Article

Cascading Landslide–Barrier Dam–Outburst Flood Hazard: A Systematic Study Using Rockfall Analyst and HEC-RAS

1
School of Geography and Planning, Sun Yat-sen University, Guangzhou 510006, China
2
Department of Civil, Aerospace and Design Engineering, University of Bristol, Bristol BS8 1QU, UK
3
Department of Land, Air and Water Resources, University of California Davis, Davis, CA 95616, USA
4
School of Earth and Environmental Sciences, Cardiff University, Cardiff CF10 3AT, UK
5
Key Laboratory for Environment and Disaster Monitoring and Evaluation of Hubei, Innovation Academy for Precision Measurement Science and Technology, Chinese Academy of Sciences, Wuhan 430071, China
*
Author to whom correspondence should be addressed.
Remote Sens. 2025, 17(11), 1842; https://doi.org/10.3390/rs17111842
Submission received: 7 March 2025 / Revised: 24 April 2025 / Accepted: 21 May 2025 / Published: 25 May 2025

Abstract

:
Landslide hazard chains pose significant threats in mountainous areas worldwide, yet their cascading effects remain insufficiently studied. This study proposes an integrated framework to systematically assess the landslide-landslide dam-outburst flood hazard chain in mountainous river systems. First, landslide susceptibility is assessed through a random forest model incorporating 11 static environmental and geological factors. The surface deformation rate derived from SABS-InSAR technology is incorporated as a dynamic factor to improve classification accuracy. Second, motion trajectories of rock masses in high-risk zones are identified by Rockfall Analyst model to predict potential river blockages by landslide dams, and key geometric parameters of the landslide dams are predicted using a predictive model. Third, the 2D HEC-RAS model is used to simulate outburst flood evolution. Results reveal that: (1) incorporating surface deformation rate as a dynamic factor significantly improves the predictive accuracy of landslide susceptibility assessment; (2) landslide-induced outburst floods exhibit greater destructive potential and more complex inundation dynamics than conventional mountain flash floods; and (3) the outburst flood propagation process exhibits three sequential phases defined by the Outburst Flood Arrival Time (FAT): initial rapid advancement phase, intermediate lateral diffusion phase, and mature floodplain development phase. These phases represent critical temporal thresholds for initiating timely downstream evacuation. This study contributes to the advancement of early warning systems aimed at protecting downstream communities from outburst floods triggered by landslide hazard chains. It enables researchers to better analyze the complex dynamics of such cascading events and to develop effective risk reduction strategies applicable in vulnerable regions.

1. Introduction

A landslide hazard chain refers to a sequence of cascading hydrogeological hazards, often triggered by intense rainfall or seismic activity, which block river channels and form landslide-dammed lakes that pose a potential risk of dam failure [1,2,3,4]. The subsequent outburst floods frequently cause substantial human casualties and socioeconomic losses [5,6,7], and the cascading nature of these events amplifies their complexity, leading to an escalation cycle of disaster risks [8,9,10]. Notable examples include the successive landslides that dammed the Jinsha River at Baige Village in 2018, which affected over 500 km of downstream river, forcing the evacuation of tens of thousands and causing severe damage to infrastructure [11,12]. Similarly, the Tangjiashan landslide dam, formed during the 2008 Wenchuan earthquake, threatened the lives of more than 2.5 million people downstream [13,14]. These cases highlight the strong interconnection between landslides and floods, especially in mountainous regions characterized by vulnerable geological conditions and intense rainfall. They interact with the hydrographic network by forming landslide dams. The formation of landslide dams significantly alters river systems, highlighting the urgent need to understand how initial hazards (e.g., landslides) influence subsequent ones (e.g., outburst floods).
Landslides are among the most widespread and devastating geological disasters globally [15]. Landslide susceptibility assessment (LSA) is a critical tool for identifying high-risk areas and informing risk mitigation strategies [16,17]. While traditional statistical approaches to LSA rely on predefined hypotheses, machine learning models—particularly the random forest (RF) algorithm—have enhanced prediction flexibility and accuracy [18,19]. However, the effectiveness of RF models heavily depends on the selection of input features. Most existing models primarily incorporate static topographic and geological factors, such as soil type, slope, and elevation, while underutilizing dynamic indicators. Interferometric synthetic aperture radar (InSAR) technology, especially the small baseline subset interferometric synthetic aperture radar (SBAS-InSAR), has been extensively utilized for detecting surface deformation at high spatial-temporal resolution; yet, its integration into machine learning-based LAS remains limited [20,21]. This oversight constrains the model’s accuracy and generalizability across regions [22]. Incorporating surface deformation rates as dynamic variables into LSA can significantly enhance the alignment with the actual spatial distribution of landslides. Nevertheless, LSA remains largely qualitative and does not capture the physical processes of landslide movement, which is an essential factor in hazard chain analysis, especially in regions where landslides frequently obstruct river channels.
Modeling rock mass movement is thus crucial for understanding the formation and behavior of landslide dams. Lan et al. [23] developed the first 3D spatially distributed RockFall Analyst (RA) model, which enables dynamic simulation of rockfall trajectories while capturing spatial statistics of rockfalls. This model has been widely used in different regions [24,25,26] and provides critical insights into landslide behavior and the likelihood of river blockage. In the context of landslide hazard chains, outburst floods caused by landslide-dam breaching pose the most significant risks to downstream populations and infrastructure [27]. Effectively simulating both the breach process and downstream flood propagation is essential for comprehensive hazard assessment. Existing dam failure models can be broadly categorized as empirical (parametric) or physically based [12,28]. Parametric models use historical datasets to derive empirical relationships [6,29] but often neglect important erosion resistance indices, such as material heterogeneity, particle size distribution, gradation characteristics, critical incipient shear stress (τc), and erosion rate coefficients (e.g., b0 and b1) [30]. In contrast, physically based models simulate breach evolution processes using numerical computation techniques combined with the failure mechanisms of earth-rock dams. They offer ease of operation and rapid computational efficiency. Notable examples of such models include the Dam-Break Flood Forecasting Model (DAMBRK) [31], the breach erosion model (BREACH) [32], the breach erosion of earthfill dams model (BEED) [33], and the Hydrologic Engineering Center’s River Analysis System (HEC-RAS) [34]. Among these, HEC-RAS incorporates a range of parametric models designed to estimate the failure parameters of earth-rock dams, such as the Froehlich formula [35,36], the Von Thun and Gillette formula [37], the Macdonald formula [38], and the Xu and Zhang formula [39]. These empirical formulas serve as effective tools for calculating parameters associated with landslide dam failure. Additionally, HEC-RAS integrates a simulation module for the outburst process with a flood evolution module, employing advanced numerical methods for hydraulic calculations. These advantages make the HEC-RAS model an ideal tool for simulating the occurrence of outburst floods in this study.
In general, the formation of a landslide hazard chain encompasses multiple stages: landslide susceptibility assessment, identification of potential dam-forming river segments, and simulation of outburst floods. To date, most studies focus on a single component of the hazard chain—either LSA or flood modeling—without capturing the full evolutionary process of cascading hazards [22,40]. This presents three major scientific challenges: (1) how to incorporate dynamic factors in LSA; (2) how to identify river reaches susceptible to blockage by landslide dams; and (3) how to simulate and provide early warnings for outburst floods caused by such dams? A comprehensive framework capable of addressing all three aspects remains lacking.
This study proposes an integrated multi-model framework for simulating the complete landslide-landslide dam-outburst flood hazard chain. Specifically, we aim to investigate the mechanisms linking these sequential hazards and quantify their cascading impacts. Our methodology includes three main components: (1) dynamic landslide susceptibility assessment using the SBAS-InSAR-derived surface deformation rates and RF algorithm; (2) simulation of rock mass movement in high susceptibility zones using the RA model to identify potential landslide dam locations and estimate dam geometry; and (3) simulation of outburst floods from landslide-blocked rivers using the HEC-RAS model in the Xinfengjiang River Basin, Heyuan City. This framework provides a scientific basis for early warning systems and supports regional disaster preparedness and mitigation planning.

2. Materials and Methodology

2.1. Study Area and Data
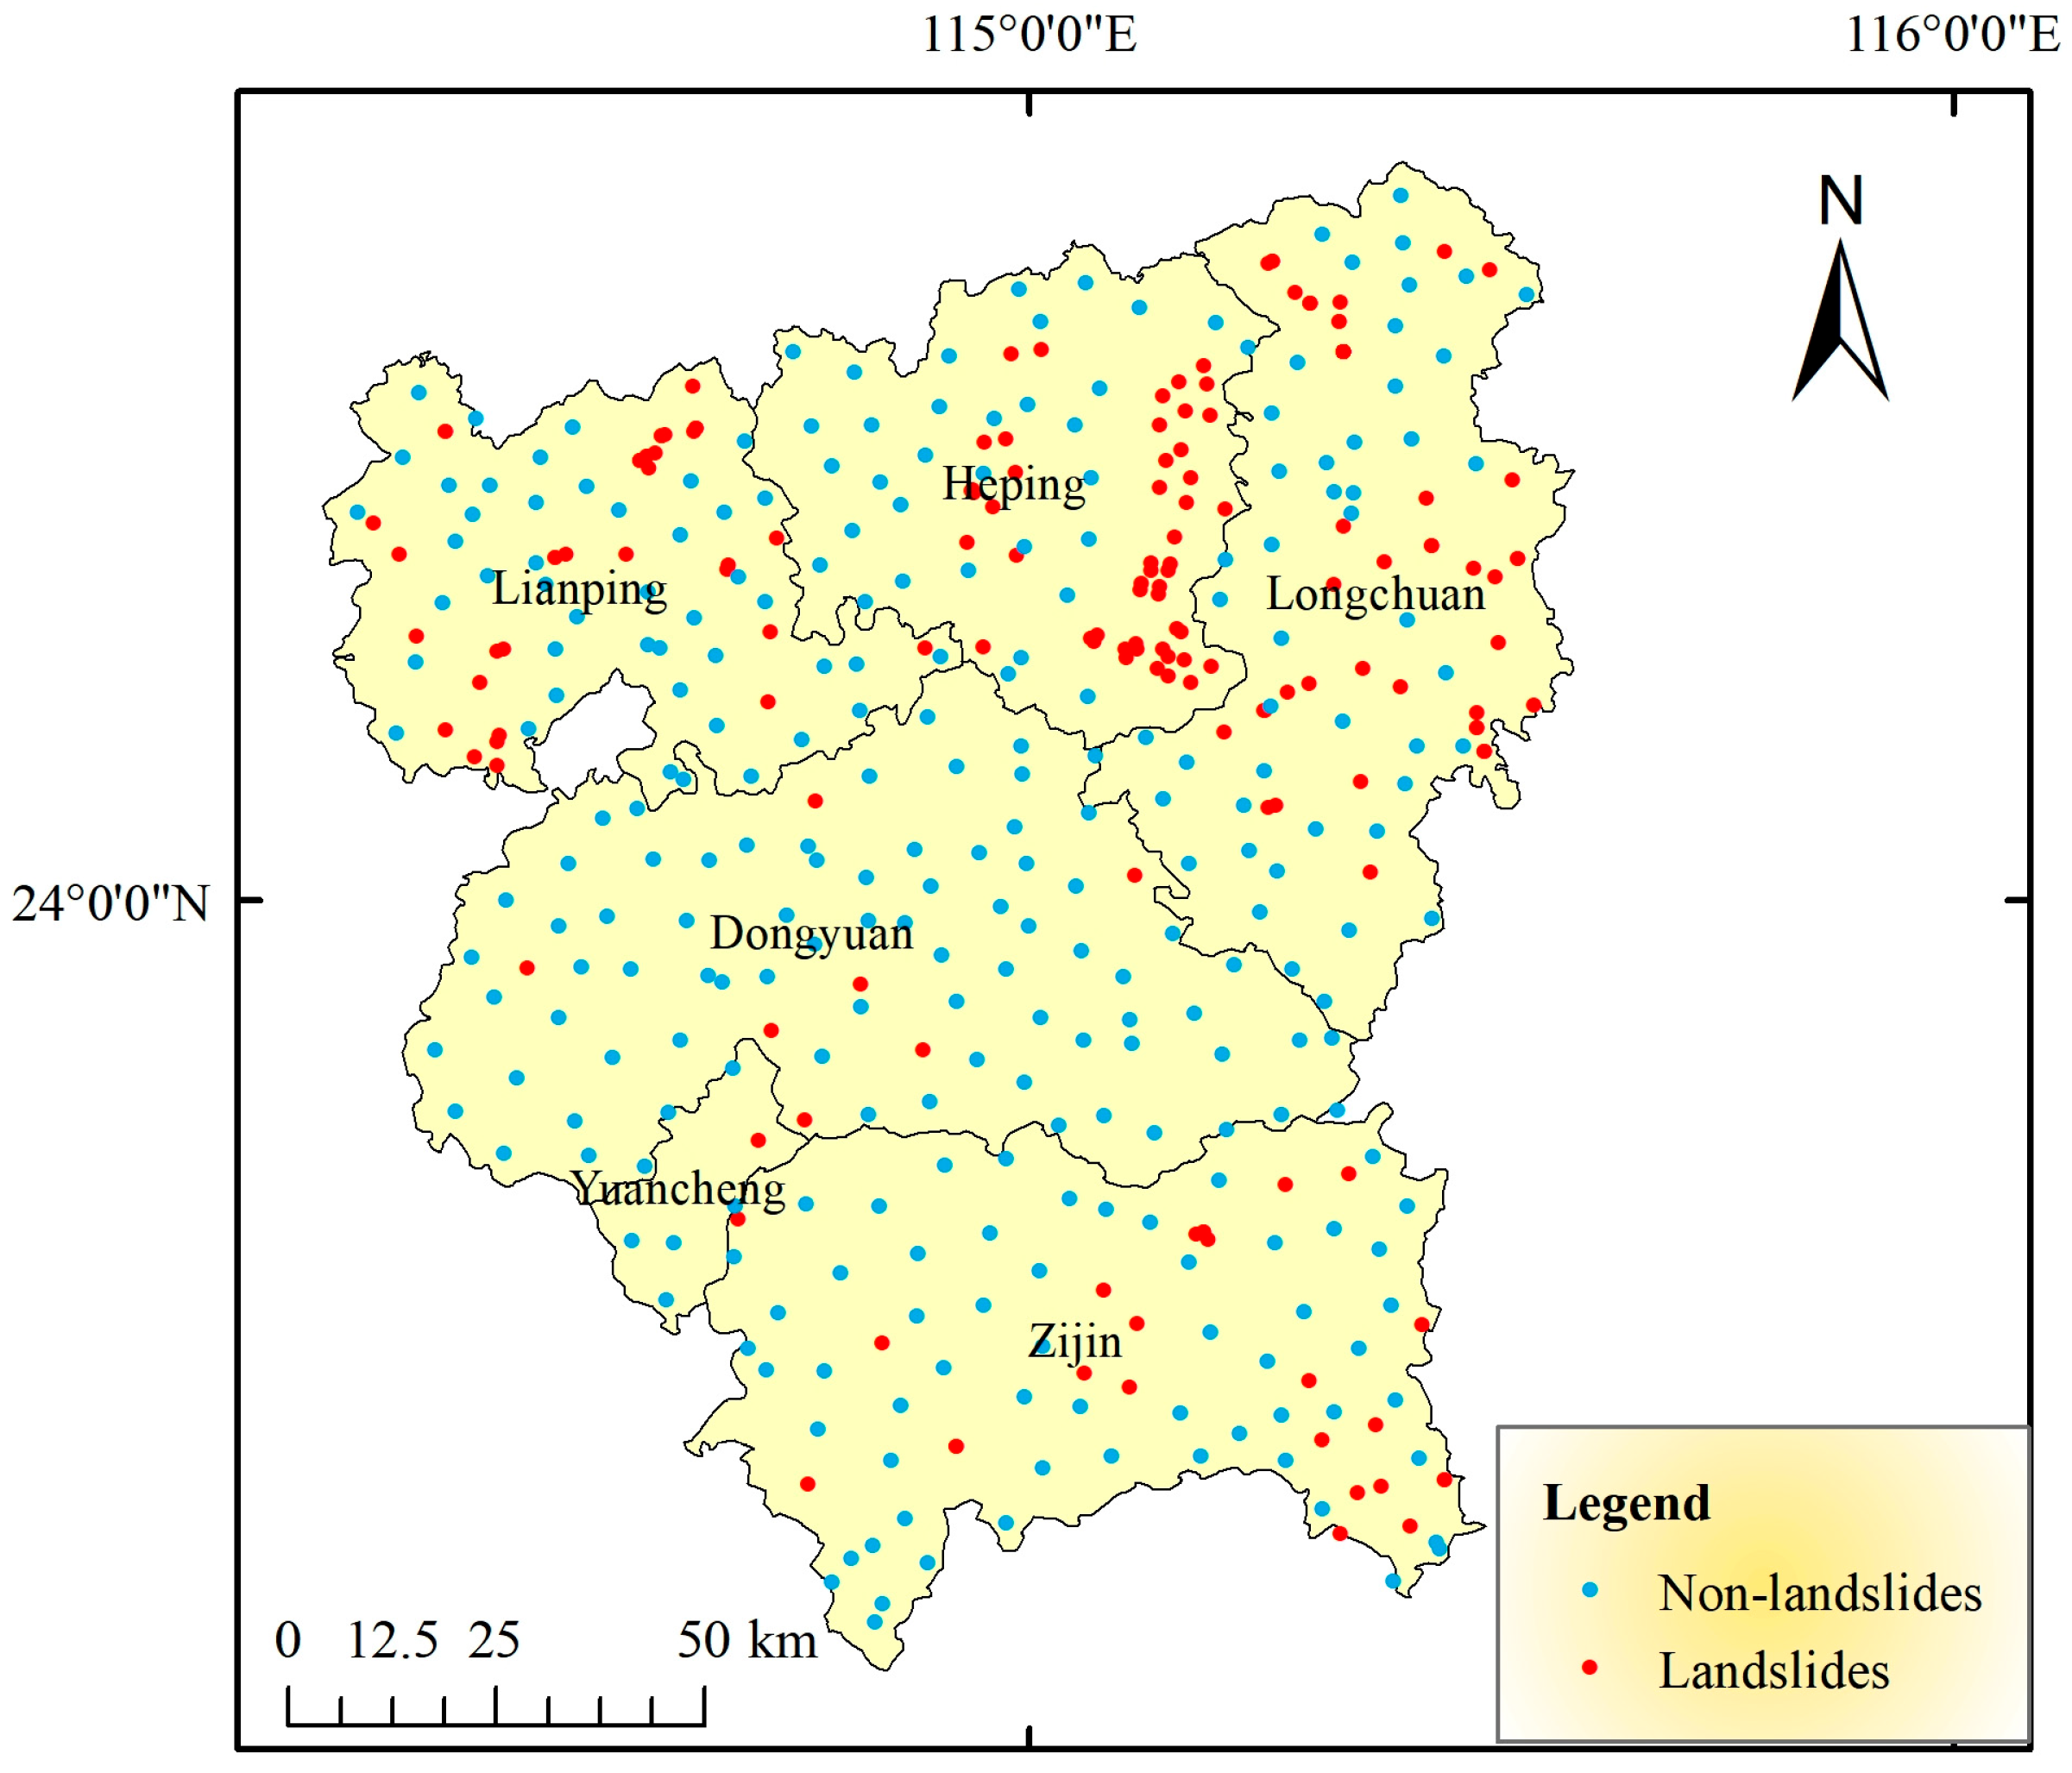
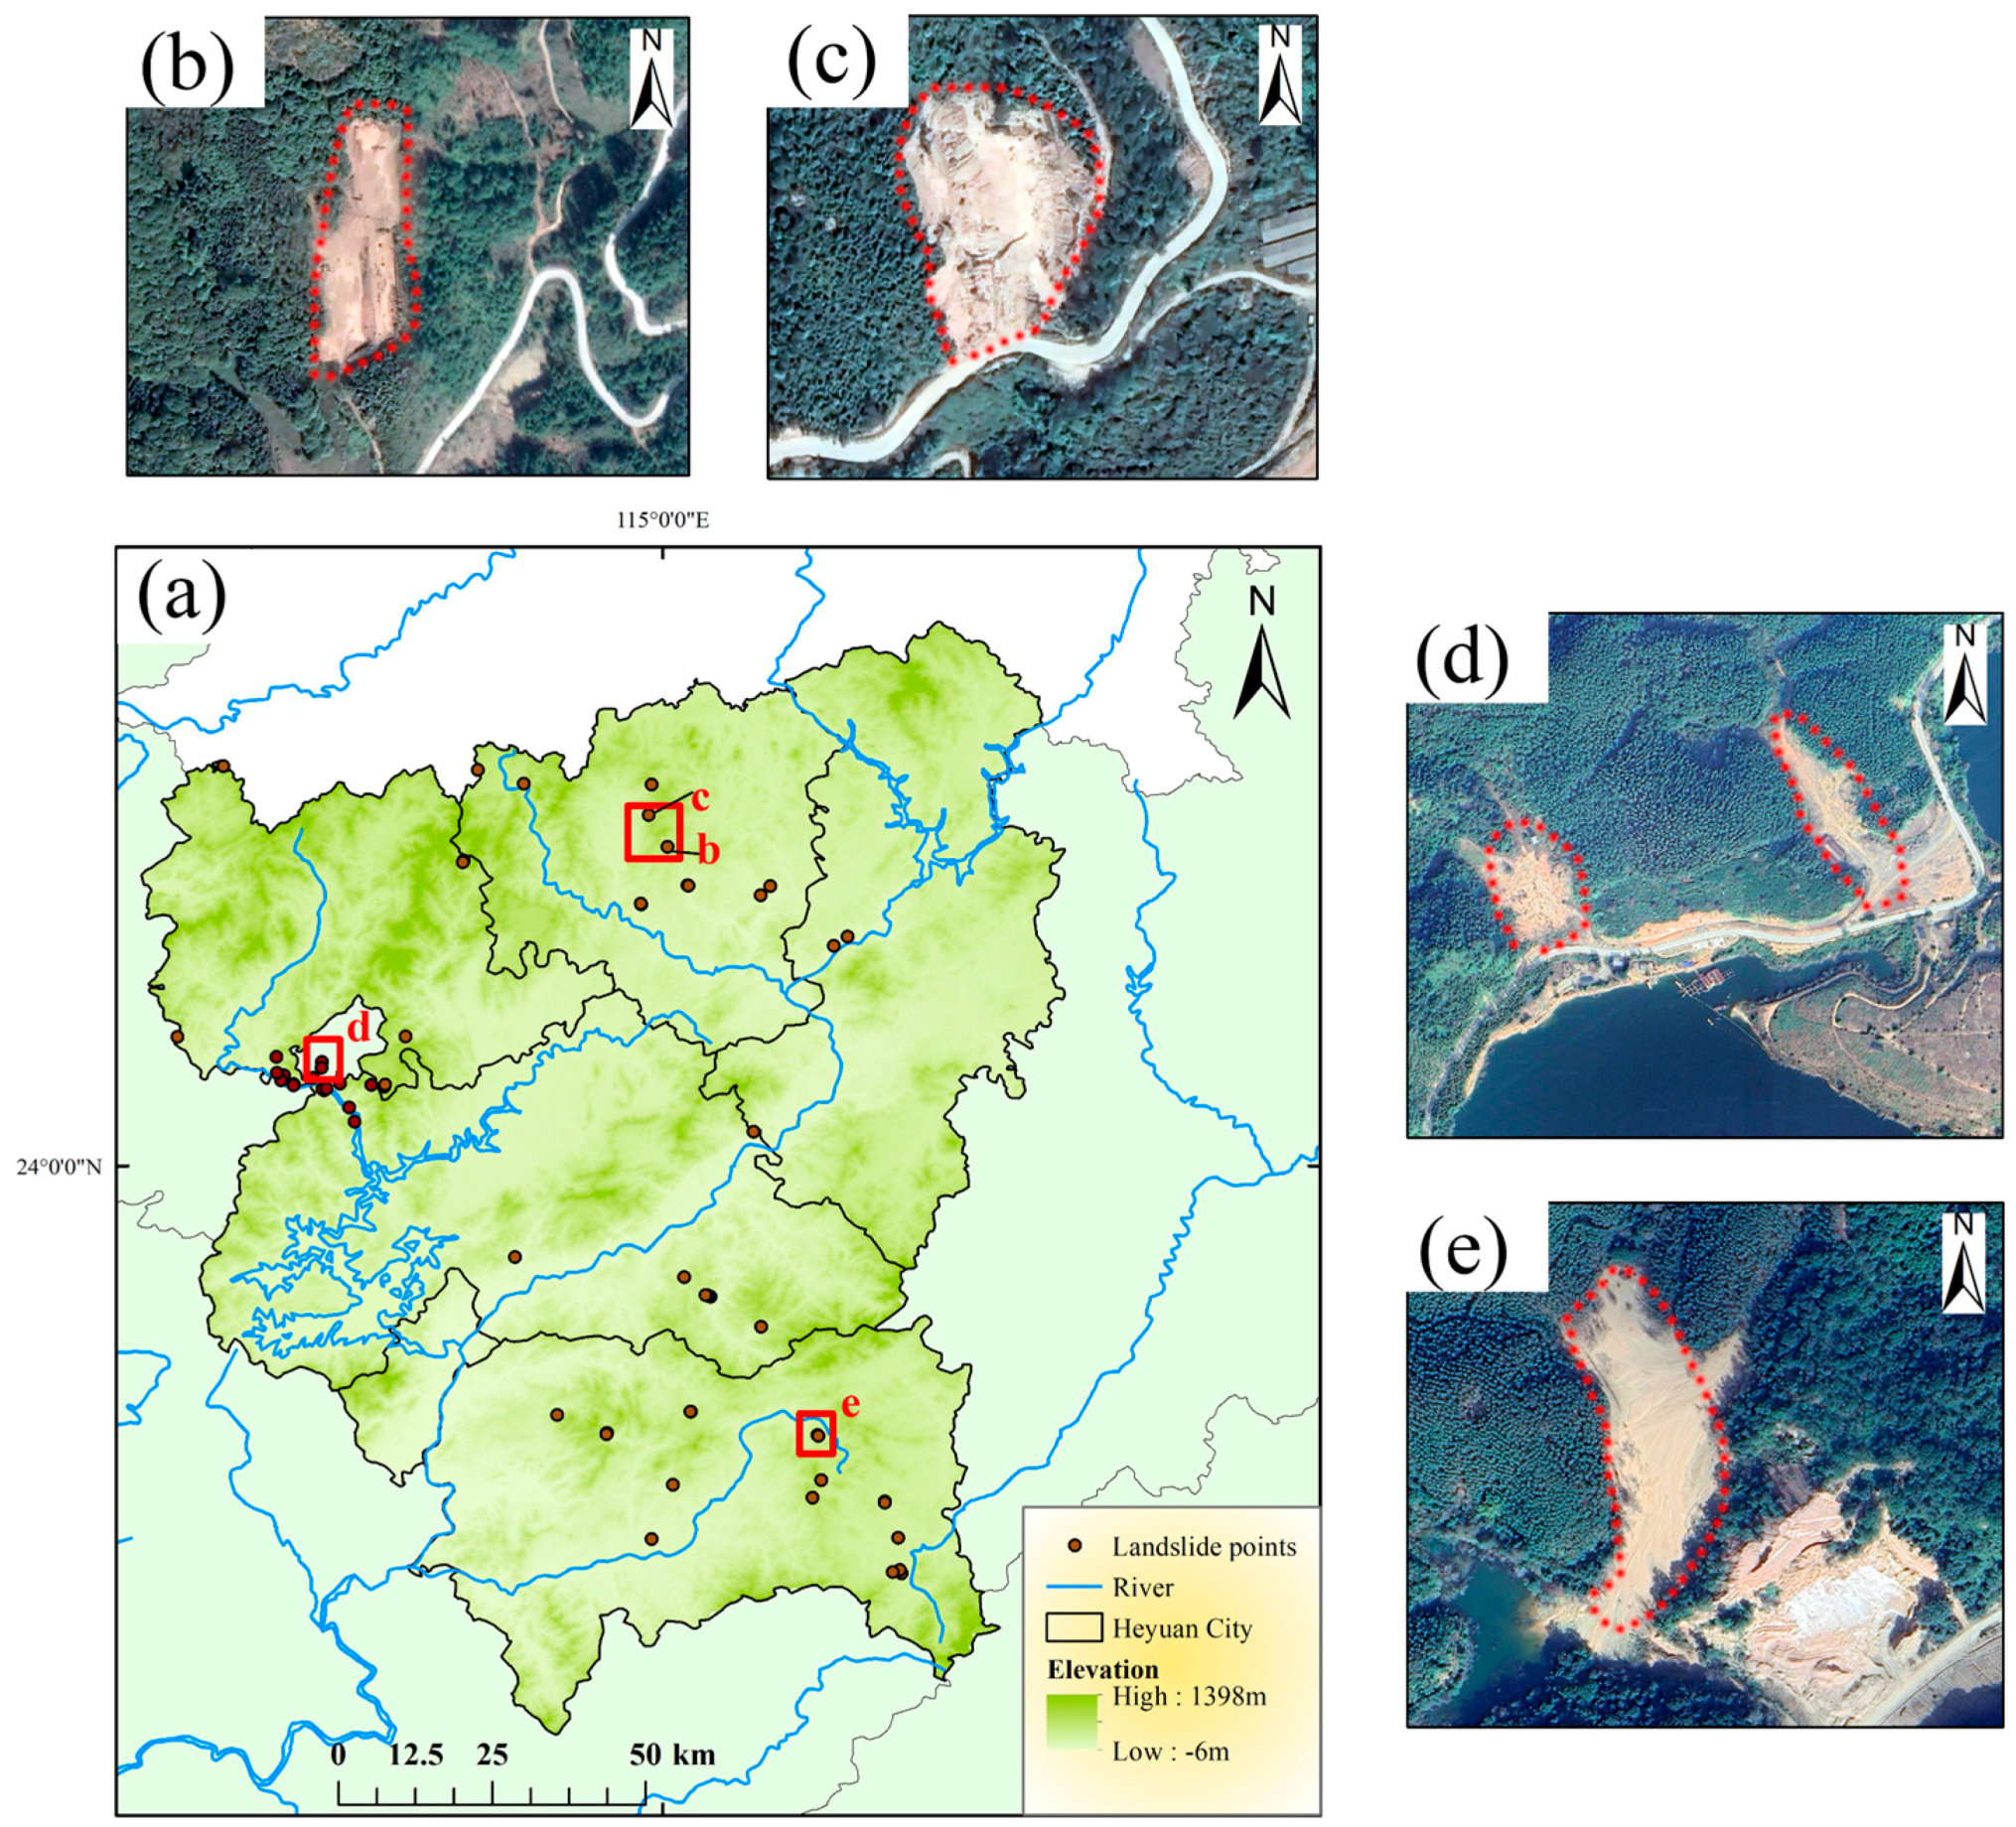
2.1.1. Study Area

Figure 1 illustrates the geographical position of Heyuan City. As shown in Figure 1a, Heyuan City is situated in the northeastern part of Guangdong Province, China, spanning latitudes 23.2°N to 24.8°N and longitudes 114.2°E to 115.6°E, covering an area of approximately 15,653 km2. The region experiences a typical subtropical monsoon climate, with an average annual precipitation of approximately 1769 mm. Precipitation varies greatly and is predominantly concentrated from April to September. Situated between the mountainous region of northeastern Guangdong Province and the Pearl River Delta Plain, the terrain is predominantly mountainous and hilly. Figure 1b shows that elevation in the region ranges from −6 m to 1398 m. The fluvial system of Heyuan City comprises three principal watersheds: the Dongjiang, Beijiang, and Hanjiang Rivers. Among these, the Dongjiang River basin is the most extensive, covering 13,737 km2 and accounting for 87.3% of the city’s total area. The Xinfeng River, the largest tributary of the Dongjiang River system, flows along its right bank, passing through Heyuan’s urban center before joining the mainstream. Heyuan City is characterized by steep mountains and conical peaks, shaped by a well-developed hydrographic network and intense topographic incision. This geomorphological activity has resulted in the formation of numerous V-shaped valleys, where slope angles typically range between 20° and 75°. Due to its unique geography and climate, Heyuan City experiences multiple heavy rainstorms every year, making it highly prone to geological disasters. For instance, from 10 June to 13 June 2019, Longchuan County suffered continuous heavy rainfall that triggered numerous landslides, causing substantial economic losses and human casualties. Therefore, landslides are a major geo-hazard in the study area.

2.1.2. Data

(1)
Landslide inventory
The establishment of systematic landslide inventories forms a foundational requirement for LSA [16], as both data completeness and positional accuracy critically govern the reliability of predictive modeling outcomes. The landslide inventory of Heyuan City used herein was compiled by the group of National Key R&D Program of China (2021YFC3001000). To construct the machine learning models for LSA, it was necessary to include a sufficient number of non-landslide samples, which were randomly generated throughout the study area. The spatial distribution of landslide samples and non-landslide samples is presented in Figure 2. The landslide inventory contains 240 documented landslide cases, most of which were mainly triggered by heavy rainfall. Additionally, an equivalent number of non-landslide points was generated through ArcGIS-based random sampling. Landslide events were labeled as “1” (positive samples), while non-landslide events were labeled as “0” (negative samples) for LSA. These landslide and non-landslide samples with a label of “1” and ‘‘0”, respectively, were then combined into a final dataset for training and testing the machine learning models. According to previous study [41], a common approach is to split the dataset so that 70% is used for training and 30% for validation.
(2)
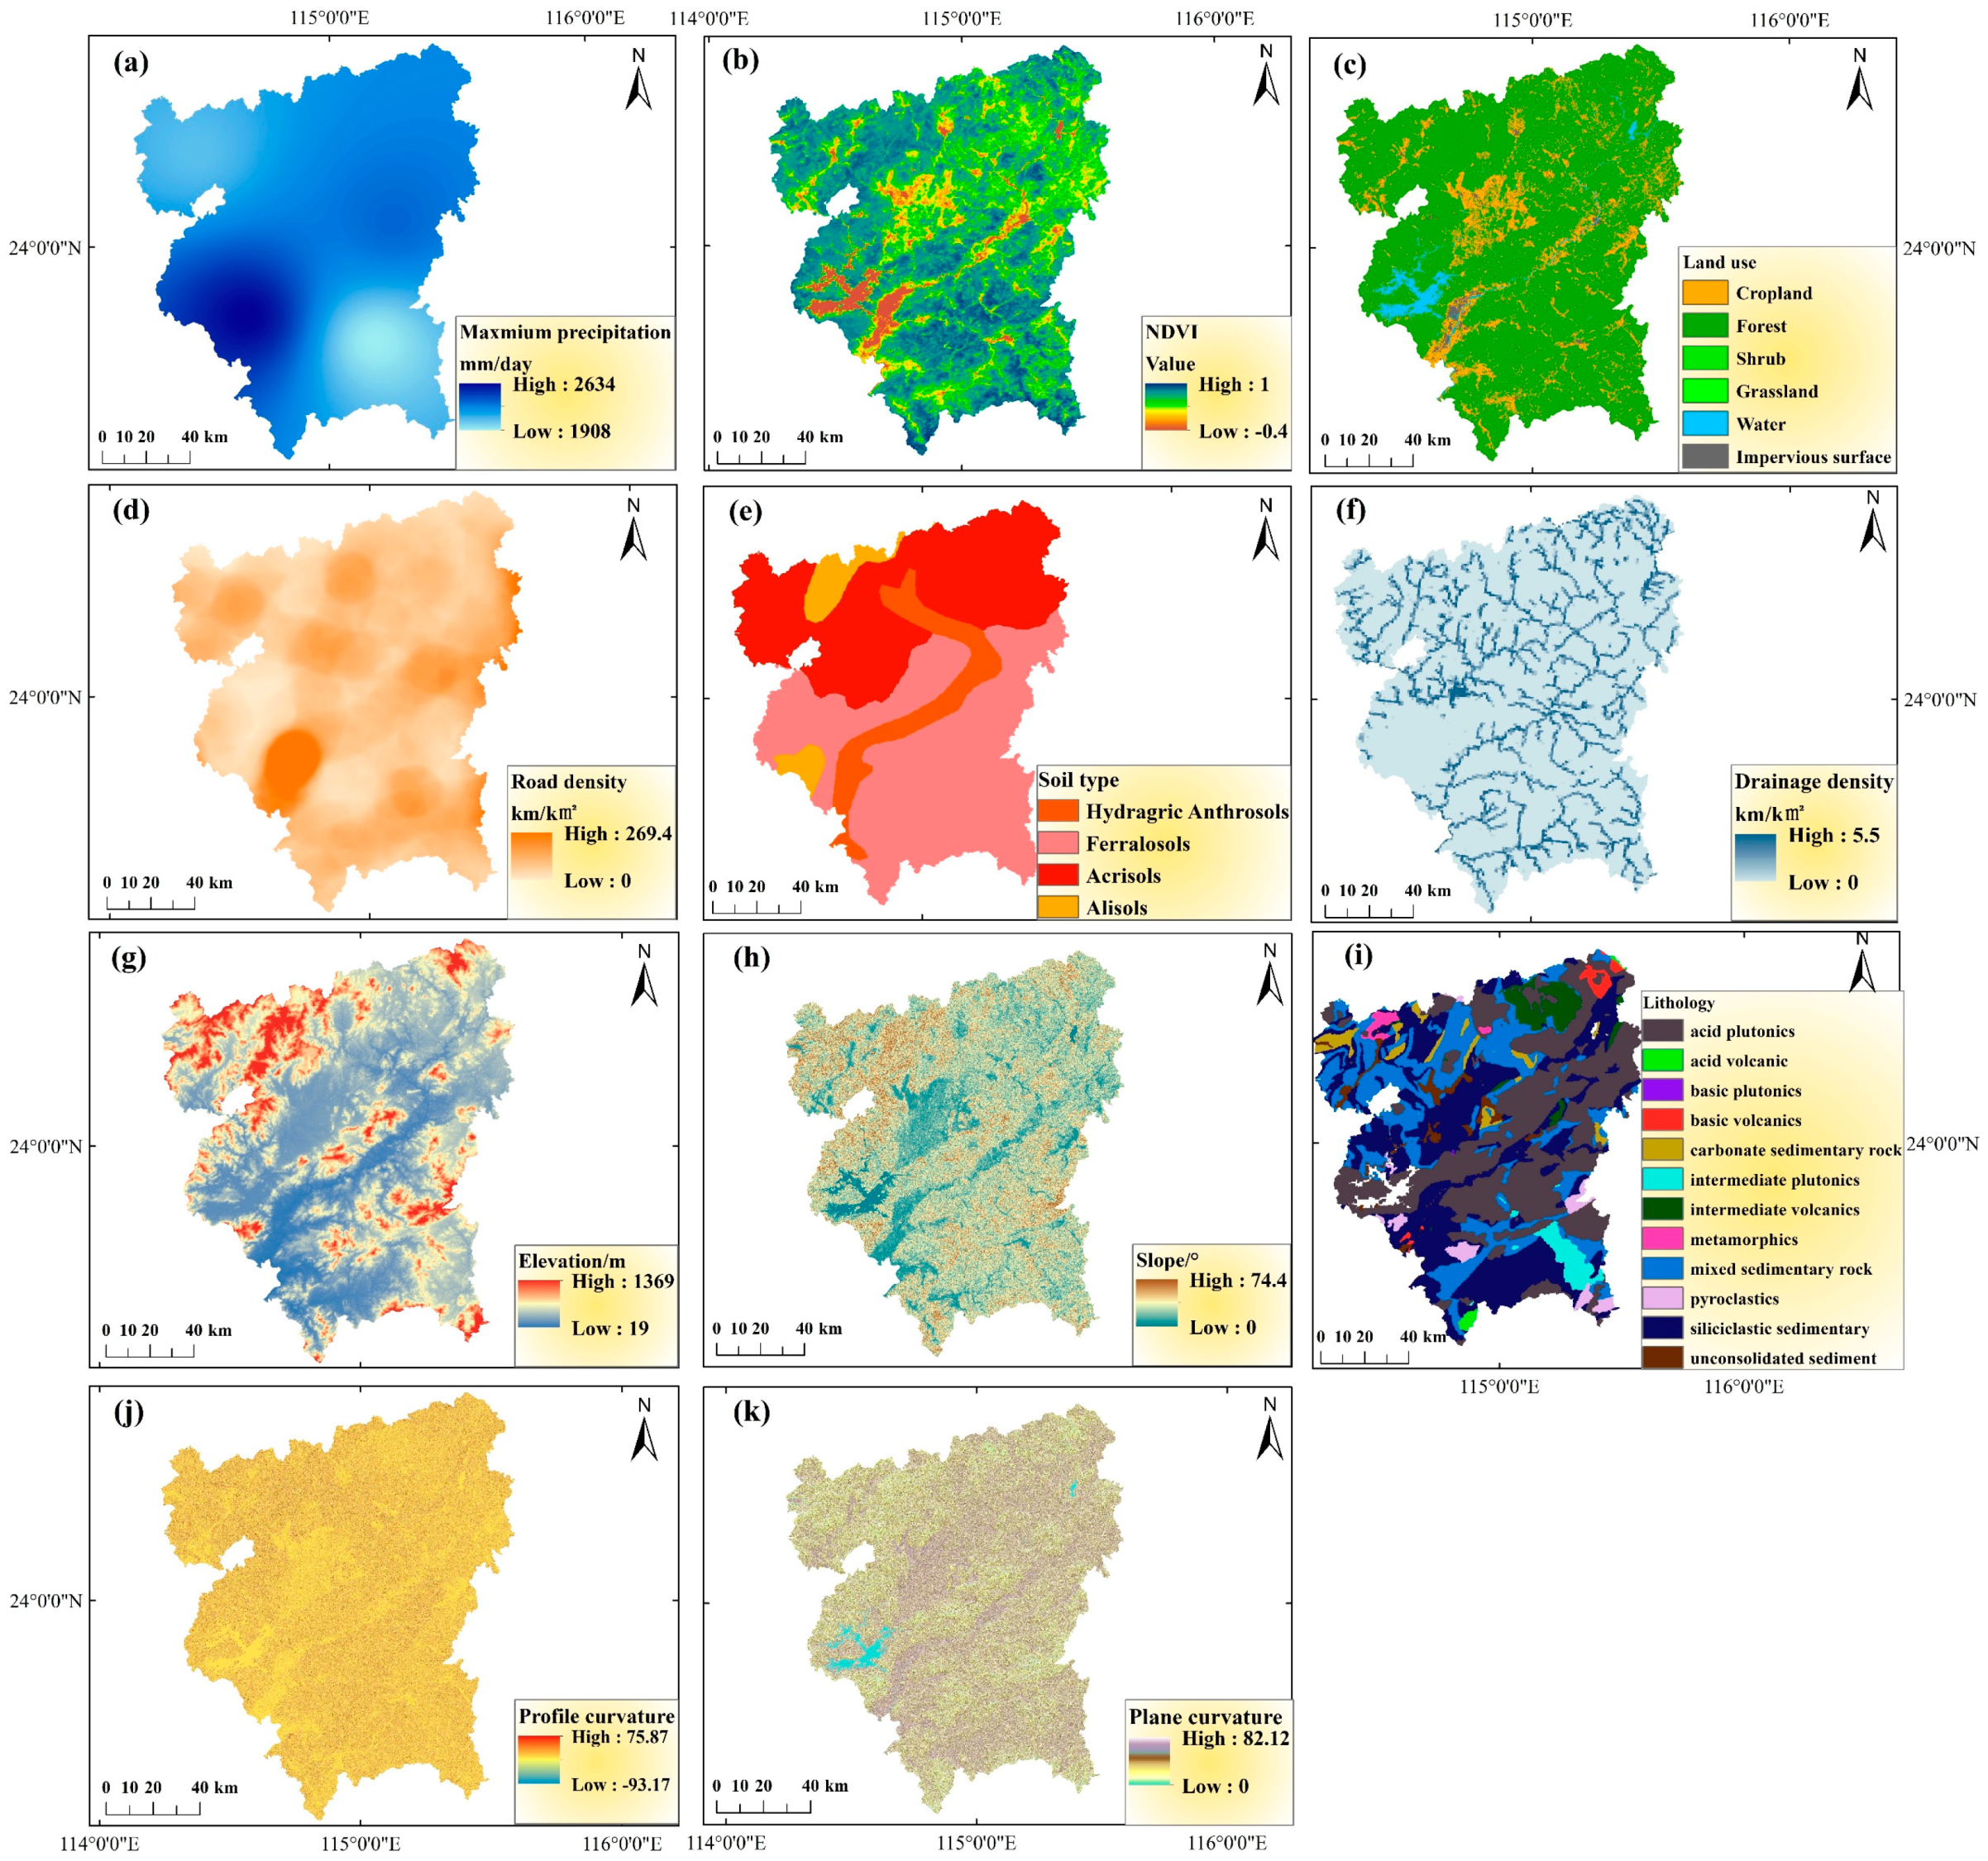
Landslide conditioning factors
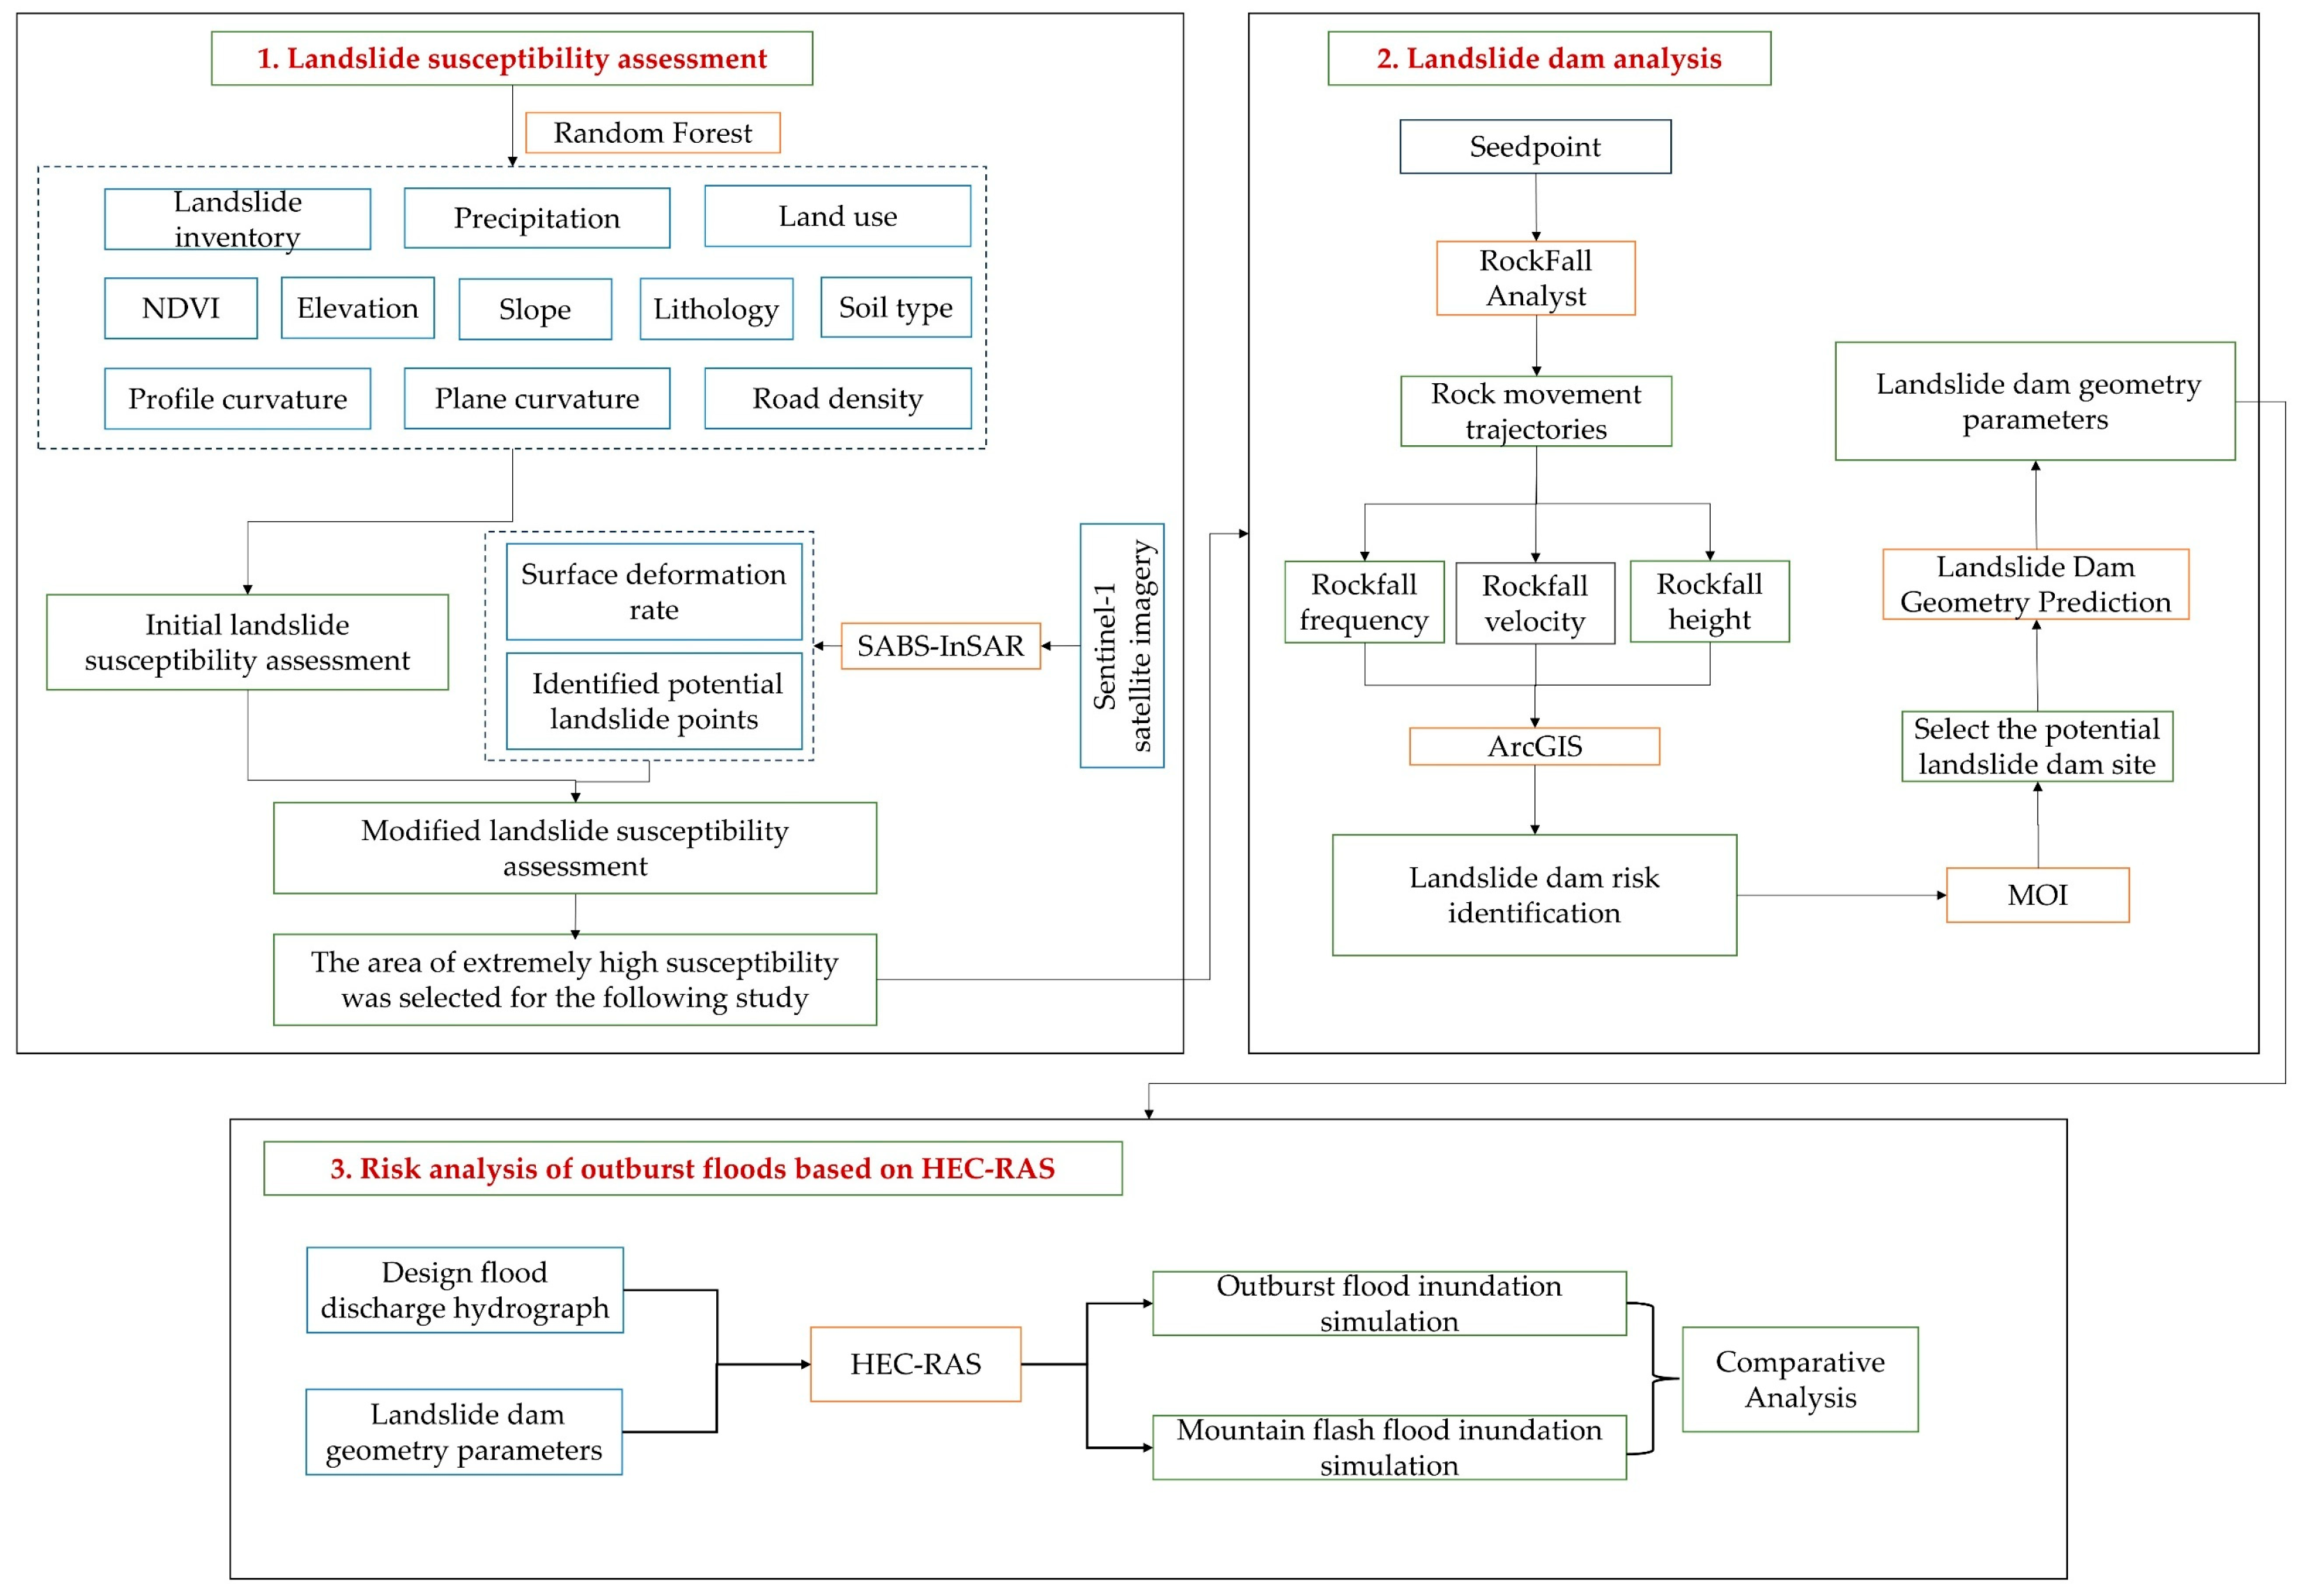
To assess the rainfall-induced landslide susceptibility, we obtained the meteorological, land cover, hydrologic, topographic, and geological data. Nine conditioning factors were selected for the study, including the annual maximum precipitation, Normalized Difference Vegetation Index (NDVI), land use, road density, soil type, drainage density, elevation, slope, and lithology. The data sources for these factors are as shown in Table 1. However, it is important that the nine factors generated in ArcGIS require further data processing before they can be utilized for subsequent machine learning modeling. Specifically, the factors must be transformed into discrete variables. Since there are categorical factors (e.g., land use) and continuous factors (e.g., elevation), they are treated differently. For categorical factors, their original text labels are replaced with consecutive integers, such as {1, 2, 3, 4, 5} [16]. Continuous factors are discretized by using the natural breaks method in ArcGIS 10.6. Then, a database, including these nine landslide conditioning factors, was generated using ArcGIS 10.6 for data interpretation and analysis. Thematic layers with a 30 m × 30 m spatial resolution pixel size were prepared (Figure 3). All layers have UTM coordinate system zone 50 with a datum of WGS 84.
To calculate the surface deformation rate, we downloaded the Sentinel-1 satellite images from the ASF Data Search Platform (https://search.asf.alaska.edu/#/, accessed on 7 January 2025). Sentinel-1 carries a C-band synthetic aperture radar with a wavelength of 5.5 cm and a resolution of 5 m × 20 m. A total of 59 scenes of Sentinel-1A ascending orbit data from 8 January 2019 to 28 December 2020 were used to carry out SBAS-InSAR monitoring, covering the entire city of Heyuan.

2.2. Methodology

This study investigates the cascading hazard chain of landslide-induced dam formation and subsequent outburst flood, employing a multi-model coupling approach to unravel the propagation mechanisms across interconnected hazards. The methodology framework of this study is shown in Figure 4.
Step1: Landslide susceptibility was assessed through a random forest model incorporating 11 static environmental and geological factors. To enhance the classification accuracy, surface deformation rates derived from SABS-InSAR were integrated as a dynamic factor to modify the susceptibility classification.
Step 2: Areas with high landslide susceptibility zones were further analyzed to evaluate the potential for landslide dam formation. RockFall Analyst simulations were applied to identify critical river segments most prone to blockage by sliding rock masses. Additionally, a predictive model was used to estimate the geometry parameters of potential landslide dams—parameters essential for the outburst flood simulation.
Step 3: The HEC-RAS 6.4.1 hydrodynamic model was selected to simulate two flood scenarios: (i) outburst floods from landslide-blocked rivers and (ii) typical mountain flash floods. A comparative analysis of inundation depth and flow velocity between these scenarios provided quantifiable metrics for delineating risk zones, optimizing flood control infrastructure, and informing emergency protocols.

2.2.1. Landslide Susceptibility Assessment Model

(1)
Classification of landslide susceptibility based on Random Forest
Random forest (RF) is a commonly used machine learning integration algorithm [42]. It has been widely used in landslide susceptibility assessment [16,40,43]. First, the algorithm uses the bagging technique to randomly select samples and form multiple data subsets, allowing repeated observations in each subset (i.e., sampling with replacement). Next, these bootstrapped subsets are used to build multiple classification or regression trees, whose final outputs are determined by majority voting [17]. RF offers advantages such as low computational overhead, high predictive accuracy, and a reduced risk of overfitting [44]. Accordingly, by leveraging a dataset of landslide conditioning factors and combining both landslide and non-landslide samples, this study develops a random forest–based model to assess landslide susceptibility.
To demonstrate the reliability of the assessment model, the receiver operating characteristic (ROC) curve is used to validate the results [45]. The ROC curve is derived from the model’s confusion matrix, plotting the false positive rate (FPR) on the X-axis against the true positive rate (TPR) on the Y-axis. The area under this curve, known as the AUC, ranges from 0 to 1 and serves as a widely accepted measure for evaluating binary classification models. Generally, a higher AUC value indicates better model performance.
(2)
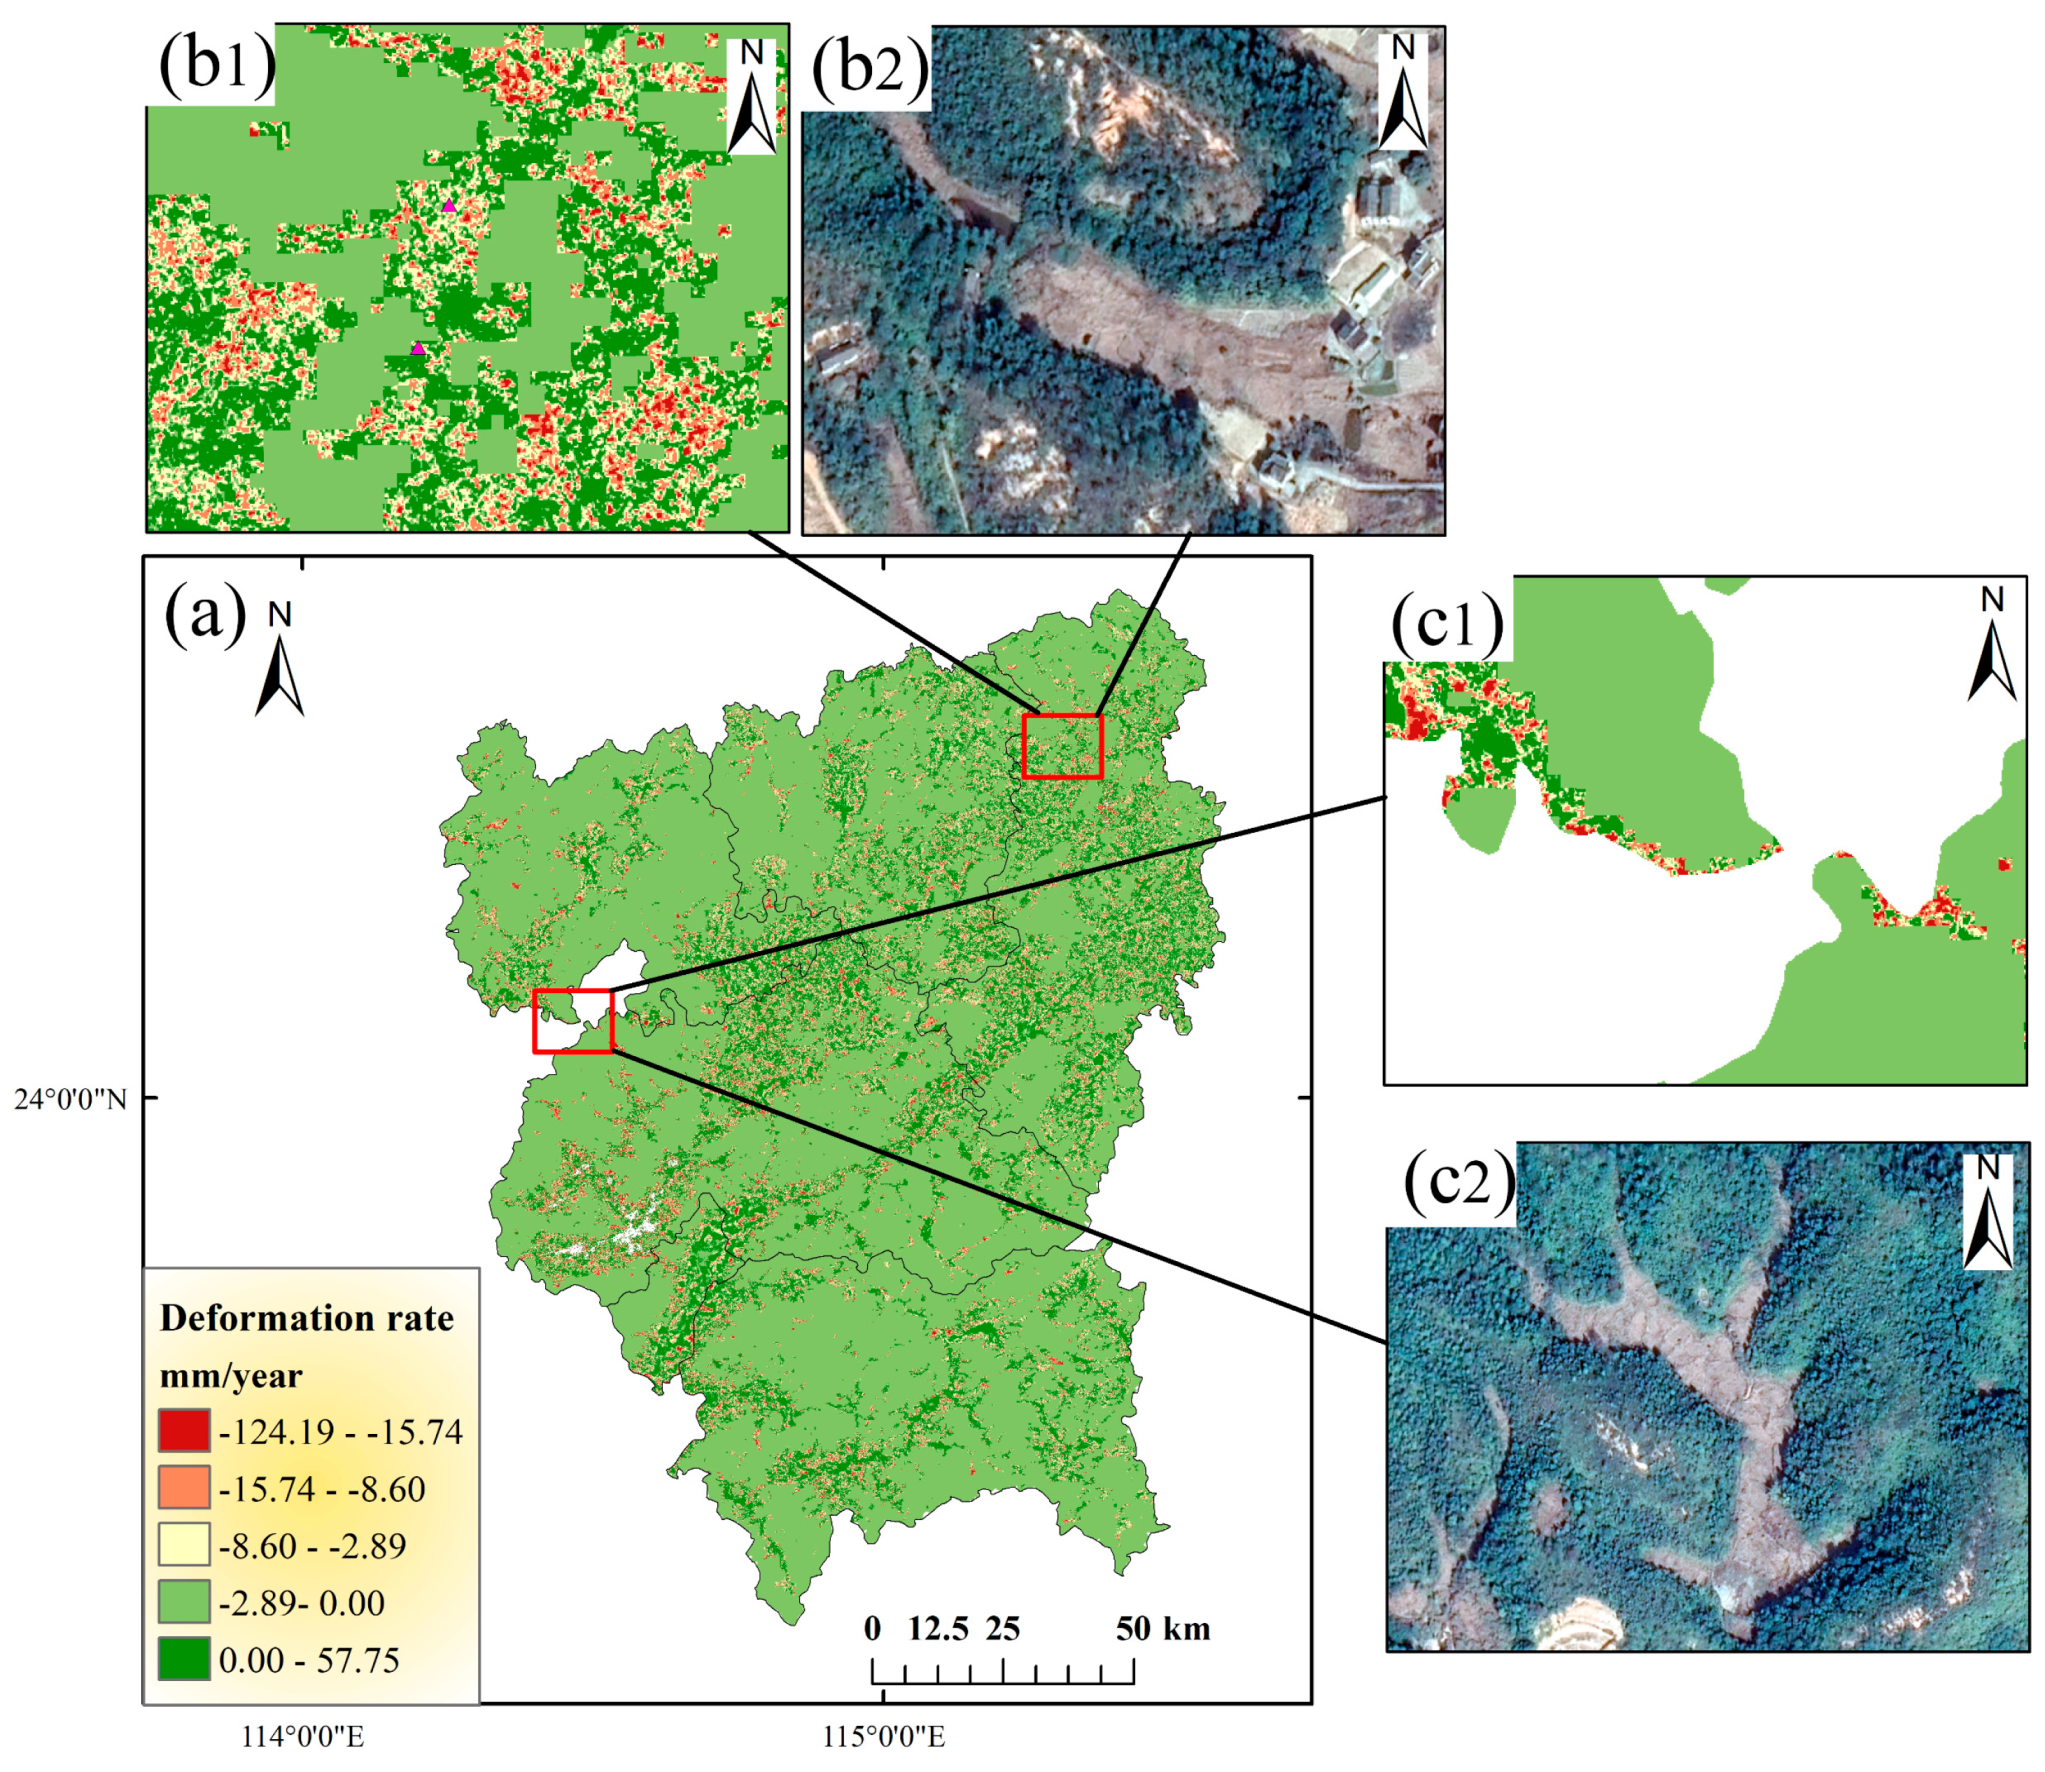
Modification of landslide susceptibility based on SABS-InSAR
Landslide instability typically occurs following prolonged periods of gradual creep deformation. InSAR technology enables continuous monitoring of surface deformation patterns with millimeter-scale accuracy, providing the surface deformation rate for analyzing deformation mechanisms and assessing landslide susceptibility. Consequently, incorporating the surface deformation rate to adjust the initial classification of landslide susceptibility assessment can enhance the precision of the outcomes. PS–InSAR and SABS-InSAR are the two predominant time-series InSAR techniques. The SABS-InSAR technique is characterized by its more flexible temporal and spatial baseline thresholds for the formation of interferometric pairs [16]. This advantage mitigates the impacts of spatial decorrelation and atmospheric delays, rendering it particularly effective for the long-term monitoring of natural surface deformation patterns [46]. Consequently, this research employs SBAS-InSAR to assess the surface deformation rate, which serves as a critical factor in the evaluation of LSA. The detailed methodology is shown below:
  • The primary image should be selected based on the quality of the imaging effect or minimal climate fluctuations, followed by the process of image registration.
  • Utilizing the principle of baseline combination from small baseline subsets, multiple interferogram pairs are generated.
  • Differential interferograms are obtained by phase re-flattening process using satellite orbital data, DEM, and the geometric model.
  • High coherence points are identified for the purpose of phase unwrapping and calibrating the interferogram.
  • Surface deformation parameters and elevation inaccuracies are obtained by the Singular Value Decomposition (SVD) method, grounded in the least squares approach.
  • The impacts of atmospheric phase and nonlinear deformation have been estimated.

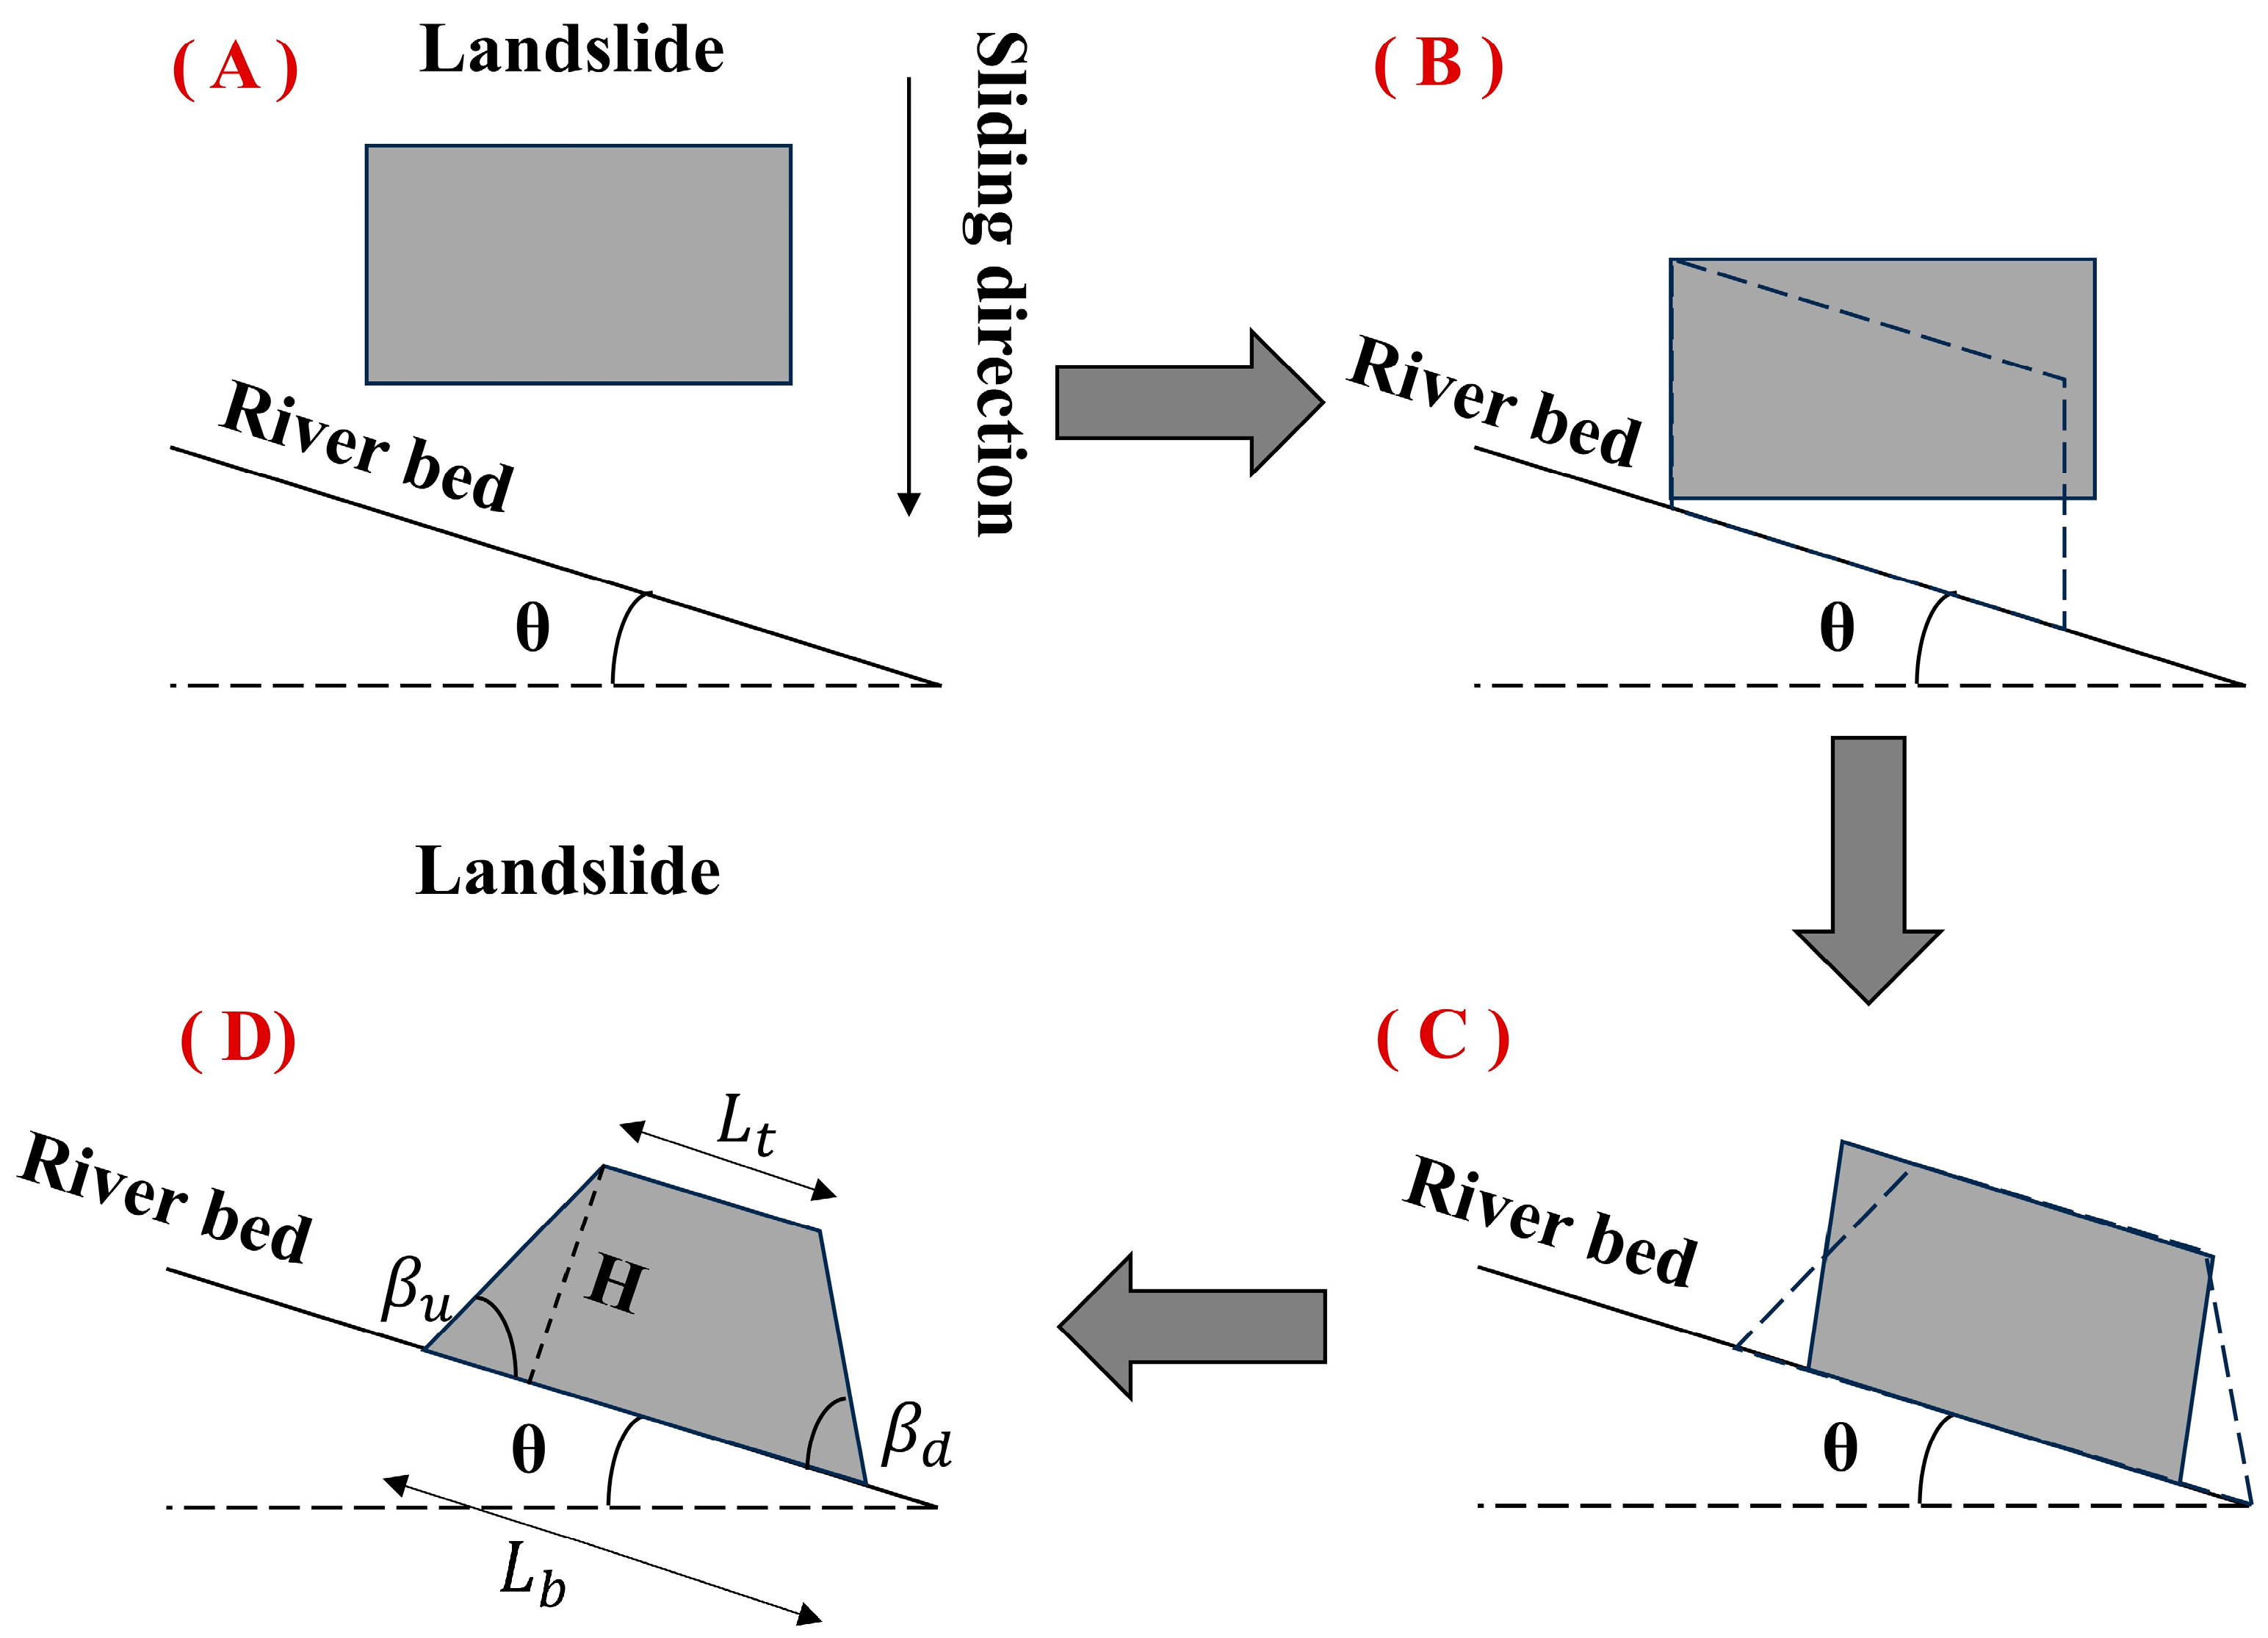
2.2.2. Analysis of Landslide Dam Based on Physical Model

The RockFall Analyst (RA) model proposed by Lan et al. [23] is a 3D solid motion model developed in ArcGIS, which dramatically extends the functional capabilities of ArcGIS in analyzing rockfall hazards. It includes two major components: (1) 3D rockfall trajectory simulations and (2) raster modeling for the spatial distribution of rockfalls. The rockfall trajectory is the main part of the RA, which represents a physical quantity of a boulder that is directional in 3D space and can be used to represent the rock’s position, displacement, velocity, acceleration, force, and momentum.
The input parameters include seeder features for defining the rock attributes, land use data sets for classifying the sliding surface materials, and DEM raster for generating slope and slope direction. The sliding surface materials play a crucial role in determining the parameters of the RA model, which underpins the normal restitution coefficient, tangential restitution coefficient, and sliding surface friction angle. The classification of sliding surface materials in this area is primarily linked to the types of vegetation cover present on the slope surfaces. Utilizing land use datasets, these sliding surfaces are categorized in accordance with the criteria established by the Chinese Ministry of Railways [47], as well as the parameters in previous studies [23]. The properties of the sliding surface materials are shown in Table 2. To facilitate further model calculations, all this data were converted into raster images with a spatial resolution of 12.5 m.
The RA model is employed to examine the sliding dynamics of unstable rock and to characterize the ultimate extent and volume of landslide deposits. Subsequently, the Spatial analyst tool within ArcGIS is utilized to delineate and assess the riverine extent of the identified landslide deposits, thereby facilitating the determination of the spatial distribution of hazardous river segments. The hazardous rivers are then classified into five distinct categories: very low danger, low danger, moderate danger, high danger, and very high danger based on the natural break method. River segments classified as medium danger or higher are selected for identifying dam formations, employing the Morphological Obstruction Index (MOI) as indicated in Equation (1).
M O I = l g V L / B
where B is valley width and V L is landslide volume.

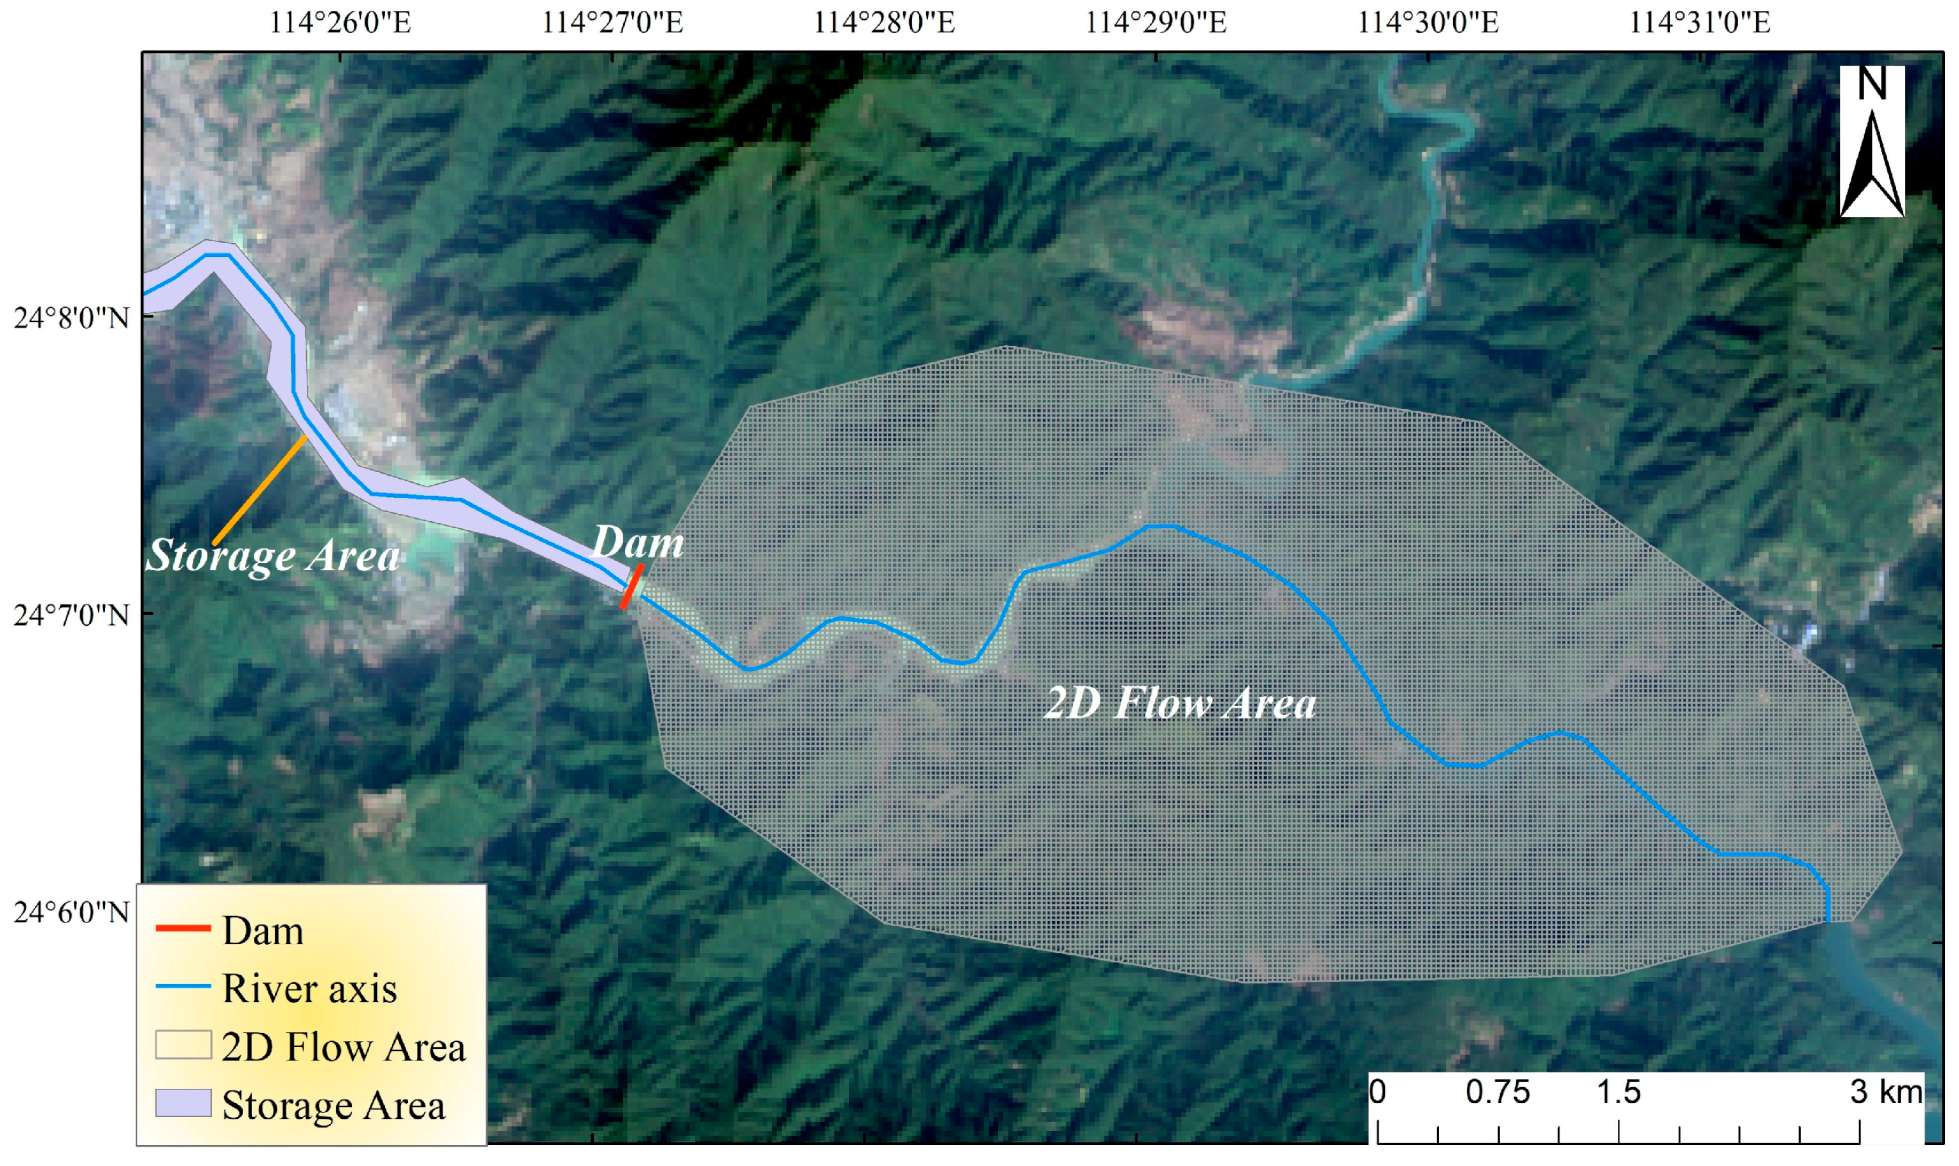
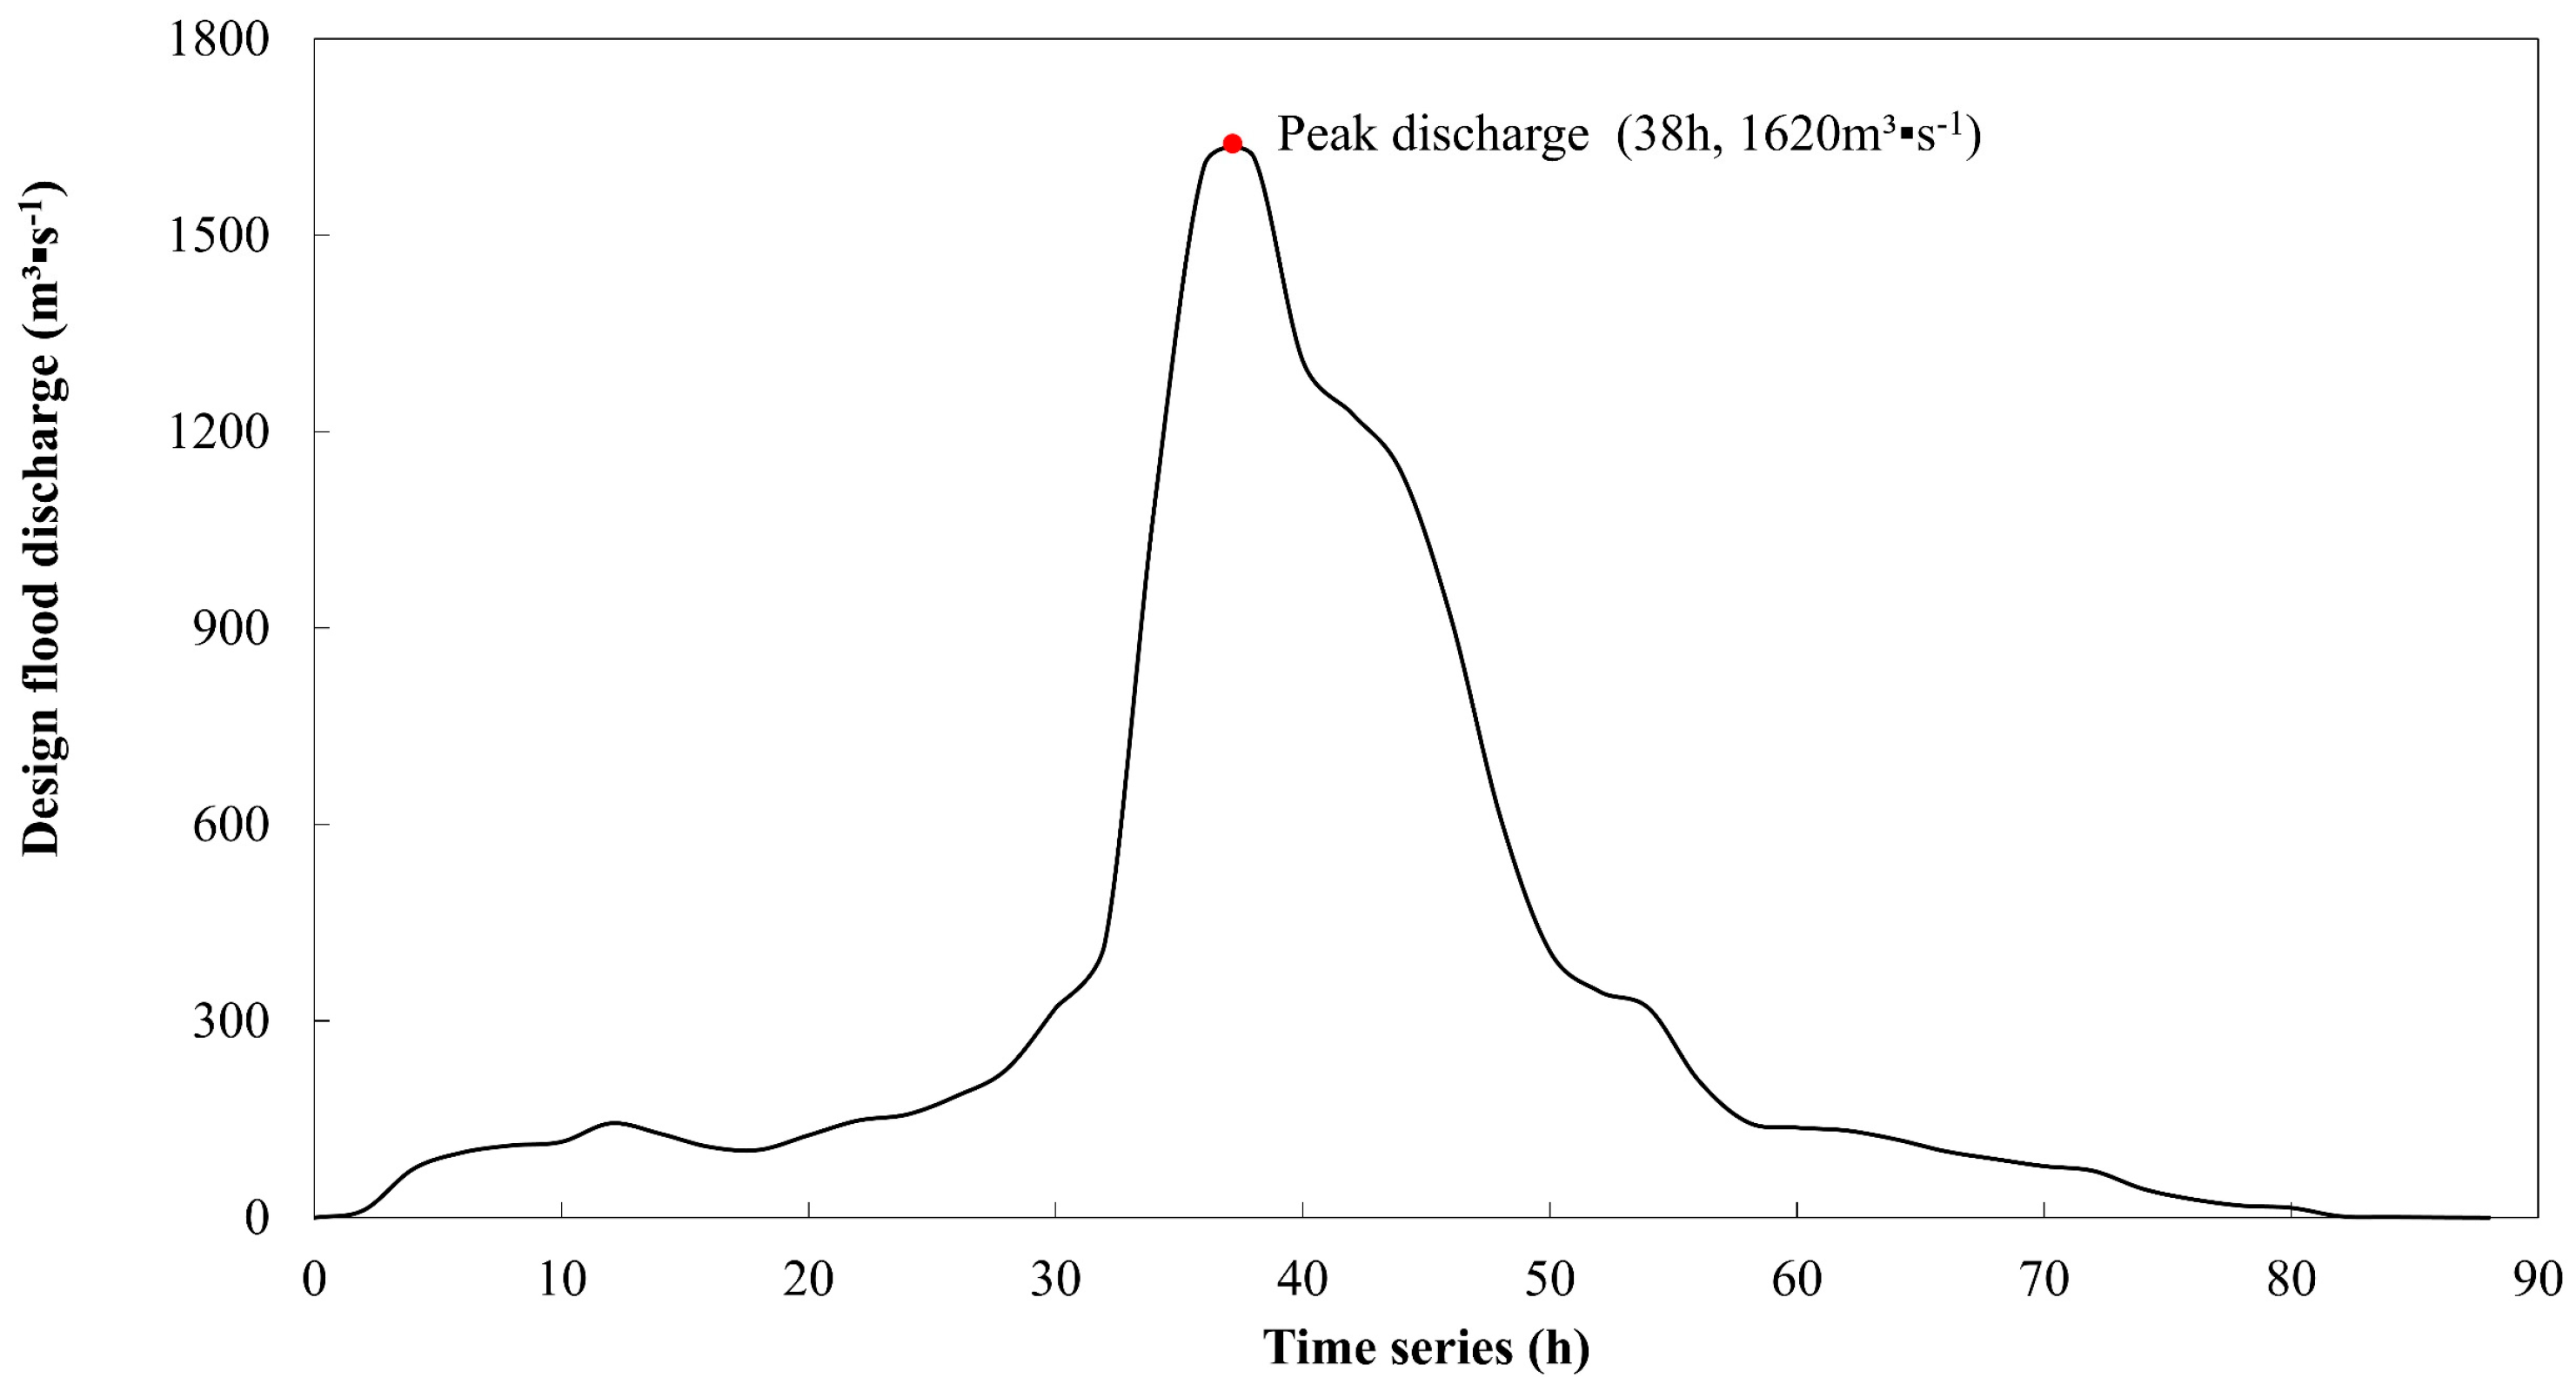
2.2.3. Risk Analysis of Outburst Floods Based on HEC-RAS

The HEC-RAS 6.4.1 model (https://github.com/HydrologicEngineeringCenter/hec-downloads/releases), developed by the Hydrologic Engineering Center of the United States Army Corps of Engineers, performs computations of flood wave propagation following a dam failure scenario by solving the full Saint–Venant equations [48]. In this study, dam parameters calculated by the predictive model of landslide dam geometry are input into HEC-RAS 6.4.1 to set up a landslide dam along the river (Figure 5). Manning roughness coefficient (n) was obtained from previous empirical parameters (Table 3) [49]. The infiltration method was selected from the Soil Conservation Service proposed by the U.S. Department of Agriculture [34], with the watershed characteristics represented by the integrated runoff curve number (CN) values, as detailed in Table 3.
The storage area is established in the upstream region, while the 2D flow area is designated in the downstream region. This landslide dam serves to connect the storage area with the 2D flow area. The mesh in the 2D flow area was computed with a spatial resolution of 30 m × 30 m. External boundary conditions, referring to the most upstream and downstream ends of the river system need to be set in HEC-RAS 6.4.1. The time step for simulation used was set to 1 s. The upstream boundary is fixed at the reservoir extent (storage area), and the input flow data is derived from the design flood hydrograph determined through the integrated unit line method in Guangdong Province. The downstream boundary is set at the normal depth slope.
The design values of precipitation and river discharge in different recurrence periods are shown in Table 4. Notably, from 10 June to 12 June 2019, Heyuan City experienced sustained heavy rainfall. Over this 72 h period, multiple monitoring stations recorded rainfall intensities ranging from heavy to extreme levels, with cumulative precipitation exceeding 500 mm. This rainfall magnitude approached the 100-year return period design precipitation threshold for the region. Consequently, the design discharge value of 100-year return period was chosen for outburst flood simulation, and the design flood hydrograph is illustrated in Figure 6. This flooding process serves as the upstream boundary condition for the HEC-RAS 6.4.1 model.

3. Results

3.1. Landslide Susceptibility Map Analysis

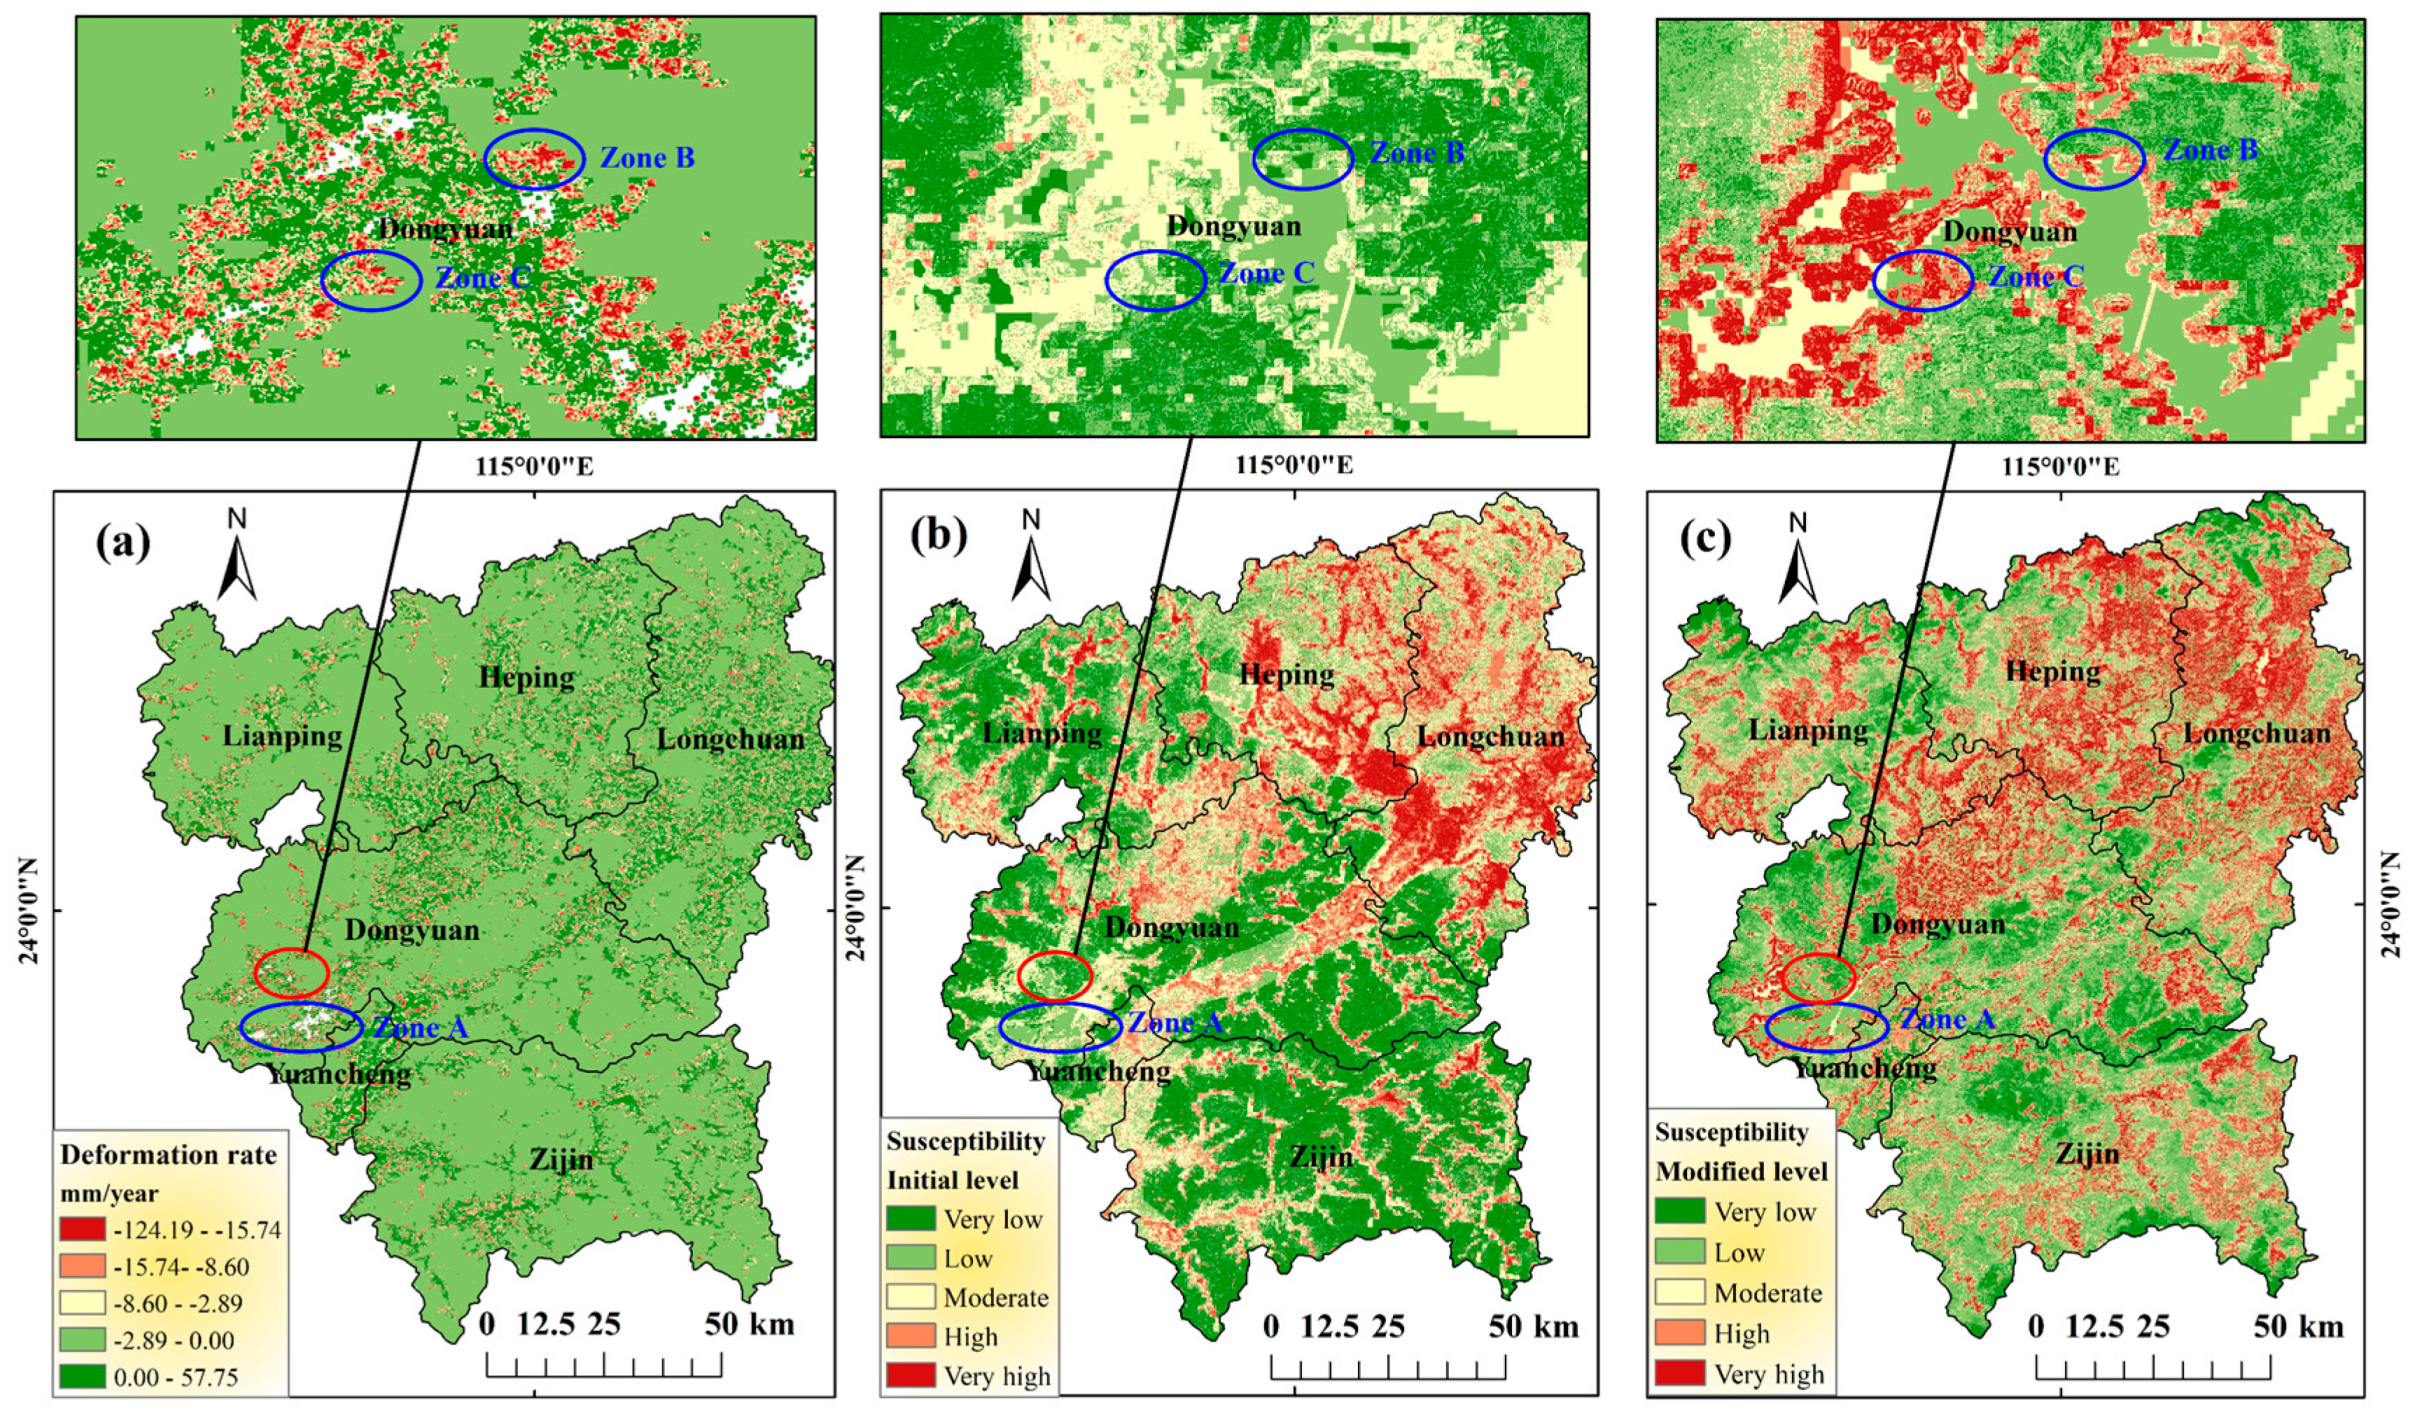
3.1.1. Surface Deformation Rate

A total of 59 ascending Sentinel-1A images, spanning from 8 January 2019 to 28 December 2020, were acquired and applied using the SBAS-InSAR technique to monitor surface deformation rate. This study filters unreliable deformation points using land use and NDVI. As shown in Figure 3c, the study is categorized into six land use types: cropland, forest, shrub, grassland, water, and impervious surfaces. Among these, forest is the predominant category, covering approximately 12,821.05 km2, 80% of the study area. However, the limited penetration capability of Sentinel-1’s C-band in densely vegetated areas reduces the reliability of deformation measurements in forested regions. To mitigate this effect while retaining sufficient data for analysis, only zones with NDVI greater than 0.75 were removed.
The refined surface deformation rate map for Heyuan City is presented in Figure 7a, with the local amplification maps featuring high surface deformation rates shown in Figure 7b1,c2. A comparative analysis with high-resolution remote sensing imagery reveals a pronounced correlation between elevated surface deformation rates and potential landslide hazards. Building upon this refined deformation dataset, we conduct a systematic visual interpretation, identifying 65 potential landslide sites, as shown in Figure 8a. These landslide-prone areas are predominantly distributed along river valley flanks and mountains. The local amplification maps, which highlight certain landslides, are delineated by red dotted lines in Figure 8b–e.

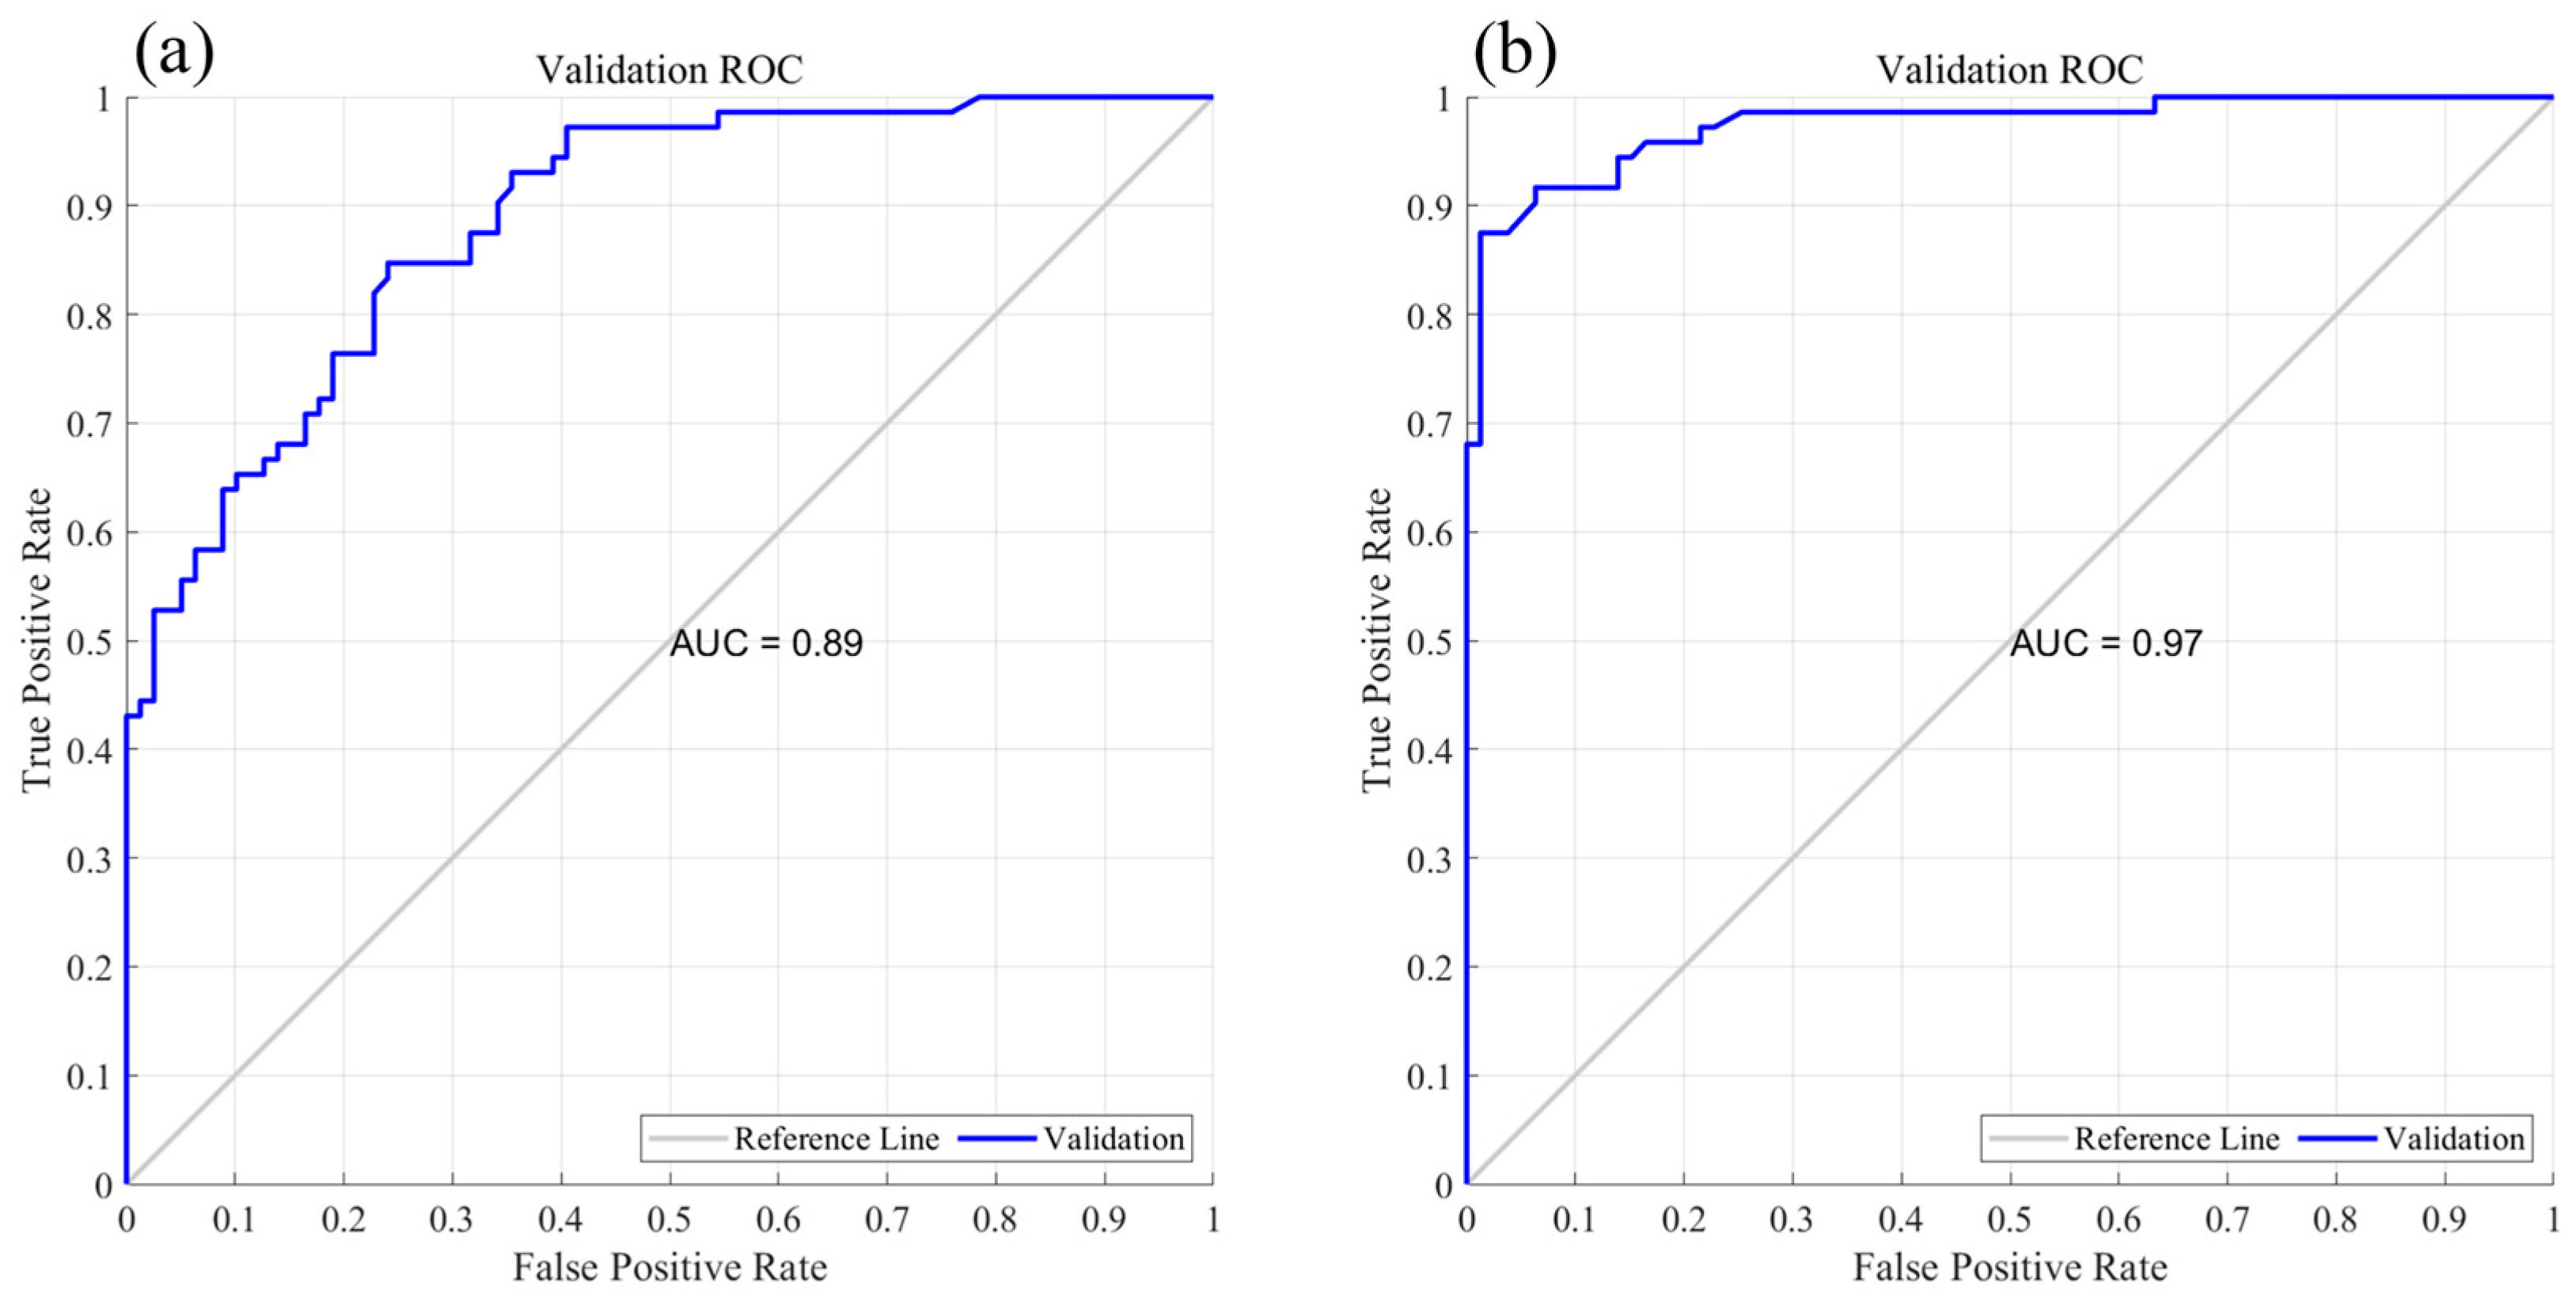
3.1.2. Landslide Susceptibility Assessment

The initial landslide susceptibility map generated by the RF model is presented in Figure 9b. Five susceptibility classes are defined as very low, low, moderate, high, and very high susceptible zones, utilizing the natural breaks method. By comparing Figure 9a,b, it can be seen that certain regions characterized by small deformation rates have been classified as moderate susceptibility areas, such as the Xinfengjiang Reservoir area (Figure 9 zone A). Conversely, some regions exhibiting significant deformation rates have been categorized as low susceptibility areas (Figure 9 zones B & C). However, regions characterized by significant deformation rates are susceptible to landslides. Therefore, the reliability of landslide susceptibility assessments that solely take into account static factors, such as elevation and slope, is limited and may not accurately reflect the actual conditions.
To address this limitation, we implemented a two-step correction framework: (1) augmenting the original 11 factors (Figure 3) with surface deformation rates and (2) integrating the identified potential landslide points in Figure 8 with the established landslide inventory (Figure 2) to create an enhanced landslide dataset. The result of modified landslide susceptibility assessment was subsequently evaluated using the RF model, as shown in Figure 9c. Overall, the result of LSA reveals pronounced spatial clustering of regions with high landslide susceptibility, predominantly located within two specific geological units: the granitic weathering mantles in the northeastern region and the unconsolidated sedimentary deposits in the northwestern region. These vital zones encompass Heping, Longchuan, Dongyuan, and Lianping Counties, which is consistent with the geological disaster prevention plan issued by the Heyuan City People’s Government in 2024 (http://www.heyuan.gov.cn/zwgk/zfgb/2024/03/szfbgswj/content/mpost_603919.html, accessed on 15 April 2025). In addition, these zones with high susceptibility display discrete distribution patterns in Zijin and Yuancheng Counties while exhibiting clustered distributions along fluvial valley banks.
Table 5 presents the distribution of various landslide susceptibility levels as a percentage of the total area of Heyuan City. The modified proportions of landslide susceptibility area for extremely low, low, moderate, high, and extremely high susceptibility zones are 12.48%, 37.00%, 17.91%, 17.58%, and 15.03%, respectively. In comparison to the initial evaluation of landslide susceptibility, the proportion of extremely high susceptibility areas is notably increased. It indicates that the failure to consider the surface deformation rate will underestimate the landslide susceptibility. To demonstrate the reliability of the evaluation models, the receiver operating characteristic (ROC) curve is used to validate the results, as shown in Figure 10. The LSA model incorporating surface deformation rate demonstrated significantly enhanced performance, achieving an AUC of 0.96, corresponding to a 7.9% improvement relative to the initial LSA model. This enhancement confirms the improved model’s superior predictive capability, highlighting the value of integrating dynamic terrain indicators such as surface deformation metrics in LSA.

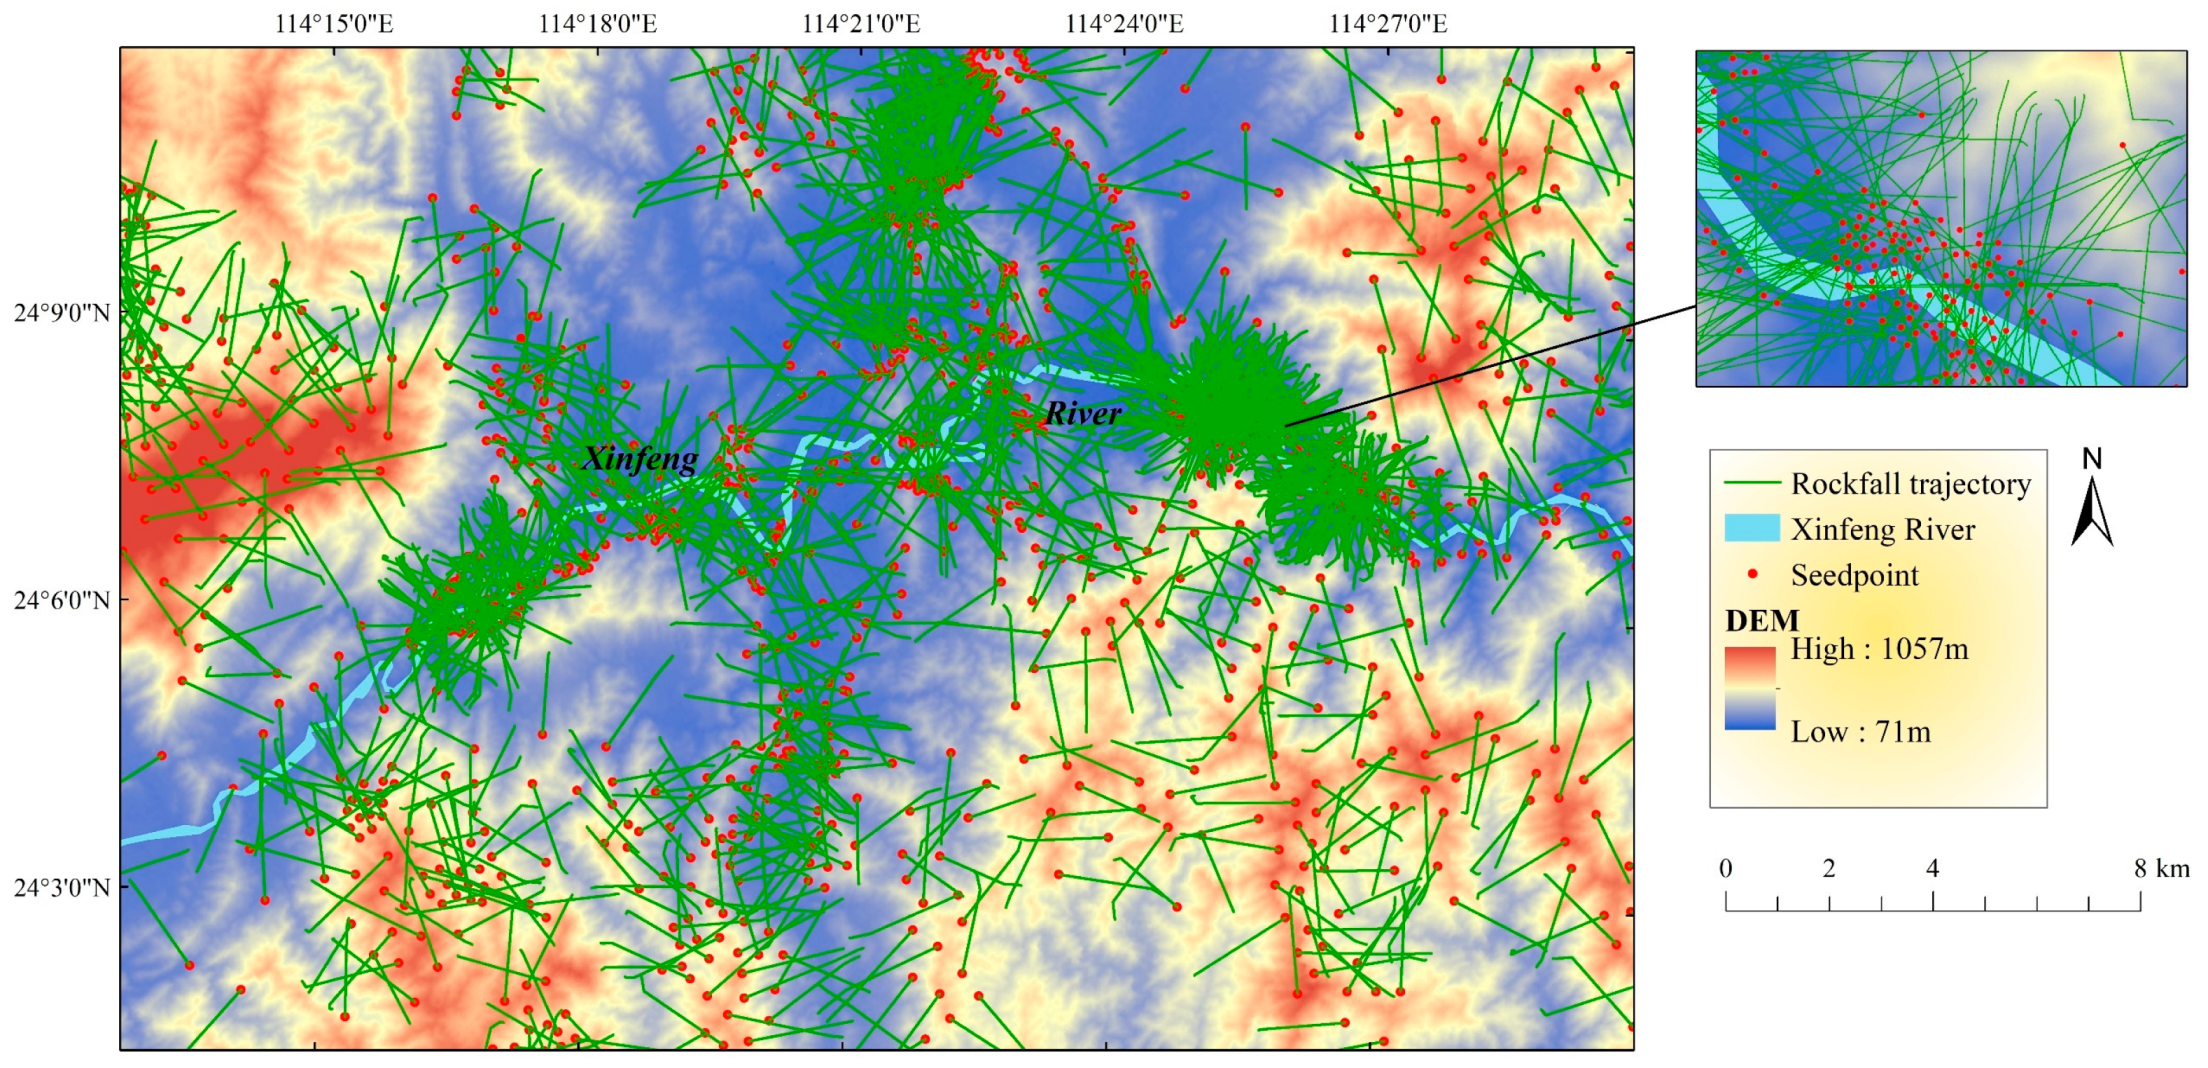
3.2. Landslide Dam Analysis

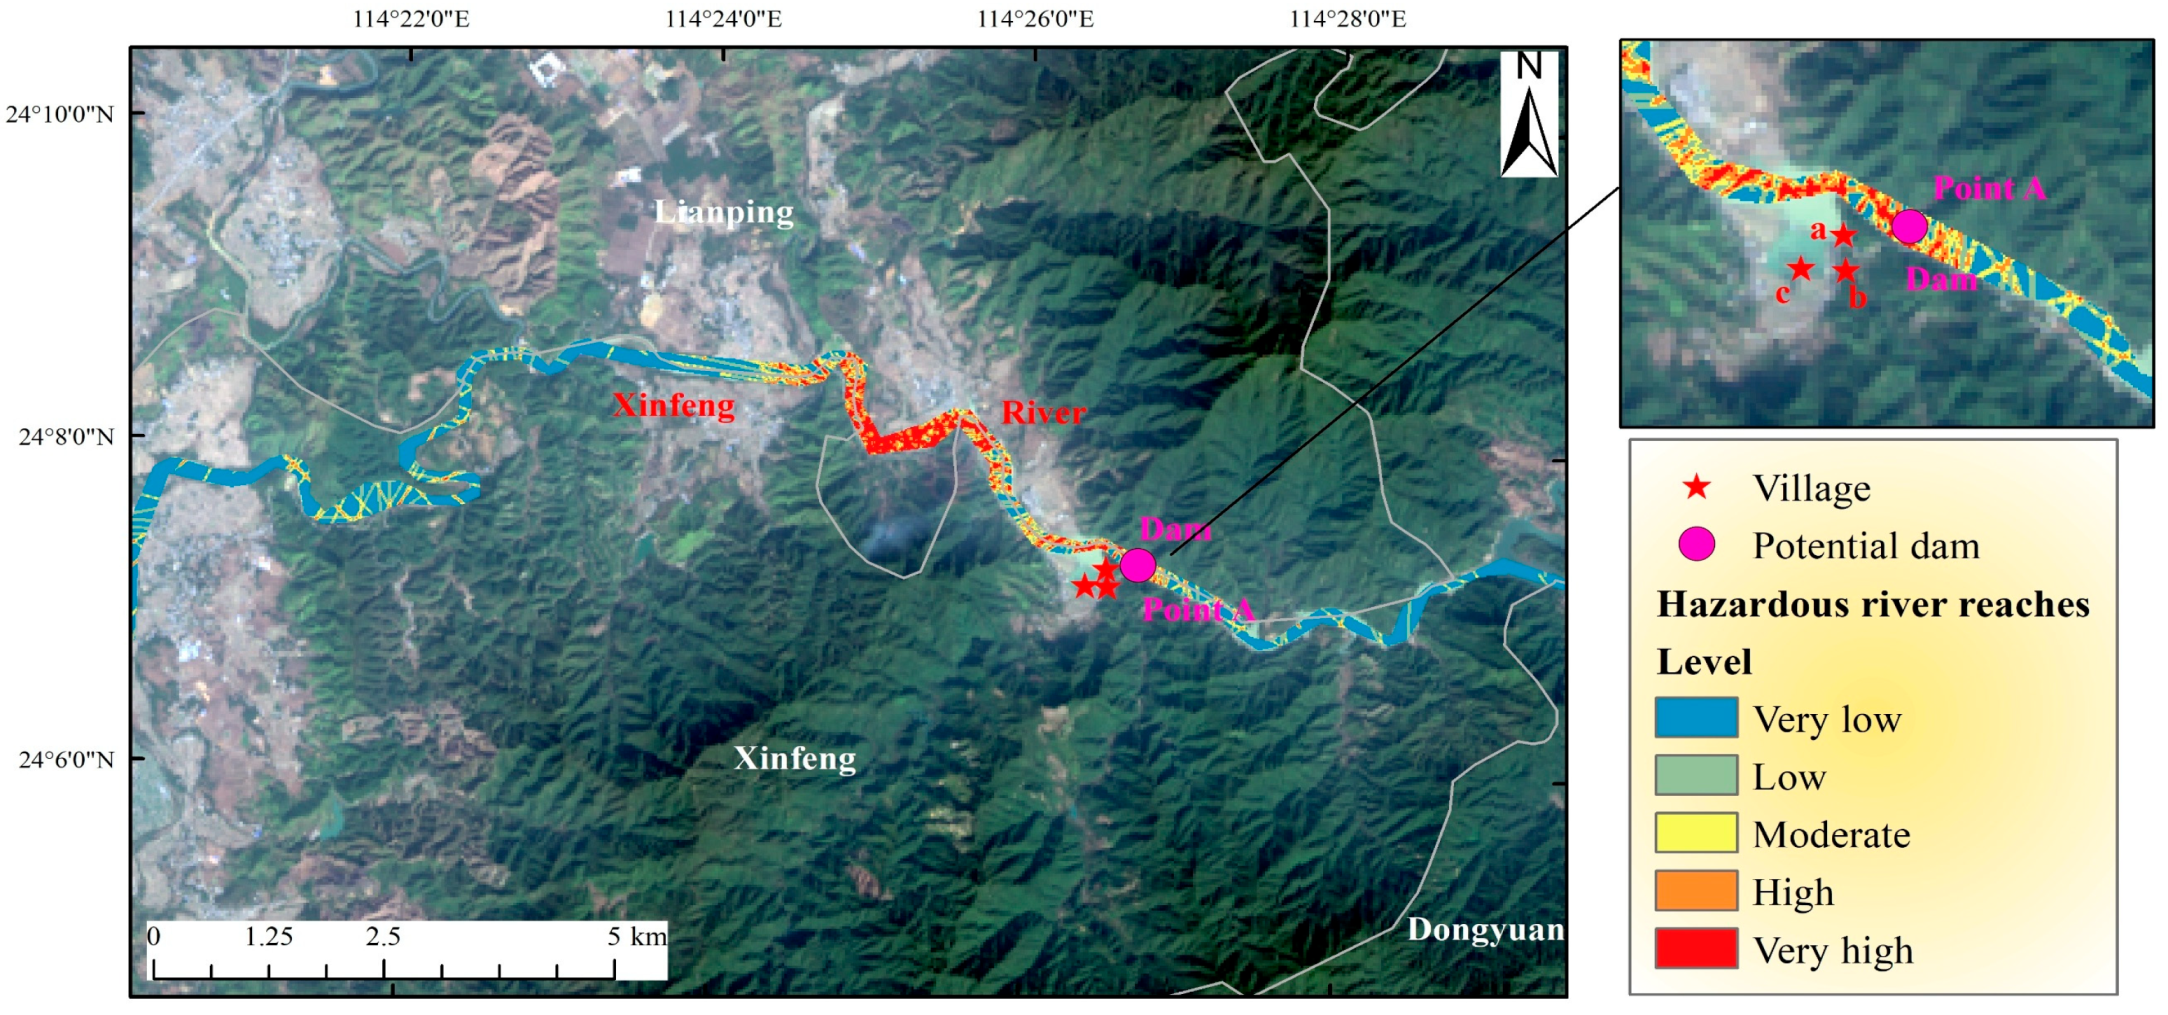
3.2.1. Landslide Dam Risk Identification

Based on the landslide susceptibility assessment, the area of extremely high susceptibility was selected for mass trajectory simulation. The Xinfengjiang River Basin exhibits steep terrain with an average elevation of approximately 700 m. Fluvial erosion has sculpted a distinct U-shaped valley, creating a stepped geomorphological profile that provides favorable geological conditions for landslide disaster chain development. Moreover, as the primary water source for the Pearl River Delta, twenty potential landslide points have been identified in the upper reaches of the Xinfengjiang Reservoir through visual interpretation. Landslide-induced disaster chains could threaten reservoir safety through cross-regional cascading effects. This underscores the strategic imperative to prioritize landslide dam analysis in the Xinfeng River Basin.
The RockFall Analyst model was applied to simulate the motion trajectories of unstable slopes along the Xinfeng River, as illustrated in Figure 11. Rockfall sources (seed points) can be defined as point features stored in shapefiles, which are dangerous landslide rock masses. The resultant rockfall trajectories are saved as polyline shapefiles. The findings indicate that unstable rock masses are predominantly concentrated along the slopes of river valleys and mountain canyons, while their distribution is comparatively sparse in other regions. Based on the motion trajectories, key indices, including the spatial distribution of rockfall frequency, velocity, and height, were calculated. A risk analysis of rock trajectories was then conducted using spatial weighting. Subsequently, the Spatial analyst tool in ArcGIS was employed to extract the river channel range associated with the identified rock trajectory risks. This process enabled the determination of the spatial distribution of hazardous river reaches along the Xinfeng River. Next, the Moment of Inertia (MOI) index was utilized to assess the potential formation of a landslide dam. Figure 12 illustrates the spatial distribution of landslide-affected hazardous river segments, with analysis revealing the risk of landslide dam formation is higher in the middle and lower reaches of the river, which are mainly located in the steep slope valley area. Point A in Figure 12 marks a potential landslide dam location identified through MOI analysis, which was selected to predict the geometric characteristics of the potential dam and to conduct further research. The potential landslide dam (point A) is situated downstream of the confluence area where three villages: Xinmenling Village (a), Hongxing Village (b), and Xihang Village (c)—are within a typical valley landscape. This geomorphologically active region exhibits pronounced landslide susceptibility along both mountain slopes. Of particular concern, the formation of the potential dam is projected to result in upstream backwater, posing a flooding threat to the aforementioned villages. Following the selection of potential dam site, the subsequent phase involves forecasting the geometric parameters of the dam through the predictive model, followed by a hydrodynamic simulation of outburst flood using the HEC-RAS 6.4.1 model to quantitatively assess the downstream inundation risk.

3.2.2. Landslide Dam Geometry Prediction

Based on the above investigation, the model for predicting the landslide dam geometry proposed by Wu et al. [50] was applied to predict the potential dam geometry. The prediction model contains seven input parameters: the landslide volume (V) was calculated by the Rockfall Analyst model; the bottom width of the valley (b) and the two slope angles on both sides of the valley (Φl and Φr) were measured by the topographic profile tool in the 91 map (www.91weitu.com, accessed on 15 January 2025.); the slope sliding surface angle ( α ), the valley bed inclination ( θ ), and the repose angle of the landslide mass (φ) used the experience values. According to the above description, the parameters required for predicting the geometric parameters of the landslide dam were summarized in Table 6. By simultaneously solving Equations (A6)–(A11) in Appendix A.2, the geometric parameters of the landslide dam were calculated, as listed in Table 7. The height of the landslide dam H is 95.26 m, the length of the dam bottom L b is 114.4 m, while the length of the dam top L t is 90.7 m, and the width W of the landslide dam is a known constant of 120 m. The internal angles of the downstream and upstream slopes β d and β u of the landslide dam are 20.98° and 27.78°, respectively. The geometric parameters of the landslide dam serve as the foundation for subsequent outburst flood simulations using HEC-RAS 6.4.1.

3.3. Risk Analysis of Landslide-Induced River Blocking

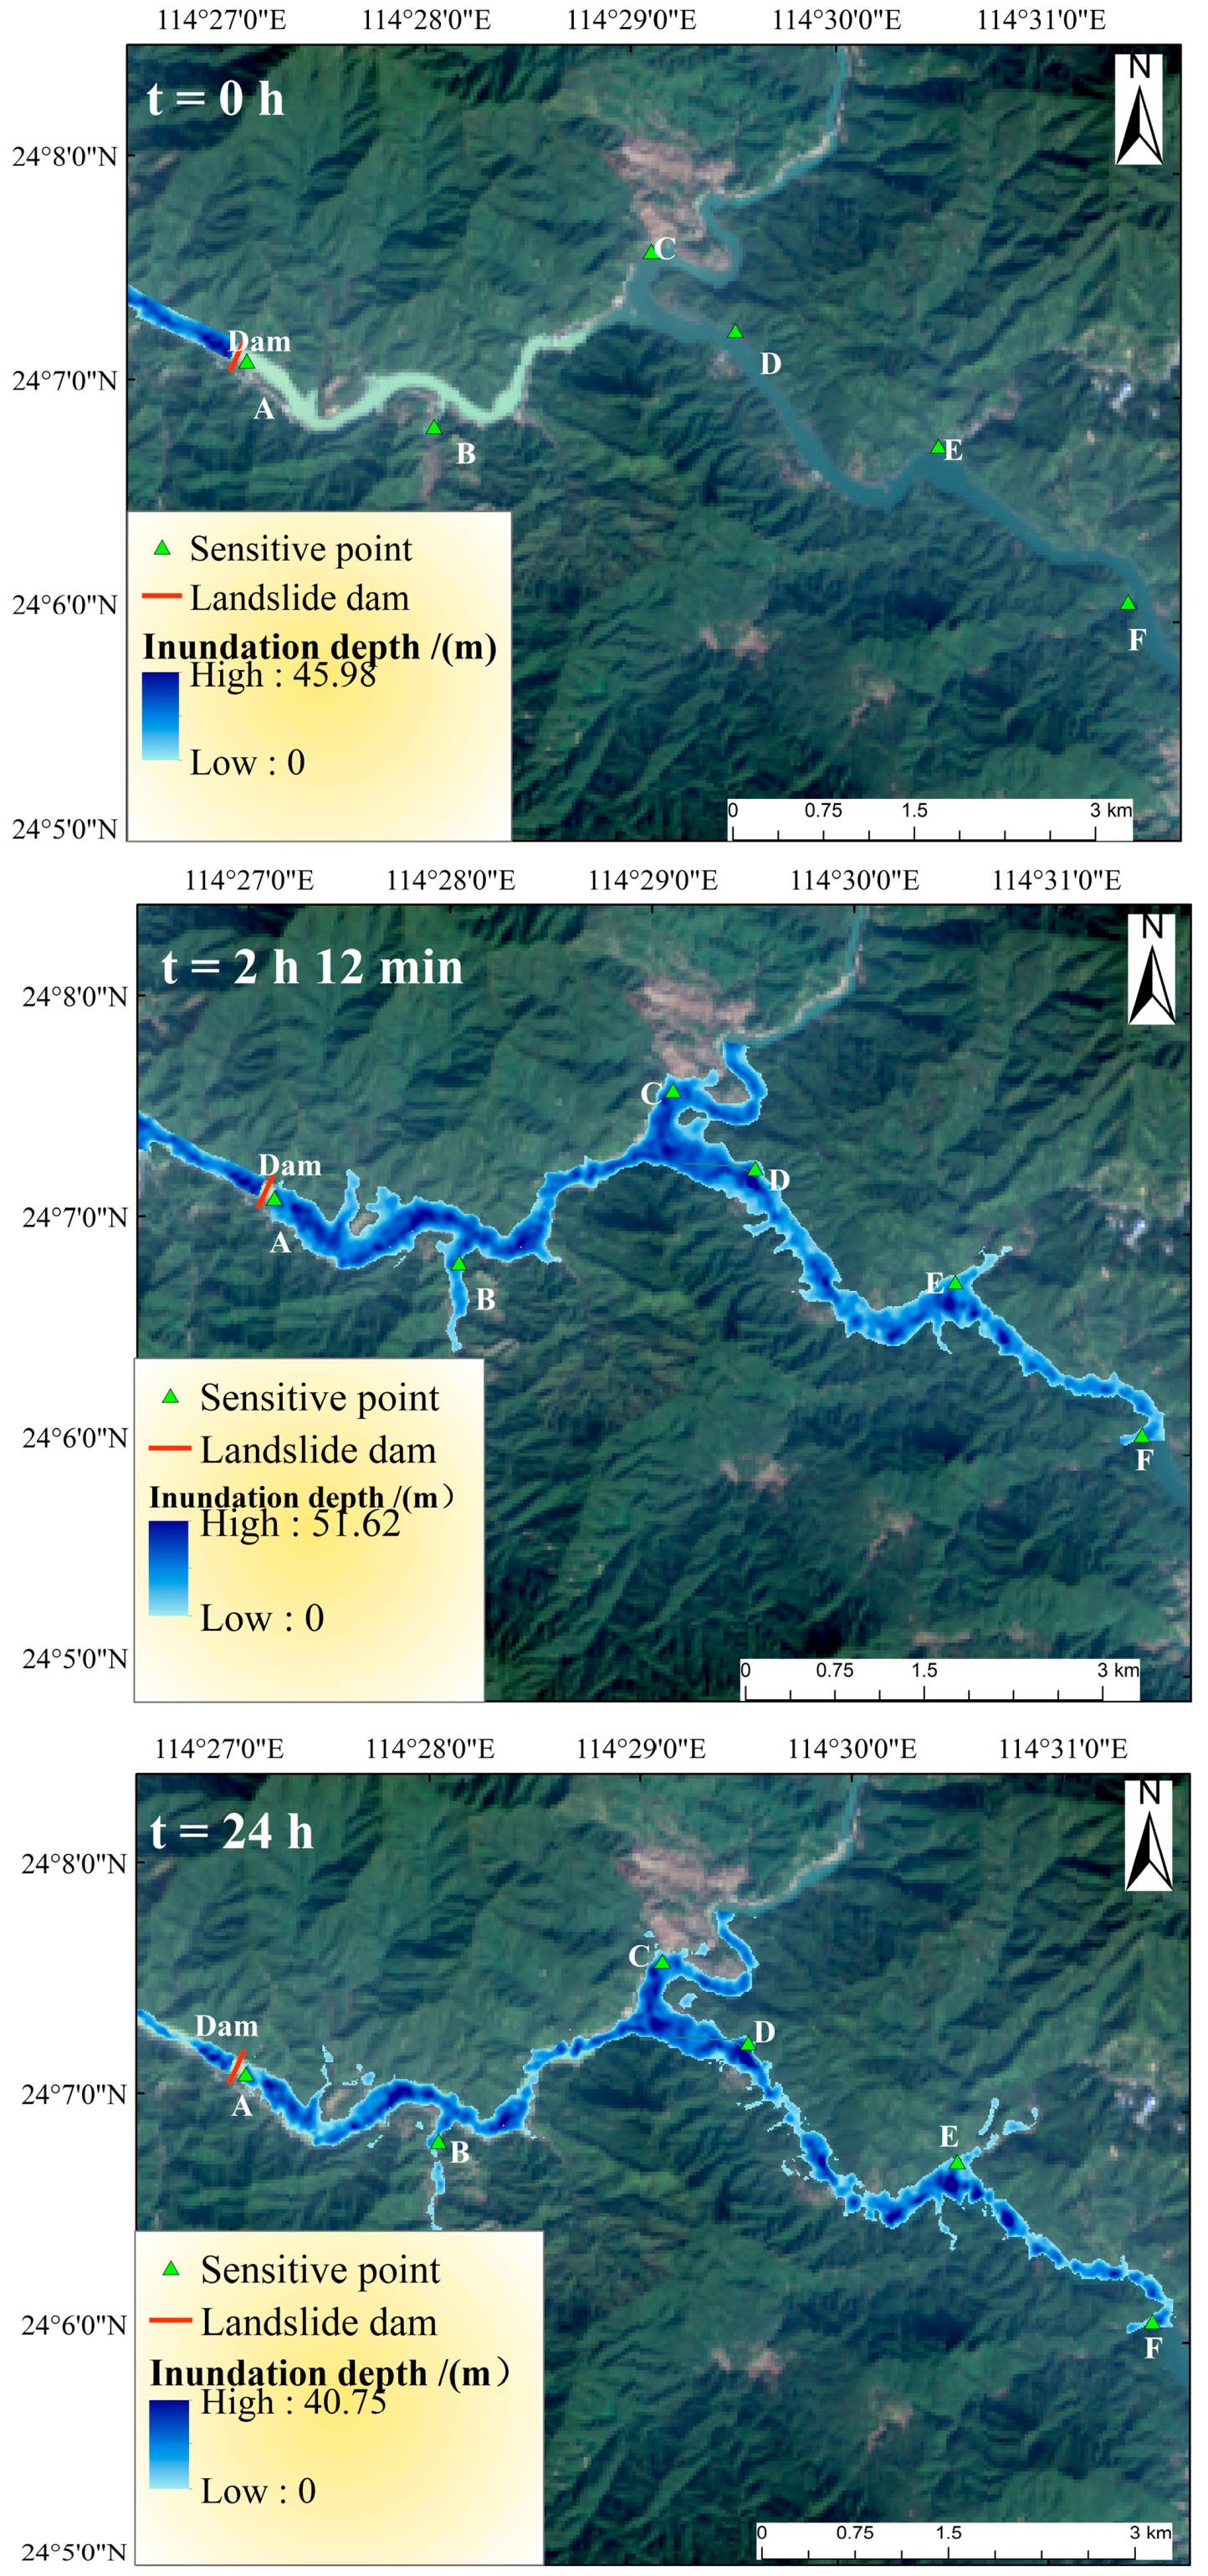
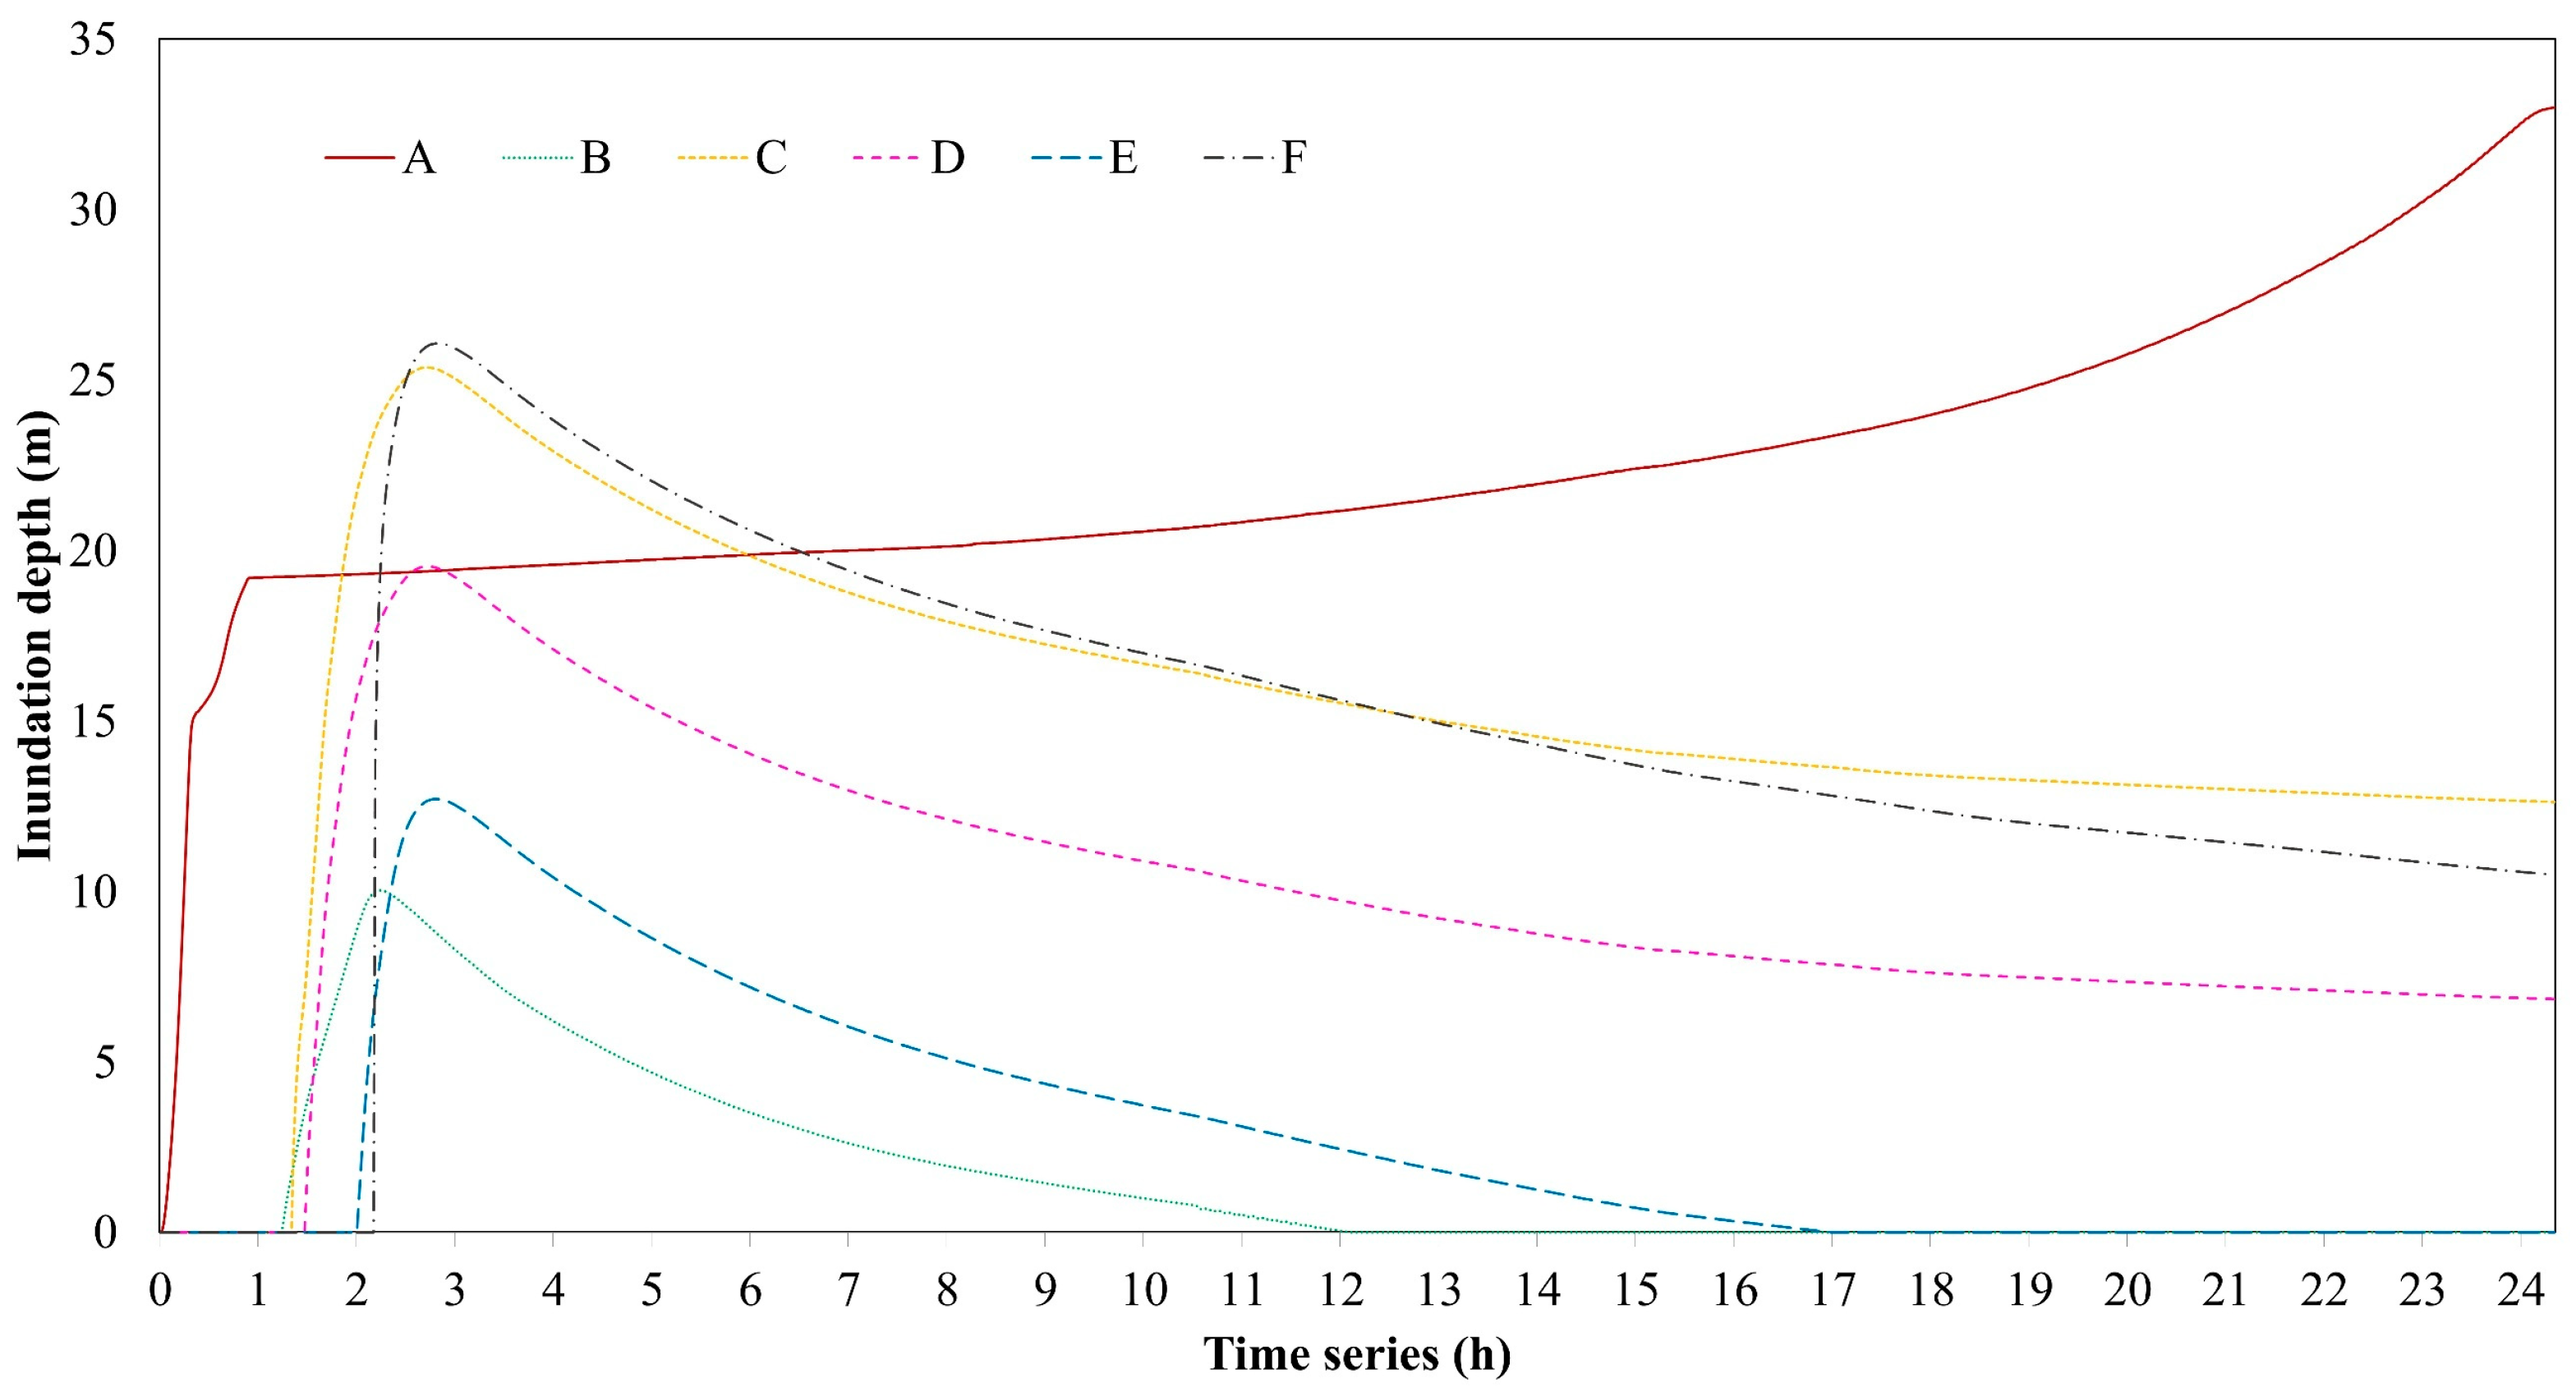
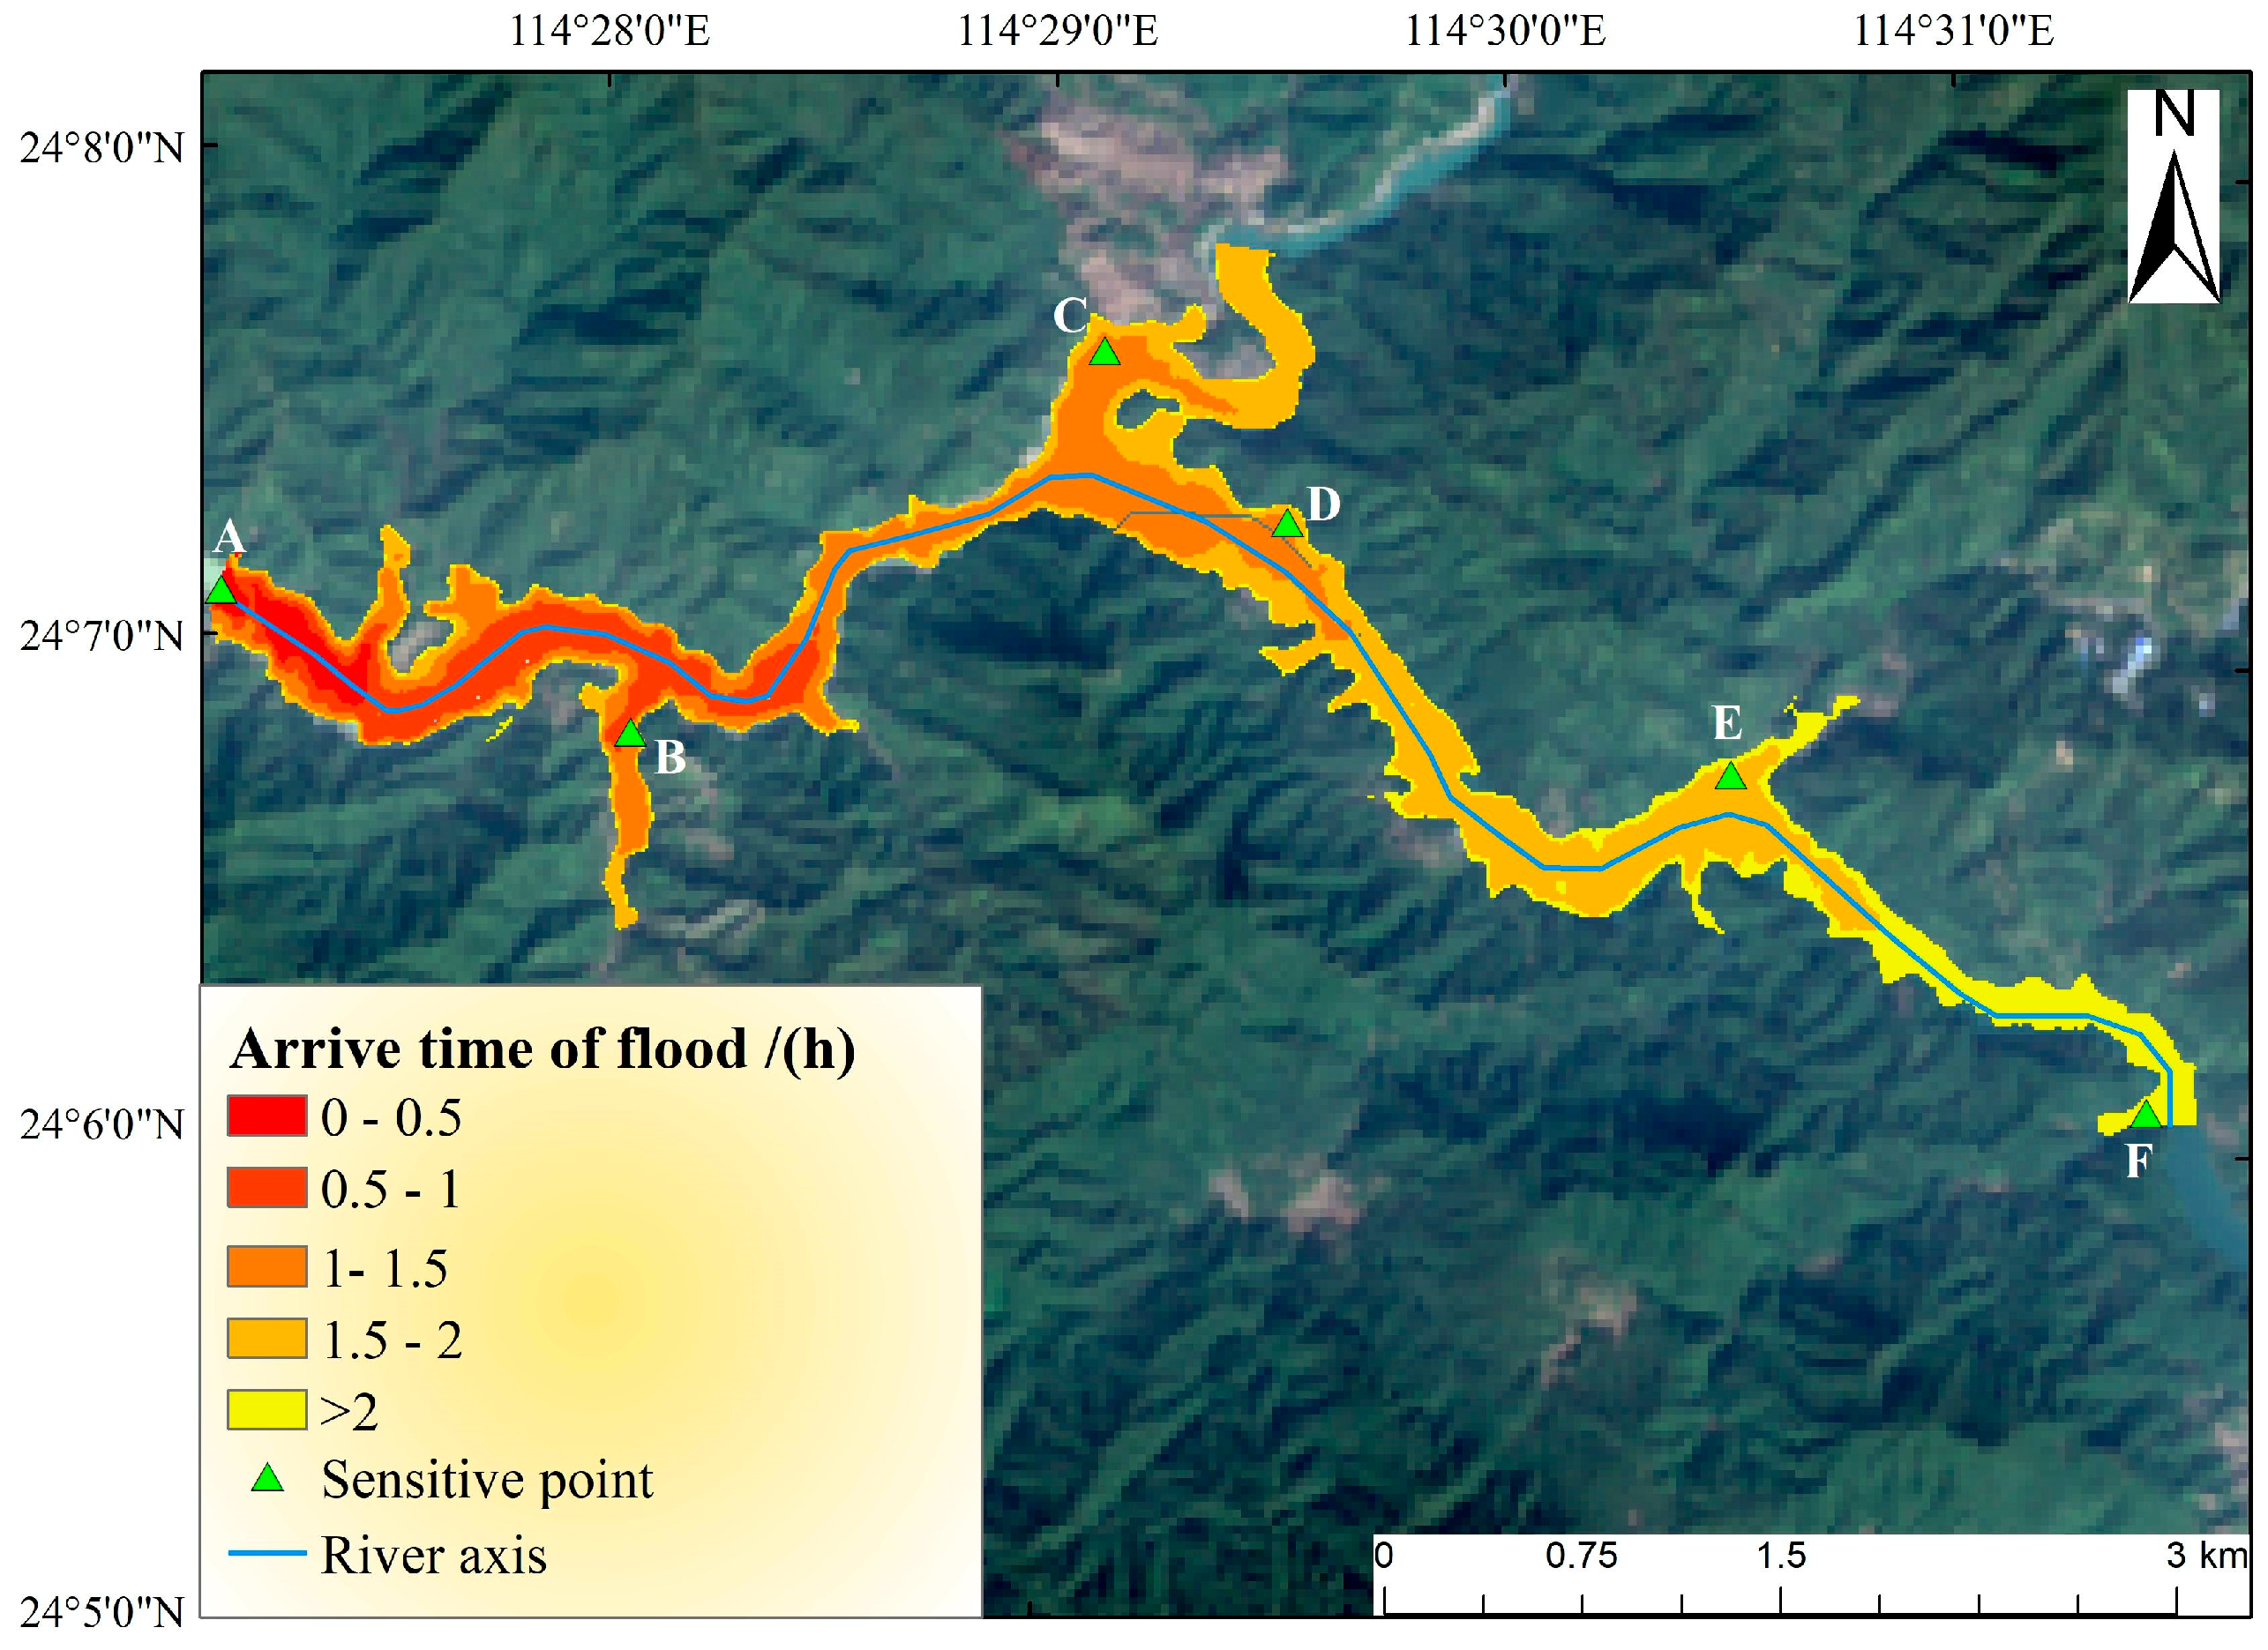
3.3.1. Outburst Flood

The HEC-RAS 6.4.1 model was employed to simulate the 72 h process of outburst flood according to the design flood discharge hydrograph in Figure 6. Figure 13 shows the evolution and inundation process of outburst flood during the whole process of dam failure, which demonstrates that the maximum inundation depth was reached immediately upon dam failure at 2 h and 12 min, marking the completion of the breach formation process. Subsequent backwater effects induced gradual water level recession. The findings indicate that dam failure constitutes a rapid geomorphic event dominated by high-velocity flows, causing instantaneous downstream stage increases. Throughout the dam failure process, the erosion and inundation of the downstream region represent a dynamic and complex phenomenon. Initial partial structural failure releases limited discharge, followed by exponentially increasing flows as the breach expands progressively. Notably, the landslide dam was completely broken prior to the attainment of peak flow. This early failure can be attributed to the composition of the landslide dam, which consists of loosely aggregated earth and stone. This textural heterogeneity created preferential failure areas that propagated rapidly once initiated, accelerating structural collapse.
To assess the effects of outburst floods on downstream areas and their evolutionary patterns, six sensitive points (point A to F in Figure 13) were selected based on the topography and population density. These points were located in the river bends, tributary confluences, and densely populated zones. As illustrated in Figure 14, the inundation depths of the most sensitive points exhibited a pattern of rapid stage rise followed by gradual recession. Furthermore, it was observed that the rate of increase in inundation depth was more pronounced in proximity to the breach. Notably, the inundation depth at point A, which is situated closest to the breach, initially surged sharply before experiencing a slower rise. The reason for this difference is that point A is immediately close to the breach. During the initial breach phase, the high-potential energy head generated catastrophic discharge velocities exceeding 14 m/s, triggering an abrupt water level surge. However, subsequent flow interactions with downstream channel constrictions created a hydraulic accumulation effect at point A, producing sustained gradual stage increases. In contrast, the sensitive points downstream are far away from the breach, leading to the flow energy attenuating along the channel. Consequently, the inundation depth is expected to gradually recede following an initial rapid increase.
The outburst flood arrival time (FAT), defined as the interval between breach initiation and the first appearance of inundation at downstream locations, constitutes a critical emergency response window for downstream communities. Figure 15 documents the FAT progression: (1) initial rapid advancement phase (0–1 h): during the first hour following dam breach initiation, floods propagated along the river axis at velocities of 10–15 m/s, sequentially inundating the sensitive points A and B. (2) Intermediate lateral diffusion phase (1–2 h): within two hours post-failure, the flood wave maintained axial channel progression while initiating lateral spreading, progressively submerging points C, D, and E within two hours of breach occurrence. (3) Mature floodplain development phase (>2 h): after 2 h, the flood front propagates to the outflow boundary of the two-dimensional floodplain, where the submerged area reaches its maximum spatial extent, followed by the initiation of flow recession. The results reveal the spatiotemporal propagation patterns of flood evolution, establishing critical emergency response windows for downstream areas at risk of outburst flooding. Based on differential early warning response times, a three-tier “red-orange-yellow” emergency mechanism is proposed. Red zones (FAT < 1 h) necessitate pre-positioned shelters due to severely constrained evacuation windows, while orange zones (1 h ≤ FAT ≤ 2 h) require immediate mass evacuation. Yellow zones (FAT > 2 h) allow phased population relocation, enabling optimized resource allocation. This tiered framework strategically aligns evacuation patterns with the arrival time of outburst floods, allowing for the optimization of emergency evacuation times for residents in that area.

3.3.2. Mountain Flash Flood

To further evaluate downstream impacts of landslide dam failure scenarios, this investigation employs HEC-RAS 6.4.1 to simulate mountain flash flood inundation patterns under unobstructed channel conditions. Figure 16 compares the maximum inundation depths between outburst floods and mountain flash floods. Quantitative analysis reveals a notable difference in peak water depths, with mountain flash floods reaching 44.19 m compared to 53.43 m for outburst floods, representing a differential of approximately 10 m. The outburst flood exhibits lateral expansion along the riverbanks, resulting in broader inundation coverage compared to the flash floods. These findings demonstrate that landslide dam-triggered outburst floods possess enhanced destructive potential and more intricate inundation characteristics, characterized by rapid lateral propagation and elevated inundation depths. Figure 17 demonstrates significant velocity differences between outburst floods and mountain flash floods. The sudden release of impounded water during dam failure generates transient, high-velocity flow fronts reaching 20 m/s—nearly three times faster than the 7 m/s peak velocities observed in typical mountain floods. This rapid discharge propagation causes abrupt stage rises in downstream reaches. In addition, the flow with high kinetic energy substantially increases lateral erosive capacity, resulting in a broader inundation area compared to conventional flash floods.
In conclusion, compared to mountain flash floods, outburst floods exhibit shorter durations and higher intensities. Following the occurrence of a dam breach, the resultant flood can submerge the entire downstream region within a matter of hours. Furthermore, the substantial energy released during the breach significantly enhances both the flow velocity and inundation depth. Flood control planning must incorporate separate analysis of landslide dam breach scenarios, enhance the level of flood control measures, and expand the scope of emergency response to ensure safety.

4. Discussion

4.1. The LSA Integrated Surface Deformation Rate

While interferometric synthetic aperture radar (InSAR) has proven effective for landslide detection, most machine learning-based landslide susceptibility assessments (LSAs) predominantly rely on static topographic parameters (elevation, slope, and aspect) while neglecting dynamic indicators such as InSAR-derived surface deformation rates. This limitation reduces the accuracy and practical applicability of these models and hindering their generalizability to other regions. Furthermore, the accuracy of surface deformation rates obtained through InSAR technology is influenced by multiple factors, including data processing methodologies, atmospheric disturbances, and baseline parameters. Importantly, surface characteristics such as vegetation cover constitute an additional critical factor affecting the reliability of deformation monitoring results. To address these, our study filters unreliable deformation points using land use and NDVI and incorporates surface deformation rates into LSAs to enhance the alignment of evaluation results with the actual spatial distribution of landslides, thereby improving the accuracy and reliability of the assessment.
The initial model, relying solely on static factors such as elevation and slope, misclassified regions with low deformation rates as moderate-to-high susceptibility zones (e.g., Xinfengjiang Reservoir, Zone A) while overlooking high deformation areas (Zone B) as low-risk. This discrepancy underscores the limitations of conventional static approaches in capturing real-time geomorphic dynamics. The revised susceptibility map (Figure 9c), incorporating deformation data, reveals a 27.55% reduction in extremely low-risk zones and an 8.99% expansion of extremely high-risk areas, notably concentrated in Heyuan’s northern districts. This finding aligns with the distribution of landslide samples that we have collected (as shown in Figure 2). The ROC validation (AUC = 0.9) confirms the model’s robustness, emphasizing the necessity of integrating dynamic indicators to mitigate underestimation of landslide risks in geologically active regions.

4.2. The Systematic Framework of Landslide Hazard Chain

This study proposes a novel and objective framework to systematically evaluate downstream risks triggered by landslide dam formation through integrated hazard chain analysis. By incorporating dynamic deformation rates into the RockFall Analyst (RA) model, this framework enhances simulation accuracy for mass motion trajectories, enabling precise identification of vulnerable river segments susceptible to blockage. Furthermore, the model’s capacity to derive geometric parameters of potential landslide dams provides critical inputs for subsequent flood outburst modeling.
Subsequently, this study investigates the mechanisms of energy accumulation and release during short-duration, high-intensity outburst floods by implementing dynamic breach boundary conditions. It also establishes a definition for dam break time, thereby addressing the limitations of conventional methodologies in analyzing transient processes. While previous studies [51,52] have predominantly quantified flood risk through inundation depth alone, this work advances the field by systematically integrating outburst flood arrival time thresholds in downstream regions post-dam failure. This threshold provides critical time windows for emergency response and evacuation strategies for affected populations. Additionally, the majority of prior research has concentrated on the risk assessment of individual disasters, thereby neglecting the cascading effects associated with hazard chains. In contrast, this study develops a comprehensive forecasting framework that encompasses the entire process of landslide susceptibility assessment, prediction of the geometry of the hazardous reach of a dammed reservoir, and simulation of outburst floods, which systematically investigates the landslide—landslide dam—outburst flood disaster chain.

4.3. Limitations and Future Directions

Despite its contributions, this study acknowledges two primary limitations. First, the dam’s location and geometric parameters are derived solely from model-based simulations without validation against empirical data from actual dam breach incidents. Second, the research exclusively examines flood evolution patterns from single landslide-dam scenarios, whereas natural disasters such as heavy rainfall or the high frequency of earthquakes often trigger clustered landslide dams. When multiple landslide dams simultaneously form in both the main river and its tributaries and subsequently breach over time, the ensuing downstream floods may overlap, a critical scenario not addressed in the current investigation.
Future research should extend this framework to real-world landslide-dammed lakes under diverse geological and topographic conditions, including canyon-type and wide-valley-type channels, and evaluate its applicability across various material compositions and topographical features. Additionally, special attention must be given to the cascading failure mechanisms of sequential landslide dams within river systems, a critical factor in catastrophic chain reactions. Moreover, integrating high-resolution remote sensing data and digital elevation model (DEM) data could further enhance the accuracy and reliability of predictions related to hazard chains.

5. Conclusions

This study proposes a novel and objective framework to systematically assess the hazard chain risk of landslide—landslide dam—outburst flood events in mountainous river systems. By integrating random forest, the Rockfall Analyst model, and the HEC-RAS 6.4.1 hydraulic model, the framework offers a comprehensive and quantitative approach for analyzing cascading geohazard processes. The framework was applied to Heyuan City, a region prone to landslide hazards due to its steep terrain and subtropical monsoon climate, offering a representative case for complex mountainous disaster scenarios. The main conclusions are as follows:
(1) Landslide susceptibility is assessed through a random forest model incorporating 11 static environmental and geological factors. The use of surface deformation rate, derived from the SABS-InSAR technique, significantly improves landslide susceptibility assessment and avoids underestimation. The middle-lower Xinfengjiang River Basin exhibits pronounced susceptibility to landslide-induced damming, particularly within steep-sided valleys. The confluence near Xinmenling, Hongxing, and Xikeng villages was identified as the most probable site for dam formation.
(2) The motion trajectories of potential landslides are simulated using the Rockfall Analyst model, identifying the vulnerable river segments to landslide-induced damming. A predictive model is applied to systematically estimate the key geometric parameters of potential landslide dams, which serve as critical inputs for subsequent flood modeling.
(3) The HEC-RAS 6.4.1 model is employed to simulate outburst flood evolution. The timing of dam failure is determined, and a novel emergency response parameter, outburst flood arrival time (FAT), is introduced to define the time threshold for initiating downstream evacuation. This provides a critical time window for timely implementation of actions for affected populations of downstream regions. In addition, outburst floods exhibit greater destructive potential and more intricate inundation characteristics than typical mountain flash floods. This underscores the need for flood control planning to incorporate separate analyses of landslide dam failure scenarios, thereby enhancing the effectiveness of mitigation measures and ensuring broader evacuation zones for improved safety assurance.
This integrated framework represents a significant advancement in hazard chain modeling. Its applicability extends beyond the specific study area, allowing researchers in other regions to analyze the complex dynamics of compound events and develop effective risk reduction strategies. Ultimately, this work contributes to the development of early warning systems for landslide—landslide dam—outburst flood hazard chains by pinpointing a critical evacuation time window for the downstream areas at risk of experiencing an outburst flood. Furthermore, this framework demonstrates potential for application in analyzing landslide-dammed lakes across diverse geological conditions, material compositions, and topographic settings. Future studies should address cascading dam failures along river systems while integrating high-resolution remote sensing and DEM data to enhance prediction accuracy of hazard cascades.

Author Contributions

M.Z.: Writing—original draft, visualization, resources, project administration, methodology, formal analysis, conceptualization. X.L.: writing—original draft, visualization, resources, methodology, investigation. J.W.: writing—review and editing, visualization, software, investigation, data curation. L.Z.: writing—review and editing, visualization, software, investigation, data curation. F.L.: writing—review and editing, visualization, software, investigation, data curation. All authors have read and agreed to the published version of the manuscript.

Funding

This work was supported by the National Key R&D Program of China (2021YFC3001000). The financial support is gratefully acknowledged.

Data Availability Statement

The original contributions presented in the study are included in the article, further inquiries can be directed to the corresponding author.

Conflicts of Interest

The authors declare no conflicts of interest.

Abbreviations

The following abbreviations are used in this manuscript:
LSAMultidisciplinary Digital Publishing Institute
RARockfall Analyst
InSARInterferometric synthetic aperture radar
RFRandom forest
FATOutburst flood arrival time
ROCReceiver operating characteristic curve
FPRFalse positive rate
TPRTrue positive rate

Appendix A

Appendix A.1. RockFall Analyst (RA) Model

The RA employs the “lumped mass” or point approach to simulate the trajectories of rockfalls by considering the ground topography as well as various physical parameters, including the normal restitution coefficient, the tangential restitution coefficient, and the sliding surface friction angle. A distributed raster (or GRID) modeling technique is employed to present the distribution of rockfall spatial frequency, flying or bouncing height (potential energy), and kinetic energy based on the results of 3D rockfall process modeling.
In the rock leap phase, the trajectory, velocity, elevation, and other related variables are modeled using parabolic equations characterized by specific parameters. The displacement and velocity are defined as follows:
P ath = V x 0 t + X 0 V y 0 t + Y 0 1 2 g t 2 + V z 0 t + Z 0 = 0 0 1 2 g t 2 + V x 0 t V y 0 t V z 0 t + X 0 Y 0 Z 0
V elocity = V x 0 V y 0 V z 0 g t = 0 0 g t + V x 0 V y 0 V z 0
where g is the acceleration due to gravity (9.8 m/s2), X 0 , Y 0 , and Z 0 are the coordinates of the initial position, and V x 0 , V y 0 , and V z 0 represent the initial velocity of the rock in the x, y, and z directions, respectively.
In the collision rebound stage, the intersection of the defined surface raster and the flight path of the rock, the bouncing velocity vector in a local coordinate system, is defined as follows:
V Dip = V Dip R t
V Trend = V Trend R t
V N = V N R n
where V Dip , V Trend , and V N represent the bouncing velocity vector without energy loss, V Dip is the velocity component of the rock in the dip direction of the slope cell, and V Trend is the rock velocity component of V N in the normal direction of the slope cell. R n is the normal restitution coefficient, and R t is the tangential restitution coefficient, both of which range from [0, 1].

Appendix A.2. The Prediction Model of Landslide Dam Geometry

It is hypothesized that when the river valley is narrow and the volume of the landslide is substantial, the landslide mass can entirely obstruct the river valley. The formation mechanism of landslide dams can then be characterized through the conceptual model illustrated in Figure A1. Firstly, as the landslide mass moves downslope and interacts with the riverbed at a given inclination angle ( θ ), its longitudinal profile transitions from a rectangle to a parallelogram shape due to shear deformation. Subsequently, under the continued influence of the riverbed’s gradient, the profile is further altered, gradually evolving into a trapezoidal form. This progressive transformation reflects the mechanical interaction between the landslide material and the valley geometry, which ultimately determines the morphology of the resulting dam.
Figure A1. Evolution of landslide dam geometry. (A) The initial stage; (B) The second stage; (C) The third stage; (D) The final stage.
Remotesensing 17 01842 g0a1
Based on the generalization of the landslide dam formation process, a predictive model for predicting landslide dam geometry was proposed by Wu et al. [50], supported by physical model tests. The prediction model includes seven parameters, including the natural repose angle of the landslide mass ( φ ), the landslide volume (V), the bottom width of river valley (b), the angles of two riverbanks ( φ l and φ r ), the slope sliding surface angle ( α ), and the valley bed inclination ( θ ). Among the parameters, φ , b, φ l and φ r , α , and θ can be acquired through geological surveys, while V and α can refer to the prior researchers [53,54,55]. The formulas for the landslide dam geometry prediction model are as follows:
κ 1 = 2 λ t a n β d t a n β u 2 t a n β u λ t a n β d + t a n β u
κ 2 = 2 t a n β u 2 λ t a n β d t a n β u λ 2 t a n β d t a n β d + t a n β u
κ 3 = 1 κ 1 κ 1 t a n β d + t a n β u 2 t a n β d t a n β u
H = κ 1 V / B
L b = κ 2 V / B
L t = κ 3 V / B
where H is the height of the landslide dam, L b is the length of the dam bottom, and L t is the length of the dam top. κ 1 , κ 2 , and κ 3 are the geometric characteristic parameters of the dam. B is the width of the river valley. β d and β u represent the internal angles of the downstream and upstream slopes of the landslide dam, respectively. The calculation method refers to the previous literature [50].

References

  1. Liu, W.; Carling, P.A.; Hu, K.; Wang, H.; Zhou, Z.; Zhou, L.; Liu, D.; Lai, Z.; Zhang, X. Outburst floods in China: A review. Earth Sci. Rev. 2019, 197, 102895. [Google Scholar] [CrossRef]
  2. Zhang, Z.; Liu, M.; Tan, Y.J.; Walter, F.; He, S.M.; Chmiel, M.; Su, J.R. Landslide hazard cascades can trigger earthquakes. Nat. Commun. 2024, 15, 2878. [Google Scholar] [CrossRef] [PubMed]
  3. Wang, X.; Mao, H. Spatio-temporal evolution of post-seismic landslides and debris flows: 2017 Ms 7.0 Jiuzhaigou earthquake. Environ. Sci. Pollut. Res. 2022, 29, 15681–15702. [Google Scholar] [CrossRef] [PubMed]
  4. Koukouvelas, I.K.; Piper, D.J.; Katsonopoulou, D.; Kontopoulos, N.; Verroios, S.; Nikolakopoulos, K.; Zygouri, V. Earthquake-triggered landslides and mudflows: Was this the wave that engulfed Ancient Helike? Holocene 2020, 30, 1653–1668. [Google Scholar] [CrossRef]
  5. Wang, F.; Dai, Z.; Okeke, C.A.U.; Mitani, Y.; Yang, H. Experimental study to identify premonitory factors of landslide dam failures. Eng. Geol. 2018, 232, 123–134. [Google Scholar] [CrossRef]
  6. Peng, M.; Zhang, L.M. Breaching parameters of landslide dams. Landslides 2011, 9, 13–31. [Google Scholar] [CrossRef]
  7. Ma, J.; Chen, J.; Xu, C. Hydraulic reconstruction of giant paleolandslide-dammed lake outburst floods in high-mountain region, eastern Tibetan Plateau: A case study of the Upper Minjiang River valley. Trans. GIS 2024, 28, 1793–1825. [Google Scholar] [CrossRef]
  8. Helbing, D. Globally networked risks and how to respond. Nature 2013, 497, 51–59. [Google Scholar] [CrossRef]
  9. Carpignano, A.; Golia, E.; Mauro, C.D.; Bouchon, S.; Nordvik, J.P. A methodological approach for the definition of multi-risk maps at regional level: First application. J. Risk Res. 2009, 12, 513–534. [Google Scholar] [CrossRef]
  10. Kappes, M.S.; Keiler, M.; Elverfeldt, K.V.; Glade, T. Challenges of analyzing multi-hazard risk: A review. Nat. Hazards 2012, 64, 1925–1958. [Google Scholar] [CrossRef]
  11. Liu, D.; Cui, Y.; Wang, H.; Jin, W.; Wu, C.; Bazai, N.A.; Zhang, G.; Carling, P.A.; Chen, H. Assessment of local outburst flood risk from successive landslides: Case study of Baige landslide-dammed lake, upper Jinsha river, eastern Tibet. J. Hydrol. 2021, 599, 126294. [Google Scholar] [CrossRef]
  12. Zhang, Q.; Chen, Z.; Li, Y.; Yu, S.; Wang, L.; Zhou, X.; Wu, S. Quantitative assessment on landslide dam risks and mitigation: An in-depth study on the Baige lake breach. Environ. Earth Sci. 2023, 82, 96. [Google Scholar] [CrossRef]
  13. Ma, J.; Xu, C.; Chen, J. Dam-breach process simulation and risk assessment of outburst flood induced by the Tangjiashan landslide-dammed lake. J. Hydrol. Reg. Stud. 2025, 57, 102164. [Google Scholar] [CrossRef]
  14. Wang, B.; Zhang, T.; Zhou, Q.; Wu, C.; Chen, Y.-L.; Wu, P. A case study of the Tangjiashan landslide dam-break. J. Hydrodyn. 2015, 27, 223–233. [Google Scholar] [CrossRef]
  15. Segoni, S.; Pappafico, G.; Luti, T.; Catani, F. Landslide susceptibility assessment in complex geological settings: Sensitivity to geological information and insights on its parameterization. Landslides 2020, 17, 2443–2453. [Google Scholar] [CrossRef]
  16. Yang, C.; Liu, L.-L.; Huang, F.; Huang, L.; Wang, X.-M. Machine learning-based landslide susceptibility assessment with optimized ratio of landslide to non-landslide samples. Gondwana Res. 2023, 123, 198–216. [Google Scholar] [CrossRef]
  17. Youssef, A.M.; Pourghasemi, H.R. Landslide susceptibility mapping using machine learning algorithms and comparison of their performance at Abha Basin, Asir Region, Saudi Arabia. Geosci. Front. 2021, 12, 639–655. [Google Scholar] [CrossRef]
  18. Pourghasemi, H.R.; Kornejady, A.; Kerle, N.; Shabani, F. Investigating the effects of different landslide positioning techniques, landslide partitioning approaches, and presence-absence balances on landslide susceptibility mapping. CATENA 2020, 187, 104364. [Google Scholar] [CrossRef]
  19. Dikshit, A.; Pradhan, B.; Alamri, A.M. Pathways and challenges of the application of artificial intelligence to geohazards modelling. Gondwana Res. 2021, 100, 290–301. [Google Scholar] [CrossRef]
  20. Kulsoom, I.; Hua, W.; Hussain, S.; Chen, Q.; Khan, G.; Shihao, D. SBAS-InSAR based validated landslide susceptibility mapping along the Karakoram Highway: A case study of Gilgit-Baltistan, Pakistan. Sci. Rep. 2023, 13, 3344. [Google Scholar] [CrossRef]
  21. Su, X.; Zhang, Y.; Meng, X.; Rehman, M.U.; Khalid, Z.; Yue, D. Updating inventory, deformation, and development characteristics of landslides in Hunza Valley, NW Karakoram, Pakistan by SBAS-InSAR. Remote Sens. 2022, 14, 4907. [Google Scholar] [CrossRef]
  22. Zhao, F.; Meng, X.; Zhang, Y.; Chen, G.; Su, X.; Yue, D. Landslide susceptibility mapping of karakorum highway combined with the application of SBAS-InSAR technology. Sensors 2019, 19, 2685. [Google Scholar] [CrossRef] [PubMed]
  23. Lan, H.X.; Martin, C.D.; Lim, C.H. RockFall analyst: A GIS extension for three-dimensional and spatially distributed rockfall hazard modeling. Comput. Geosci. 2007, 33, 262–279. [Google Scholar] [CrossRef]
  24. Yue, X.; Wu, S.; Yin, Y.; Gao, J.; Zheng, J. Risk identification of seismic landslides by joint Newmark and RockFall analyst models: A case study of roads affected by the Jiuzhaigou earthquake. Int. J. Disaster Risk Sci. 2018, 9, 392–406. [Google Scholar] [CrossRef]
  25. Zhan, J.; Yu, Z.; Lv, Y.; Peng, J.; Song, S.; Yao, Z. Rockfall hazard assessment in the Taihang grand canyon scenic area integrating regional-scale identification of potential rockfall sources. Remote Sens. 2022, 14, 3021. [Google Scholar] [CrossRef]
  26. Lan, H.; Martin, C.D.; Zhou, C.; Lim, C.H. Rockfall hazard analysis using LiDAR and spatial modeling. Geomorphology 2010, 118, 213–223. [Google Scholar] [CrossRef]
  27. Costa, J.E.; Schuster, R.L. The formation and failure of natural dams. GSA Bull. 1988, 100, 1054–1068. [Google Scholar] [CrossRef]
  28. Bharath, A.; Shivapur, A.V.; Hiremath, C.; Maddamsetty, R. Dam break analysis using HEC-RAS and HEC-GeoRAS: A case study of Hidkal dam, Karnataka state, India. Environ. Chall. 2021, 5, 100401. [Google Scholar] [CrossRef]
  29. Walder, J.S.; O’connor, J.E. Methods for predicting peak discharge of floods caused by failure of natural and constructed earthen dams. Water Resour. Res. 1997, 33, 2337–2348. [Google Scholar] [CrossRef]
  30. Liu, J.; Zhong, Q.; Chen, L.; Shan, Y. Review on the Simulation Technologies of Breach Mechanism and Breaching Process of Landslide Dam. J. Disaster Prev. Mitig. Eng. 2022, 3, 42. [Google Scholar]
  31. Fread, D.L. DAMBRK: The NWS Dam-Break Flood Forecasting Model; National Weather Service: Silver Spring, MD, USA, 1980. [Google Scholar]
  32. Fread, D.L. BREACH: An Erosion Model for Earthen Dam Failures; National Weather Service: Silver Spring, MD, USA, 1988. [Google Scholar]
  33. Singh, V.P.; Scarlatos, P.D.; Collins, J.G.; Jourdan, M.R. Breach erosion of earthfill dams (BEED) model. Nat. Hazards 1988, 1, 161–180. [Google Scholar] [CrossRef]
  34. Brunner, G.W. HEC-RAS River Analysis System; Version 1.0; Hydraulic User’s Manual: Jackson, MS, USA, 1995. [Google Scholar]
  35. Froehlich, D. Embankment dam breach parameters revisited. In Proceedings of the International Water Resources Engineering Conference—Proceedings 1, San Antonio, Texas, USA, 14–18 August 1995. [Google Scholar]
  36. Froehlich, D.C. Embankment dam breach parameters and their uncertainties. J. Hydraul. Eng. 2008, 134, 1708–1721. [Google Scholar] [CrossRef]
  37. Thun, J.L.V.; Gillette, D.R. Guidance on Breach Parameters; Unpublished Internal Document; US Bureau of Reclamation: Denver, CO, USA, 1990.
  38. Macdonald, T.C.; Langridge-Monopolis, J. Breaching charateristics of dam failures. J. Hydraul. Eng. 1984, 110, 567–586. [Google Scholar] [CrossRef]
  39. Xu, Y.; Zhang, L.M. Breaching parameters for earth and rockfill dams. J. Geotech. Geoenviron. Eng. 2009, 135, 1957–1970. [Google Scholar] [CrossRef]
  40. Wang, X.; Nie, W.; Xie, W.; Zhang, Y. Incremental learning-random forest model-based landslide susceptibility analysis: A case of Ganzhou City, China. Earth Sci. Inform. 2024, 17, 1645–1661. [Google Scholar] [CrossRef]
  41. Pourghasemi, H.R.; Rahmati, O. Prediction of the landslide susceptibility: Which algorithm, which precision? CATENA 2018, 162, 177–192. [Google Scholar] [CrossRef]
  42. Breiman, L. Random Forests. Mach. Learn 2001, 45, 5–32. [Google Scholar] [CrossRef]
  43. Zhang, X.D.; Xie, H.Y.; Xu, Z.D.; Li, Z.W.; Chen, B. Evaluating landslide susceptibility: An AHP method-based approach enhanced with optimized random forest modeling. Nat. Hazards 2024, 120, 8153–8207. [Google Scholar] [CrossRef]
  44. Speiser, J.L.; Miller, M.E.; Tooze, J.; Ip, E. A comparison of random forest variable selection methods for classification prediction modeling. Expert Syst. Appl. 2019, 134, 93–101. [Google Scholar] [CrossRef]
  45. Hussain, M.A.; Chen, Z.L.; Kalsoom, I.; Asghar, A.; Shoaib, M. Landslide Susceptibility Mapping Using Machine Learning Algorithm: A Case Study Along Karakoram Highway (KKH), Pakistan. J. Indian Soc. Remote Sens. 2022, 50, 849–866. [Google Scholar] [CrossRef]
  46. Berardino, P.; Fornaro, G.; Lanari, R.; Sansosti, E. A new algorithm for surface deformation monitoring based on small baseline differential SAR interferograms. IEEE Trans. Geosci. Remote Sens. 2002, 40, 2375–2383. [Google Scholar] [CrossRef]
  47. Huang, R.; Liu, W. Study on the movement characteristics of rolling rock block on platform. Adv. Earth Sci. 2008, 5, 517. [Google Scholar]
  48. Kiwanuka, M.; Chelangat, C.; Mubialiwo, A.; Lay, F.J.; Mugisha, A.; Mbujje, W.J.; Mutanda, H.E. Dam breach analysis of Kibimba Dam in Uganda using HEC-RAS and HEC-GeoRAS. Environ. Syst. Res. 2023, 12, 31. [Google Scholar] [CrossRef]
  49. Zhong, M.; Xiao, L.; Li, X.D.; Mei, Y.W.; Jiang, T.; Song, L.X.; Chen, X.H. A study on compound flood prediction and inundation simulation under future scenarios in a coastal city. J. Hydrol. 2024, 628, 130475. [Google Scholar] [CrossRef]
  50. Wu, H.; Nian, T.-K.; Chen, G.-Q.; Zhao, W.; Li, D.-Y. Laboratory-scale investigation of the 3-D geometry of landslide dams in a U-shaped valley. Eng. Geol. 2020, 265, 105428. [Google Scholar] [CrossRef]
  51. Shen, D.Y.; Shi, Z.M.; Peng, M.; Zheng, H.C.; Yang, J.T.; Zhang, L.M. Efficient risk assessment of landslide dam breach floods in the Yarlung Tsangpo river basin. Landslides 2024, 21, 2673–2694. [Google Scholar] [CrossRef]
  52. Nibigira, L.; Havenith, H.-B.; Archambeau, P.; Dewals, B. Formation, breaching and flood consequences of a landslide dam near Bujumbura, Burundi. Nat. Hazards Earth Syst. Sci. 2018, 18, 1867–1890. [Google Scholar] [CrossRef]
  53. Larsen, I.J.; Montgomery, D.R.; Korup, O. Landslide erosion controlled by hillslope material. Nat. Geosci. 2010, 3, 247–251. [Google Scholar] [CrossRef]
  54. Chen, S.-C.; Chen, C.-Y.; Huang, W.-Y. Exploring landslide erosion volume–area scaling relationships by slip depth using changes in DTMs for basin sediment volume estimation. J. Mt. Sci. 2019, 16, 581–594. [Google Scholar] [CrossRef]
  55. Mao, J.; Liu, X.; Zhang, C.; Jia, G.; Zhao, L. Runout prediction and deposit characteristics investigation by the distance potential-based discrete element method: The 2018 Baige landslides, Jinsha River, China. Landslides 2021, 18, 235–249. [Google Scholar] [CrossRef]
Figure 1. Study area: (a) Guangdong Province, China; (b) Heyuan City, Guangdong Province.
Remotesensing 17 01842 g001
Figure 2. Landslide inventory (including landslide samples and non-landslide samples).
Remotesensing 17 01842 g002
Figure 3. Landslide causal factors: (a) Maxmium precipitation; (b) NDVI; (c) Land use; (d) Road density; (e) Soil type; (f) Drainage density; (g) Elevation; (h) Slope; (i) Lithology; (j) Profile curvature; (k) Plane curvature.
Remotesensing 17 01842 g003
Figure 4. Methodology framework of this study.
Remotesensing 17 01842 g004
Figure 5. Dam setting and 2D flow area for HEC-RAS 6.4.1 model.
Remotesensing 17 01842 g005
Figure 6. The design flood discharge hydrograph.
Remotesensing 17 01842 g006
Figure 7. The map of surface deformation rate: (a) the surface deformation rate of Heyuan; (b1,c1) surface deformation rate of the local area; (b2,c2) remote sensing images of the local high deformation area.
Remotesensing 17 01842 g007
Figure 8. Visual interpretation result map: (a) Identification and spatial distribution of potential landslide hazards in Heyuan City; (be) the local amplification maps of certain landslides.
Remotesensing 17 01842 g008
Figure 9. Landslide susceptibility analysis map: (a) distribution map of surface deformation rates from 2019 to 2020; (b) the initial landslide susceptibility map; (c) the modified landslide susceptibility map.
Remotesensing 17 01842 g009
Figure 10. The receiver characteristic operation curve (ROC): (a) the initial landslide susceptibility ROC; (b) the modified landslide susceptibility ROC.
Remotesensing 17 01842 g010
Figure 11. The motion trajectories of unstable slopes.
Remotesensing 17 01842 g011
Figure 12. The spatial distribution of hazardous river reaches.
Remotesensing 17 01842 g012
Figure 13. The evolution process of outburst flood.
Remotesensing 17 01842 g013
Figure 14. Change process of inundation depth at each sensitive point.
Remotesensing 17 01842 g014
Figure 15. Distribution of arrival time of outburst flood.
Remotesensing 17 01842 g015
Figure 16. Comparison of maximum inundation depths: (a) mountain flash floods; (b) outburst floods.
Remotesensing 17 01842 g016
Figure 17. Comparison of maximum velocity: (a) mountain flash floods; (b) outburst floods.
Remotesensing 17 01842 g017
Table 1. Landslide causal factors.
Evaluation FactorDataTime Resolution/Spatial Resolution (m)Data Sources
Meteorological conditionPrecipitationdailyNational Tibetan Plateau Data Center (https://data.tpdc.ac.cn/zh-hans/data/e5c335d9-cbb9-48a6-ba35-d67dd614bb8c, accessed on 1 November 2024)
Land coverNDVI250 × 250National Tibetan Plateau Data Center (https://data.tpdc.ac.cn/zh-hans/data/10535b0b-8502-4465-bc53-78bcf24387b3, accessed on 1 November 2024)
Land use30 × 30Landsat-derived annual land cover product of China (http://doi.org/10.5281/zenodo.4417809, accessed on 3 November 2024)
Road density250 × 250OpenStreetMap Data (https://osm.org/go/41dQzc1-, accessed on 3 November 2024)
Soil type1000 × 1000Harmonized World Soil Database version 2.0 (https://doi.org/10.4060/cc3823en, accessed on 4 November 2024)
Hydrologic conditionDrainage density1000 × 1000Science Data Bank platform
Topographic conditionElevation30 × 30ALOS PALSAR DEM from ASF Data Search Platform (https://search.asf.alaska.edu/#/, accessed on 3 November 2024)
Slope30 × 30Elevation extraction
Profile curvature30 × 30Elevation extraction
Plane curvature30 × 30Elevation extraction
Geological conditionsLithology250 × 250the database GLiM
Table 2. Properties of the sliding surface materials.
Surface Material TypeNormal Restitution
Coefficient (Rn)
Tangential Restitution
Coefficient (Rn)
Friction
Angle (°)
Soil slope with dense vegetation0.20.630
Soil slope with loose vegetation0.30.630
Soil slope with grass0.30.830
Water (rock must stop)0089
Weathered rock slope0.350.830
Urban construction land0.40.8530
Table 3. Parameters setting table.
Land UsenCN
Water0.035100
Forest0.16077
Grassland0.05580
Wetland0.03580
Cropland0.04089
Artificial surface0.09092
Barren0.02098
Table 4. Design values of precipitation and river discharge in different return periods.
Return Periods (a)Design Value
Precipitation (mm)Discharge (m3·s−1)
1005941620
505301435
204471191
103831009
5316818
Table 5. Landslide susceptibility evaluation statistics table.
Landslide Initial Susceptibility EvaluationLandslide Modified Susceptibility Evaluation
levelarea/km2ratio/%levelarea/km2ratio/%
Very low4662.47 29.77%Very low1953.86 12.48%
Low3134.49 20.02%Low5794.72 37.00%
Moderate3933.35 25.12%Moderate2803.89 17.91%
High2587.21 16.52%High2753.71 17.58%
Very high1342.02 8.57%Very high2353.37 15.03%
Table 6. Parameters required for calculating the geometric parameters of the landslide dam.
ParametersV/m3b/mΦlΦrΦ/°α/°θ/°
Value372,9001088640603.4
Table 7. The calculated values of the geometric parameters of the landslide dam.
ParametersH/mLt/mLb/mW/mβdβu
Value95.26 90.70 114.40 120.00 20.98 27.78
Disclaimer/Publisher’s Note: The statements, opinions and data contained in all publications are solely those of the individual author(s) and contributor(s) and not of MDPI and/or the editor(s). MDPI and/or the editor(s) disclaim responsibility for any injury to people or property resulting from any ideas, methods, instructions or products referred to in the content.

