
Spectral Angle Mapper Application Using Sentinel-2 in Coastal Placer Deposits in Vigo Estuary, Northwest Spain

 , ,
, ,  ,
,  , ,
, ,  ,
,  ,
, 
Abstract

1. Introduction
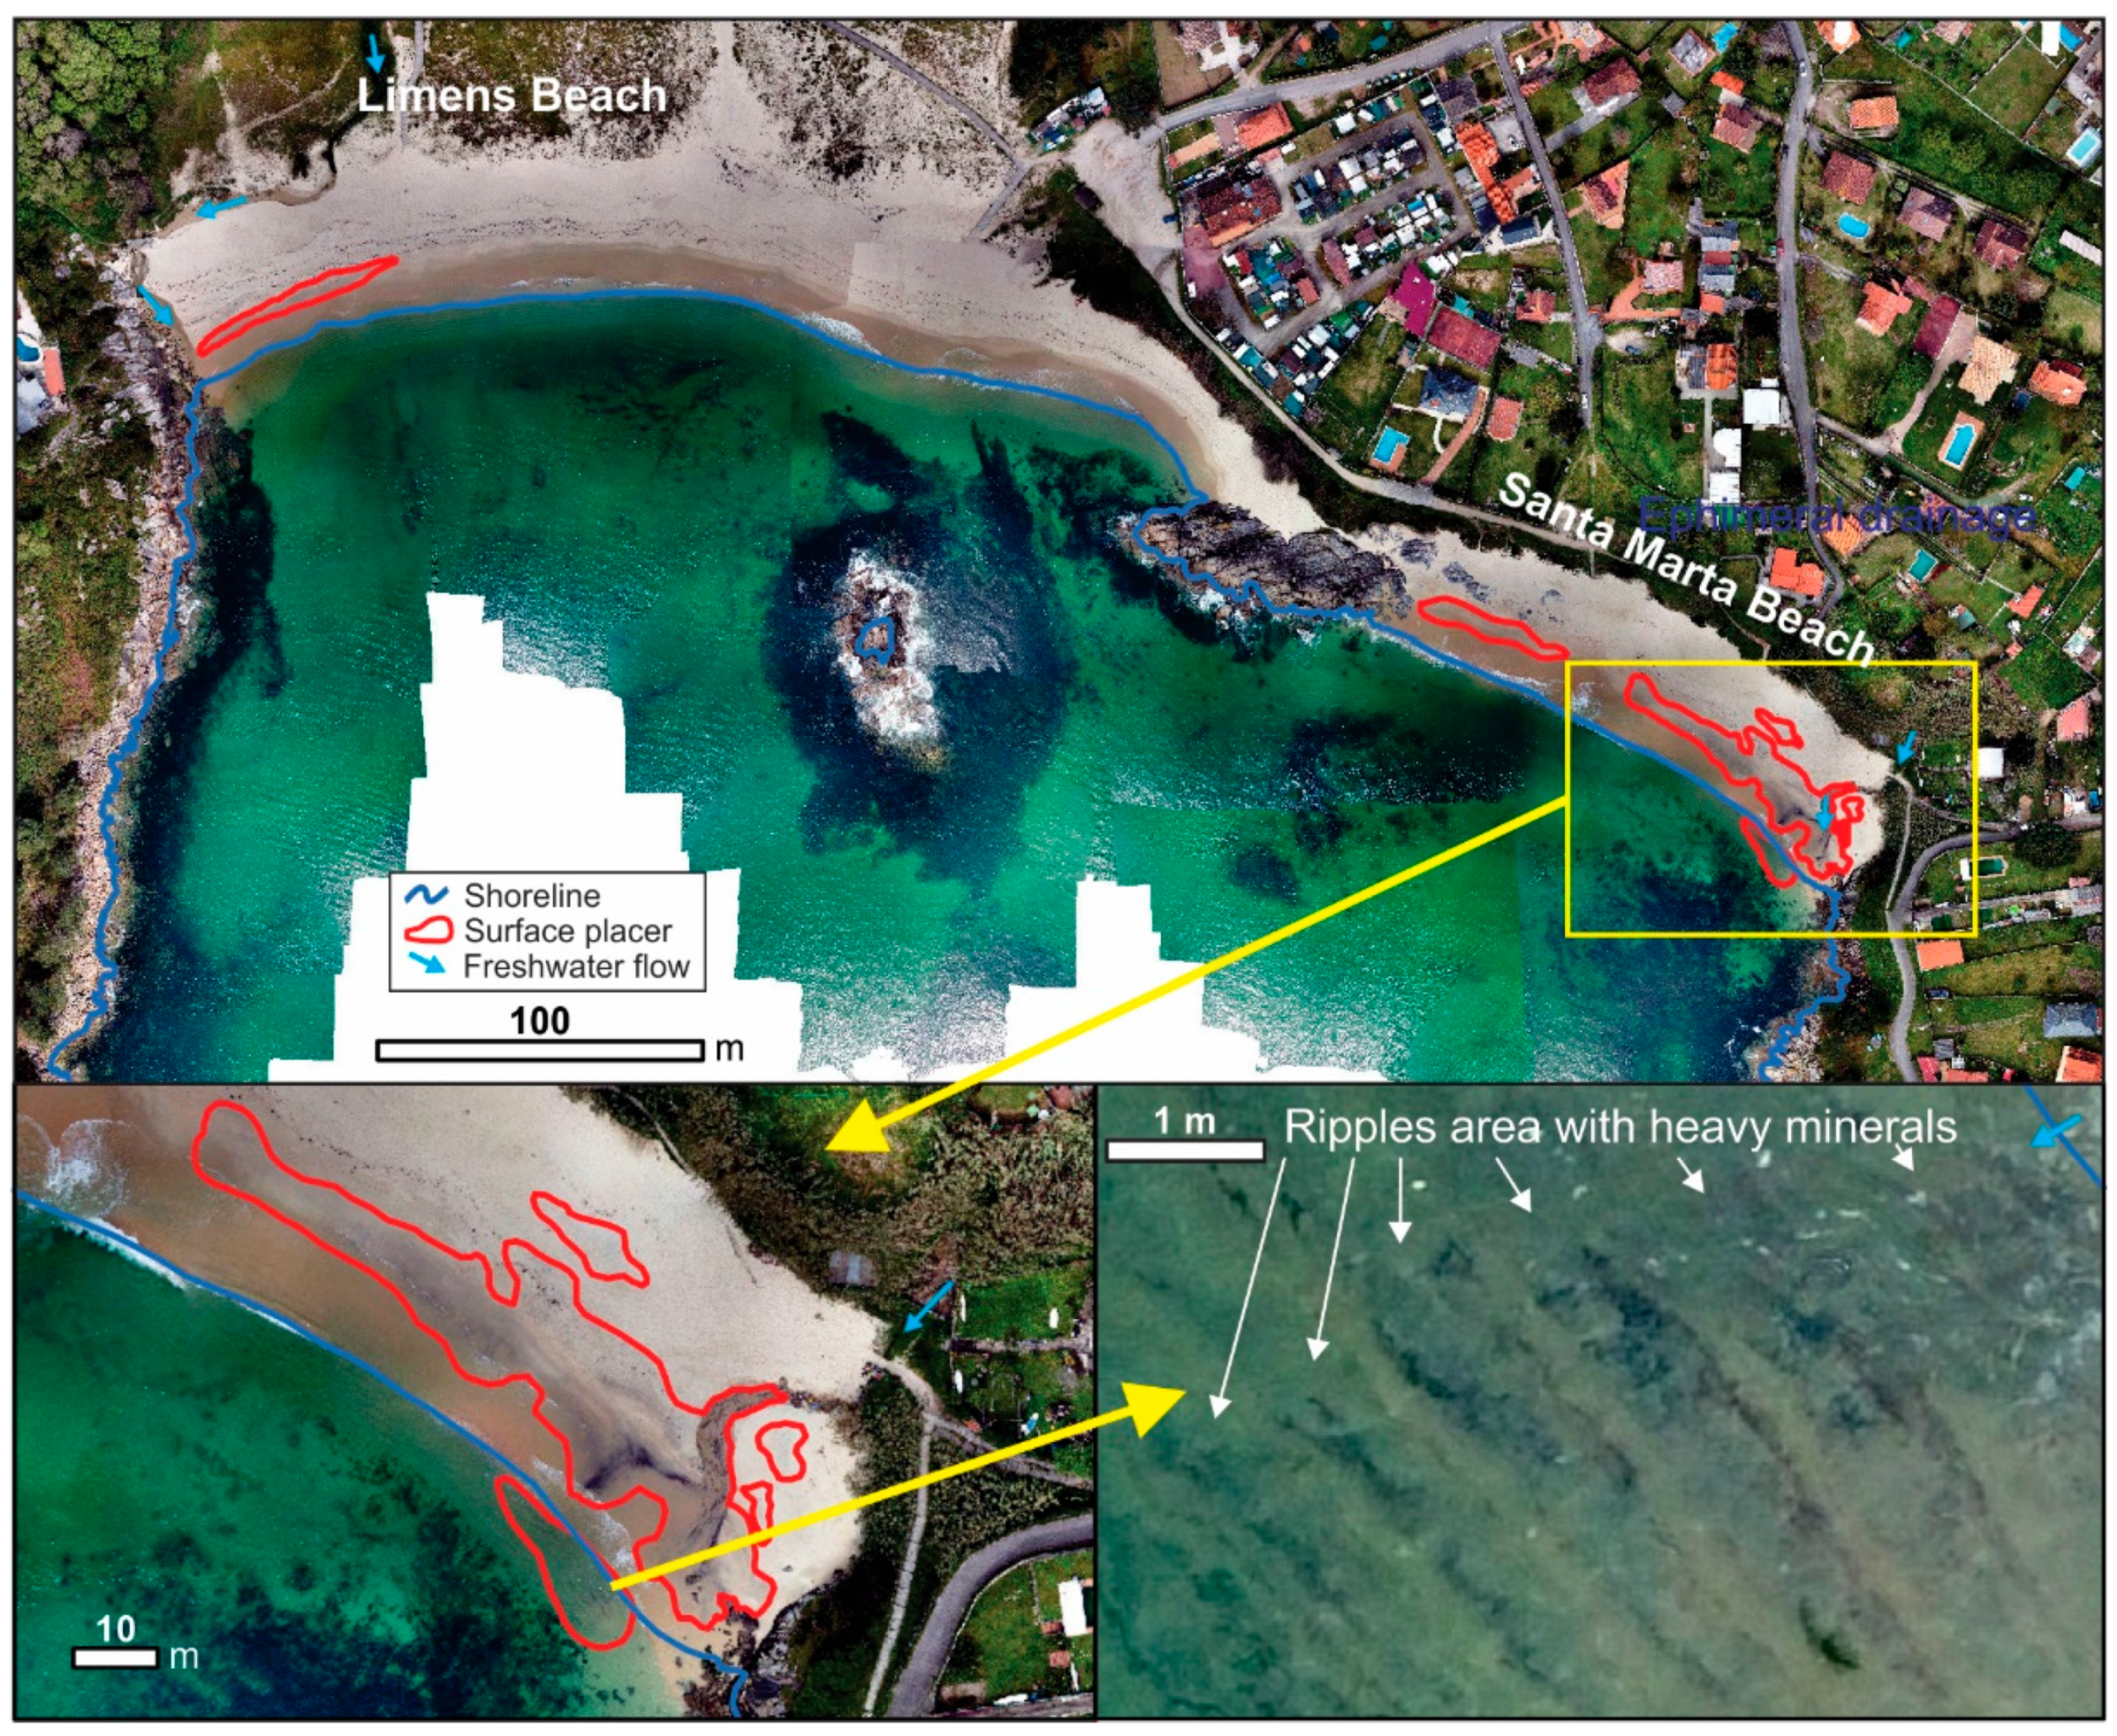
2. Study Area
3. Materials and Methods
3.1. Workflow
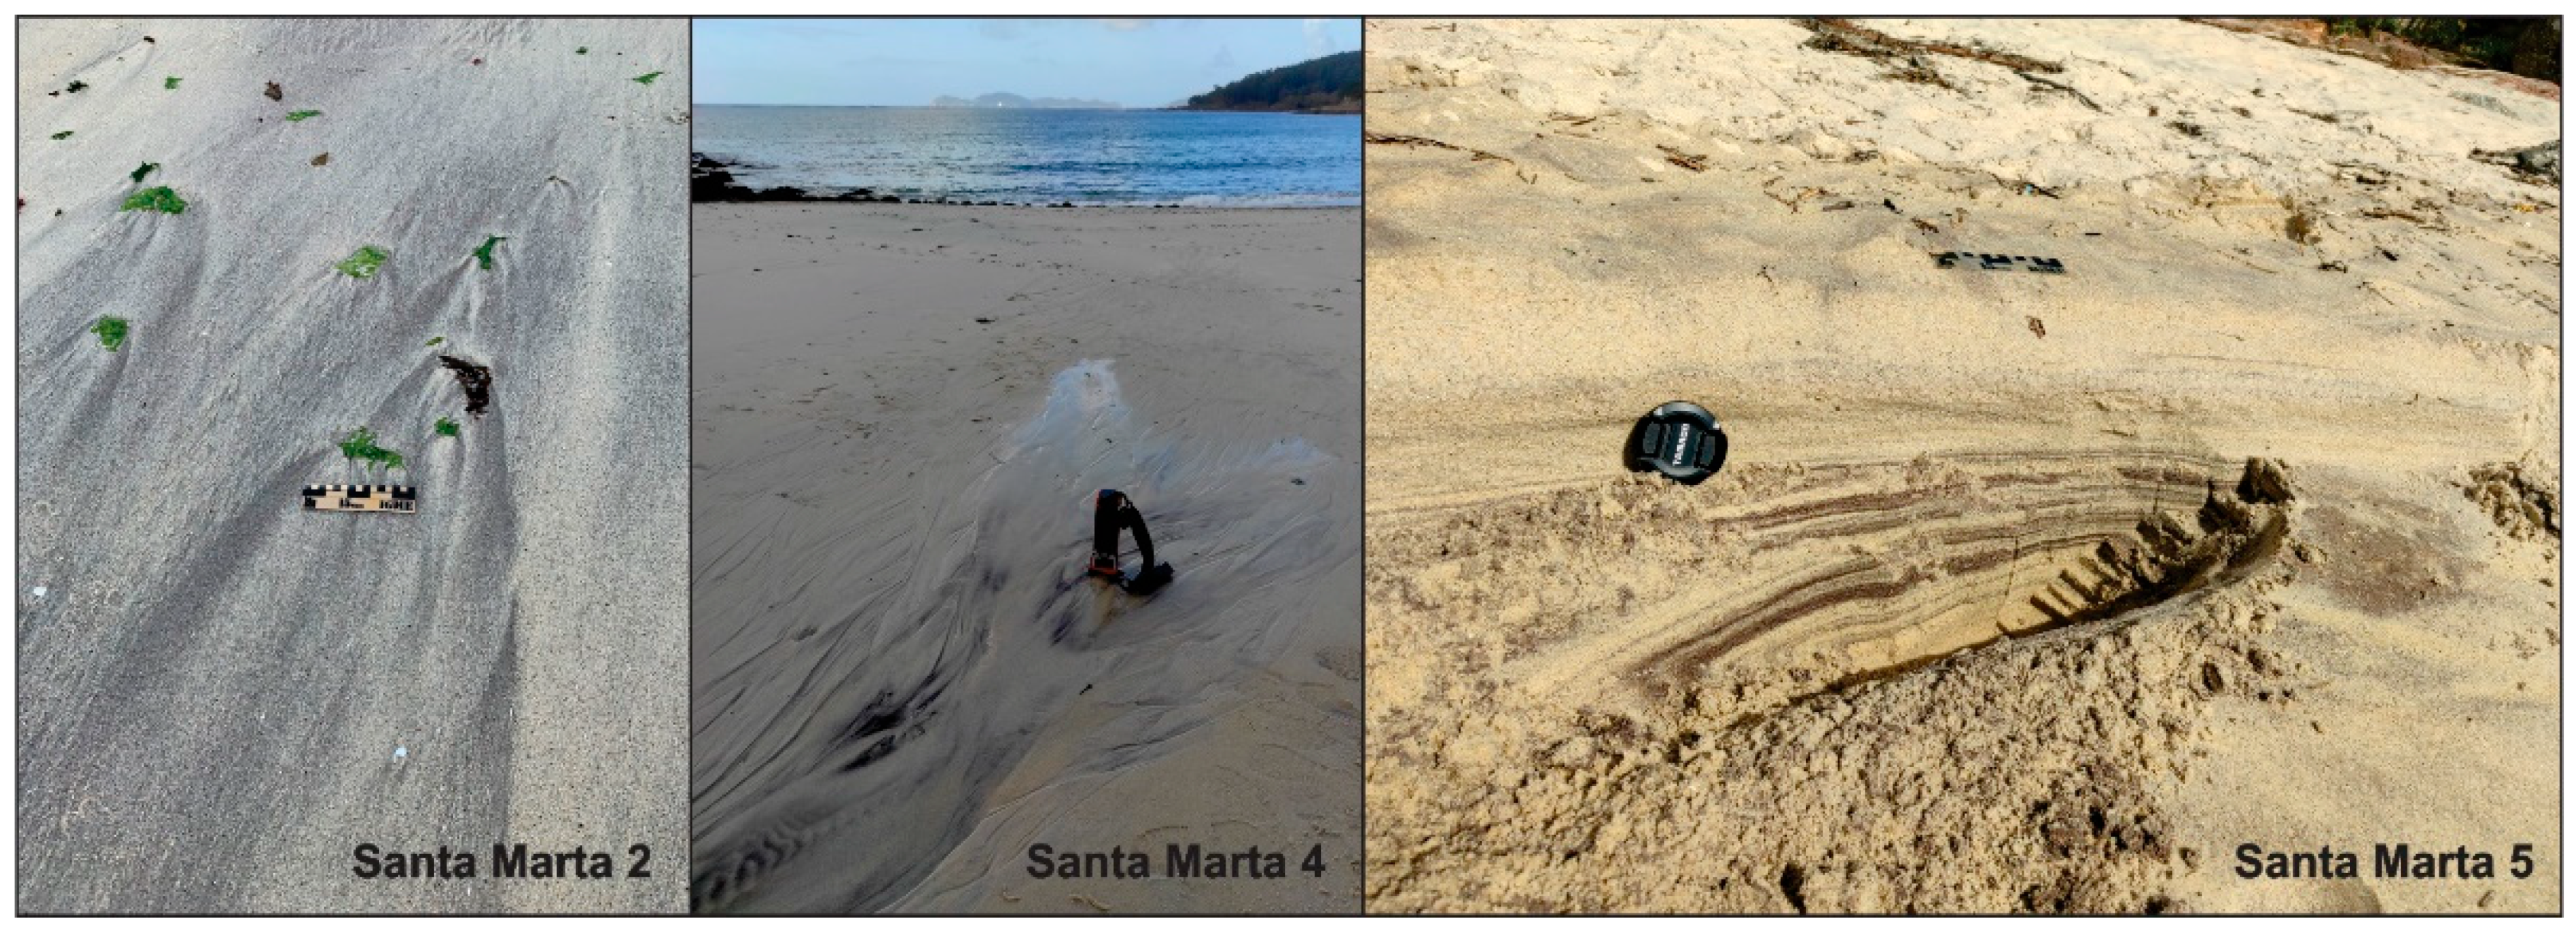
3.2. Beach Samples, Heavy Minerals and Spectral Signature Measurement
3.3. Sentinel-2 Data, NDWI, and SAM
3.4. Validation Using In Situ Data
4. Results
4.1. Heavy Mineral Content
4.2. Spectral Signature of Sand Samples
4.3. Water Body Measurements Using NDWI and SAM in SNAP
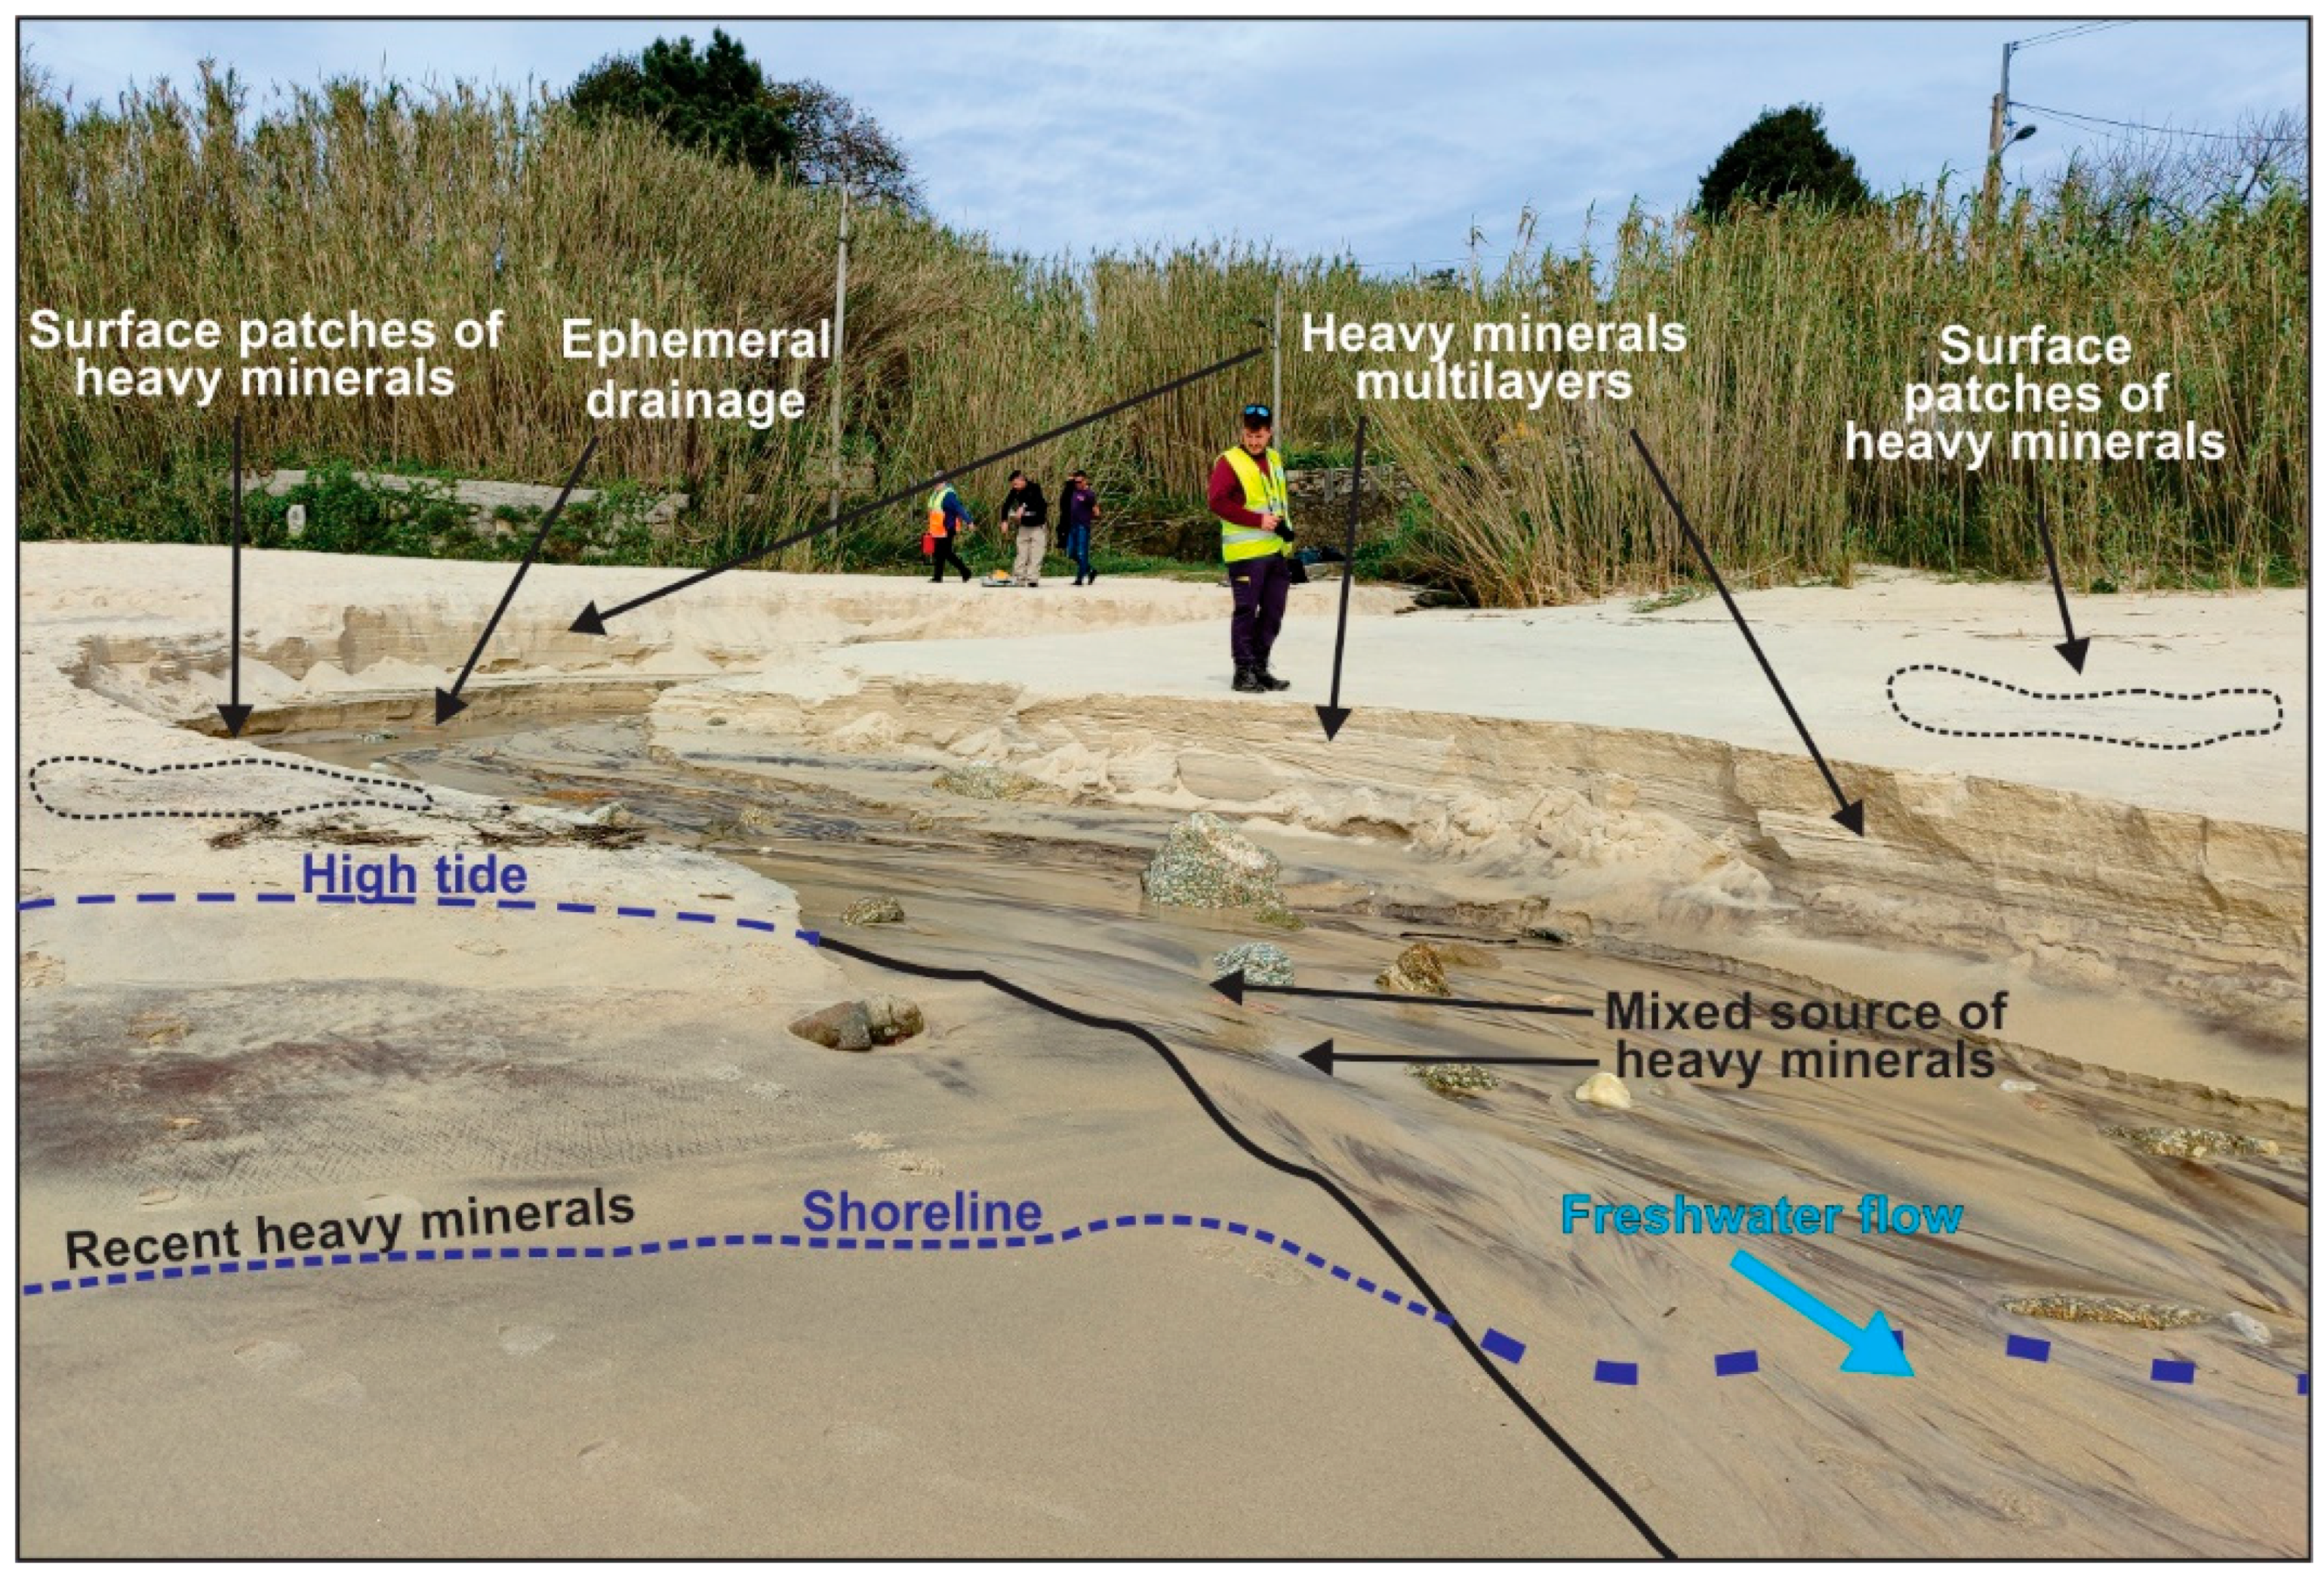
4.4. Validation Using UAV Survey
5. Discussion
5.1. Integrating In Situ Surface Placer Data with EO Data
5.2. Remote Sensing Applications to Explore Placer Deposits
6. Conclusions
Author Contributions
Funding
Data Availability Statement
Acknowledgments
Conflicts of Interest
References
- Rona, P.A. The Changing Vision of Marine Minerals. Ore Geol. Rev. 2008, 33, 618–666. [Google Scholar] [CrossRef]
- Van Gosen, B.S.; Fey, D.L.; Shah, A.K.; Verplanck, P.L.; Hoefen, T.M. Deposit Model for Heavy-Mineral Sands in Coastal Environments; Scientific Investigations Report; U.S. Geological Survey: Reston, VA, USA, 2014; p. 51.
- Hou, B.; Keeling, J.; Van Gosen, B.S. Geological and Exploration Models of Beach Placer Deposits, Integrated from Case-Studies of Southern Australia. Ore Geol. Rev. 2017, 80, 437–459. [Google Scholar] [CrossRef]
- European Commission. Directorate General for Internal Market, Industry, Entrepreneurship and SMEs. In Study on the Critical Raw Materials for the EU 2023: Final Report; Publications Office of the European Union: Luxembourg, 2023. [Google Scholar]
- Kokaly, R.F.; Clark, R.N.; Swayze, G.A.; Livo, K.E.; Hoefen, T.M.; Pearson, N.C.; Wise, R.A.; Benzel, W.; Lowers, H.A.; Driscoll, R.L.; et al. USGS Spectral Library Version 7; Data Series; U.S. Geological Survey: Reston, VA, USA, 2017; p. 68.
- Prates Hallal, G.; De Almeida Espinoza, J.M.; Veettil, B.K.; Porcher, C.C.; Oliveira Righi Da Silva, M.; Beatriz Alves Rolim, S. Mapping Heavy Mineral Deposits on the Coast of the State of Rio Grande Do Sul (Brazil) Using Orbital and Proximal Remote Sensing. PLoS ONE 2024, 19, e0309043. [Google Scholar] [CrossRef] [PubMed]
- Rejith, R.G.; Sundararajan, M.; Gnanappazham, L.; Loveson, V.J. Satellite-Based Spectral Mapping (ASTER and Landsat Data) of Mineralogical Signatures of Beach Sediments: A Precursor Insight. Geocarto Int. 2020, 37, 2580–2603. [Google Scholar] [CrossRef]
- Rejith, R.G.; Sundararajan, M.; Gnanappazham, L.; Kaliraj, S.; Chandrasekar, N. Exploring Beach Placer Minerals in the East Coast of Tamil Nadu, India, Using EO-1 Hyperion Data. J. Appl. Remote Sens. 2022, 16, 012017. [Google Scholar] [CrossRef]
- Rao, K.J.; Subramanyam, A.V.; Abhinav Kumar, A.K.; Sunil, T.C.; Chaturvedi, A.K. Discovery of Heavy Mineral-Rich Sand Dunes along the Orissa-Bengal Coast of India Using Remote Sensing Techniques. Curr. Sci. 2008, 94, 983–985. [Google Scholar]
- Putra, I.D.; Abbas, R.; Masti, S.D.; Warmada, I.W. Remote Sensing Application in Exploration of Iron Mineral Placer Deposit: Case Study of Kulonprogo’s Iron Placer Deposit. In Proceedings of the EAGE-HAGI 1st Asia Pacific Meeting on Near Surface Geoscience and Engineering, Yogyakarta, Indonesia, 9–13 April 2018; European Association of Geoscientists & Engineers: Utrecht, The Netherlands, 2018; Volume 2018, pp. 1–5. [Google Scholar]
- Rejith, R.G.; Sundararajan, M.; Venkatesan, S.; Mohammed-Aslam, M.A. Remote Sensing for Exploring Heavy Mineral Deposits. In Remote Sensing of Ocean and Coastal Environments; Elsevier: Amsterdam, The Netherlands, 2021; pp. 177–188. ISBN 978-0-12-819604-5. [Google Scholar]
- Sinaice, B.B.; Owada, N.; Ikeda, H.; Toriya, H.; Bagai, Z.; Shemang, E.; Adachi, T.; Kawamura, Y. Spectral Angle Mapping and AI Methods Applied in Automatic Identification of Placer Deposit Magnetite Using Multispectral Camera Mounted on UAV. Minerals 2022, 12, 268. [Google Scholar] [CrossRef]
- IGME. Investigación Minera Preliminar de la Plataforma Continental Submarina del área sur de Pontevedra; Programa Sectorial de Estudio de Fondos Marinos (FOMAR); Ministerio de Industria, Programa Nacional Investigación Minera, IGME: Madrid, Spain, 1976; p. 242. [Google Scholar]
- IGME. Investigación Minera de Detalle en los Fondos Submarinos de la zona de las rías de Pontevedra y Vigo (GALI-RIAS); Programa Sectorial de Estudio de Fondos Marinos (FOMAR); Ministerio de Industria, Programa Nacional Investigación Minera, IGME: Madrid, Spain, 1979; p. 83. [Google Scholar]
- Manso, F. Exploración de Placeres Costeros de Minerales Pesados y su Génesis en la Costa de Galicia. Ph.D. Thesis, Universidad de Vigo, Vigo, Spain, 2001. [Google Scholar]
- González, F.J.; Medialdea, T.; Schiellerup, H.; Zananiri, I.; Ferreira, P.; Somoza, L.; Monteys, X.; Alcorn, T.; Marino, E.; Lobato, A.B.; et al. MINDeSEA: Exploring Seabed Mineral Deposits in European Seas, Metallogeny and Geological Potential for Strategic and Critical Raw Materials. Geol. Soc. Lond. Spec. Publ. 2023, 526, 289–317. [Google Scholar] [CrossRef]
- González, M.I.; Vicente, J. Mapa Geológico de España con la Inclusión de Portugal Continental y Pirineos Franceses a Escala 1:2.000.000; IGME: Madrid, Spain, 2004. [Google Scholar]
- Vilas, F.; Bernabéu, A.; Rubio, B.; Rey, D. The Galician Rías. NW Coast of Spain. In The Spanish Coastal Systems: Dynamic Processes, Sediments and Management; Morales, J.A., Ed.; Springer International Publishing: Cham, Switzerland, 2019; pp. 387–414. ISBN 978-3-319-93169-2. [Google Scholar]
- Ng-Cutipa, W.L.; González, F.J.; Lobato, A.; Zananiri, I.; Teodoro, A.C. Titanium, Zirconium and Rare Earth Element Placer Deposits in Coastal Environments of Rías Baixas (Galicia, NW Spain). In Proceedings of the Underwater Minerals Conference, Rotterdam, The Netherlands, 1–6 October 2023; p. 4. [Google Scholar] [CrossRef]
- Ng-Cutipa, W.L.; Lobato, A.; González, F.J.; Zananiri, I.; Georgalas, G.; Teodoro, A.C.; Støren, J.; Myrnes, I.; S34i Shallow Water Team. Marine Placer Occurrences and Associated Critical Raw Materials in Rias Baixas (NW Spain). In Proceedings of the 37th International Geological Congress 2024, Busan, Republic of Korea, 25–31 August 2024. [Google Scholar]
- Ng-Cutipa, W.L.; Lobato, A.; González, F.J.; Georgalas, G.; Zananiri, I.; Cardoso-Fernandez, J.; Carvalho, M.; Azzalini, A.; Araújo, B.L.; Teodoro, A.C. Earth Observation Approach to Understand Coastal Morphology, Shoreline Dynamics, and Their Relationship with Mineral Placer Deposits: The Case of Santa Marta Beach (Ría de Vigo, NW Spain). In Proceedings of the Abstracts Volume IX International Symposium on Marine Sciences (ISMS24), Valencia, Spain, 10–12 July 2024. [Google Scholar]
- Carvalho, M.; Cardoso-Fernandes, J.; González, F.J.; Teodoro, A.C. Comparative Performance of Sentinel-2 and Landsat-9 Data for Raw Materials’ Exploration Onshore and in Coastal Areas. Remote Sens. 2025, 17, 305. [Google Scholar] [CrossRef]
- Cardoso-Fernandes, J.; Silva, J.; Dias, F.; Lima, A.; Teodoro, A.C.; Barrès, O.; Cauzid, J.; Perrotta, M.; Roda-Robles, E.; Ribeiro, M.A. Tools for Remote Exploration: A Lithium (Li) Dedicated Spectral Library of the Fregeneda–Almendra Aplite–Pegmatite Field. Data 2021, 6, 33. [Google Scholar] [CrossRef]
- Carvalho, M.; Cardoso-Fernandes, J.; Lima, A.; Teodoro, A.C. Convolutional Neural Networks Applied to Antimony Quantification via Soil Laboratory Reflectance Spectroscopy in Northern Portugal: Opportunities and Challenges. Remote Sens. 2024, 16, 1964. [Google Scholar] [CrossRef]
- McFeeters, S.K. The Use of the Normalized Difference Water Index (NDWI) in the Delineation of Open Water Features. Int. J. Remote Sens. 1996, 17, 1425–1432. [Google Scholar] [CrossRef]
- Kruse, F.A.; Lefkoff, A.B.; Boardman, J.W.; Heidebrecht, K.B.; Shapiro, A.T.; Barloon, P.J.; Goetz, A.F.H. The Spectral Image Processing System (SIPS)—Interactive Visualization and Analysis of Imaging Spectrometer Data. Remote Sens. Environ. 1993, 44, 145–163. [Google Scholar] [CrossRef]
- Clark, R.N. Spectroscopy of Rocks and Minerals and Principles of Spectroscopy. In Manual of Remote Sensing, Volume 3, Remote Sensing for the Earth Sciences; Rencz, A.N., Ed.; Wiley: Hoboken, NJ, USA, 1999; pp. 3–58. [Google Scholar]
- Hunt, G.R. Visible and Near-Infrared Spectra of Minerals and Rocks: III. Oxides and Hydro-Oxides. Mod. Geol. 1971, 2, 195–205. [Google Scholar]
- Hunt, G.R.; Salisbury, J.W.; Lenhoff, C.J. Visible and near Infrared Spectra of Minerals and Rocks. VI. Additional Silicates. Mod. Geol. 1973, 4, 85–106. [Google Scholar]
- Divya, Y.; Sanjeevi, S.; Ilamparuthi, K. A Study on the Hyperspectral Signatures of Sandy Soils with Varying Texture and Water Content. Arab. J. Geosci. 2014, 7, 3537–3545. [Google Scholar] [CrossRef]


| Band | Resolution (m) | Wavelength Range (nm) | Central Wavelength for S2A (nm) |
|---|---|---|---|
| 1 | 60 | 433–453 | 442.7 |
| 2 | 10 | 458–523 | 492.7 |
| 3 | 10 | 543–578 | 559.8 |
| 4 | 10 | 650–680 | 664.6 |
| 5 | 20 | 698–713 | 704.1 |
| 6 | 20 | 733–748 | 740.5 |
| 7 | 20 | 773–793 | 782.8 |
| 8 | 10 | 785–900 | 832.8 |
| 8A | 20 | 855–875 | 864.7 |
| 9 | 60 | 935–955 | 945.1 |
| 10 | 60 | 1360–1390 | 1373.5 |
| 11 | 20 | 1565–1655 | 1613.7 |
| 12 | 20 | 2100–2280 | 2202.4 |
| Nº | Sample | Light Minerals (g) | Heavy Minerals (g) | Light Minerals (%) | Heavy Minerals (%) |
|---|---|---|---|---|---|
| 1 | Limens 1 | 51.97 | 0.86 | 98.37 | 1.63 |
| 2 | Santa Marta 1 | 43.98 | 1.65 | 96.38 | 3.62 |
| 3 | Santa Marta 2 | 45.38 | 5.56 | 89.01 | 10.91 |
| 4 | Santa Marta 4 | 45.92 | 6.69 | 87.28 | 12.72 |
| 5 | Santa Marta 5 | 8.13 | 19.42 | 70.49 | 29.51 |
| 6 | Alemans 1 | 49.64 | 0.69 | 98.63 | 1.37 |
| 7 | Ratas 1 | 47.48 | 2.74 | 94.54 | 5.46 |
| 8 | Canabal 1 | 48.55 | 1.47 | 97.06 | 2.94 |
| 9 | Canabal 2 | 39.7 | 1.43 | 96.52 | 3.48 |
| 10 | Canabal 3 | 50.56 | 1.58 | 96.97 | 3.03 |
Disclaimer/Publisher’s Note: The statements, opinions and data contained in all publications are solely those of the individual author(s) and contributor(s) and not of MDPI and/or the editor(s). MDPI and/or the editor(s) disclaim responsibility for any injury to people or property resulting from any ideas, methods, instructions or products referred to in the content. |
© 2025 by the authors. Licensee MDPI, Basel, Switzerland. This article is an open access article distributed under the terms and conditions of the Creative Commons Attribution (CC BY) license (https://creativecommons.org/licenses/by/4.0/).
Share and Cite
Ng-Cutipa, W.L.; Lobato, A.; González, F.J.; Georgalas, G.P.; Zananiri, I.; Carvalho, M.; Cardoso-Fernandes, J.; Somoza, L.; Piña, R.; Lunar, R.; et al. Spectral Angle Mapper Application Using Sentinel-2 in Coastal Placer Deposits in Vigo Estuary, Northwest Spain. Remote Sens. 2025, 17, 1824. https://doi.org/10.3390/rs17111824
Ng-Cutipa WL, Lobato A, González FJ, Georgalas GP, Zananiri I, Carvalho M, Cardoso-Fernandes J, Somoza L, Piña R, Lunar R, et al. Spectral Angle Mapper Application Using Sentinel-2 in Coastal Placer Deposits in Vigo Estuary, Northwest Spain. Remote Sensing. 2025; 17(11):1824. https://doi.org/10.3390/rs17111824
Chicago/Turabian StyleNg-Cutipa, Wai L., Ana Lobato, Francisco Javier González, Georgios P. Georgalas, Irene Zananiri, Morgana Carvalho, Joana Cardoso-Fernandes, Luis Somoza, Rubén Piña, Rosario Lunar, and et al. 2025. "Spectral Angle Mapper Application Using Sentinel-2 in Coastal Placer Deposits in Vigo Estuary, Northwest Spain" Remote Sensing 17, no. 11: 1824. https://doi.org/10.3390/rs17111824
APA StyleNg-Cutipa, W. L., Lobato, A., González, F. J., Georgalas, G. P., Zananiri, I., Carvalho, M., Cardoso-Fernandes, J., Somoza, L., Piña, R., Lunar, R., & Teodoro, A. C. (2025). Spectral Angle Mapper Application Using Sentinel-2 in Coastal Placer Deposits in Vigo Estuary, Northwest Spain. Remote Sensing, 17(11), 1824. https://doi.org/10.3390/rs17111824