
Revealing Long-Term Displacement and Evolution of Open-Pit Coal Mines Using SBAS-InSAR and DS-InSAR
 , , and
Abstract
1. Introduction
2. Study Area and Datasets
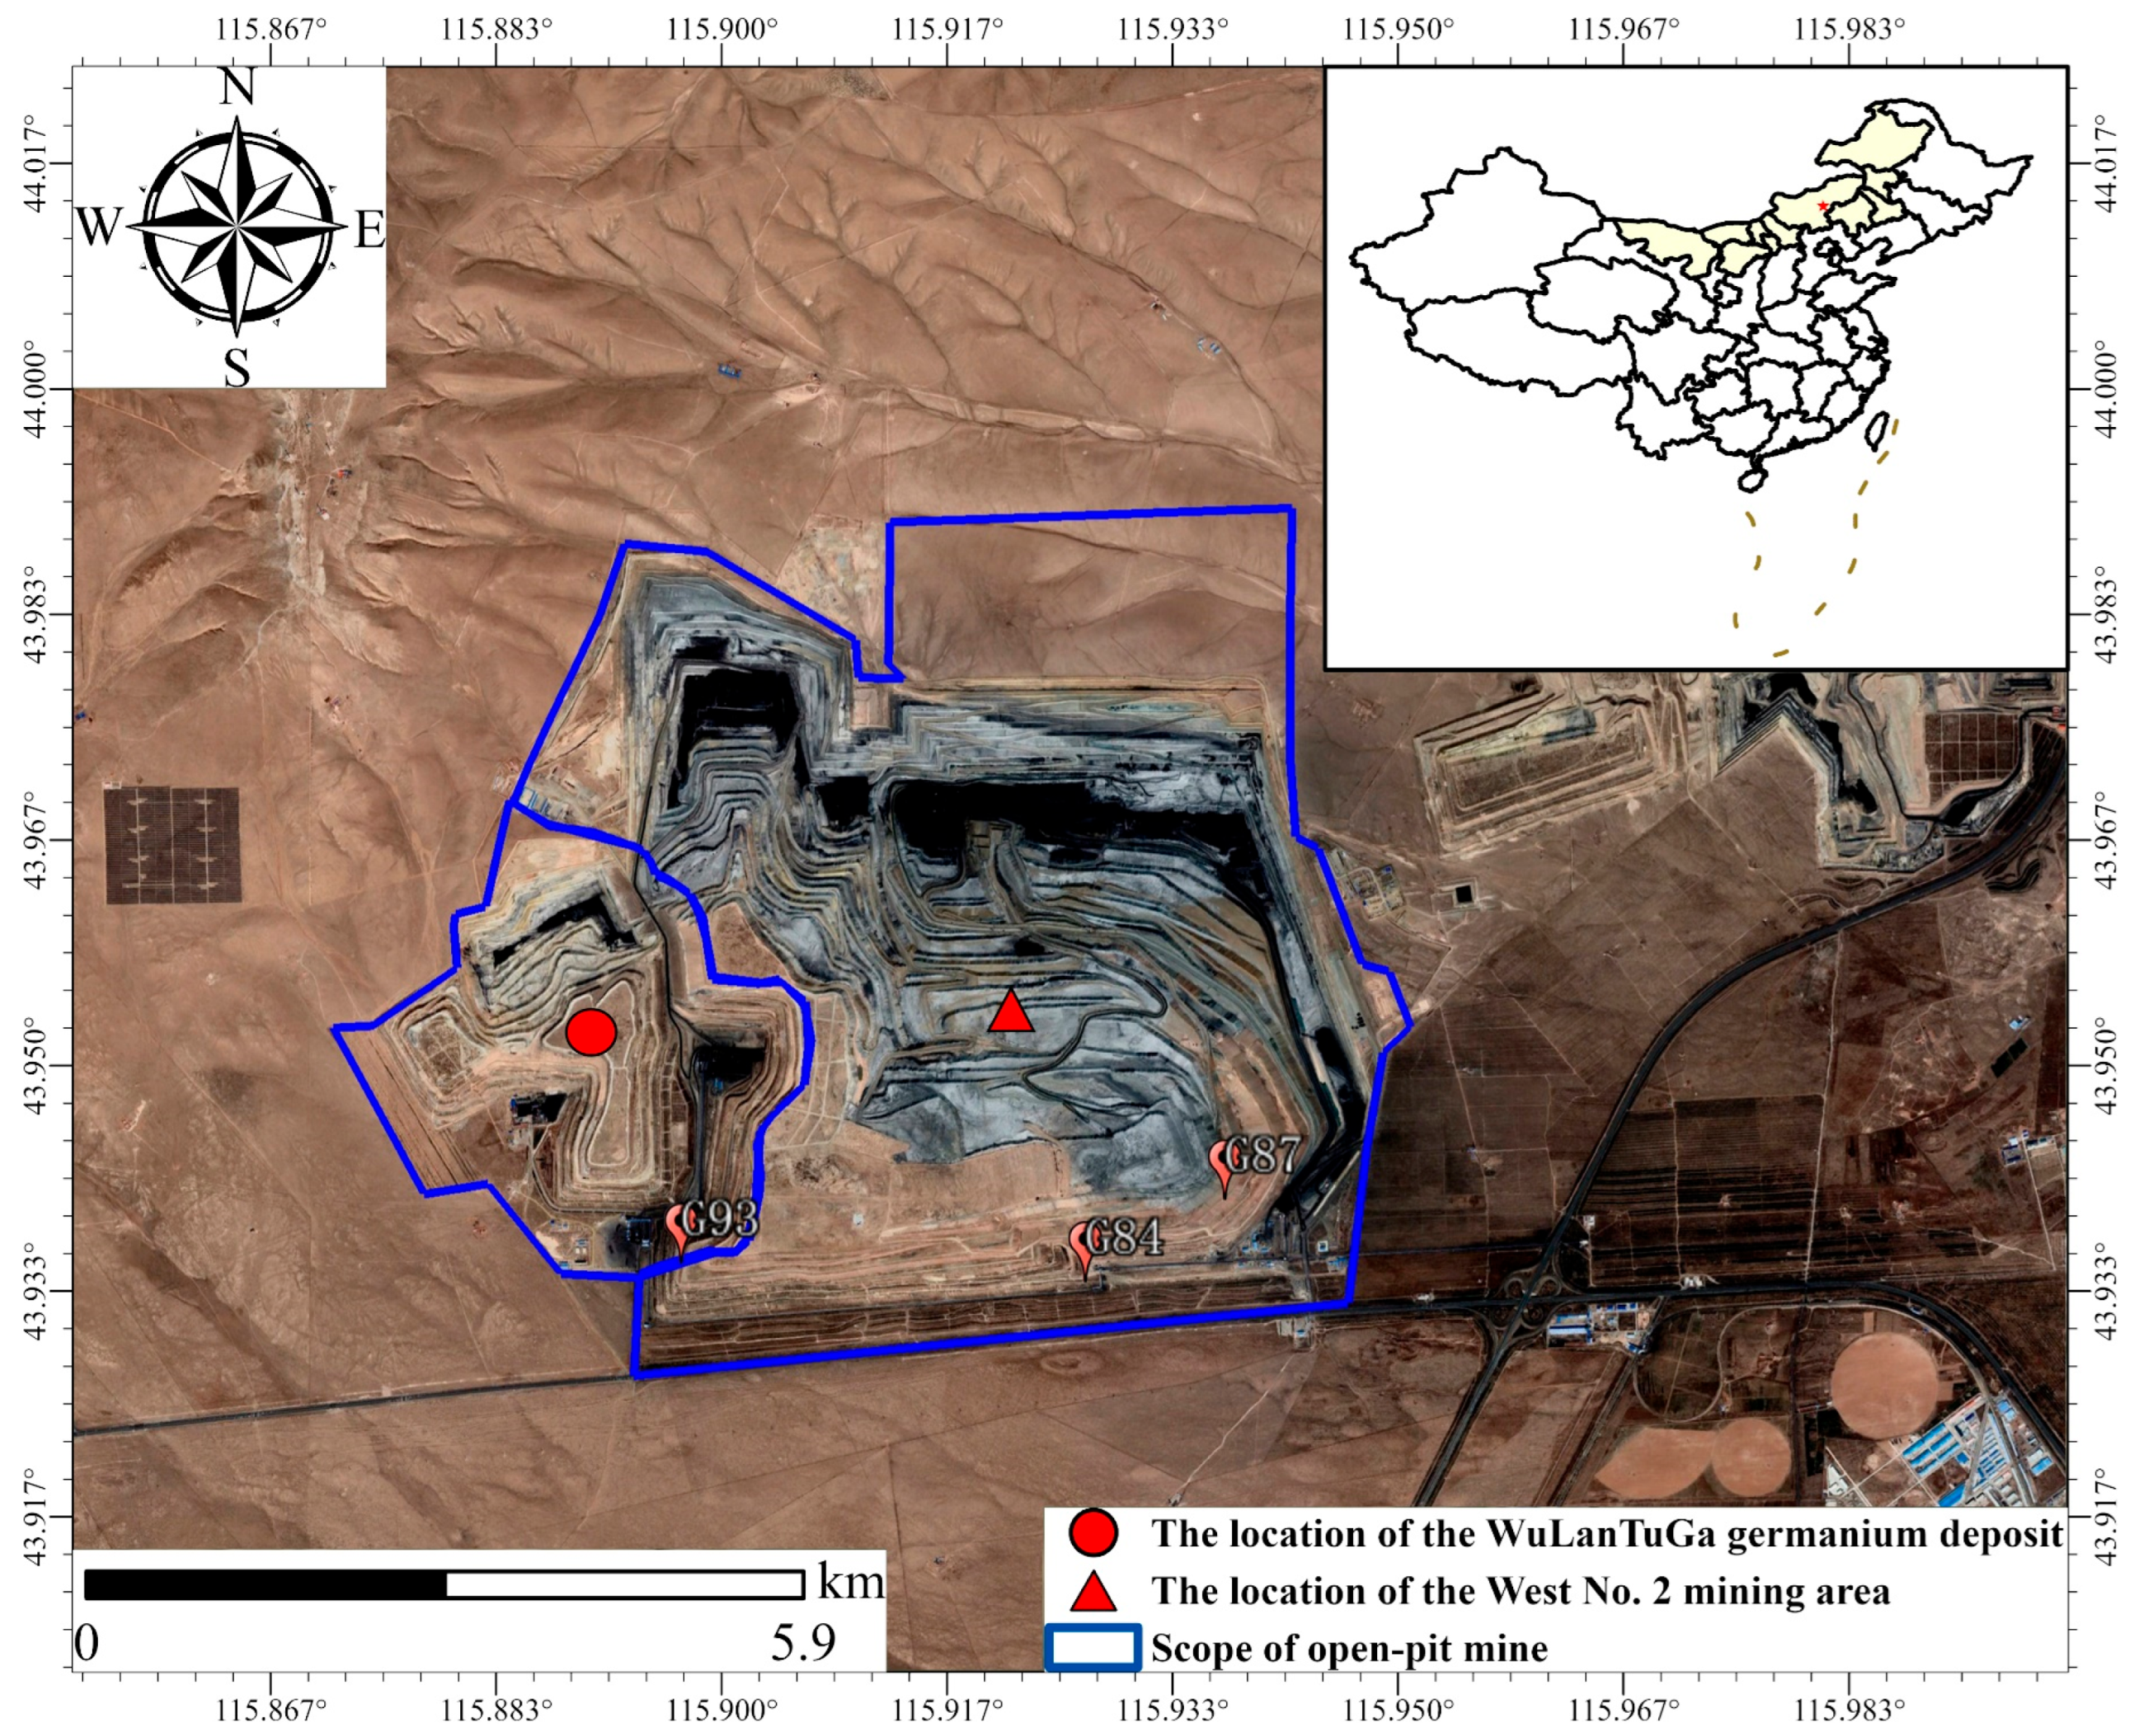
2.1. Study Area
2.2. Datasets
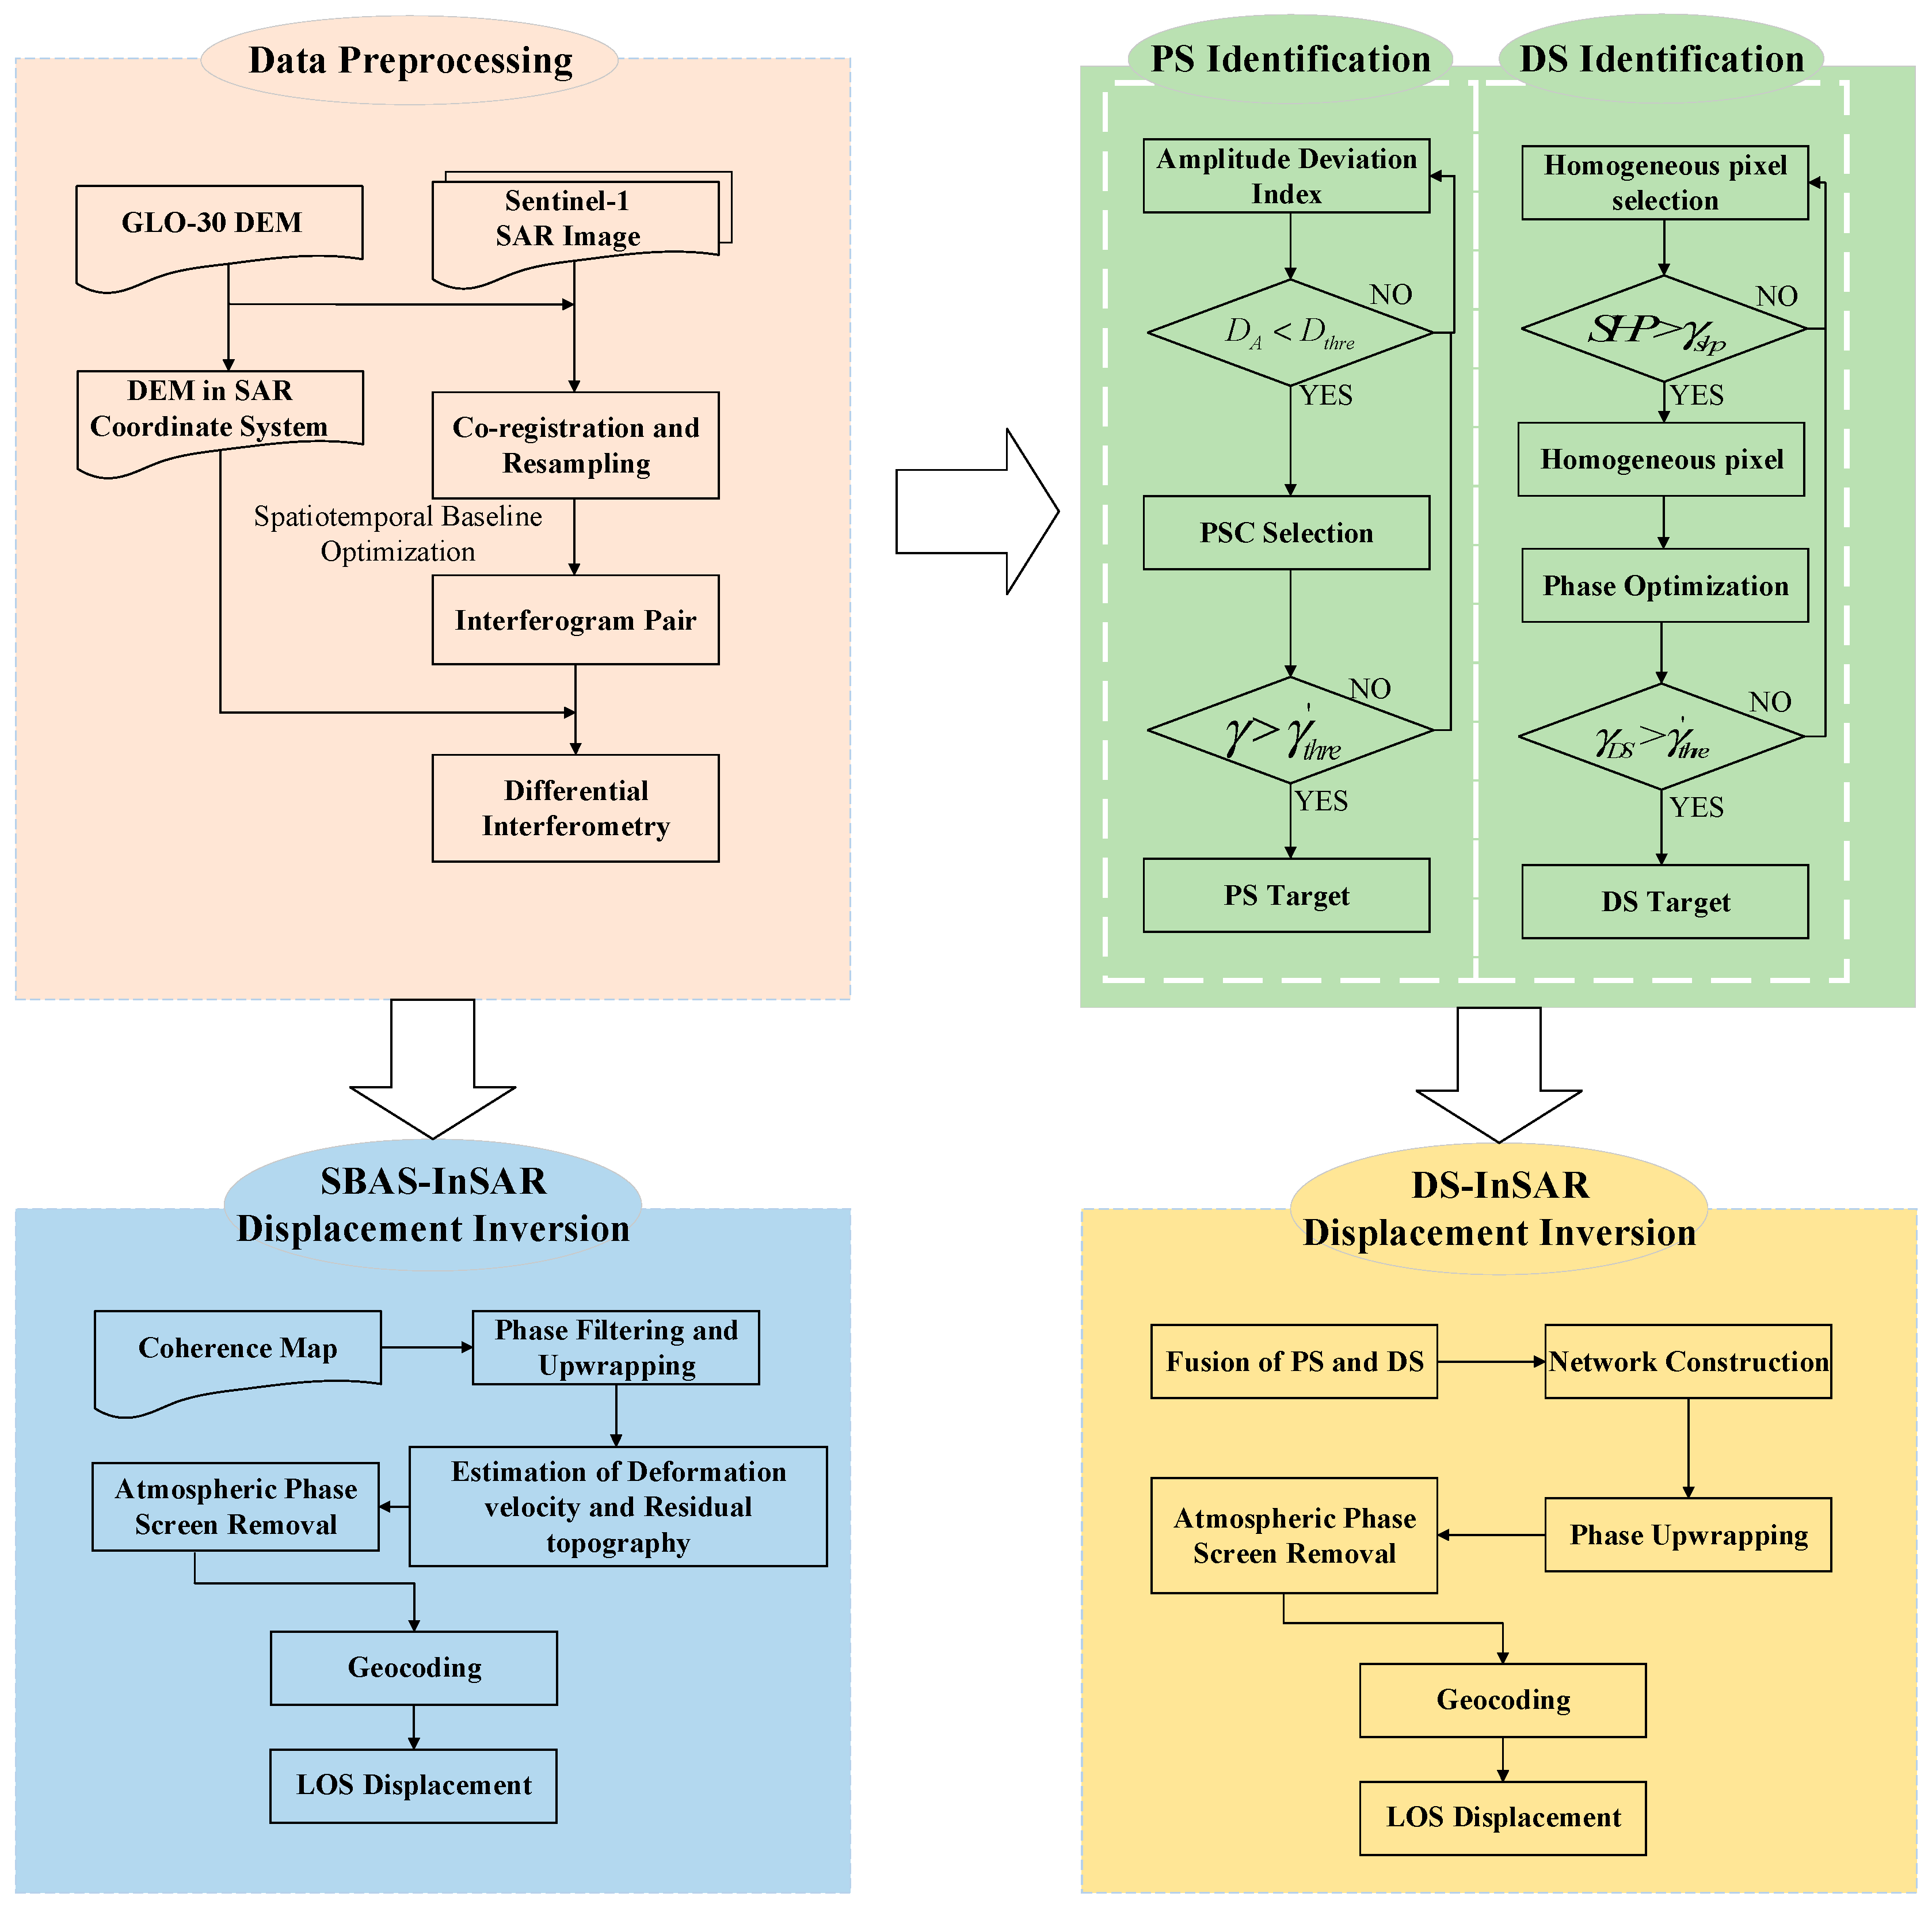
3. Methodology
4. Results
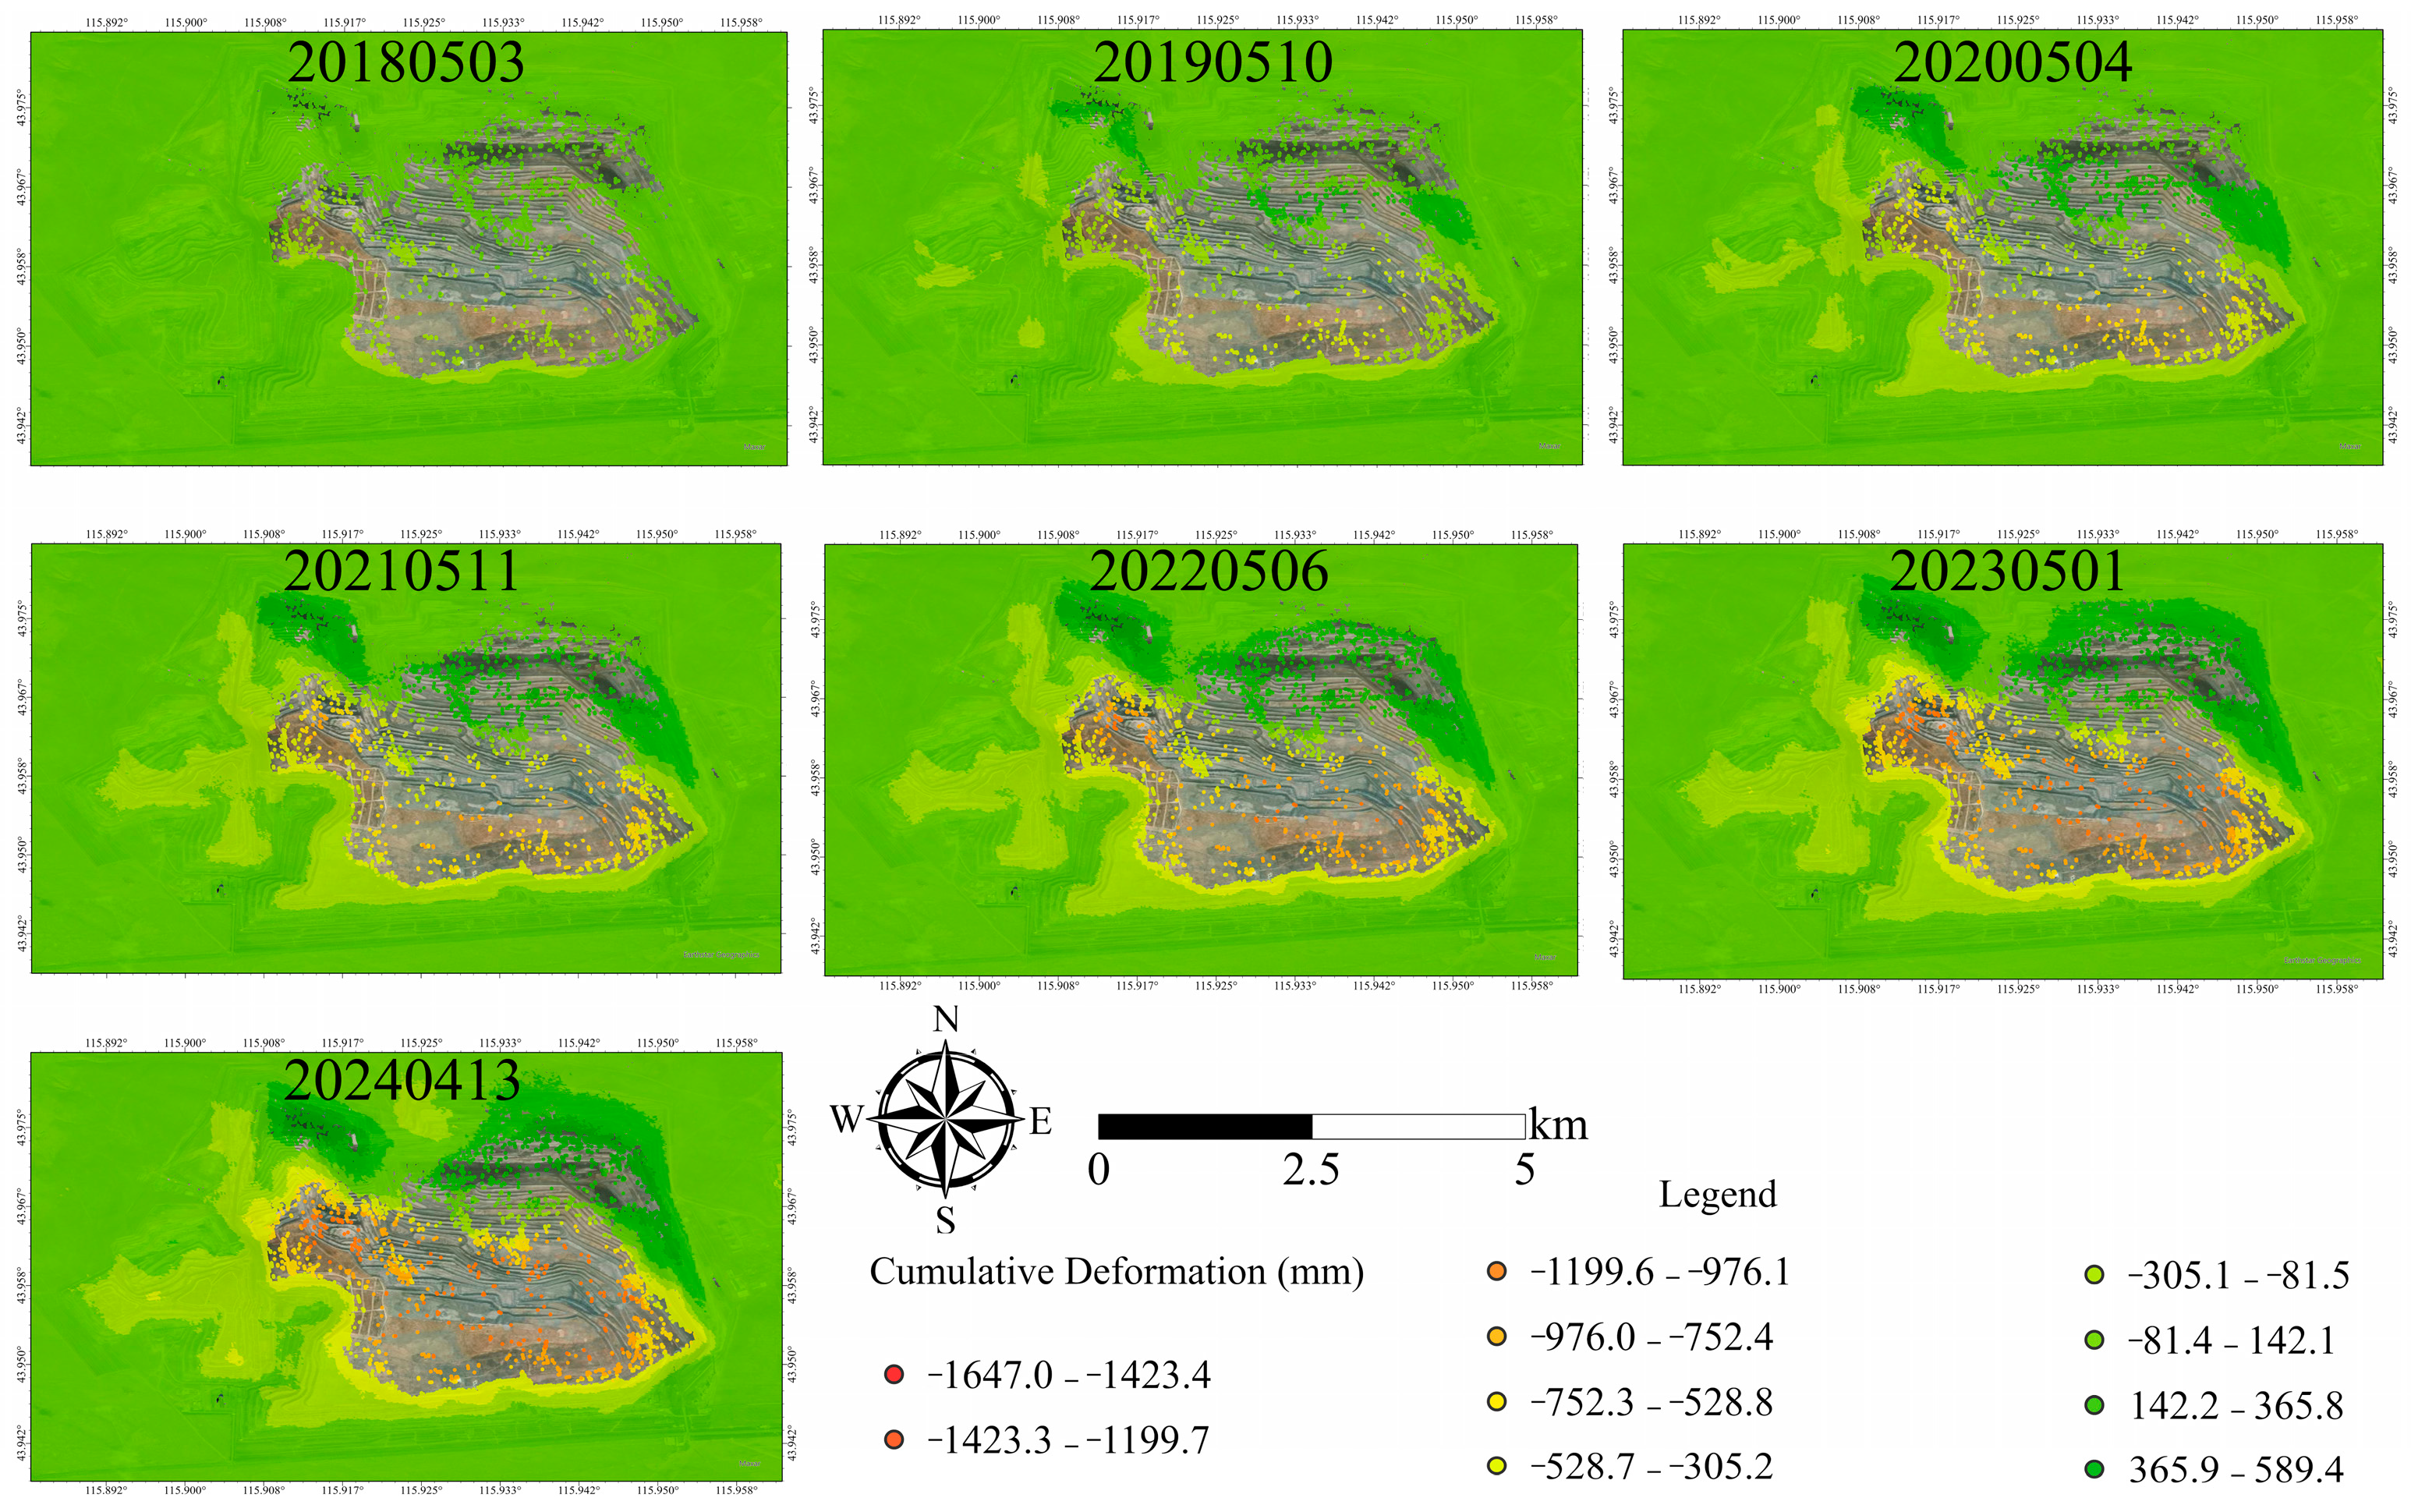
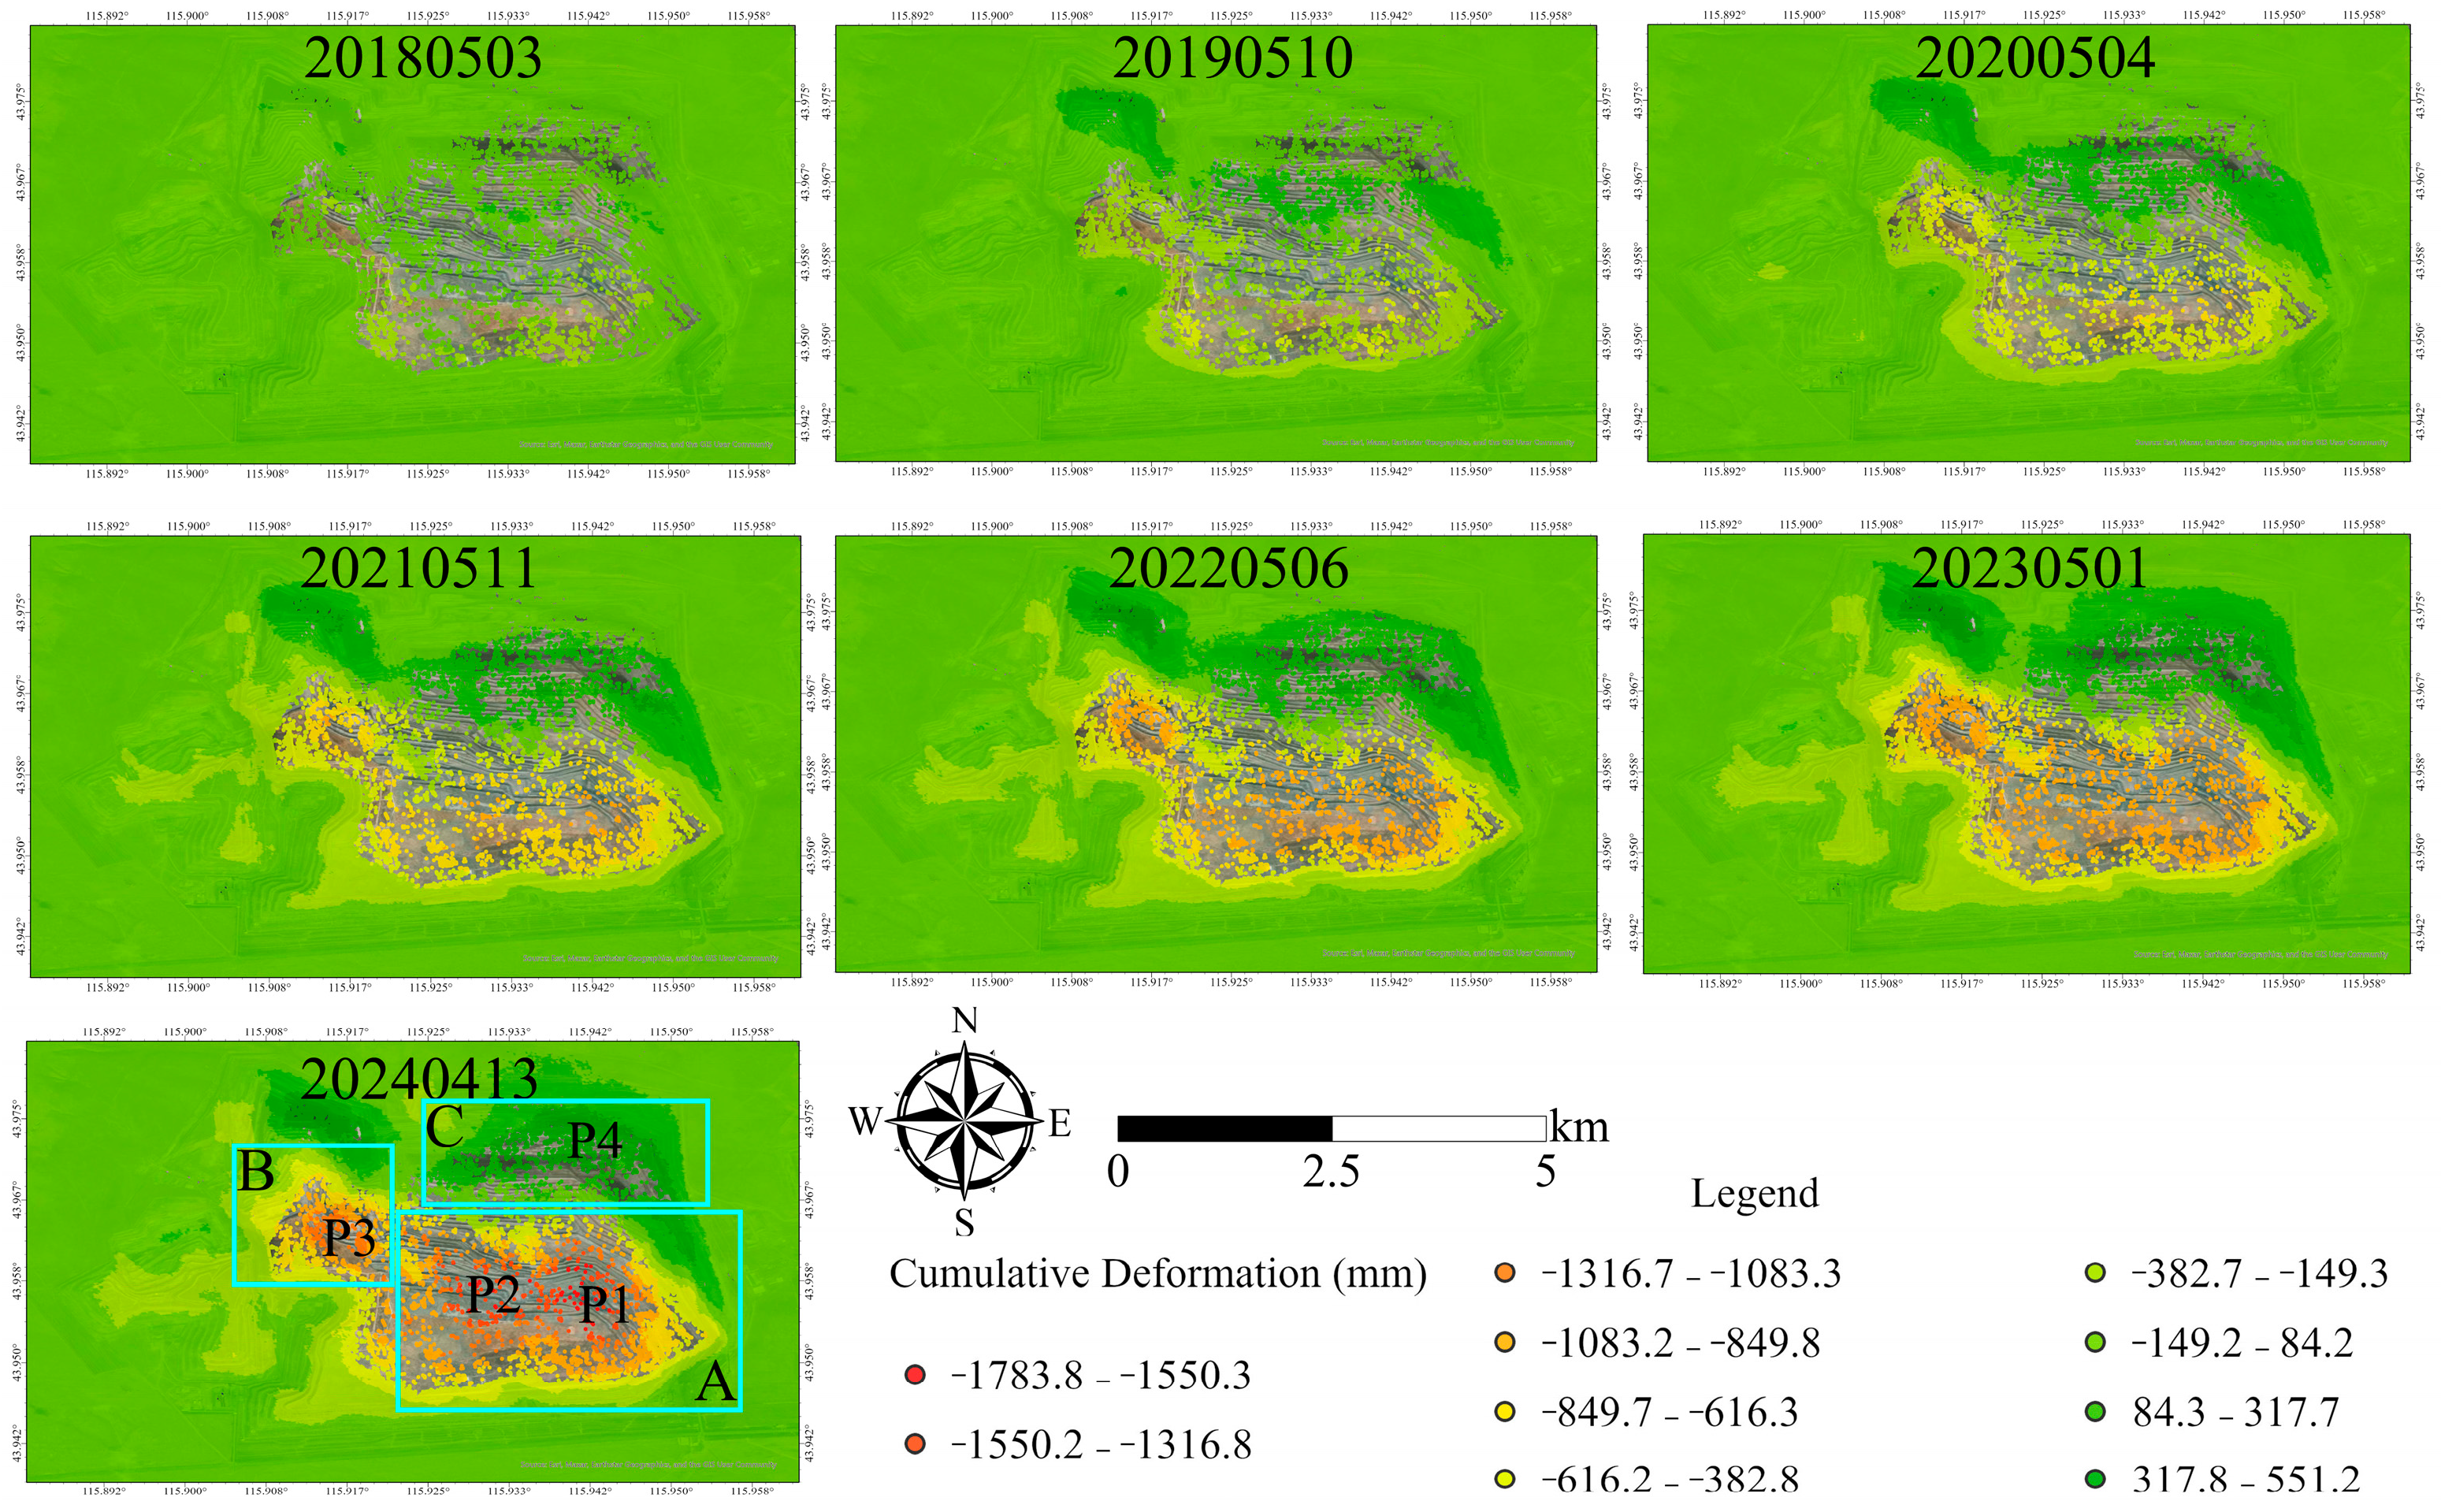
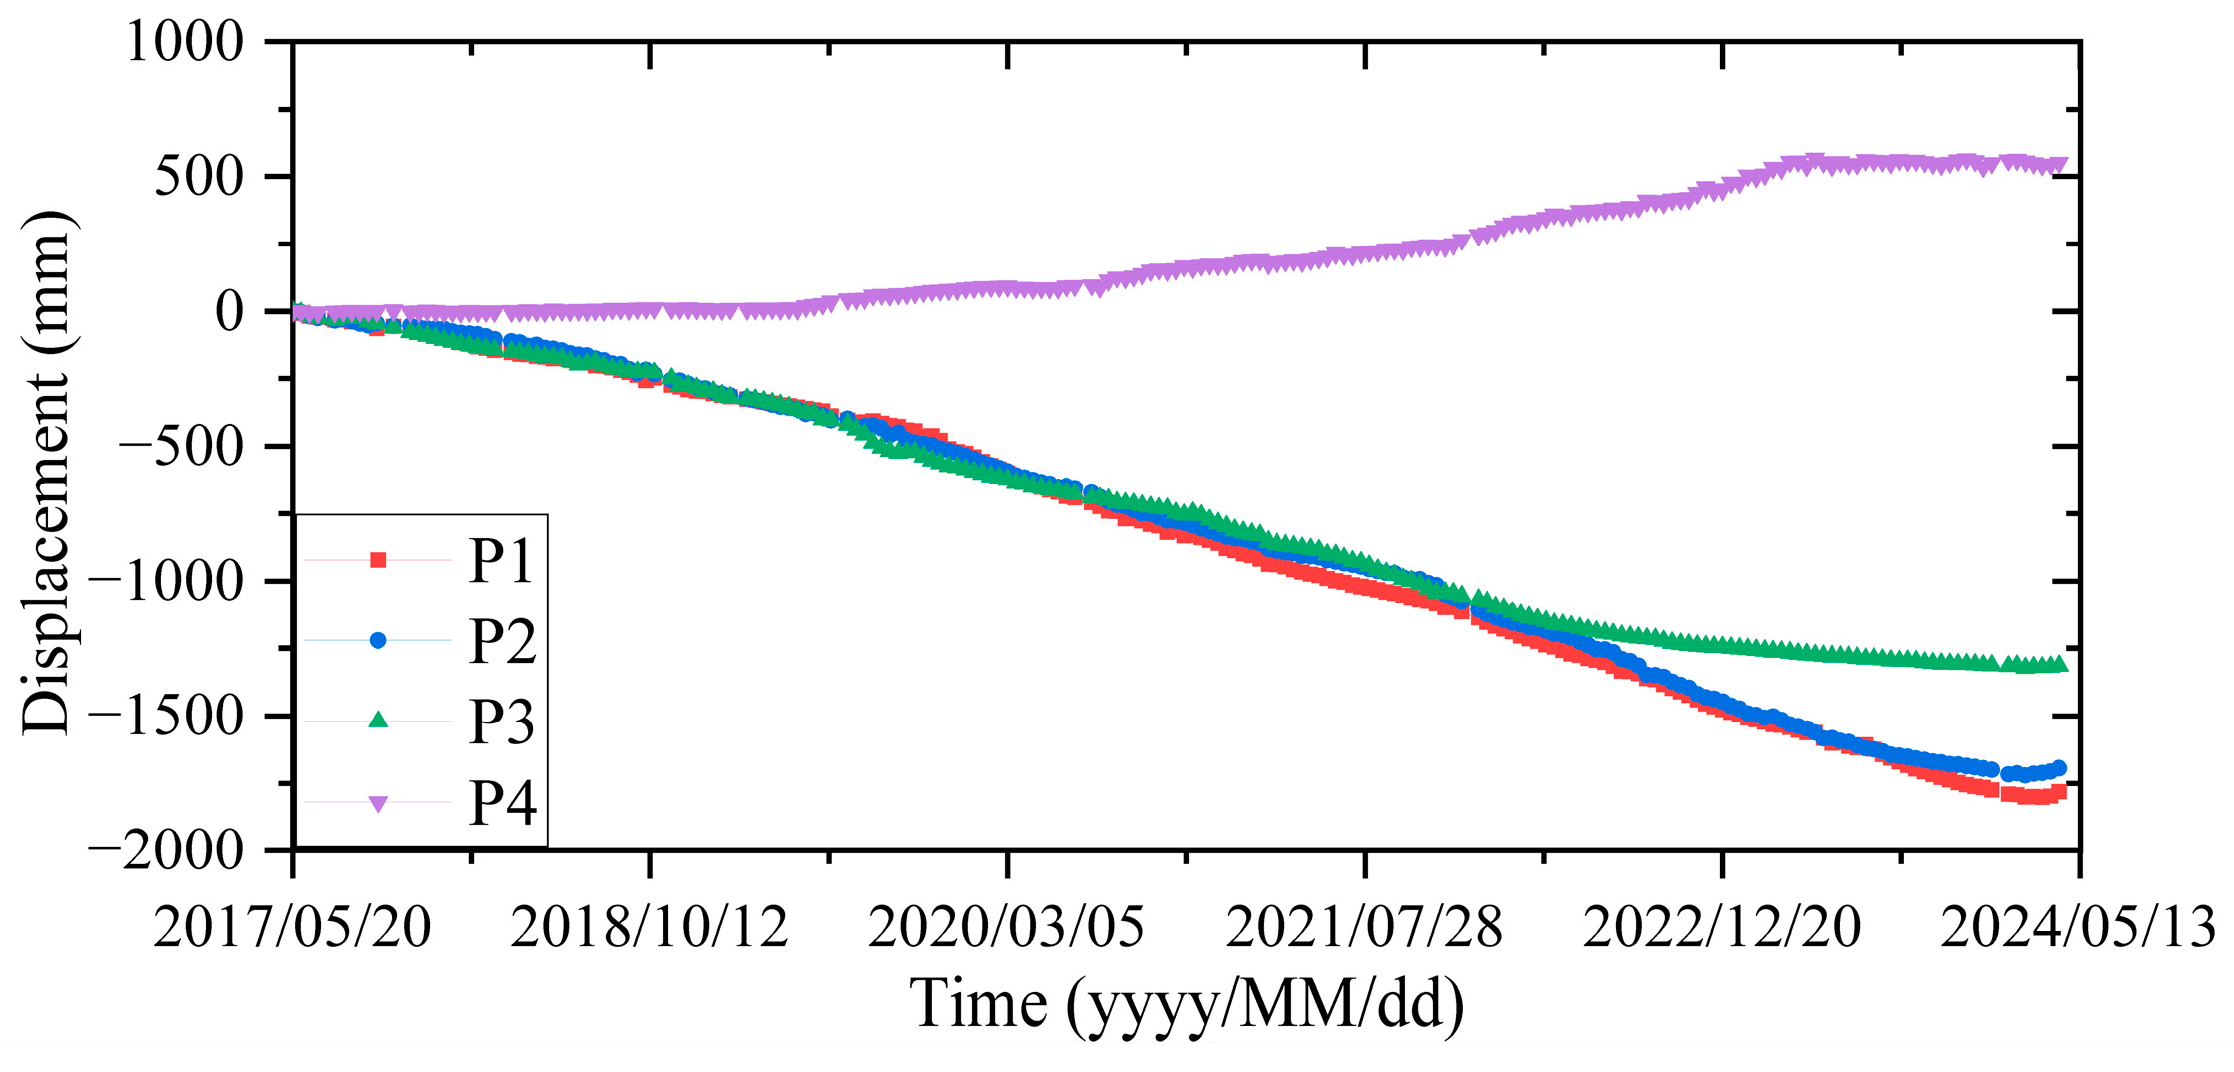
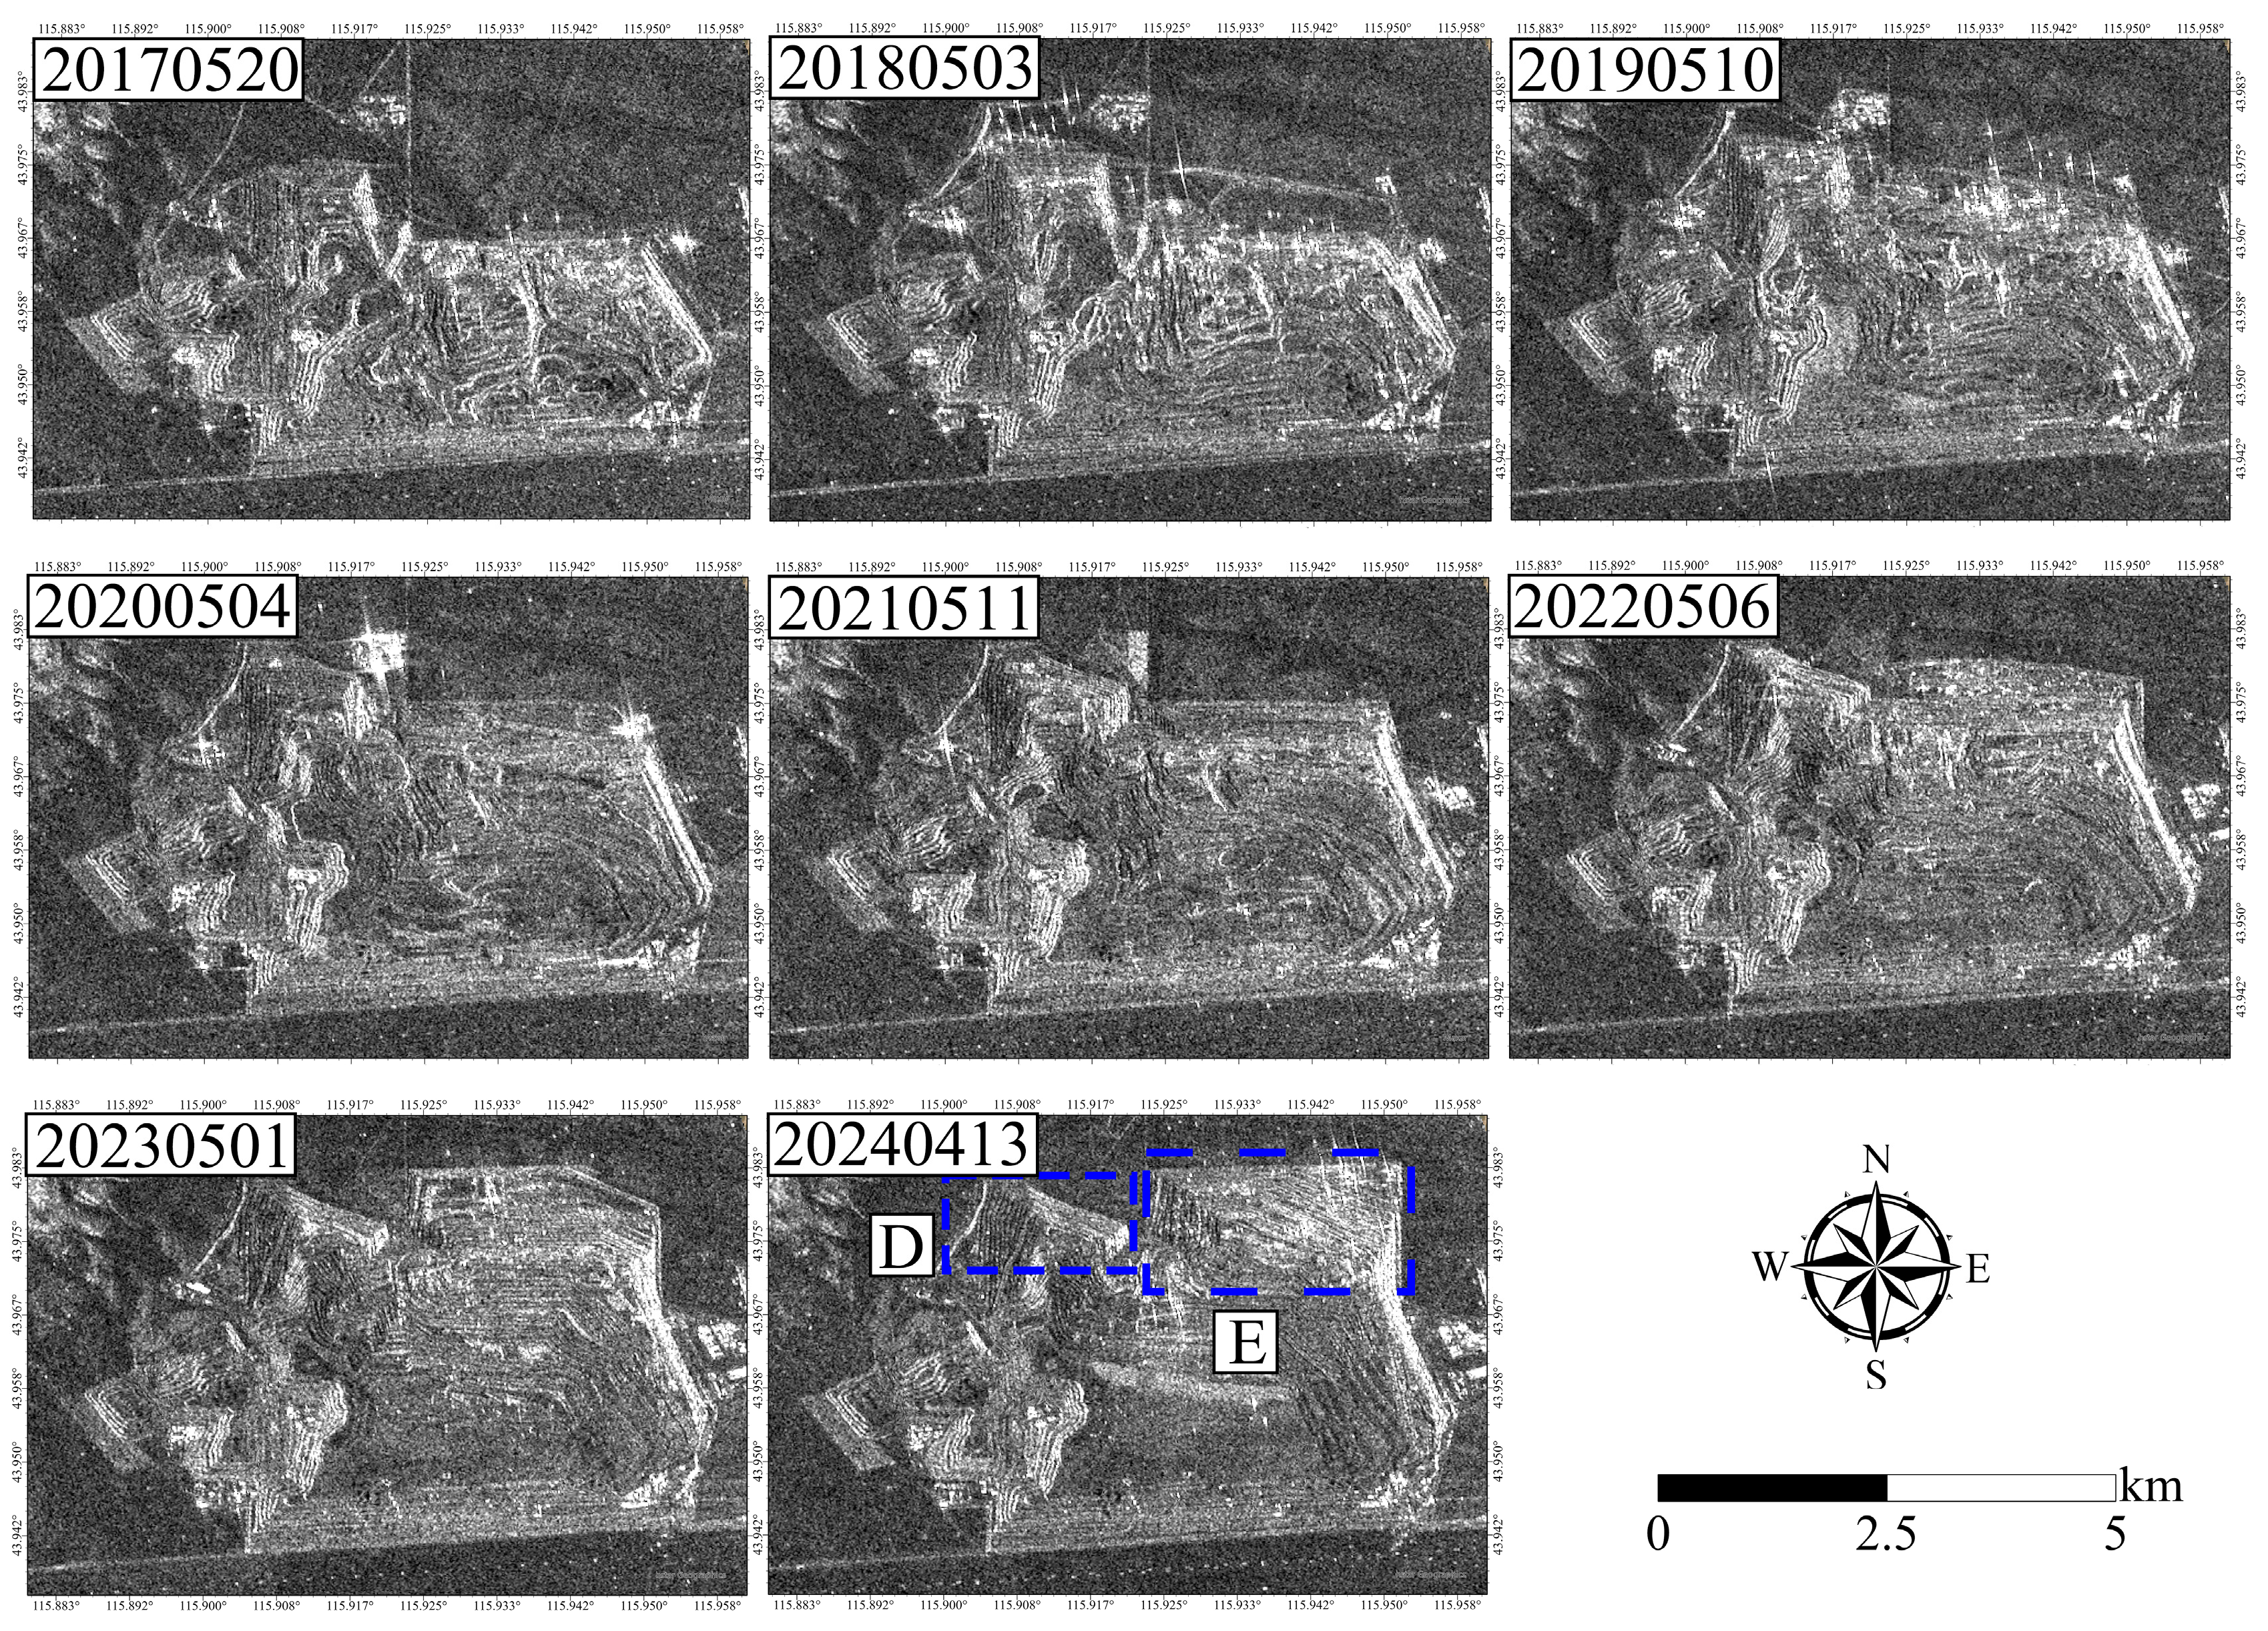
4.1. Time Series Displacement Maps
4.2. Accuracy Assessment
5. Discussion
5.1. Analysis of the Impact of Open-Pit Mining Activities on Displacement
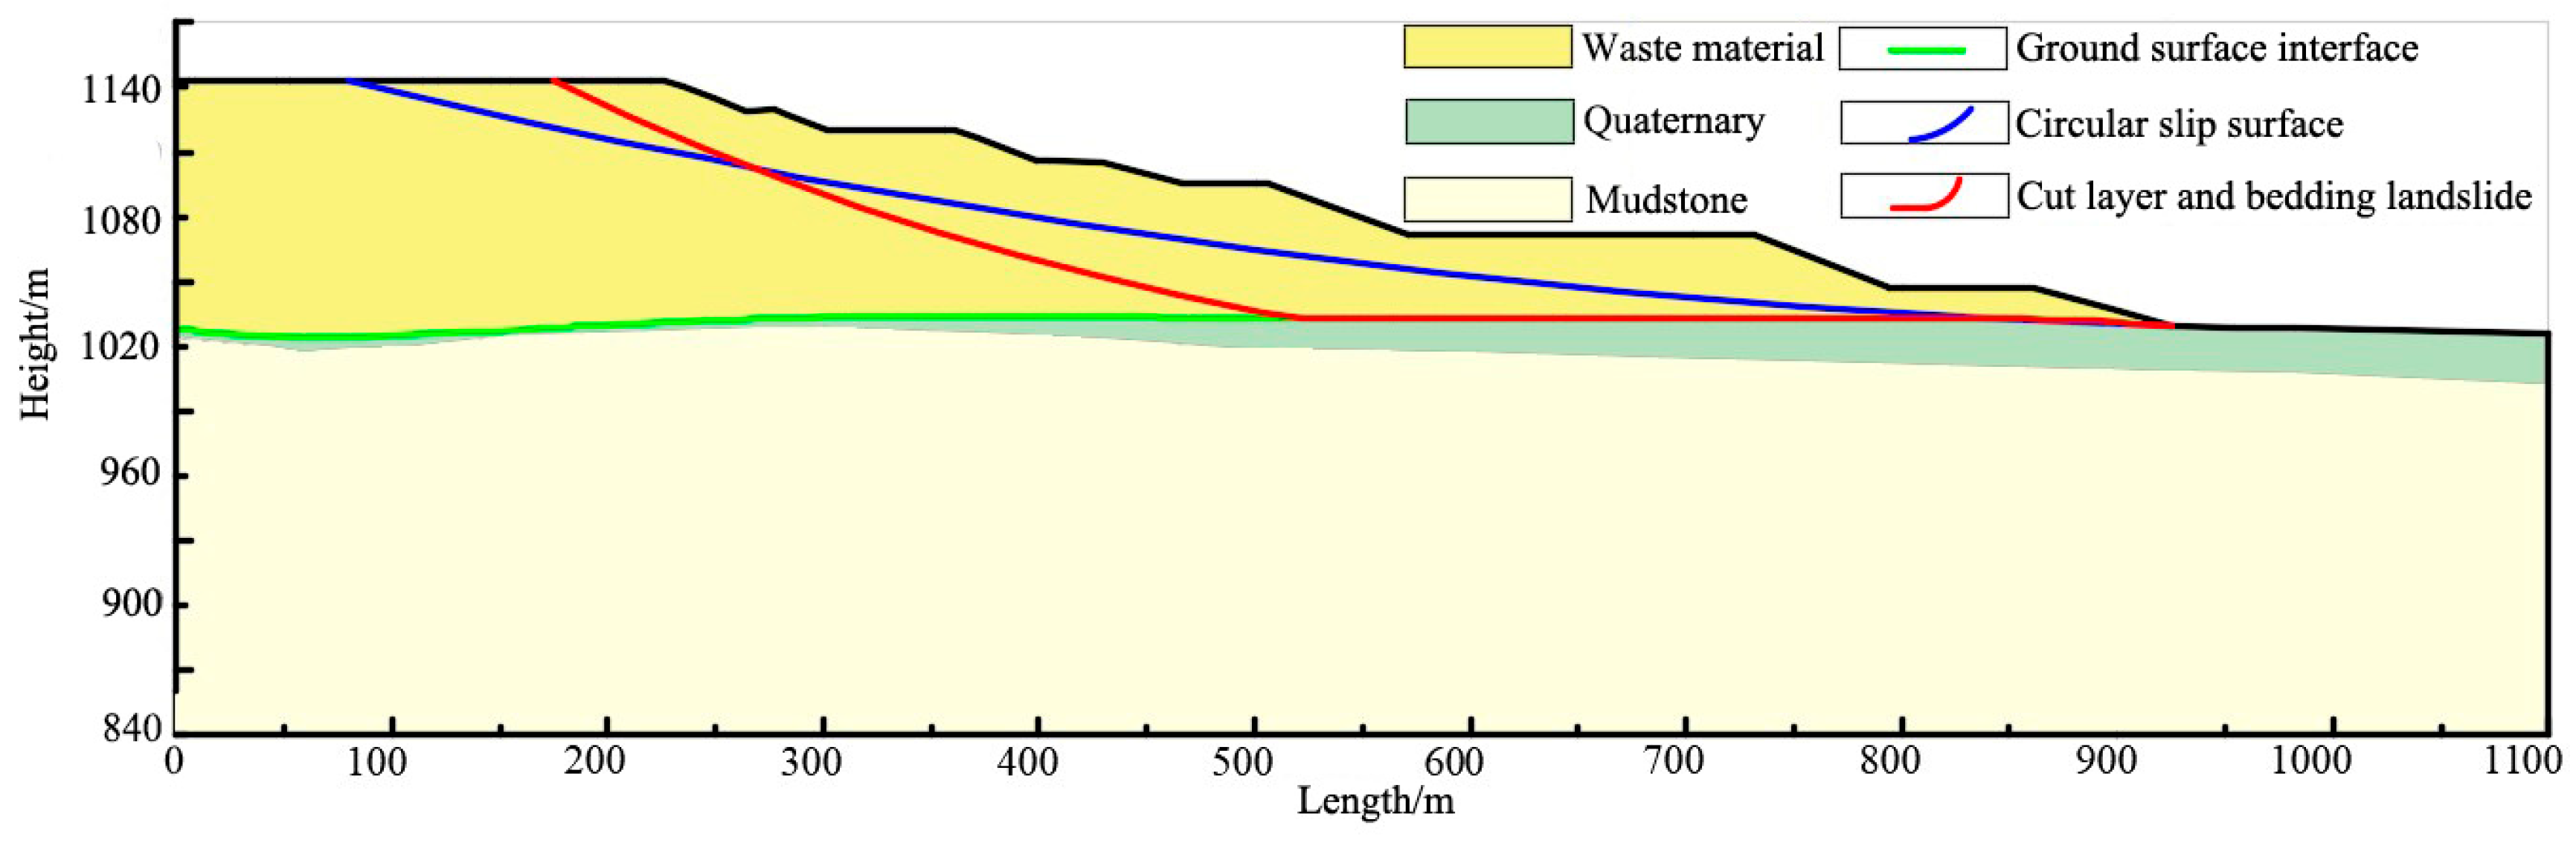
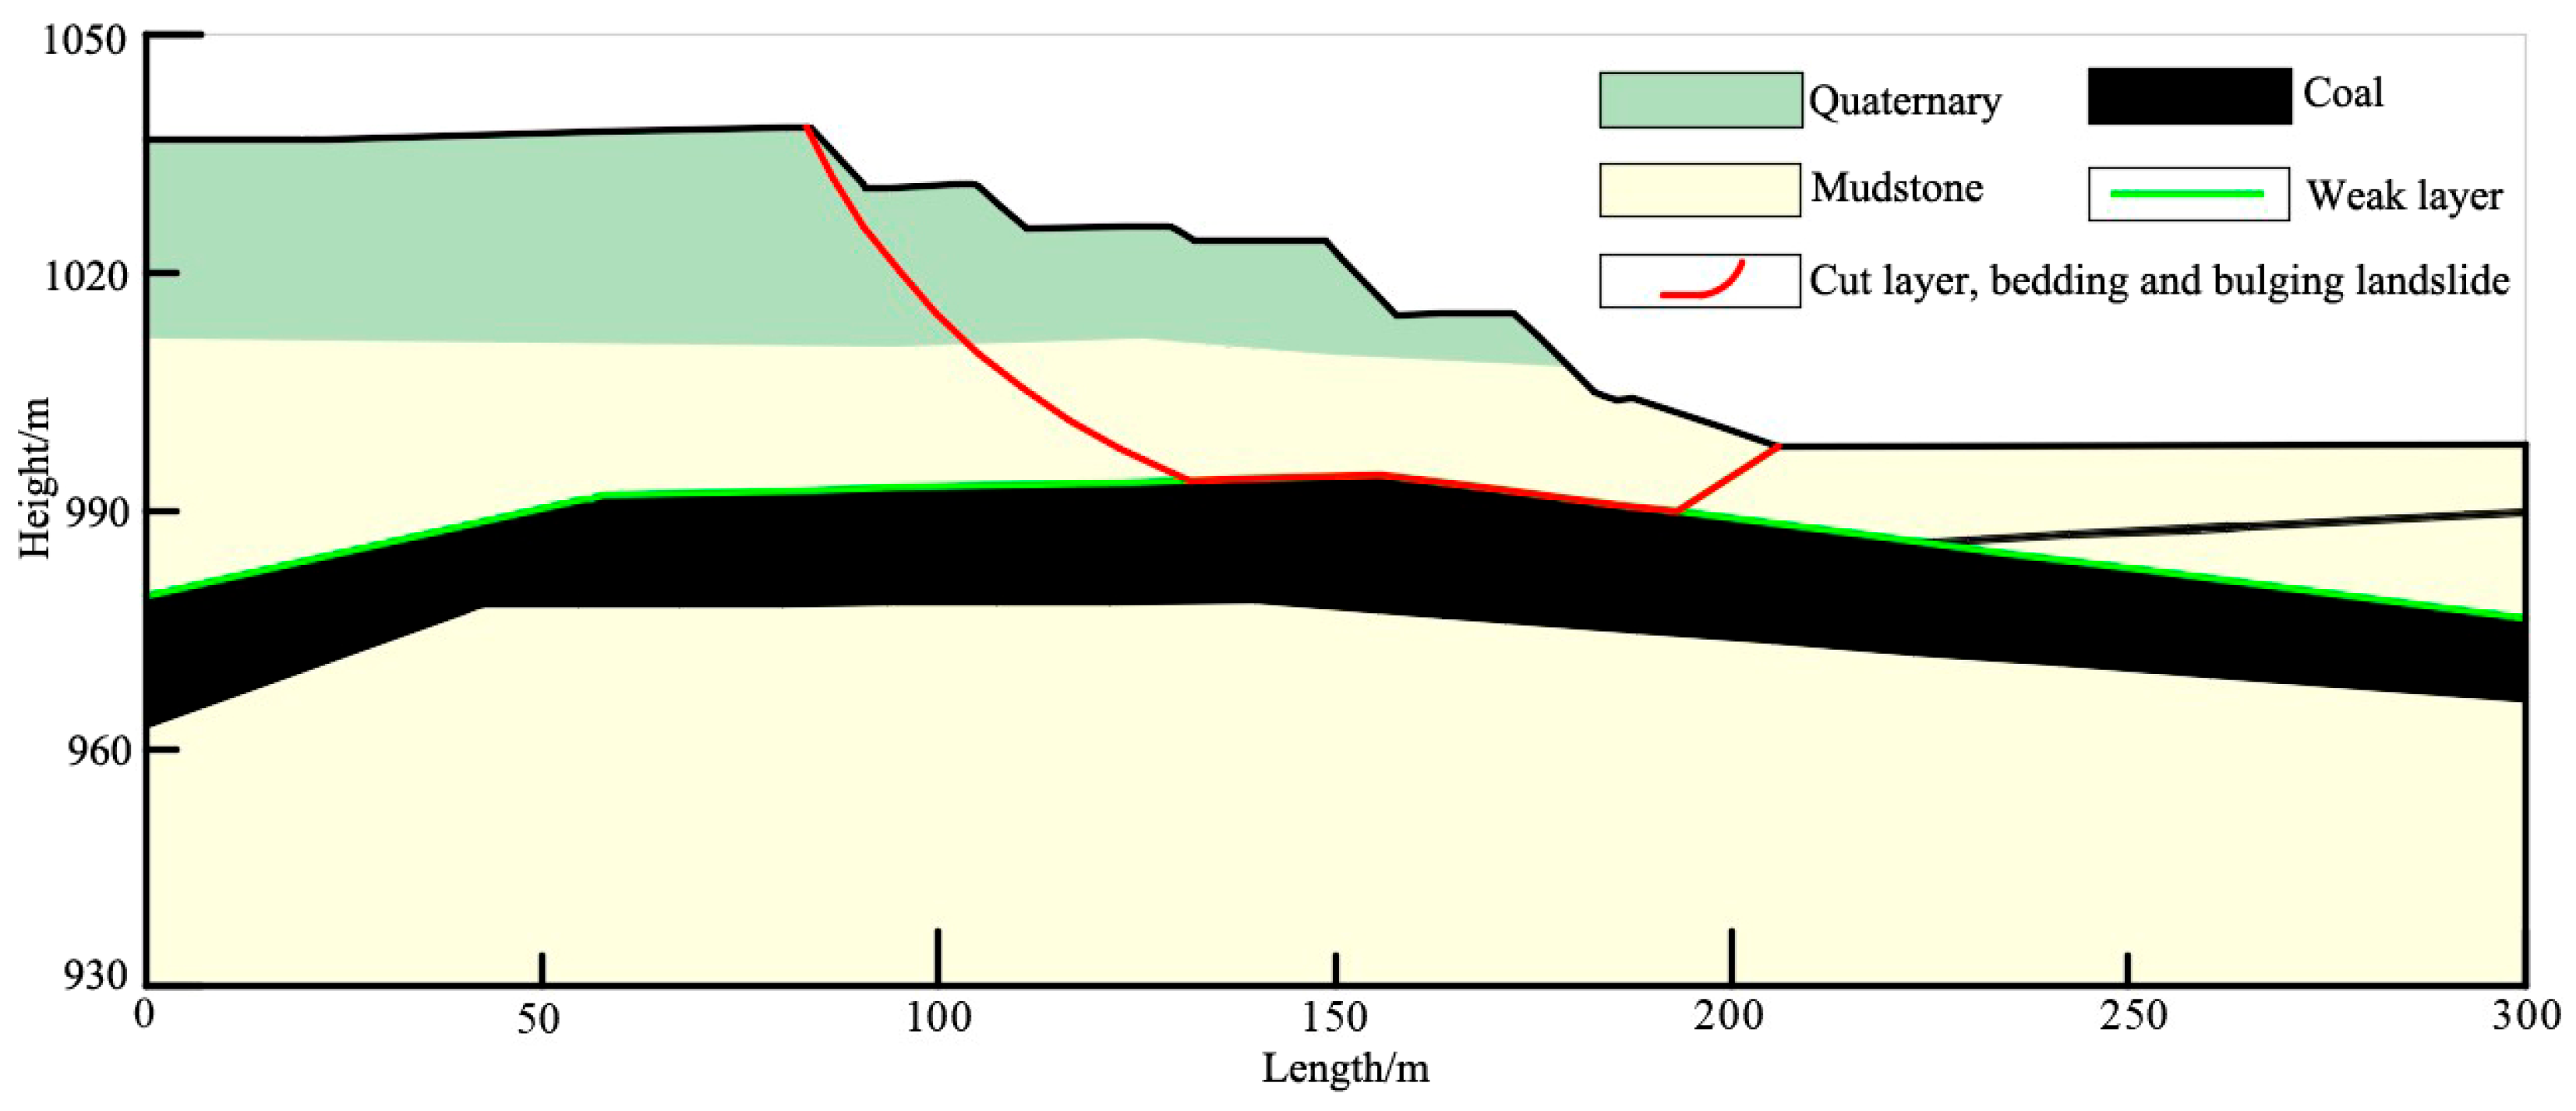
5.2. Analysis of Displacement Mode of Open-Pit Mine Slope
6. Conclusions
Author Contributions
Funding
Data Availability Statement
Acknowledgments
Conflicts of Interest
References
- Asif, M.; Bak, C.; Saleem, M.W.; Kim, W.-S. Performance evaluation of integrated gasification combined cycle (IGCC) utilizing a blended solution of ammonia and 2-amino-2-methyl-1-propanol (AMP) for CO2 capture. Fuel 2015, 160, 513–524. [Google Scholar] [CrossRef]
- Wu, Q.; Song, C.; Liu, K.; Ke, L. Integration of TanDEM-X and SRTM DEMs and spectral imagery to improve the large-scale detection of opencast mining areas. Remote Sens. 2020, 12, 1451. [Google Scholar] [CrossRef]
- Sellier, V.; Navratil, O.; Laceby, J.P.; Allenbach, M.; Lefèvre, I.; Evrard, O. Reconstructing the impact of nickel mining activities on sediment supply to the rivers and the lagoon of South Pacific Islands: Lessons learnt from the Thio early mining site (New Caledonia). Geomorphology 2021, 372, 107459. [Google Scholar] [CrossRef]
- Tang, W.; Motagh, M.; Zhan, W. Monitoring active open-pit mine stability in the Rhenish coalfields of Germany using a coherence-based SBAS method. Int. J. Appl. Earth Obs. Geoinf. 2020, 93, 102217. [Google Scholar] [CrossRef]
- Wei, L.; Wang, F.; Tolomei, C.; Liu, S.; Bignami, C.; Li, B.; Lv, D.; Trasatti, E.; Cui, Y.; Ventura, G.; et al. Displacements of Fushun west opencast coal mine revealed by multi-temporal InSAR technology. Geo-Spat. Inf. Sci. 2024, 27, 585–601. [Google Scholar] [CrossRef]
- Hui, X.; Ma, F.; Zhao, H.; Xu, J. Monitoring and statistical analysis of mine subsidence at three metal mines in China. Bull. Eng. Geol. Environ. 2019, 78, 3983–4001. [Google Scholar] [CrossRef]
- Chen, B.; Li, Z.; Yu, C.; Fairbairn, D.; Kang, J.; Hu, J.; Liang, L. Three-dimensional time-varying large surface displacements in coal exploiting areas revealed through integration of SAR pixel offset measurements and mining subsidence model. Remote Sens. Environ. 2020, 240, 111663. [Google Scholar] [CrossRef]
- Wang, Y.; Hong, W.; Zhang, Y.; Lin, Y.; Li, Y.; Bai, Z.; Zhang, Q.; Lv, S.; Liu, H.; Song, Y. Ground-based differential interferometry SAR: A review. IEEE Geosci. Remote Sens. Mag. 2020, 8, 43–70. [Google Scholar] [CrossRef]
- Jiang, M.; Zhao, X.; Shi, X. Kinematic behavior analysis of the wadi landslide from time-series sentinel-1 data. IEEE J. Sel. Top. Appl. Earth Obs. Remote Sens. 2021, 15, 127–135. [Google Scholar] [CrossRef]
- He, Y.; Chen, Y.; Wang, W.; Yan, H.; Zhang, L.; Liu, T. TS-InSAR analysis for monitoring ground deformation in Lanzhou New District, the loess Plateau of China, from 2017 to 2019. Adv. Space Res. 2021, 67, 1267–1283. [Google Scholar] [CrossRef]
- Peng, M.; Zhao, C.; Zhang, Q.; Lu, Z.; Li, Z. Research on spatiotemporal land deformation (2012–2018) over Xi’an, China, with multi-sensor SAR datasets. Remote Sens. 2019, 11, 664. [Google Scholar] [CrossRef]
- Bai, Z.; Wang, Y.; Balz, T. Beijing land subsidence revealed using PS-InSAR with long time series TerraSAR-X SAR data. Remote Sens. 2022, 14, 2529. [Google Scholar] [CrossRef]
- Wang, Y.; Bai, Z.; Zhang, Y.; Qin, Y.; Lin, Y.; Li, Y.; Shen, W. Using TerraSAR X-band and sentinel-1 C-band SAR interferometry for deformation along Beijing-Tianjin intercity railway analysis. IEEE J. Sel. Top. Appl. Earth Obs. Remote Sens. 2021, 14, 4832–4841. [Google Scholar] [CrossRef]
- Liu, X.; Zhao, C.; Zhang, Q.; Lu, Z.; Li, Z.; Yang, C.; Zhu, W.; Liu-Zeng, J.; Chen, L.; Liu, C. Integration of Sentinel-1 and ALOS/PALSAR-2 SAR datasets for mapping active landslides along the Jinsha River corridor, China. Eng. Geol. 2021, 284, 106033. [Google Scholar] [CrossRef]
- Du, J.; Li, Z.; Song, C.; Zhu, W.; Ji, Y.; Zhang, C.; Chen, B.; Su, S. InSAR-based active landslide detection and characterization along the upper reaches of the Yellow River. IEEE J. Sel. Top. Appl. Earth Obs. Remote Sens. 2023, 16, 3819–3830. [Google Scholar] [CrossRef]
- Eker, R.; Aydın, A.; Görüm, T. Tracking deformation velocity via PSI and SBAS as a sign of landslide failure: An open-pit mine-induced landslide in Himmetoğlu (Bolu, NW Turkey). Nat. Hazards 2024, 120, 7701–7724. [Google Scholar] [CrossRef]
- Lu, Y.; Jin, C.; Wang, Q.; Li, G.; Han, T. Deformation and failure characteristic of open-pit slope subjected to combined effects of mining blasting and rainfall infiltration. Eng. Geol. 2024, 331, 107437. [Google Scholar] [CrossRef]
- Ferretti, A.; Prati, C.; Rocca, F. Permanent Scatterers in SAR Interferometry. IEEE Trans. Geosci. Remote Sens. 2001, 39, 8–20. [Google Scholar] [CrossRef]
- Berardino, P.; Fornaro, G.; Lanari, R.; Sansosti, E. A New Algorithm for Surface Deformation Monitoring Based on Small Baseline Differential SAR Interferograms. IEEE Trans. Geosci. Remote Sens. 2002, 40, 2375–2383. [Google Scholar] [CrossRef]
- Rocca, F. Modeling interferogram stacks. IEEE Trans. Geosci. Remote Sens. 2007, 45, 3289–3299. [Google Scholar] [CrossRef]
- Ferretti, A.; Fumagalli, A.; Novali, F.; Prati, C.; Rocca, F.; Rucci, A. A new algorithm for processing interferometric data-stacks: SqueeSAR. IEEE Trans. Geosci. Remote Sens. 2011, 49, 3460–3470. [Google Scholar] [CrossRef]
- Jiang, M.; Ding, X.; Hanssen, R.F.; Malhotra, R.; Chang, L. Fast statistically homogeneous pixel selection for covariance matrix estimation for multitemporal InSAR. IEEE Trans. Geosci. Remote Sens. 2014, 53, 1213–1224. [Google Scholar] [CrossRef]
- Dong, J.; Zhang, L.; Tang, M.; Liao, M.; Xu, Q.; Gong, J.; Ao, M. Mapping landslide surface displacements with time series SAR interferometry by combining persistent and distributed scatterers: A case study of Jiaju landslide in Danba, China. Remote Sens. Environ. 2018, 205, 180–198. [Google Scholar] [CrossRef]
- Wang, Y.; Cui, X.; Che, Y.; Li, P.; Jiang, Y.; Peng, X. Automatic identification of slope active deformation areas in the Zhouqu region of China with DS-InSAR results. Front. Environ. Sci. 2022, 10, 883427. [Google Scholar] [CrossRef]
- Raspini, F.; Caleca, F.; Del Soldato, M.; Festa, D.; Confuorto, P.; Bianchini, S. Review of satellite radar interferometry for subsidence analysis. Earth-Sci. Rev. 2022, 235, 104239. [Google Scholar]
- Fadhillah, M.F.; Hakim, W.L.; Lee, S.; Lee, K.-J.; Lee, S.-J.; Chae, S.-H.; Lee, H.; Lee, C.-W. Multitemporal analysis of land subsidence induced by open-pit mining activity using improved combined scatterer interferometry with deep learning algorithm optimization. Sci. Rep. 2024, 14, 6311. [Google Scholar] [CrossRef] [PubMed]
- European Space Agency. Copernicus Global Digital Elevation Model. Distributed by OpenTopography. Available online: https://portal.opentopography.org/datasetMetadata?otCollectionID=OT.032021.4326.1 (accessed on 27 April 2024).
- Ho Tong Minh, D.; Hanssen, R.; Rocca, F. Radar interferometry: 20 years of development in time series techniques and future perspectives. Remote Sens. 2020, 12, 1364. [Google Scholar] [CrossRef]
- Shamshiri, R.; Nahavandchi, H.; Motagh, M.; Hooper, A. Efficient ground surface displacement monitoring using Sentinel-1 data: Integrating distributed scatterers (DS) identified using two-sample t-test with persistent scatterers (PS). Remote Sens. 2018, 10, 794. [Google Scholar] [CrossRef]
- Fornaro, G.; Verde, S.; Reale, D.; Pauciullo, A. CAESAR: An approach based on covariance matrix decomposition to improve multibaseline–multitemporal interferometric SAR processing. IEEE Trans. Geosci. Remote Sens. 2014, 53, 2050–2065. [Google Scholar] [CrossRef]
- Varnes, D.J. Landslide types and processes. Landslides Eng. Pract. 1958, 24, 20–47. [Google Scholar]
- Grelle, G.; Revellino, P.; Donnarumma, A.; Guadagno, F.M. Bedding control on landslides: A methodological approach for computer-aided mapping analysis. Nat. Hazards Earth Syst. Sci. 2011, 11, 1395–1409. [Google Scholar] [CrossRef]


| Parameter | Value |
|---|---|
| Flight direction | Ascending |
| Beam mode | IW |
| Polarization | VV |
| Wave band | C |
| Wavelength/cm | 5.6 |
| Number of images | 201 |
| Monitored period | 20 May 2017–13 April 2024 |
| GNSS Station | (mm) | (mm) | (mm) | ||
|---|---|---|---|---|---|
| G84 | 1.1 | −0.9 | −0.8 | −2.0 | −1.9 |
| G87 | −8.8 | −4.5 | −6.3 | 4.3 | 2.5 |
| G93 | −3.8 | 0.5 | −0.1 | 4.3 | 3.7 |
Disclaimer/Publisher’s Note: The statements, opinions and data contained in all publications are solely those of the individual author(s) and contributor(s) and not of MDPI and/or the editor(s). MDPI and/or the editor(s) disclaim responsibility for any injury to people or property resulting from any ideas, methods, instructions or products referred to in the content. |
© 2025 by the authors. Licensee MDPI, Basel, Switzerland. This article is an open access article distributed under the terms and conditions of the Creative Commons Attribution (CC BY) license (https://creativecommons.org/licenses/by/4.0/).
Share and Cite
Bai, Z.; Zhao, F.; Wang, J.; Li, J.; Wang, Y.; Li, Y.; Lin, Y.; Shen, W. Revealing Long-Term Displacement and Evolution of Open-Pit Coal Mines Using SBAS-InSAR and DS-InSAR. Remote Sens. 2025, 17, 1821. https://doi.org/10.3390/rs17111821
Bai Z, Zhao F, Wang J, Li J, Wang Y, Li Y, Lin Y, Shen W. Revealing Long-Term Displacement and Evolution of Open-Pit Coal Mines Using SBAS-InSAR and DS-InSAR. Remote Sensing. 2025; 17(11):1821. https://doi.org/10.3390/rs17111821
Chicago/Turabian StyleBai, Zechao, Fuquan Zhao, Jiqing Wang, Jun Li, Yanping Wang, Yang Li, Yun Lin, and Wenjie Shen. 2025. "Revealing Long-Term Displacement and Evolution of Open-Pit Coal Mines Using SBAS-InSAR and DS-InSAR" Remote Sensing 17, no. 11: 1821. https://doi.org/10.3390/rs17111821
APA StyleBai, Z., Zhao, F., Wang, J., Li, J., Wang, Y., Li, Y., Lin, Y., & Shen, W. (2025). Revealing Long-Term Displacement and Evolution of Open-Pit Coal Mines Using SBAS-InSAR and DS-InSAR. Remote Sensing, 17(11), 1821. https://doi.org/10.3390/rs17111821