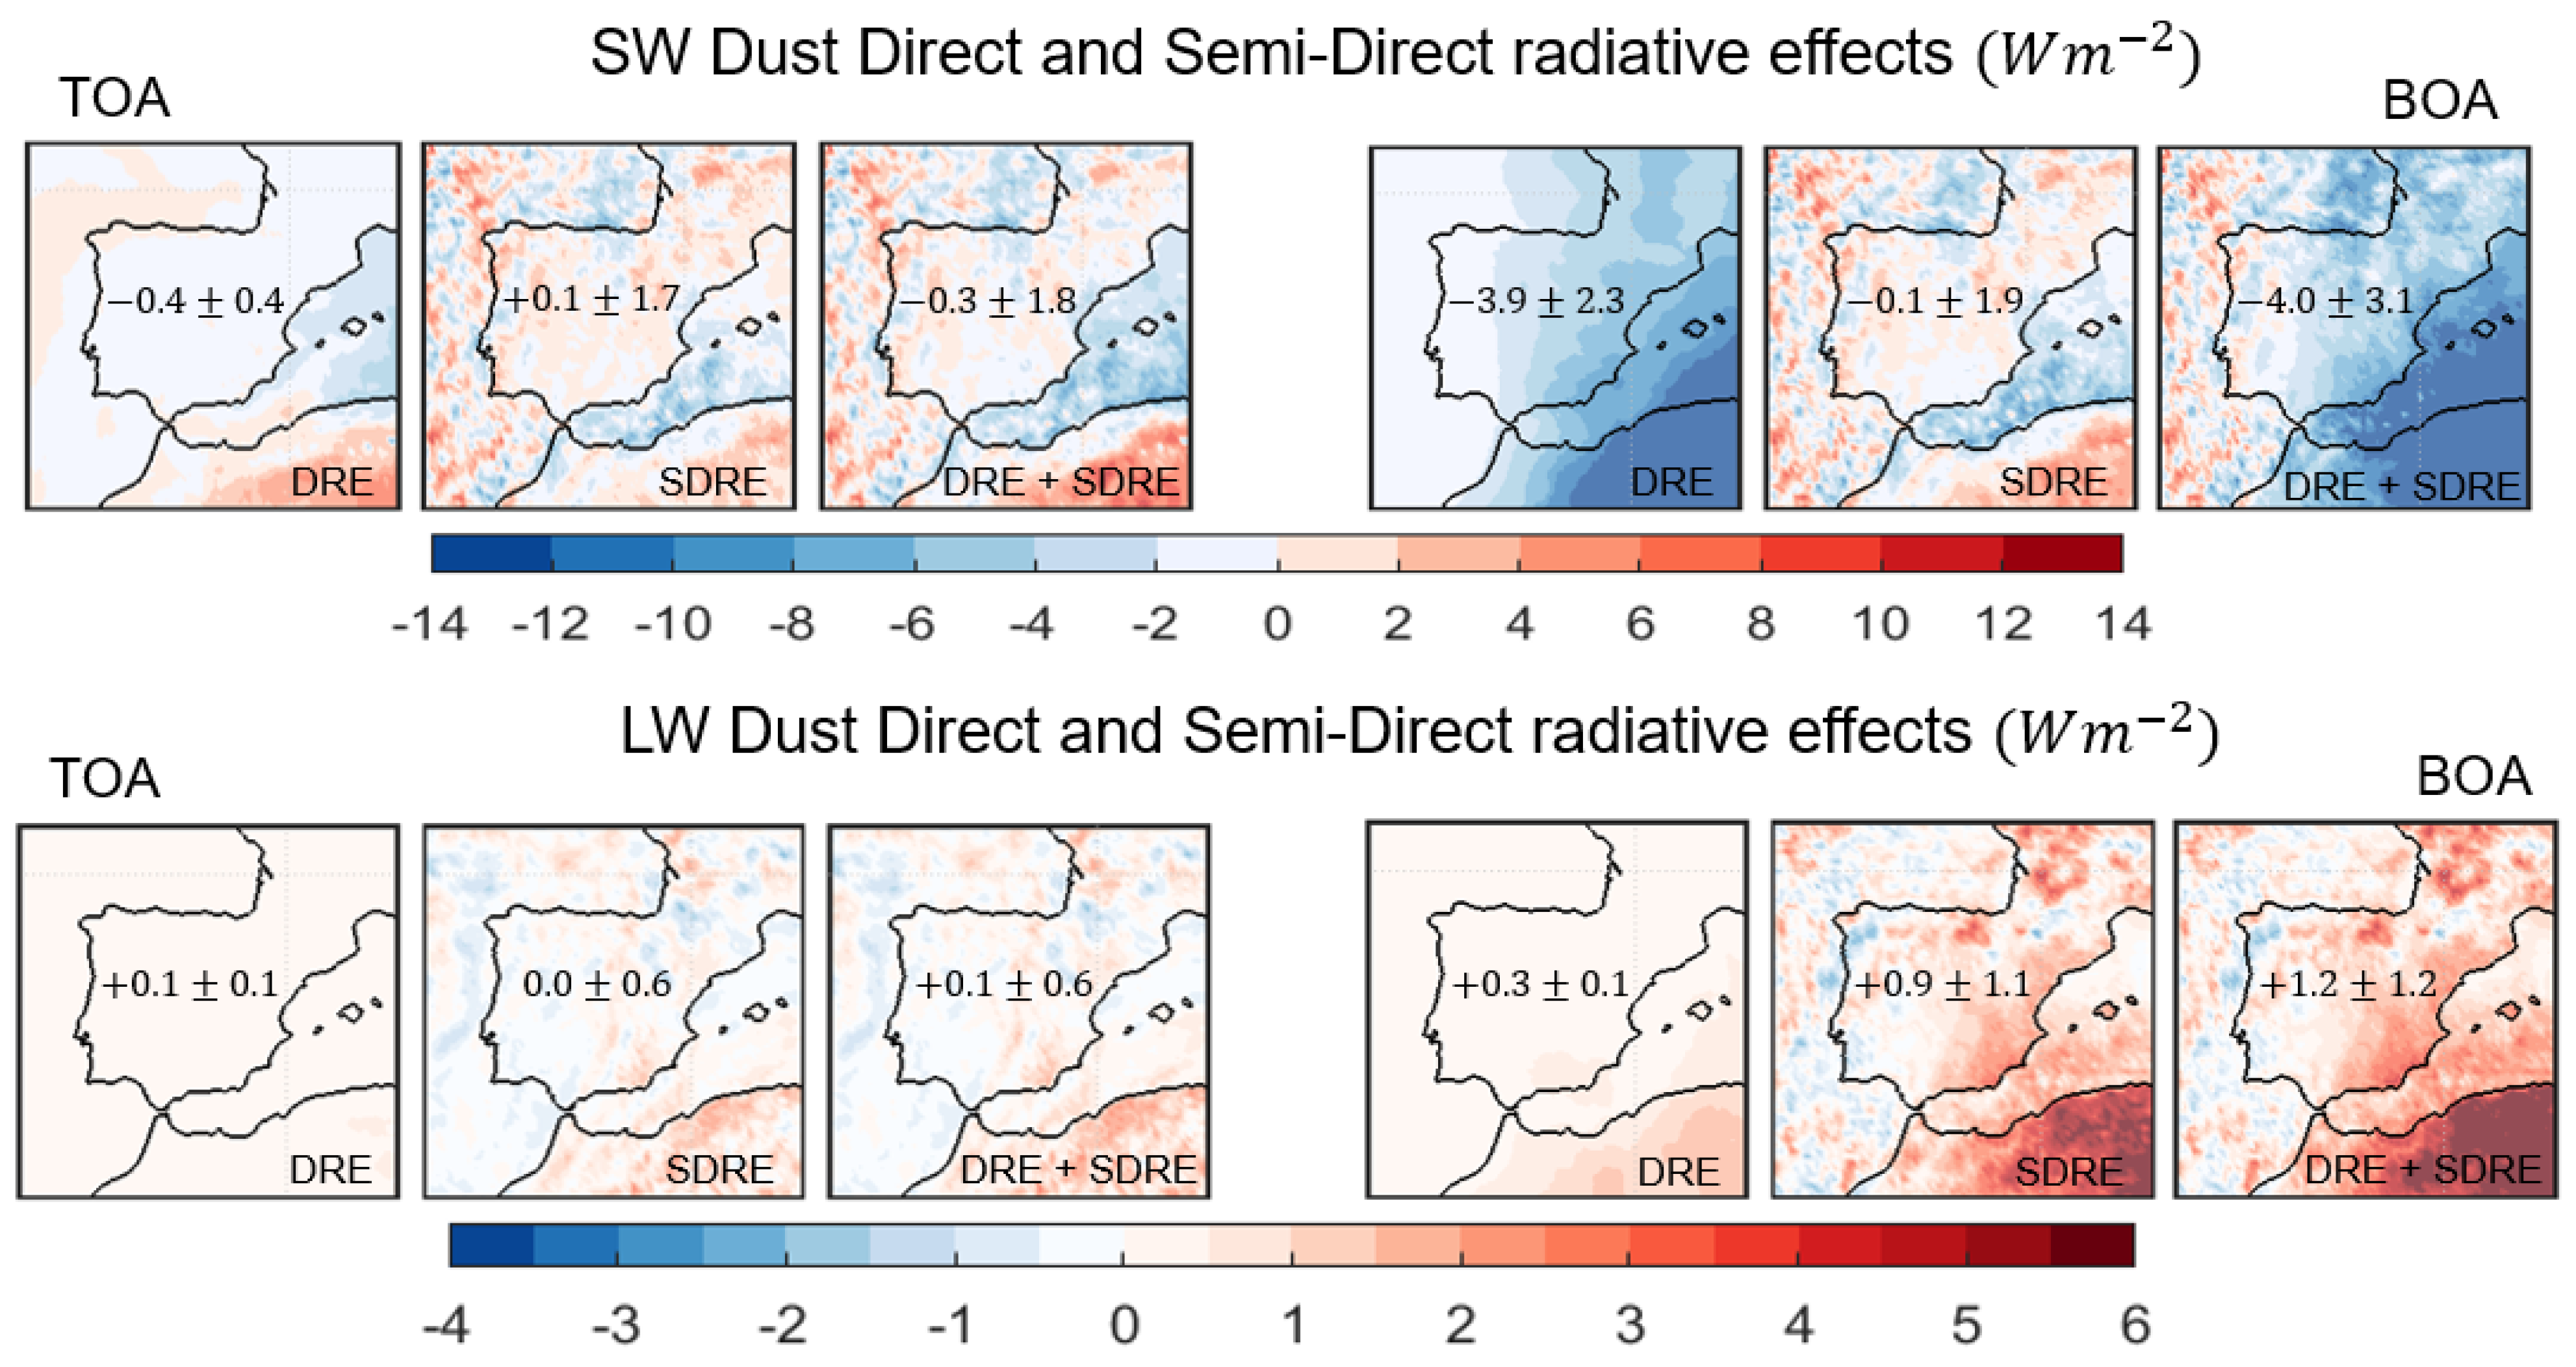
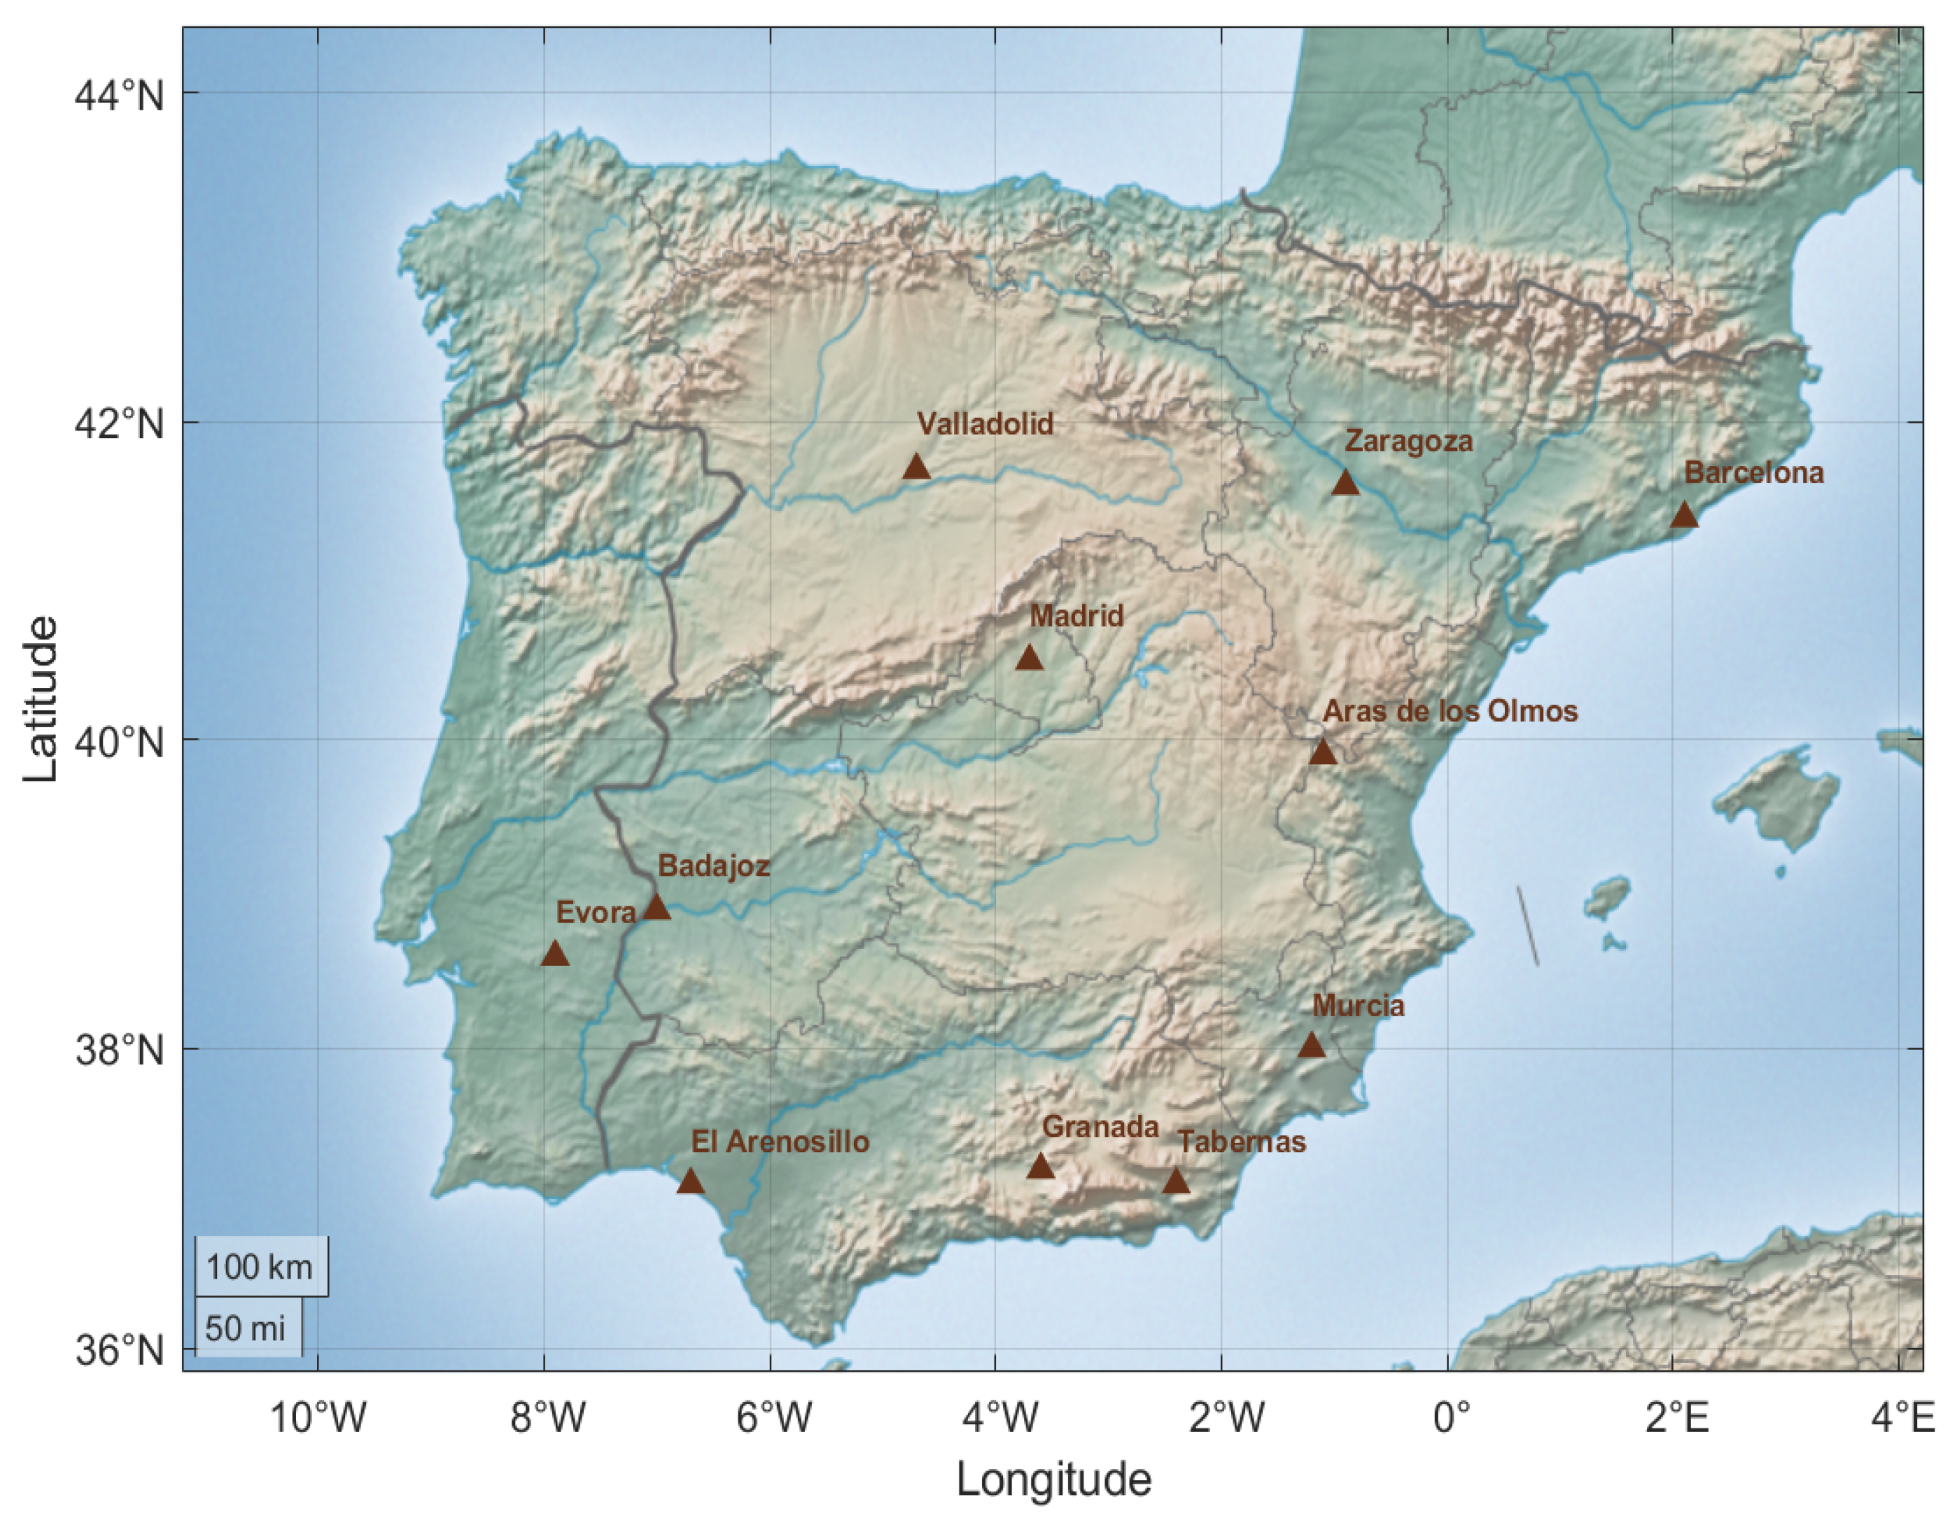
Appendix B. Impact of Spectral Nudging Relaxation on Simulations
This section analyzes the differences found between the S-Dust-SN-Wind and S-Dust-SN-All simulations. The difference between these two simulations is the relaxation of the spectral nudging on the meteorological variables of the temperature, humidity and surface pressure in the S-Dust-SN-Wind simulation. First, the averages of the semi-direct radiative effects of dust particles over the Iberian Peninsula in the shortwave, longwave and both spectra, at the top of the atmosphere, at the bottom of the atmosphere and in the full atmosphere, are calculated for the central period of the event, which covers the period from 23rd to 30th June 2019, as shown in
Figure A2.
In
Figure A2, we can discern the substantial variability in the semi-direct radiative effect differences between the S-Dust-SN-Wind and S-Dust-SN-All simulations. Notably, these differences are of the same order of magnitude as the semi-direct effect obtained with the S-Dust-SN-All simulation (see
Figure 9). In SW, the difference in the semi-direct radiative effect generally exhibits negative values over the central and eastern parts of the Peninsula, while positive values dominate in the west. As a result, an average semi-direct radiative effect of −
at TOA and −
at BOA is calculated. The S-Dust-SN-All simulation significantly underestimates the semi-direct effect. Furthermore, since the difference in the semi-direct effect is generally greater at BOA than at TOA over a large part of the Iberian Peninsula, the net semi-direct radiative effect in the full atmosphere has positive values extended over the center and east of the Iberian Peninsula and weak negative variations in the west, resulting in an average value of +
.
Figure A2.
Spatial distribution of differences between S-Dust-SN-Wind and S-Dust-SN-All simulations of the average dust semi-direct (SDRE) radiative effect in the shortwave (SW) and longwave (LW) spectra and the combination of both (NET), at the top of the atmosphere (TOA), the bottom of the atmosphere (BOA) and the full atmosphere (ATM), over the Iberian Peninsula, during the period 23rd to 30th June 2019. In the center of each graph, we show the average value and standard deviation of the radiative effect associated with the Iberian Peninsula.
In LW, the spatial division of the Iberian Peninsula in terms of the semi-direct effect differences is more pronounced, particularly at BOA and in ATM. At TOA, these differences are generally negative, with scattered regions exhibiting positive values. However, on average, they are negligible due to the balance between negative and positive contributions across the Peninsula. At BOA, the distribution of the semi-direct effect differences is more uniform. In the central and eastern regions, the S-Dust-SN-All simulation underestimates the semi-direct effect, whereas, in the west, it overestimates it. Consequently, the mean radiative effect at BOA is + over the Iberian Peninsula. In the full atmosphere, the pattern of semi-direct effect differences is similar but inverted relative to the BOA, also resulting in a mean value of +.
When both spectral ranges are combined, the difference in the net semi-direct radiative effect in the full atmosphere follows a pattern similar to that observed in the LW spectrum but with weaker values, indicating the predominance of this spectrum. On average, this difference is −, suggesting that the S-Dust-SN-All simulation slightly overestimates the net semi-direct radiative effect in the full atmosphere over the Iberian Peninsula.
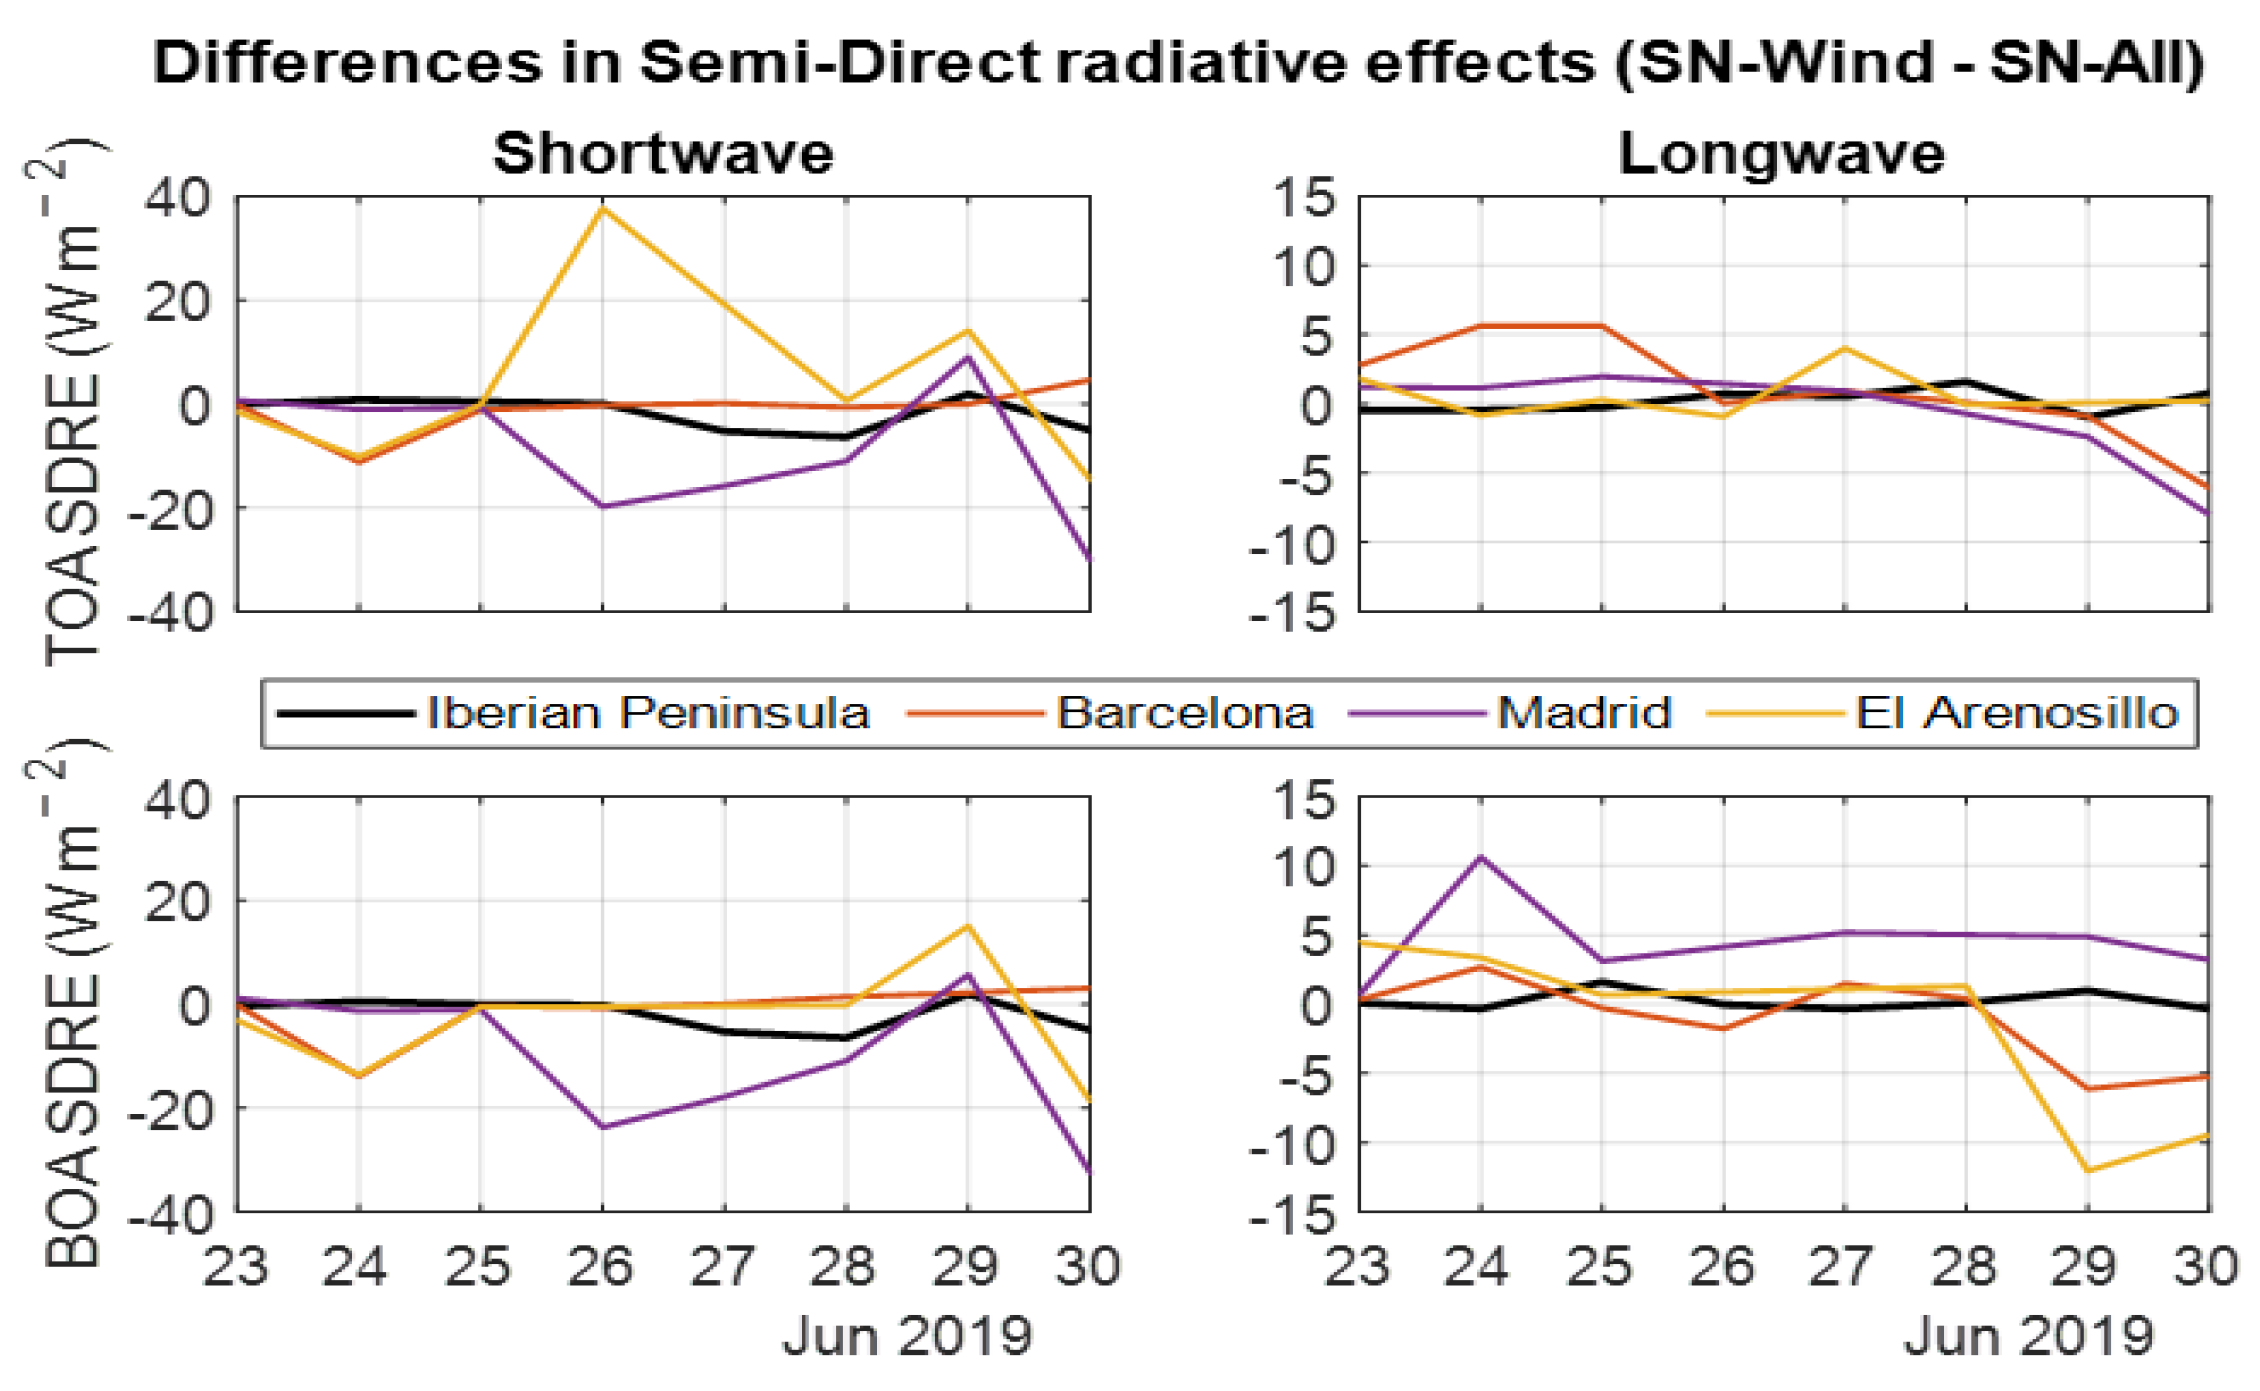
For further discussion, the temporal distribution of the daily semi-direct radiative effect differences in both spectra over the Iberian Peninsula and at three representative AERONET stations—Barcelona, Madrid and El Arenosillo—during the central period of the event is shown below in
Figure A3.
Figure A3.
Temporal distribution of differences between S-Dust-SN-Wind and S-Dust-SN-All simulations of the daily semi-direct (SDRE) radiative effect in the shortwave (SW) and longwave (LW) spectra, at the top of the atmosphere (TOA) and bottom of the atmosphere (BOA), over the Iberian Peninsula and at three representative AERONET stations—Barcelona, Madrid and El Arenosillo—during the period 23rd to 30th June 2019.
Figure A3 shows the semi-direct radiative effect differences induced by spectral nudging relaxation. In SW, at TOA, the semi-direct effect differences exhibit considerable variability on specific days of the event. Over the Iberian Peninsula, this effect decreases slightly from the 26th onward, reaching a maximum negative difference of −
. In Barcelona, significant differences are only observed on the 24th, with a peak negative value of −
. Conversely, Madrid experiences more pronounced negative differences, reaching a maximum negative difference of −
on the 26th. In contrast, El Arenosillo generally shows positive differences, peaking at +
on the same day. At BOA, similar patterns are found, with slightly larger discrepancies between the simulations, except in El Arenosillo, where the maximum observed on the 26th disappears.
In LW, at TOA, the observed differences in the semi-direct effect are smaller than in SW. Over the Iberian Peninsula, no significant changes are observed. In Barcelona and Madrid, positive differences between the simulations occur during the first half of the event, followed by negative differences in the second half. The most notable differences are discernible on the 30th and show negative values of −6.0 in Barcelona and − in Madrid. In contrast, El Arenosillo exhibits minimal differences during this period, except on the 27th, when a maximum of + is discerned.
Overall, the Iberian Peninsula shows minimal semi-direct radiative effect differences between the simulations, likely due to the large spatial averaging. In Barcelona, the slight overestimation of the SW SDRE is observed on the 24th, while the LW SDRE is overestimated on the 29th and 30th in the S-Dust-SN-All simulation compared to S-Dust-SN-Wind. However, the slight underestimation of the LW TOA SDRE is noted between the 23rd and 25th. Madrid exhibits more pronounced variations, with the overestimation of the SW SDRE from the 26th onward and the general underestimation of the LW SDRE. El Arenosillo shows the most significant discrepancies between the simulations, being the location whose observed AOD is the lowest compared to the other two Spanish AERONET stations. This site experiences the notable underestimation of the SW TOA SDRE on a particular day and the marked overestimation of the LW BOA SDRE in the final two days of the event.
To continue this analysis, the temporal averages and standard deviations of the differences between the S-Dust-SN-Wind and S-Dust-SN-All simulations of the daily semi-direct radiative effects at the three representative AERONET stations and over the Iberian Peninsula are shown in
Table A1.
Table A1.
Temporal averages and standard deviations of differences between S-Dust-SN-Wind and S-Dust-SN-All simulations of the daily semi-direct (SDRE) radiative effect (), at three representative AERONET stations, Barcelona, Madrid and El Arenosillo, and over the Iberian Peninsula, during the period 23rd to 30th June 2019.
| Location | Shortwave Spectrum | Longwave Spectrum |
|---|
| TOA SDRE | BOA SDRE | TOA SDRE | BOA SDRE |
|---|
| Barcelona | −1.1 ± 4.5 | −1.0 ± 5.3 | +1.0 ± 3.8 | −1.1 ± 3.1 |
| Madrid | −8.6 ± 12.9 | −10.1 ± 13.5 | +0.6 ± 1.7 | +4.9 ± 3.7 |
| El Arenosillo | +3.7 ± 17.5 | −3.5 ± 11.8 | +0.6 ± 1.7 | −0.5 ± 6.7 |
| Iberian Peninsula | −1.7 ± 3.3 | −1.9 ± 3.2 | +0.2 ± 0.9 | +0.2 ± 0.7 |
In
Table A1, it can be discerned how the semi-direct radiative effect obtained with the two simulations with differences in spectral nudging differs on average. The Iberian Peninsula exhibits the smallest differences between simulations, likely due to spatial averaging. In contrast, Madrid and El Arenosillo show the largest variations. In SW, Barcelona shows minor negative differences both at TOA (−
) and at BOA (−
), indicating the slight overestimation of the SDRE. Madrid experiences the largest differences between simulations in the TOA SDRE (−
) and in the BOA SDRE (−
), suggesting the significant overestimation of the S-Dust-SN-All simulation with respect to the S-Dust-SN-Wind simulation. El Arenosillo stands out with the considerable underestimation of the TOA SDRE (+
) and significant underestimation of the BOA SDRE (−
).
In LW, at TOA, all locations show the consistent underestimation of the SDRE obtained with the S-Dust-SN-All simulation with respect to S-Dust-SN-Wind. The greatest differences are found in Madrid and El Arenosillo (+). In contrast, at BOA, Barcelona and El Arenosillo show overestimation of the SDRE (−1.1 and −, respectively) and Madrid shows strong underestimation of +. Overall, Madrid and El Arenosillo show the largest variability in the SDRE, while the Iberian Peninsula and Barcelona display more stability and minor variations.
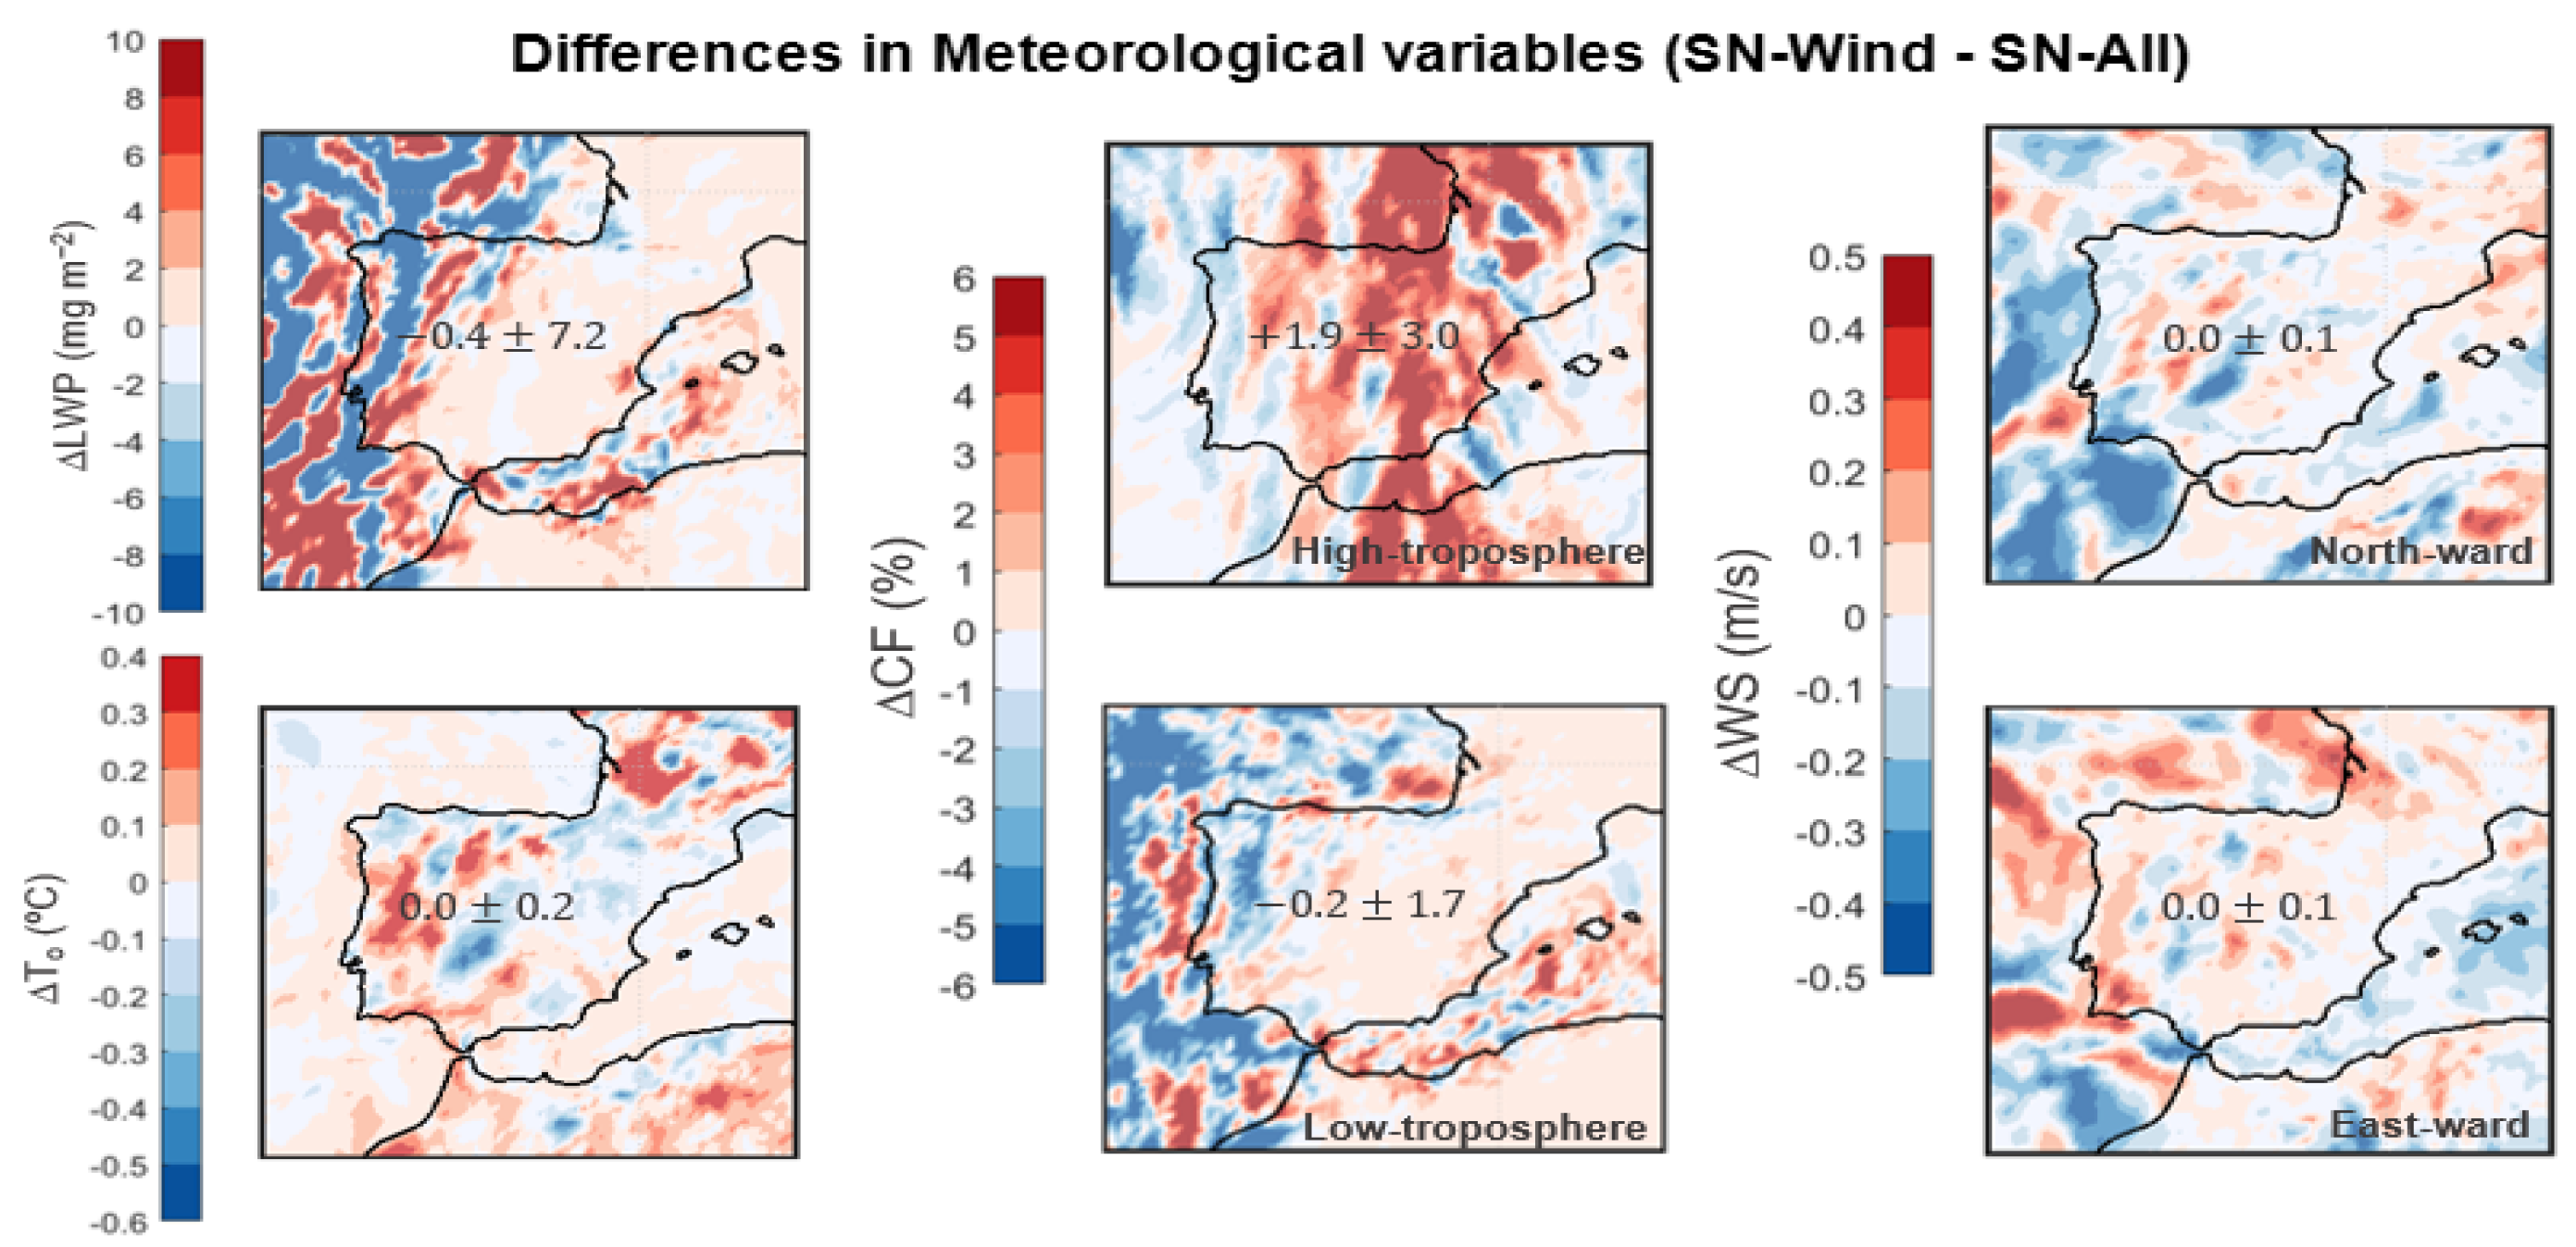
Second, the differences between the S-Dust-SN-Wind and S-Dust-SN-All simulations of the mean changes in the meteorological variables are analyzed, for the central period of the event, which covers the period from 23rd to 30th June 2019, as shown in
Figure A4.
Figure A4 shows the notable variability in the mean changes in the meteorological variables due to the relaxation of the spectral nudging, especially in the west of the Iberian Peninsula, where the dust load was lower. The differences found in the LWP between both simulations are very similar to the LWP distribution in
Figure 12. This indicates that the LWP simulated by S-Dust-SN-Wind has a similar distribution to that of S-Dust-SN-All but with a slightly larger order of magnitude. On average, a value of −0.4 mg
is obtained, indicating that the overestimation of the LWP from the simulation with the most restrictive spectral nudging led to variability in the Western Peninsula. The differences in the near-surface air temperature are also notable over the Iberian Peninsula, exhibiting negative values in the eastern and central regions and positive values in scattered locations in the west and center. On average, the near-surface air temperature differences over the Iberian Peninsula are very small, but, in some locations, they reach values higher than
C in terms of absolute values. Therefore, the S-Dust-SN-All simulation underestimates or overestimates significantly the changes in the near-surface air temperature due to the impact of dust particles.
Regarding differences in the cloud fraction changes, a strong positive difference is observed at the high troposphere, with values reaching up to +9%. This flux comes from the Cantabrian Sea and extends across the entire Iberian Peninsula, where S-Dust-SN-Wind simulates a larger increase in the cloud fraction associated with the dust particles. On average, the S-Dust-SN-All simulation underestimates the increase in cloud fraction by −1.9% over the Iberian Peninsula. In the lower troposphere, the cloud fraction differences are generally positive and weak, except in the Western Peninsula, where strong negative differences dominate in this area. On average, the S-Dust-SN-All simulation overestimates the low-troposphere cloud fraction by +0.2%. In terms of the near-surface wind speed, the mean difference between the two simulations over the Iberian Peninsula is very minimal, due to the large variability between positive and negative values. However, in certain locations, the differences reach values of −6 m/s for the northward component and ±0.5 m/s for the eastward component.
Figure A4.
Spatial distribution of differences between S-Dust-SN-Wind and S-Dust-SN-All simulations of the average changes in meteorological variables, namely the liquid water path (LWP), near-surface air temperature (), cloud fraction (CF) at high troposphere (HCF) and low troposphere (LCF) and near-surface wind speed (WS) northward (VAS) and eastward (UAS) components, over the Iberian Peninsula, during the period 23rd to 30th June 2019. In the center of each graph, we show the average value and standard deviation of the radiative effect associated with the Iberian Peninsula.
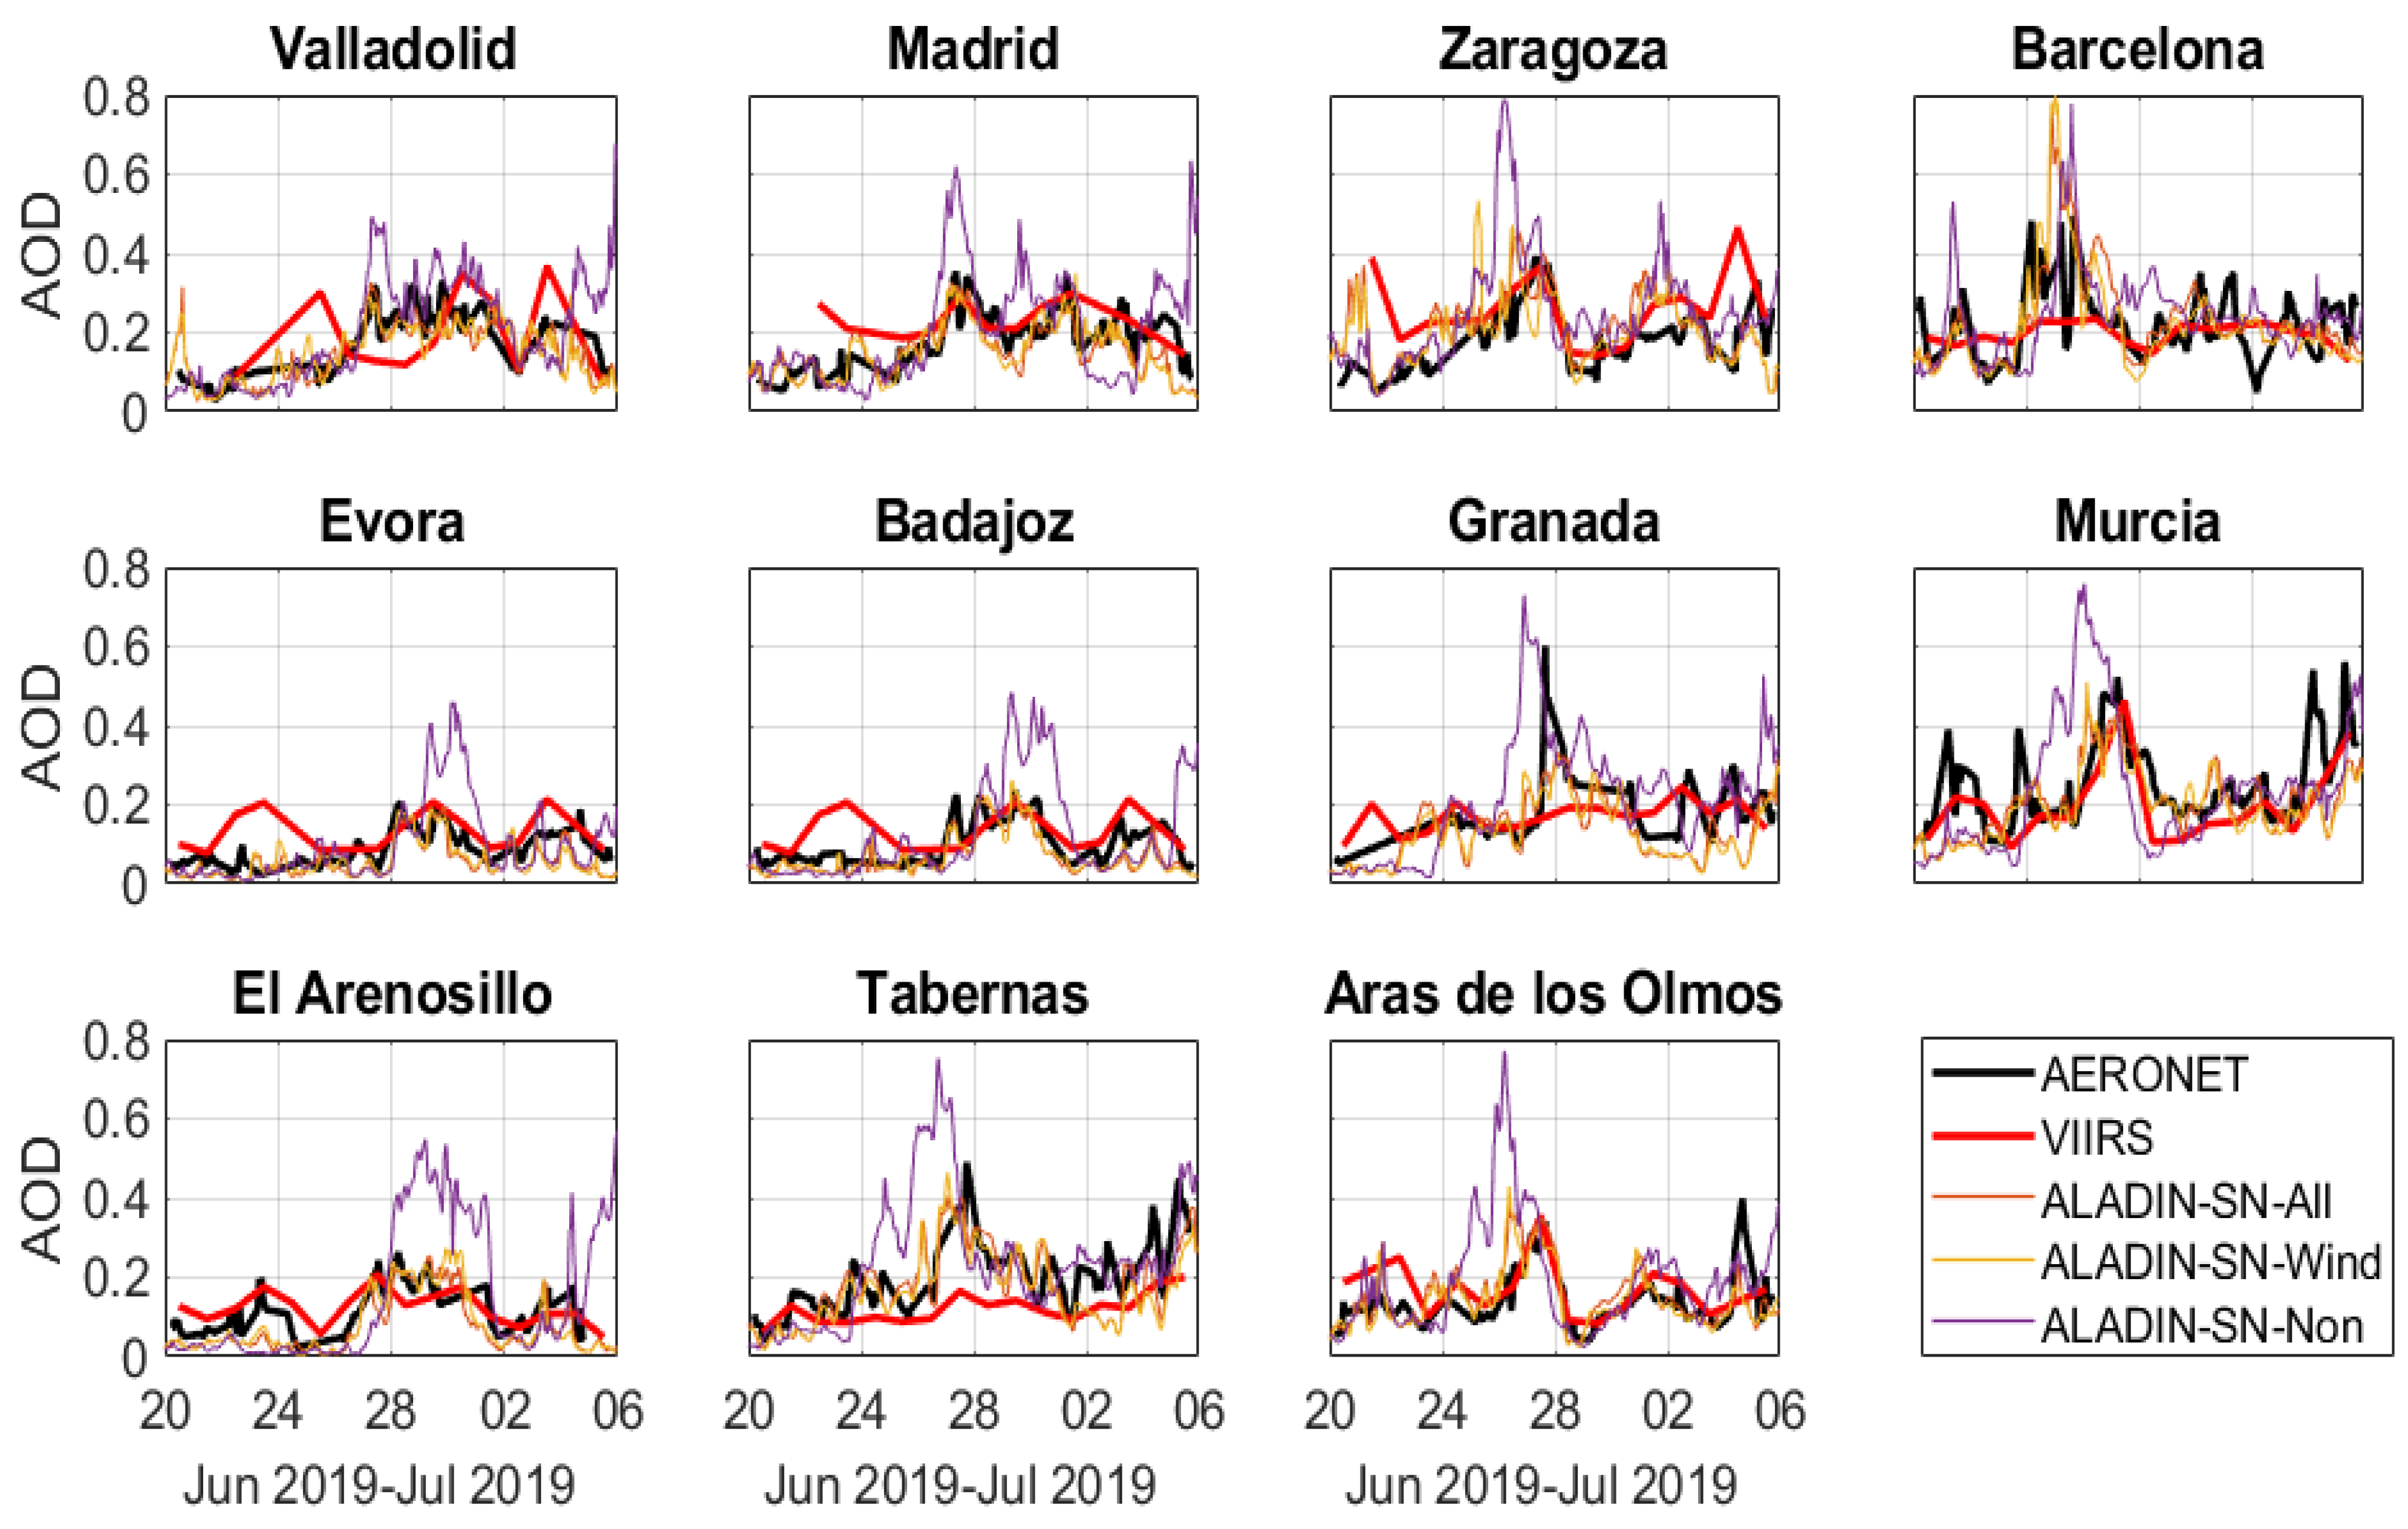
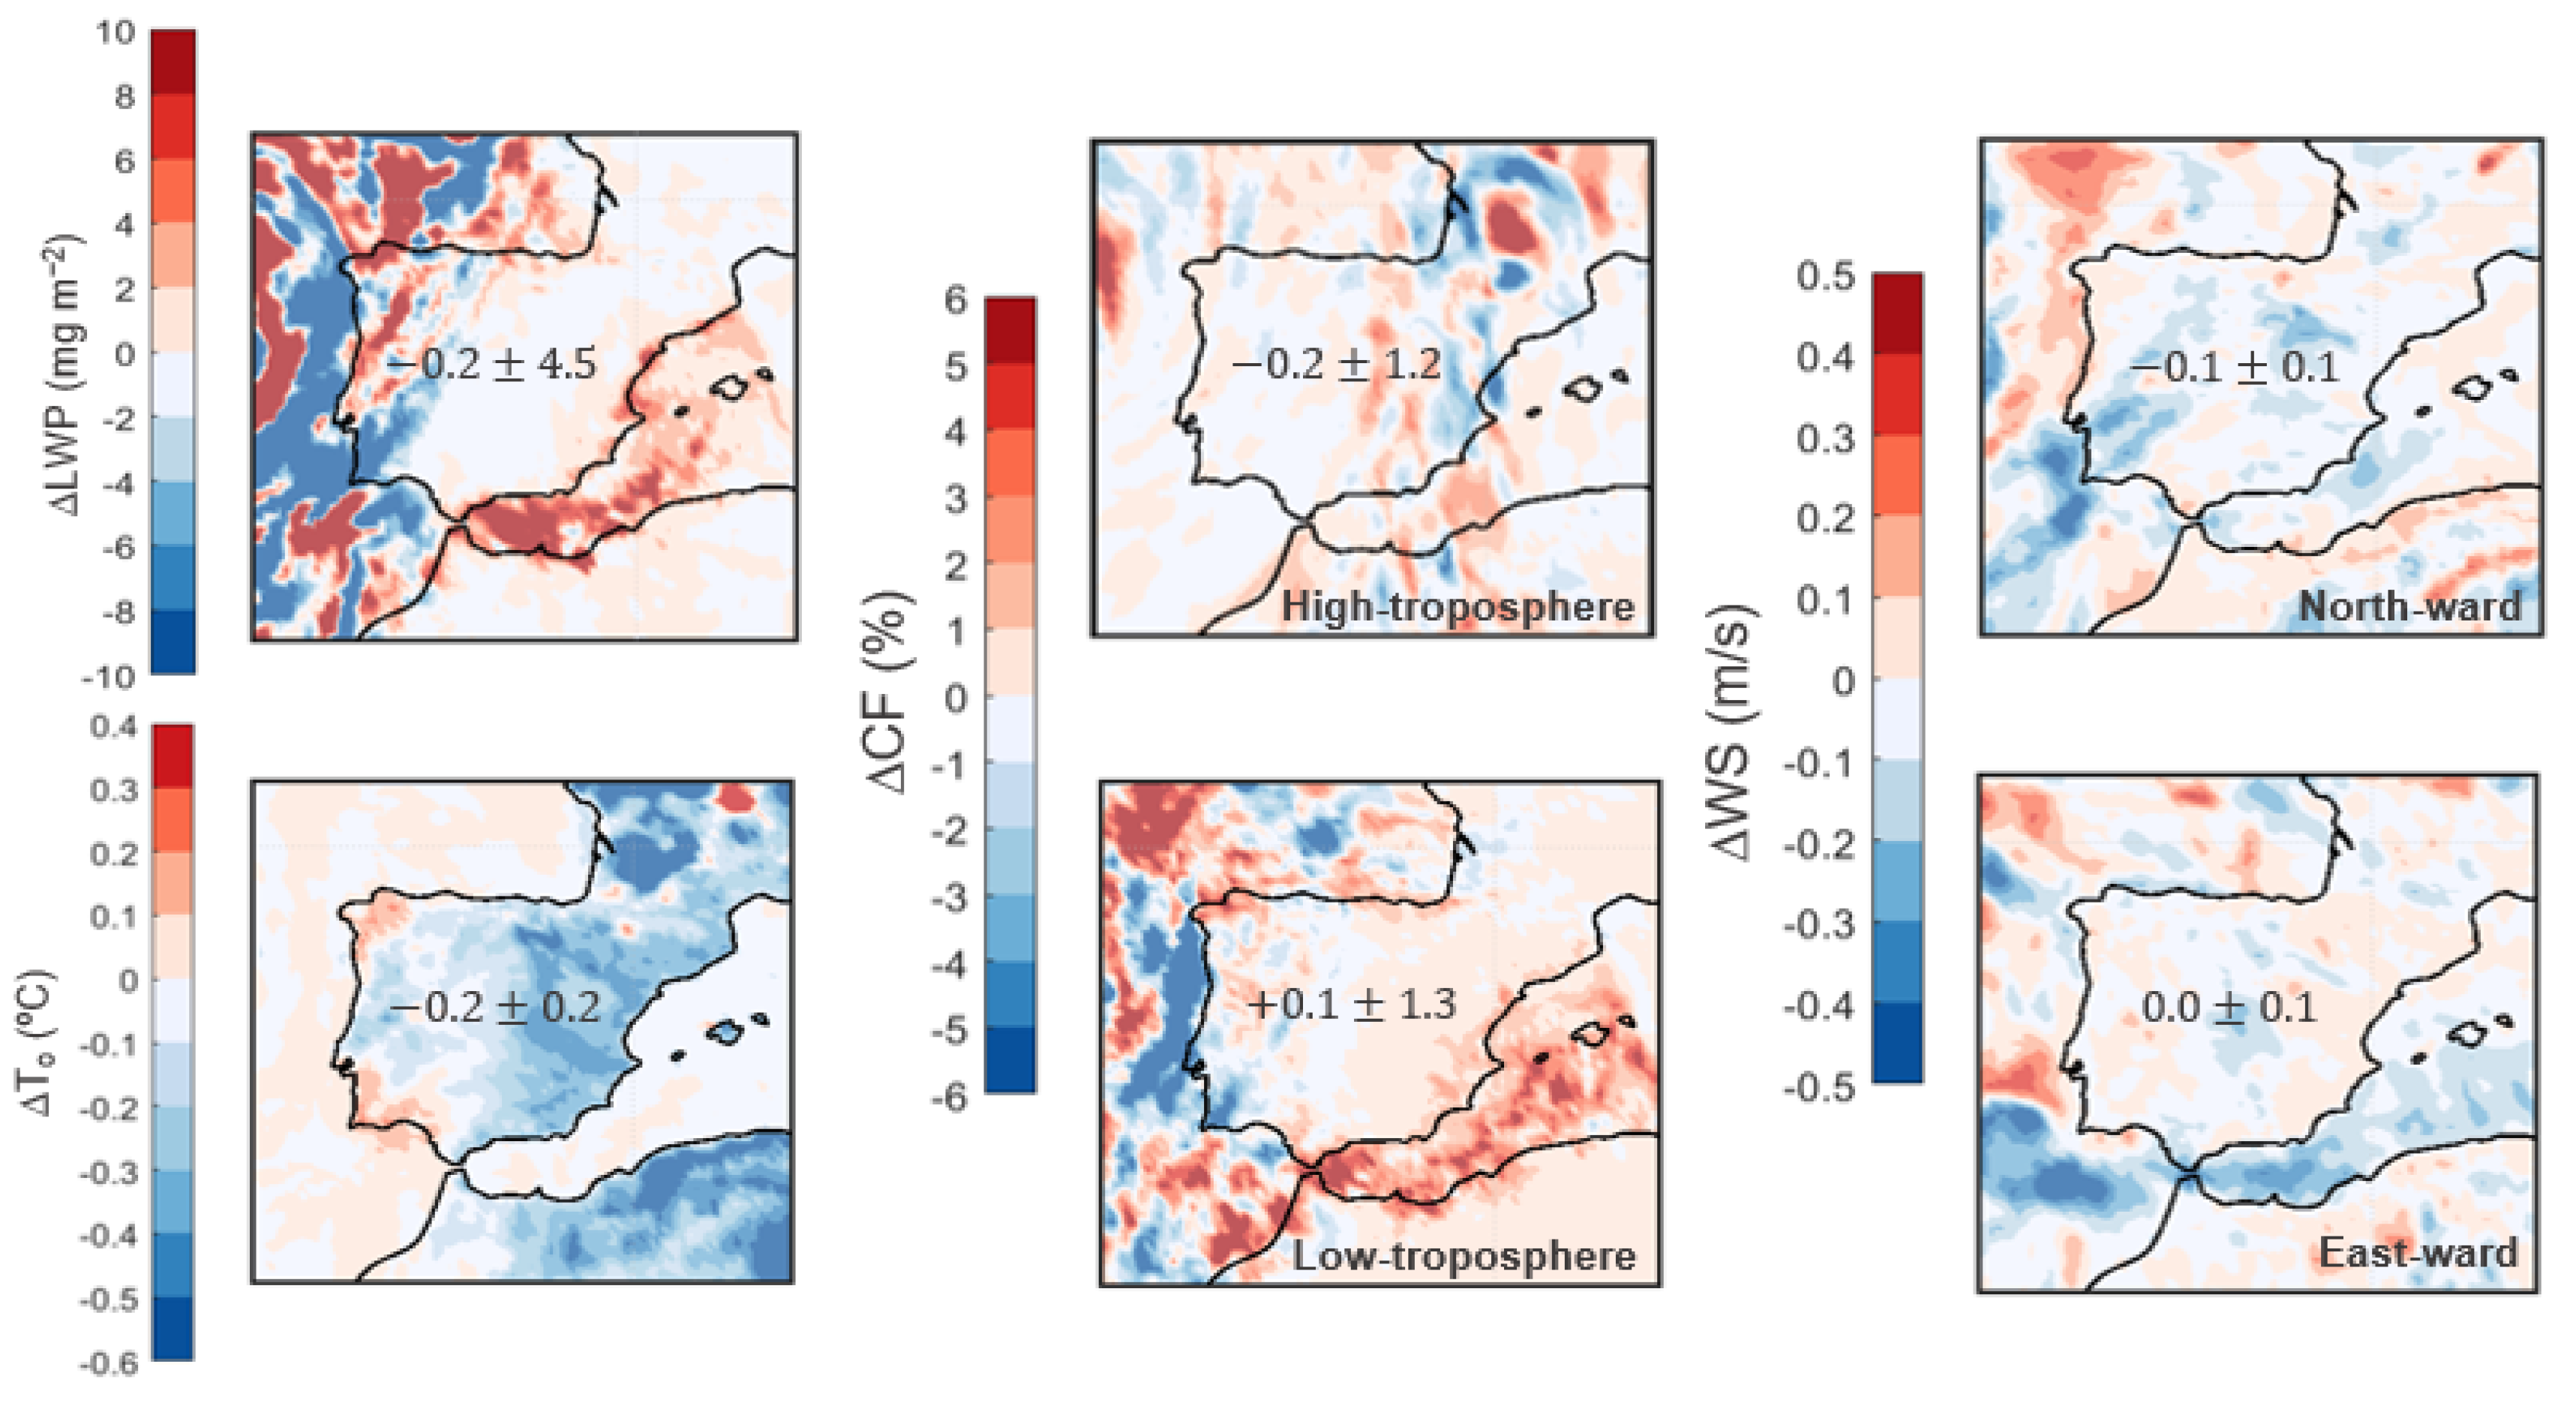
For further discussion, the temporal distribution of the differences between both simulations of the daily changes in the meteorological variables are analyzed over the Iberian Peninsula and at three representative AERONET stations, Barcelona, Madrid and El Arenosillo, as shown in
Figure A5.
Figure A5 shows how the meteorological variables change when relaxing the spectral nudging. Over the Iberian Peninsula, no large differences in LWP are observed between the simulations. Barcelona and Madrid experience an increase in LWP when considering the S-Dust-SN-Wind simulation, with maxima of +9.8 mg
on the 25th in Barcelona and +4.3 mg
on the 26th in Madrid. In contrast, El Arenosillo shows positive and negative fluctuations depending on the day, reaching a maximum negative difference of −16.2 mg
on the 26th. The near-surface air temperature generally experiences a decrease when considering the S-Dust-SN-Wind simulation, with large variability. The largest differences between the simulations show values of −
C on the 28th in Barcelona and −
C on the same day in Madrid. On the contrary, El Arenosillo exhibits a temperature increase when relaxing the spectral nudging during the 26th to 29th, peaking at +
C.
Cloudiness is also affected by relaxing the spectral nudging of the simulations. At the high troposphere, very different patterns are found at different locations. Over the Iberian Peninsula, a notable increase in cloudiness is observed, reaching a maximum difference of +6.7%. Barcelona shows an increase in the high-troposphere cloud fraction of +5.7% on the 24th and a sharp decrease of −16.1% on the 30th. Madrid exhibits considerable cloud cover, reaching a maximum of +17.6% on the 26th. In contrast, El Arenosillo shows negative differences in the high-troposphere cloud fraction, peaking at −8.5% on the 29th. At the low troposphere, the differences in the cloud fraction between the simulations are very small, except for El Arenosillo. This site shows very strong fluctuations on the 26th and 27th, reaching a minimum of −29.4% and a maximum of +17% on consecutive days.
Figure A5.
Temporal distribution of differences between S-Dust-SN-Wind and S-Dust-SN-All simulations of the daily changes in meteorological variables, namely the liquid water path (LWP), near-surface air temperature (), cloud fraction (CF) at high troposphere (HCF) and low troposphere (LCF) and near-surface wind speed (WS) northward (VAS) and eastward (UAS) components, over the Iberian Peninsula and at three representative AERONET stations, Barcelona, Madrid and El Arenosillo, during the period 23rd to 30th June 2019.
Turning to the near-surface wind speed, differences between the simulations are also discernible at all locations except over the Iberian Peninsula. Barcelona does not experience large changes in the northward wind component except on the 29th and 30th, with a maximum of +0.13 and a minimum of −0.28 m/s. Madrid shows slightly more accentuated generally negative differences, reaching a maximum negative difference of −0.27 m/s on the 27th. El Arenosillo exhibits sharp fluctuations during this period, reaching a maximum positive difference between simulations of +0.54 m/s on the 25th and a maximum negative value of −0.61 m/s on the 29th. In the eastward component, smaller differences are observed at all locations. Barcelona shows a slight increase in the first half of the event and a decrease in the second half, with a maximum in each interval of +0.2 and −0.3 m/s, respectively. Madrid shows larger variations, and the maximum difference between simulations is +0.21 m/s on the 28th. El Arenosillo shows a general decrease in the near-surface wind speed from the 24th to the 27th, with a maximum negative difference of −0.34 m/s.
The relaxation of spectral nudging affects the meteorological variables differently across locations. Barcelona and Madrid show moderate differences, with the LWP and high-troposphere cloud fraction generally underestimated with the S-Dust-SN-All simulation, while the near-surface air temperature and wind speed exhibit minor variations. In contrast, El Arenosillo experiences the strongest and most abrupt fluctuations, particularly in the LWP, cloud fraction and near-surface wind speed, with sharp overestimations and underestimations depending on the day. These results highlight the high sensitivity of El Arenosillo to the change in spectral nudging compared to other locations.
To conclude the analysis, the temporal distribution of the differences between the S-Dust-SN-Wind and S-Dust-SN-All simulations of the daily changes in the meteorological variables is examined, at the three representative AERONET stations—Barcelona, Madrid and El Arenosillo—and over the Iberian Peninsula, as summarized in
Table A2.
Table A2.
Temporal averages and standard deviations of the daily changes in meteorological variables, namely the liquid water path (LWP), near-surface air temperature (), cloud fraction at high troposphere (HCF), cloud fraction at low troposphere (LCF) and near-surface wind speed northward (VAS) and eastward (UAS) components, at three representative AERONET stations, Barcelona, Madrid and El Arenosillo, and over the Iberian Peninsula, during the period 23rd to 30th June 2019.
| Location | Meteorological Variable |
|---|
| LWP (mg ) | (°C) | HCF (%) | LCF (%) | VAS (m/s) | UAS (m/s) |
|---|
| Barcelona | +1.8 ± 3.4 | 0.0 ± 0.2 | −0.7 ± 6.5 | −0.4 ± 0.9 | 0.0 ± 0.1 | 0.0 ± 0.2 |
| Madrid | +0.4 ± 1.7 | −0.1 ± 0.2 | +6.5 ± 10.4 | 0.0 ± 0.0 | −0.1 ± 0.1 | 0.0 ± 0.2 |
| El Arenosillo | −1.7 ± 7.8 | +0.1 ± 0.3 | −1.4 ± 3.2 | −1.0 ± 13.9 | −0.1 ± 0.4 | −0.1 ± 0.2 |
| Iberian Peninsula | −0.3 ± 1.1 | 0.0 ± 0.1 | +2.4 ± 2.8 | −0.2 ± 0.9 | 0.0 ± 0.0 | 0.0 ± 0.0 |
In
Table A2, it can be discerned how the variations in the meteorological variables with the two simulations with differences in spectral nudging differ on average. In terms of LWP, Barcelona and Madrid experience slight increases, with Barcelona showing the highest positive average difference (+1.8 mg
). In contrast, El Arenosillo exhibits the most pronounced variability and an average negative difference (−1.7 mg
). The near-surface air temperature remains largely unchanged, with a slight negative difference in Madrid (−
C) and a minor positive value in El Arenosillo (+
C). Regarding the cloud fraction at high troposphere, Madrid stands out with the most significant positive difference (+6.5%), while El Arenosillo shows a small negative value (−1.4%). At low troposphere, El Arenosillo again displays the strongest response, with an average negative difference and high variability (−1.0 ± 13.9%), whereas Barcelona and Madrid remain mostly unchanged. The wind speed changes are minor across locations. The northward component difference has a slightly negative value in Madrid and El Arenosillo (−0.1 m/s), while Barcelona and the Iberian Peninsula show no significant variations. Similarly, the eastward component remains nearly unchanged at all locations (−0.1 to 0.0 m/s).
Overall, the meteorological differences between the simulations are most evident in El Arenosillo, where the fluctuations are sharper and more pronounced, particularly in the LWP, LCF and near-surface wind speed. Meanwhile, Barcelona and Madrid exhibit more stable conditions, with Madrid experiencing notable underestimation in the S-Dust-SN-All simulation for the high-troposphere cloud fraction. Over the Iberian Peninsula, the average impact of spectral nudging is minimal, with small reductions in the LWP and LCF and a slight increase in the HCF.


 ,
, 


