Abstract
The degradation of subarctic peatland ecosystems under climate change impacts surrounding landscapes, carbon balance, and biogeochemical cycles. To assess these ecosystems’ responses to climate change, it is essential to consider not only the active-layer thickness but also its thermo-hydraulic conditions. Ground-penetrating radar is one of the leading methods for studying the active layer, and this paper proposes systematically investigating its potential to determine the thermal properties of the active layer. Collected experimental data confirm temperature hysteresis in peat linked to changes in water and ice content, which GPR may detect. Using palsa mires of the Kola Peninsula (NW Russia) as a case study, we analyze relationships between peat parameters in the active layer and search for thermal gradient responses in GPR signal attributes. The results reveal that frequency-dependent GPR attributes can delineate thermal intervals of ±1 °C through disperse waveguides. However, further verification is needed to clarify the conditions under which GPR can reliably detect temperature variations in peat, considering factors such as moisture content and peat structure. In conclusion, our study discusses the potential of GPR for remotely monitoring freeze–thaw processes and moisture distribution in frozen peatlands and its role as a valuable tool for studying peat thermal properties in terms of permafrost stability prediction.
1. Introduction
The active layer is the seasonally frozen and thawed zone between the ground surface and the permafrost table, where dynamic processes take place. Estimated active-layer thickness (ALT) is a key indicator of permafrost dynamics and serves as an important metric for monitoring potential climate change [1,2,3]. Spatial heterogeneity in the ALT is a common feature of all subarctic regions [4]. Northern frozen peatlands are a critical component of the cryosphere. Permafrost degradation in peatlands leads to landscape transformation, hydrological shifts, vegetation changes, and disruptions to biogeochemical and carbon cycles [5,6,7]. To assess the responses of northern frozen peatlands to climatic and cryospheric changes, the properties of their active layer must be examined, as multiple factors, including moisture and temperature, affect ALT variability [8,9]. This variability stems from the complex interplay of moisture and temperature conditions in frozen peatlands [10]. While some studies suggest relatively low sensitivity of ALT to water content under constant environmental conditions [11], other research shows that peat’s thermal conductivity and high water content provide thermal insulation, enhancing permafrost preservation [12]. The temperature regime of frozen peatlands is also shaped by additional climatic factors. For instance, air temperature controls active-layer thawing, while snow depth further modulates soil temperature [13]. Research on frozen peat plateau complexes has revealed variability in ground thermal regimes depending on micro-landscape conditions and snow cover [14]. Given the high relevance of these dynamics, new methods for investigating the thermal field of the active layer are being developed. Innovations such as distributed temperature profiling [15] aim to provide high-resolution soil temperature data in discontinuous permafrost environments.
An important aspect of the problem under consideration is the influence of temperature on greenhouse gas emissions from peatlands. A study by Wilson et al. [16] demonstrated that warming in the upper layers of northern peatlands enhances methane production. Similarly, carbon dioxide emissions are influenced by both peatland temperature and freeze–thaw cycles (FTCs) [17]. New approaches are being developed to study soil thermo-hydraulic behavior using soil probe systems, which also help validate satellite observations [18,19,20,21]. However, deploying these systems in remote areas or under conditions of sharp soil parameter changes faces logistical challenges. Therefore, a method capable of detecting even qualitative temperature changes in the active layer of frozen peatlands would be valuable for defining monitoring reference points. Ground-penetrating radar (GPR) is a remote sensing method that offers a possible solution for this task. GPR signal propagation is governed by complex permittivity and electrical conductivity of soils—parameters that most soil probes also measure. GPR has already proven effective in studying the thickness and moisture content of the active layer, which often has spatial and vertical heterogeneity [22,23,24,25,26,27]. At present, GPR is used to validate permafrost probability maps, assess permafrost variability, and analyze the relationship between landscape features and permafrost conditions [28,29]. Additionally, long-range GPR surveys serve as a tool for evaluating the stability of permafrost-affected infrastructure and identifying potential hazards [30,31]. Another modern challenge that can be solved by GPR is the remote detection of FTCs and water redistribution in the active layer. Several studies show the feasibility of such an approach. For instance, researchers have statistically established a relationship between thermal fields and electromagnetic signal attenuation [32,33]. The study of thermal properties of soils under artificial freezing revealed GPR pulse reflections on freezing fronts [34], whereas Steelman et al. [35] reported the ability of GPR to monitor shallow freeze–thaw events, which create thin dispersive waveguides in the wavefield. The high sensitivity of GPR to FTC enable non-invasive temporal monitoring [36]. Further evidence comes from engineering surveys in seasonal permafrost zones, where GPR attributes were found to correlate with soil temperature [37,38,39]. Based on this evidence, we can assume physical prerequisites exist for detecting variability in peat’s thermal properties through GPR wavefield analysis. To investigate this, we combined field data on thermo-hydraulic parameters of the active layer with GPR data from subarctic peatlands. Our aim was to identify and validate GPR attributes that could highlight temperature gradient changes within the active layer’s peat. To accomplish this, we employed a systematic approach consisting of laboratory investigations of peat FTCs, parametric measurements of peat properties in situ, and finally, GPR surveys of subarctic palsa mounds followed by attribute analysis.
2. Study Site
To comprehensively investigate variations in peat parameters within the active layer, we conducted studies at three subarctic peatlands on the Kola Peninsula (NW Russia). Fieldwork was performed during June–July in both 2023 and 2024. In 2023, the mean summer air temperature was 12.5 °C with 159 mm of precipitation, and these values were 14.4 °C and 228 mm in 2024. Our primary research site was the Lovozero palsa mire (68.0119°N, 35.0841°E), located at the boundary of sporadic permafrost distribution (Figure 1). This large mire system includes alternating flat palsa complexes and flarks [40]. The palsa mounds, characterized by complex shapes with heights ranging from 0.7 to 1.2 m (up to 2.0 m), exhibited ALT variations between 20 and 60 cm depending on seasonal conditions. Our data indicate that the thickness of permafrost in the mounds can vary from 0.7 to 2.6 m. The Lovozero mire is particularly interesting for monitoring because it contains both relatively stable flat palsas and collapsing formations, providing valuable variability in permafrost conditions and peat parameters. Previously, Rönkkö and Seppälä [41] noted that ALT correlates with mound height and erosion degree. The peat deposit thickness across the mire varied from 0.8 to 2.6 m, underlaid by sand and sandy loam deposits. The active-layer composition transitioned from Ericales or Sphagnum fuscum peat at the surface to Eriophorum–Carex–Equisetum transition mire and fen peat in deeper layers.
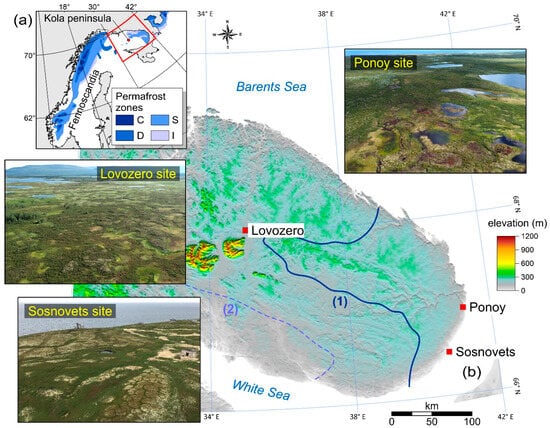
Figure 1.
Panel (a): Location of the Kola Peninsula relative to the Circum-Arctic Permafrost Map [42], with permafrost zones indicated as C—continuous, D—discontinuous, S—sporadic, and I—isolated patches. Panel (b): Study sites on regional DEM GMTED2010 [43] showing (1) the southern boundary of frozen peatlands and (2) the southern boundary of frozen mineral soils [44], with insets displaying aerial photographs of each site.
Our second study site, Ponoy (66.9563°N, 41.2255°E), is located in the sporadic permafrost zone (Figure 1). Here, palsa mounds initially exhibited flat, isometric shapes with heights of 1.5–2 m, though these features have undergone significant transformation through permafrost thaw, collapse, and peat weathering. We documented intensive degradation phenomena, including collapse features and thermokarst pond formation. The underlying mineral bed consisted of clay lake sediments overlying basal till. Summer ALT measurements ranged from 20 to 40 cm. Vegetation showed distinct zonation: palsa surfaces supported shrub–lichen communities, while thermokarst-affected areas and hollows between mounds developed sphagnum moss, cotton grass, and sedge communities partially sustained by thaw water. Our investigations focused on the best-preserved palsa mound at this site.
The final study site, Sosnovets, is located on Sosnovets Island (66.4833°N, 40.6833°E), covering approximately 40.6 ha in the White Sea’s northern sector off the Kola Peninsula. Most of the island contains relatively dry peat bogs with depths ranging from 1 to 2.5 m. Permafrost occurs nearly ubiquitously within the peat, forming a continuous peat plateau. Our field measurements indicated a seasonal ALT of 40–60 cm. The site’s geomorphology is characterized by mound tops and gentle elevations fractured into 1–10 m2 polygonal blocks by desiccation cracks, interspersed with well-branched drainage hollows. Between these hollows, palsa peat mounds reach heights up to 2 m. Notably, we observed no palsas showing erosion or degradation, suggesting exceptional permafrost stability. Our investigations focused on a palsa mound.
Northern peatlands represent important monitoring targets due to their sensitivity to external influences and rapid degradation potential [45]. Such research objects are particularly relevant given bioclimatic models projecting that Fennoscandia (including the Kola Peninsula) may become climatically unsuitable for sustaining frozen peatlands in the medium-term future [46,47]. Supporting this concern, previous studies at the Lovozero site reported active-layer heterogeneity across palsa mounds, driven by both climatic factors and uneven permafrost degradation [48].
3. Materials and Methods
Our experimental design comprised three distinct stages employing different research methodologies. Stage 1: Laboratory Analysis. We conducted laboratory studies using peat samples collected from the active layer of the Lovozero site. The peat in the active layer of all examined palsas exhibited characteristic features—low density and minimal decomposition. Thus, we considered the samples from the Lovozero site sufficiently representative for describing the entire set of study objects. To determine the relative complex dielectric permittivity (εr, in a.u.) and electrical conductivity (σ, in mS/m)—key parameters GPR signal transmission—we employed time domain reflectometry method (TDR) with a TDR200 reflectometer and CS635 probe (Campbell Scientific, Inc., Logan, UT, USA). Temperature was monitored using a 107L temperature sensor, with measurements recorded by a CR800 datalogger (Campbell Scientific, Inc., Logan, UT, USA). Peat samples were prepared by homogenization and uniform moistening before being placed in polypropylene cylindrical cells (25 cm height × 11 cm diameter). This size minimized boundary effects from the container walls. Samples underwent FTC in a temperature-controlled chamber, cycling between −15 °C and 20 °C over 24 h periods, with logging performed at 3 min intervals. All sensors were calibrated according to standard Campbell Scientific protocols prior to measurement. Peat moisture content was determined gravimetrically using an EVLAS-2M analyzer (Sibagropribor, Krasnoobsk, Russia) before and after each experiment. This allowed us to quantify variations in peat’s electrophysical properties under freeze–thaw conditions at different moisture levels based on an established understanding of palsa peat’s characteristics [49].
Stage 2: Field Measurements. Field data collection focused on active-layer peat parameters at the Lovozero site. We excavated trial pits along palsa mounds and measured εr and σ at 5 cm depth intervals using the TDR200 system with a CS635 probe. With ALT 25 ± 4 cm (n = 41) in mid-June, we obtained 5 measurements per pit. This approach eliminated uncertainties associated with moisture content estimation. Concurrent measurements included temperature (T, °C), determined using an LT-300 precision thermometer (Termex, Tomsk, Russia), and thermal conductivity coefficient (λ, W/m·K), measured with a portable MIT-1 m and thermal needle probe (Interpribor, Chelyabinsk, Russia). Thermal conductivity was determined by recording the cooling of the probe over a certain period of time—7 min. Previous studies have established a functional relationship between TDR measurements and temperature sensor data in field-based soil monitoring [50]. In addition, an approach for combining TDR and a thermal sensor for determining the ice content in soils was used [51]. For hydraulic characterization, we collected intact 10 × 10 cm peat samples from the active layer to determine bulk density (ρ in g/cm3), porosity (φ in %), water saturation coefficient (Sr, in a.u.), and organic content. The soil ρ was measured using the cutting ring method; φ was then derived from the density measurements. The Sr coefficient was calculated as the ratio of the natural soil moisture content to the moisture content at full water saturation. And organic matter content was measured by the calcination method (ignition loss) at constant mass. In total, we examined the active layers of 7 palsas plus one control point from permafrost-free flark. The dataset was analyzed to determine compliance with existing patterns and identify correlation links between peat parameters.
Stage 3: GPR Survey and Analysis. In this final stage, we conducted GPR surveys along lines crossing palsa mounds, incorporating known temperature distribution data from the active layer. To examine diverse conditions, we collected data from three distinct sites: Lovozero, Ponoy, and Sosnovets. We obtained field records using OKO-2 GPR equipment with an antenna unit with a central frequency of 400 MHz (Geotech LLC, Moscow, Russia). Based on the expected GPR velocities in peat (4–6 cm/ns) and the corresponding wavelengths (10–20 cm), accounting for the frequency shift in the subsurface, we assumed a vertical GPR resolution of Δr = 2.5–5 cm [52]. The GPR tracks were recorded every 5 cm with a time sweep of 200 ns and 16 stacks. Data processing was performed using CartScan software ver. 45 (Geotech LLC, Moscow, Russia). We did not filter the raw data to preserve the original frequency spectrum. We expected that if subzero temperatures caused ice formation in the peat, this would affect the dynamic attributes of the GPR signal. Kinematic attributes primarily allow us to estimate variations in GPR signal propagation velocity. In the study of the active layer, these attributes are largely controlled by its moisture content. On the other hand, dynamic parameters show variability in the reflective and absorptive properties of the geological medium. Time domain attributes (such as amplitude and coherence) are related to reflector continuity and response stability. However, under real conditions, the permafrost boundary in the palsa is not uniform in depth, which also controls the distribution of moisture. This results in inconsistent GPR signal travel times, which in turn affect the amplitude of the reflections. As a result, the reflected pulse has a high amplitude due to the contrast of the permittivity of wet peat and permafrost but varies laterally. Additionally, vegetation cover on the palsa impacts the amplitude of echo signals. At the mound’s top, lichens dominate, allowing the antenna unit to maintain close contact with the surface. However, shrubs along the edges elevate the antenna, causing additional nonlinear GPR signal scattering. Fissures in the peat and lateral areas of groundwater may also distort GPR recordings [27].
For temperature gradient studies, we hypothesized that the focus should be on identifying thin layers with subtle or absent interfaces. As noted by Annan [52], instantaneous frequency serves as a reliable indicator of thin stratigraphic layers that selectively respond to the incident signal’s spectrum. Moreover, spectral composition shifts can occur due to reflection from thin-layered or gradient media [53]. Given the active layer’s structure, we prioritized the analysis of frequency domain attributes. Therefore, we employed the attribute analysis module in CartScan [53], which utilizes fast Fourier transform for spectral attribute computation. Specifically, we examined three key parameters to identify temperature gradient effects on the wavefield: normalized spectrum area (Sn) [Equation (1)], weighted average frequency (Ff) [Equation (2)], and Q-factor [Equation (3)]. These parameters characterize frequency shifts and attenuation of the GPR signal in the subsurface [47]. The following formulas were used to calculate such attributes:
where Ai is the spectral amplitude for the i harmonic; fi is the spectral frequency for the i harmonic; Amax is the maximum spectral amplitude; fmax is the spectral frequency corresponding to the maximum spectral range; and fR and fL are the right and left frequencies limiting the area of influence with a level of 0.7 from the maximum.
Our studies were conducted in different conditions: in the marginal part of the palsa mound, in the transition area from the mound to the flark, on one mound at the beginning and middle of the warm season, on one mound at the degrading edge, and in the stable central part (Figure 2). To identify the influence of the thermal field on the dynamic attributes of GPR, we measured the peat temperature with an LT-300 thermometer and compared it with the corresponding point in space on GPR cross-sections. We focused on identifying characteristic GPR signatures rather than quantitative matches. Therefore, we focused on searching for GPR patterns that could indicate abrupt thermal transitions within the active-layer peat.
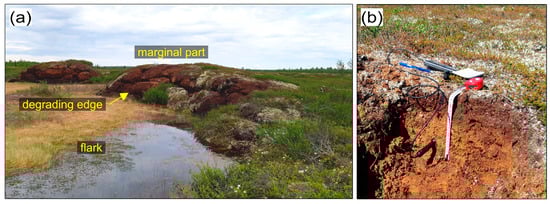
Figure 2.
Photographs of the degrading palsa mound indicating the areas under study (a) and the process of measuring the active-layer peat (b).
4. Results
4.1. FTC and Relative Permittivity
Analysis of the peat’s electrophysical parameter variability revealed that in moist conditions, its εr (and consequently GPR velocity) can vary more than fivefold (Figure 3). During FTCs, we observed hysteresis in εr behavior because of changes in the content and thermal state of the pore water. The hysteresis phenomenon has long been recognized in the FTCs of soils [54]. This effect, described as typical for peat, has been discussed in sufficient detail from the point of view of volumetric moisture content (VWC) in a series of studies [55,56]. The observed hysteresis stems from pore water phase transitions according to the thermal regime and the dynamic ice-to-liquid water ratio in peat pore space. Hysteresis intensity was primarily a response to the total moisture, becoming noticeable when gravimetric water content (GWC) decreased from 73% to 31%. We noted that sample preparation (including peat crushing) introduced systematic shifts in εr measurements compared to field observations, consistent with known structural and bulk density effects on dielectric properties [57,58].
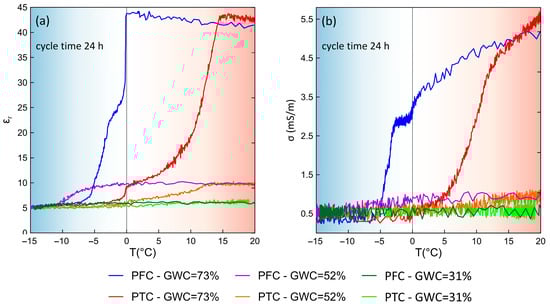
Figure 3.
PFC and PTC thermal hysteresis graphs for relative dielectric permittivity (a) and electrical conductivity (b) parameters obtained from TDR data.
The peat freezing cycle (PFC) graph in the most water-saturated state demonstrated constant εr values at positive temperatures and a sharp decrease from 43 at 0.0 °C to 26 at −0.8 °C. Further, the PFC gradually moved to a stable εr = 6.0 at −7.0 °C. The peat thawing cycle (PTC) looks somewhat different: starting at −15.0 °C, εr slowly increases, and in the range of −1–0 °C, it makes a jump from 6.5 to 9, after which it begins to grow uniformly in the temperature range of 0–14.5 °C. With a decrease in GWC of 21%, we observed a similar pattern against the background of a general decrease in the εr level. However, the sharp phase transitions near −1 °C disappeared. The change in εr occurred more smoothly. With PFC in the temperature range from −10 to 0 °C, εr decreased from 6.0 to 9.8, whereas for PTC, εr increased from 6.0 to 9.7 in the range from 0.0 to 12.4 °C. With a decrease in GWC by another 21% under normal conditions, the εr of peat decreased to 6.1 because the remaining water was in a bound state. However, the hysteresis remained, starting at about 6.4 °C, and the value of εr was about 1. The measurements for σ reflected the nature of the changes in εr, and this emphasized the general cause of the change in the electrophysical properties of peat. However, the general noise in the σ data makes them difficult to analyze at low GWC values.
Our experimental results showed that during seasonal transitions, when the active layer undergoes freezing and thawing, the εr of peat at the permafrost interface could vary significantly—by several folds—depending on the ice content in peat. This effect required high-moisture conditions as a prerequisite. In contrast, drier peat maintained more stable εr values with minimal temperature factor dependence. In addition, our findings indicated that the temperature range from −5 to 5 °C was critically important. We defined the range of ±5 °C as the temperature interval characterizing non-stationary peat behavior, where εr exhibited instability before, during, and after water phase transitions. This range provided the greatest electrophysical contrast, which was detectable by GPR. Obviously, the zones with such conditions primarily occupied the lower part of the active layer and the uppermost permafrost table. It should also be noted that peat exhibits stronger hysteresis (greater εr variation range) than mineral soils.
4.2. Variability of Peat Parameters
Sample data of active-layer peat measurements collected at the Lovozero site are presented in Figure 4. Since the active layer exhibited natural variations, we calculated average values, the trend of which emphasized the main patterns of change in peat properties at depth. Three peat intervals were most clearly distinguishable in the graphs. The first interval spanned a depth range of 0–15 cm. It was characterized by a smooth increase in εr (from 21 to 37), a decrease in T (from 6.1 to 2.3 °C), and an increase in λ (from 0.31 to 0.55 W/m·K). The smallest change was recorded for σ (from 2.0 to 2.4 mS/m). This layer was probably composed of relatively dry and loose peat typical of frozen peatlands, which plays an important thermal insulation role in maintaining permafrost stability [49]. As well, our data further corroborated the lower thermal conductivity of peat compared to that of mineral soils [59]. A similar dry layer was also observed in non-permafrost flark, though its thickness was typically 5 cm less. The next layer, approximately 5 cm thick, was wetter, as specified by an εr of ~38. The temperature gradient in this layer decreased to 1.3 °C, while σ and λ remained stable at 2.35 mS/m and 0.55 W/m·K, respectively. These observations suggested higher moisture content in this layer, likely because of seasonal ground ice melt. Below this, at depths of 20–25 cm, T declined more gradually (from 0.9 to 0.1 °C). Concurrently, εr decreased (from 38 to 32) and σ declined (from 2.35 to 2.0 mS/m), whereas λ increased to 0.62 W/m·K. These parameter shifts represented a transitional layer containing both frozen and premelted water.
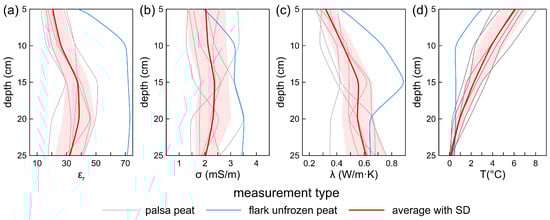
Figure 4.
Variations in (a) relative permittivity, (b) electrical conductivity, (c) thermal conductivity, and (d) temperature within the active-layer peat of palsa in the Lovozero site.
The vertical stratification of peat that we observed persisted even as the active layer thickened during the warm season. To demonstrate this, we conducted measurements at a single mound location in June and July (Figure 5). The εr depth profiles exhibited similar patterns, with a particularly characteristic sharp decrease at temperatures below 1 °C. By July, both the upper dry peat layer and the lower transition layer in the active layer became more distinct, likely because of their increased thickness. Our study of active-layer peat parameters revealed at least two boundaries where contrasts in εr could form detectable GPR interfaces. These interfaces corresponded to changes in the thermal properties of the active layer. However, the limited thickness of the studied active layer presented challenges for GPR vertical resolution and the ability to identify such boundaries. We hypothesized that a thicker active layer would be a more suitable target for investigating thermal characteristics using the GPR method.
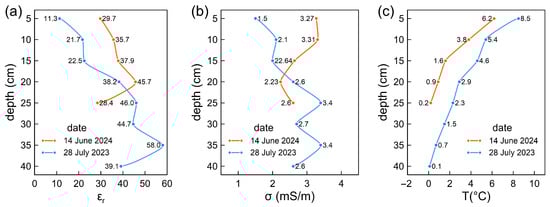
Figure 5.
Variations in (a) relative permittivity, (b) electrical conductivity, and (c) temperature profiles within the active layer of palsa at the Lovozero site, measured on 14 June 2024 (Tair = 19.9 °C) and 28 July 2023 (Tair = 10.6 °C).
For statistical analysis, we compiled a catalog of all measured parameters for the active-layer peat (Figure 6). Given that the samples had a 10 cm edge length and field measurements in the trial pit were spaced 5 cm apart, we averaged adjacent measurements when comparing field and laboratory data. The organic content of the peat samples ranged from 93% to 99%, allowing us to treat its influence as constant. Our comparative analysis revealed that εr exhibited the strongest interrelation with Sr, λ, ρ, and σ, as evidenced by significant positive correlation coefficients and acceptable p-values. This suggests these parameters were primarily governed by peat moisture content. Conversely, we observed moderate negative correlations for the T–εr, T–λ, T–Sr, and T–ρ relationships, specifying an additional temperature-dependent effect that, however, was also linked to peat water saturation. Among all parameters, σ characterized the weakest correlations, displaying only the expected significant relationship with ε and a marginal one with T, despite the known theoretical dependence between T and σ. The parameter φ showed no statistical significance, nor did the ρ–λ relationship. These findings aligned with previous conclusions about Kola Peninsula peatlands, where the λ of active layer was primarily controlled by VWC and only secondarily by peat density [60].
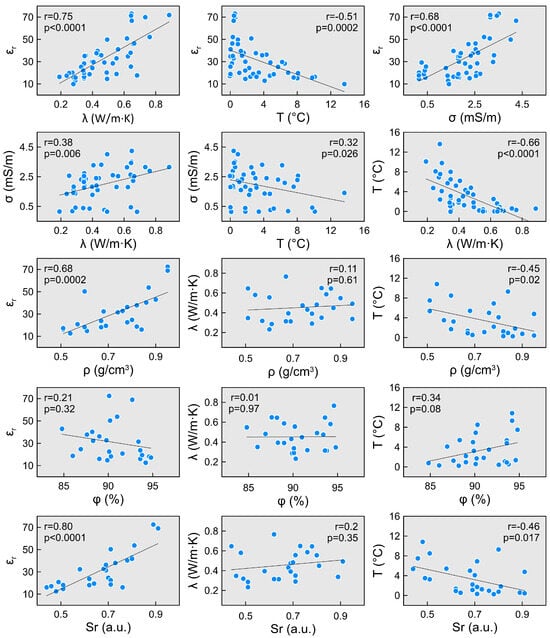
Figure 6.
Scatter plots with correlation analysis for active-layer peat parameters from the Lovozero site.
As previously noted, some studies showed that thermal field variations can increase electromagnetic signal attenuation in soil under otherwise constant conditions. On the other hand, a similar effect would be expected from increased water content, particularly when involving mineralized water. Excessive water saturation reduces the energy of the electromagnetic wave, causing a corresponding low-frequency shift because of an increase in electrical conductivity. The temperature influence on GPR signals appeared less direct, manifesting primarily through modifications in peat’s electrophysical properties when containing frozen fringe and ice schlieren. Notably, temperature variations within the −10 °C to 10 °C range can alter εr values by 5–40, depending on moisture content. Since GPR interfaces were predominantly formed at humidity gradients, temperature gradient detection required attributes that were either less humidity-sensitive or exhibiting inverse responses. Consequently, frequency domain dynamic attributes such as weighted average frequency proved more suitable than time domain attributes like peak amplitude. This approach has found support in multiple studies. For instance, Wang and Shen [34] and Wang et al. [35] demonstrated the weighted average frequency’s sensitivity to temperature trends, while Shen et al. [33] showed its utility in permafrost thaw front detection. Further evidence may come from Léger et al.’s [61] laboratory experiments monitoring sand FTCs with GPR, where recorded data revealed subtle but consistent changes in pulse width and amplitude during water phase transitions. We hypothesized that these effects may be even more pronounced in peat due to its distinct thermo- and hydrophysical properties.
4.3. GPR Field Survey
As a field case study, we examined the active-layer characteristics at the Sosnovets site. Figure 7 presents a GPR cross-section recorded in July 2023 along the margin of a stable palsa mound. This location exhibited a distinctive local permafrost protrusion formed by lateral groundwater influence. This thawing pattern is commonly observed in frozen peatlands [62]. The GPR line was along the palsa slope edge, enabling us to excavate a trial pit and measure peat εr and T parameters to a depth of 155 cm. As attribute analysis was performed on the time section, we show corresponding depths in the figure with arrows. Depth conversions were calculated using GPR signal velocities derived from averaged εr values measured in the trial pit: 6.7 cm/ns for the upper layer and 5.7 cm/ns for the lower layer. Because of difficulties in precisely determining wave velocity in the frozen core of the palsas, we applied an estimated velocity of 9.5 cm/ns for these sections.
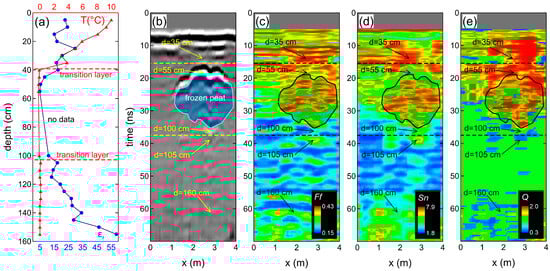
Figure 7.
GPR cross-section observed at the edge of a palsa at the Sosnovets site, showing (a) graphs of εr and T changes along the trial pit wall, (b) raw GPR cross-section, and images of GPR attributes: (c) weighted average frequency Ff, (d) normalized spectrum area Sn, and (e) Q-factor. The arrows show the corresponding depths calculated based on the effective GPR velocity in peat. The supposed transition layer under permafrost table is located in the depth range of 35–55 cm. The lower boundary of frozen peat is in the range of 100–105 cm. The mark at 160 cm indicates the presence of peat with high moisture content.
First, we identified the upper boundary of frozen peat on the GPR cross-section (Figure 7b), while the lower boundary appeared less distinct because of significant signal attenuation below 35 ns (~70 cm depth). We attributed this attenuation to increased moisture content coming from thawed permafrost. Dynamic attributes Ff (Figure 7c) and Sn (Figure 7d) showed reduced values in this zone, contrasting with increased levels in the ice-rich frozen core. We also revealed similar trends for the Q-factor (Figure 7e). Next, we delineated a transitional layer (T < 1 °C) surrounding the ice core, where contrasts in electromagnetic properties produced detectable GPR wavefield responses. While no distinct reflectors marked water phase transitions in the original GPR record (potentially related to low-frequency signal overlap), all attribute sections showed more differentiated patterns. Most notably, the 35–55 cm depth interval exhibited significant attribute variations coinciding with a temperature drop from 4 °C to −0.1 °C, especially noticeable under decreasing Sn and increasing Q values. A weaker but discernible attribute response also occurred in the 100–105 cm transition zone, where temperatures fluctuated marginally between −0.1 °C and 0.1 °C.
In a subsequent case study at the Lovozero site, we examined the transition zone between a permafrost palsa and a seasonally frozen flark (Figure 8). Unfortunately, the 400 MHz probing frequency was suboptimal for resolving the active-layer structure atop the palsa mound due to insufficient vertical resolution. However, in the peat layer of flark where seasonal freezing occurs, attribute analysis revealed an anomalous zone at ~30 ns (46 cm depth) characterized by local decreases in Ff (Figure 8b) and Sn (Figure 8c), concurrent Q-factor increases indicating frequency spectrum shifts (Figure 8d), and an absence of distinct reflectors in the raw GPR data. This anomaly appeared continuously from the flark area to the transition zone above the palsa permafrost table. While the temperature gradient interpretation remains preliminary, direct measurements confirmed T < 1 °C at 40 cm depth. In the seasonal ice deposit (70–80 cm depth), attribute values resembled those of the upper part of the palsa frozen core, which could suggest a transition to subzero temperatures within the active layer. Permafrost exhibited an on overall increase in attribute values, with a decrease only below 140 cm of depth, probably marking the groundwater table and confirming the site’s overall dry peat conditions.
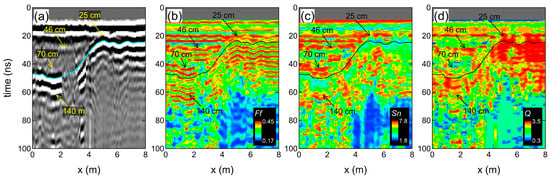
Figure 8.
GPR cross-section observed along the line from flark to palsa at the Lovozero site, showing (a) the raw GPR cross-section and images of GPR attributes: (b) weighted average frequency Ff, (c) normalized spectrum area Sn, and (d) Q-factor; the solid line outlines the boundary of the active layer. The arrows show the corresponding depths calculated based on the effective GPR velocity in peat. Between 0 and 4 m along the transect, a flark containing seasonal ice was observed in the depth range of 70–140 cm, transitioning into a permafrost-containing palsa mound beyond the 4 m mark. The inferred transition layer depth decreased from 46 cm in the flark to 25 cm within the mound.
At the Lovozero site, we conducted seasonal GPR surveys of the palsa mound in June 2024 and July 2023 (Figure 9), with corresponding active-layer parameters shown in Figure 5. This allowed us to assess changes in GPR attributes associated with active-layer thickening. For the conversion of time section to depth section, we applied velocities of 5.1 cm/ns for the active layer and 9.5 cm/ns for the permafrost. In June 2024, ALT was 25–30 cm and was identifiable on GPR cross-sections at time 17–18 ns (excluding the non-informative, direct wave in the upper 10 ns of the record). The thin (5–10 cm) transition layer near the permafrost table had minimal attribute responses, with only the Sn cross-section displaying detectable effects. However, at 30 ns (~100 cm depth), we observed abrupt changes in frequency-dependent attributes, potentially denoting the existence of a temperature gradient at the frozen core boundary.
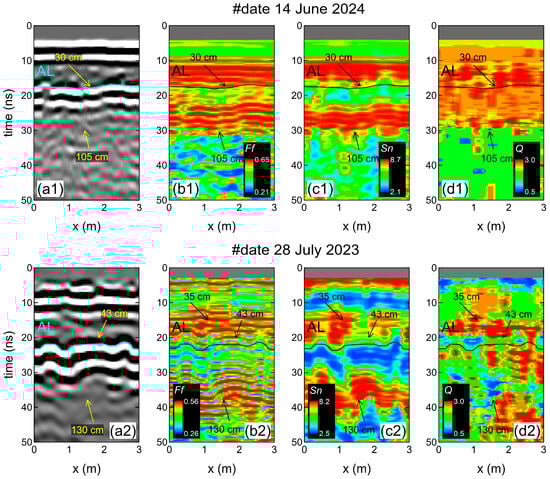
Figure 9.
GPR cross-sections recorded in June 2024 and July 2023 on a palsa at the Lovozero site, showing (a1,a2) the raw GPR cross-section and images of GPR attributes: (b1,b2) weighted average frequency Ff, (c1,c2) normalized spectrum area Sn, and (d1,d2) Q-factor; the solid line outlines the boundary of the active layer. The arrows show the corresponding depths calculated based on the effective GPR velocity in peat. In June, when the active-layer thickness reached 30 cm, the reflection from the transition layer overlapped with the ground wave. However, as the active layer increased to 43 cm, more distinct GPR attributes were recorded within the 35–43 cm interval. Anomalies in the GPR signal—likely associated with liquid water content—were also observed in the upper permafrost. These anomalies occurred at depths of 100 cm in June and extended to 130 cm by July.
By July 2023, ALT was 40–45 cm (22–23 ns on GPR cross-section). The reflected signal in both cases was stable—it had five peaks and a duration of 8 ns, though surface vegetation in July increased the uninformative zone to 15 ns. In contrast, we found an interval of increasing Sn and Q-factor at a depth of 35–43 cm, which could mark the transit zone and a decrease in temperature below 1 °C (see Figure 4). However, the 400 MHz antenna’s resolution proved insufficient for finer active-layer discretization. At the bottom of the GPR record, we identified complex attribute patterns, possibly identifying thermal front migration. The Sn boundary shifted from 100 cm in June to 130 cm in July, though this requires verification. Comparative analysis suggested that homogeneous attribute distribution in June (Figure 7) reflected post-thaw saturation, as confirmed by peat moisture in flarks, starting from a depth of 10 cm (Figure 4). In July, the situation was drier, which resulted in GPR attributes with a non-uniform distribution pattern. Analogous results could be observed for a palsa mound that was characterized by dry conditions (Figure 8).
For our final case study at the Ponoy site, we implemented a new experimental design involving two parallel GPR survey lines (Figure 10): line #1 along the degrading palsa margin and line #2 across the stable central portion. Simultaneously, we collected T measurements at a 25 cm depth in peat using an LT-300 thermometer at 2 m intervals along both lines. As a result, this enabled a direct correlation between GPR cross-sections and their thermal profiles. Using the TDR-derived velocity of 5.2 cm/ns for active-layer peat, we positioned thermometric measurement points at 14 ns on GPR cross-sections. Since GPR raw data were noisy, we analyzed Ff and Sn attributes averaged over 5 ns intervals (Δt). Even after averaging, attribute variability remained high because of heterogeneous near-surface conditions, requiring moving average trend analysis. The temperature data revealed characteristic palsa thermal patterns: a decrease in T at the location of permafrost and an increase in T along degrading margins with moisture accumulation. We did not establish a T value below 1 °C at the measurement points, eliminating ice content effects. At the same time, in the central part of both GPR cross-sections, T was quite stable at 3–4 °C. There was also a weak tendency for T to increase with increasing ALT. In GPR cross-sections, this interval corresponded to a continuous permafrost interface. The distribution of attributes was uniform, albeit with fluctuations, but without sharp extremes.
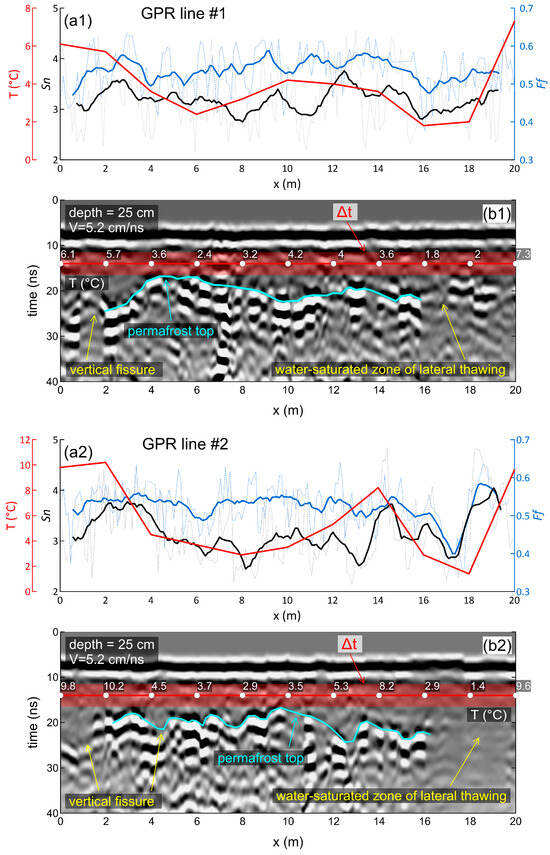
Figure 10.
Data from the Ponoy site along two GPR lines on the palsa mound: (a1,a2) graphs of Sn, Ff, and T changes along GPR lines; (b1,b2) GPR cross-sections with the active layer position marks, T measurement points, and Δt—attribute calculation interval. Blue arrows outline the continuous permafrost surface, while yellow arrows show the locations and causes of disturbances in the frozen core surface of the palsa.
The marginal sections at 0–2 m and 16–18 m survey points exhibited contrasting behavior. At an interval of 16–18 m, partial permafrost thaw led to both increased moisture content in the active-layer peat and decreased overall temperatures. These changes manifested on GPR cross-sections as zones of enhanced signal attenuation, with corresponding reductions in Sn and Ff attribute values. As conditions transitioned to non-permafrost peat background levels, these parameters gradually recovered. The 0–2 m section presented a different scenario, characterized by subsiding permafrost and a cracked active-layer structure. With an active-layer thickness of 40 cm and apparently lower overall peat moisture, this area showed increased temperatures at 25 cm depth but less distinct attribute variations. Comparative analysis of attributes and temperature (n = 16, Figure 11) revealed a significant correlation for the Sn–T pair (r = 0.68), while the Ff–T relationship proved statistically insignificant. The hypothesized connection between permafrost depth and temperature remained unconfirmed, highlighting instead the dominant role of moisture in shaping the active layer’s thermal regime. Although some interpretive challenges persist, the GPR attribute analysis successfully identified peat heterogeneity, demonstrating superior diagnostic capability compared to conventional GPR record interpretation alone, which often lacked sufficient signatures to resolve lateral variability in the active layer.
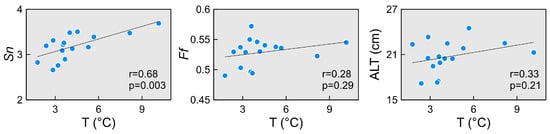
Figure 11.
Correlation of GPR attributes and temperature values in the active layer at a depth of 25 cm at the Ponoy site.
5. Discussion
Our results suggest that GPR survey shows particular promise for studying peat temperature regimes associated with the transition layer and FTCs. However, key uncertainties remain about optimal ALT and probing frequency required for the effective detection of such features with GPR. The characteristics of the active layer vary seasonally and depend on multiple factors, including initial moisture content, pore space structure, temperature gradient, and the ratio of ice to unfrozen water in peat. Therefore, understanding specific freezing and thawing thresholds is equally important. Previous studies have documented the preservation of unfrozen water in Kola Peninsula peatlands at temperatures ranging from 0 to −15 °C [63], with particularly intense phase transitions occurring between 0 and −3 °C. In addition, Mustamo et al. [64] similarly reported residual unfrozen water in peat soils down to −5 °C. However, research by Kujala et al. [49] on peat from Lapland palsa mires identified a narrower freezing range of 0 to −0.8 °C. Comparative studies reveal further variability: Quinton and Baltzer [56] observed a −0.7 °C freezing point for free water in peat plateaus, while Smerdon and Mendoza [55] documented threshold ranges between −0.25 and −2 °C for the thawed-to-frozen transition of water, noting differences between fen and swamp peat because of thermal buffering effects. Using mesocosm measurements, Nagare et al. [65] found that peat freezing temperatures vary with moisture content within the 0 to −1 °C range. These experimental ranges likely apply similarly to water phase transitions during peat thawing.
The reliable detection of temperature shifts requires a minimum εr change exceeding 3.8 [66]. Our laboratory experiments revealed a broader εr range of 1–17 during FTCs, with reduced unfrozen water affecting hysteresis under lower moisture conditions, in agreement with the findings of Romanovsky and Osterkamp [67]. Experimental studies have shown that peat freezing generates moisture gradients aligned with temperature gradients [68]. Moreover, Watanabe and Wake [69] defined that at temperatures below −1 °C in frozen mineral soils with initially different total water contents, the amount of remaining unfrozen water is equivalent, but εr depends on the total water content. These findings correspond with earlier results for peats [70]. Peat density significantly influences water phase transitions, as Pavlova [71] noted transitions at 0 °C in loose peat versus −10 °C in dense peat. This highlights organic soils’ slower thermal response compared to that of mineral soils, evidenced by our recorded ±10 °C hysteresis range, far exceeding the 0 to −0.15 °C range measured for silt [72]. Organic matter reduces εr by decreasing free water while increasing bound water content [73], with ice schlieren formation and cryosuction further depleting free water during freezing. These processes dramatically alter peat’s electrophysical properties in the transition layer, creating contrasts detectable using a GPR method. However, interpretation requires caution, as peat exhibits water content hysteresis during wetting–drying cycles independent of temperature [74]. Precipitation- or evapotranspiration-induced moisture variations can produce GPR signatures mimicking or obscuring thermal responses. Whether mineral soils develop sufficient property contrasts during FTC for GPR detection remains an open research question.
Palsa mounds exhibit relatively stable seasonal temperature variations, for example, temperatures at 125 cm depth ranged from −0.1 to −3.4 °C [75]. Monitoring studies by Delisle et al. [76] revealed that palsa frozen cores maintain temperatures between −0.6 and −1.2 °C in mid-June. A particularly notable feature is the thermal contrast between the coldest upper ice core section (−1.2 °C) and the overlying active layer, where temperatures rise sharply by 6.6 °C within a short vertical interval. Probably, such thermal gradient results from winter freezing front propagation into the frozen peat core. Our findings demonstrate significant early summer temperature gradients in upper palsa sections. Comparative measurements showed distinct differences between sites: at Lovozero in July, we observed a 5 cm transition layer with temperatures of 0.1–0.7 °C, while at Sosnovets, the layer measured 15 cm with temperatures near −0.1 °C. These thermal variations appear to have significantly influenced the corresponding GPR attribute responses.
The frequency domain attribute response to peat FTC may be explained by dispersive waveguiding in thin layers [77,78]. While these previous studies primarily included velocity analysis, changes in GPR signal propagation properties also significantly affect GPR attributes. For instance, Steelman et al. [35] demonstrated through a common mid-point method that seasonal variations produce measurable changes in reflection period and amplitude in GPR data. The stronger property contrasts and stratification in peat compared to mineral soils may promote waveguide formation within the active layer, potentially amplifying frequency domain effects. Our data suggest that at least one dispersive waveguide must be present in the lower part of the active layer (Figure 4 and Figure 5), which may account for the frequency shifts indicated by Ff and Q-value attributes above the permafrost table. However, verification remains challenging because of the limited vertical resolution of our antenna unit and sparse trial pit measurements. As the dispersive waveguide effect depends critically on layer thickness relative to GPR wavelength, optimal frequency selection represents a key consideration for future experimental designs. This relationship between layer thickness and probing frequency requires particular attention in subsequent investigations of peat freeze–thaw dynamics.
Our analysis yields several key conclusions regarding GPR signal response to temperature gradients in peat. (1) The thermo-hydraulic parameters of peat evolve interdependently, collectively determining electrophysical properties and complicating the separate identification of thermal response. (2) Phase changes in pore water under temperature variation significantly influence GPR pulse propagation, enabling temperature gradient detection through ice content changes. (3) GPR signal changes in time and frequency domains arise from the development of relatively high-velocity layers, as liquid water content during FTC at various initial moisture levels remains constant while ice content varies. (4) Physical characteristics of peat produce distinct transition layers during FTCs, with measurable thermal gradients of at least ±1 °C that represent primary targets for GPR detection. (5) GPR attributes may respond differently to thermal variations in diverse peat environments—including permafrost-overlying peat, hollow peat, and thawed marginal zones. (6) The persistence of liquid water in peat down to −15 °C may allow for the identification of GPR signatures related to thermal field heterogeneity within permafrost layers.
We have presented the key factors determining peat thermo-hydraulic conditions and their influence on GPR signal propagation as a schematic model (Figure 12). The depth-dependent εr function is derived from active-layer field observations with laboratory measurements. While this model emphasizes key relationships, the seasonal variability in layer thicknesses requires further targeted investigation.
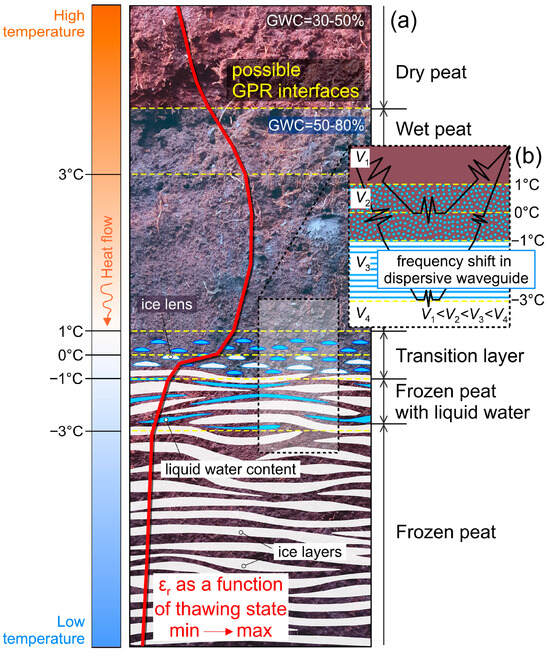
Figure 12.
Conceptual model showing (a) thermal gradient effects on peat state in the active layer and (b) the anticipated GPR wavefield response to thermo-hydraulic heterogeneity in the active layer.
During field work, GPR surveys can include but are not limited to analyzing the process of active-layer formation and identifying the stages of peat freezing. Future research directions should explore the potential of GPR to detect the zero-curtain effect depth, which could serve as a valuable indicator for shallow permafrost mapping when combined with land-surface temperature satellite data [79]. While we concur with Wang and Shen’s [38] assessment of the current limitations of the GPR method in temperature estimation compared to soil moisture prediction, several promising avenues exist for improvement. These include the following:
- (i)
- High-resolution field studies combining high-frequency GPR antennas with thermistor arrays;
- (ii)
- Controlled freeze–thaw cycle experiments with concurrent GPR monitoring following approaches described by Léger et al. [61];
- (iii)
- Advanced attribute selection and analysis incorporating machine learning techniques.
Additional methodological enhancements may involve the analysis of refracted waves, as shallow permafrost under water-saturated peat provides favorable conditions for the production of refracted phases [80]. The dispersion inversion method [78] also shows considerable potential for advancing FTC investigations in peat.
6. Conclusions
This study presents a comprehensive analysis of GPR data from various subarctic frozen peatlands and develops a hypothesis regarding GPR attribute sensitivity to thermal gradients in the active layer. Our findings confirm the complex thermo-hydraulic behavior of peat, where FTCs involve substantial water phase changes that remain relatively immobilized because of peat’s binding properties. Therefore, the thermal gradient in the active layer of peatlands consistently coincides with moisture gradients and, together with other peat heterogeneities, create intricate vertical distributions of electrophysical parameters. These results emphasize the fundamental challenge of inferring temperature variability in northern peatlands using GPR data. While our phenomenological approach has yielded valuable insights, some inherent ambiguity remains, requiring further research to validate and confirm the proposed hypothesis. A primary motivation for this study was to initiate scientific discourse on the following question: Can ground-penetrating radar reliably detect thermal gradients in frozen peatland, or not?
Funding
This research was funded by the Russian Science Foundation under grant No. 22-77-10055, “https://rscf.ru/en/project/22-77-10055/ (accessed on 20 May 2025)”.
Data Availability Statement
The data presented in this study are available on request from the corresponding author.
Conflicts of Interest
The author declares no conflicts of interest.
References
- Aalto, J.; Karjalainen, O.; Hjort, J.; Luoto, M. Statistical Forecasting of Current and Future Circum-Arctic Ground Temperatures and Active Layer Thickness. Geophys. Res. Lett. 2018, 45, 4889–4898. [Google Scholar] [CrossRef]
- Kaverin, D.; Malkova, G.; Zamolodchikov, D.; Shiklomanov, N.; Pastukhov, A.; Novakovskiy, A.; Sadurtdinov, M.; Skvortsov, A.; Tsarev, A.; Pochikalov, A.; et al. Long-Term Active Layer Monitoring at CALM Sites in the Russian European North. Polar Geogr. 2021, 44, 203–216. [Google Scholar] [CrossRef]
- Li, G.; Zhang, M.; Pei, W.; Melnikov, A.; Khristoforov, I.; Li, R.; Yu, F. Changes in Permafrost Extent and Active Layer Thickness in the Northern Hemisphere from 1969 to 2018. Sci. Total Environ. 2022, 804, 150182. [Google Scholar] [CrossRef]
- Yi, Y.; Kimball, J.S.; Chen, R.H.; Moghaddam, M.; Reichle, R.H.; Mishra, U.; Zona, D.; Oechel, W.C. Characterizing Permafrost Active Layer Dynamics and Sensitivity to Landscape Spatial Heterogeneity in Alaska. Cryosphere 2018, 12, 145–161. [Google Scholar] [CrossRef] [PubMed]
- Zhang, H.; Piilo, S.R.; Amesbury, M.J.; Charman, D.J.; Gallego-Sala, A.V.; Väliranta, M.M. The Role of Climate Change in Regulating Arctic Permafrost Peatland Hydrological and Vegetation Change Over the Last Millennium. Quat. Sci. Rev. 2018, 182, 121–130. [Google Scholar] [CrossRef]
- Carpino, O.A.; Haynes, K.; Connon, R.; Craig, J.; Devoie, E.; Quinton, W. Long-Term Climate-Influenced Land Cover Change in Discontinuous Permafrost Peatland Complexes. Hydrol. Earth Syst. Sci. 2021, 25, 3301–3317. [Google Scholar] [CrossRef]
- Olefeldt, D.; Heffernan, L.; Jones, M.C.; Sannel, A.B.K.; Treat, C.C.; Turetsky, M.R. Permafrost Thaw in Northern Peatlands: Rapid Changes in Ecosystem and Landscape Functions. In Ecosystem Collapse and Climate Change; Canadell, J.G., Jackson, R.B., Eds.; Ecological Studies; Springer: Cham, Switzerland, 2021; Volume 241, pp. 3–22. [Google Scholar] [CrossRef]
- Luo, D.; Wu, Q.; Jin, H.; Marchenko, S.S.; Lü, L.; Gao, S. Recent Changes in the Active Layer Thickness Across the Northern Hemisphere. Environ. Earth Sci. 2016, 75, 555. [Google Scholar] [CrossRef]
- Clayton, L.K.; Schaefer, K.; Battaglia, M.J.; Bourgeau-Chavez, L.; Chen, J.; Chen, R.H.; Chen, A.C.; Bakian-Dogaheh, K.; Grelik, S.; Jafarov, E.; et al. Active Layer Thickness as a Function of Soil Water Content. Environ. Res. Lett. 2021, 16, 055028. [Google Scholar] [CrossRef]
- Bobrik, A.A.; Goncharova, O.Y.; Matyshak, G.V.; Ryzhova, I.M.; Moskalenko, N.G.; Ponomareva, O.E.; Ogneva, O.A. Correlation of Active Layer Thickness and Landscape Parameters of Peatland in Northern West Siberia (Nadym Station). Earth’s Cryosphere 2015, 19, 29–35. [Google Scholar]
- Atchley, A.L.; Coon, E.T.; Painter, S.L.; Harp, D.R.; Wilson, C.J. Influences and Interactions of Inundation, Peat, and Snow on Active Layer Thickness. Geophys. Res. Lett. 2016, 43, 5116–5123. [Google Scholar] [CrossRef]
- Du, R.; Peng, X.; Frauenfeld, O.W.; Sun, W.; Liang, B.; Chen, C.; Jin, H.; Zhao, Y. The Role of Peat on Permafrost Thaw Based on Field Observations. Catena 2022, 208, 105772. [Google Scholar] [CrossRef]
- Sannel, A.B.K.; Hugelius, G.; Jansson, P.; Kuhry, P. Permafrost Warming in a Subarctic Peatland—Which Meteorological Controls Are Most Important? Permafr. Periglac. Process. 2016, 27, 177–188. [Google Scholar] [CrossRef]
- Sannel, A.B.K. Ground Temperature and Snow Depth Variability Within a Subarctic Peat Plateau Landscape. Permafr. Periglac. Process. 2020, 31, 255–263. [Google Scholar] [CrossRef]
- Léger, E.; Dafflon, B.; Robert, Y.; Ulrich, C.; Peterson, J.E.; Biraud, S.C.; Romanovsky, V.E.; Hubbard, S.S. A Distributed Temperature Profiling Method for Assessing Spatial Variability in Ground Temperatures in a Discontinuous Permafrost Region of Alaska. Cryosphere 2019, 13, 2853–2867. [Google Scholar] [CrossRef]
- Wilson, R.M.; Hopple, A.M.; Tfaily, M.M.; Sebestyen, S.D.; Schadt, C.W.; Pfeifer-Meister, L.; Hanson, P.J. Stability of Peatland Carbon to Rising Temperatures. Nat. Commun. 2016, 7, 13723. [Google Scholar] [CrossRef]
- Byun, E.; Rezanezhad, F.; Fairbairn, L.; Slowinski, S.; Basiliko, N.; Price, J.S.; Quintom, W.L.; Roy-Léveillée, P.; Webster, K.; Van Cappellen, P. Temperature, Moisture and Freeze–Thaw Controls on CO2 Production in Soil Incubations from Northern Peatlands. Sci. Rep. 2021, 11, 23219. [Google Scholar] [CrossRef]
- Rowlandson, T.L.; Berg, A.A.; Roy, A.; Kim, E.; Lara, R.P.; Powers, J.; Lewis, K.; Houser, P.; McDonald, K.; Toose, P.; et al. Capturing Agricultural Soil Freeze/Thaw State Through Remote Sensing and Ground Observations: A Soil Freeze/Thaw Validation Campaign. Remote Sens. Environ. 2018, 211, 59–70. [Google Scholar] [CrossRef]
- Williamson, M.; Adams, J.R.; Berg, A.A.; Derksen, C.; Toose, P.; Walker, A. Plot-Scale Assessment of Soil Freeze/Thaw Detection and Variability with Impedance Probes: Implications for Remote Sensing Validation Networks. Hydrol. Res. 2018, 49, 1–16. [Google Scholar] [CrossRef]
- Mavrovic, A.; Pardo Lara, R.; Berg, A.; Demontoux, F.; Royer, A.; Roy, A. Soil Dielectric Characterization During Freeze-Thaw Transitions Using L-Band Coaxial and Soil Moisture Probes. Hydrol. Earth Syst. Sci. 2021, 25, 1117–1131. [Google Scholar] [CrossRef]
- Zhu, H.H.; Wu, B.; Cao, D.F.; Li, B.; Wen, Z.; Liu, X.F.; Shi, B. Characterizing Thermo-Hydraulic Behaviors of Seasonally Frozen Loess Via a Combined Opto-Electronic Sensing System: Field Monitoring and Assessment. J. Hydrol. 2023, 622, 129647. [Google Scholar] [CrossRef]
- Wollschläger, U.; Gerhards, H.; Yu, Q.; Roth, K. Multi-Channel Ground-Penetrating Radar to Explore Spatial Variations in Thaw Depth and Moisture Content in the Active Layer of a Permafrost Site. Cryosphere 2010, 4, 269–283. [Google Scholar] [CrossRef]
- Gusmeroli, A.; Liu, L.; Schaefer, K.; Zhang, T.; Schaefer, T.; Grosse, G. Active Layer Stratigraphy and Organic Layer Thickness at a Thermokarst Site in Arctic Alaska Identified Using Ground Penetrating Radar. Arct. Antarct. Alp. Res. 2015, 47, 195–202. [Google Scholar] [CrossRef]
- Cao, B.; Gruber, S.; Zhang, T.; Li, L.; Peng, X.; Wang, K.; Zheng, L.; Shao, W.; Guo, H. Spatial Variability of Active Layer Thickness Detected by Ground-Penetrating Radar in the Qilian Mountains, Western China. J. Geophys. Res. Earth Surf. 2017, 122, 574–591. [Google Scholar] [CrossRef]
- Jafarov, E.E.; Parsekian, A.D.; Schaefer, K.; Liu, L.; Chen, A.C.; Panda, S.K.; Zhang, T. Estimating Active Layer Thickness and Volumetric Water Content from Ground Penetrating Radar Measurements in Barrow, Alaska. Geosci. Data J. 2017, 4, 72–79. [Google Scholar] [CrossRef]
- Sudakova, M.S.; Sadurtdinov, M.R.; Tsarev, A.M.; Skvortsov, A.G.; Malkova, G.V. Ground-Penetrating Radar for Studies of Peatlands in Permafrost. Russ. Geol. Geophys. 2019, 60, 793–800. [Google Scholar] [CrossRef]
- Ryazantsev, P.; Kutenkov, S.; Kabonen, A. Study of Subarctic Palsa Permafrost under Various Thawing Conditions Based on Geophysical and Geospatial Models. Permafr. Periglac. Process. 2025; in print. [Google Scholar] [CrossRef]
- Klinge, M.; Schneider, F.; Dulamsuren, C.; Arndt, K.; Bayarsaikhan, U.; Sauer, D. Interrelations between Relief, Vegetation, Disturbances, and Permafrost in the Forest-Steppe of Central Mongolia. Earth Surf. Process. Landf. 2021, 46, 1766–1782. [Google Scholar] [CrossRef]
- Campbell, S.W.; Briggs, M.; Roy, S.G.; Douglas, T.A.; Saari, S. Ground-Penetrating Radar, Electromagnetic Induction, Terrain, and Vegetation Observations Coupled with Machine Learning to Map Permafrost Distribution at Twelvemile Lake, Alaska. Permafr. Periglac. Process. 2021, 32, 407–426. [Google Scholar] [CrossRef]
- Huang, Y.; Niu, F.; He, P.; Pan, W.; Yuan, K.; Su, W. Effectiveness Evaluation of Cooling Measures for Express Highway Construction in Permafrost Regions Based on GPR and ERT. Cold Reg. Sci. Technol. 2024, 228, 104339. [Google Scholar] [CrossRef]
- Harris, R.H.; Evans, S.G.; Marshall, S.T.; Godsey, S.E.; Parsekian, A.D. Using Ground-Penetrating Radar to Infer Ice Wedge Characteristics Proximal to Water Tracks. J. Geophys. Res. Earth Surf. 2025, 130, e2024JF007832. [Google Scholar] [CrossRef]
- Neradovsky, L.G. Permafrost Soils Influence on EM Energy Attenuation. J. Geophys. 2009, 2, 57–67. (In Russian) [Google Scholar]
- Neradovsky, L.G. Effect of Ground Temperatures on Electromagnetic Field Attenuation in Developed Areas of the Yakutian Permafrost Region. Earth’s Cryosphere 2010, 14, 56–65. (In Russian) [Google Scholar]
- Song, L.; Yang, W.; Huang, J.; Li, H.; Zhang, X. GPR Utilization in Artificial Freezing Engineering. J. Geophys. Eng. 2013, 10, 034004. [Google Scholar] [CrossRef]
- Steelman, C.M.; Endres, A.L.; Van der Kruk, J. Field Observations of Shallow Freeze and Thaw Processes Using High-Frequency Ground-Penetrating Radar. Hydrol. Process. 2010, 24, 2022–2033. [Google Scholar] [CrossRef]
- Jadoon, K.Z.; Weihermüller, L.; McCabe, M.F.; Moghadas, D.; Vereecken, H.; Lambot, S. Temporal Monitoring of the Soil Freeze-Thaw Cycles over a Snow-Covered Surface by Using Air-Launched Ground-Penetrating Radar. Remote Sens. 2015, 7, 12041–12056. [Google Scholar] [CrossRef]
- Shen, Y.; Zuo, R.; Liu, J.; Tian, Y.; Wang, Q. Characterization and Evaluation of Permafrost Thawing Using GPR Attributes in the Qinghai-Tibet Plateau. Cold Reg. Sci. Technol. 2018, 151, 302–313. [Google Scholar] [CrossRef]
- Wang, Q.; Shen, Y. Calculation and Interpretation of Ground Penetrating Radar for Temperature and Relative Water Content of Seasonal Permafrost in Qinghai-Tibet Plateau. Electronics 2019, 8, 731. [Google Scholar] [CrossRef]
- Wang, Q.; Liu, X.; Shen, Y.; Li, M. Characterization and Evaluation of Thaw-Slumping Using GPR Attributes in the Qinghai-Tibet Plateau. Remote Sens. 2023, 15, 2273. [Google Scholar] [CrossRef]
- Elina, G.A.; Lukashov, A.D.; Yurkovskaya, T.K. Late Glacial and Holocene Palaeovegetation and Palaeogeography of Eastern Fennoscandia; Finnish Environment Institute: Helsinki, Finland, 2010; Volume 4. [Google Scholar]
- Rönkkö, M.; Seppälä, M. Surface Characteristics Affecting Active Layer Formation in Palsas, Finnish Lapland. In Proceedings of the Eighth International Conference on Permafrost, Zürich, Switzerland, 21–25 July 2003; Phillips, M., Springman, S.M., Arenson, L.U., Eds.; Swets & Zeitlinger: Lisse, The Netherlands, 2003; pp. 995–1000. [Google Scholar]
- Brown, J.; Ferrians, O.; Heginbottom, J.A.; Melnikov, E. Circum-Arctic Map of Permafrost and Ground-Ice Conditions, Version 2; National Snow and Ice Data Center: Boulder, CO, USA, 2002. [Google Scholar] [CrossRef]
- Danielson, J.J.; Gesch, D.B. Global Multi-Resolution Terrain Elevation Data 2010 (GMTED2010); Open-File Report 1073; U.S. Department of the Interior: Washington, DC, USA; U.S. Geological Survey: Reston, VA, USA, 2011. [Google Scholar]
- Romanenko, F.A.; Garankina, E.V. Permafrost Formation and Structure at the South Border of Cryolithozone, the Kola Peninsula. Earth’s Cryosphere 2012, 16, 72–80. [Google Scholar]
- Olvmo, M.; Holmer, B.; Thorsson, S.; Reese, H.; Lindberg, F. Sub-Arctic Palsa Degradation and the Role of Climatic Drivers in the Largest Coherent Palsa Mire Complex in Sweden (Vissátvuopmi), 1955–2016. Sci. Rep. 2020, 10, 8937. [Google Scholar] [CrossRef]
- Fewster, R.E.; Morris, P.J.; Ivanovic, R.F.; Swindles, G.T.; Peregon, A.M.; Smith, C.J. Imminent Loss of Climate Space for Permafrost Peatlands in Europe and Western Siberia. Nat. Clim. Change 2022, 12, 373–379. [Google Scholar] [CrossRef]
- Leppiniemi, O.; Karjalainen, O.; Aalto, J.; Luoto, M.; Hjort, J. Environmental Spaces for Palsas and Peat Plateaus Are Disappearing at a Circumpolar Scale. Cryosphere 2023, 17, 3157–3176. [Google Scholar] [CrossRef]
- Krutskikh, N.; Ryazantsev, P.; Ignashov, P.; Kabonen, A. The Spatial Analysis of Vegetation Cover and Permafrost Degradation for a Subarctic Palsa Mire Based on UAS Photogrammetry and GPR Data in the Kola Peninsula. Remote Sens. 2023, 15, 1896. [Google Scholar] [CrossRef]
- Kujala, K.; Seppälä, M.; Holappa, T. Physical Properties of Peat and Palsa Formation. Cold Reg. Sci. Technol. 2008, 52, 408–414. [Google Scholar] [CrossRef]
- Spaans, E.J.A.; Baker, J.M. The Soil Freezing Characteristic: Its Measurement and Similarity to the Soil Moisture Characteristic. Soil Sci. Soc. Am. J. 1996, 60, 13–19. [Google Scholar] [CrossRef]
- Kojima, Y.; Nakano, Y.; Kato, C.; Noborio, K.; Kamiya, K.; Horton, R. A New Thermo-Time Domain Reflectometry Approach to Quantify Soil Ice Content at Temperatures Near the Freezing Point. Cold Reg. Sci. Technol. 2020, 174, 103060. [Google Scholar] [CrossRef]
- Annan, A.P. Ground Penetrating Radar. In Near Surface Geophysics; Butler, D.K., Ed.; Society of Exploration Geophysicists: Tulsa, OK, USA, 2005; pp. 357–438. [Google Scholar]
- Kapustin, V.V.; Sinitsin, A.V. The Application of Attribute Analysis for the Solution of Applied Problems of GPR Profiling. J. Geophys. 2015, 2, 17–23. (In Russian) [Google Scholar]
- Patterson, D.E.; Smith, M.W. The Measurement of Unfrozen Water Content by Time Domain Reflectometry: Results from Laboratory Tests. Can. Geotech. J. 1981, 18, 131–144. [Google Scholar] [CrossRef]
- Smerdon, B.D.; Mendoza, C.A. Hysteretic Freezing Characteristics of Riparian Peatlands in the Western Boreal Forest of Canada. Hydrol. Process. 2010, 24, 955–1094. [Google Scholar] [CrossRef]
- Quinton, W.L.; Baltzer, J.L. The Active-Layer Hydrology of a Peat Plateau with Thawing Permafrost (Scotty Creek, Canada). Hydrogeol. J. 2013, 21, 201–220. [Google Scholar] [CrossRef]
- Oleszczuk, R.; Brandyk, T.; Gnatowski, T.; Szatylowicz, J. Calibration of TDR for Moisture Determination in Peat Deposits. Int. Agrophys. 2004, 18, 145–151. [Google Scholar]
- Parsekian, A.D.; Slater, L.; Giménez, D. Application of Ground-Penetrating Radar to Measure Near-Saturation Soil Water Content in Peat Soils. Water Resour. Res. 2012, 48, W02533. [Google Scholar] [CrossRef]
- Zhao, Y.; Si, B. Thermal Properties of Sandy and Peat Soils Under Unfrozen and Frozen Conditions. Soil Tillage Res. 2019, 189, 64–72. [Google Scholar] [CrossRef]
- Kalyuzhny, I.L.; Lavrov, S.A. Thermophysical Properties of the Active Layer of the Kola Peninsula Bogs. Her. Kola Sci. Cent. RAS 2019, 4, 16–28. (In Russian) [Google Scholar]
- Léger, E.; Saintenoy, A.; Serhir, M.; Costard, F.; Grenier, C. Brief Communication: Monitoring Active Layer Dynamic Using a Lightweight Nimble Ground-Penetrating Radar System. A Laboratory Analog Test Case. Cryosphere 2023, 17, 1271–1277. [Google Scholar] [CrossRef]
- Devoie, É.; Craig, J.; Dominico, M.; Carpino, O.; Connon, R.; Rudy, A.; Quinton, W. Mechanisms of Discontinuous Permafrost Thaw in Peatlands. J. Geophys. Res. Earth Surf. 2021, 126, e2021JF006204. [Google Scholar] [CrossRef]
- Kalyuzhny, I.L. Content of Non-Frozen Moisture in a Seasonally Frozen Active Layer of the Kola Peninsula Marshes. Her. Kola Sci. Cent. RAS 2019, 3, 55–64. (In Russian) [Google Scholar]
- Mustamo, P.; Ronkanen, A.K.; Berglund, Ö.; Berglund, K.; Kløve, B. Thermal Conductivity of Unfrozen and Partially Frozen Managed Peat Soils. Soil Tillage Res. 2019, 191, 245–255. [Google Scholar] [CrossRef]
- Nagare, R.M.; Schincariol, R.A.; Quinton, W.L.; Hayashi, M. Effects of Freezing on Soil Temperature, Freezing Front Propagation and Moisture Redistribution in Peat: Laboratory Investigations. Hydrol. Earth Syst. Sci. 2012, 16, 501–515. [Google Scholar] [CrossRef]
- Pardo Lara, R.; Berg, A.A.; Warland, J.; Tetlock, E. In Situ Estimates of Freezing/Melting Point Depression in Agricultural Soils Using Permittivity and Temperature Measurements. Water Resour. Res. 2020, 56, e2019WR026020. [Google Scholar] [CrossRef]
- Romanovsky, V.E.; Osterkamp, T.E. Effects of unfrozen water on heat and mass transport processes in the active layer and permafrost. Permafr. Periglac. Process. 2000, 11, 219–239. [Google Scholar] [CrossRef]
- Gamayunov, N.I.; Stotland, D.M.; Agafonova, O.N.; Tovbin, I.B. Investigation of Heat and Mass Transport During Freezing in Peat Soils. Sov. Soil Sci. 1990, 22, 88–97. [Google Scholar]
- Watanabe, K.; Wake, T. Measurement of Unfrozen Water Content and Relative Permittivity of Frozen Unsaturated Soil Using NMR and TDR. Cold Reg. Sci. Technol. 2009, 59, 34–41. [Google Scholar] [CrossRef]
- Pavlova, N.N. Thermal Properties of the Active Layer of Bogs; Proceedings of the State Hydrological Institute: Leningrad, Russia, 1969; Volume 177, pp. 119–155. (In Russian) [Google Scholar]
- Pavlova, N.N. Phase Composition of Water and Thermophysical Characteristics of Frozen Peat in the Study of Infiltration. Sov. Hydrol. 1970, 4, 361–378. [Google Scholar]
- Koopmans, R.W.R.; Miller, R.D. Soil Freezing and Soil Water Characteristic Curves. Soil Sci. Soc. Am. J. 1966, 30, 680–685. [Google Scholar] [CrossRef]
- Bircher, S.; Andreasen, M.; Vuollet, J.; Vehviläinen, J.; Rautiainen, K.; Jonard, F.; Weihermüller, L.; Zakharova, E.; Wigneron, J.-P.; Kerr, Y.H. Soil Moisture Sensor Calibration for Organic Soil Surface Layers. Geosci. Instrum. Methods Data Syst. 2016, 5, 109–125. [Google Scholar] [CrossRef]
- Naasz, R.; Michel, J.C.; Charpentier, S. Measuring Hysteretic Hydraulic Properties of Peat and Pine Bark Using a Transient Method. Soil Sci. Soc. Am. J. 2005, 69, 13–22. [Google Scholar] [CrossRef]
- Westin, B.; Zuidhoff, F.S. Ground Thermal Conditions in a Frost-Crack Polygon, a Palsa and a Mineral Palsa (Lithalsa) in the Discontinuous Permafrost Zone, Northern Sweden. Permafr. Periglac. Process. 2001, 12, 325–335. [Google Scholar] [CrossRef]
- Delisle, G.; Allard, M.; Phillips, M.; Springman, S.M.; Arenson, L.U. Numerical Simulation of the Temperature Field of a Palsa Reveals Strong Influence of Convective Heat Transport by Groundwater. In Proceedings of the 8th International Permafrost Conference, Zurich, Switzerland, 21–25 July 2003; pp. 21–25. [Google Scholar]
- Arcone, S.A.; Peapples, P.R.; Liu, L. Propagation of a Ground-Penetrating Radar (GPR) Pulse in a Thin-Surface Waveguide. Geophysics 2003, 68, 1922–1933. [Google Scholar] [CrossRef]
- Van der Kruk, J.; Steelman, C.M.; Endres, A.L.; Vereecken, H. Dispersion Inversion of Electromagnetic Pulse Propagation Within Freezing and Thawing Soil Waveguides. Geophys. Res. Lett. 2009, 36, L18503. [Google Scholar] [CrossRef]
- Batbaatar, J.; Gillespie, A.R.; Sletten, R.S.; Mushkin, A.; Amit, R.; Trombotto Liaudat, D.; Liu, L.; Petrie, G. Toward the Detection of Permafrost Using Land-Surface Temperature Mapping. Remote Sens. 2020, 12, 695. [Google Scholar] [CrossRef]
- Bohidar, R.N.; Hermance, J.F. The GPR Refraction Method. Geophysics 2002, 67, 1474–1485. [Google Scholar] [CrossRef]
Disclaimer/Publisher’s Note: The statements, opinions and data contained in all publications are solely those of the individual author(s) and contributor(s) and not of MDPI and/or the editor(s). MDPI and/or the editor(s) disclaim responsibility for any injury to people or property resulting from any ideas, methods, instructions or products referred to in the content. |
© 2025 by the author. Licensee MDPI, Basel, Switzerland. This article is an open access article distributed under the terms and conditions of the Creative Commons Attribution (CC BY) license (https://creativecommons.org/licenses/by/4.0/).