Abstract
Understanding tidal changes and their potential forcing mechanisms enables a better assessment of non-stationary tidal effects for projecting extreme sea levels and nuisance flooding. In this study, we investigate the seasonal and interannual changes in the M2 tidal current off the Guangdong coast using currents observed via two different types of high-frequency radar from 2019 to 2022. The results indicate significant seasonal changes in the M2 tidal current in the coastal areas of the Pearl River Estuary and Cape Maqijiao, with the largest relative deviations occurring in summer, reaching 10–20%. Observations of thermohaline profiles from 2006 to 2007 and 1978 to 1988 show that runoff in summer can reach these two areas and change the stratification of seawater, in turn affecting tidal currents. A comparative analysis of the two areas suggests that the greater the runoff, the wider the area where the M2 tidal current experiences significant seasonal variation. No significant interannual changes in the M2 tidal current were detected offshore of Guangdong during the observation period. However, an abrupt change occurred in the coastal area of Shantou in 2021, primarily caused by the distortion of the antenna patterns.
1. Introduction
Coastal tide-gauge records and satellite radar altimetry data collected over the past century have revealed that ocean tides exhibit unexpected seasonal, interannual, and decadal changes [1,2,3]. The effects of variations in astronomical forcing are small and can be ruled out [4,5]. Previous studies have found that the evolution of ocean tides is related to changes in geometry [6,7], stratification [4,8], mean sea-level rise [2,9], and internal tides [10,11]. River runoff significantly influences stratification and circulation in coastal regions, making these areas prone to large temporal changes in tides [4,12,13].
Owing to their low spatial resolution, it is difficult for traditional observation methods to capture the fine spatial structures of tidal temporal variability caused by ocean processes, such as stratification and mixing, especially in estuarine and bay areas where offshore ocean dynamic processes are extremely complex [12,13]. High-frequency ground wave radar (HFR) provides real-time, continuous, all-weather monitoring of ocean surface currents with high spatial resolution across expansive areas, making it a valuable tool for addressing this problem. Thus, HFR observations have been widely used in research on the main characteristics of coastal tides [14,15,16].
Previous studies based on observational data and numerical models have mainly discussed the mean characteristics of tides, tidal wave movement, and tidal wave energy balance in the South China Sea (SCS) [17,18,19,20,21,22,23,24]; there has been limited research on the temporal variations in tides in the region. Using 17 tide gauge data from 1954 to 2012, Feng et al. (2015) [25] analyzed the long-term variations in the main tidal constituents along the coasts of China and adjacent seas, and concluded that the M2 amplitude of the Chinese coasts has been increasing, with higher rates in the Bohai and Yellow Seas and lower rates in the SCS. Pan et al. (2021) [26] extracted the long-term trends in the amplitudes of four major constituents using tide gauge observations and satellite altimeter data. The results show that the tidal amplitudes are stable in most areas of the SCS but show significant trends in a few areas. Using the mooring current profile observations from September 2011 to May 2013 in the northern SCS, Zhao et al. (2019) [27] found that the baroclinic diurnal tide exhibits significant seasonal characteristics and becomes the strongest in summer. However, little is known about the seasonal and interannual changes in tidal currents along the Guangdong coast, owing to the lack of high-resolution observations. In recent years, the development of HFRs along the Guangdong coastal region has provided continuous high-resolution surface current observations that facilitate further investigation of the spatial and temporal changes in tides.
The Pearl and Hanjiang Rivers are the two largest rivers along the Guangdong coast, discharging 3.138 × 10¹¹ m3 and 0.246 × 10¹¹ m3 of fresh water per year into the northern SCS, respectively (China River Sediment Bulletin). Influenced by the SCS monsoon, the runoff from the Pearl and Hanjiang Rivers exhibits significant seasonal variability. During the flood season, the runoff accounts for approximately 80% of the total annual runoff, with the majority occurring in summer [28]. The spread of the Pearl River Plume (PRP) presents distinct seasonal and interannual variability because of the seasonal and interannual variations in the SCS monsoon and river runoff [29,30,31]. PRP significantly influences water properties and changes the distribution of stratification [31,32], which might affect the temporal variations in tidal currents in the coastal region of Guangdong.
Therefore, this study focuses on the seasonal and interannual changes in the M2 tidal current off the Guangdong coast using HFR observations in the coastal areas of the Pearl River Estuary and Shantou. The remainder of this paper unfolds as follows. Section 2 presents the materials and methods. Seasonal and interannual changes of M2 tidal currents are discussed in Section 3. A discussion and summary are presented in Section 4 and Section 5, respectively.
2. Materials and Methods
2.1. Materials
The HFR detects ocean surface currents based on the Bragg scattering and Doppler shift [15]. In recent years, four HFRs have been deployed to observe the surface currents at Nanao (NAND), Huilai (HULA), Wanshan (WASH), and Shangchuan (SHCH) in Guangdong Province, China (Figure 1). The radar type deployed at Nanao and Huilai was OSMAR-S (Beijing Highlander Digital Technology Co., Ltd., Beijing, China), with temporal and spatial resolutions of 20 min and 3.3 km, respectively. The radar type for Wanshan and Shangchuan was OSMAR-071G (Hubei Zhongnan Pengli Marine Exploration System Engineering Co., Ltd., Yichang, China), with a temporal resolution of 10 min and a spatial resolution of 5 km. The accuracy and reliability of the current products extracted using these two radar systems were determined through a series of experiments [16,33,34,35,36]. The HFR observations for 2019–2022 were analyzed in the study.
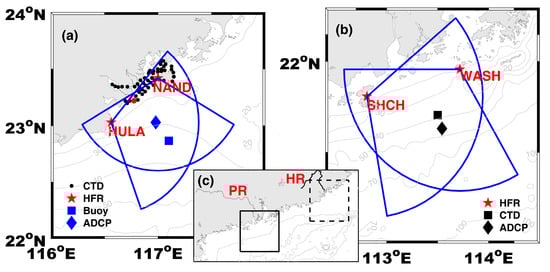
Figure 1.
Bathymetry along the Guangdong coast and locations of observation stations. (a) The Coastal area of Shantou, where the blue square represents buoy MF14005, black circles represent conductivity–temperature–depth (CTD) observation sites during 2006–2007, and the red circle indicates the location of Cape Maqijiao. (b) Coastal area of the Pearl River Estuary, with the black square representing the CTD observation station during 1978–1988. (c) Solid and dashed boxes represent the coastal areas of the Pearl River Estuary and Shantou, respectively. PR and HR represent the Pearl and Hanjiang Rivers, respectively. Red pentagrams, blue circular sectors, and diamonds represent radar sites, radar observation areas, and the acoustic Doppler current profiler (ADCP) stations, respectively. HFR: high-frequency ground wave radar.
During the period of 23 October to 25 October 2019, an intercomparison of the currents observed by OSMAR-S and the moored acoustic Doppler current profiler (ADCP, Teledyne RD Instruments, San Diego, the United States) was performed; an intercomparison between OSMAR-071G and ADCP was conducted from 12 November to 14 November 2019.
The hourly currents observed by buoy MF14005 (Figure 1) in 2018 were obtained from the South China Sea Area and Island Center, Ministry of Natural Resources.
Four conductivity–temperature–depth (CTD) profiler cruises were conducted in the coastal area of Shantou: the 2006 summer cruise (14 July–24 August 2006), the 2006 winter cruise (20 December 2006–24 January 2007), the 2007 spring cruise (1 April–25 April 2007), and the 2007 autumn cruise (19 October–5 December 2007). Continuous hydrological surveys were conducted during 1978–1988 in the coastal areas of the Pearl River Estuary. One of the CTD stations was located within the core area of the HFR Wanshan-Shangchuan (113.5°E, 21.5°N). Surveys were conducted once a month during 1978–1981, and once every two months during 1982–1988.
In July 2022, the antenna patterns of the Nanao and Huilai radars were measured using a portable antenna pattern-measuring device based on an unmanned aerial vehicle platform.
2.2. Methods
Harmonic analysis of the ocean current data was conducted using the MATLAB program package T_Tide (v1.4) [37]. A series of observations with a temporal interval and several optional parameters were passed to T_Tide. The tidal response model is constructed as follows:
where is the number of tidal constituents, is the known frequency, and is the unknown complex amplitude. T_Tide automatically identified 35 tidal constituents. The first two terms describe the possible offset and linear drift. The liner drift was not considered in this study.
The analysis result is a pair of complex values for each tidal component, which were converted into four parameters:
For horizontal current, , , , and are the semi-major axis, semi-minor axis, the inclination of the northern semi-major axis, and the Greenwich phase, respectively. >(<) 0 represents the counterclockwise (clockwise) rotation of tidal current.
To describe the differences in the tidal currents from different periods in the same location, the relative deviation of the tidal currents is defined as follows:
where and are the amplitudes of the two tidal ellipses in direction , and is the semi-major axis. The unit is %.
3. Results
3.1. Comparison of Tidal Current
Observations from the ADCP, buoy MF14005, and HFR Nanao-Huilai were used to analyze the M2 tidal current characteristics in the coastal areas of Shantou (Table 1). Harmonic analysis of the observations showed that the coastal areas of Shantou belong to regular semi-diurnal tidal current, and the M2 tidal current dominates the overall tidal current. The maximum velocity observed by the ADCP was 0.872 m/s, and the M2 tidal current accounted for approximately 40% of the total amplitude. Based on the harmonic analysis of the ADCP current, the M2 tidal current had a semi-major axis of 0.334 m/s, a semi-minor axis of 0.036 m/s, and a phase of 278.0°. For buoy MF14005, the M2 tidal current had a semi-major axis of 0.286 m/s, a semi-minor axis of 0.045 m/s, and a phase of 273.4°. Based on the harmonic analysis of the HFR current during 2019–2020, the M2 tidal current had a semi-major axis of 0.379–0.395 m/s, a semi-minor axis of 0.019–0.028 m/s, and a phase of 277.7–279.0°. The M2 tidal current observed by the HFR is consistent with that obtained from the ADCP and buoy and is consistent with a previous study [38].

Table 1.
Tidal ellipses for M2 tidal currents observed by ADCP, buoy MF14005, and HFR Nanao-Huilai.
The characteristics of the M2 tidal current in the coastal areas of the Pearl River Estuary were analyzed using ADCP and HFR Wanshan-Shangchuan observations (Table 2). The harmonic analysis of the observations showed that the coastal areas of the Pearl River Estuary belong to regular semi-diurnal tidal current, with the M2 tidal current being the dominant component. The semi-major axis of the M2 tidal current observed by the ADCP was slightly larger than that obtained by the HFR, while the semi-minor axis and phase calculated from both ADCP and HFR were similar.
Table 2.
Tidal ellipses of M2 tidal currents observed by ADCP and HFR Wanshan-Shangchuan.
A comparison between HFR, ADCP, and the buoy showed that the tidal current observed by HFR was accurate and reliable and that the HFR data were suitable for further applications. The seasonal and interannual variations in tidal currents offshore of Guangdong were analyzed using the M2 tidal current because it was the most important tidal component in this area.
3.2. Seasonal Variations in M2 Tidal Current
The M2 tidal currents in the coastal areas of the Pearl River Estuary were obtained by conducting a harmonic analysis of the ocean current data for all four seasons of 2021, and the seasonal variations in the M2 tidal current were analyzed (Figure 2). Clear differences were observed in M2 tidal currents at the edges of the radar observation region, which may be due to the poor radar echo signal in these areas. To reduce the influence of currents in the edge area, only the data from the core area observed by HFR were used in subsequent analyses for the coastal areas of the Pearl River Estuary. In 2021, the M2 tidal current in the coastal area of the Pearl River Estuary showed a northwest–southeast direction (Figure 2a), which is consistent with previous research results [16,38]. Although the major and minor axis of M2 tidal currents in summer and autumn were almost identical to those of the full year of 2021, the inclination was significantly deflected in summer, followed by autumn. The tidal ellipses for M2 tidal currents in spring and winter were almost identical to those of the full year of 2021. This indicates that the M2 tidal current off the Pearl River Estuary shows significant seasonal change, with the largest differences of M2 tidal currents in summer, followed by autumn. The comparison results for the other years showed similar patterns to those obtained for 2021.
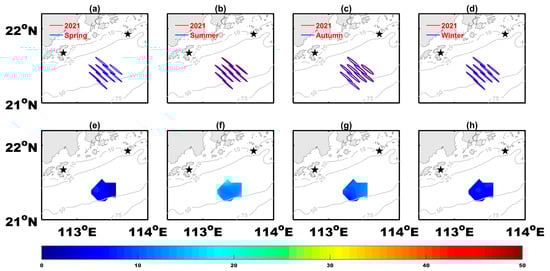
Figure 2.
The tidal ellipses and relative deviations for M2 tidal currents observed in different seasons in the coastal areas of the Pearl River Estuary in 2021. (a) tidal ellipses in 2021 and spring 2021; (b) tidal ellipses in 2021 and summer 2021; (c) tidal ellipses in 2021 and autumn 2021; (d) tidal ellipses in 2021 and winter 2021; (e) relative deviations in spring 2021; (f) relative deviations in summer 2021; (g) relative deviations in autumn 2021; (h) relative deviations in winter 2021. The black pentagrams indicate the locations of Wanshan and Shangchuan radar sites. March to May is spring, June to August is summer, September to November is autumn, and December to February is winter.
Here, we assessed whether the relative deviation of the M2 tidal currents was suitable for analyzing the differences in the tidal currents. The regional average relative deviations for spring, summer, autumn, and winter in 2021 were 5.2%, 14.3%, 11.2%, and 7.0%, respectively, while the maximum relative deviations were 8.7%, 20.3%, 13.6%, and 8.5%, respectively. The relative deviation of the M2 tidal current in the coastal areas of the Pearl River Estuary was the highest in summer, followed by autumn. The relative deviations in spring and winter were minimal. These changes in the relative deviation corresponded to the differences in the tidal ellipses of the M2 tidal currents. This implies that the relative deviation of the M2 tidal current can quantitatively describe significant changes in tidal currents. Thus, this approach was used in the present study.
Salinity data from the upper seawater layer showed that freshwater from the Pearl River can spread to the coastal areas of the Pearl River Estuary during summer and autumn, significantly reducing seawater salinity (Figure 3a). The impact of Pearl River freshwater on seawater was the greatest during summer, and salinity levels below 32 PSU (the outer boundary of the PRP [30,31]) were observed from 1978 to 1988. The average salinity in summer during this period was 31.95 PSU. During autumn, the impact was relatively lower, with an average salinity of 33.62 PSU, which was significantly lower than that observed during spring (34.12 PSU) and winter (34.07 PSU). The vertical standard deviation of salinity can effectively represent the strength of stratification: the larger the standard deviation, the stronger the stratification. The standard deviations of salinity during summer and autumn were 1.24 and 0.14 PSU, respectively. The standard deviation of salinity during summer was significantly greater than that during autumn, indicating stronger stratification during summer than during autumn (Figure 3b). The seasonal variation of the stratification in the continental shelf affects the vertical pro-file of the viscosity coefficient, which affects the velocity profile, ultimately leading to the seasonal variation of the M2 tidal current [4]. In summer, the Pearl River experiences its highest runoff, and freshwater spreads into the coastal areas of the Pearl River Estuary, strengthening the stratification of seawater. Consequently, the relative deviation of the M2 tidal current in this area reaches 20.3% during summer. In autumn, it is still affected by freshwater; however, the stratification weakens because of the reduced Pearl River runoff, and the relative deviation reaches only 13.6%.
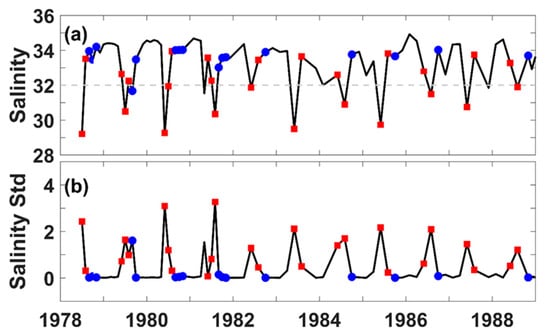
Figure 3.
Salinity in the upper ocean (a) and vertical salinity standard deviation (b) in the coastal areas of the Pearl River Estuary. Red squares represent summer observations, blue circles represent autumn observations, and the isohaline of the 32 PSU line (dashed line) represents the outer boundary of the Pearl River Plume [30,31].
Next, the M2 tidal currents in the coastal areas of Shantou were analyzed for the four seasons of 2019 (Figure 4). The major axis of the M2 tidal current in 2019 showed a northeast–southwest direction, parallel to the coastline. Near Cape Maqijiao, there were some subtle changes in the inclination of the M2 tidal currents across the four seasons. At individual points near Cape Maqijiao, the M2 current rotated counterclockwise in autumn and winter, while the M2 currents in other areas rotated clockwise. The corresponding relative deviations in all four seasons were significantly larger near Cape Maqijiao, reaching 15–20%. The area with significant relative deviation was larger in summer, and the maximum relative deviation in summer was the largest, reaching 22.1%. The maximum relative deviations in spring, autumn, and winter were 20.5%, 20.7%, and 20.7%, respectively. Except for the area near Cape Maqijiao, the tidal ellipses for M2 tidal currents in four seasons were basically consistent with those in the whole year of 2019. The corresponding relative deviations were also small, with average values of 4.3%, 7.8%, 5.9%, and 7.8% for spring, summer, autumn, and winter, respectively. Compared with the overall tidal current data from 2019, the relative deviation near Cape Maqijiao was the highest in summer. This might be due to poor radar echo signals in the edge areas. However, such deviations were negligible in other edge areas; therefore, this explanation was ruled out. The comparison results for the four seasons in other years were similar to those in 2019.
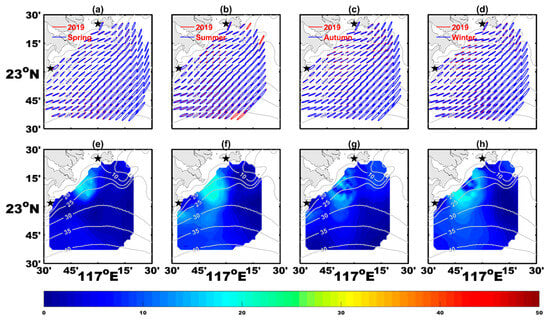
Figure 4.
The tidal ellipses and relative deviations for M2 tidal currents observed in different seasons in the coastal areas of Shantou in 2019. (a) tidal ellipses in 2019 and spring 2019; (b) tidal ellipses in 2019 and summer 2019; (c) tidal ellipses in 2019 and autumn 2019; (d) tidal ellipses in 2019 and winter 2019; (e) relative deviations in spring 2019; (f) relative deviations in summer 2019; (g) relative deviations in autumn 2019; (h) relative deviations in winter 2019. The solid (dashed) lines indicate the clockwise (counterclockwise) rotation of tidal currents. The black pentagrams indicate the locations of Nanao and Huilai radar sites.
The region near Cape Maqijiao is located at the outlet of the Hanjiang River. In spring, autumn, and winter, the freshwater from the Hanjiang River is confined to the northeastern side of Cape Maqijiao, and in summer, it spreads outward significantly, resulting in the presence of freshwater on the southwestern side of Cape Maqijiao (Figure 5). Owing to runoff, the stratification in the waters near Cape Maqijiao is the strongest in summer, followed by spring (Figure 6). The runoff of the Hanjiang River is the highest in summer, and freshwater spreads into the coastal areas around Cape Maqijiao, strengthening the stratification and ultimately resulting in the maximum relative deviation of the M2 tidal current. Although freshwater runoff is small and limited to the northeastern side of Cape Maqijiao in spring, autumn, and winter, the relative deviation in the waters near Cape Maqijiao still reaches 15–20%. This may be due to the sharp topography of Cape Maqijiao, which affects the propagation of tides; however, further verification is required.
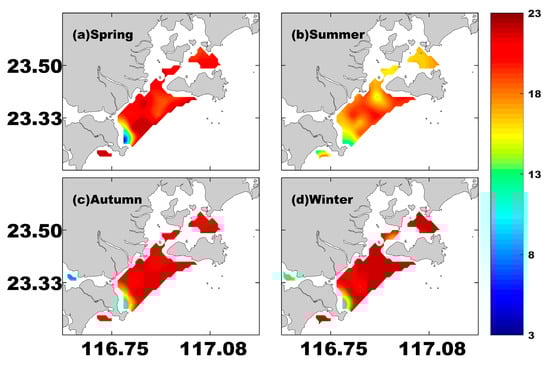
Figure 5.
Spatial distribution of density (kg/m3) in the coastal waters off Shantou in all four seasons.
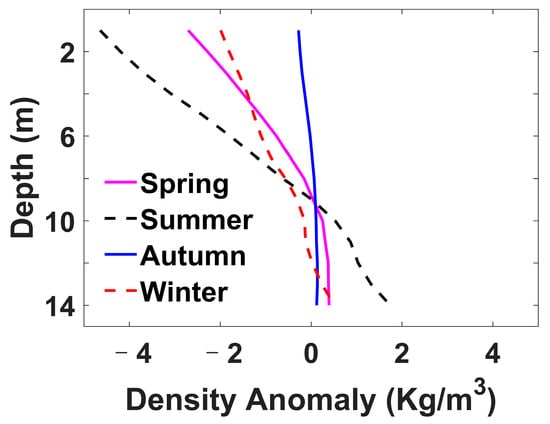
Figure 6.
Seasonal density profiles in the coastal waters off Shantou. Each density profile is subtracted from its depth-average density, and all profiles in a season are synthesized into a single profile.
The relative deviation of the M2 tidal current was the highest in summer in both the coastal areas of both the Pearl River Estuary and Cape Maqijao, while the area with significant seasonal changes in the M2 tidal current was larger in the coastal areas of the Pearl River Estuary. According to the China River Sediment Bulletin, the annual runoff from the Pearl River is approximately 13 times that of the Hanjiang River. This indicates that greater runoff results in a wider area with obvious seasonal variations in the M2 tidal current.
The above analysis, based on observations from different radar systems in different regions, shows that the M2 tidal current exhibits significant seasonal variation in areas affected by runoff. The extent of these seasonal variations in the M2 tidal current and the corresponding relative deviations are influenced by seasonal variations in runoff. In the nearshore areas of Guangdong, the relative deviation of the M2 tidal current can reach 10–20%. Guangdong coastal current has significant seasonal changes, and influences the spread of the river plume, which could affect the extent of significant seasonal variations in the M2 tidal current.
3.3. Interannual Variations in M2 Tidal Current
The interannual variations in M2 tidal currents in the coastal areas of the Pearl River Estuary were analyzed using the observations from HFR Wanshan-Shangchuan for the period 2019–2022. Compared with the M2 tidal current in 2019, the relative deviations in the core area were minimal from 2020 to 2022, with average relative deviations of 4.2%, 6.0%, and 4.4% and maximum relative deviations of 8.3%, 9.1%, and 8.5%, respectively (Figure 7). These results indicate that there was no significant interannual change in the M2 tidal current in the coastal areas of the Pearl River Estuary from 2019 to 2022.
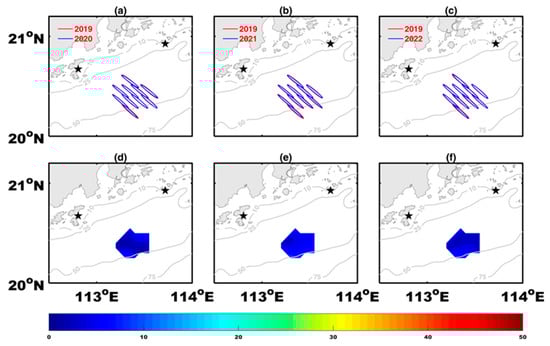
Figure 7.
The tidal ellipses and relative deviations for M2 tidal currents observed in the coastal areas of the Pearl River Estuary for the period 2019–2022. (a) tidal ellipses in 2019 and 2020; (b) tidal ellipses in 2019 and 2021; (c) tidal ellipses in 2019 and 2022; (d) relative deviations in 2020; (e) relative deviations in 2021; (f) relative deviations in 2022. The black pentagrams indicate the locations of Wanshan and Shangchuan radar sites.
Using the observations from HFR Nanao-Huilai during 2019–2022, the interannual variations in the M2 tidal current in the coastal areas of Shantou were analyzed (Figure 8). The spatial distribution of the M2 tidal current in 2020 was nearly identical to that in 2019, with an average relative deviation of 4.9%. However, in 2021, the M2 tidal currents showed significant changes in most of the observation areas when compared to 2019; for example, the major axis became shorter, the minor axis became longer, and the inclination was significantly deflected (Figure 8b). The relative deviation of the M2 tidal current between 2019 and 2021 was significantly larger, with an average relative deviation of 17.9% and a maximum relative deviation of 33.4%. The spatial distribution of the M2 tidal current in 2022 was nearly identical to that in 2021, with an average relative deviation of 9.3% (Figure 8c). The consistency between the M2 tidal currents in 2020 and 2019, as well as between 2022 and 2021, indicates that no significant interannual change occurred in the M2 tidal current in the coastal areas of Shantou, and the M2 tidal current likely exhibited an abrupt change in 2021.
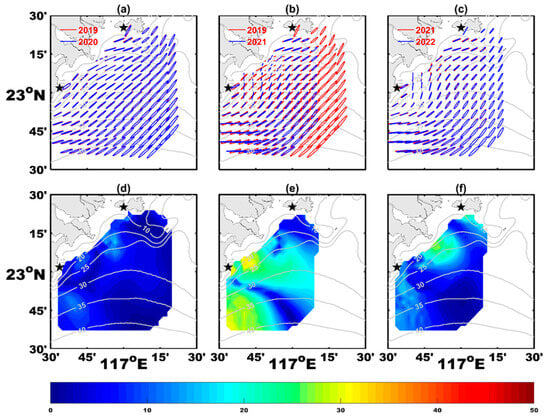
Figure 8.
The tidal ellipses and relative deviations for M2 tidal currents observed in the coastal areas of Shantou for the period 2019–2022. (a) tidal ellipses in 2019 and 2020; (b) tidal ellipses in 2019 and 2021; (c) tidal ellipses in 2021 and 2022; (d) relative deviations in 2020; (e) relative deviations in 2021 (f) relative deviations in 2022. The solid (dashed) lines indicate the clockwise (counterclockwise) rotation of tidal currents. The black pentagrams indicate the locations of Nanao and Huilai radar sites.
The above analysis, based on observations from different radar systems in different regions, shows that there is no significant interannual change in the M2 tidal current in the coastal areas of Guangdong. This finding is consistent with traditional cognition, as tidal currents are mainly affected by the movement of celestial bodies and are thus very stable.
The M2 tidal currents were highly stable before and after the sudden change observed in 2021 (Figure 8). The abrupt change in the M2 tidal current in 2021 may have been caused by the changes in the hydrological environment in the coastal area [4] or changes in the surrounding environment of the radar antennas [39,40]. However, while the M2 tidal current showed significant seasonal variations only near Cape Maqijiao, the abrupt change in 2021 occurred in the entire radar observation area. This suggests that the abrupt change in the M2 tidal current in 2021 was not caused by changes in the nearshore hydrological environment.
The antenna patterns of the Nanao and Huilai radars were measured in July 2022 (Figure 9). The results indicated that these patterns significantly deviated from the ideal situation and were distorted. The Nanao and Huilai radars were established in January 2018 and December 2017, respectively. Over time, objects within the near-field range of the radar antenna (such as metal railings, houses, fences, woods, rocks, and water bodies) have changed. Owing to the mutual electromagnetic coupling between the objects and the antenna, the antenna patterns deviate from the ideal situation, which leads to changes in the ocean current data [39,40]. Therefore, the sudden change in the M2 tidal current in 2021 was most likely caused by distortions in the antenna patterns owing to environmental changes around the Nanao and Huilai radar stations since their establishment.
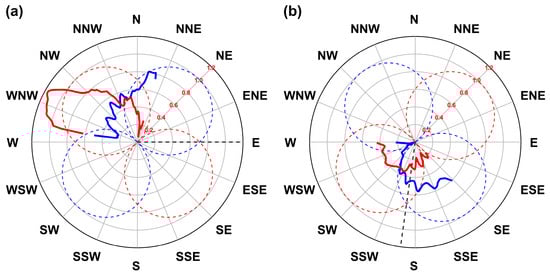
Figure 9.
Measured antenna patterns of the (a) Huilai and (b) Nanao radars. The red and blue solid lines indicate the measured antenna patterns of loops A and B, respectively. The red and blue dashed lines indicate the ideal antenna patterns of loops A and B, respectively. The black dashed line indicates the normal direction of radar.
4. Discussion
In this study, seasonal and interannual changes in the M2 tidal current off the Guangdong coast are analyzed and the effects of stratification caused by rivers are discussed. Although seasonal changes have been observed in the other constituents, amplitudes of these constituents are not significantly larger than the root-mean-square errors of HFR. Therefore, seasonal changes in the other constituents were not discussed in this study. Offshore tidal changes are complex and susceptible to changes in geometry, sea-level rise, stratification, and internal tides [2,3]. Although anthropogenic activities, such as offshore wind farms, are present in the HFR observation areas, they do not change the topography as significantly as in ports and estuaries. Therefore, the seasonal variations in the M2 tidal current off the Guangdong coast are likely independent of the alterations in geometry. According to the China Sea Level Bulletin, the rate of sea-level rise in the SCS was 3.6 mm/year from 1980 to 2022. In addition, the complex topography and strong oceanic stratification of the SCS make it one of the most active tidal waters in the world [41,42]. Studies on other areas suggest that rising sea levels and changes in internal tides can cause tidal changes [9,11]. A more comprehensive study discussing the influence of these factors on tidal changes is a direction for future research.
5. Conclusions
In this study, the M2 tidal current in the coastal areas of Guangdong was analyzed using observations from ADCP, buoy, and HFR. The M2 tidal current characteristics obtained from HFR were consistent with the results of ADCP and the buoy. Observation results show that the coastal areas of Guangdong exhibit a regular semi-diurnal tidal current, with the M2 tidal current as the dominant component. Seasonal and interannual variations in the M2 tidal currents in the coastal areas of Guangdong were analyzed using observational data from different radar systems in different regions. The M2 tidal current exhibited significant seasonal variations in areas affected by river runoff. Analysis of temperature–salinity profiles for the periods 2006–2007 and 1978–1988 indicated that the river plume enhanced the stratification of seawater. Seasonal variation in stratification affects vertical eddy viscosity and, in turn, the vertical profile of currents, thereby causing variations in the M2 tidal current. The runoff is the highest in summer, resulting in the largest relative deviation of the M2 tidal current, reaching 10–20%. The larger the runoff, the wider the area in which the M2 tidal current exhibits significant seasonal variation. No significant interannual variation in the M2 tidal current was observed during the observation period; however, a sudden change occurred in the coastal areas of Shantou in 2021. Further analysis indicated that this sudden change was mainly caused by the distortion of antenna patterns.
Author Contributions
Conceptualization, R.Z. and X.X.; methodology, T.Z. and Y.T.; software, X.X.; validation, P.W. and C.H.; formal analysis, C.H., T.Z. and Y.T.; data curation, P.W.; writing—original draft preparation, C.H.; writing—review and editing, T.Z. and C.H.; visualization, C.H.; supervision, L.Z. and R.S.; funding acquisition, T.Z., R.Z, Q.W. and C.H. All authors have read and agreed to the published version of the manuscript.
Funding
This research was funded by the Key Laboratory of Marine Environmental Survey Technology and Application of the Ministry of Natural Resources, P. R. China (No. MESTA-2021-A006), the Science and Technology Development Foundation of the South China Bureau, the Ministry of Natural Resources (Nos. 230101, 230102), the Guangdong Basic and Applied Basic Research Foundation (No. 2024B1515020099), the Guangdong-Hong Kong-Macao Greater Bay Area Branch, the National Marine Data Center (No. 2024B1212080006), and the National Natural Science Foundation of China (Nos. 42076026 and 42276004).
Data Availability Statement
The original contributions presented in the study are included in the article, further inquiries can be directed to the corresponding author.
Acknowledgments
We are grateful to the editor and anonymous reviewers for their valuable suggestions and comments which greatly help to improve the manuscript. We also thank Dongxiao Wang for the helpful discussion.
Conflicts of Interest
Author Xinjun Xu was employed by the Wuhan Starband Communication Equipment Co., Ltd. The remaining authors declare that the research was conducted in the absence of any commercial or financial relationships that could be construed as a potential conflict of interest.
References
- Jay, D.A. Evolution of tidal amplitudes in the eastern Pacific Ocean. Geophys. Res. Lett. 2009, 36, L04603. [Google Scholar] [CrossRef]
- Devlin, A.T.; Jay, D.A.; Zaron, E.D.; Talke, S.A.; Pan, J.; Lin, H. Tidal variability related to sea level variability in the Pacific Ocean. J. Geophys. Res. Ocean. 2017, 122, 8445–8463. [Google Scholar] [CrossRef]
- Opel, L.; Schindelegger, M.; Ray, R.D. A likely role for stratification in long-term changes of the global ocean tides. Commun. Earth Environ. 2024, 5, 261. [Google Scholar] [CrossRef]
- Müller, M.; Cherniawsky, J.Y.; Foreman, M.G.G.; von Storch, J.-S. Seasonal variation of the M2 tide. Ocean Model. 2014, 64, 159–177. [Google Scholar] [CrossRef]
- Haigh, I.D.; Pickering, M.D.; Green, J.A.M.; Arbic, B.K.; Arns, A.; Dangendorf, S.; Hill, D.F.; Horsburgh, K.; Howard, T.; Idier, D.; et al. The tides they are a-changin’: A comprehensive review of past and future nonastronomical changes in tides, their driving mechanisms, and future implications. Rev. Geophys. 2020, 58, e2018RG00063. [Google Scholar] [CrossRef]
- Jay, D.A.; Leffler, K.; Degens, S. Long-term evolution of Columbia River tides. J. Waterw. Port Coast. Ocean. Eng. 2011, 137, 182–191. [Google Scholar] [CrossRef]
- Talke, S.A.; Jay, D.A. Changing tides: The role of natural and anthropogenic factor. Annu. Rev. Mar. Sci. 2020, 12, 121–151. [Google Scholar] [CrossRef]
- Kang, S.K.; Foreman, M.G.G.; Lie, H.J.; Lee, J.H.; Cherniawsky, J.Y.; Yum, K.D. Two-layer tidal modeling of the Yellow and East China Seas with application to seasonal variability of the M2 tide. J. Geophys. Res. 2002, 107, 3020. [Google Scholar] [CrossRef]
- Arbic, B.K.; Karsten, R.H.; Garrett, C. On tidal resonance in the global ocean and the back-effect of coastal tides upon open-ocean tides. Atmos. Ocean 2009, 47, 239–266. [Google Scholar] [CrossRef]
- Colosi, J.A.; Munk, W. Tales of the venerable Honolulu tide gauge. J. Phys. Oceanogr. 2006, 36, 967–996. [Google Scholar] [CrossRef]
- Müller, M. The influence of changing stratification conditions on barotropic tidal transport. Cont. Shelf Res. 2012, 47, 107–188. [Google Scholar] [CrossRef]
- Schindelegger, M.; Kotzian, D.P.; Ray, R.D.; Green, J.A.M.; Stolzenberger, S. Interannual changes in tidal conversion modulate M2 amplitudes in the Gulf of Maine. Geophys. Res. Lett. 2022, 49, e2022GL101671. [Google Scholar] [CrossRef]
- Fassoni-Andrade, A.C.; Durand, F.; Azevedo, A.; Bertin, X.; Santos, L.G.; Khan, J.M.; Testut, L.; Moreira, D.M. Seasonal to interannual variability of the tide in the Amazon estuary. Cont. Shelf Res. 2023, 255, 104945. [Google Scholar] [CrossRef]
- Zhao, J.; Chen, X.; Hu, W.; Chen, J.; Guo, M. Dynamics of surface currents over Qingdao coastal waters in August 2008. J. Geophys. Res. 2011, 116, C10020. [Google Scholar] [CrossRef]
- Liu, Y.; Weisberg, R.H.; Merz, C.R. Assessment of CODAR SeaSonde and WERA HF Radars in Mapping Surface Currents on the West Florida Shelf. J. Atmos. Ocean. Technol. 2014, 31, 1363–1382. [Google Scholar] [CrossRef]
- Zhu, L.; Lu, T.; Yang, F.; Liu, B.; Wu, L.; Wei, J. Comparisons of Tidal Currents in the Pearl River Estuary between High-Frequency Radar Data and Model Simulations. Appl. Sci. 2022, 12, 6509. [Google Scholar] [CrossRef]
- Fang, G.; Kwok, Y.K.; Yu, K.; Zhu, Y. Numerical simulation of principal tidal constituents in the South China Sea, Gulf of Tonkin and Gulf of Thailand. Cont. Shelf Res. 1999, 19, 845–869. [Google Scholar] [CrossRef]
- Zu, T.; Gan, J.; Erofeeva, S.Y. Numerical study of the tide and tidal dynamics in the South China Sea. Deep-Sea Res. Part I Oceanogr. Res. Pap. 2008, 55, 137–154. [Google Scholar] [CrossRef]
- Wang, Y.; Zhang, T.; Zhu, X. Tidal characteristics analysis in the South China Sea by 18.6 years satellite altimetry data. Mar. Forecast. 2014, 31, 35–40, (In Chinese with English Abstract). [Google Scholar] [CrossRef]
- Li, R.; Chen, C.; Xia, H.; Beardsley, R.C.; Shi, M.; Lai, Z.; Lin, H.; Feng, Y.; Liu, C.; Xu, Q.; et al. Observed wintertime tidal and subtidal currents over the continental shelf in the northern South China Sea. J. Geophys. Res. Ocean. 2014, 119, 5289–5310. [Google Scholar] [CrossRef]
- Zhu, J.; Hu, J.; Zhang, W.; Zeng, G.; Chen, D.; Shang, S. Numerical study on tides in the Taiwan Strait and its adjacent areas. Mar. Sci. Bull. 2009, 11, 23–36. [Google Scholar]
- Wu, W.; Yan, Y.; Song, D. Study on the tidal dynamics in Daya Bay, China—Part I. Observation and numerical simulation of tidal dynamic system. J. Trop. Oceanogr. 2017, 36, 34–45, (In Chinese with English Abstract). [Google Scholar] [CrossRef]
- Yan, Y.; Wu, W.; Song, D.; Bao, X. Study on the tidal dynamics in Daya Bay, China—Part II. The generation of double high waters and double-peak flood-current flows. J. Trop. Oceanogr. 2017, 36, 46–54, (In Chinese with English Abstract). [Google Scholar] [CrossRef]
- Pan, H.; Devlin, A.T.; Xu, T.; Lv, X.; Wei, Z. Anomalous 18.61-Year Nodal Cycles in the Gulf of Tonkin Revealed by Tide Gauges and Satellite Altimeter Records. Remote Sens. 2022, 14, 3672. [Google Scholar] [CrossRef]
- Feng, X.; Tsimplis, M.N.; Woodworth, P.L. Nodal variations and long-term changes in the main tides on the coasts of China. J. Geophys. Res. Ocean. 2015, 120, 1215–1232. [Google Scholar] [CrossRef]
- Pan, H.; Wang, Y.; Lv, X. The study of the trends of tidal amplitudes of major constituents in the South China Sea. Haiyang Xuebao 2021, 43, 26–34, (In Chinese with English Abstract). [Google Scholar] [CrossRef]
- Zhao, J.; Zhang, Y.; Liu, Z.; Zhao, Y.; Wang, M. Seasonal variability of tides in the deep northern South China Sea. Sci. China Earth Sci. 2019, 62, 671–683, (In Chinese with English Abstract). [Google Scholar] [CrossRef]
- Yang, Y.; Wang, Y.; Cai, S.; Liu, F. Interannual and intra-annual variation characteristics of runoff in downstream areas of Pearl River basin during 1960–2017. Bull. Soil Water Conserv. 2019, 39, 23–31, (In Chinese with English Abstract). [Google Scholar] [CrossRef]
- Harrison, P.J.; Yin, K.; Lee, J.H.W.; Gan, J.; Liu, H. Physical-biological coupling in the Pearl River Estuary. Cont. Shelf Res. 2008, 28, 1405–1415. [Google Scholar] [CrossRef]
- Ou, S.; Zhang, H.; Wang, D. Dynamics of the buoyant plume off the Pearl River Estuary in summer. Environ. Fluid Mech. 2009, 9, 471–492. [Google Scholar] [CrossRef]
- Zu, T.; Wang, D.; Gan, J.; Guan, W. On the role of wind and tide in generating variability of Pearl River plume during summer in a coupled wide estuary and shelf system. J. Mar. Syst. 2014, 136, 65–79. [Google Scholar] [CrossRef]
- Shu, Y.; Chen, J.; Yao, J.; Pan, J.; Wang, W.; Mao, H.; Wang, D. Effects of the Pearl River plume on the vertical structure of coastal currents in the Northern South China Sea during summer 2008. Ocean Dyn. 2014, 64, 1743–1752. [Google Scholar] [CrossRef]
- Zhu, D.; Shao, h.; Li, Y.; Li, L. Quality analyses of radial currents measured by a demonstration system of OSMAR HF radar in Fujian Province. J. Oceanogr. Taiwan Strait 2007, 26, 7–16, (In Chinese with English Abstract). [Google Scholar]
- Wen, B.; Li, Z.; Zhou, H.; Shi, Z.; Wu, S.; Wang, X.; Yang, H.; Li, S. Sea surface currents detection at the eastern China Sea by HF ground wave radar OSMAR-S. Acta Electron. Sin. 2009, 37, 2778–2782. [Google Scholar] [CrossRef]
- Lai, Y.; Zhou, H.; Yang, J.; Zeng, Y.; Wen, B. Submesoscale eddies in the Taiwan Strait observed by high-frequency radars: Detection algorithms and eddy properties. J. Atmos. Ocean. Technol. 2017, 34, 939–953. [Google Scholar] [CrossRef]
- Huang, C.; Zeng, L.; Wang, D.; Wang, Q.; Wang, P.; Zu, T. Submesoscale eddies in eastern Guangdong identified using high-frequency radar observations. Deep Sea Res. Part II Top. Stud. Oceanogr. 2023, 207, 105220. [Google Scholar] [CrossRef]
- Pawlowicz, R.; Beardsley, B.; Lentz, S. Classical tidal harmonic analysis including error estimates in MATLAB using T_TIDE. Comput. Geosci. 2002, 28, 929–937. [Google Scholar] [CrossRef]
- Ding, W. Distribution of tides and tidal currents in the South China Sea. Oceanol. Limnol. Sin. 1986, 17, 468–480, (In Chinese with English Abstract). [Google Scholar]
- Tian, Y.; Wen, B.; Tan, J.; Li, Z. Study on pattern distortion and DOA estimation performance of crossed-loop/monopole antenna in HF radar. IEEE Trans. Antennas Propag. 2017, 65, 6095–6106. [Google Scholar] [CrossRef]
- Tian, Y.; Wen, B.; Li, Z.; Yin, Y.; Huang, W. Analysis and validation of an improved method for measuring HF surface wave radar antenna pattern. IEEE Antennas Wirel. Propag. Lett. 2019, 18, 659–663. [Google Scholar] [CrossRef]
- Gao, X.; Wei, Z.; Lv, X.; Wang, Y.; Fang, G. Numerical study of tidal dynamics in the South China Sea with adjoint method. Ocean Model. 2015, 92, 101–114. [Google Scholar] [CrossRef]
- Bai, X.; Lamb, K.G.; Liu, Z.; Hu, J. Intermittent Generation of Internal Solitary-Like Waves on the Northern Shelf of the South China Sea. Geophys. Res. Lett. 2023, 50, e2022GL102502. [Google Scholar] [CrossRef]
Disclaimer/Publisher’s Note: The statements, opinions and data contained in all publications are solely those of the individual author(s) and contributor(s) and not of MDPI and/or the editor(s). MDPI and/or the editor(s) disclaim responsibility for any injury to people or property resulting from any ideas, methods, instructions or products referred to in the content. |
© 2025 by the authors. Licensee MDPI, Basel, Switzerland. This article is an open access article distributed under the terms and conditions of the Creative Commons Attribution (CC BY) license (https://creativecommons.org/licenses/by/4.0/).