
New Method for Single-Site Cloud-to-Ground Lightning Location Based on Tri-Pre Processing

Abstract

1. Introduction
2. Instrumentation and Data Source
3. Methods
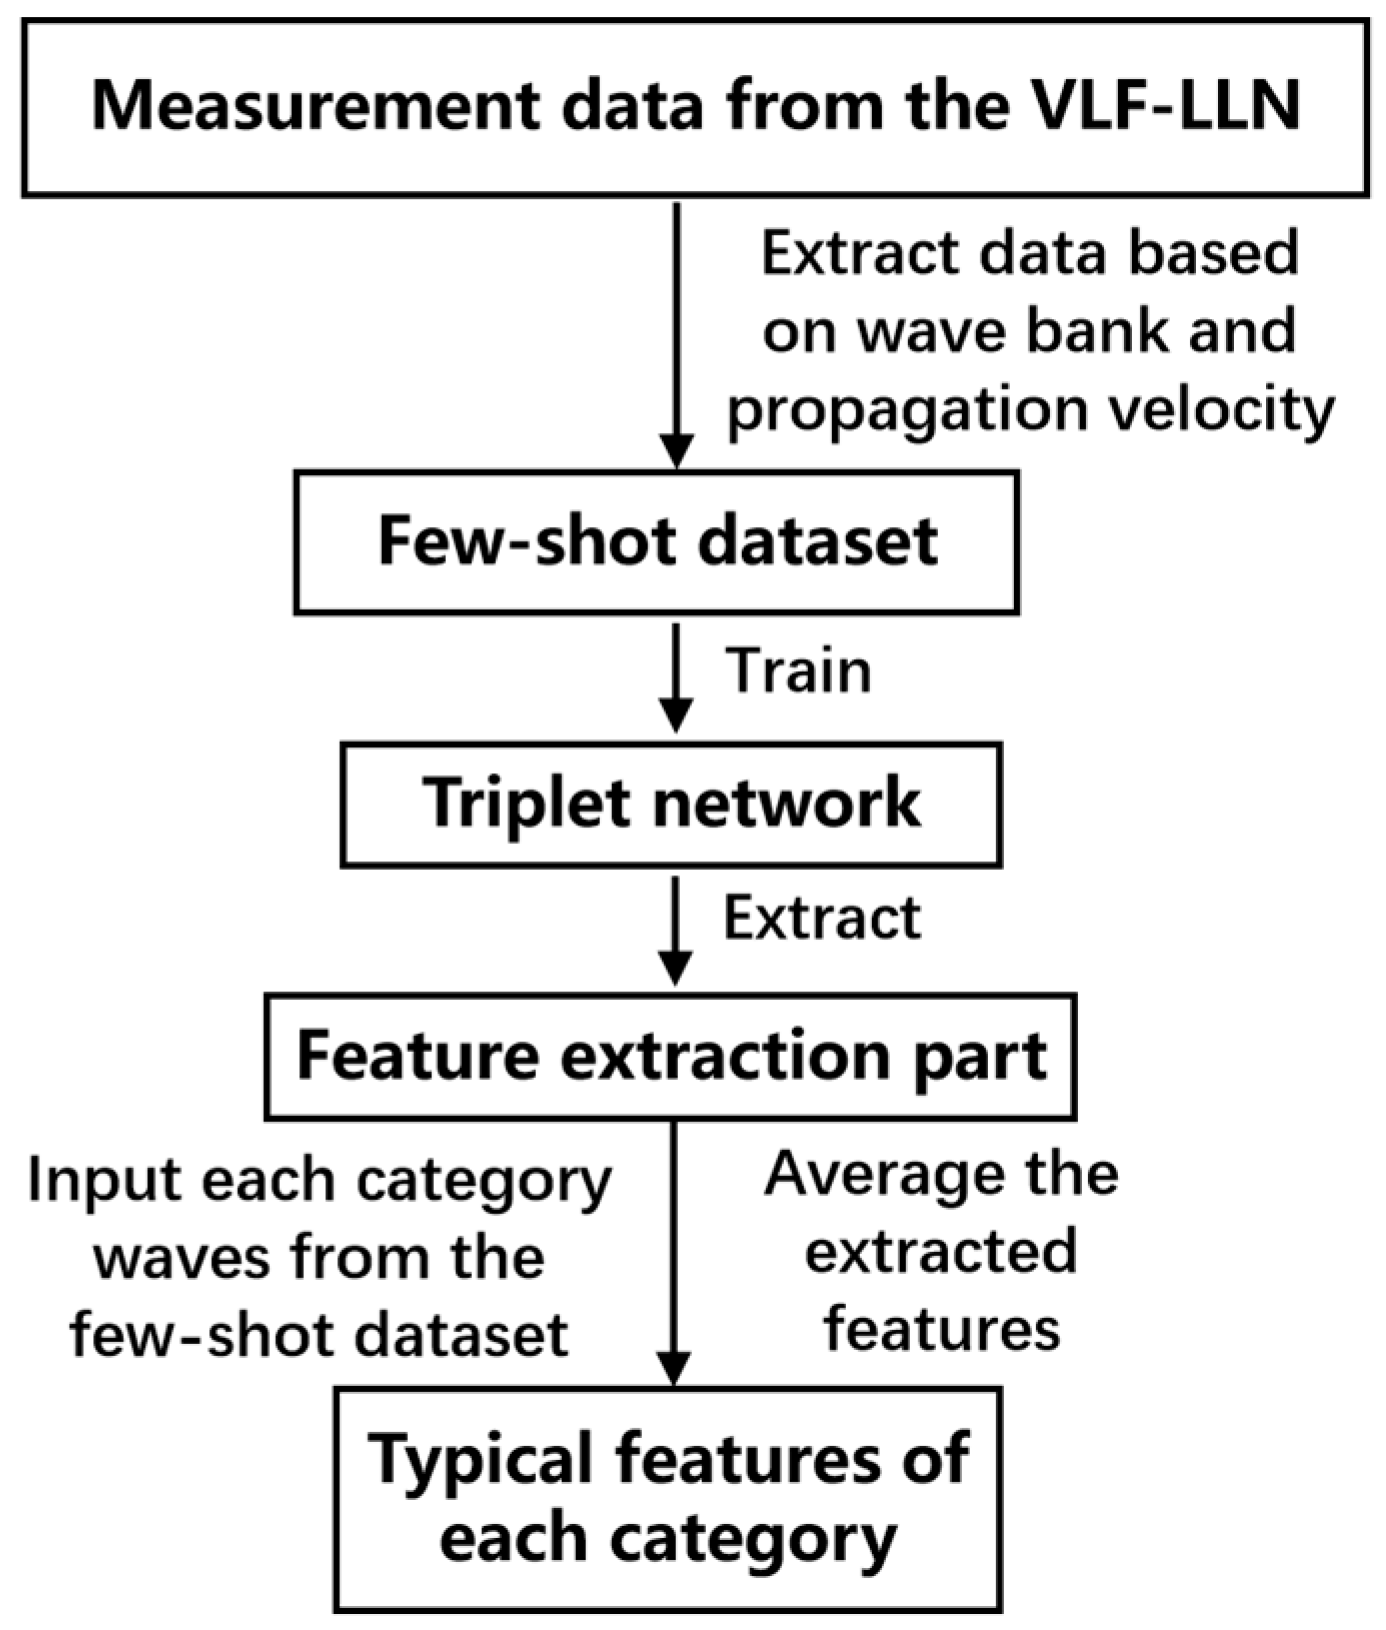
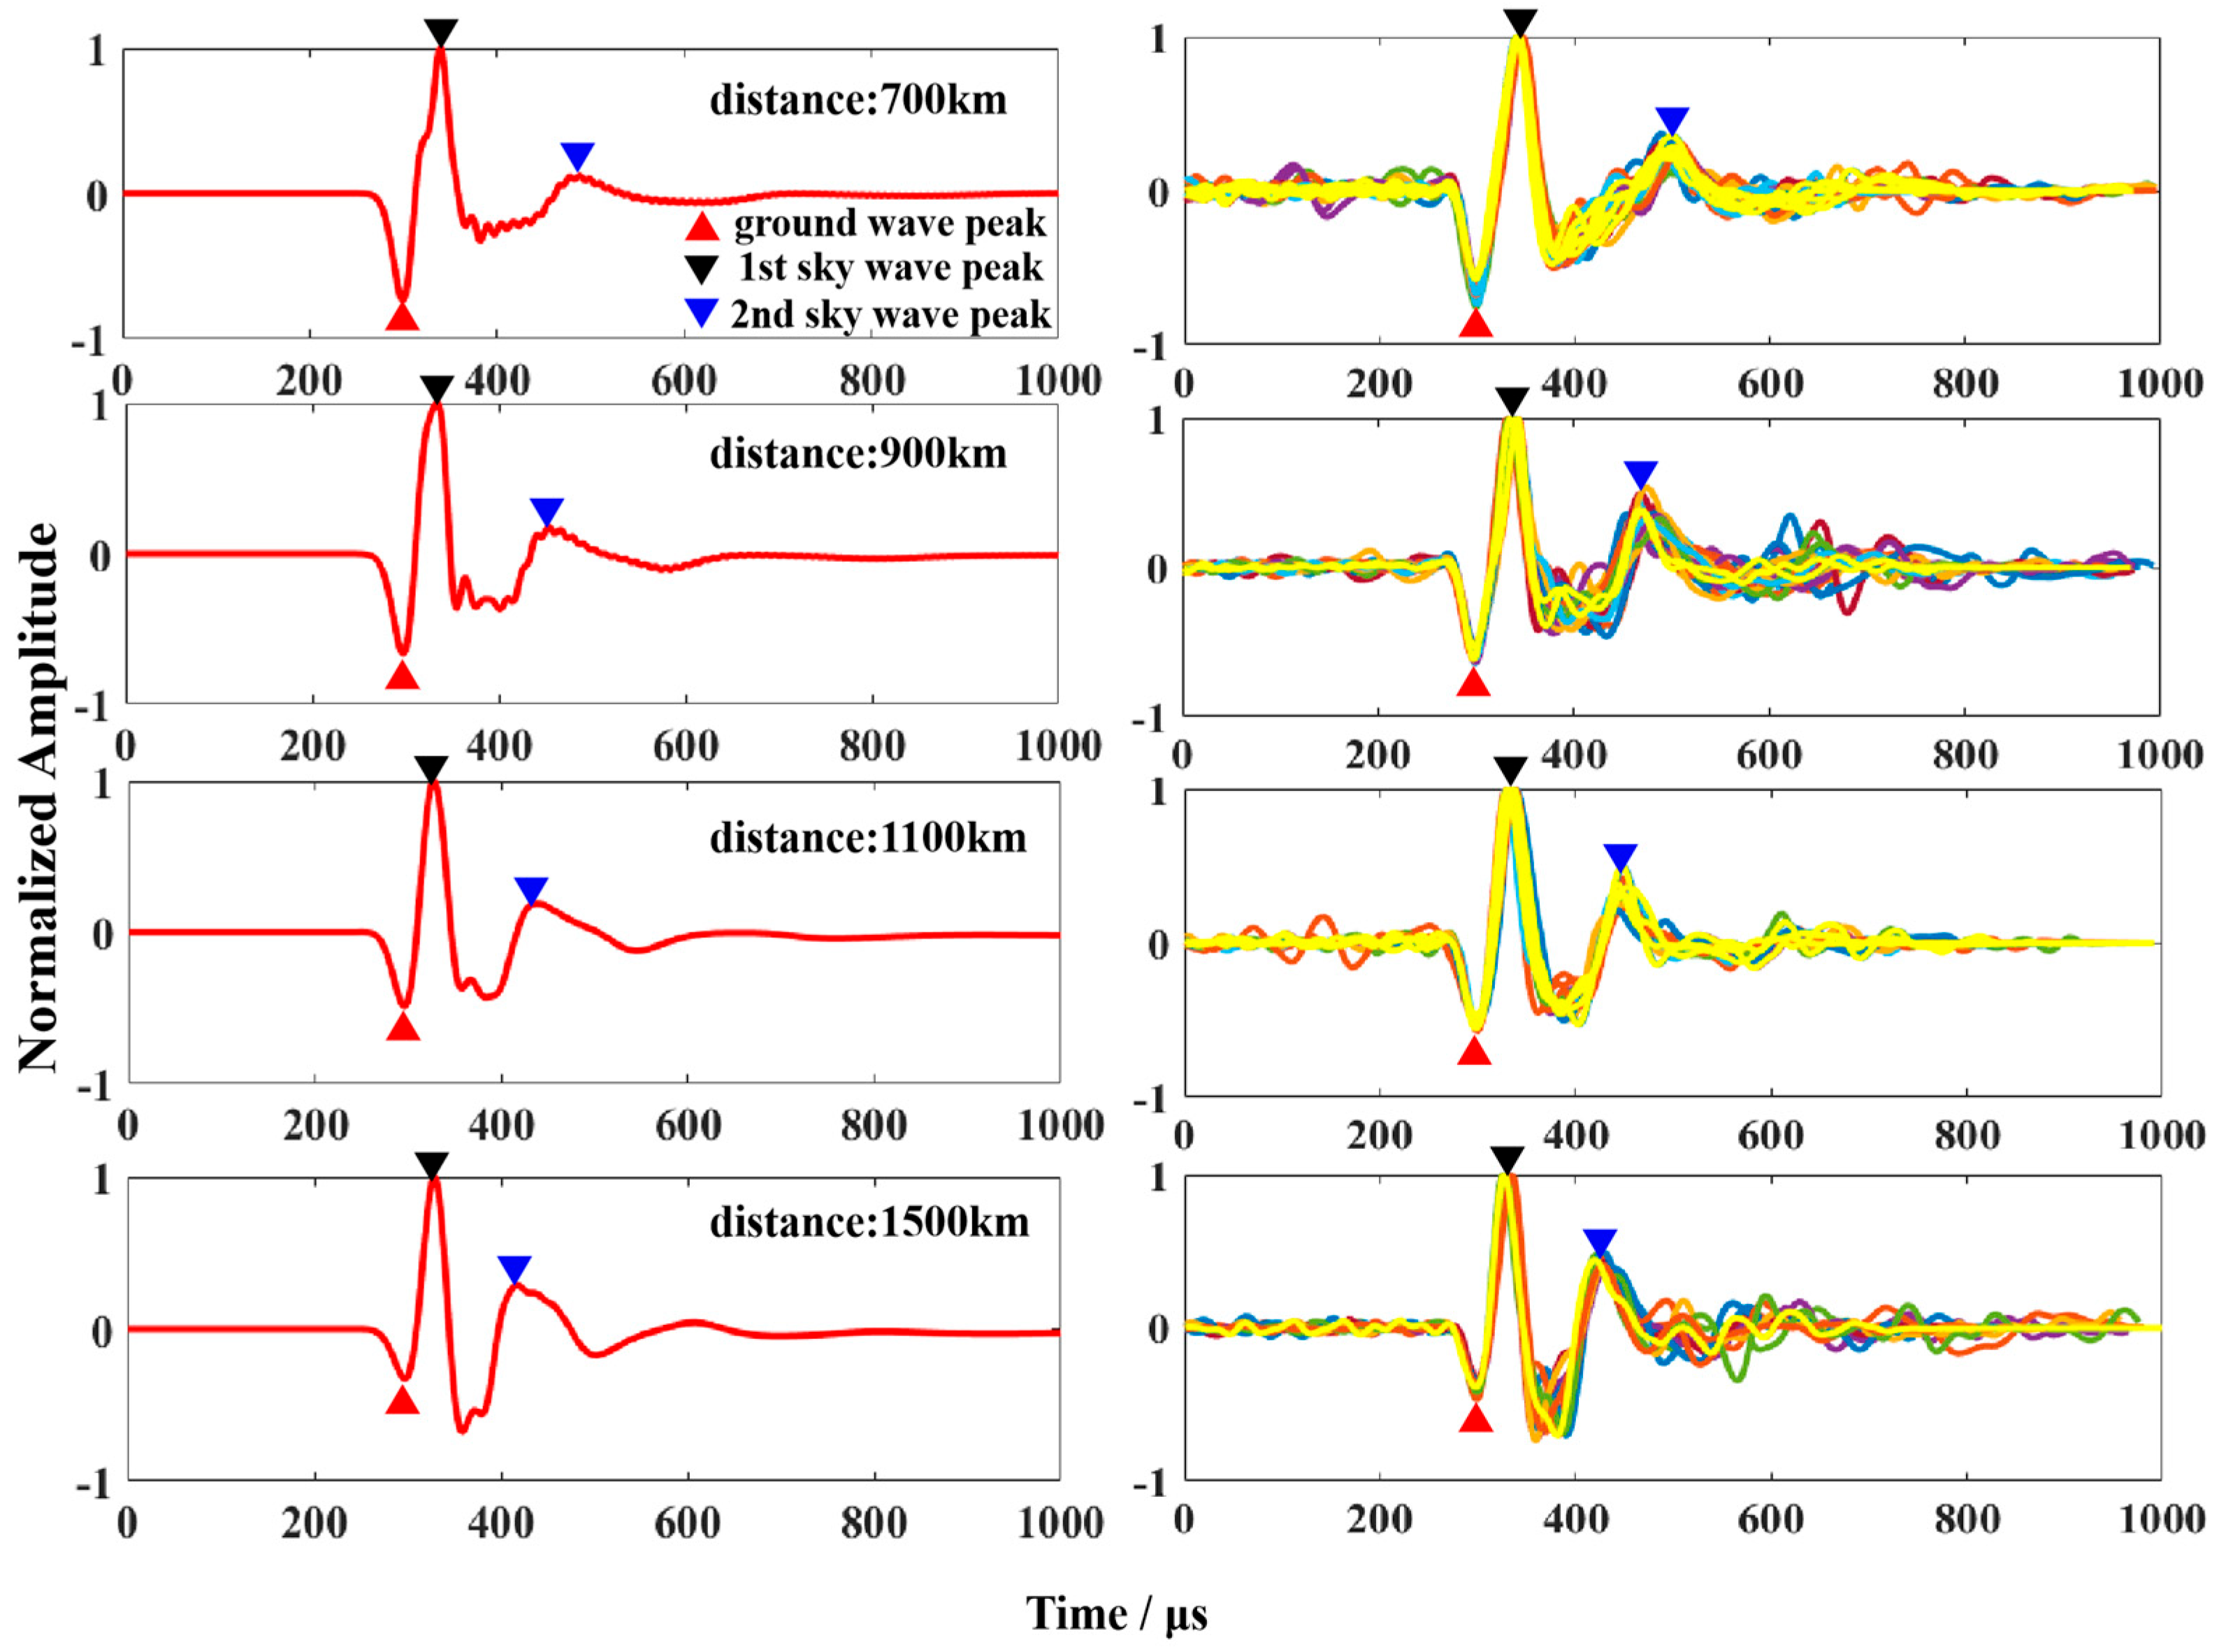
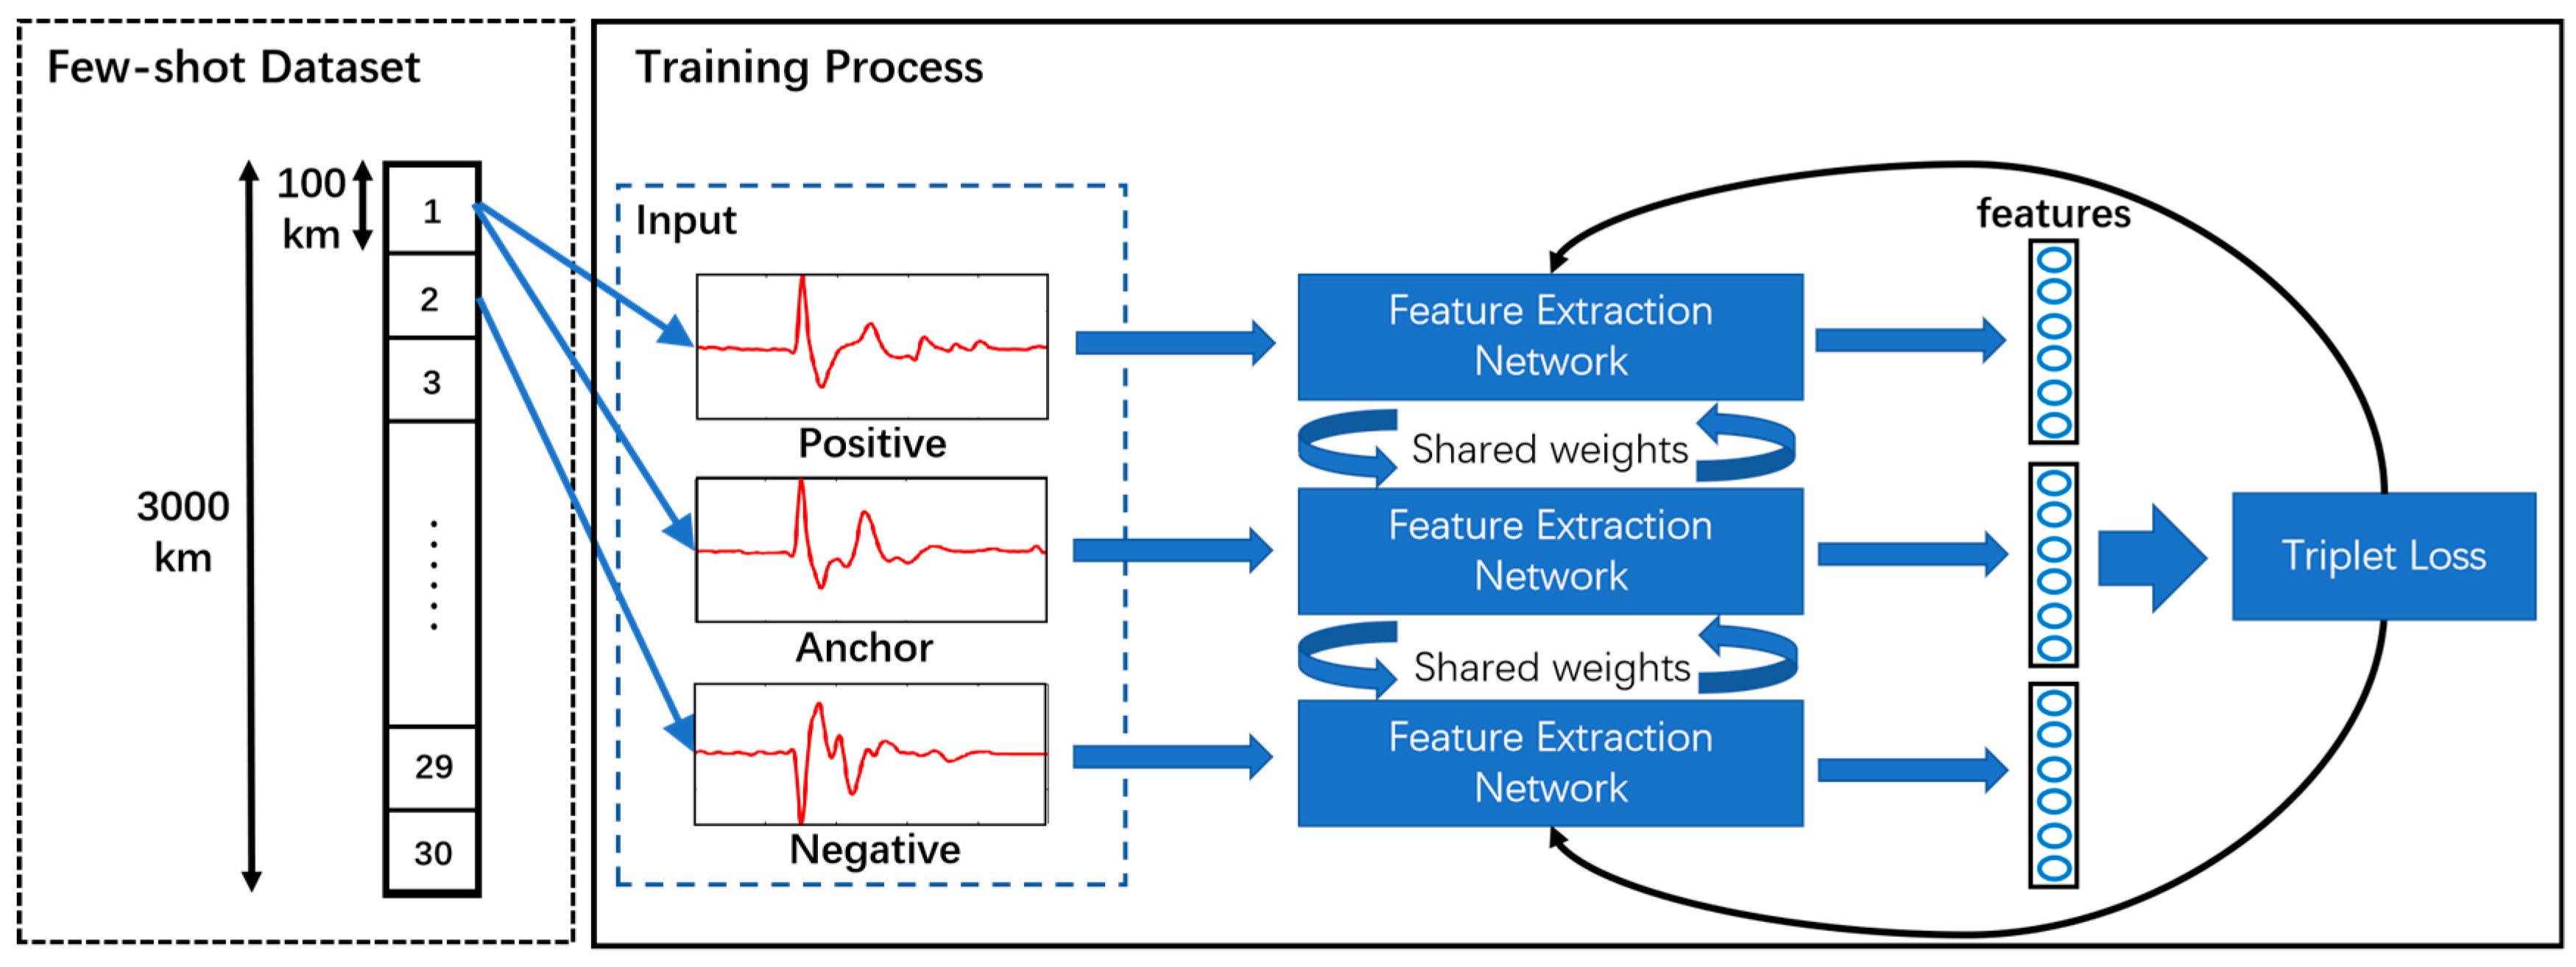
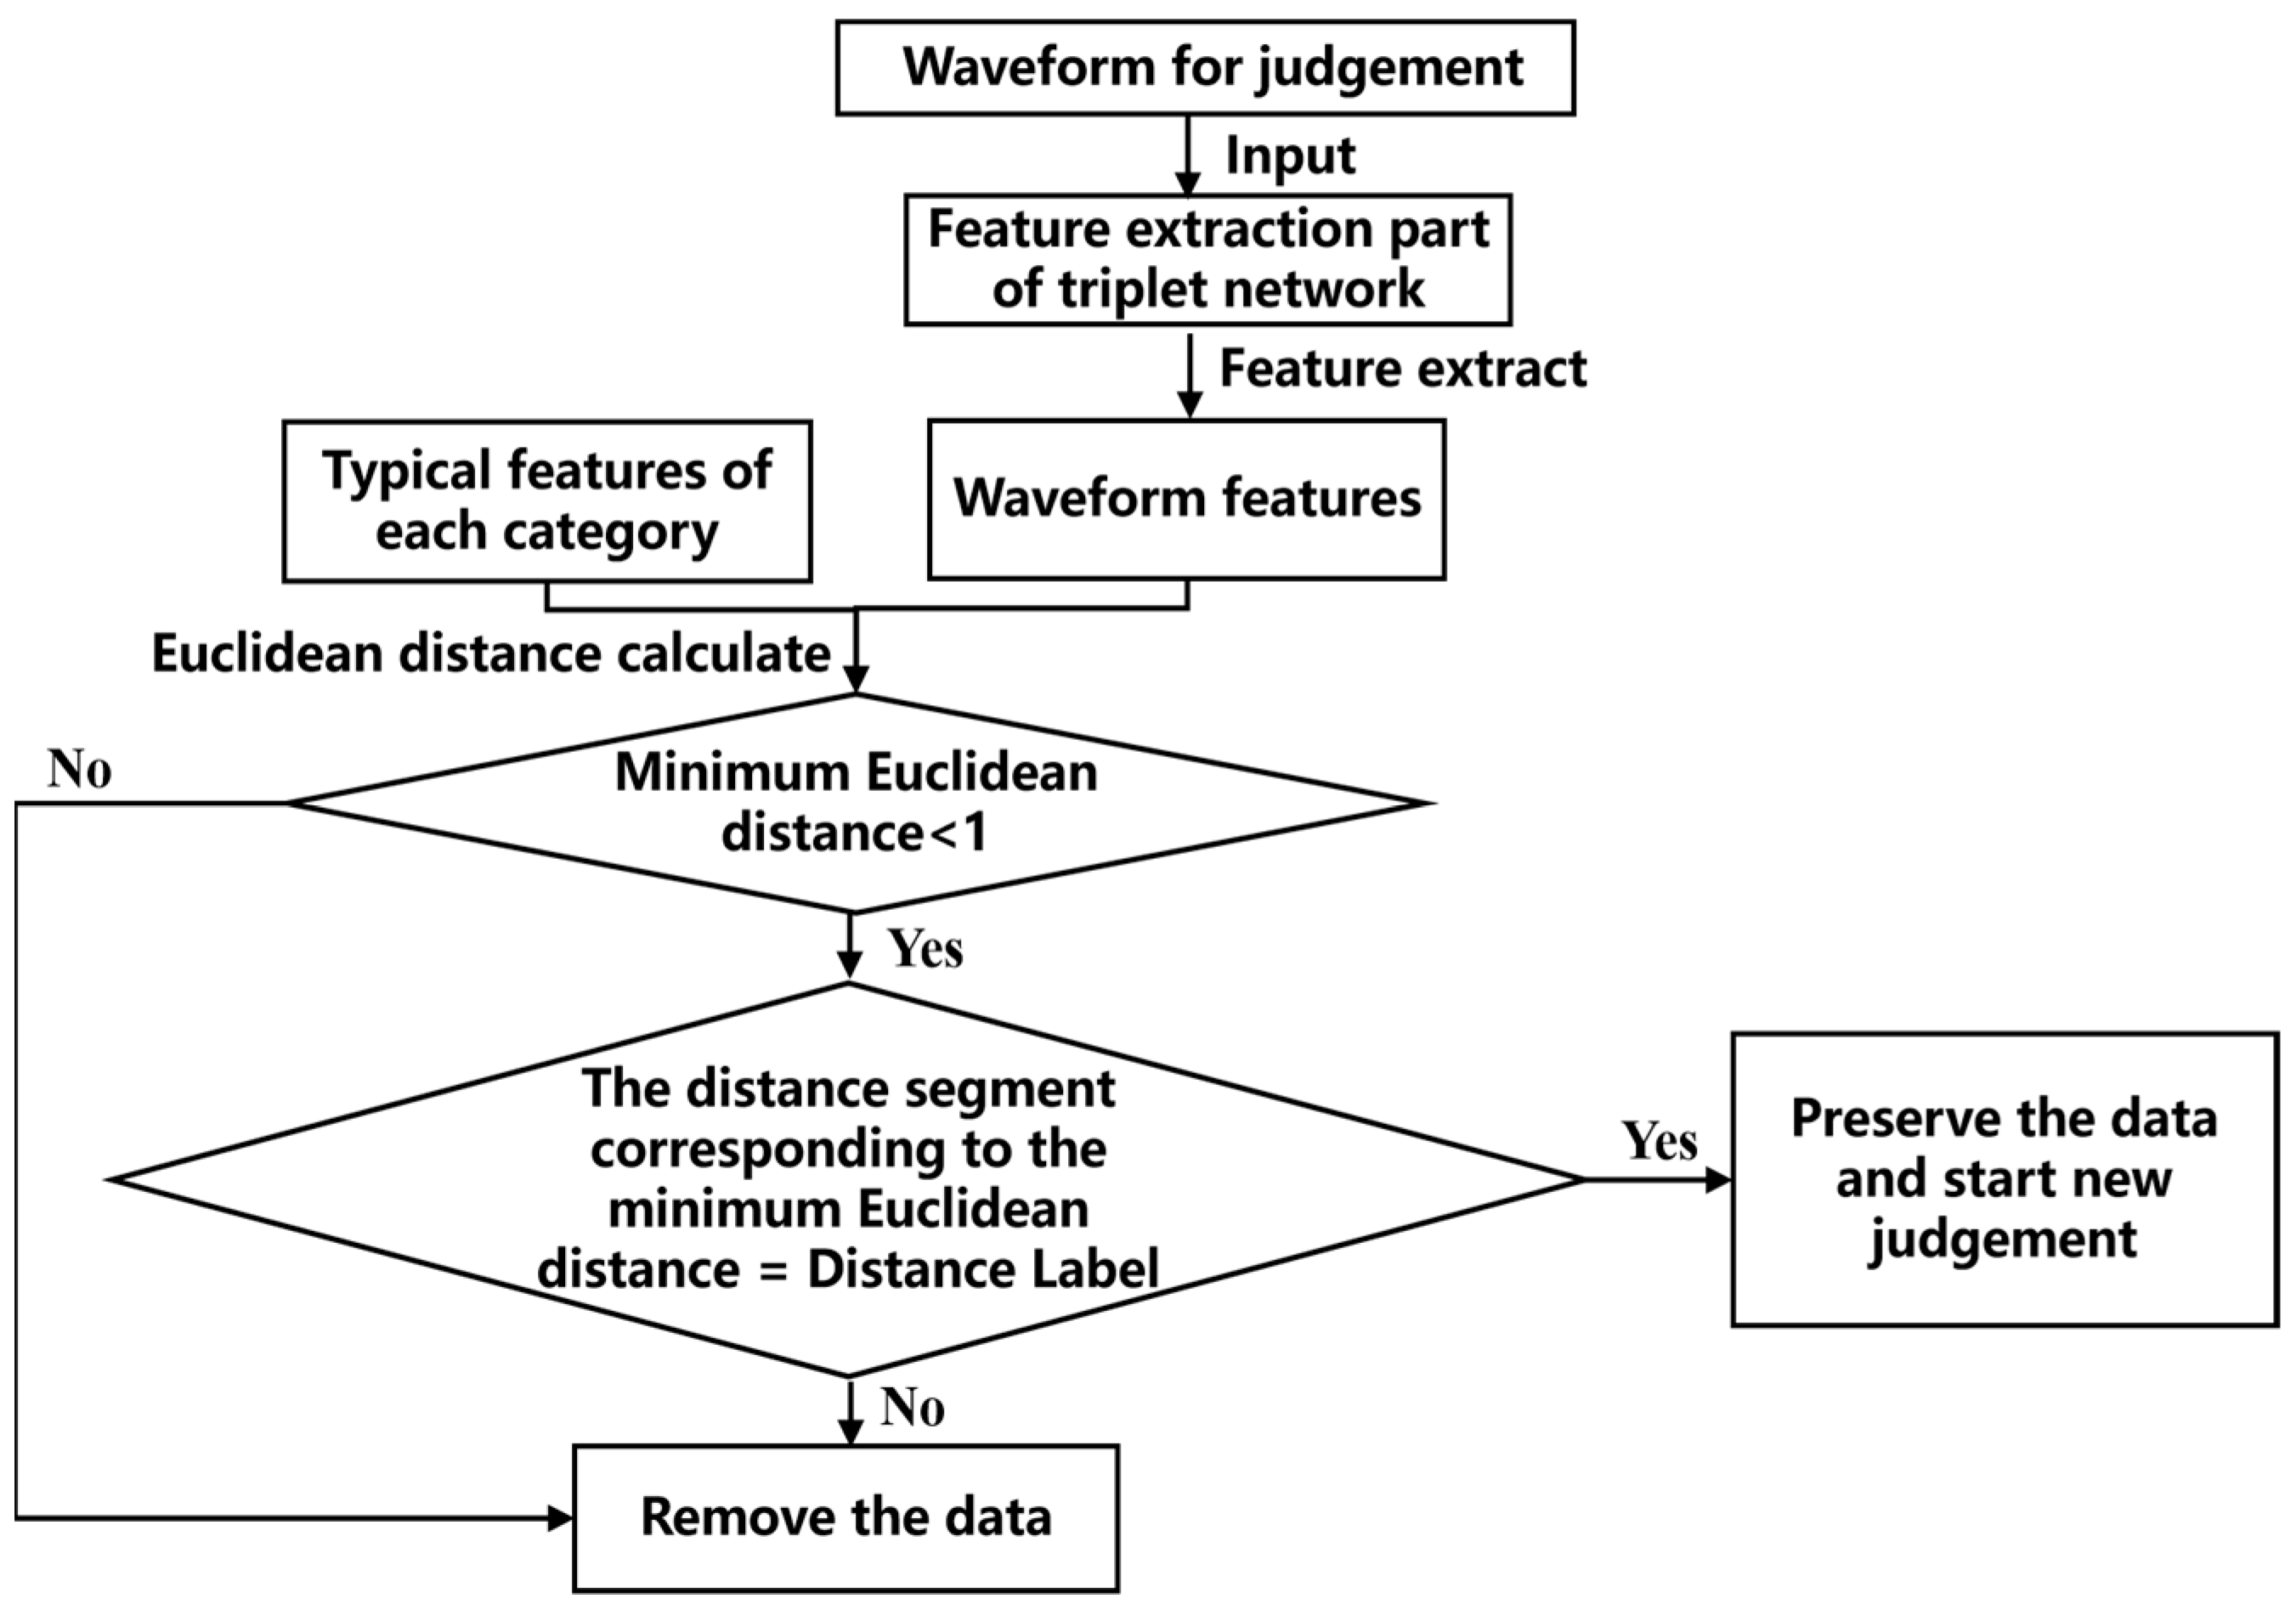
3.1. Tri-Pre Method
3.2. Single-Site Lightning Location Model
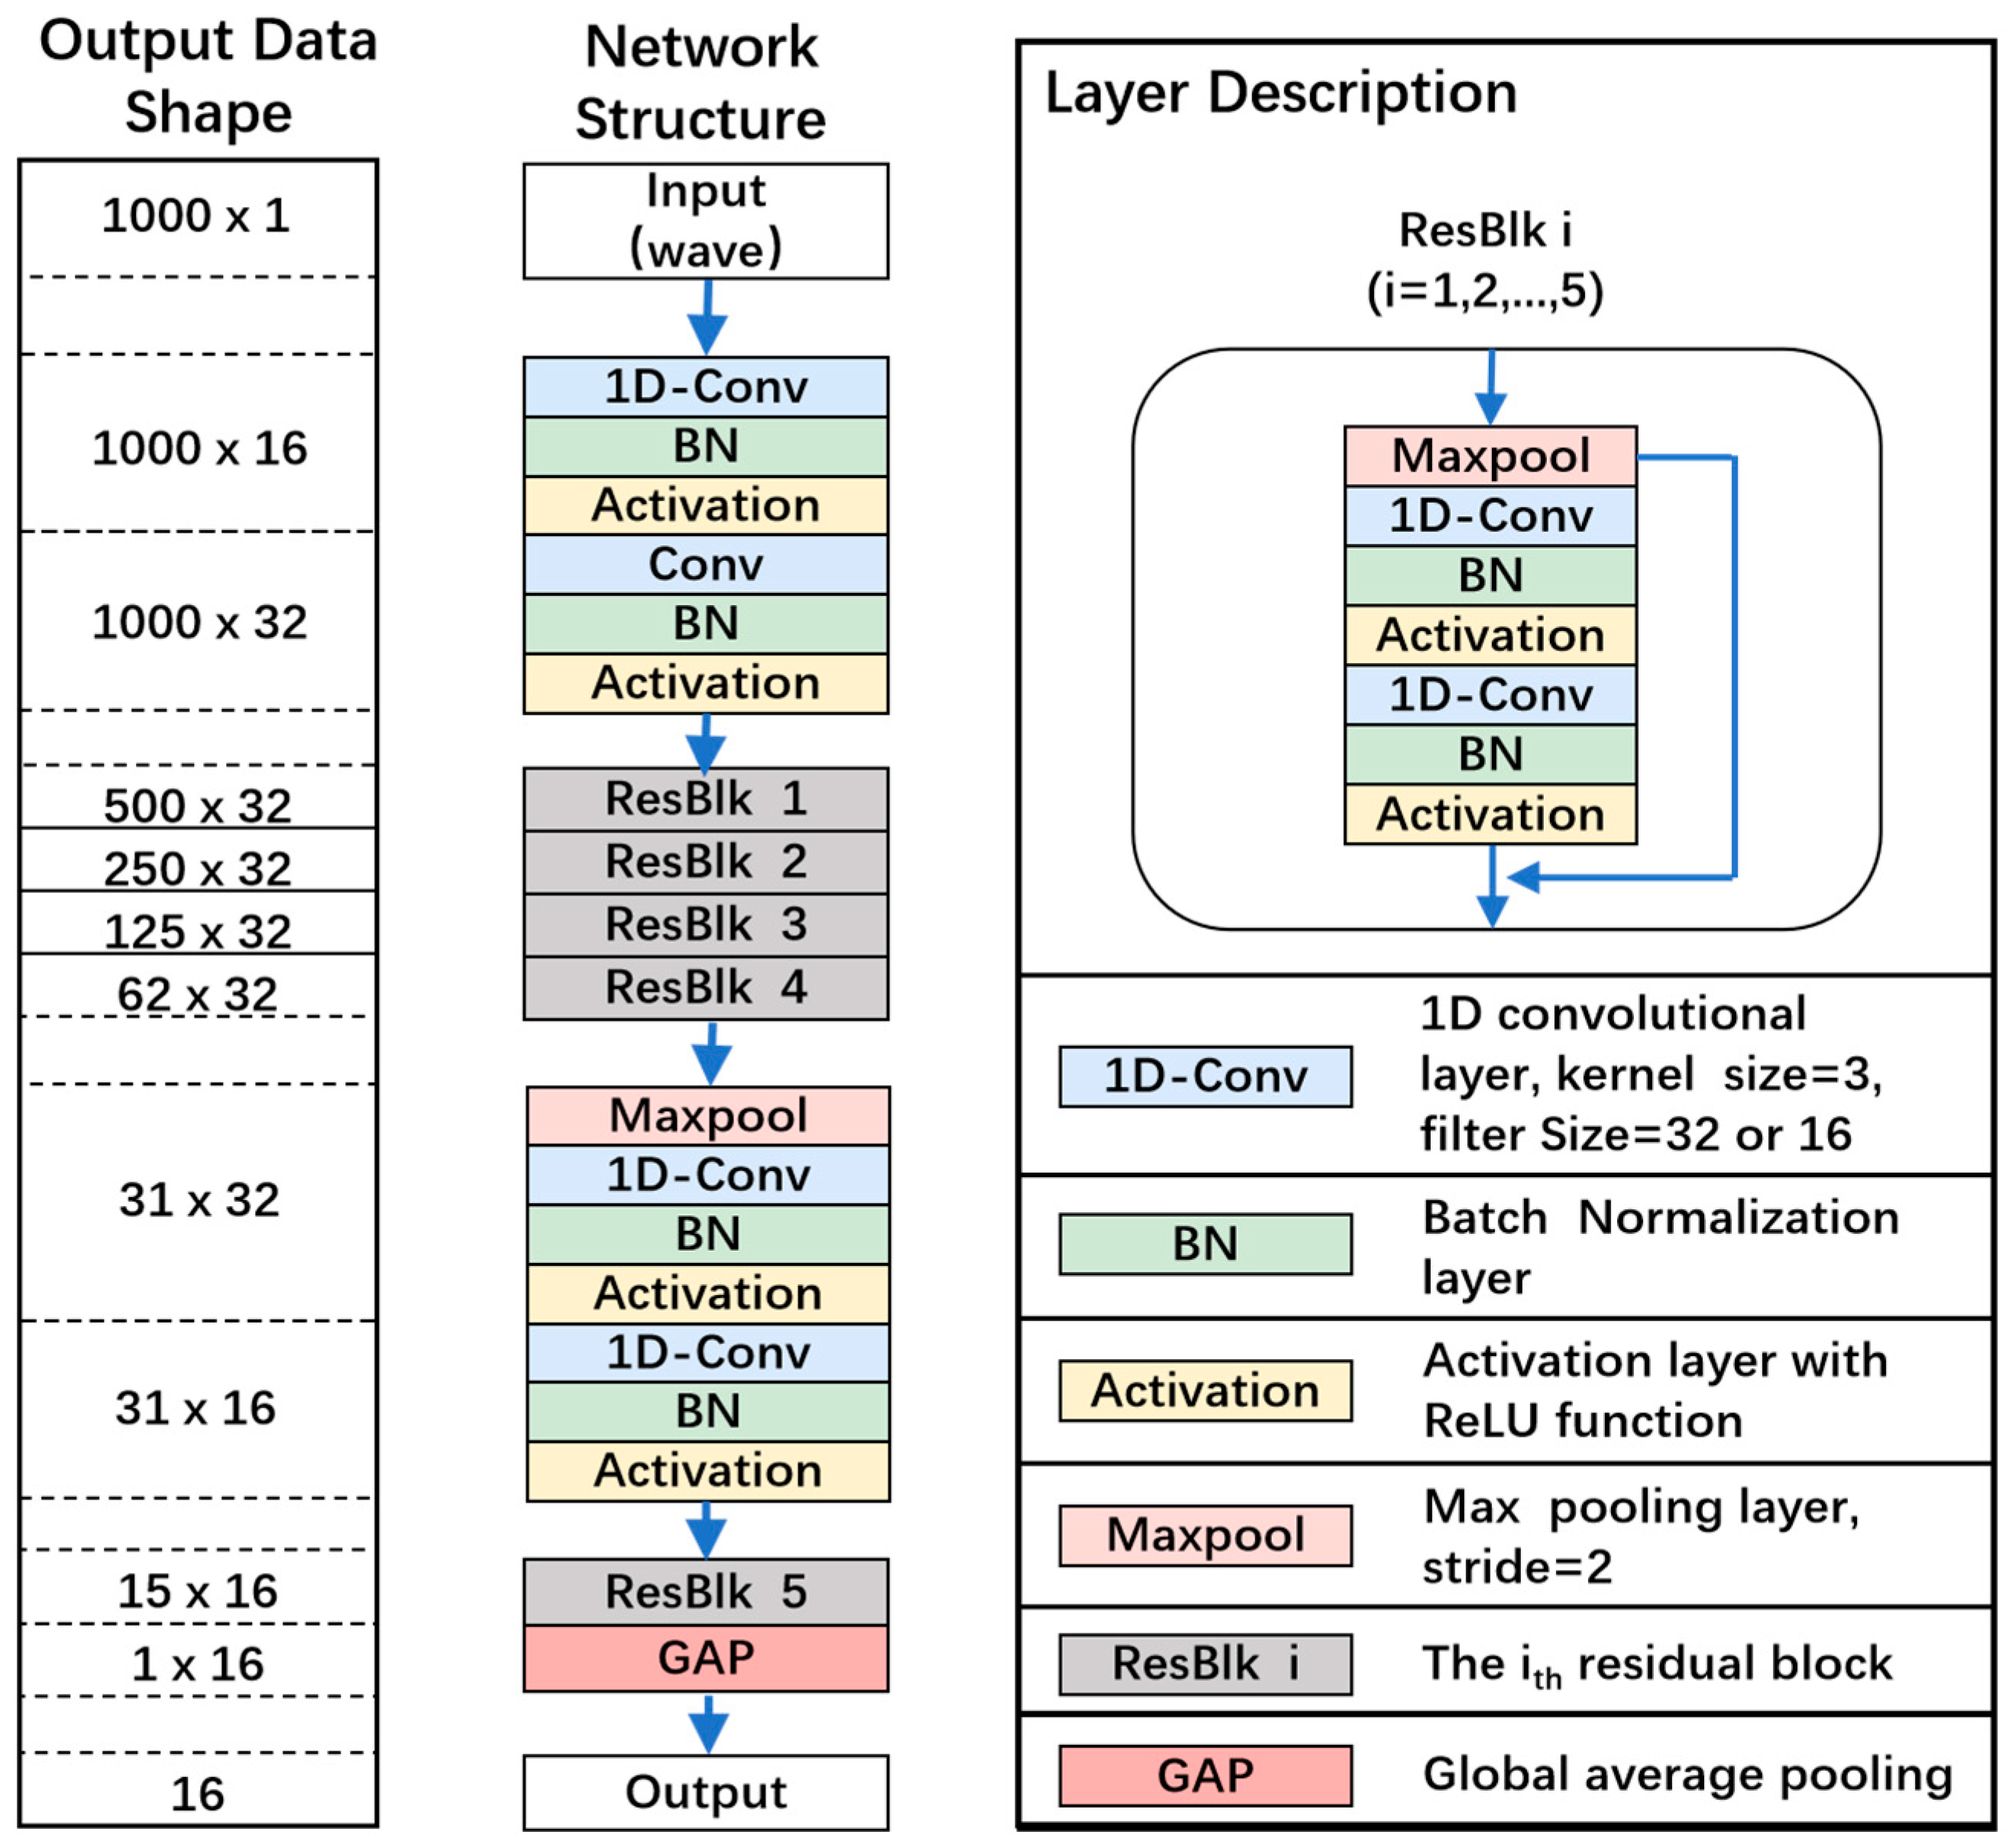
3.2.1. Feature Extraction Network
3.2.2. Multi-Feature Fusion Network for Direction Estimation
3.2.3. Multi-Feature Fusion Network for Distance Estimation
3.3. Training Parameter Settings and Evaluation Metrics
4. Results
4.1. Effectiveness of Tri-Pre Method
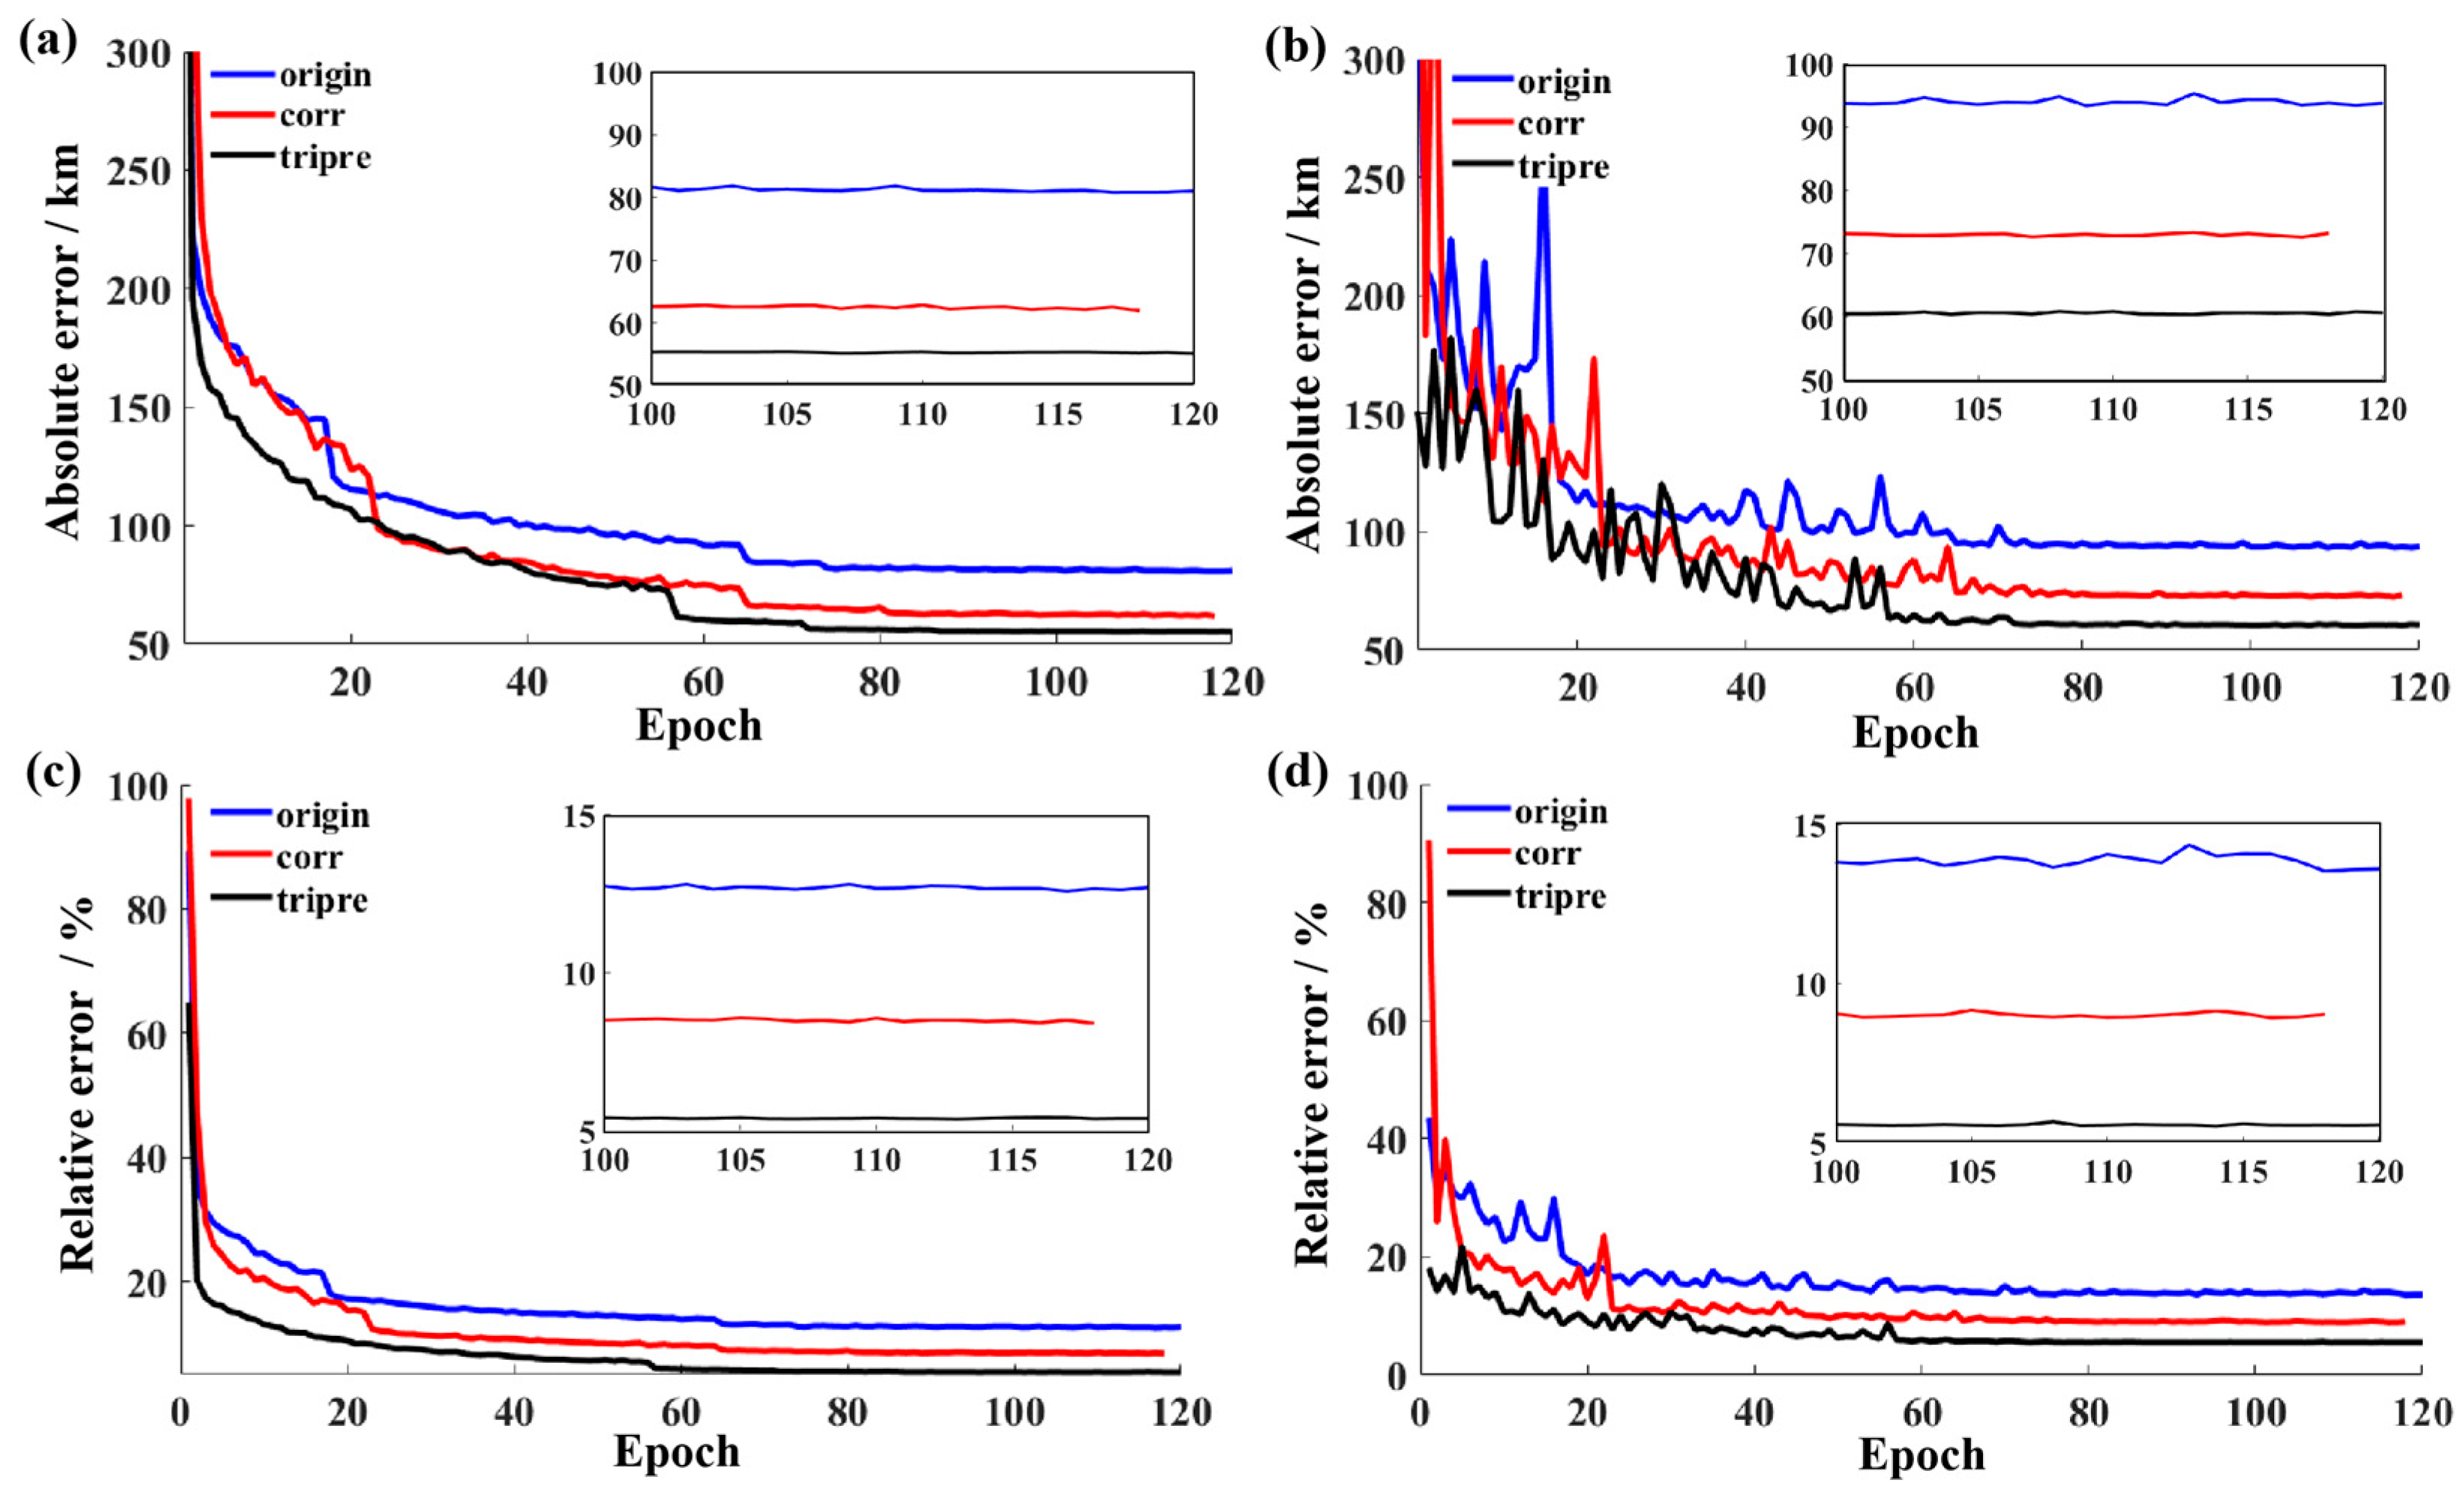
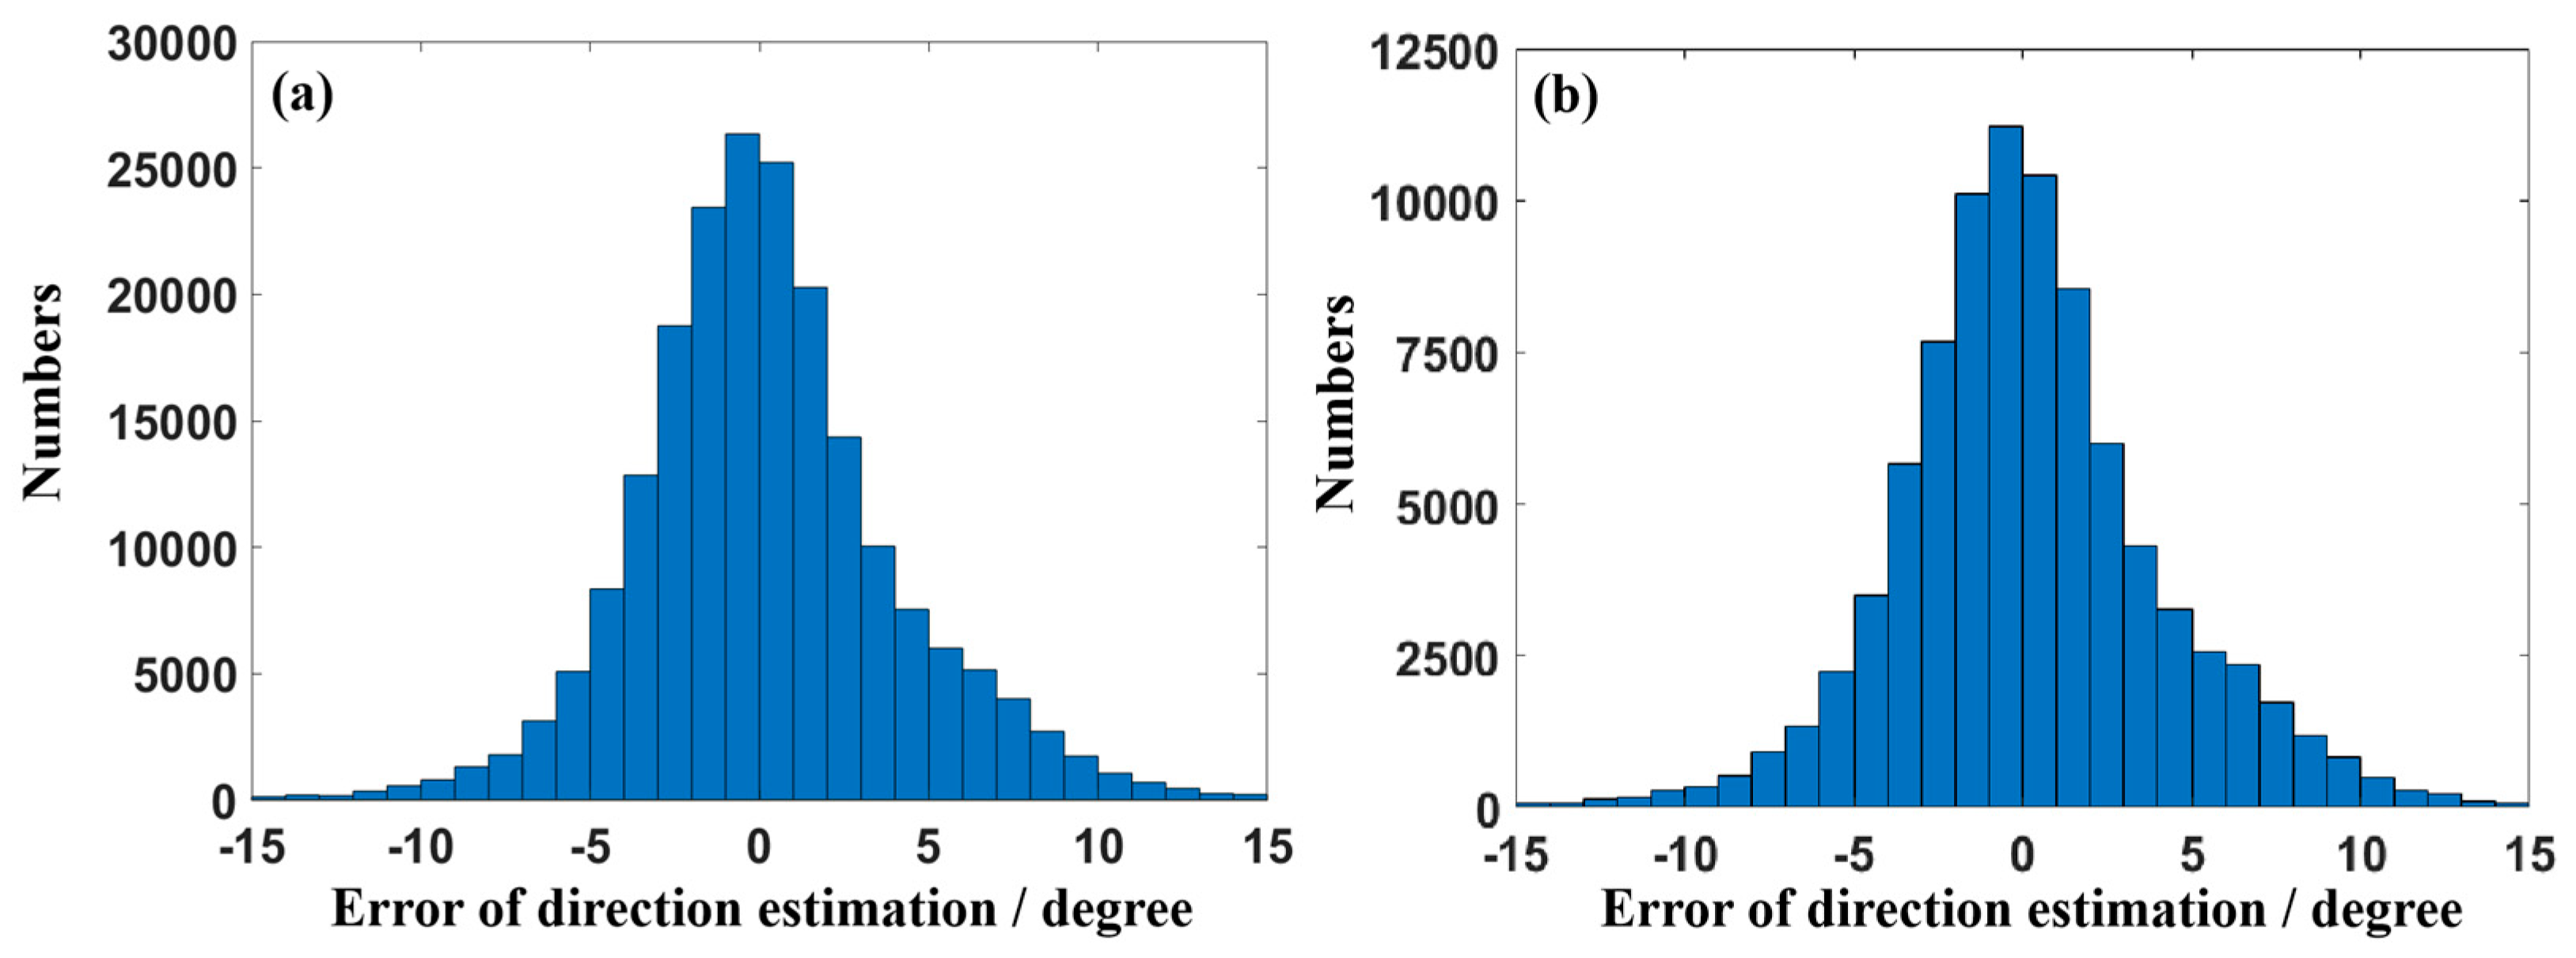
4.2. The Performance of Single-Site Lightning Location Model Based on Tri-Pre Method
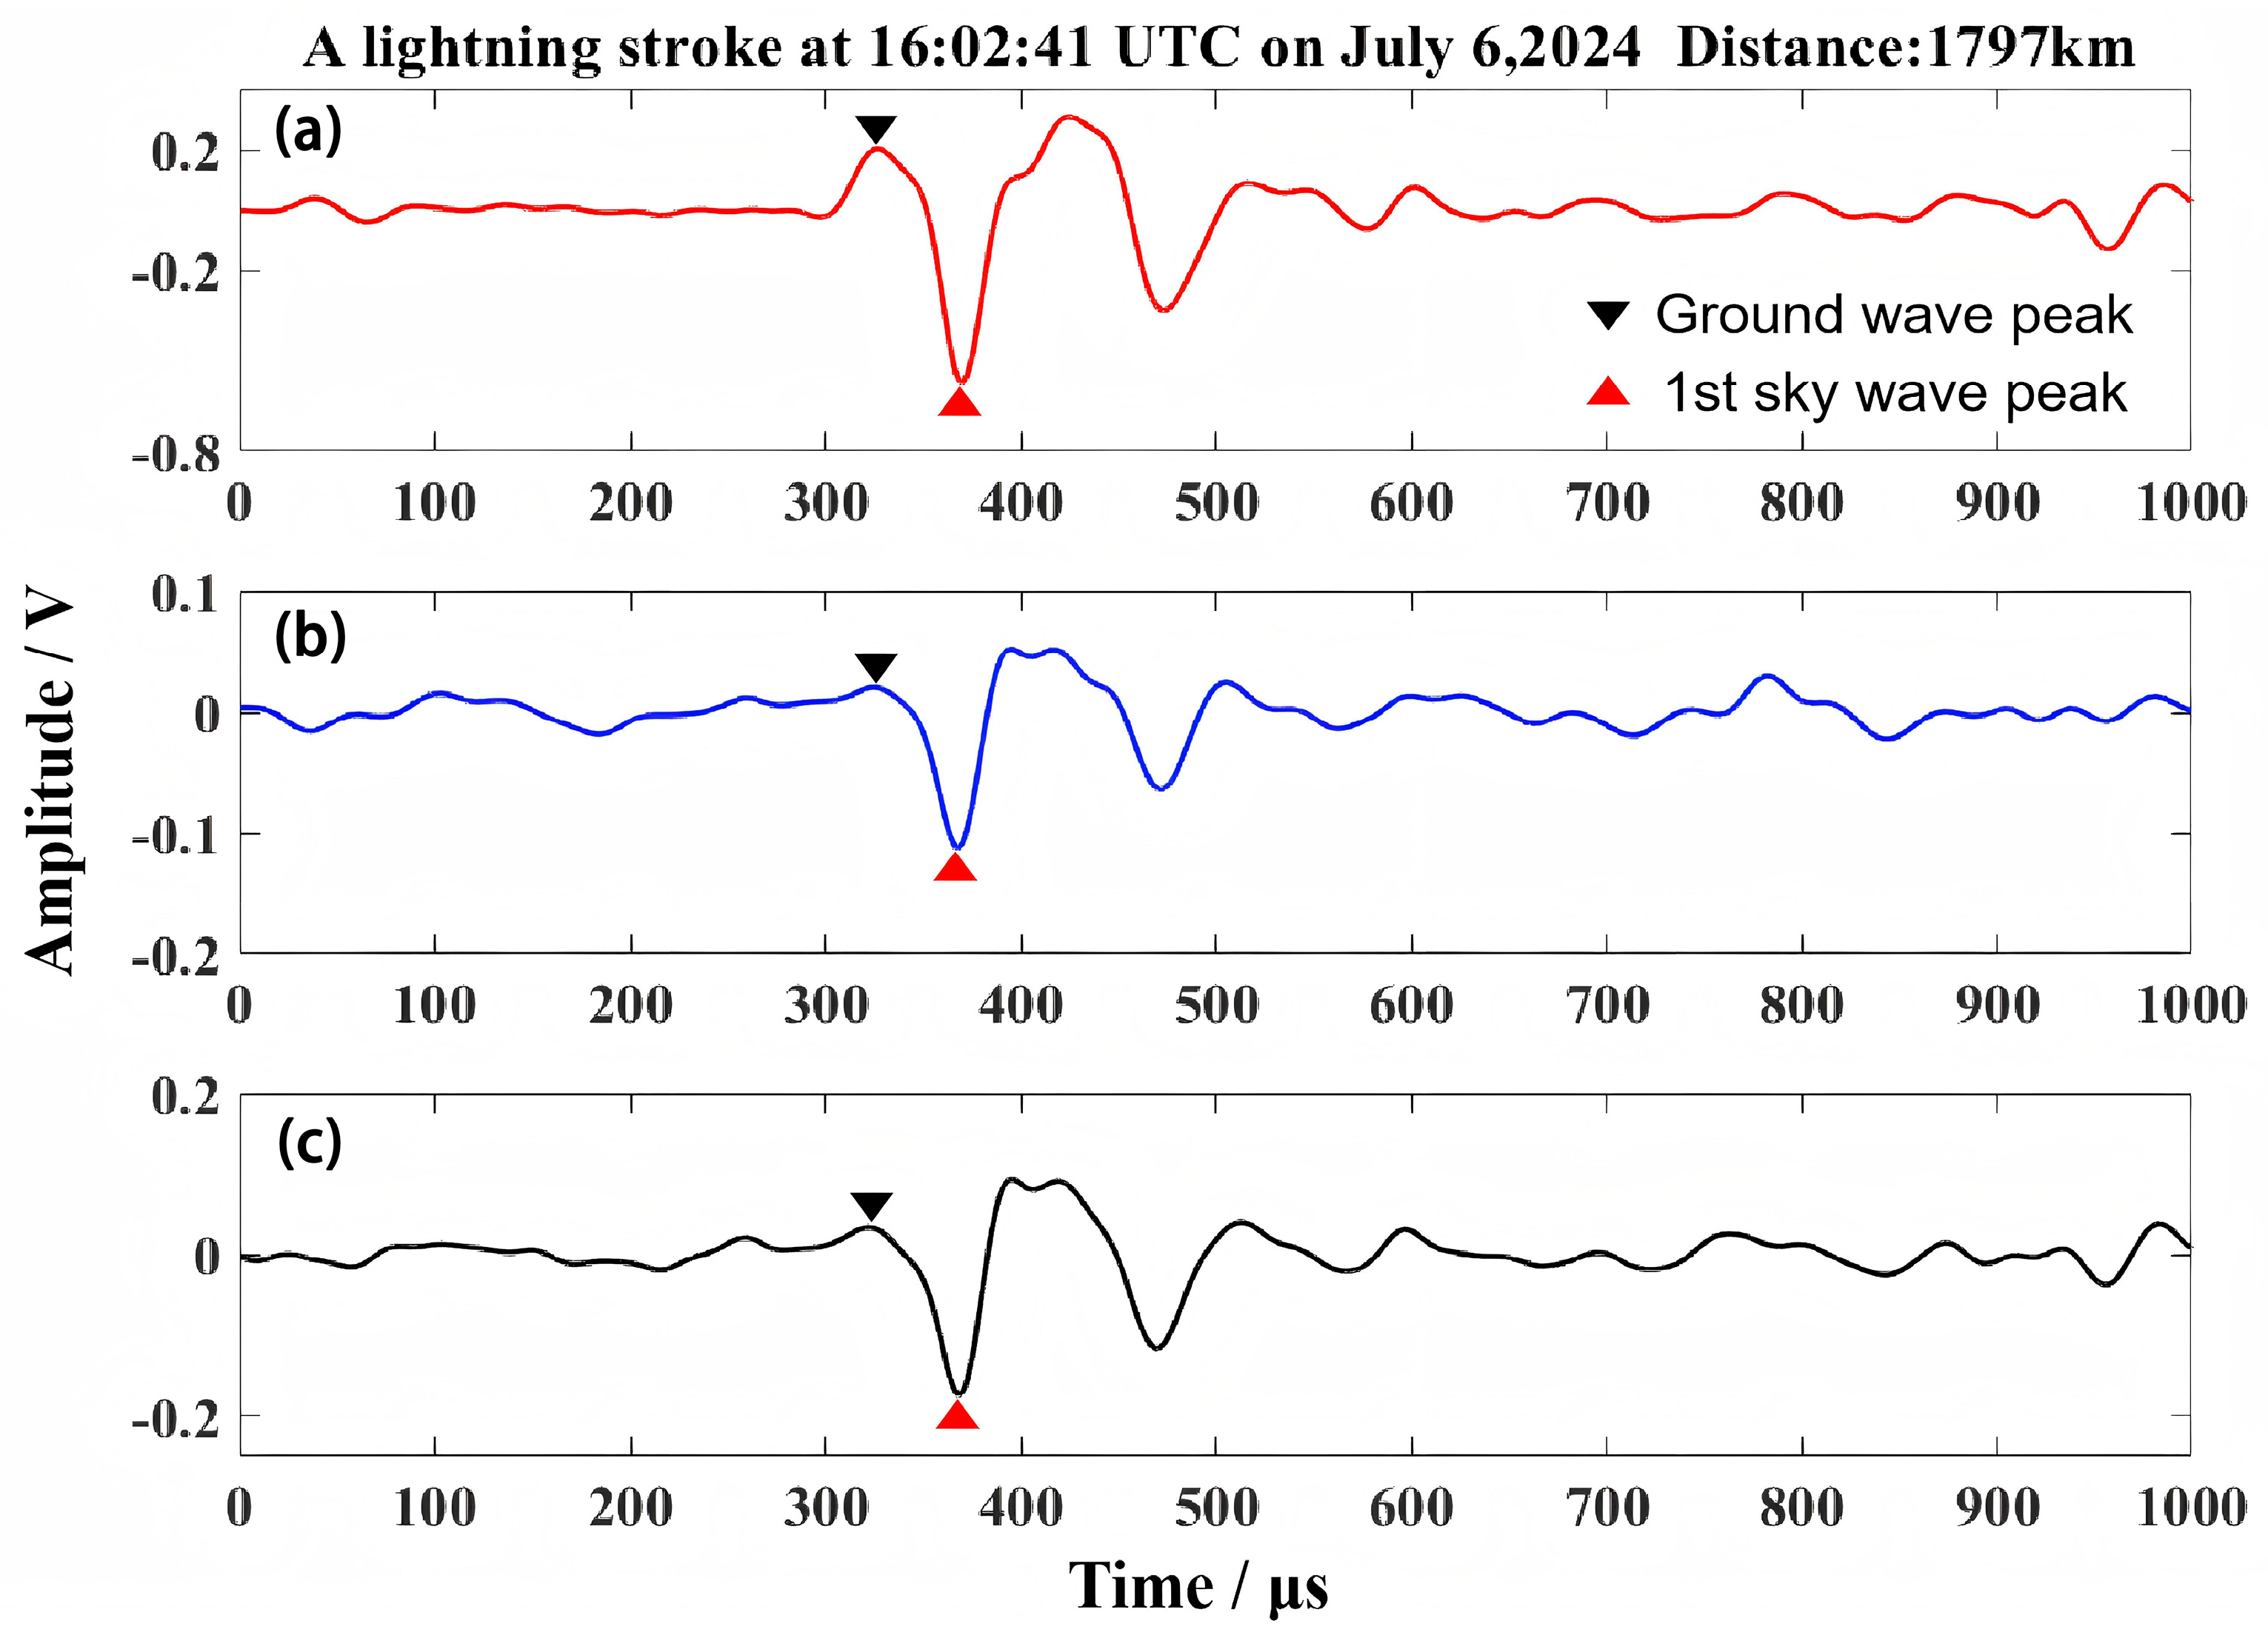
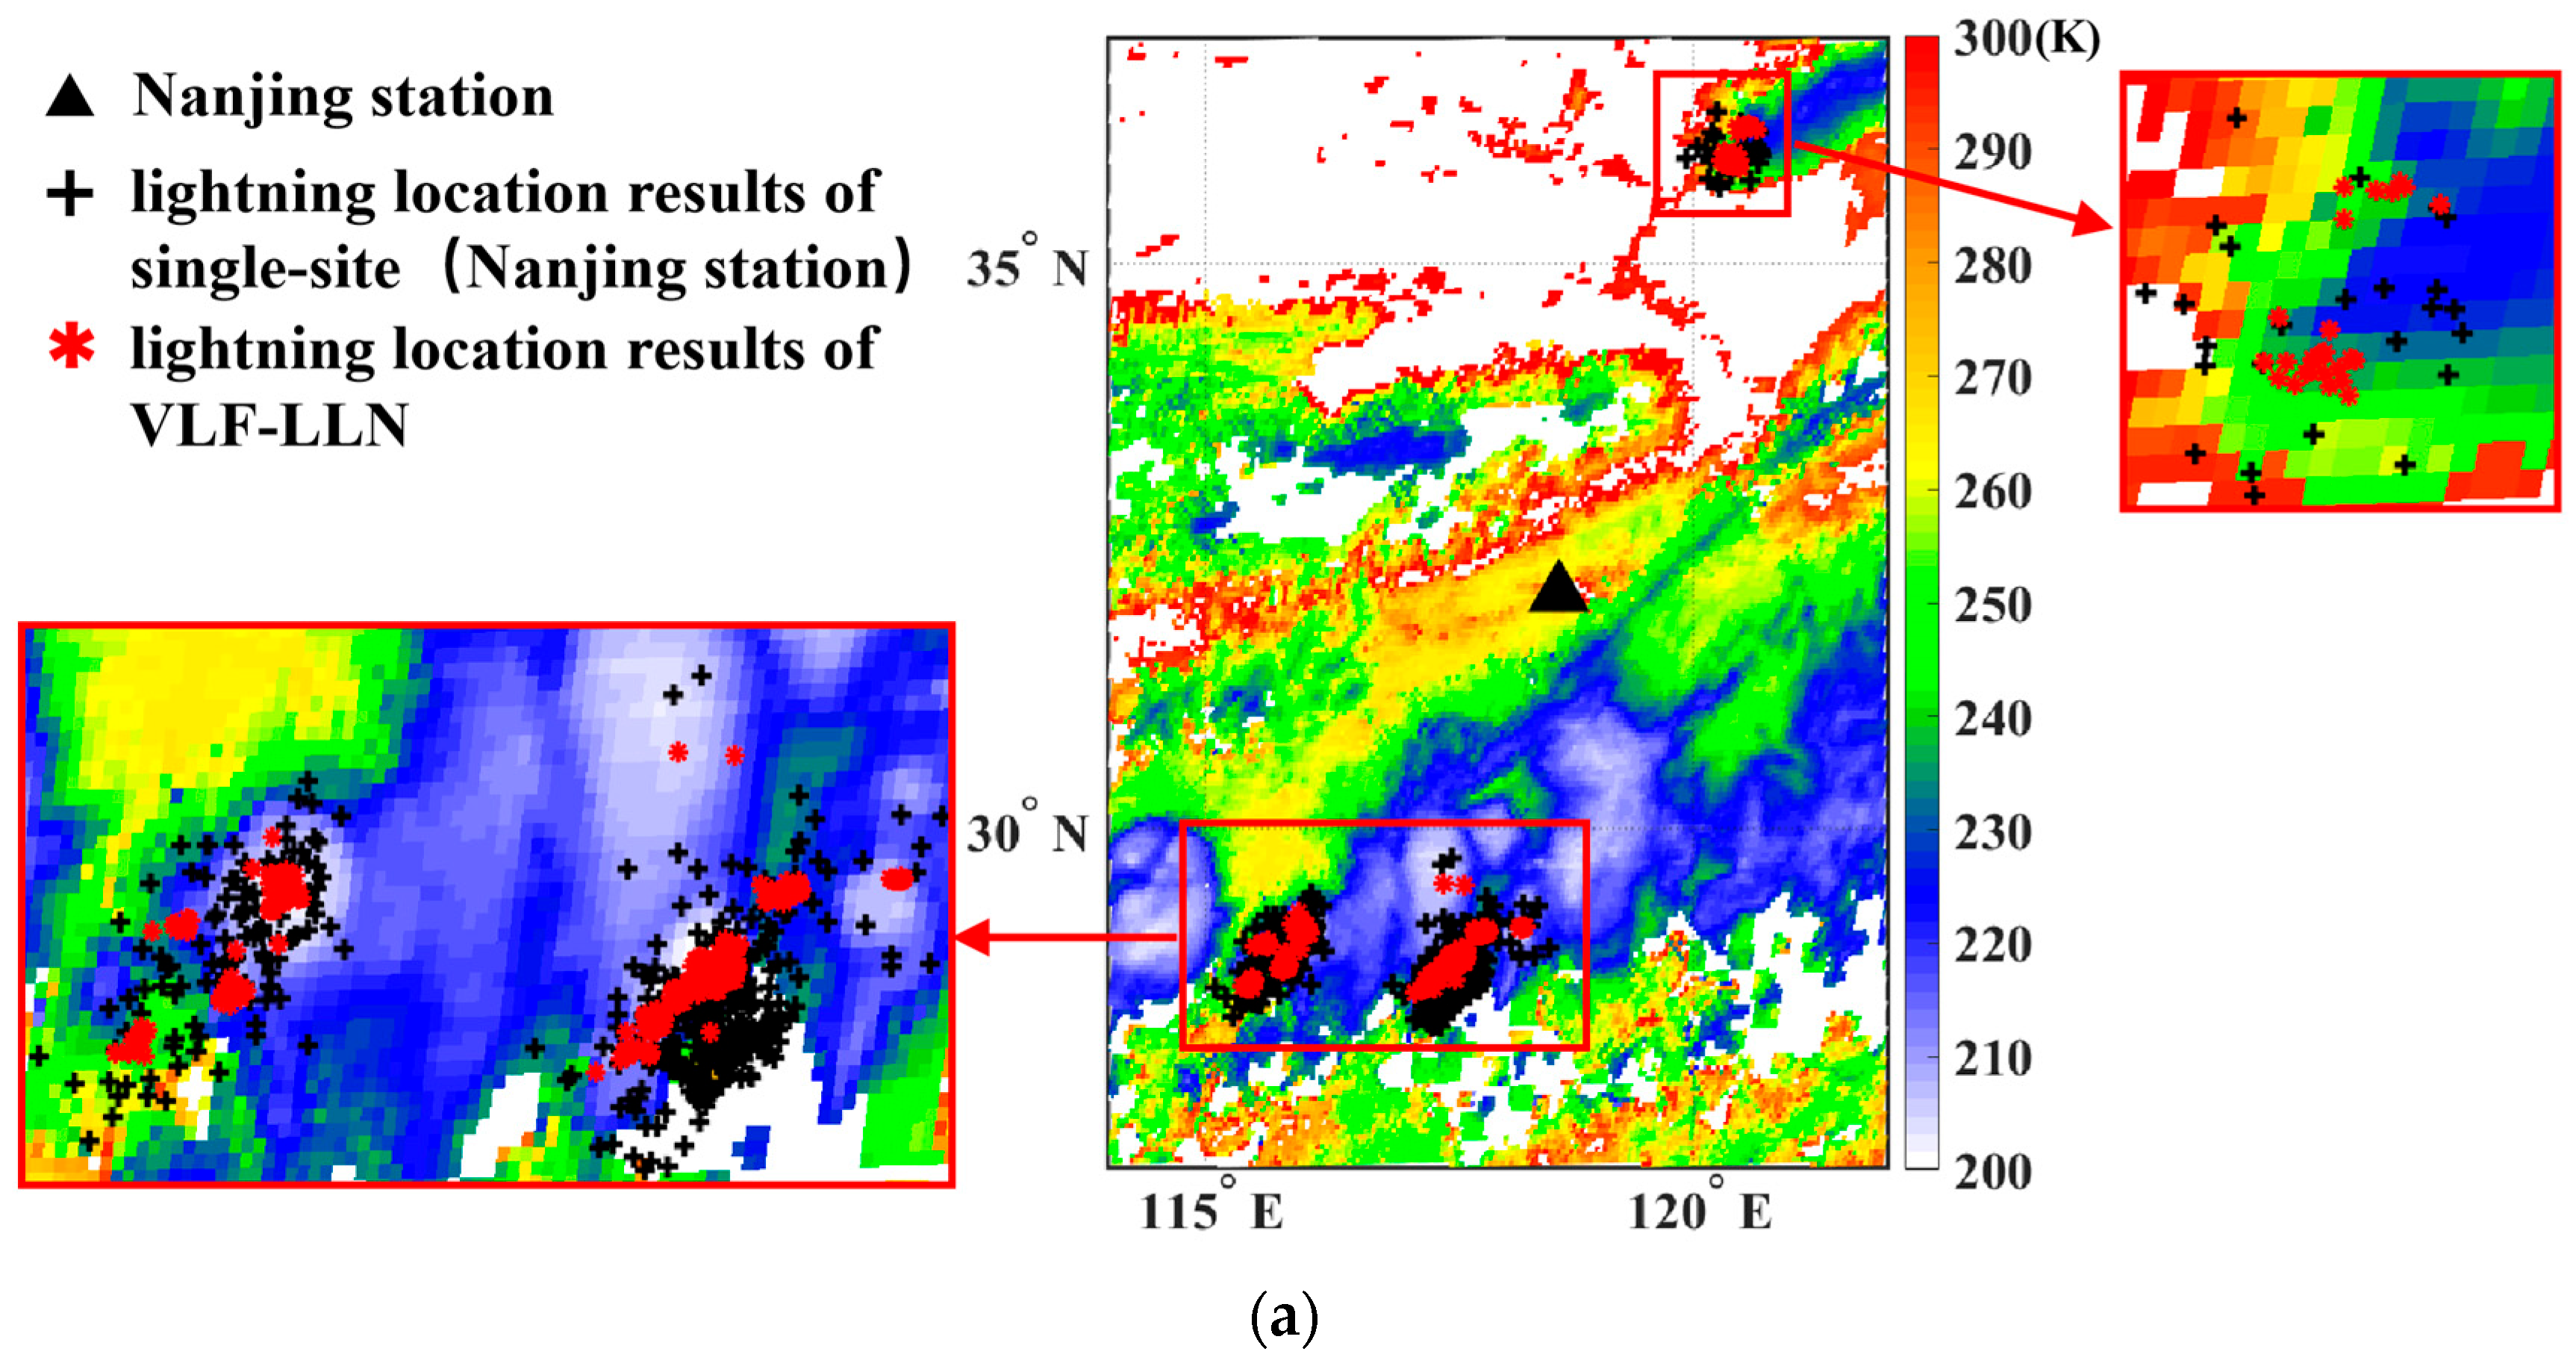
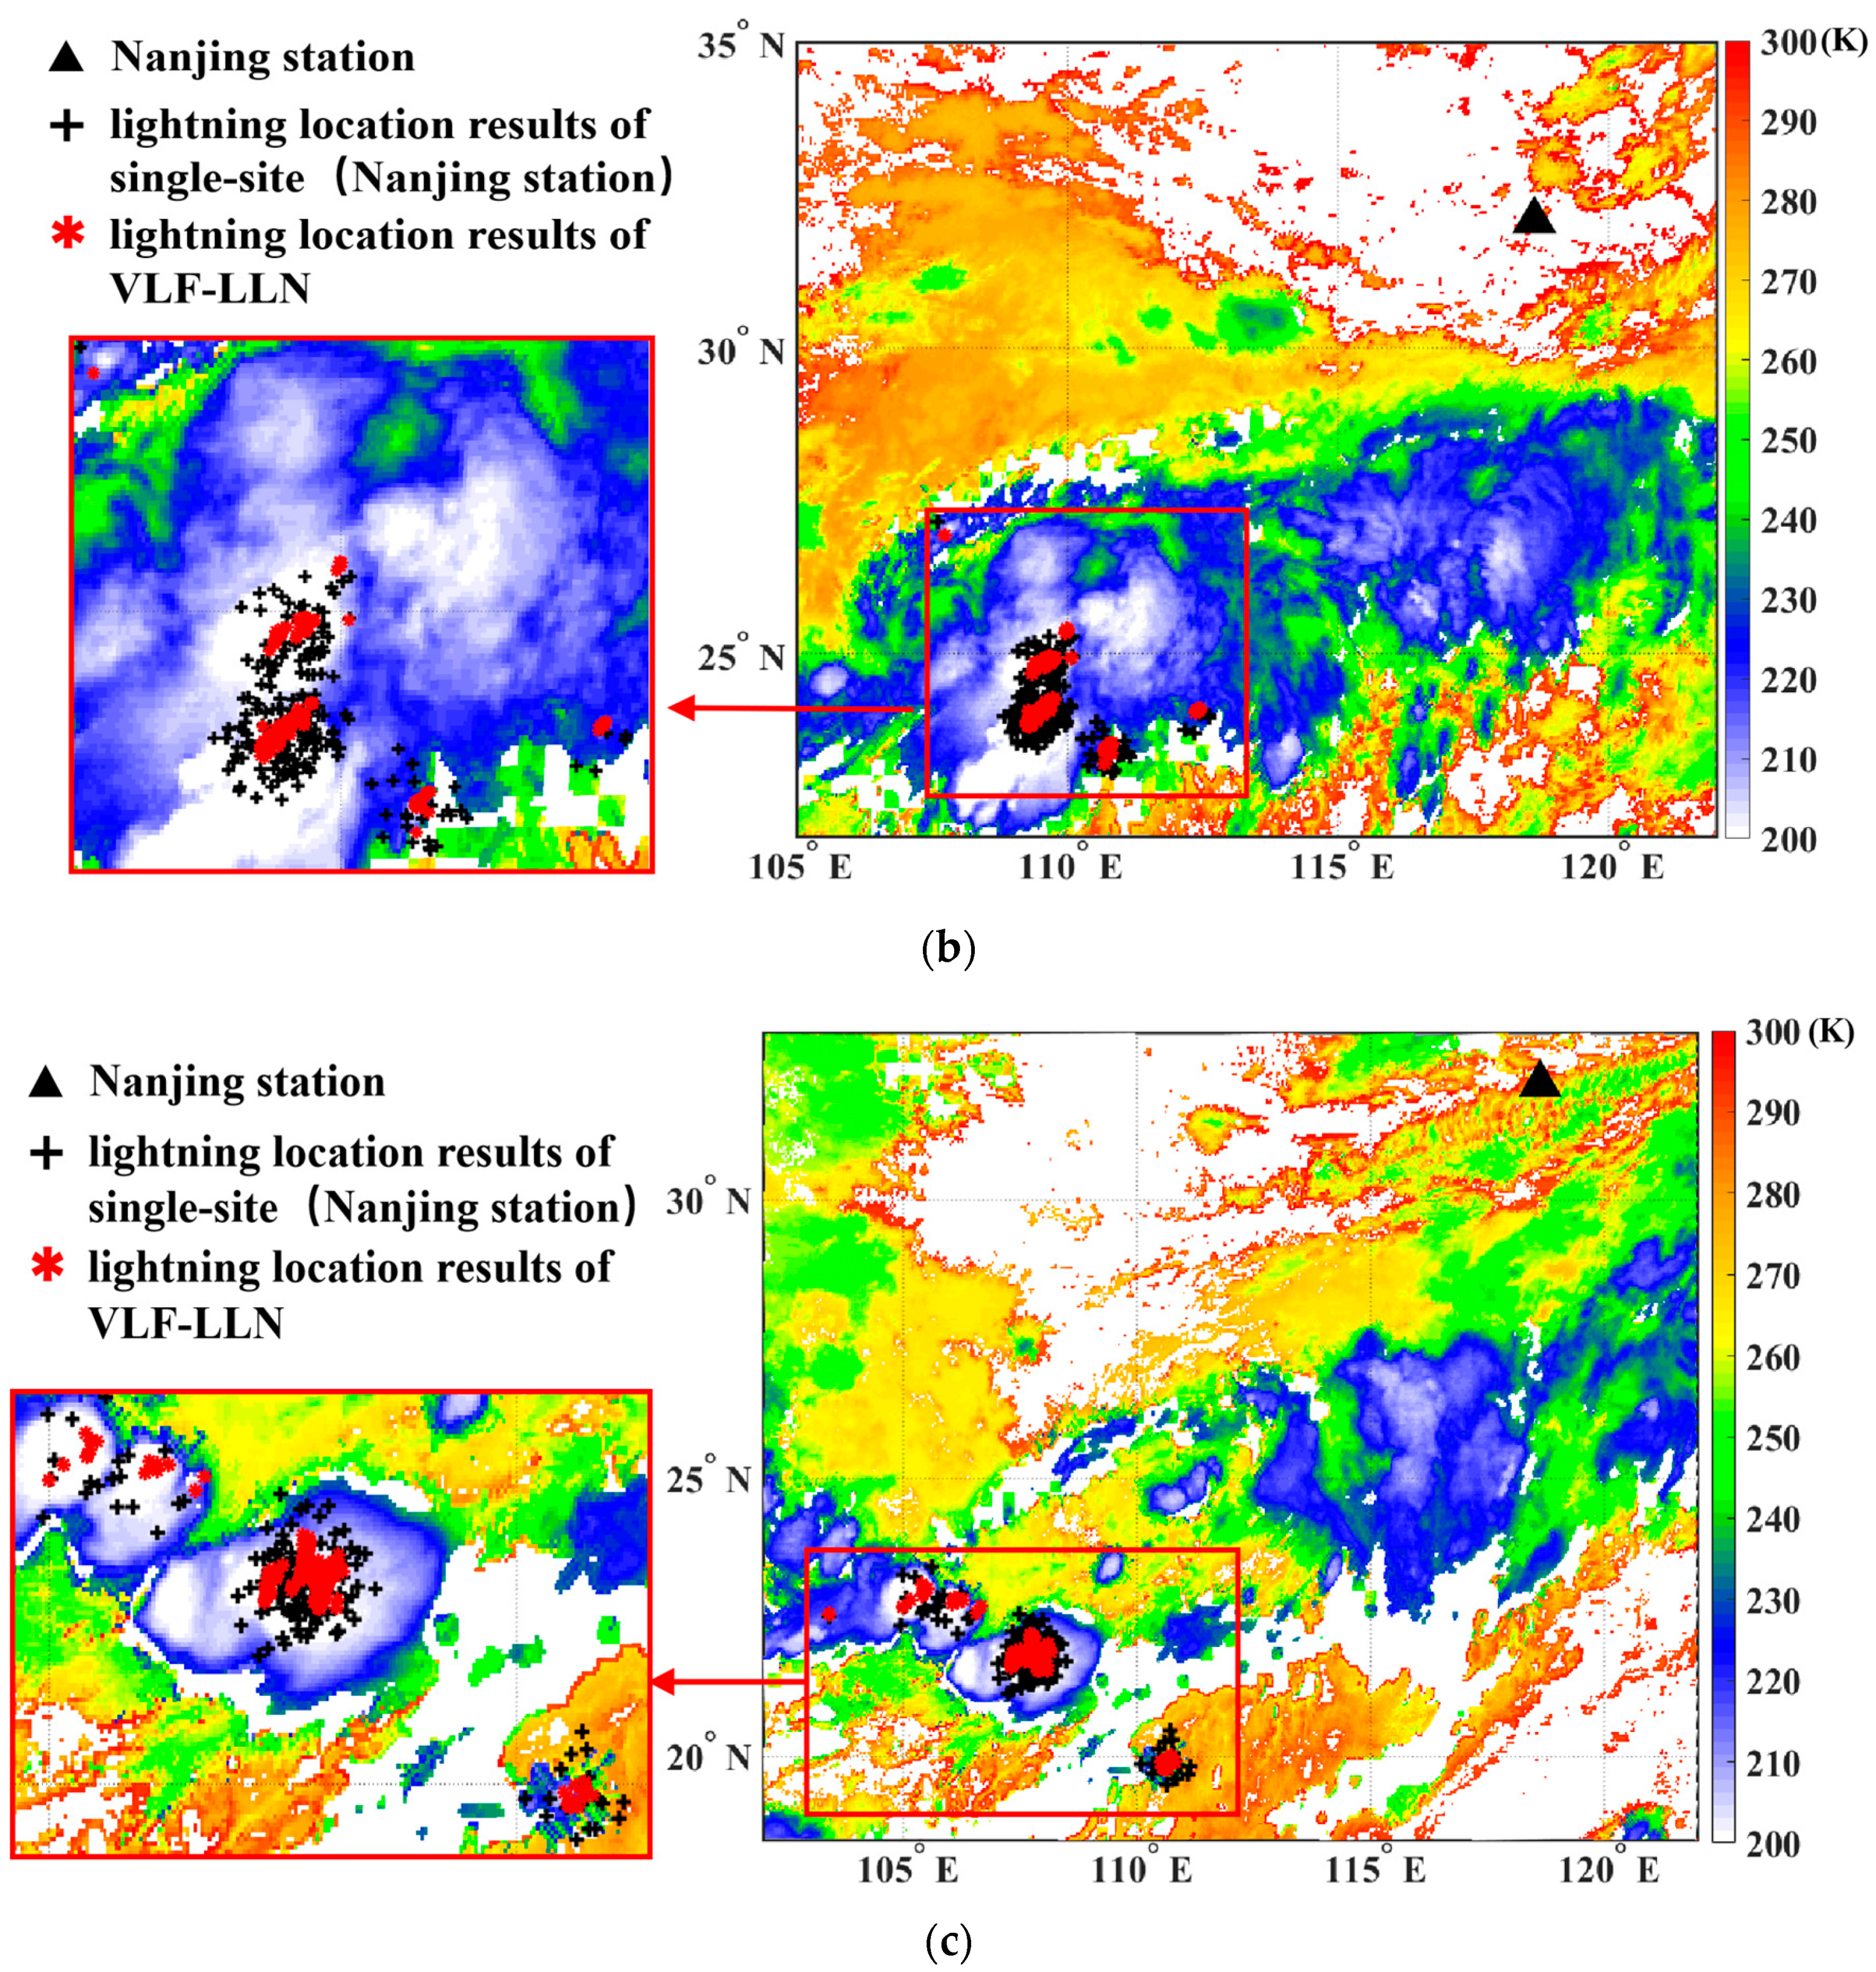
4.3. Measured Results
5. Discussion
Author Contributions
Funding
Data Availability Statement
Acknowledgments
Conflicts of Interest
Abbreviations
| BN | batch normalization |
| CG | cloud-to-ground |
| CNN | convolutional neural networks |
| CTT | cloud-top temperature |
| EA | absolute error |
| ELF | extremely low frequency |
| ER | relative error |
| FY4B | fengyun 4B |
| GLD360 | global lightning detection network |
| LEMP | lightning electromagnetic pulse |
| LF | low frequency |
| LSTM | long short-term memory |
| MDF | magnetic direction-finding |
| MSPS | million samples per second |
| NLDN | national lightning detection network |
| ResNet | residual networks |
| RNN | recurrent neural networks |
| TDOA | time difference of arrival |
| VLF | very low frequency |
| VLF-LLN | very low frequency long-range lightning location network |
| WWLLN | world wide lightning location network |
References
- Rakov, V.A. Electromagnetic methods of lightning detection. Surv. Geophys. 2013, 34, 731–753. [Google Scholar] [CrossRef]
- Dowden, R.L.; Brundell, J.B.; Rodger, C.J. VLF lightning location by time of group arrival (TOGA) at multiple sites. J. Atmos. Sol.-Terr. Phys. 2002, 64, 817–830. [Google Scholar] [CrossRef]
- Said, R.K.; Inan, U.S.; Cummins, K.L. Long-range lightning geolocation using a VLF radio atmospheric waveform bank. J. Geophys. Res. Atmos. 2010, 115. [Google Scholar] [CrossRef]
- Changnon, S.A. Damaging thunderstorm activity in the United States. Bull. Am. Meteorol. Soc. 2001, 82, 597–608. [Google Scholar] [CrossRef]
- Schultz, C.J.; Petersen, W.A.; Carey, L.D. Lightning and severe weather: A comparison between total and cloud-to-ground lightning trends. Weather. Forecast. 2011, 26, 744–755. [Google Scholar] [CrossRef]
- Liu, Y.; Wang, J.; Song, Y.; Liang, S.; Xia, M.; Zhang, Q. Lightning nowcasting based on high-density area and extrapolation utilizing long-range lightning location data. Atmos. Res. 2025, 321, 108070. [Google Scholar] [CrossRef]
- Srivastava, A.; Liu, D.; Xu, C.; Yuan, S.; Wang, D.; Babalola, O.; Sun, Z.; Chen, Z.; Zhang, H. Lightning nowcasting with an algorithm of thunderstorm tracking based on lightning location data over the Beijing area. Adv. Atmos. Sci. 2022, 39, 178–188. [Google Scholar] [CrossRef]
- Zhang, L.; Li, Q.; Zhou, Z.; Yang, K. A lightning augmented recurrent nowcasting model based on self-supervised learning and multi-modal fusion method. Atmos. Res. 2025, 321, 108089. [Google Scholar] [CrossRef]
- Orville, R.E. Development of the national lightning detection network. Bull. Am. Meteorol. Soc. 2008, 89, 180–190. [Google Scholar] [CrossRef]
- Pohjola, H.; Mäkelä, A. The comparison of GLD360 and EUCLID lightning location systems in Europe. Atmos. Res. 2013, 123, 117–128. [Google Scholar] [CrossRef]
- Cummins, K.L.; Murphy, M.J.; Bardo, E.A.; Hiscox, W.L.; Pyle, R.B.; Pifer, A.E. A combined TOA/MDF technology upgrade of the US National Lightning Detection Network. J. Geophys. Res. Atmos. 1998, 103, 9035–9044. [Google Scholar] [CrossRef]
- Krider, E.P.; Noggle, R.C.; Uman, M.A. A gated, wideband magnetic direction finder for lightning return strokes. J. Appl. Meteorol. 1976, 15, 301–306. [Google Scholar] [CrossRef]
- Füllekrug, M. Introduction to lightning detection. Weather 2017, 72, 32–35. [Google Scholar] [CrossRef]
- Koochak, Z.; Fraser-Smith, A. Single-station lightning location using azimuth and time of arrival of sferics. Radio Sci. 2020, 55, 1–13. [Google Scholar] [CrossRef]
- Chen, M.; Lu, T.; Du, Y. An improved wave impedance approach for locating close lightning stroke from single station observation and its validation. J. Atmos. Sol.-Terr. Phys. 2015, 122, 1–8. [Google Scholar] [CrossRef]
- Rafalsky, V.A.; Shvets, A.V.; Hayakawa, M. One-site distance-finding technique for locating lightning discharges. J. Atmos. Terr. Phys. 1995, 57, 1255–1261. [Google Scholar] [CrossRef]
- Rafalsky, V.A.; Nickolaenko, A.P.; Shvets, A.V.; Hayakawa, M. Location of lightning discharges from a single station. J. Geophys. Res. Atmos. 1995, 100, 20829–20838. [Google Scholar] [CrossRef]
- de Sá, A.L.A.; Marshall, R.A. Lightning distance estimation using LF lightning Radio signals via analytical and machine-learned models. IEEE Trans. Geosci. Remote Sens. 2020, 58, 5892–5907. [Google Scholar] [CrossRef]
- Wang, J.; Xiao, F.; Yuan, S.; Song, J.; Ma, Q.; Zhou, X. A novel method for ground-based VLF/LF single-site lightning location. Measurement 2022, 196, 111208. [Google Scholar] [CrossRef]
- Jordan, M.I. Artificial intelligence—The revolution hasn’t happened yet. Harv. Data Sci. Rev. 2019, 1, 1–9. [Google Scholar]
- Li, J.; Dai, B.; Zhou, J.; Zhang, J.; Zhang, Q.; Yang, J.; Wang, Y.; Gu, J.; Hou, W.; Zou, B.; et al. Preliminary application of long-range lightning location network with equivalent propagation velocity in China. Remote. Sens. 2022, 14, 560. [Google Scholar] [CrossRef]
- Hoffer, E.; Ailon, N. Deep metric learning using triplet network. In Similarity-Based Pattern Recognition: Third International Workshop, SIMBAD 2015, Copenhagen, Denmark, October 12–14, 2015. Proceedings 3; Springer International Publishing: Berlin/Heidelberg, Germany, 2015. [Google Scholar]
- Hou, W.; Azadifar, M.; Rubinstein, M.; Zhang, Q.; Rachidi, F. An efficient FDTD method to calculate lightning electromagnetic fields over irregular terrain adopting the moving computational domain technique. IEEE Trans. Electromagn. Compat. 2019, 62, 976–980. [Google Scholar] [CrossRef]
- Wang, J.; Huang, Q.; Ma, Q.; Chang, S.; He, J.; Wang, H.; Zhou, X.; Xiao, F.; Gao, C. Classification of VLF/LF lightning signals using sensors and deep learning methods. Sensors 2020, 20, 1030. [Google Scholar] [CrossRef] [PubMed]
- Zhou, X.; Wang, J.; Ma, Q.; Huang, Q.; Xiao, F. A method for determining D region ionosphere reflection height from lightning skywaves. J. Atmos. Sol.-Terr. Phys. 2021, 221, 105692. [Google Scholar] [CrossRef]
- LeCun, Y.; Bengio, Y.; Hinton, G. Deep learning. Nature 2015, 521, 436–444. [Google Scholar] [CrossRef]
- Yu, Y.; Si, X.; Hu, C.; Zhang, J. A review of recurrent neural networks: LSTM cells and network architectures. Neural Comput. 2019, 31, 1235–1270. [Google Scholar] [CrossRef]
- Van Houdt, G.; Mosquera, C.; Nápoles, G. A review on the long short-term memory model. Artif. Intell. Rev. 2020, 53, 5929–5955. [Google Scholar] [CrossRef]
- He, K.; Zhang, X.; Ren, S.; Sun, J. Deep residual learning for image recognition. In Proceedings of the IEEE Conference on Computer Vision and Pattern Recognition, Las Vegas, NV, USA, 27–30 June 2016. [Google Scholar]
- Maas, A.L.; Hannun, A.Y.; Ng, A.Y. Rectifier nonlinearities improve neural network acoustic models. In Proceedings of the 30th International Conference on Machine Learning, Atlanta, GA, USA, 17–19 June 2013; Volume 30. [Google Scholar]
- Kinga, D.; Adam, J.B. A method for stochastic optimization. In Proceedings of the International Conference on Learning Representations, ICLR 7, San Diego, CA, USA, 7–9 May 2015. [Google Scholar]


| Layer | Filter Number | Kernel Size | Pooling Window Size | Padding | Stride | Activation Function | Output Shape | |
|---|---|---|---|---|---|---|---|---|
| 1 | Input | 5 / | / | / | / | / | / | (1000, 1) |
| 2 | 1 1D-Conv | 16 | 32 | / | 6 √ | / | 8 ReLU | (1000, 16) |
| 3 | 1D-Conv | 16 | 32 | / | √ | / | ReLU | (1000, 16) |
| 4 | 2 Max-Pooling | / | / | 2 | 7 × | 2 | / | (500, 16) |
| 5 | 1D-Conv | 32 | 32 | / | √ | / | ReLU | (500, 32) |
| 6 | 1D-Conv | 32 | 32 | / | √ | / | ReLU | (500, 32) |
| 7 | Max-Pooling | / | / | 2 | × | 2 | / | (250, 32) |
| 8 | 1D-Conv | 64 | 16 | / | √ | / | ReLU | (250, 64) |
| 9 | 1D-Conv | 64 | 16 | / | √ | / | ReLU | (250, 64) |
| 10 | Max-Pooling | / | / | 2 | × | 2 | / | (125, 64) |
| 11 | 1D-Conv | 128 | 8 | / | √ | / | ReLU | (125, 128) |
| 12 | 1D-Conv | 128 | 8 | / | √ | / | ReLU | (125, 128) |
| 13 | Max-Pooling | / | / | 5 | × | 5 | / | (25, 128) |
| 14 | 1D-Conv | 256 | 3 | / | √ | / | ReLU | (25, 256) |
| 15 | 1D-Conv | 256 | 3 | / | √ | / | ReLU | (25, 256) |
| 16 | 3 Mean-Pooling | / | / | 5 | × | 5 | / | 256 |
| 17 | 4 Dense | / | / | / | / | / | / | 16 |
Disclaimer/Publisher’s Note: The statements, opinions and data contained in all publications are solely those of the individual author(s) and contributor(s) and not of MDPI and/or the editor(s). MDPI and/or the editor(s) disclaim responsibility for any injury to people or property resulting from any ideas, methods, instructions or products referred to in the content. |
© 2025 by the authors. Licensee MDPI, Basel, Switzerland. This article is an open access article distributed under the terms and conditions of the Creative Commons Attribution (CC BY) license (https://creativecommons.org/licenses/by/4.0/).
Share and Cite
Dai, B.; Zhang, Q.; Li, J.; Liu, Y.; Zhao, M. New Method for Single-Site Cloud-to-Ground Lightning Location Based on Tri-Pre Processing. Remote Sens. 2025, 17, 1766. https://doi.org/10.3390/rs17101766
Dai B, Zhang Q, Li J, Liu Y, Zhao M. New Method for Single-Site Cloud-to-Ground Lightning Location Based on Tri-Pre Processing. Remote Sensing. 2025; 17(10):1766. https://doi.org/10.3390/rs17101766
Chicago/Turabian StyleDai, Bingzhe, Qilin Zhang, Jie Li, Yi Liu, and Minhong Zhao. 2025. "New Method for Single-Site Cloud-to-Ground Lightning Location Based on Tri-Pre Processing" Remote Sensing 17, no. 10: 1766. https://doi.org/10.3390/rs17101766
APA StyleDai, B., Zhang, Q., Li, J., Liu, Y., & Zhao, M. (2025). New Method for Single-Site Cloud-to-Ground Lightning Location Based on Tri-Pre Processing. Remote Sensing, 17(10), 1766. https://doi.org/10.3390/rs17101766