Review

Advances in Research and Application of Techniques for Measuring Photosynthetically Active Radiation

1
State Key Laboratory of Optoelectronic Materials and Technologies, School of Physics, Sun Yat-sen University, Guangzhou 510275, China
2
Nanchang Research Institute, Sun Yat-sen University, Nanchang 330096, China
*
Author to whom correspondence should be addressed.
These authors contributed equally to this work.
Remote Sens. 2025, 17(10), 1765; https://doi.org/10.3390/rs17101765
Submission received: 15 April 2025 / Revised: 9 May 2025 / Accepted: 16 May 2025 / Published: 19 May 2025
(This article belongs to the Special Issue Remote Sensing for Soil Properties and Plant Ecosystems)

Abstract

:
Photosynthetically Active Radiation (PAR) is a critical indicator of plant photosynthesis and ecosystem energy flux. Accurate measurement of PAR is essential in agriculture, ecological research, and environmental management. This paper reviews recent developments and applications of PAR measurement technologies, focusing on recent advances in commercial PAR sensors, low-cost sensors, and remote sensing techniques. First, we outline the definition of PAR and further discuss in situ measurements and indirect estimation approaches. The technical principles, sources of error, and practical applications of commercial PAR sensors are presented at the next section. On the contrary, we also introduce the potential of low-cost sensors, particularly emphasizing the role of citizen science initiatives and open-source technologies in promoting widespread PAR measurement. Furthermore, the technical principles underlying remote sensing-based PAR estimation on a global scale are summarized, along with the application prospects of machine learning and satellite-derived product analysis techniques. Finally, this paper comprehensively reviews the challenges confronting PAR measurement and explores potential sensor innovations that may arise from future technological advancements.

1. Introduction

Photosynthetically Active Radiation (PAR) is defined as the electromagnetic radiation within the 400–700 nm wavelength range, serving as the primary source of energy for plant photosynthesis [1]. Radiation within this wavelength range is fully absorbed by the photosynthetic pigments in chloroplasts, driving photosynthesis and consequently playing a critical role in the energy flow and carbon cycling of ecosystems [2]. As one of core variables in plant photosynthesis, the intensity and distribution of PAR not only govern plant growth and development [3] but also directly affect agricultural productivity and the rate of carbon sequestration in ecosystems. PAR also influences water use efficiency [4], soil color assessment [5], the leaf area index (LAI) [6], animal behavior [7], and other related factors.
Accurate measurement of PAR is indispensable for agricultural research and applications. Measurement techniques have continuously evolved in response to the demands of ecosystem research and agricultural development and can be broadly classified into sensor-based in situ measurements and indirect estimation methods. The latter relies heavily on meteorological radiation parameters and satellite-derived products.
In situ measurement of PAR utilizes dedicated quantum sensors or spectroradiometers that convert radiation within the 400–700 nm range into electrical signals and subsequently calculate the photosynthetic photon flux density (PPFD, μ mol / m 2 / s ). This method can accurately reflect the true radiation conditions at the measurement site while providing high temporal resolution. Currently, sensor-based in situ measurement is the mainstream approach in commercial applications. Such PAR sensors (such as those from LI-COR and Apogee) are widely utilized in agricultural and forestry research due to their accurate calibration, robust design, and precise measurements. However, their high cost remains an unavoidable impediment to widespread adoption. Recently, driven by the rapid growth of citizen science, an increasing number of researchers have begun to utilize existing sensors and open-source devices to develop low-cost PAR sensors. Through rigorous calibration and validation, these sensors can achieve accuracy comparable to that of commercial PAR sensors, with much lower cost.
Indirect estimation of PAR involves utilizing meteorological radiation parameters from ground-based stations or measurements derived from products. Subsequent estimations are performed using empirical, physical, or machine learning models. These methods primarily quantify PAR in terms of radiation flux density (unit: W / m 2 ). They effectively integrate multidimensional data and provide dynamic, long-term monitoring capabilities over large scales, thereby extending PAR measurements from local areas to broader regions. However, these methods are significantly influenced by environmental conditions, exhibit limited spatial and temporal resolution, and lack interpretability in their modeling approaches.
Although the two methods described above employ different units to measure PAR, measurements can be easily converted between photosynthetic photon flux density and radiation flux density when the incident spectral irradiance curve is available. Since PAR is a component of total solar irradiance, a simpler and more commonly used approach when a rigorous spectral curve is unavailable is the application of an energy-to-photon conversion coefficient of 4.57 μ mol / J for unit conversion [8]. This conversion coefficient is not constant; it is influenced by a variety of environmental factors [9,10].
Moreover, recent studies increasingly highlight the significance of spectral regions beyond the traditional PAR definition [11,12,13,14,15]—notably, the far-red range (701–750 nm)—in driving photosynthetic efficiency and plant morphological responses, particularly under canopy shading conditions. Incorporating this extended spectral range, termed extended PAR (ePAR) [16], challenges the traditional theoretical framework that confines photosynthetically effective radiation strictly within the range of 400–700 nm. It also necessitates the adaptation of practical measurement techniques and sensor calibration protocols, fundamentally broadening both the conceptual and methodological landscapes of PAR measurement.
Recent advances in spectroscopy and sensor miniaturization [17], particularly the development of portable or miniaturized spectrometers, have opened new avenues for PAR measurement. Unlike traditional quantum sensors, which only measure integrated photon flux density within the 400–700 nm range, miniaturized spectrometers provide detailed spectral information at each wavelength. This capability enables measurements across a broader spectral range, convenient conversions between energy-based and quantum-based units, and dynamic assessment of spectral quality ratios. This method not only facilitates measurement of PAR itself but also deepens theoretical understanding of plant physiological responses under various spectral conditions, significantly enhancing practical measurement accuracy and flexibility across diverse environmental scenarios.
With further advancements in sensor technology and algorithmic models, PAR measurement technology has evolved from traditional commercial sensors to open-source, low-cost devices and innovative methods based on remote sensing and machine learning. However, a comprehensive systematic review and synthesis of the different aspects of PAR measurement techniques remains conspicuously absent.
This review aims to systematically synthesize the development of existing PAR measurement techniques, including current applications and future trends. The second section outlines the operating principles and applications of commercial PAR sensors. In contrast, the third section discusses the progress and applications of low-cost PAR sensors from a citizen science perspective. The fourth section focuses on remote sensing-based applications with model-based estimation of photosynthetically active radiation, including empirical models, machine learning models, and satellite-derived products. Finally, the fifth section provides a summary of existing technologies and outlines prospective directions for future research.

2. Traditional Commercial PAR Sensors: Principles, Limitations, and Current Applications

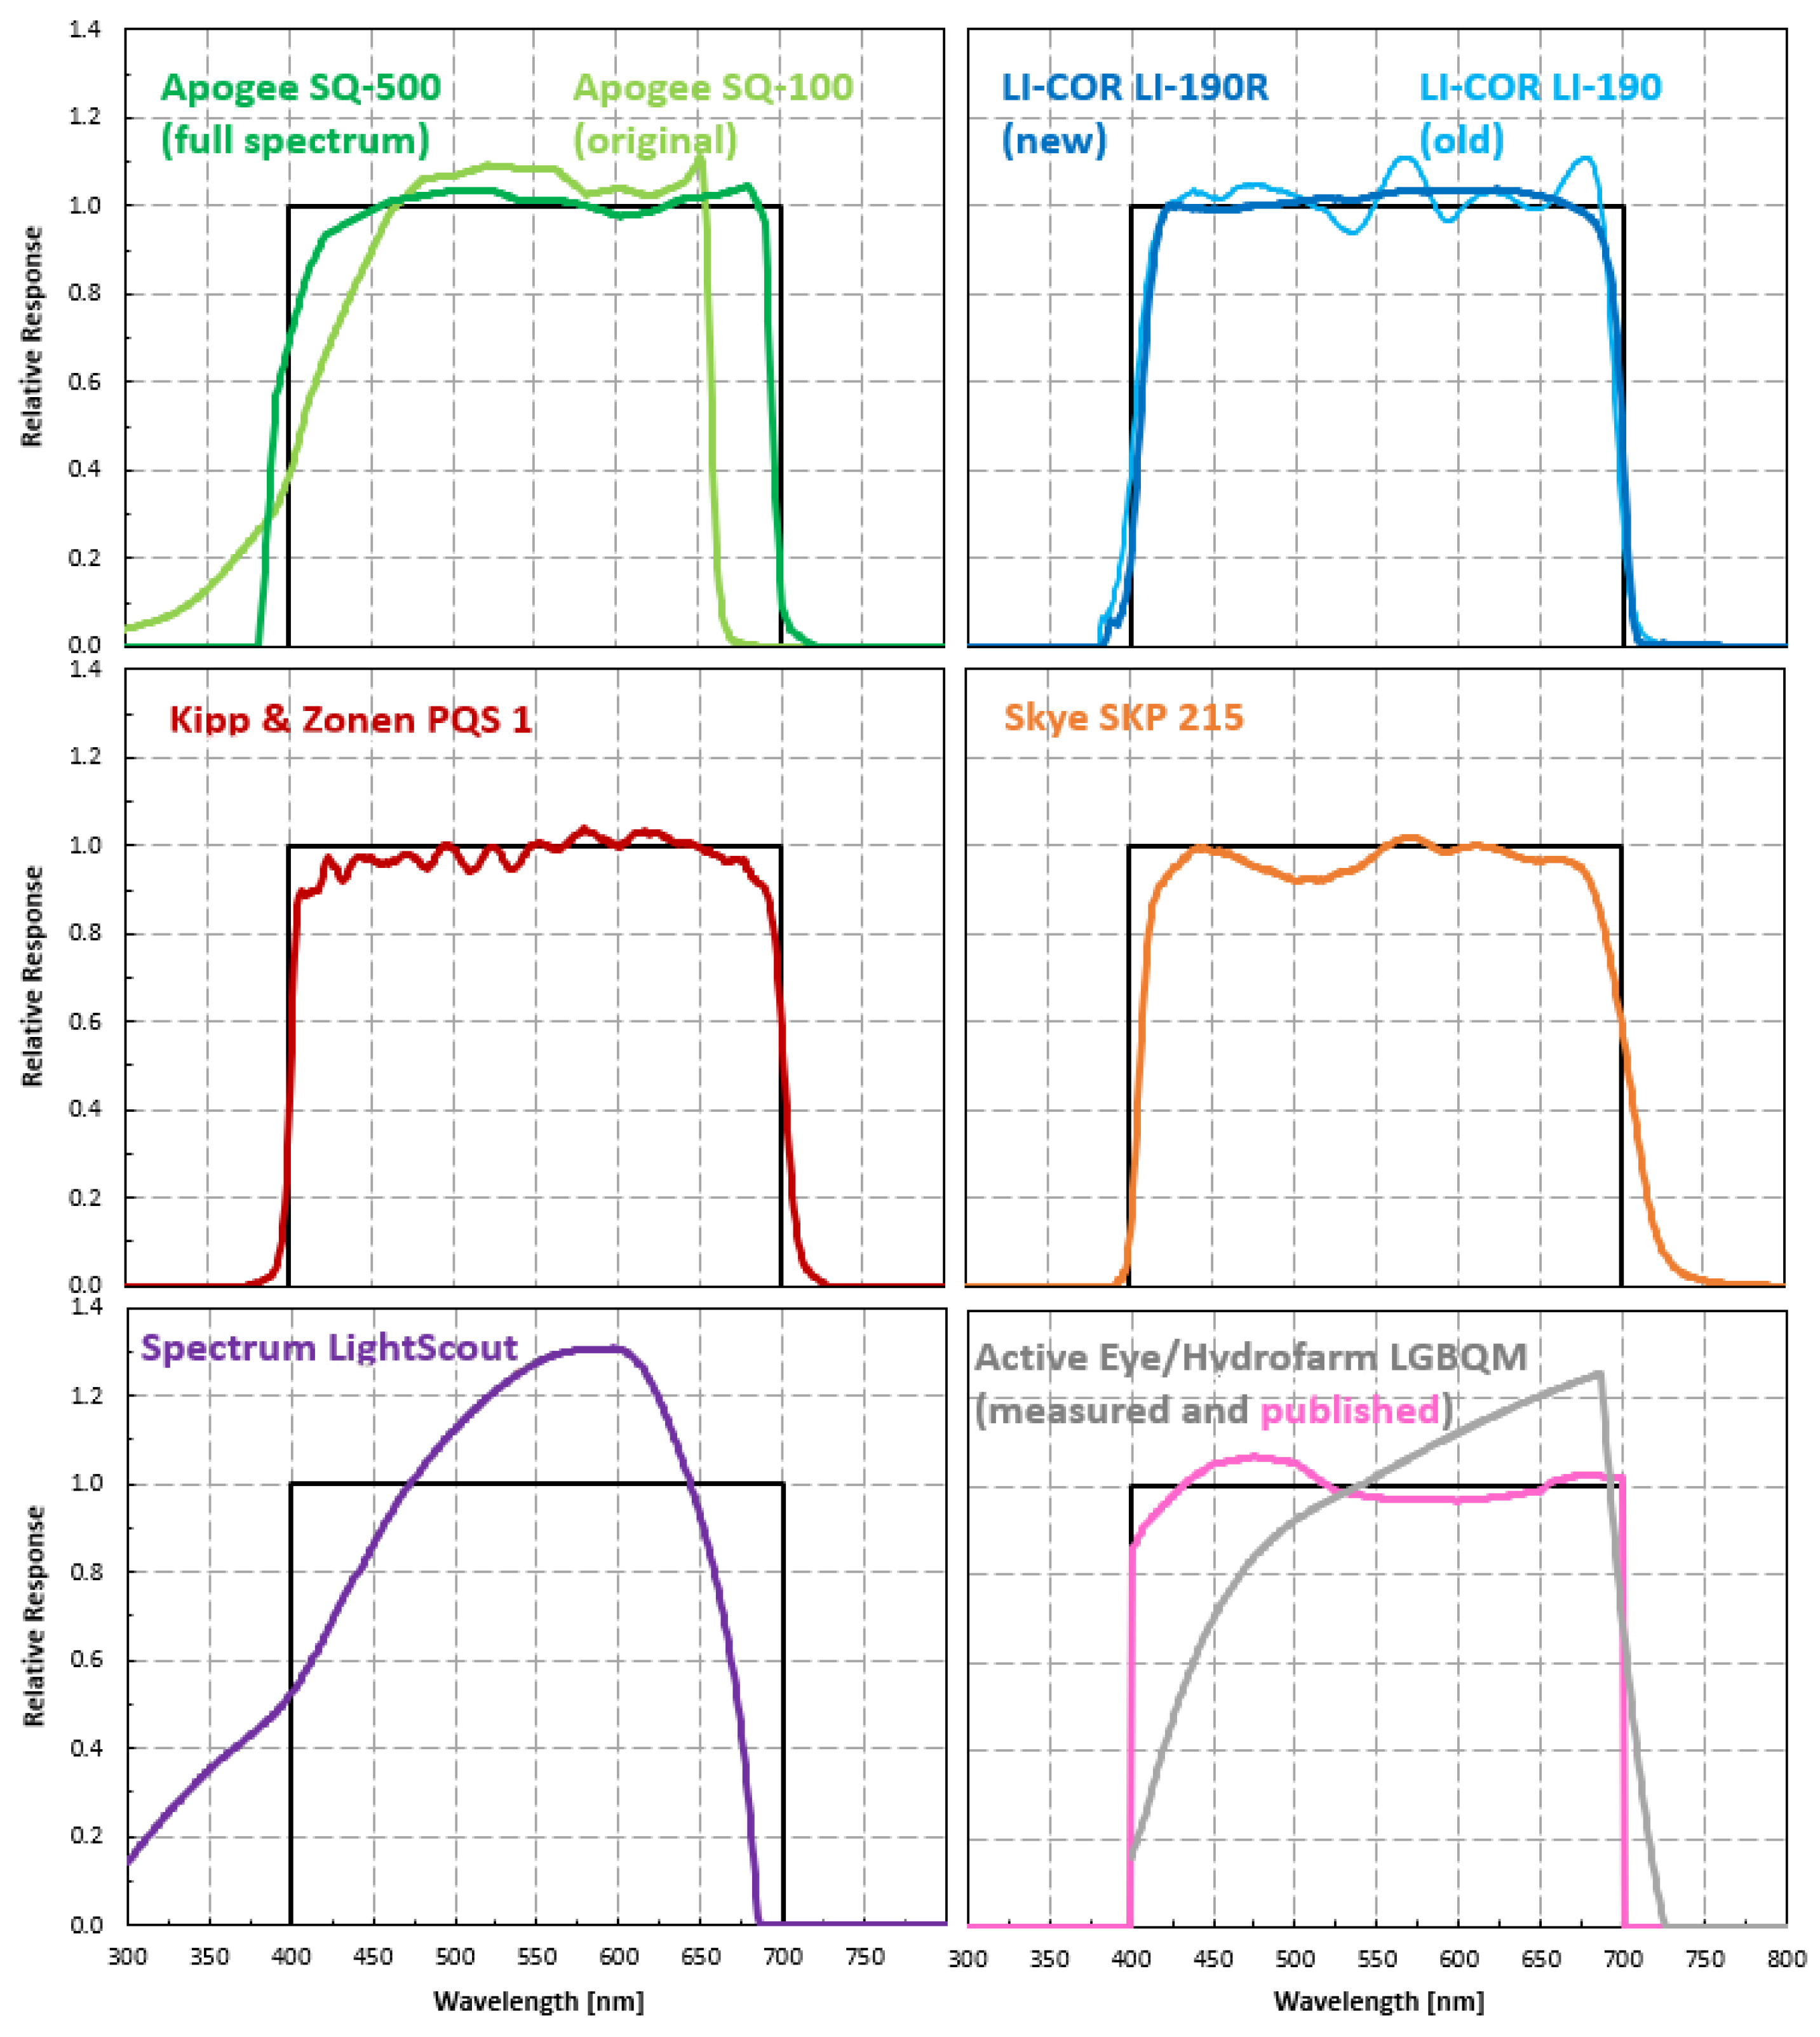
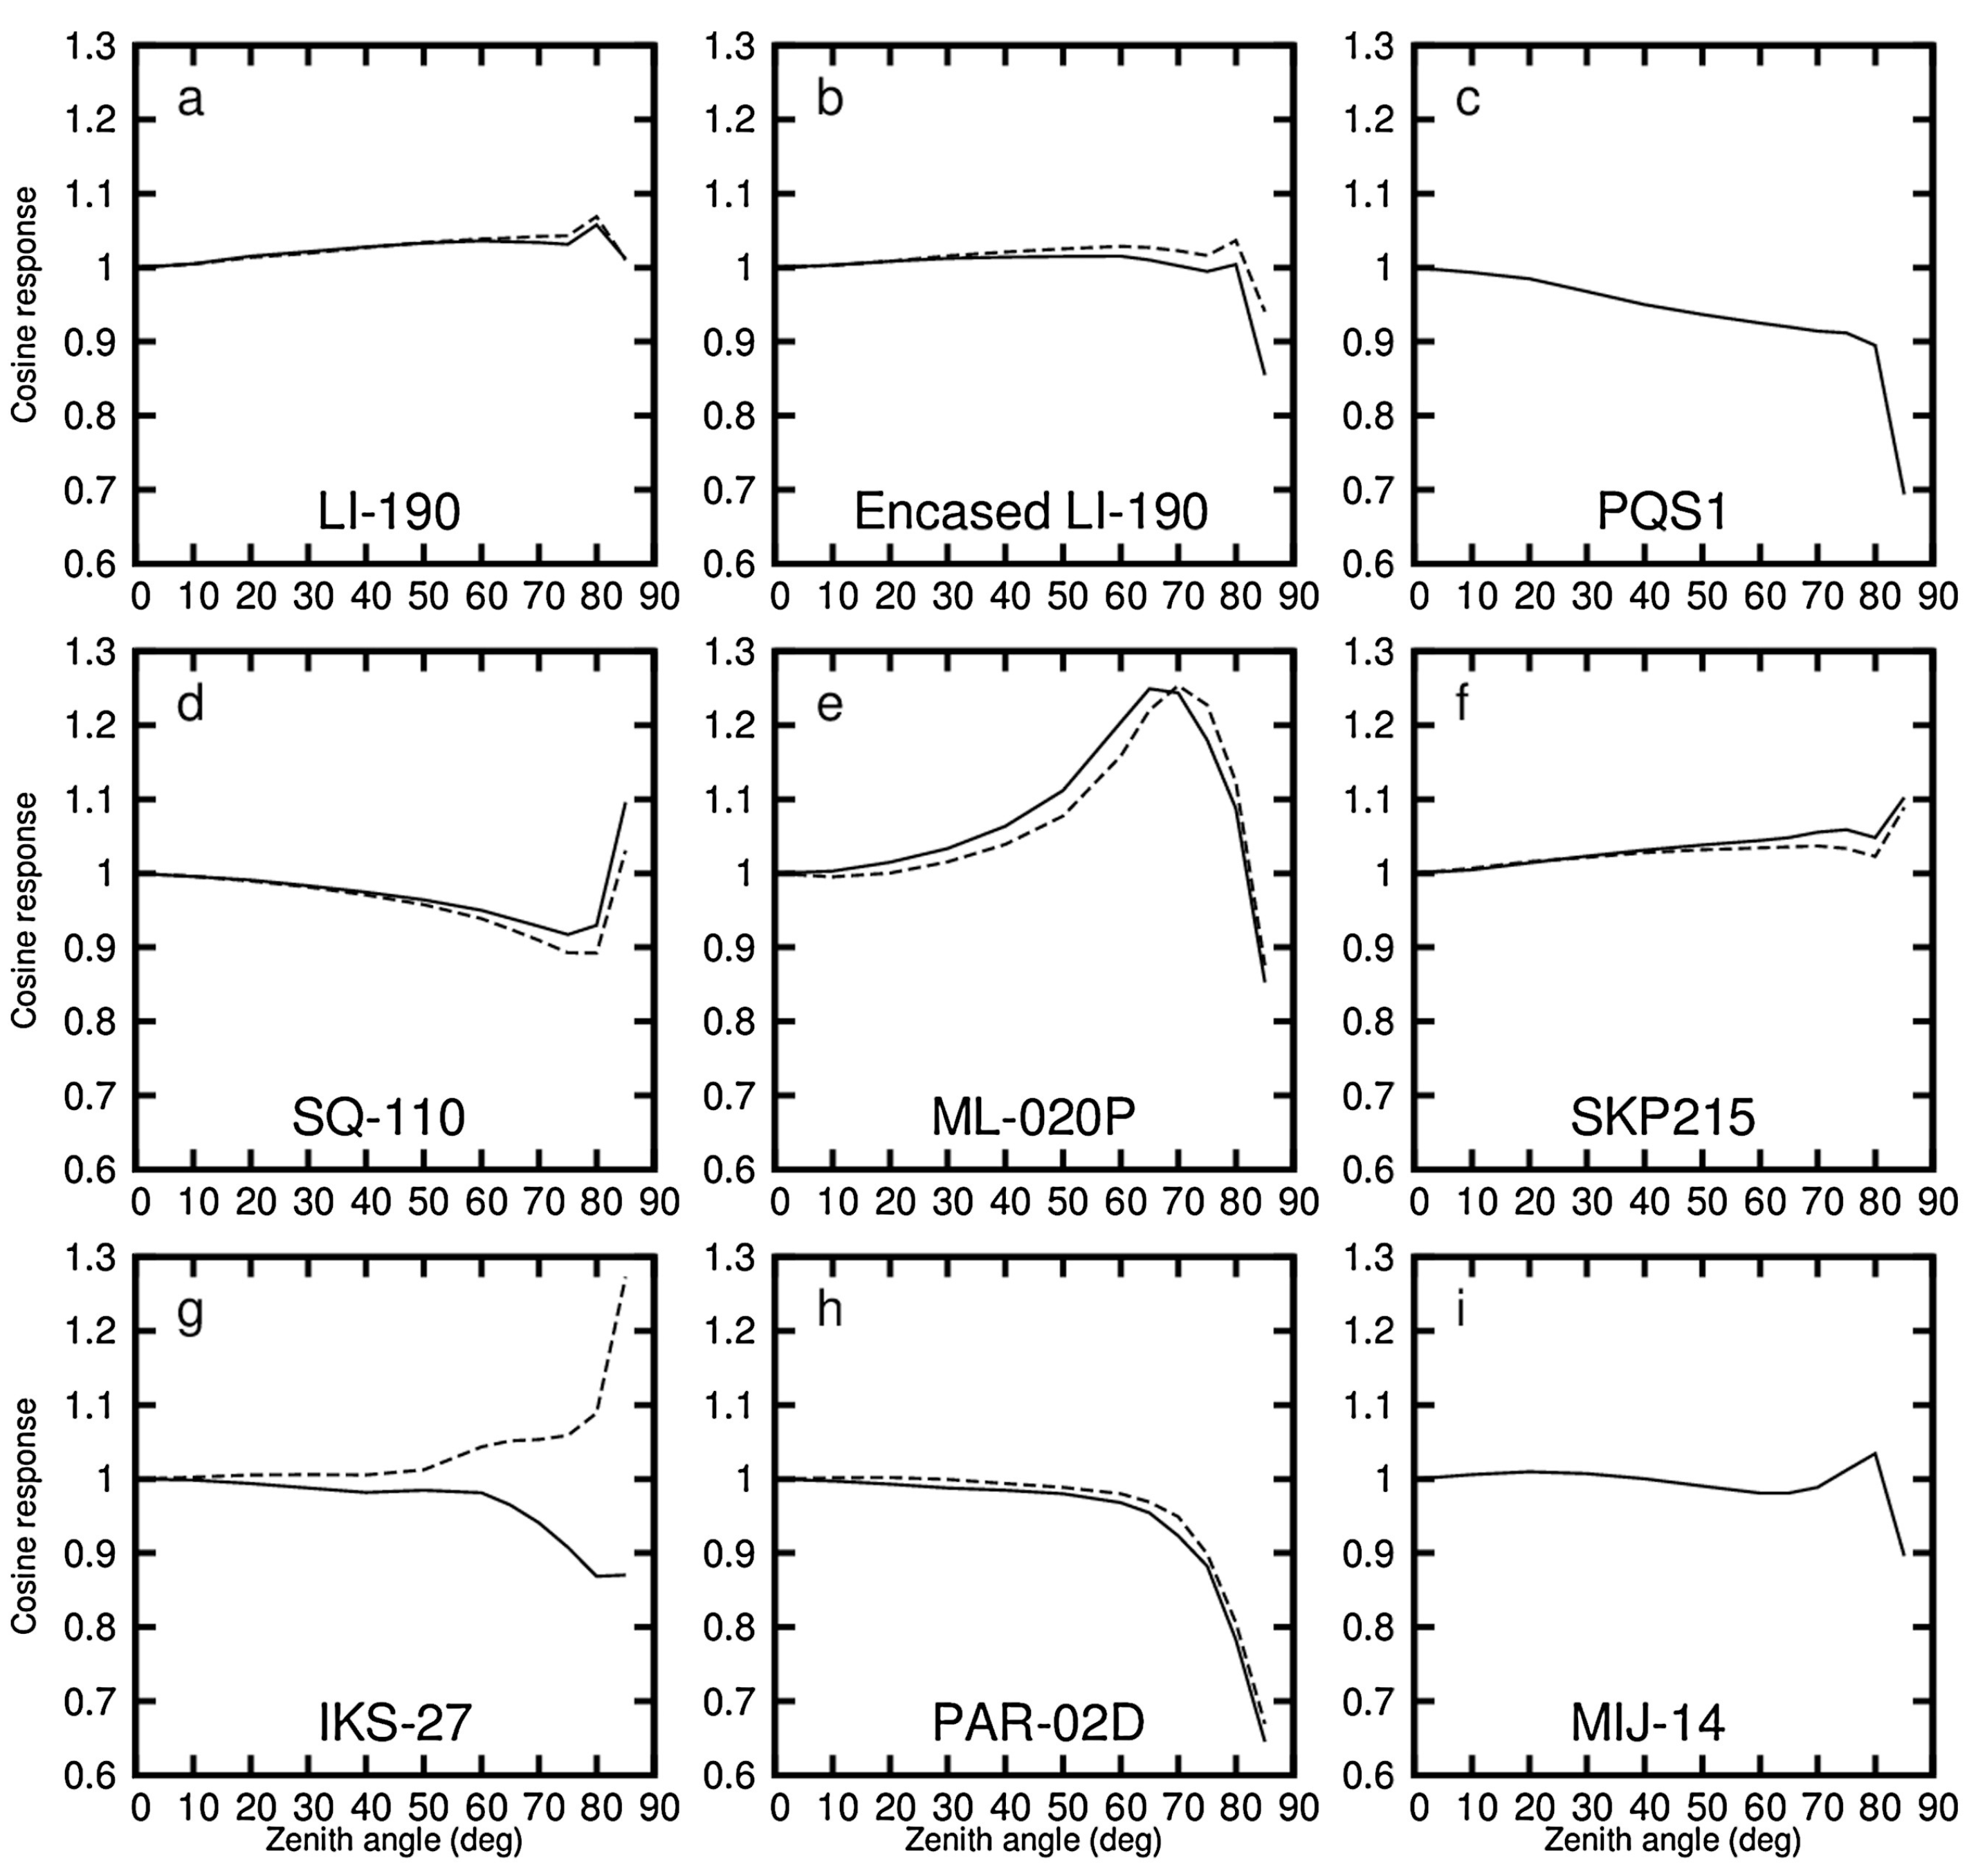
2.1. Principles and Sources of Error

Commercial PAR sensors typically comprise a diffuser, an optical filter, a detector, and a data processing unit. The detectors are primarily based on the photoelectric effect, where photodiodes convert light radiation into electrical signals for measurement. In 1966, Federer [18] compared the spectral response errors of various sensors and ultimately selected a photocell with a simple structure and minimal error. With the ongoing exploration and development of PAR sensors, subsequent applications have gradually adopted silicon photodiodes that demonstrate excellent responsiveness within the 400–700 nm range, in addition to being compact and resistant to fatigue. In order to obtain the photosynthetic photon flux density in the PAR band, it is necessary to incorporate optical filters on the sensor to eliminate responses outside the 400–700 nm range. However, due to limitations in the fabrication process and the cost of wide bandpass filters, most PAR sensors struggle to achieve precise filtering within the 400–700 nm band. Consequently, balancing filtering performance and cost has become a key area of research for manufacturers. It is worth noting that Norman [19] employed two specially paired silicon photocells to filter out far-red light beyond 700 nm; however, the complexity of matching these components presents challenges for mass production.
Another key research area related to PAR sensors involves correcting the intrinsic spectral response function of the photodetector through various means. This correction ensures that the sensor achieves an ideal photon response curve (a smooth, straight line) in the 400–700 nm range. PAR sensors with non-ideal spectral response curves may produce varying readings under different spectral conditions, such as under direct sunlight and in greenhouse interiors and canopy reflection zones. This variability can affect the overall versatility of PAR sensors. Blonquist [20] compiled the spectral response functions of eight quantum PAR sensors, as shown in Figure 1.
Another significant source of error arises from the variation in Fresnel reflection with changes in the incident angle, leading to a cosine response error. When light strikes the sensor surface at an oblique angle, the sensor’s response typically follows a cosine distribution relative to the incident angle. However, angle-dependent Fresnel reflection causes the measured PPFD to deviate from the actual distribution. This error significantly impacts sensor accuracy, particularly under conditions of high-angle light incidence. Akitsu [21] conducted a detailed study on nine commercial PAR quantum sensors, addressing the aforementioned issues. Their comparison revealed that the optimal sensors were the glass-encapsulated LI-190 and the PREDE PAR-02D. At a zenith angle of 80°, the LI-190 exhibited a maximum deviation of approximately 7% from the ideal response. The cosine response curves for the nine quantum sensors are shown in Figure 2. Errors from PAR sensors also encompass drifts resulting from temperature responses, instability, and calibration inaccuracies.
Although technical challenges such as cosine response errors and spectral mismatches have been extensively documented, their broader impacts on ecological and agricultural modeling are often overlooked. During long-term operation of PAR sensors, water infiltration and ultraviolet radiation can degrade diffusers and optical filters, leading to sensor deterioration and measurement errors [22]. Such errors, when accumulated over extended temporal and spatial scales, can introduce cumulative biases into ecological datasets. These biases can systematically affect derived variables, including net primary productivity, carbon sequestration rates, and evapotranspiration estimates, ultimately reducing the robustness of ecosystem assessments and large-scale ecological model predictions. Given the increasing reliance of ecological and agricultural research on sensor-measured PAR data, quantifying the potential magnitude of these biases and understanding their propagation into models become critically important. Currently, there is still a lack of a universally recognized quantum sensor that can serve as a standard reference to eliminate such errors. A practical interim solution is regular laboratory calibration or timely replacement of PAR sensors. Future research should prioritize cross-sensor harmonization through the exploration of standardized calibration protocols, comprehensive inter-comparison studies, and rigorous uncertainty analyses, thereby enhancing the reliability and comparability of PAR measurements across various ecological contexts and sensor types.

2.2. Applications of Commercial PAR Sensors

Owing to their exceptional calibration and reliability, commercial PAR sensors have been extensively utilized in diverse research and measurement endeavors, yielding highly effective results. In the field of animal and plant monitoring, Brzychczyk [23] employed the Apogee MQ-100 commercial PAR sensor to conduct real-time measurements of its designed microbial photoreactor, utilizing the data to implement light compensation strategies that optimize microbial proliferation. Rahman [24] employed a LightScout quantum bar sensor to measure the FAPAR of demonstrative crop Triticale. Their findings indicate that stable results can be obtained at specific solar altitude angles and sensor placement heights. Moreover, variability between rows or individual plants emerges as a significant source of uncertainty when inferring plant parameters from in situ reflectance measurements.
In the field of environmental measurement, Qu [25] used LI-COR’s LI-190 sensor to measure PAR, which was combined with other meteorological parameters to study the impact of soil environmental anomalies on the ecosystem in the Mongolian grassland. Scordo [26] developed a low-cost optical instrument (ILI) based on the commercially available HOBO MX2202 PAR sensor. By submerging the device underwater with ropes and weighted discs, ILI can measure photosynthetically active radiation at specific depths. In comparison to the expensive and cumbersome high-quality in situ radiometers, ILI is considerably more economical while maintaining comparable accuracy. Altikat [27] employed a sensor capable of simultaneously measuring multiple parameters, including PAR, crop type, soil temperature, soil moisture, and soil oxygen exchange. These inputs were used to develop various models, such as multivariate linear regression (MLR), artificial neural networks (ANNs), and deep learning neural networks (DLNNs), to predict the carbon dioxide concentration. Commercial PAR sensors are widely recognized and used by ecological monitoring stations and research institutions around the world due to their compact and rugged design, accurate output of results, and long-term stability.
The above examples represent only a subset of the numerous commercial PAR sensors available today. Commercial PAR sensors are diverse and can be broadly classified into three main categories: quantum sensors, spectral PAR sensors, and underwater PAR sensors. Quantum sensors are based on silicon photodiodes fitted with optical filters to achieve a spectral response across the 400–700 nm band, which, in some models, is extended to the 400–750 nm band, outputting the photosynthetic photon flux density (PPFD). Common examples include the Apogee SQ series, the LI-COR LI-190/LI-190R, the Skye Instruments SKP-215 series, and the Kipp & Zonen PQS-1. These quantum sensors are renowned for their high quality and are widely used in ecological monitoring, precision agriculture, and satellite calibration, among other research and industrial applications. Spectral PAR sensors not only report the PPFD but also provide multi-wavelength flux data, making them ideal for studies of the effects of light quality on plant physiology; a notable commercial example is the Uprtek PG200N. Underwater PAR sensors, such as the Sea-Bird In-Water PAR Sensor, are specifically designed for the monitoring of photosynthetically active radiation in aquatic environments and feature anti-fouling and pressure-resistant housings. In practice, users should consider their specific application requirements and cost when selecting the most appropriate commercial PAR sensor.

3. Low-Cost PAR Sensors from a Citizen Science Perspective

With the development of citizen science, scientific research has gradually transitioned from professional laboratories to the public domain. Citizen science aims to empower non-specialist participants to collect scientific data, design experiments, and engage in the scientific process using low-cost, user-friendly tools. This approach has broadened the scope of fields such as ecological monitoring, precision agriculture, and environmental research. As a crucial factor in plant photosynthesis, photosynthetically active radiation (PAR) is traditionally measured using high-precision commercial sensors. However, the high cost and complex operation of these sensors have limited their widespread adoption. In response, researchers have developed a diverse range of cost-effective PAR sensors based on photodiodes, multispectral sensors, and Internet of Things (IoT) technologies, facilitating public engagement in scientific research.
However, these sensors still face some technical challenges, such as low-cost sensors being susceptible to environmental influences such as temperature and humidity and their long-term stability requiring further improvement. Additionally, issues concerning data standardization and interoperability among different devices also need to be addressed. Nonetheless, these devices significantly reduce costs and, by leveraging open-source hardware and innovative calibration methods, have achieved reliable performance in citizen science projects. With ongoing technological enhancement, low-cost PAR sensors are poised to play an increasingly important role in citizen science, broadening public engagement in scientific research and providing essential support for ecological monitoring, precision agriculture, and environmental protection.

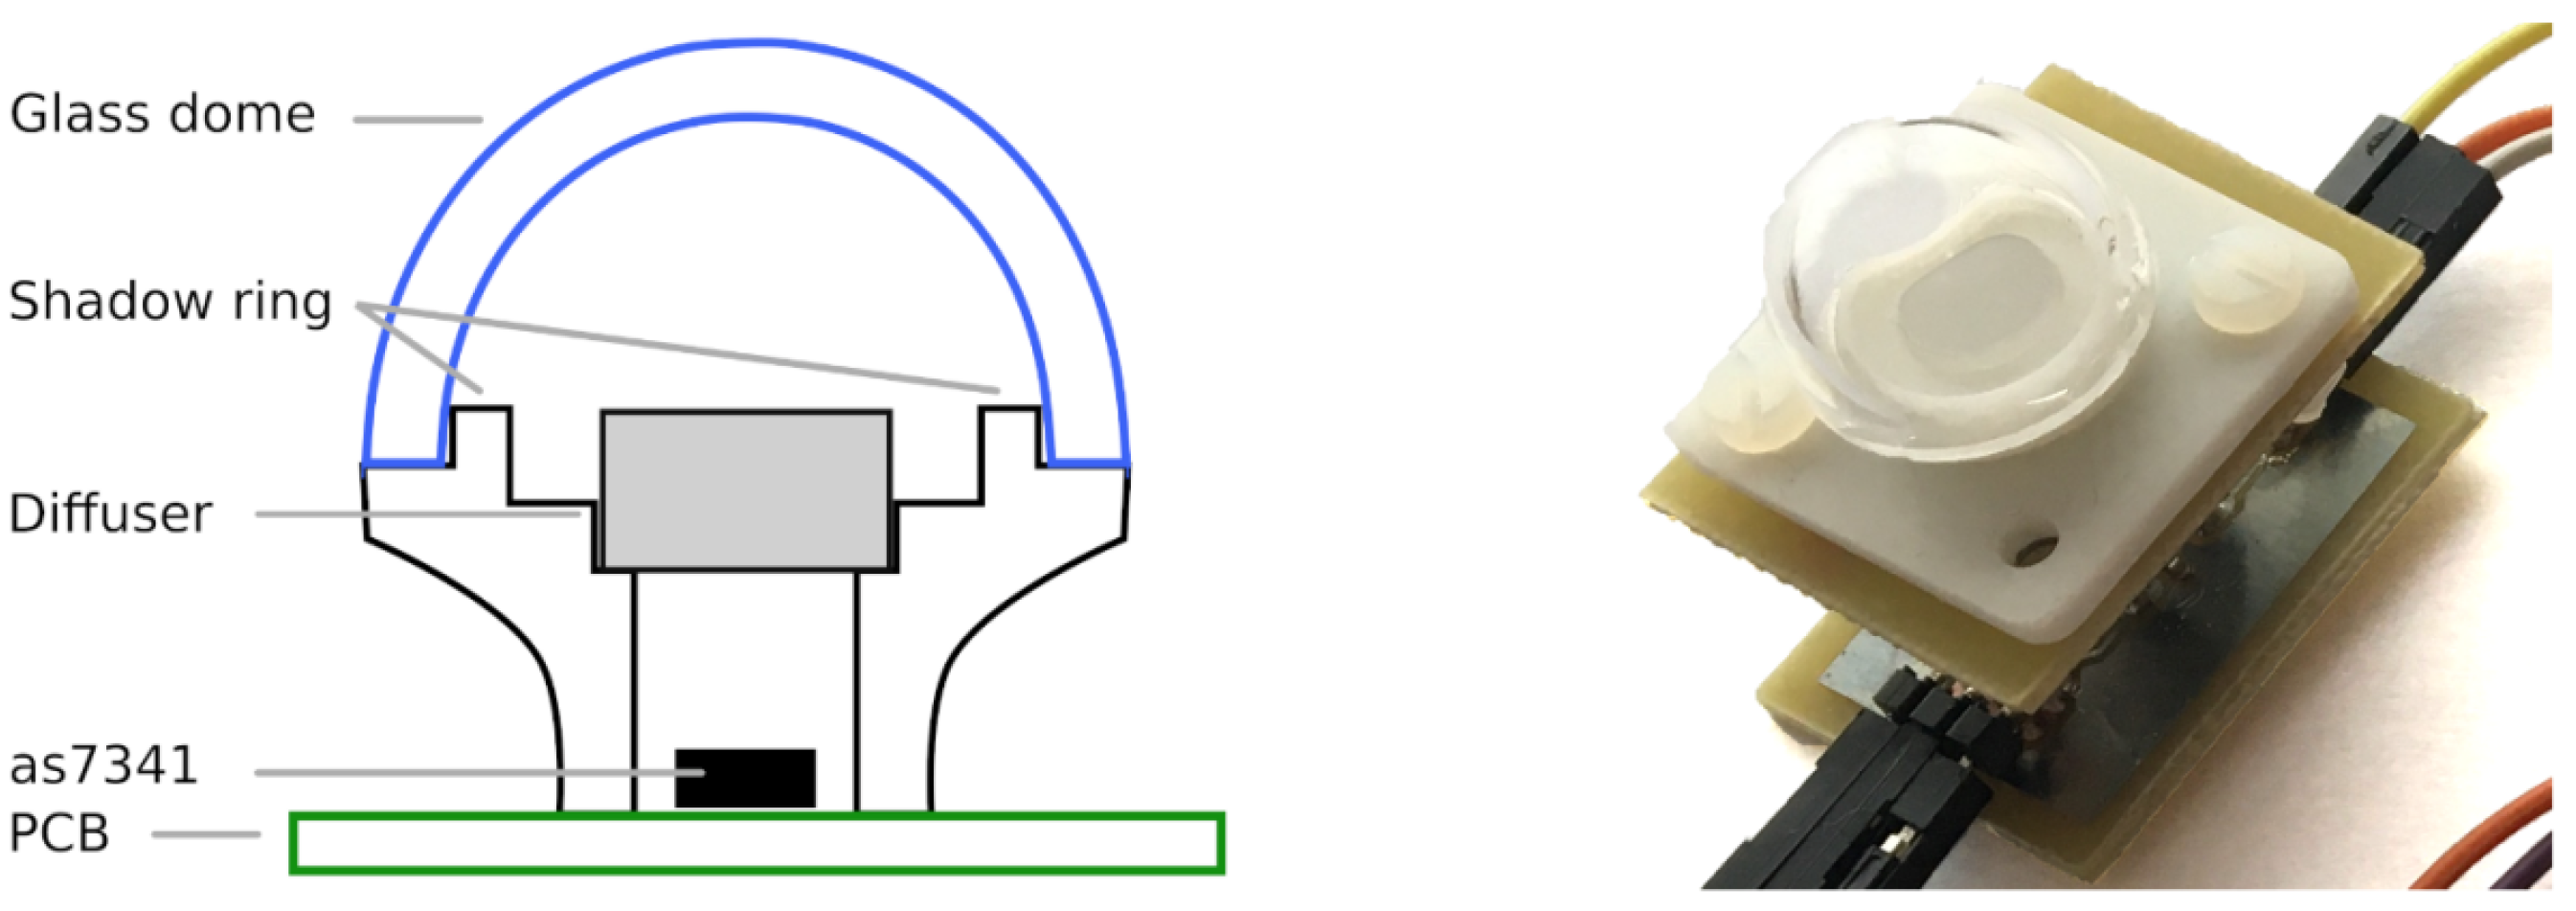
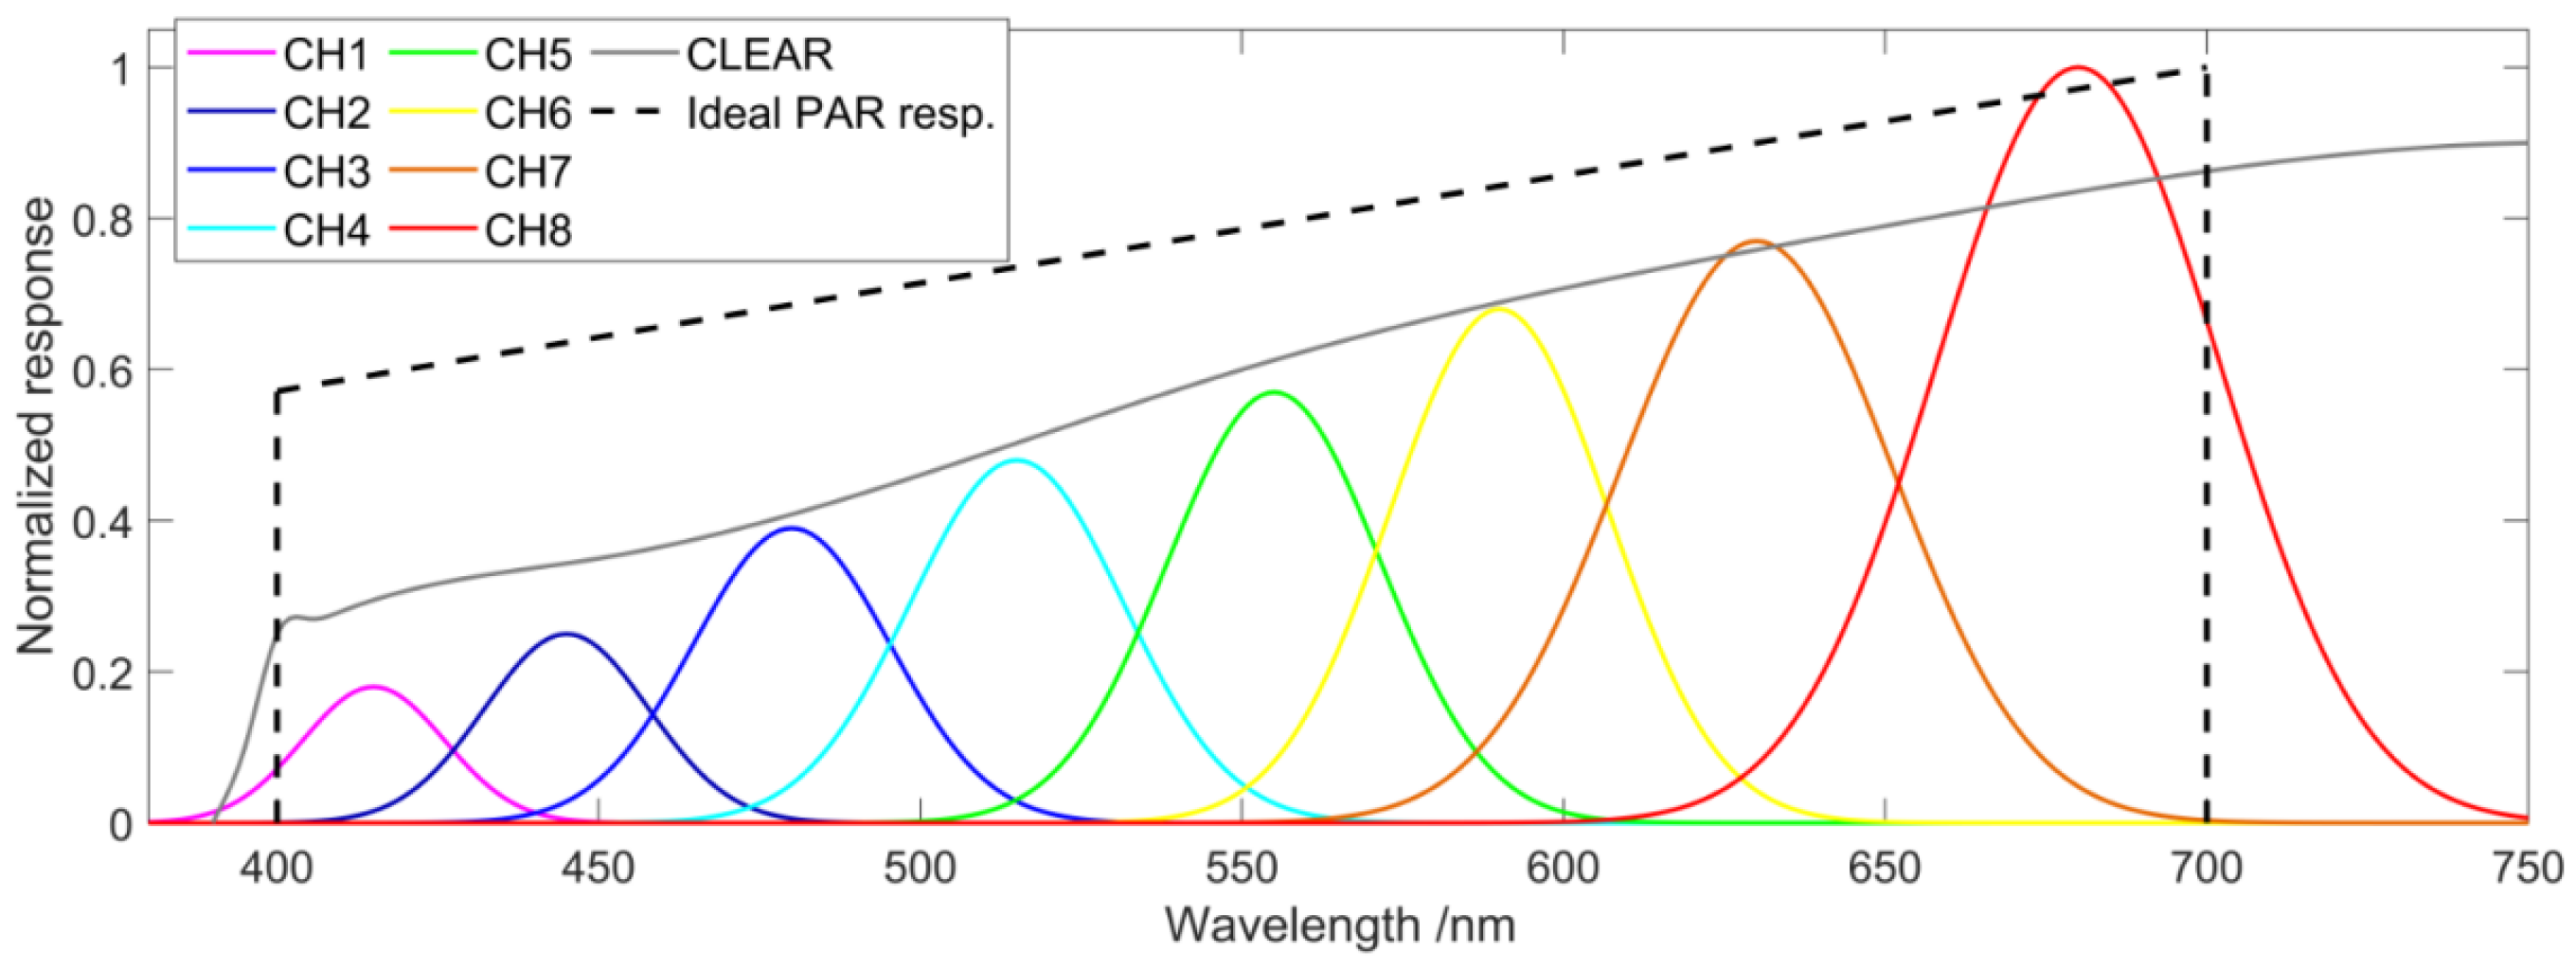
3.1. Low-Cost Design Based on Photodiodes and Optical Filters

Photodiodes, known for their low cost, low power consumption, and high photoelectric conversion efficiency, have become key component in low-cost PAR sensors. Many researchers have utilized photodiodes combined with optical filters and diffusers to achieve highly accurate PAR measurements. Rajendra [28] employed a BPW34 silicon photodiode combined with UV-IR filters and a 3D-printed diffuser to develop a sensor suitable for high-intensity light environments. Its measurement accuracy is comparable to that of the commercial LI-190R sensor, although performance under low-light conditions requires further optimization. Caya [29] utilized the VTB8440BH blue-enhanced silicon photodiode and an infrared-blocking optical filter to design a PAR sensor integrated with a custom data logger. Comparative experiments with the Apogee SQ-420 demonstrated that, at PPFD levels below 1800 μ mol / m 2 / s , the sensor exhibited an average error of only ±4.7%, with a correlation of up to 0.99 relative to commercial devices.
To further enhance the applicability and data storage capabilities of low-cost sensors, Dong [30] integrated Internet of Things (IoT) technology to design a low-cost monitoring system based on the SI1145 photodiode. The performance of this device was found to be highly consistent with that of the LI-190R, while its cost was only 20% of that of the latter. Another innovation is the PARADe system developed by Coffin [31]. Coffin et al. employed uncertified PAR/LE sensors integrated with a data acquisition system that includes an electrical signal amplifier to achieve precise total PAR measurements. A key design feature is its ability to transmit data in real time via low-power, wide-area networks (such as LoRaWAN), providing an economical and efficient solution for ecological monitoring in remote areas.

3.2. Innovative Applications of Multispectral Sensors

Due to their ability to simultaneously measure multiple spectral channels, multispectral sensors that provide higher dimensional data represent a significant opportunity to enhance sensor performance. These sensors not only broaden the spectral measurement range but also provide the combined benefits of flexibility and precision for data acquisition under specific lighting conditions.
Currently, the AS7265x sensor has the largest number of spectral channels among the low-cost PAR sensors in practical use. The AS7265x sensor consists of three integrated circuits (ICs), each featuring six optical channels, resulting in a total of 18 channels covering the 410–940 nm range with a full width at half maximum (FWHM) of 20 nm. The detailed parameters are shown in Figure 3. Several studies have built low-cost multispectral PAR sensors based on this sensor. Leon-Salas [32] developed a PAR sensor based on AMS’s AS7265x integrated spectral sensor. By calibrating against a spectroradiometer and the LI-190R, the sensor’s high-precision performance under complex lighting conditions was verified. Compared to the PAR values computed from the calibrated spectroradiometer, this PAR sensor exhibited an average error of 6.83%; under the same conditions, the error for a commercial PAR sensor was 12.51%. Additionally, the AS7265x costs approximately USD 5 per chip, demonstrating a favorable balance between cost-effectiveness and performance. D Stevens [33] developed an Adaptalight system that employs the AS7265x multispectral sensor to measure PAR in a Miniature Indoor Smart Hydroponics (MISH) system. By utilizing a linear regression calibration model and comparing its performance with that of the Apogee SQ-520, the system was shown to accurately capture PAR intensity in complex indoor lighting environments.
There are also some solutions involving the building cheap PAR sensors based on the AS7341 sensor with eight visible-light-spectrum channels. Baumker [34] employed the AS7341 sensor, integrating a cosine corrector and a multivariate linear regression model, to design a low-cost PAR sensor. An image of the actual device and its spectral response curve are shown in Figure 4 and Figure 5, respectively. By fitting the readings from the AS7341’s eight visible light channels to the LI-190R measurements, an excellent fit was achieved with R 2 = 0.991 . The sensor covers a measurement range of 0–1600 μ mol / m 2 / s , with an accuracy of 14 μ mol / m 2 / s , and the hardware cost of the AS7341 is less than EUR 10. Similarly, Comella [35] utilized the AS7341 sensor to measure both PAR and the LAI. By using the LI-190 as the calibration standard and applying multivariate linear regression, they achieved promising results. Larochelle [36] addressed canopy heterogeneity by developing a dynamic field-of-view multispectral sensor based on the AS7341. This device actively adjusts its incident field-of-view angle to optimize the capture of illumination from multiple angles. Using multivariate regression model for calibration, the sensor demonstrated outstanding performance, achieving R 2 = 0.9985 under both diffuse sunlight and LED testing conditions. With a cost of only USD 117, this innovation further expands the application scope of low-cost PAR sensors.
Some studies have also employed sensors with fewer spectral channels to construct PAR sensors, achieving promising results. Zonzini [37] employed an RGB sensor (BH1749NUC) combined with a multilayer perceptron (MLP) model to further optimize diffuser selection and data fitting methods. Their device demonstrated remarkable accuracy, with a low RMSE and robust reliability under medium-to-high light-intensity conditions. Compared to linear regression, the accuracy of the MLP model improved by approximately 30%, with a PPFD peak reaching 480 μ mol / m 2 / s . The system costs approximately USD 90 and can operate continuously for over 430 days. Additionally, Kutschera [38] employed a modular design to construct a PAR sensor by integrating a photodiode (TCS34715FN) capable of measuring the intensities of four light channels with an Arduino microcontroller. This approach significantly enhanced the sensor’s flexibility, making it suitable for diverse lighting environments, and resulted in a PPFD measurement range of up to 1200 μ mol / m 2 / s . Mims [39] developed a spectrally selective PAR sensor based on blue and red LEDs, achieving an R 2 of 0.97 when compared to both the Apogee QSO and LI-190SA. By separately analyzing the spectral responses at 380 nm and 620 nm, the device can assess the distinct impacts of aerosols on blue and red PAR. Although the sensor performs remarkably well under high light intensities (up to 2500 μ mol / m 2 / s ) and exhibits long-term stability superior to that of conventional interference filters, its relatively high temperature coefficient (approximately 1%/°C) may compromise accuracy under extreme temperatures. Consequently, continuous outdoor operation requires additional temperature regulation or data correction.

3.3. Other Types

In addition to photodiodes and multispectral sensors, some studies have explored innovative designs that both combine existing technologies and create entirely new hardware, thereby offering more options for specific application scenarios. These devices demonstrate unique adaptability in remote, subterranean, or underwater environments, further broadening the application scope of low-cost PAR sensors. We compiled the parameter information for several low-cost PAR sensors in Table 1.
Cruse [40] developed a device that utilizes a rotating shadow band and the LI-190R sensor to continuously collect hourly PAR data. This system provides ongoing measurements of total, direct, and diffuse PAR in remote locations at a lower cost—approximately half that of commercial systems.
Table 1. Parameter information of 14 low-cost PAR sensors.
Principle TypeCore Component ModelCalibration ProductFitting ModelAccuracyPAR Range ( μ mol / m 2 / s )Spectral Range (nm)CostReference
Multispectral sensorAS7341LI-190RPartial least squares regression R 2 = 0.9985 <1000415–680117 dollars[36]
AS7265xApogee SQ-520Multiple linear regression R 2 > 0.99 <350410–94050 dollars[33]
AS7265xLI-190R; Calibration spectroradiometerMultiple linear regressionMean error 6.83%<1500410–9405 dollars per Chip[32]
AS7341LI-190Multiple linear regressionnRMSE = 0.02<600415–680Unkown[35]
AS7341LI-190Multiple linear regression R 2 = 0.991 , RSME = 16<1600415–680Sensor cost below 10 euros[34]
PhotodiodeTCS34715FNLI-COR 190RMultiple linear regressionGood linear relationship<1300300–1100Unknown[38]
VTB8440BHApogee SQ-520Linear regression R 2 = 0.99 , Relative error 4.7%<1800330–720Unknown[29]
BPW34LI-190RCalculated using photocurrent magnitude and average quantum absorption efficiencyRelative error range from 80% to 0.7% (depending on light intensity)<10395–700unknown[28]
PAR radiation sensorPAR/LEPSQ1Linear regression R 2 = 0.99 <2500unknown427.6 Euros[31]
LI-COR 190SACalibrated sensor by NEONLinear regression R 2 = 0.99 <1700Unknown685 dollars[41]
RGB sensorBH1749NUCApogee SQ-110Multi-layer perceptron modelRMSE = 10.51<480400–110090 dollars[37]
Visible and near-infrared light sensorSI 1145LI-190RPolynomial fitting R 2 = 0.961 <1800near 400–700110 dollars[30]
Light intensity loggerHOBOLI-1000Exponential fitting R 2 = 0.983 <2000150–1200Unkonwn[42]
Light-emitting diodeUnkownApogee QSO; LI-190SALinear regression R 2 = 0.97 <2500380; 620Unkown[39]
Barnard [41] combined the LI-190SA sensor with the Arduino open-source hardware platform to facilitate long-term measurement and recording of PAR, providing a low-cost alternative to research-grade data loggers. Long [42] converted a light intensity data logger into a high-quality PAR sensor through calibration. Due to its compact size and robust durability, this sensor is particularly well-suited for light measurements in subterranean or shallow-water environments. After calibration, the sensor’s consistency was within 3.8%, and an exponential fit yielded an R 2 of 0.983. The research team also compared various sensors—including HOBO, Odyssey, and LI-COR models—to validate their reliability across diverse environments, such as sandy areas, seagrass beds, and coral reefs.
Despite the promising advances and cost advantages provided by low-cost PAR sensors, it is critical to acknowledge and address the inherent trade-offs between affordability and long-term data reliability. Under prolonged field deployment, environmental factors such as sensor drift [28,43], humidity fluctuations [44], temperature extremes [36,39], and spectral noise [28,29,34] can significantly degrade sensor performance and introduce systematic biases in collected datasets. Such biases, if left uncorrected, could undermine the quality and comparability of long-term ecological monitoring and agronomic research data. While the development of low-cost PAR sensors aims to reduce deployment costs in agricultural applications, their widespread adoption in scientific research demands equally rigorous quality assurance and quality control protocols. Future research should prioritize the development of robust calibration procedures, including periodic laboratory and field-based recalibrations [45], standardized inter-calibration practices with high-precision commercial sensors, and comprehensive documentation of sensor performance across diverse environmental scenarios. These steps are essential in ensuring that data generated by low-cost sensors are meaningfully comparable to those from traditional high-precision systems, thereby enhancing their reliability and scientific utility.

4. Remote Sensing Estimation of PAR: Integration of Large-Scale Observations and Ground-Based Validation

Against the backdrop of the increasing maturity of commercial PAR sensors and the emergence of citizen science-driven, low-cost sensor technologies, ground-based in situ measurements have played a vital role in local-scale PAR monitoring. However, many regions of interest still lack the capacity for long-term in situ PAR measurements, and these ground-based methods are constrained by their spatial coverage and temporal resolution, making it challenging to meet the scientific demands for large-scale, long-term dynamic monitoring. Remote sensing methods, with their advantages in spatial continuity and temporal extent, provide a crucial complement for the monitoring of PAR.
In general, remote sensing methods for PAR estimation can be roughly divided into physical radiation transfer models, empirical models, lookup table methods, machine learning models, and hybrid models. The physics-based radiation transfer model (RTM) simulates the scattering and absorption of light in the atmosphere, leaves, and canopy by solving the radiation transfer equation [46,47], which can provide the highest theoretical accuracy but has high requirements for computing resources and is suitable for high-precision regional models and ecological process research. The empirical model links PAR with easily measured meteorological or radiation parameters through statistical regression. Its operation is simple and widely used [48], but it is difficult to adapt to complex climate and terrain differences, has poor mobility in different regions, and encounters difficulty in capturing nonlinear information. It is suitable for data-scarce areas and long-term climate trend analysis. The lookup table method generates an output table in a multidimensional parameter space by running the physical model in advance, which can be used to quickly look up the table to obtain the corresponding PAR. Compared with the physical model, it saves a lot of time and computing power and can flexibly select a combination of key parameters, but it lacks adaptability to situations outside the table boundary. It is suitable for monitoring systems that need to balance efficiency and measurement accuracy [49]. The machine learning model [50] incorporates today’s popular computer technology and estimates PAR by combining various types of input information and computational models. It has strong nonlinear fitting capabilities and high training accuracy and can capture complex spatiotemporal correlations, but it is easy to overfit and has poor interpretability. It is suitable for regional observation networks with rich data. The hybrid model [51] takes into account both physical knowledge and machine learning technology. For example, deep learning is used to quickly approximate RTM output, balancing computational efficiency and regional adaptability, but the model construction and calibration are complex, and the development difficulty is high. It is suitable for global-scale solutions.
By developing different remote sensing models, accurate PAR estimation can be achieved from regional to global scales, which can be combined with ground observations to form a comprehensive monitoring system. This chapter systematically examines the theoretical foundations and practical applications of remote sensing in PAR measurement from three perspectives: empirical models, remote sensing methods based on machine learning and deep learning, and satellite product estimation. This examination lays the groundwork for multi-scale and multi-level ecological monitoring.

4.1. Empirical Model

As one of the earliest remote sensing techniques widely utilized for large-scale PAR monitoring, empirical models establish statistical regression models between PAR and other readily observable meteorological and radiative parameters, including the global radiation, clear-sky index, and solar elevation angle. These models provide an efficient and low-cost solution for PAR estimation. Given that PAR is a component of the total global solar irradiance ( R s ), one of the simplest empirical methods for calculating PAR involves applying the PAR/ R s ratio to the measured total global solar irradiance ( R s ). Various studies have reported PAR/ R s ratios ranging from 0.40 to 0.48 [52,53,54]. Variations in the PAR ratio can be attributed to various factors, including the time [2,55], geographic location [54,56], climate conditions [57,58], irradiance [53,55,59,60,61], sky conditions [62,63,64,65], and so on. Total solar irradiance is just one of the parameters in empirical models. Noriega [66] listed a series of parameters for developing empirical models; we reorganized these parameters and present them in Table 2 below.
Theoretically, numerous meteorological and radiative parameters can be used in empirical PAR regression models. However, constrained by the measurement conditions of specific geographic environments, different studies have selected various easily measurable parameters. These studies subsequently fit these parameters to PAR measurements—using either univariate or multivariate approaches—to develop a range of empirical models for predicting PAR. We present Table 3, which lists several representative empirical models.
By utilizing a variety of parameters and indirect measurements, empirical models can efficiently estimate PAR in an economical and convenient manner. Noriega [66] and Nwokolo [104] have provided comprehensive information regarding empirical models for predicting PAR. Compared with direct in situ measurements, the advantages of empirical models include their low cost, high flexibility, and broad applicability, making them especially suitable for regions with limited resources or for long-term monitoring requirements. Despite the practical advantages of empirical models, their inherent assumptions significantly constrain their broader applicability. Common assumptions such as linearity and atmospheric homogeneity often fail to hold across diverse ecological zones [105,106], potentially leading to systematic biases in PAR estimates. For instance, linear regression models may inadequately capture nonlinear interactions between atmospheric conditions and surface characteristics, while the assumption of atmospheric homogeneity neglects local variations in aerosols, water vapor, and cloud cover [107]. These simplifications limit the accuracy and reliability of empirical models and make the establishment and use of empirical models region-specific, making them difficult to apply across regions with heterogeneous climate and vegetation types. Empirical models also have some limitations, such as dependence on the quality of input data, difficulty in dynamically responding to complex meteorological changes, and limited ability to process multidimensional data. Therefore, future research should critically evaluate these assumptions, establish region-specific calibration schemes, and cooperate with systematic uncertainty analysis while optimizing model parameters to improve the applicability and robustness of the model.

4.2. Machine Learning Methods

In the study of photosynthetically active radiation (PAR) measurement, empirical models are quite efficient due to their simplicity and efficiency. Compared to empirical models that rely on physically interpretable meteorological or radiative variables, machine learning approaches can additionally incorporate high-dimensional and nonlinear information—such as remote sensing reflectance data, vegetation indices, time-series features, and geographic attributes—to estimate PAR. The integration of these multidimensional inputs enables machine learning models to capture complex nonlinear relationships and spatiotemporal correlations in PAR estimation. Leveraging their superior fitting capabilities, machine learning models have been widely applied across various fields. Ehteram’s study [108] provides a comprehensive examination of how various machine learning methods can be utilized to optimize algorithms for the modeling and prediction of meteorological and agricultural parameters such as rainfall, solar radiation, and wind speed, among others.
Artificial Neural Networks (ANNs) have been extensively utilized in the measurement and estimation of PAR due to their powerful capability in nonlinear modeling. Over two decades ago, Lopez [109] developed an ANN model using a multilayer feedforward perceptron trained with the Levenberg–Marquardt algorithm. This model predicts PAR based on parameters such as global irradiance, solar zenith angle, and sunshine duration and was validated across a range of environments, from oceanic regions to high-altitude deserts, achieving an R 2 up to 0.99 compared with in situ ground-station measurements. A diagram of the model for predicting PAR using an ANN model is shown in the Figure 6. Researchers [92,107,110,111,112] have also constructed various ANN models using different input parameters across diverse geographic and climatic conditions, including multilayer perceptrons (MLPs), generalized regression neural networks (GRNNs), and radial basis function neural networks (RBNN), among others. The schematic diagrams for these three models are presented in Figure 7. Their superiority over empirical models has been validated across various ecosystems, such as agricultural fields, wetlands, and forests.
Hybrid models that integrate machine learning with statistical approaches have demonstrated excellent performance in PAR measurement. The MLP-CARIMA-GPM model, which integrates MLP with ARIMA, successfully predicted PAR with high accuracy under complex climatic conditions, such as in China and India [98]. The study further revealed that by integrating physical information with data-driven techniques, these hybrid models not only effectively capture nonlinear relationships but also enhance regional adaptability, making them suitable for various climatic conditions. Furthermore, machine learning techniques can incorporate multimodal data to improve model accuracy. For example, Virani et al.employed seven machine learning methods to integrate remote sensing and meteorological datasets. They developed a rapid workflow for estimating sugarcane yield, with results indicating that the combination of meteorological data and MODIS data achieved higher classification accuracy [113].
Moreover, traditional machine learning methods—including bagging, boosting, AutoRegressive Integrated Moving Average (ARIMA), controlled ARIMA, LGBM, XGB, and KNN—have been compared with empirical models [95,114]. These traditional models require lower data quality and training complexity compared to deep learning methods. However, with precise hyperparameter tuning and additional functions, they can achieve better predictive capabilities in specific scenarios and enhance interpretability. Some studies have also utilized non-meteorological and non-radiative parameters. For instance, Mercier [115] employed a deep learning approach, utilizing a vision transformer-based model that directly generates irradiance estimates from sky images. This approach eliminates the need for auxiliary meteorological data and significantly reduces hardware dependency. In contrast, Parida [116] utilized unmanned aerial vehicles (UAVs) to collect multispectral data and developed a FAPAR model for corn using 17 environmental indices and four machine learning methods.
Whether using empirical models or machine learning methods, selecting appropriate input variables is essential to the models’ predictive accuracy. Research has shown that some core variables (such as global irradiance and the solar zenith angle [111,112]) are essential in machine learning and deep learning models for PAR prediction. Conversely, some variables (such as temperature, relative humidity, dew point, precipitable water, and water vapor [109,111]) only have a minimal impact on the accuracy of PAR estimation. Different ecosystems exhibit significant variability in their reliance on input variables [107], highlighting the importance of targeted data selection. Therefore, appropriate variable selection, high-quality data inputs, and the construction of a suitable model are imperative for the accurate estimation of PAR.
Although machine learning approaches offer promising solutions by incorporating complex nonlinear relationships and multidimensional data, several critical challenges must be addressed before widespread adoption for large-scale PAR mapping. First, machine learning models are prone to overfitting, particularly when trained with limited or geographically concentrated datasets, leading to poor generalizability across different regions [117,118]. Second, the interpretability of these models remains limited; their “black-box” nature can obscure the physical meaning behind predictions [119,120], complicating their integration into physically based ecosystem models. Lastly, transferring machine learning models to regions with sparse ground-truth data can introduce substantial uncertainties [121], potentially resulting in geographically biased errors that propagate through to global carbon cycle estimates.
To mitigate these issues, future research must adopt rigorous systematic validation strategies. These strategies should include geographically representative cross-validation procedures, integrating multi-scale validations involving both ground-based measurements and satellite-derived data. Sensitivity analyses and uncertainty quantification should also be systematically conducted, ensuring robustness and transferability of machine learning models across different ecological and climatic contexts.

4.3. Satellite-Derived Products

Empirical models and machine learning methods demonstrate high accuracy within limited areas or specific regions; however, the parameters in these methods depend on the distribution and quality of ground observation data. Their performance tends to deteriorate in locations where such observations are unavailable. Furthermore, the sparsity of observation networks and limitations in data coverage hinder their widespread application. In contrast, PAR measurement derived from satellite products offers significant advantages, including global coverage, extended time series, and the integration of multi-source data. Figure 8 shows the spatial distribution of PAR measured worldwide using two satellite products.
This approach estimates PAR by utilizing remote sensing data on atmospheric conditions, cloud cover, and surface reflectance. Physically based radiative transfer models (RTMs), lookup-table (LUT) approaches, and parameterization techniques that balance computational efficiency and accuracy have been employed to estimate PAR from satellite data. In 1999, Frouin [123] reviewed satellite algorithms for estimating PAR at the Earth’s surface. Over the past several decades, various PAR satellite products have been developed, and this section focuses on the progress of satellite-derived products for PAR. Information on satellite-derived products utilized for PAR estimation is provided in Table 4.
Frouin [124] estimated ocean-surface PAR using multispectral reflectance data obtained from the ADEOS-II Global Imager (GLI). By using a radiative transfer model, he corrected for the effects of cloud reflectance, aerosol scattering, and gaseous absorption; validation results indicated that the monthly error was less than 8%. Su [125] employed shortwave radiation data from CERES products and implemented a lookup table (LUT)-based method to retrieve surface PAR, including its direct and diffuse components. Validation results demonstrated a relative deviation of only 4.6% under all-sky conditions. Onyekwelu [126] utilized Bayesian regression in combination with CERES data to estimate PAR, specifically targeting prediction in soybean-growing regions. Within the Bayesian regression framework, it was determined that the optimal model consisted of the clearness index ( k t ), solar irradiance, and maximum temperature ( T m a x ) as predictive factors.
Table 4. Selected PAR satellite-derived products.
Satellite-Derived ProductCategoryCountryReferences
MODISModerate-resolution imaging spectroradiometerAmerica[49,113,122,127,128,129,130,131,132,133,134]
ADEOS-II GLIImaging spectrometerJapan[124]
Sentinel-3 OLCIMultispectral imaging instrumentEurope[135,136,137]
CERESPassive radiometer sensorAmerica[125,126]
SeaWiFSMultispectral imaging instrumentAmerica[130,138]
MERISModerate-resolution imaging spectroradiometerEurope[130,139]
CAMS-RadSolar radiation productsEurope[140,141]
Some researchers have also developed a global land PAR product by integrating MODIS and geostationary satellite products through a LUT-based approach. The results indicated a low RMSE for the predicted PAR values, suggesting that atmospheric profiles, ozone levels, and water vapor had minimal impacts on PAR prediction [127,128]. Zhang [49] estimated PAR from GOES-16 and MODIS data using a LUT-based approach that incorporates aerosol optical depth (AOD) and cloud optical depth (COD), achieving a validation result of R 2 = 0.97 . They proposed that spatial and temporal averaging could mitigate uncertainty in the PAR inversion. Li [129], Gould [131], and Tang [134] also utilized MODIS data to investigate PAR estimation. Harme [136] developed the OLCIPAR algorithm using the OLCI sensor onboard Sentinel-3, validating it with buoy observations in the Mediterranean. The results showed that the daily PAR estimation bias was less than 10%, with a correlation coefficient of 0.97. Pecci [137] employed the OLCI sensor on Sentinel-3 to conduct instantaneous PAR measurements over the ocean. Subsequently, they compared satellite data with in situ measurements near Lampedusa in the central Mediterranean, obtaining remarkable consistency.
In regionalized modeling, partitioning methods based on satellite data exhibit exceptional adaptability. For example, researchers estimated PAR using Kato-band data from CM-SAF and applied clustering analysis to delineate distinct climatic regions. They also developed separate linear regression models for each region. Validation results revealed R 2 values as high as 0.99 [93]. This regionalized modeling approach effectively accounts for the characteristics of different climatic zones, significantly enhancing the applicability of satellite data. Meanwhile, multi-source data fusion techniques are continuously advancing the accuracy and resolution of PAR measurements. For instance, some researchers combined ISCCP cloud products, MERRA-2 aerosol data, and ERA5 variables to generate a global gridded PAR dataset spanning 35 years. This global dataset has a temporal resolution of 3 h and a spatial resolution of 10 km, demonstrating superior accuracy compared to CERES products [122].
Various satellite-derived products have also offered diverse options for PAR measurement through comparative and validation analyses. Products such as HC3, CAMS-Rad, and SARAH-3 have been employed for the global validation of solar irradiance, showing correlation coefficients exceeding 0.95 in regions including Europe, Africa, and South America [141]. The distribution of the ground PAR monitoring stations they used is shown in Figure 9. Five global FAPAR products—MODIS, MISR, MERIS, SeaWiFS, and GEOV1—were compared. The results indicate that MODIS, MISR, and GEOV1 are in good agreement with one another, while MERIS and SeaWiFS also exhibit strong consistency with each other. However, the difference between these two groups may be as high as 0.1 [130]. Finally, Yang conducted a global validation of eight satellite-derived irradiance products, with data spanning 27 years [140].
Regardless of the remote sensing method used, the accuracy of the data is critical for PAR monitoring. Tang [122] found that the quality of PAR observations from CERN (from China) was slightly worse than that of observations from SURFRAD and NEON. One possible reason is that China’s aerosol optical depth (AOD) is much greater than that of the United States, and the greater uncertainty in the aerosol data leads to larger errors in China’s PAR estimates. When studying the PAR of the Arctic seafloor, Singh [142] found that due to the high uncertainty of in situ PAR measurements and the offset of remote sensing data caused by clouds and sea ice, their final estimate of the annual PAR had a 24% uncertainty.
Currently, satellite-derived PAR products still face significant challenges that limit their accuracy and global applicability. Persistent issues such as atmospheric interference [122], dynamic variability in cloud cover [131], and environmental differences across regions impose higher demands on model adaptability [141]; varying predictive parameters and environmental conditions affect the validation accuracy of satellite products [126,137,139]; and sensor calibration drift across different satellite missions significantly impacts long-term data consistency and accuracy. For instance, sensor calibration drift over extended periods can introduce systematic biases, complicating the direct comparison of multi-decadal datasets. Cloud-cover variability, particularly rapid cloud transitions, can induce substantial short-term fluctuations in PAR estimates, degrading temporal reliability. Furthermore, discrepancies in atmospheric correction methods and aerosol retrieval algorithms across missions lead to regional biases, further complicating the harmonization of global datasets.
Although multi-source data fusion provides a potential pathway to improve global PAR estimates, merging datasets from multiple satellites involves substantial technical and computational challenges. These challenges primarily arise from inherent differences in spatial resolution [134], spectral bands, temporal sampling frequencies, and viewing geometries among different satellite sensors [128,134,143]. Key sources of error during the multi-source fusion process include spatial resampling errors, discrepancies in radiometric calibration, differences in atmospheric correction procedures, cloud detection mismatches, and temporal alignment issues. To achieve genuinely high-fidelity global PAR products, future research must rigorously address these error sources through the use of standardized calibration protocols, advanced atmospheric correction models, robust data processing algorithms [144,145], and systematic inter-sensor calibration exercises [128]. Moreover, comprehensive uncertainty analyses and validation against globally distributed ground measurements will be essential for ensuring the accuracy, reliability, and comparability of satellite-derived PAR datasets.

5. Conclusions and Outlook

This paper presents a systematic and comprehensive review of various measurement techniques for PAR and its current applications. The discussion has focused on commercial PAR sensors, low-cost sensors, and remote sensing technologies for PAR monitoring. First, the basic concept of PAR and its significance in ecology, agriculture, and environmental science were discussed. Existing methods for the measurement of PAR primarily include in situ sensor measurements and indirect estimation approaches based on various models. Although commercial PAR sensors are widely used across different fields due to their high precision, their high cost hinders large-scale adoption.The development of low-cost sensors presents a promising solution to these challenges, driven particularly by citizen science and open-source technologies, which have significantly improved the accessibility and practicality of PAR measurement devices. Moreover, advancements in remote sensing methods, such as empirical models, have created new opportunities for large-scale, long-term PAR estimation. Satellite-derived data products have made global PAR monitoring feasible. However, remote sensing approaches continue to face challenges related to data accuracy and consistency, and improving the accuracy and generality of these models remains a critical focus for future research.
Currently, the theoretical foundation for measuring PAR largely derives from McCree’s pioneering work, which focuses exclusively on photosynthetically active radiation in the 400–700 nm wavelength range. This narrow focus imposes limitations on both technical methodologies and the scope of research.
As research has progressed and laser technology has evolved, an increasing number of studies have demonstrated that factors such as varying spectral intervals [146,147], light quality ratios [148,149], and far-red light [150,151] significantly influence plant growth and development. These effects are contingent upon the specific growth stage and species of the plants. Measurements using traditional PAR sensors typically yield only a single PPFD value, which is inadequate for effectively guiding precision agricultural practices such as the implementation of supplemental LED lighting. A future development direction is to progressively update the McCree photosynthetically active radiation curve [152] and utilize innovative PAR sensors to provide more comprehensive and precise data regarding plant growth and development.
Theoretically, PAR measured and calculated with a spectroradiometer-based system is more precise and can also capture spectral information at the measurement site. However, practical limitations such as substantial size and high costs have led to the predominance of current PAR sensors that utilize photodiodes and optical filters. A potential future innovation is to develop PAR sensors that are based on miniaturized spectrometer technology, which enables the simultaneous acquisition of PAR measurements and spectral data. The additional spectral information captured by miniaturized spectrometers can significantly enhance physiological models of plant growth, photosynthesis, and light use efficiency. Integrating detailed spectral data into existing plant models will allow researchers to quantify plant responses to different spectral distributions more accurately, thereby improving the prediction of plant productivity and ecosystem carbon dynamics. This refined spectral modeling capability will also facilitate adaptive agricultural practices, including tailored spectral supplementation strategies and precise management of crop lighting conditions, ultimately optimizing plant productivity and resource use efficiency under diverse environmental scenarios.
However, achieving widespread deployment and effective integration of miniaturized spectrometer-based PAR sensors into existing agricultural and ecological monitoring frameworks will require continued development of micro-spectrometer technology, cost reductions resulting from large-scale production, standardized measurement protocols, and rigorous calibration procedures. Future research should prioritize the development of international standards for instrument calibration, spectral response characterization, and data validation procedures. Ensuring cross-study comparability will also demand standardized spectral data formats, metadata conventions, and rigorous uncertainty quantification to facilitate meaningful data integration across diverse studies and sensor platforms.

Funding

This research received no external funding.

Conflicts of Interest

The authors declare no conflicts of interest.

References

  1. McCree, K.J. Test of current definitions of photosynthetically active radiation against leaf photosynthesis data. Agric. Meteorol. 1972, 10, 443–453. [Google Scholar] [CrossRef]
  2. Udo, S.; Aro, T. Global PAR related to global solar radiation for central Nigeria. Agric. For. Meteorol. 1999, 97, 21–31. [Google Scholar] [CrossRef]
  3. Wang, Q.; Sun, D.; Hao, H.; Zhao, X.; Hao, W.; Liu, Q. Photosynthetically active radiation determining yields for an intercrop of maize with cabbage. Eur. J. Agron. 2015, 69, 32–40. [Google Scholar] [CrossRef]
  4. Chen, F.; Yang, X.; Yu, Q.; Han, B. Quantifying the effects of diffuse photosynthetically active radiation on water use efficiency in different ecosystems. Agric. For. Meteorol. 2024, 356, 110191. [Google Scholar] [CrossRef]
  5. Hill, I.; Park, D.; Bridges, W.; White, D. Soil water content and photosynthetically active radiation influences soil color assessment. Geoderma Reg. 2022, 31, e00581. [Google Scholar] [CrossRef]
  6. Rogers, C.; Chen, J.M.; Croft, H.; Gonsamo, A.; Luo, X.; Bartlett, P.; Staebler, R.M. Daily leaf area index from photosynthetically active radiation for long term records of canopy structure and leaf phenology. Agric. For. Meteorol. 2021, 304, 108407. [Google Scholar] [CrossRef]
  7. Newman, S.J.; Ritz, D.; Nicol, S. Behavioural reactions of Antarctic krill (Euphausia superba Dana) to ultraviolet and photosynthetically active radiation. J. Exp. Mar. Biol. Ecol. 2003, 297, 203–217. [Google Scholar] [CrossRef]
  8. Dye, D.G. Spectral composition and quanta-to-energy ratio of diffuse photosynthetically active radiation under diverse cloud conditions. J. Geophys. Res. Atmos. 2004, 109, D10203. [Google Scholar] [CrossRef]
  9. García-Rodríguez, A.; García-Rodríguez, S.; Díez-Mediavilla, M.; Alonso-Tristán, C. Photosynthetic active radiation, solar irradiance and the CIE standard sky classification. Appl. Sci. 2020, 10, 8007. [Google Scholar] [CrossRef]
  10. Alados, I.; Foyo-Moreno, I.; Alados-Arboledas, L. Photosynthetically active radiation: Measurements and modelling. Agric. For. Meteorol. 1996, 78, 121–131. [Google Scholar] [CrossRef]
  11. Stamford, J.D.; Stevens, J.; Mullineaux, P.M.; Lawson, T. LED lighting: A grower’s guide to light spectra. HortScience 2023, 58, 180–196. [Google Scholar] [CrossRef]
  12. Kong, J.; Zhao, Y.; Fan, P.; Wang, Y.; Xu, X.; Wang, L.; Li, S.; Duan, W.; Liang, Z.; Dai, Z. Far-red light modulates grapevine growth by increasing leaf photosynthesis efficiency and triggering organ-specific transcriptome remodelling: Author. BMC Plant Biol. 2024, 24, 189. [Google Scholar] [CrossRef] [PubMed]
  13. Shomali, A.; De Diego, N.; Zhou, R.; Abdelhakim, L.; Vrobel, O.; Tarkowski, P.; Aliniaeifard, S.; Kamrani, Y.Y.; Ji, Y.; Ottosen, C.O. The crosstalk of far-red energy and signaling defines the regulation of photosynthesis, growth, and flowering in tomatoes. Plant Physiol. Biochem. 2024, 208, 108458. [Google Scholar] [CrossRef]
  14. Shomali, A.; Kamrani, Y.Y.; Zivcak, M.; Kovar, M.; Brestic, M. Beyond Photosynthetic Active Radiation: The Role of Far-Red Energy and Signalling in the Improvement of Photosynthesis. Plant Cell Environ. 2025. [Google Scholar] [CrossRef] [PubMed]
  15. Yan, Z.; Li, X.; Li, Z.; Qi, Y.; Song, J.; Cheng, F.; Dou, H.; Yang, Y. Partially Substituting Photosynthetic Photon Flux Density with Far-red Photons Differentially Alters Biomass Accumulation and Photochemical Efficiency of Greenhouse Lettuce. HortScience 2024, 59, 1691–1699. [Google Scholar] [CrossRef]
  16. Zhen, S.; van Iersel, M.W.; Bugbee, B. Photosynthesis in sun and shade: The surprising importance of far-red photons. New Phytol. 2022, 236, 538–546. [Google Scholar] [CrossRef]
  17. Yang, Z.; Albrow-Owen, T.; Cai, W.; Hasan, T. Miniaturization of optical spectrometers. Science 2021, 371, eabe0722. [Google Scholar] [CrossRef]
  18. Federer, C.; Tanner, C. Sensors for measuring light available for photosynthesis. Ecology 1966, 47, 654–657. [Google Scholar] [CrossRef]
  19. Norman, J.M.; Tanner, C.; Thurtell, G. Photosynthetic Light Sensor for Measurements in Plant Canopies 1. Agron. J. 1969, 61, 840–843. [Google Scholar] [CrossRef]
  20. Blonquist, M.; Johns, J. Accurate PAR measurement: Comparison of eight quantum sensor models. Proquest 2018, 28154655. [Google Scholar]
  21. Akitsu, T.; Nasahara, K.N.; Hirose, Y.; Ijima, O.; Kume, A. Quantum sensors for accurate and stable long-term photosynthetically active radiation observations. Agric. For. Meteorol. 2017, 237, 171–183. [Google Scholar] [CrossRef]
  22. Mizoguchi, Y.; Ohtani, Y.; Aoshima, T.; Hirakata, A.; Yuta, S.; Takanashi, S.; Iwata, H.; Nakai, Y. Comparison of the Characteristics of Five Quantum Sensors; Forestry and Forest Products Research Institute, Ministry of Agriculture, Forestry and Fisheries: Tokyo, Japan, 2010. [Google Scholar]
  23. Brzychczyk, B.; Hebda, T.; Fitas, J.; Giełżecki, J. The follow-up photobioreactor illumination system for the cultivation of photosynthetic microorganisms. Energies 2020, 13, 1143. [Google Scholar] [CrossRef]
  24. Rahman, M.M.; Stanley, J.; Lamb, D.; Trotter, M. Methodology for measuring fAPAR in crops using a combination of active optical and linear irradiance sensors: A case study in Triticale (X Triticosecale Wittmack). Precis. Agric. 2014, 15, 532–542. [Google Scholar] [CrossRef]
  25. Qu, L.P.; Dong, G.; Chen, J.; Xiao, J.; De Boeck, H.J.; Chen, J.; Jiang, S.; Batkhishig, O.; Legesse, T.G.; Xin, X.; et al. Soil environmental anomalies dominate the responses of net ecosystem productivity to heatwaves in three Mongolian grasslands. Sci. Total Environ. 2024, 944, 173742. [Google Scholar] [CrossRef] [PubMed]
  26. Scordo, F.; Seitz, C.; Suenaga, E.K.; Piccolo, M.C.; Chandra, S.; Amodeo, M.; Perillo, G.M. An inexpensive method for the measurement of photosynthetically active radiation profiles in waterbodies. Aquat. Sci. 2024, 86, 68. [Google Scholar] [CrossRef]
  27. Altikat, S. Prediction of CO2 emission from greenhouse to atmosphere with artificial neural networks and deep learning neural networks. Int. J. Environ. Sci. Technol. 2021, 18, 3169–3178. [Google Scholar] [CrossRef]
  28. Rajendran, J.; Leon-Salas, W.D.; Fan, X.; Zhang, Y.; Vizcardo, M.A.; Postigo, M. On the development of a low-cost photosynthetically active radiation (par) sensor. In Proceedings of the 2020 IEEE International Symposium on Circuits and Systems (ISCAS), Seville, Spain, 12–14 October 2020; pp. 1–5. [Google Scholar]
  29. Caya, M.V.C.; Alcantara, J.T.; Carlos, J.S.; Cereno, S.S.B. Photosynthetically active radiation (PAR) sensor using an array of light sensors with the integration of data logging for agricultural application. In Proceedings of the 2018 3rd International Conference on Computer and Communication Systems (ICCCS), Nagoya, Japan, 27–30 April 2018; pp. 377–381. [Google Scholar]
  30. Dong, Y.; Hansen, H. Design of an Internet of Things (IoT)-Based Photosynthetically Active Radiation (PAR) Monitoring System. AgriEngineering 2024, 6, 773–785. [Google Scholar] [CrossRef]
  31. Coffin, A.; Bonnefoy-Claudet, C.; Chassaigne, M.; Jansen, A.; Gée, C. PARADe: A low-cost open-source device for photosynthetically active radiation (PAR) measurements. Smart Agric. Technol. 2021, 1, 100018. [Google Scholar] [CrossRef]
  32. Leon-Salas, W.D.; Rajendran, J.; Vizcardo, M.A.; Postigo-Malaga, M. Measuring photosynthetically active radiation with a multi-channel integrated spectral sensor. In Proceedings of the 2021 IEEE International Symposium on Circuits and Systems (ISCAS), Daegu, Republic of Korea, 22–28 May 2021; pp. 1–5. [Google Scholar]
  33. Stevens, J.D.; Murray, D.; Diepeveen, D.; Toohey, D. Adaptalight: An inexpensive PAR sensor system for daylight harvesting in a micro indoor smart hydroponic system. Horticulturae 2022, 8, 105. [Google Scholar] [CrossRef]
  34. Bäumker, E.; Zimmermann, D.; Schierle, S.; Woias, P. A novel approach to obtain PAR with a multi-channel spectral microsensor, suitable for sensor node integration. Sensors 2021, 21, 3390. [Google Scholar] [CrossRef]
  35. Comella, L.M.; Goldschmidtboeing, F.; Kluppel, J.; Hager, E.; Woias, P. An innovative sensor for the simultaneous measurement of Photosynthetic Active Radiation (PAR) and Leaf Area Index (LAI). In Proceedings of the 2022 IEEE Sensors, Dallas, TX, USA, 30 October 2022–2 November 2022; pp. 1–4. [Google Scholar]
  36. Larochelle, J.; Klueppel, J.; McCormick, R.; Biegert, K.; Comella, L.M. A Low Power Optical Sensor with Dynamically Adjustable Field of View for Photosynthetically Active Radiation (PAR) Measurement. IEEE Sensors J. 2024, 24, 7711–7728. [Google Scholar] [CrossRef]
  37. Zonzini, F.; Peppi, L.M.; De Renzis, L.; Vignati, G.; Manfrini, L.; De Marchi, L. High Precision Photosynthetically Active Radiation Estimation via a Sensor-near AI Architecture and Low-cost Sensors. In Proceedings of the 2024 IEEE Sensors Applications Symposium (SAS), Naples, Italy, 23–25 July 2024; pp. 1–6. [Google Scholar]
  38. Kutschera, A.; Lamb, J.J. Light meter for measuring photosynthetically active radiation. Am. J. Plant Sci. 2018, 9, 2420. [Google Scholar] [CrossRef]
  39. Mims, F.M., III. A 5-Year Study of a New Kind of Photosynthetically Active Radiation Sensor. Photochem. Photobiol. 2003, 77, 30–33. [Google Scholar] [CrossRef]
  40. Cruse, M.J.; Kucharik, C.J.; Norman, J.M. Using a simple apparatus to measure direct and diffuse photosynthetically active radiation at remote locations. PLoS ONE 2015, 10, e0115633. [Google Scholar] [CrossRef]
  41. Barnard, H.R.; Findley, M.C.; Csavina, J. PARduino: A simple and inexpensive device for logging photosynthetically active radiation. Tree Physiol. 2014, 34, 640–645. [Google Scholar] [CrossRef] [PubMed]
  42. Long, M.H.; Rheuban, J.E.; Berg, P.; Zieman, J.C. A comparison and correction of light intensity loggers to photosynthetically active radiation sensors. Limnol. Oceanogr. Methods 2012, 10, 416–424. [Google Scholar] [CrossRef]
  43. Sanchez-Azofeifa, A.; Sharp, I.; Green, P.D.; Nightingale, J. Calibration of co-located identical PAR sensors using wireless sensor networks and characterization of the in situ fPAR variability in a tropical dry forest. Remote Sens. 2022, 14, 2752. [Google Scholar] [CrossRef]
  44. Nedbal, J.; Gao, L.; Suhling, K. Bottom-illuminated orbital shaker for microalgae cultivation. HardwareX 2020, 8, e00143. [Google Scholar] [CrossRef]
  45. Jin, H.; Eklundh, L. In situ calibration of light sensors for long-term monitoring of vegetation. IEEE Trans. Geosci. Remote Sens. 2014, 53, 3405–3416. [Google Scholar] [CrossRef]
  46. Yang, P.; Prikaziuk, E.; Verhoef, W.; van Der Tol, C. SCOPE 2.0: A model to simulate vegetated land surface fluxes and satellite signals. Geosci. Model Dev. 2021, 14, 4697–4712. [Google Scholar] [CrossRef]
  47. Levashova, N.; Lukyanenko, D.; Mukhartova, Y.; Olchev, A. Application of a three-dimensional radiative transfer model to retrieve the species composition of a mixed forest stand from canopy reflected radiation. Remote Sens. 2018, 10, 1661. [Google Scholar] [CrossRef]
  48. Bian, Z.; Lu, Y.; Du, Y.; Zhao, W.; Cao, B.; Hu, T.; Li, R.; Li, H.; Xiao, Q.; Liu, Q. Comparison between Physical and Empirical Methods for Simulating Surface Brightness Temperature Time Series. Remote Sens. 2022, 14, 3385. [Google Scholar] [CrossRef]
  49. Zhang, H.; Dong, X.; Xi, B.; Xin, X.; Liu, Q.; He, H.; Xie, X.; Li, L.; Yu, S. Retrieving high-resolution surface photosynthetically active radiation from the MODIS and GOES-16 ABI data. Remote Sens. Environ. 2021, 260, 112436. [Google Scholar] [CrossRef]
  50. Zhang, G.; Ma, H.; Liang, S.; Jia, A.; He, T.; Wang, D. A machine learning method trained by radiative transfer model inversion for generating seven global land and atmospheric estimates from VIIRS top-of-atmosphere observations. Remote Sens. Environ. 2022, 279, 113132. [Google Scholar] [CrossRef]
  51. Jin, C.; Yuan, Q.; Li, T.; Wang, Y.; Zhang, L. An optimized semi-empirical physical approach for satellite-based PM 2.5 retrieval: Embedding machine learning to simulate complex physical parameters. Geosci. Model Dev. 2023, 16, 4137–4154. [Google Scholar] [CrossRef]
  52. Jacovides, C.; Tymvios, F.; Asimakopoulos, D.; Theofilou, K.; Pashiardes, S. Global photosynthetically active radiation and its relationship with global solar radiation in the Eastern Mediterranean basin. Theor. Appl. Climatol. 2003, 74, 227–233. [Google Scholar] [CrossRef]
  53. Aguiar, L.J.; da Costa, J.M.; Aguiar, R.G.; Fischer, G.R. Estimates and measurements of photosynthetically active radiation and global solar irradiance in Rondonia. In AIP Conference Proceedings; American Institute of Physics: College Park, MD, USA, 2009; Volume 1100, pp. 435–438. [Google Scholar]
  54. Akitsu, T.; Kume, A.; Hirose, Y.; Ijima, O.; Nasahara, K.N. On the stability of radiometric ratios of photosynthetically active radiation to global solar radiation in Tsukuba, Japan. Agric. For. Meteorol. 2015, 209, 59–68. [Google Scholar] [CrossRef]
  55. Finch, D.; Bailey, W.; McArthur, L.; Nasitwitwi, M. Photosynthetically active radiation regimes in a southern African savanna environment. Agric. For. Meteorol. 2004, 122, 229–238. [Google Scholar] [CrossRef]
  56. Tsubo, M.; Walker, S. Relationships between photosynthetically active radiation and clearness index at Bloemfontein, South Africa. Theor. Appl. Climatol. 2005, 80, 17–25. [Google Scholar] [CrossRef]
  57. Chukwujindu, N.S.; Ogbulezie Julie, C.; Kabele, T.C.; Alwell, J.J.S. Modeling the Influence of Relative Humidity on Photosynthetically Active Radiation from Global Horizontal Irradiation in Six Tropical Ecological Zones in Nigeria. N. Y. Sci. J. 2016, 9, 40–55. [Google Scholar]
  58. Majnooni-Heris, A. Estimating photosynthetically active radiation (PAR) using air temperature and sunshine durations. J. Biodivers. Environ. Sci. 2014, 5, 371–377. [Google Scholar]
  59. Szeicz, G. Solar radiation for plant growth. J. Appl. Ecol. 1974, 11, 617–636. [Google Scholar] [CrossRef]
  60. Meek, D.W.; Hatfield, J.L.; Howell, T.A.; Idso, S.B.; Reginato, R.J. A generalized relationship between photosynthetically active radiation and solar radiation 1. Agron. J. 1984, 76, 939–945. [Google Scholar] [CrossRef]
  61. Aguiar, L.J.; Fischer, G.R.; Ladle, R.J.; Malhado, A.C.; Justino, F.B.; Aguiar, R.G.; da Costa, J.M.N. Modeling the photosynthetically active radiation in South West Amazonia under all sky conditions. Theor. Appl. Climatol. 2012, 108, 631–640. [Google Scholar] [CrossRef]
  62. Nagaraja Rao, C. Photosynthetically active components of global solar radiation: Measurements and model computations. Arch. Meteorol. Geophys. Bioclimatol. Ser. A Meteorol. Atmopsheric Phys. 1984, 34, 353–364. [Google Scholar] [CrossRef]
  63. Britton, C.; Dodd, J. Relationships of photosynthetically active radiation and shortwave irradiance. Agric. Meteorol. 1976, 17, 1–7. [Google Scholar] [CrossRef]
  64. Jacovides, C.; Timvios, F.; Papaioannou, G.; Asimakopoulos, D.; Theofilou, C. Ratio of PAR to broadband solar radiation measured in Cyprus. Agric. For. Meteorol. 2004, 121, 135–140. [Google Scholar] [CrossRef]
  65. Wang, Q.; Kakubari, Y.; Kubota, M.; Tenhunen, J. Variation on PAR to global solar radiation ratio along altitude gradient in Naeba Mountain. Theor. Appl. Climatol. 2007, 87, 239–253. [Google Scholar] [CrossRef]
  66. Noriega Gardea, M.M.Á.; Corral Martínez, L.F.; Anguiano Morales, M.; Trujillo Schiaffino, G.; Salas Peimbert, D.P. Modeling photosynthetically active radiation: A review. Atmósfera 2021, 34, 357–370. [Google Scholar]
  67. Xia, X.; Li, Z.; Wang, P.; Cribb, M.; Chen, H.; Zhao, Y. Analysis of photosynthetic photon flux density and its parameterization in Northern China. Agric. For. Meteorol. 2008, 148, 1101–1108. [Google Scholar] [CrossRef]
  68. Li, R.; Zhao, L.; Ding, Y.; Wang, S.; Ji, G.; Xiao, Y.; Liu, G.; Sun, L. Monthly ratios of PAR to global solar radiation measured at northern Tibetan Plateau, China. Sol. Energy 2010, 84, 964–973. [Google Scholar] [CrossRef]
  69. Trisolino, P.; di Sarra, A.; Anello, F.; Bommarito, C.; Di Iorio, T.; Meloni, D.; Monteleone, F.; Pace, G.; Piacentino, S.; Sferlazzo, D. A long-term time series of global and diffuse photosynthetically active radiation in the Mediterranean: Interannual variability and cloud effects. Atmos. Chem. Phys. 2018, 18, 7985–8000. [Google Scholar] [CrossRef]
  70. Grant, R.H.; Slusser, J.R. Estimation of photosynthetic photon flux density from 368-nm spectral irradiance. J. Atmos. Ocean. Technol. 2004, 21, 481–487. [Google Scholar] [CrossRef]
  71. Kathilankal, J.C.; O’Halloran, T.L.; Schmidt, A.; Hanson, C.V.; Law, B.E. Development of a semi-parametric PAR (Photosynthetically Active Radiation) partitioning model for the United States, version 1.0. Geosci. Model Dev. 2014, 7, 2477–2484. [Google Scholar] [CrossRef]
  72. Hu, B.; Wang, Y. Comparison of multi-empirical estimation models of photosynthetically active radiation under all sky conditions in Northeast China. Theor. Appl. Climatol. 2014, 116, 119–129. [Google Scholar] [CrossRef]
  73. Tsubo, M.; Walker, S. Relationships between diffuse and global solar radiation in southern Africa. S. Afr. J. Sci. 2003, 99, 360–362. [Google Scholar]
  74. Jacovides, C.; Boland, J.; Asimakopoulos, D.; Kaltsounides, N. Comparing diffuse radiation models with one predictor for partitioning incident PAR radiation into its diffuse component in the eastern Mediterranean basin. Renew. Energy 2010, 35, 1820–1827. [Google Scholar] [CrossRef]
  75. Ge, S.; Smith, R.G.; Jacovides, C.P.; Kramer, M.G.; Carruthers, R.I. Dynamics of photosynthetic photon flux density (PPFD) and estimates in coastal northern California. Theor. Appl. Climatol. 2011, 105, 107–118. [Google Scholar] [CrossRef]
  76. Mizoguchi, Y.; Yasuda, Y.; Ohtani, Y.; Watanabe, T.; Kominami, Y.; Yamanoi, K. A practical model to estimate photosynthetically active radiation using general meteorological elements in a temperate humid area and comparison among models. Theor. Appl. Climatol. 2014, 115, 583–589. [Google Scholar] [CrossRef]
  77. Foyo Moreno, I.; Alados-Arboledas, I.; Alados Arboledas, L. A new conventional regression model to estimate hourly photosynthetic photon flux density under all sky conditions. Int. J. Climatol. 2017, 37, 1067–1075. [Google Scholar] [CrossRef]
  78. Foyo-Moreno, I.; Alados, I.; Alados-Arboledas, L. A new empirical model to estimate hourly diffuse photosynthetic photon flux density. Atmos. Res. 2018, 203, 189–196. [Google Scholar] [CrossRef]
  79. Perez, R.; Ineichen, P.; Seals, R.; Michalsky, J.; Stewart, R. Modeling daylight availability and irradiance components from direct and global irradiance. Sol. Energy 1990, 44, 271–289. [Google Scholar] [CrossRef]
  80. Janjai, S.; Sripradit, A.; Wattan, R.; Buntoung, S.; Pattarapanitchai, S.; Masiri, I. Research Article A Simple Semi-Empirical Model for the Estimation of Photosynthetically Active Radiation from Satellite Data in the Tropics. Int. J. Photoenergy 2013, 2013, 857072. [Google Scholar] [CrossRef]
  81. Hu, B.; Wang, Y.; Liu, G. Measurements and estimations of photosynthetically active radiation in Beijing. Atmos. Res. 2007, 85, 361–371. [Google Scholar] [CrossRef]
  82. Zhang, X.; Zhang, Y.; Zhoub, Y. Measuring and modelling photosynthetically active radiation in Tibet Plateau during April–October. Agric. For. Meteorol. 2000, 102, 207–212. [Google Scholar] [CrossRef]
  83. Tan, P.Y.; Ismail, M.R.B. Photosynthetically active radiation and comparison of methods for its estimation in equatorial Singapore. Theor. Appl. Climatol. 2016, 123, 873–883. [Google Scholar] [CrossRef]
  84. Bai, J. Observations and estimations of PAR and solar visible radiation in North China. J. Atmos. Chem. 2012, 69, 231–252. [Google Scholar] [CrossRef]
  85. Wang, L.; Gong, W.; Ma, Y.; Hu, B.; Zhang, M. Photosynthetically active radiation and its relationship with global solar radiation in Central China. Int. J. Biometeorol. 2014, 58, 1265–1277. [Google Scholar] [CrossRef]
  86. Hu, B.; Liu, H.; Wang, Y. Investigation of the variability of photosynthetically active radiation in the Tibetan Plateau, China. Renew. Sustain. Energy Rev. 2016, 55, 240–248. [Google Scholar] [CrossRef]
  87. Janjai, S.; Wattan, R.; Sripradit, A. Modeling the ratio of photosynthetically active radiation to broadband global solar radiation using ground and satellite-based data in the tropics. Adv. Space Res. 2015, 56, 2356–2364. [Google Scholar] [CrossRef]
  88. Niu, Z.; Wang, L.; Niu, Y.; Hu, B.; Zhang, M.; Qin, W. Spatiotemporal variations of photosynthetically active radiation and the influencing factors in China from 1961 to 2016. Theor. Appl. Climatol. 2019, 137, 2049–2067. [Google Scholar] [CrossRef]
  89. Stanhill, G.; Fuchs, M. The relative flux density of photosynthetically active radiation. J. Appl. Ecol. 1977, 14, 317–322. [Google Scholar] [CrossRef]
  90. Howell, T.; Meek, D.; Hatfield, J. Relationship of photosynthetically active radiation to shortwave radiation in the San Joaquin Valley. Agric. Meteorol. 1983, 28, 157–175. [Google Scholar] [CrossRef]
  91. Sun, Z.; Liang, H.; Liu, J.; Shi, G. Estimation of photosynthetically active radiation using solar radiation in the UV–visible spectral band. Sol. Energy 2017, 153, 611–622. [Google Scholar] [CrossRef]
  92. García-Rodríguez, A.; Granados-López, D.; García-Rodríguez, S.; Díez-Mediavilla, M.; Alonso-Tristán, C. Modelling Photosynthetic Active Radiation (PAR) through meteorological indices under all sky conditions. Agric. For. Meteorol. 2021, 310, 108627. [Google Scholar] [CrossRef]
  93. Vindel, J.M.; Valenzuela, R.X.; Navarro, A.A.; Zarzalejo, L.F.; Paz-Gallardo, A.; Souto, J.A.; Méndez-Gómez, R.; Cartelle, D.; Casares, J.J. Modeling photosynthetically active radiation from satellite-derived estimations over mainland Spain. Remote Sens. 2018, 10, 849. [Google Scholar] [CrossRef]
  94. Trisolino, P.; di Sarra, A.; Meloni, D.; Pace, G. Determination of global and diffuse photosynthetically active radiation from a multifilter shadowband radiometer. Appl. Opt. 2016, 55, 8280–8286. [Google Scholar] [CrossRef] [PubMed]
  95. Musleh, Y.J.; Rahman, T. Predictive models for photosynthetic active radiation irradiance in temperate climates. Renew. Sustain. Energy Rev. 2024, 200, 114599. [Google Scholar] [CrossRef]
  96. Hu, B.; Yu, Y.; Liu, Z.; Wang, Y. Analysis of photosynthetically active radiation and applied parameterization model for estimating of PAR in the North China Plain. J. Atmos. Chem. 2016, 73, 345–362. [Google Scholar] [CrossRef]
  97. Peng, S.; Du, Q.; Lin, A.; Hu, B.; Xiao, K.; Xi, Y. Observation and estimation of photosynthetically active radiation in Lhasa (Tibetan Plateau). Adv. Space Res. 2015, 55, 1604–1612. [Google Scholar] [CrossRef]
  98. Nwokolo, S.C.; Proutsos, N.; Meyer, E.L.; Ahia, C.C. Machine learning and physics-based hybridization models for evaluation of the effects of climate change and urban expansion on photosynthetically active radiation. Atmosphere 2023, 14, 687. [Google Scholar] [CrossRef]
  99. Zhu, Z.; Wang, L.; Gong, W.; Xiong, Y.; Hu, B. Observation and estimation of photosynthetic photon flux density in Southern China. Theor. Appl. Climatol. 2015, 120, 701–712. [Google Scholar] [CrossRef]
  100. Wang, L.; Gong, W.; Hu, B.; Zhu, Z. Analysis of photosynthetically active radiation in Northwest China from observation and estimation. Int. J. Biometeorol. 2015, 59, 193–204. [Google Scholar] [CrossRef]
  101. Hu, B.; Wang, Y. The climatological characteristics of photosynthetically active radiation in arid and semi-arid regions of China. J. Atmos. Chem. 2012, 69, 175–186. [Google Scholar] [CrossRef]
  102. Udo, S.; Aro, T. New empirical relationships for determining global PAR from measurements of global solar radiation, infrared radiation or sunshine duration. Int. J. Climatol. A J. R. Meteorol. Soc. 2000, 20, 1265–1274. [Google Scholar] [CrossRef]
  103. Nwokolo, S.; Ogbulezie, J.; Toge, C.; John-Jaja, S. Photosynthetically active radiation estimation and modeling over different climatic zones in Nigeria. J. Agric. Ecol. Res. Int. 2016. [Google Scholar]
  104. Nwokolo, S.C.; Amadi, S.O. A global review of empirical models for estimating photosynthetically active radiation. Trends Renew. Energy 2018, 4, 236–327. [Google Scholar] [CrossRef]
  105. Noriega-Gardea, M.M.A.; Corral-Martínez, L.F.; Anguiano-Morales, M.; Trujillo-Schiaffino, G.; Salas-Peimbert, D.P. Empirical model for the estimation of photosynthetically active radiation in the city of Chihuahua and its zone of influence. Theor. Appl. Climatol. 2023, 152, 1221–1229. [Google Scholar] [CrossRef]
  106. Proutsos, N.; Liakatas, A.; Alexandris, S. Ratio of photosynthetically active to total incoming radiation above a Mediterranean deciduous oak forest. Theor. Appl. Climatol. 2019, 137, 2927–2939. [Google Scholar] [CrossRef]
  107. Wang, L.; Kisi, O.; Zounemat-Kermani, M.; Hu, B.; Gong, W. Modeling and comparison of hourly photosynthetically active radiation in different ecosystems. Renew. Sustain. Energy Rev. 2016, 56, 436–453. [Google Scholar] [CrossRef]
  108. Ehteram, M.; Seifi, A.; Banadkooki, F.B. Application of Machine Learning Models in Agricultural and Meteorological Sciences; Springer Nature: London, UK, 2023. [Google Scholar]
  109. Lopez, G.; Rubio, M.; Martınez, M.; Batlles, F. Estimation of hourly global photosynthetically active radiation using artificial neural network models. Agric. For. Meteorol. 2001, 107, 279–291. [Google Scholar] [CrossRef]
  110. Jacovides, C.; Tymvios, F.; Boland, J.; Tsitouri, M. Artificial Neural Network models for estimating daily solar global UV, PAR and broadband radiant fluxes in an eastern Mediterranean site. Atmos. Res. 2015, 152, 138–145. [Google Scholar] [CrossRef]
  111. Yu, X.; Guo, X. Hourly photosynthetically active radiation estimation in Midwestern United States from artificial neural networks and conventional regressions models. Int. J. Biometeorol. 2016, 60, 1247–1259. [Google Scholar] [CrossRef] [PubMed]
  112. Ferrera-Cobos, F.; Vindel, J.; Valenzuela, R.; González, J. Models for estimating daily photosynthetically active radiation in oceanic and mediterranean climates and their improvement by site adaptation techniques. Adv. Space Res. 2020, 65, 1894–1909. [Google Scholar] [CrossRef]
  113. Virani, V.; Kumar, N.; Mote, B. Integration of Remote Sensing and Meteorological Data for Rapid Sugarcane Yield Estimation Using Machine Learning. J. Indian Soc. Remote. Sens. 2024, 53, 1109–1124. [Google Scholar] [CrossRef]
  114. Nwokolo, S.C.; Ogbulezie, J.C.; Obiwulu, A.U. Impacts of climate change and meteo-solar parameters on photosynthetically active radiation prediction using hybrid machine learning with Physics-based models. Adv. Space Res. 2022, 70, 3614–3637. [Google Scholar] [CrossRef]
  115. Mercier, T.M.; Sabet, A.; Rahman, T. Vision transformer models to measure solar irradiance using sky images in temperate climates. Appl. Energy 2024, 362, 122967. [Google Scholar] [CrossRef]
  116. Parida, P.K.; Eagan, S.; Ramanujam, K.; Sengodan, R.; Uthandi, S.; Ettiyagounder, P.; Rajagounder, R. Machine learning approaches for estimation of the fraction of absorbed photosynthetically active radiation and net photosynthesis rate of maize using multi-spectral sensor. Heliyon 2024, 10, e34117. [Google Scholar] [CrossRef]
  117. Brown, M.G.; Skakun, S.; He, T.; Liang, S. Intercomparison of machine-learning methods for estimating surface shortwave and photosynthetically active radiation. Remote Sens. 2020, 12, 372. [Google Scholar] [CrossRef]
  118. Liang, J.; Yu, X.; Hong, W.; Cai, Y. Information extraction of UV-NIR spectral data in waste water based on Large Language Model. Spectrochim. Acta Part A Mol. Biomol. Spectrosc. 2024, 318, 124475. [Google Scholar] [CrossRef]
  119. Greener, J.G.; Kandathil, S.M.; Moffat, L.; Jones, D.T. A guide to machine learning for biologists. Nat. Rev. Mol. Cell Biol. 2022, 23, 40–55. [Google Scholar] [CrossRef] [PubMed]
  120. Zhu, J.J.; Yang, M.; Ren, Z.J. Machine learning in environmental research: Common pitfalls and best practices. Environ. Sci. Technol. 2023, 57, 17671–17689. [Google Scholar] [CrossRef] [PubMed]
  121. Foloni-Neto, H.; Ciotti, Á.M. Predicting Underwater Photosynthetically Active Radiation (PAR) Using Random Forests in the São Sebastião Channel, Brazil. Ocean Sci. J. 2024, 59, 38. [Google Scholar] [CrossRef]
  122. Tang, W.; Qin, J.; Yang, K.; Jiang, Y.; Pan, W. Mapping long-term and high-resolution global gridded photosynthetically active radiation using the ISCCP H-series cloud product and reanalysis data. Earth Syst. Sci. Data 2022, 14, 2007–2019. [Google Scholar] [CrossRef]
  123. Frouin, R.; Pinker, R.T. Estimating photosynthetically active radiation (PAR) at the earth’s surface from satellite observations. Remote Sens. Environ. 1995, 51, 98–107. [Google Scholar] [CrossRef]
  124. Frouin, R.; Murakami, H. Estimating photosynthetically available radiation at the ocean surface from ADEOS-II global imager data. J. Oceanogr. 2007, 63, 493–503. [Google Scholar] [CrossRef]
  125. Su, W.; Charlock, T.P.; Rose, F.G.; Rutan, D. Photosynthetically active radiation from Clouds and the Earth’s Radiant Energy System (CERES) products. J. Geophys. Res. Biogeosci. 2007, 112, G02022. [Google Scholar] [CrossRef]
  126. Onyekwelu, I.; Sharda, V. A Bayesian Regression Approach for Estimating Photosynthetically Active Radiation Using Satellite Data: Implications for Soybean Yield Prediction using the CROPGRO Model. Earth Syst. Environ. 2024, 8, 1059–1076. [Google Scholar] [CrossRef]
  127. Liang, S.; Zheng, T.; Liu, R.; Fang, H.; Tsay, S.C.; Running, S. Estimation of incident photosynthetically active radiation from Moderate Resolution Imaging Spectrometer data. J. Geophys. Res. Atmos. 2006, 111, D15208. [Google Scholar] [CrossRef]
  128. Zhang, X.; Liang, S.; Zhou, G.; Wu, H.; Zhao, X. Generating Global LAnd Surface Satellite incident shortwave radiation and photosynthetically active radiation products from multiple satellite data. Remote Sens. Environ. 2014, 152, 318–332. [Google Scholar] [CrossRef]
  129. Li, L.; Xin, X.; Zhang, H.; Yu, J.; Liu, Q.; Yu, S.; Wen, J. A method for estimating hourly photosynthetically active radiation (PAR) in China by combining geostationary and polar-orbiting satellite data. Remote Sens. Environ. 2015, 165, 14–26. [Google Scholar] [CrossRef]
  130. Tao, X.; Liang, S.; Wang, D. Assessment of five global satellite products of fraction of absorbed photosynthetically active radiation: Intercomparison and direct validation against ground-based data. Remote Sens. Environ. 2015, 163, 270–285. [Google Scholar] [CrossRef]
  131. Gould, R.W.; Ko, D.S.; Ladner, S.D.; Lawson, T.A.; MacDonald, C.P. Comparison of satellite, model, and in situ values of photosynthetically available radiation (PAR). J. Atmos. Ocean. Technol. 2019, 36, 535–555. [Google Scholar] [CrossRef]
  132. Zhang, Y.; Hu, Z.; Wang, J.; Gao, X.; Yang, C.; Yang, F.; Wu, G. Temporal upscaling of MODIS instantaneous FAPAR improves forest gross primary productivity (GPP) simulation. Int. J. Appl. Earth Obs. Geoinf. 2023, 121, 103360. [Google Scholar] [CrossRef]
  133. Li, R.; Wang, D.; Devadiga, S.; Sarkar, S.; Román, M.O. MCD18 V6. 2: A New Version of MODIS Downward Shortwave Radiation and Photosynthetically Active Radiation Products. IEEE Geosci. Remote Sens. Lett. 2024, 22, 1–5. [Google Scholar]
  134. Tang, W.; Qin, J.; Yang, K.; Niu, X.; Min, M.; Liang, S. An efficient algorithm for calculating photosynthetically active radiation with MODIS products. Remote Sens. Environ. 2017, 194, 146–154. [Google Scholar] [CrossRef]
  135. Donlon, C.; Berruti, B.; Buongiorno, A.; Ferreira, M.H.; Féménias, P.; Frerick, J.; Goryl, P.; Klein, U.; Laur, H.; Mavrocordatos, C.; et al. The global monitoring for environment and security (GMES) sentinel-3 mission. Remote Sens. Environ. 2012, 120, 37–57. [Google Scholar] [CrossRef]
  136. Harmel, T.; Chami, M. Estimation of daily photosynthetically active radiation (PAR) in presence of low to high aerosol loads: Application to OLCI-like satellite data. Opt. Express 2016, 24, A1390–A1407. [Google Scholar] [CrossRef]
  137. Pecci, M.; Colella, S.; Di Iorio, T.; Meloni, D.; Monteleone, F.; Pace, G.; Sferlazzo, D.M.; di Sarra, A.G. Validation of photosynthetically active radiation by OLCI on Sentinel-3 against ground-based measurements in the central Mediterranean and possible aerosol effects. Eur. J. Remote Sens. 2024, 57, 2307617. [Google Scholar] [CrossRef]
  138. Frouin, R.; Franz, B.; Wang, M. Algorithm to estimate PAR from SeaWiFS data Version 1.2-Documentation. NASA Tech Memo 2003, 206892, 46–50. [Google Scholar]
  139. Tan, J.; Frouin, R.; Jolivet, D.; Compiègne, M.; Ramon, D. Evaluation of the NASA OBPG MERIS ocean surface PAR product in clear sky conditions. Opt. Express 2020, 28, 33157–33175. [Google Scholar] [CrossRef] [PubMed]
  140. Yang, D.; Bright, J.M. Worldwide validation of 8 satellite-derived and reanalysis solar radiation products: A preliminary evaluation and overall metrics for hourly data over 27 years. Sol. Energy 2020, 210, 3–19. [Google Scholar] [CrossRef]
  141. Thomas, C.; Wandji Nyamsi, W.; Arola, A.; Pfeifroth, U.; Trentmann, J.; Dorling, S.; Laguarda, A.; Fischer, M.; Aculinin, A. Smart Approaches for Evaluating Photosynthetically Active Radiation at Various Stations Based on MSG Prime Satellite Imagery. Atmosphere 2023, 14, 1259. [Google Scholar] [CrossRef]
  142. Singh, R.K.; Vader, A.; Mundy, C.J.; Søreide, J.E.; Iken, K.; Dunton, K.H.; Castro de la Guardia, L.; Sejr, M.K.; Bélanger, S. Satellite-derived photosynthetically available radiation at the coastal Arctic seafloor. Remote Sens. 2022, 14, 5180. [Google Scholar] [CrossRef]
  143. Liu, R.; Ren, H.; Liu, S.; Liu, Q.; Yan, B.; Gan, F. Generalized FPAR estimation methods from various satellite sensors and validation. Agric. For. Meteorol. 2018, 260, 55–72. [Google Scholar] [CrossRef]
  144. Li, Z.; Tang, H.; Zhang, B.; Yang, G.; Xin, X. Evaluation and intercomparison of MODIS and GEOV1 global leaf area index products over four sites in North China. Sensors 2015, 15, 6196–6216. [Google Scholar] [CrossRef] [PubMed]
  145. Li, J.; Zhan, X.; Xiao, Z.; Shi, H.; Jiang, J. Simultaneous estimation of LAI, PAR, FAPAR, and surface albedo at multiple spatial scales from top-of-atmosphere satellite observations with different spatial resolutions. IEEE Trans. Geosci. Remote Sens. 2023, 61, 1–21. [Google Scholar] [CrossRef]
  146. Hogewoning, S.W.; Wientjes, E.; Douwstra, P.; Trouwborst, G.; Van Ieperen, W.; Croce, R.; Harbinson, J. Photosynthetic quantum yield dynamics: From photosystems to leaves. Plant Cell 2012, 24, 1921–1935. [Google Scholar] [CrossRef]
  147. Liu, J.; Van Iersel, M.W. Photosynthetic physiology of blue, green, and red light: Light intensity effects and underlying mechanisms. Front. Plant Sci. 2021, 12, 619987. [Google Scholar] [CrossRef]
  148. Zhou, W.L.; Liu, W.K.; Yang, Q. Quality changes in hydroponic lettuce grown under pre-harvest short-duration continuous light of different intensities. J. Hortic. Sci. Biotechnol. 2012, 87, 429–434. [Google Scholar] [CrossRef]
  149. Wu, B.S.; Mansoori, M.; Schwalb, M.; Islam, S.; Naznin, M.T.; Addo, P.W.; MacPherson, S.; Orsat, V.; Lefsrud, M. Light emitting diode effect of red, blue, and amber light on photosynthesis and plant growth parameters. J. Photochem. Photobiol. B Biol. 2024, 256, 112939. [Google Scholar] [CrossRef] [PubMed]
  150. Zhang, Y.T.; Zhang, Y.Q.; Yang, Q.C.; Tao, L. Overhead supplemental far-red light stimulates tomato growth under intra-canopy lighting with LEDs. J. Integr. Agric. 2019, 18, 62–69. [Google Scholar] [CrossRef]
  151. Zhen, S.; van Iersel, M.; Bugbee, B. Why far-red photons should be included in the definition of photosynthetic photons and the measurement of horticultural fixture efficacy. Front. Plant Sci. 2021, 12, 693445. [Google Scholar] [CrossRef]
  152. Wu, B.S.; Addo, P.W.; MacPherson, S.; Orsat, V.; Lefsrud, M. Updates to McCree’s photosynthetically active radiation curve—55 years later. J. Photochem. Photobiol. B Biol. 2025, 262, 113069. [Google Scholar] [CrossRef] [PubMed]
Figure 1. Comparison of the actual spectral responses (colored lines) and the ideal spectral responses (black lines) of eight commercial quantum sensors [20].
Remotesensing 17 01765 g001
Figure 2. Cosine responses of nine quantum PAR sensors. Sub-figures a−i show 9 different types of PAR sensors, and the sensor names are marked at the bottom of the picture. The ideal cosine response value is 1, independent of the zenith angle. In the figure, the solid and dashed lines represent two different products of the same sensor type [21].
Remotesensing 17 01765 g002
Figure 3. Spectral sensor AS7265x. (a) Simplified schematic of inter-chip connections and light channel distribution; (b) normalized optical filter responses [32].
Remotesensing 17 01765 g003
Figure 4. Design schematic and physical image of the PAR sensor based on the AS7341 [34].
Remotesensing 17 01765 g004
Figure 5. Spectral response curves of the AS7341 sensor [34].
Remotesensing 17 01765 g005
Figure 6. Flow chart of PAR prediction based on an ANN model.
Remotesensing 17 01765 g006
Figure 7. Schematic diagrams of three models: (a) multi-layer perceptron; (b) radial basis function; (c) generalized regression neural network architecture.
Remotesensing 17 01765 g007
Figure 8. Spatial distribution of global annual mean PAR between 2001 and 2018, in W / m 2 . (a) ISCCP−ITP PAR product estimate. (b) CERES PAR product estimate [122].
Remotesensing 17 01765 g008
Figure 9. Locations of 33 ground-based PAR monitoring sites in Europe, Africa, and South America and their climatic conditions according to the Köppen–Geiger classification [141].
Remotesensing 17 01765 g009
Table 2. Several empirical model parameters for PAR estimation.
Parameter TypeParametersParameter SignificanceReferences
Atmospheric optical parametersAerosol optical depth (AOD)Describes the ability of aerosols to absorb and scatter solar radiation[54,67,68,69]
Aerosol transmittance ( τ )The extent to which radiation passing through the atmosphere is absorbed by aerosols present in the atmosphere[70]
Albedo ( α )The portion of incident radiation that is reflected by the surface[71]
Attenuation factor under clear skies ( ρ c l e a r )The ratio of observed PAR under clear skies to extraterrestrial PAR[72]
Clearness index ( k t )The ratio of total solar radiation to extraterrestrial solar radiation[57,73,74,75,76,77,78]
Clearness of the sky ( ε ) and brightness of the skylight ( Δ )Characterization of sky conditions[10,77,78,79]
Cloud index (n)The attenuation of solar radiation by cloud cover[80]
Solar radiation correction parameterCorrection to the Sun–Earth distance ( E 0 )The ratio of the daily Earth–Sun distance to its annual mean value[80]
Extraterrestrial global solar irradiance ( R s 0 )Solar irradiance at the top of the atmosphere, also known as the “solar constant”, with a value of 1367 W / m 2 [57]
Extraterrestrial photosynthetic photon flux density ( Q P 0 )Extraterrestrial photon flux density per unit area for photosynthetically active radiation[81]
Extraterrestrial PAR constant ( Q e x t )The value of Q p at the top of the atmosphere, which is 45% of the solar irradiance at the top of the atmosphere ( 2776.412 μ mol / m 2 / s )[80]
Radiation measurement parametersDiffuse irradiance ( R d )The amount of radiation received per unit area at the surface that is scattered by molecules and particles in the atmosphere[78]
Diffuse PAR fraction ( Q d p )The ratio of diffuse PAR solar radiation to global PAR solar radiation[74]
PAR irradiance ( Q P A R )The incident energy per unit area in the 400–700 nm wavelength range per unit time[82]
Photosynthetic photon flux density ( Q p )The number of incident photons in the 400–700 nm wavelength range per unit area per unit time[82]
Photometric radiation illuminance (L)Incident luminous flux per unit area on the surface[83]
Visible irradiance ( V I S )Radiation in the 400–700 nm wavelength range[84]
Atmospheric physical parametersDewpoint temperature ( T d )The temperature at which water vapor in the air begins to condense, forming dew or fog[10,75]
Water vapor pressure (e)Related to atmospheric water vapor content[61,76]
Precipitable water (w)The total amount of water vapor contained in a unit vertical column of the atmosphere[85]
Relative humidity ( R H )The amount of water vapor present in air, expressed as a percentage of the amount needed for saturation at the same temperature[57,71]
Weather and geometric parametersSolar elevation angle ( β )The angle between the horizon and the center of the Sun’s disc[10]
Solar zenith angle ( θ )The angle between the zenith and the center of the Sun’s disc[70,80,84]
Sunshine duration ( L D )The total duration during which the direct solar irradiance exceeds ( 120 W / m 2 )[86]
Relative sunshine ( S 1 )The ratio of measured to theoretical sunshine duration[68]
Total ozone column ( O z )The total amount of ozone in the column extending vertically from the Earth’s surface to the top of the atmosphere[80,87]
Auxiliary radiation parametersOptical air mass (m)Measurement of the optical path length of light traveling from the Sun through the atmosphere to sea level relative to the optical path length of the same light source at the zenith[76,80,88]
PAR clearness index ( k t p )The ratio between incident Qp and extraterrestrial Qp[57]
Scattering factor ( H d / H )The ratio of diffuse irradiance to global irradiance, used as an indicator of the scattering effects of atmospheric components[84]
Table 3. Partially empirical models fitted at different locations.
Model FormulaLocationReferences
Q p = 2.23 H Washington, DC, USA[89]
Q p = 2.08 H University of California, USA[90]
Q p = 173 + 2105 R s 368 101 τ + 60.7 Δ 1.18 θ + 668 D 368 764 D 368 2 Nunn; West Lafayette; Starkville; Geneva; Logan (USA)[70]
P A R = 0.8644 · U V v i s i b l e USA[91]
Q p = 0.460 R s 0.129 (clear sky) Q p = 0.461 R s + 0.052 (overcast)Athalassa, Cyprus[52]
Q p = 2681 k t · c o s θ Granada, Spain[77]
P A R = 0.3806 · R a G H + 0.524 · ε + 33.247 · c o s ( Z ) 2.646 (clear sky)Burgos, Spain[92]
P A R = 0.3958 · R a G H + 18.282 · c o s ( Z ) 2.508 (Partly cloudy)Burgos, Spain[92]
P A R = 0.4335 · R a G H 7.726 · k t 9.078 · Δ + 4.065 (Overcast)Burgos, Spain[92]
Q p = 0.405 R s + 4.119 Spain[93]
Q p = 96.09 M 1 + 2.3 M 2 28.94 M 3 + 271.5 M 4 Lampedusa, Italy[94]
P A R = G H I · ( 1.386 0.059 l n k t + 1.06 × 10 3 · T d + 0.185 · c o s ( S Z A ) e ( 6.60 × 10 5 · C l e a r D N I + 2.384 · O z + 0.135 · A O D 550 ) ) Europe (Temperate Climate)[95]
Q p = ( 1.7339 + 0.842 l n e ) R s Lhasa, Tibet[82]
Q p = ( 73.5 + 2256.9 k t + 1246.7 k t 2 1182.8 k t 3 ) × u 1.09 Lhasa, Haibei, China[86]
Q p = 1886.1 ( m ) 1.1 North China Plain[96]
Q p = 73.5 + 2256.9 ( H H o ) + 1246.7 ( H H o ) 2 1182.8 ( H H o ) 3 Tibetan Plateau, China[86]
Q p = ( 88.98 + 1486.1 k t + 1094.6 k t 2 846.33 k t 3 ) × u 1.027 Lhasa, Tibetan Plateau, China[97]
Q p = ( 73.5 + 2256.9 k t + 1246.7 k t 2 1182.8 k t 3 ) × u 1.09 Lhasa, Haibei, China[86]
P A R = 4.866 + 0.480 H China; India[98]
P A R = 2.224 + 0.306 H + 0.094 H 1.1 China; India[98]
P A R = 167.365 + 3.090 R H China; India[98]
P A R = 298.135 + 878.540 · V P D + 601.510 · V P D 1.2 China; India[98]
Q p = ( 1.14 + 2279.9 k t 1006.5 k t 2 + 714.6 k t 3 ) × u 0.978 Sanya, China[99]
Q p = ( 36.48 + 2038.1 k t 276.88 k t 2 495.56 k t 3 ) × u 1.031 Fukang, China[100]
Q p = ( 8.2 + 3409.2 k t 2091.7 k t 2 + 1447.2 k t 3 ) × u 1.031 Arid and semiarid region of China[101]
Q p = ( 0.453 + 0.016 l n e 0.024 S 1 ) R s Wudaoliang, Tibetan Plateau, China[68]
Q p = 3.281 R s 57.711 k t + 3.389 National University of Singapore, Singapore[83]
Q p = 1.7972 + 0.1447 c o s θ + 0.0282 w 0.04727 A O D 0.3055 O z + 0.0630 n Four monitoring stations of Thailand[87]
Q p P A R = 0.07 + 2.76 ( S S o ) 1.85 ( S S o ) 2 Ilorin, Nigeria[102]
Q p P A R = 1.29 + 0.46 l n ( S S o ) Ilorin, Nigeria[102]
P A R H = 0.557 ( H H o ) 0.142 ( H H o ) 2 Abeokuta, Nigeria[103]
Disclaimer/Publisher’s Note: The statements, opinions and data contained in all publications are solely those of the individual author(s) and contributor(s) and not of MDPI and/or the editor(s). MDPI and/or the editor(s) disclaim responsibility for any injury to people or property resulting from any ideas, methods, instructions or products referred to in the content.

