1. Introduction
Synthetic aperture radar (SAR) has become a research hotspot in urban monitoring and analysis due to its unique all-day, all-weather, high-resolution imaging capabilities [
1]. Despite several advantages of SAR in urban monitoring, the complexity of urban environments presents major challenges for SAR image interpretation. Urban areas present three fundamental problems for SAR imaging. First, as a two-dimensional imaging technique, targets with identical range and doppler frequency but different heights appear at the same imaging position, causing layover and other geometric distortions [
2]. Therefore, it is difficult to distinguish the true three-dimensional structure of targets. Additionally, the features of objects in SAR images are highly sensitive to aspect angles [
3]. The scattering characteristics of man-made targets vary with changes in aspect angles, resulting in differences between multiple aspect angle images and limited information available in any single SAR image. Furthermore, SAR images suffer from speckle noise because of the coherent processing of radar signals. The speckle noise degrades image quality, complicates feature extraction, and hinders automatic interpretation of urban structures, making the accurate analysis of urban environments even more challenging [
4,
5].
The transition to 3D representation allows for correction of common inherent problems in 2D SAR images. Achieving precise and dense 3D reconstruction provides considerable benefits for both visualization applications and subsequent target recognition [
6,
7,
8]. To achieve this comprehensive spatial perspective, researchers have developed various three-dimensional SAR imaging methods. Two widely explored approaches are Tomographic SAR (TomoSAR) [
9] and stereo radargrammetric SAR [
10]. TomoSAR generates dense 3D point clouds through spectral estimation of coherent SAR images. However, it imposes strict requirements on temporal and spatial baselines, demanding high coherence between images [
11]. Additionally, TomoSAR struggles with angle-dependent scattering variations, limiting its ability to capture complete target features from different perspectives. In contrast, multi-aspect angle SAR radargrammetry introduces angular observation dimensions that enrich data for terrain mapping and urban modeling [
12]. As aspect angles change, the radar slant range plane shifts accordingly, helping separate previously overlapping targets [
8]. This provides essential three-dimensional structural information and more complete target profiles, which effectively reduces layover issues and angle sensitivity problems. It captures detailed features without increasing hardware complexity. Nevertheless, the core challenge in multi-aspect SAR radargrammetry remains achieving reliable dense homologous point matching, which results primarily from the variation of target scattering characteristics with an aspect angle [
13]. These angle-dependent variations substantially affect feature consistency across different aspect angles and complicate the matching process [
14].
In recent years, researchers have made progress in multi-aspect SAR image 3D reconstruction. Most current dense matching algorithms rely on intensity-based methods, such as Normalized Cross-Correlation (NCC), to balance speed and accuracy. NCC performs well in scenes with rich texture, small viewpoint changes, and linear brightness variations. Several approaches have been developed to address the challenges of multi-aspect SAR matching. Zhang et al. proposed Digital Surface Model (DSM) extraction algorithms using low-rank sparse matrix decomposition and joint correlation matching for Gotcha circular trajectory data [
15]. Li et al. developed a chain correlation method that avoids matching between large-angle stereo image pairs, instead using small-angle pairs with height map fusion to achieve better DSM reconstruction accuracy [
16]. Zhang et al. introduced a probabilistic approach for stereo 3D point cloud reconstruction from airborne multi-aspect SAR image sequences [
17]. Despite these advances, when large angular differences exist, the performance of NCC-based methods degrades rapidly, generating numerous mismatched points. In areas with repetitive textures and under non-linear illumination changes, these methods struggle to maintain accuracy. These limitations are particularly pronounced in SAR imaging systems, where the scattering characteristics of targets change with aspect angle, reducing matching effectiveness.
Voxel-based reconstruction methods recover 3D information from shadows and other features in multi-angle image domains without requiring stereo matching of images. In certain cases, these algorithms show higher robustness to geometric distortions, changes in target scattering intensity, and similar challenges in the imagery. In 2020, Zhou et al. applied space carving algorithms to SAR imagery, successfully reconstructing vehicles and bridges from multi-aspect SAR images [
18]. Feng et al. expanded this method to accurately reconstruct vehicle targets from the Gotcha dataset and tower targets from C-band circular SAR data [
19,
20]. While these methods avoid large-angle matching issues through voxel space reconstruction, they typically require high computational resources and face challenges when reconstructing complex urban structures.
For complex scenarios that require dense matching across substantial aspect angles, more advanced feature matching methods need to be considered to overcome these inherent limitations and achieve high-quality 3D reconstruction. While existing feature-based methods like SAR-SIFT effectively distinguish distinctive features for sparse 3D reconstruction [
21], they prove impractical for dense reconstruction tasks. Scale-Invariant Feature Transform (SIFT) illustrates these computational constraints [
22]. Its process of computing gradient direction histograms, assigning main orientations, and generating 128-dimensional feature descriptors creates a significant processing burden. It becomes impractical when features must be calculated for all pixels in an image.
Various feature descriptors have been developed to address these limitations. Speeded-Up Robust Features (SURFs) improve upon SIFT using integral images and box filters to approximate Gaussian derivatives, significantly reducing computation time while using lower-dimensional feature vectors [
23]. However, despite these improvements, SURF was still designed for sparse keypoint matching rather than dense applications. When computing descriptors for every pixel in an image, its feature vectors remain computationally expensive for millions of pixels, and it lacks specific optimizations for SAR image speckle noise. Other alternatives like Oriented FAST, Rotated BRIEF (ORB), and Binary Robust Independent Elementary Features (BRIEFs) employ binary descriptors that offer computational efficiency but lack the gradient orientation information crucial for SAR feature representation [
24,
25]. This makes them less effective in handling angle-dependent scattering variations. Binary Robust Invariant Scalable Keypoints (BRISKs) provide multi-scale analysis [
26], but their complex concentric circular sampling pattern requires computing Gaussian smoothing separately for each feature point. BRISKs demand additional computational resources, which is unsuitable for dense matching tasks.
In computer vision research, Tola proposed the DAISY descriptor [
27], which achieved remarkable performance in computation speed for dense stereo matching. Unlike other descriptors, DAISY utilizes convolution operations to compute directional gradient maps for the entire image simultaneously, avoiding per-pixel calculation overhead. In dense stereo matching tasks, DAISY approaches the computational efficiency of basic NCC calculations while providing superior matching accuracy compared to traditional SIFT-like descriptors [
28]. Its circular sampling pattern and histogram-based gradient representation offer an optimal balance between computational efficiency and discriminative power, making it particularly suitable for the dense matching requirements of multi-aspect SAR reconstruction.
Inspired by the efficient structure of DAISY, this study introduces the SAR-DAISY descriptor, a novel local feature descriptor specifically designed for dense matching in multi-aspect angle SAR images. The primary goal of this research is to reduce the limitations that current 3D reconstruction techniques place on radar equipment, observation geometry, and computational resources. We present three key contributions in this paper: (1) we adapt the computational efficiency of the DAISY structure for SAR image characteristics; (2) we implement the Gradient by Ratio (GR) operator to enhance gradient calculation robustness in speckle-affected SAR imagery; and (3) we enforce multi-aspect angle consistency constraints during the dense matching process. These improvements collectively enhance robustness in matching features across different aspect angles, making SAR-DAISY particularly suitable for complex environments like urban areas.
The remainder of this paper is organized as follows:
Section 2 presents end-to-end workflow of the methodology, multi-aspect angle SAR stereo height estimation, and the proposed SAR-DAISY descriptor methodology with its structured, gradient calculation using the GR operator.
Section 3 describes the experimental setup and presents comprehensive results.
Section 4 discusses the findings and limitations and also outlines future research directions.
Section 5 concludes the paper.
2. Methods
2.1. End-to-End Workflow for SAR-DAISY-Based 3D Reconstruction
The end-to-end reconstruction framework proposed in this section is based on three core principles: complementarity of multi-aspect SAR observations, consistency of feature representation, and computational efficiency. By capturing targets from different aspect angles, multi-aspect SAR imaging overcomes single-perspective limitations. The proposed feature representation maintains robustness against varying scattering characteristics while adapting to geometric distortions. Meanwhile, our approach balances computational demands with reconstruction quality.
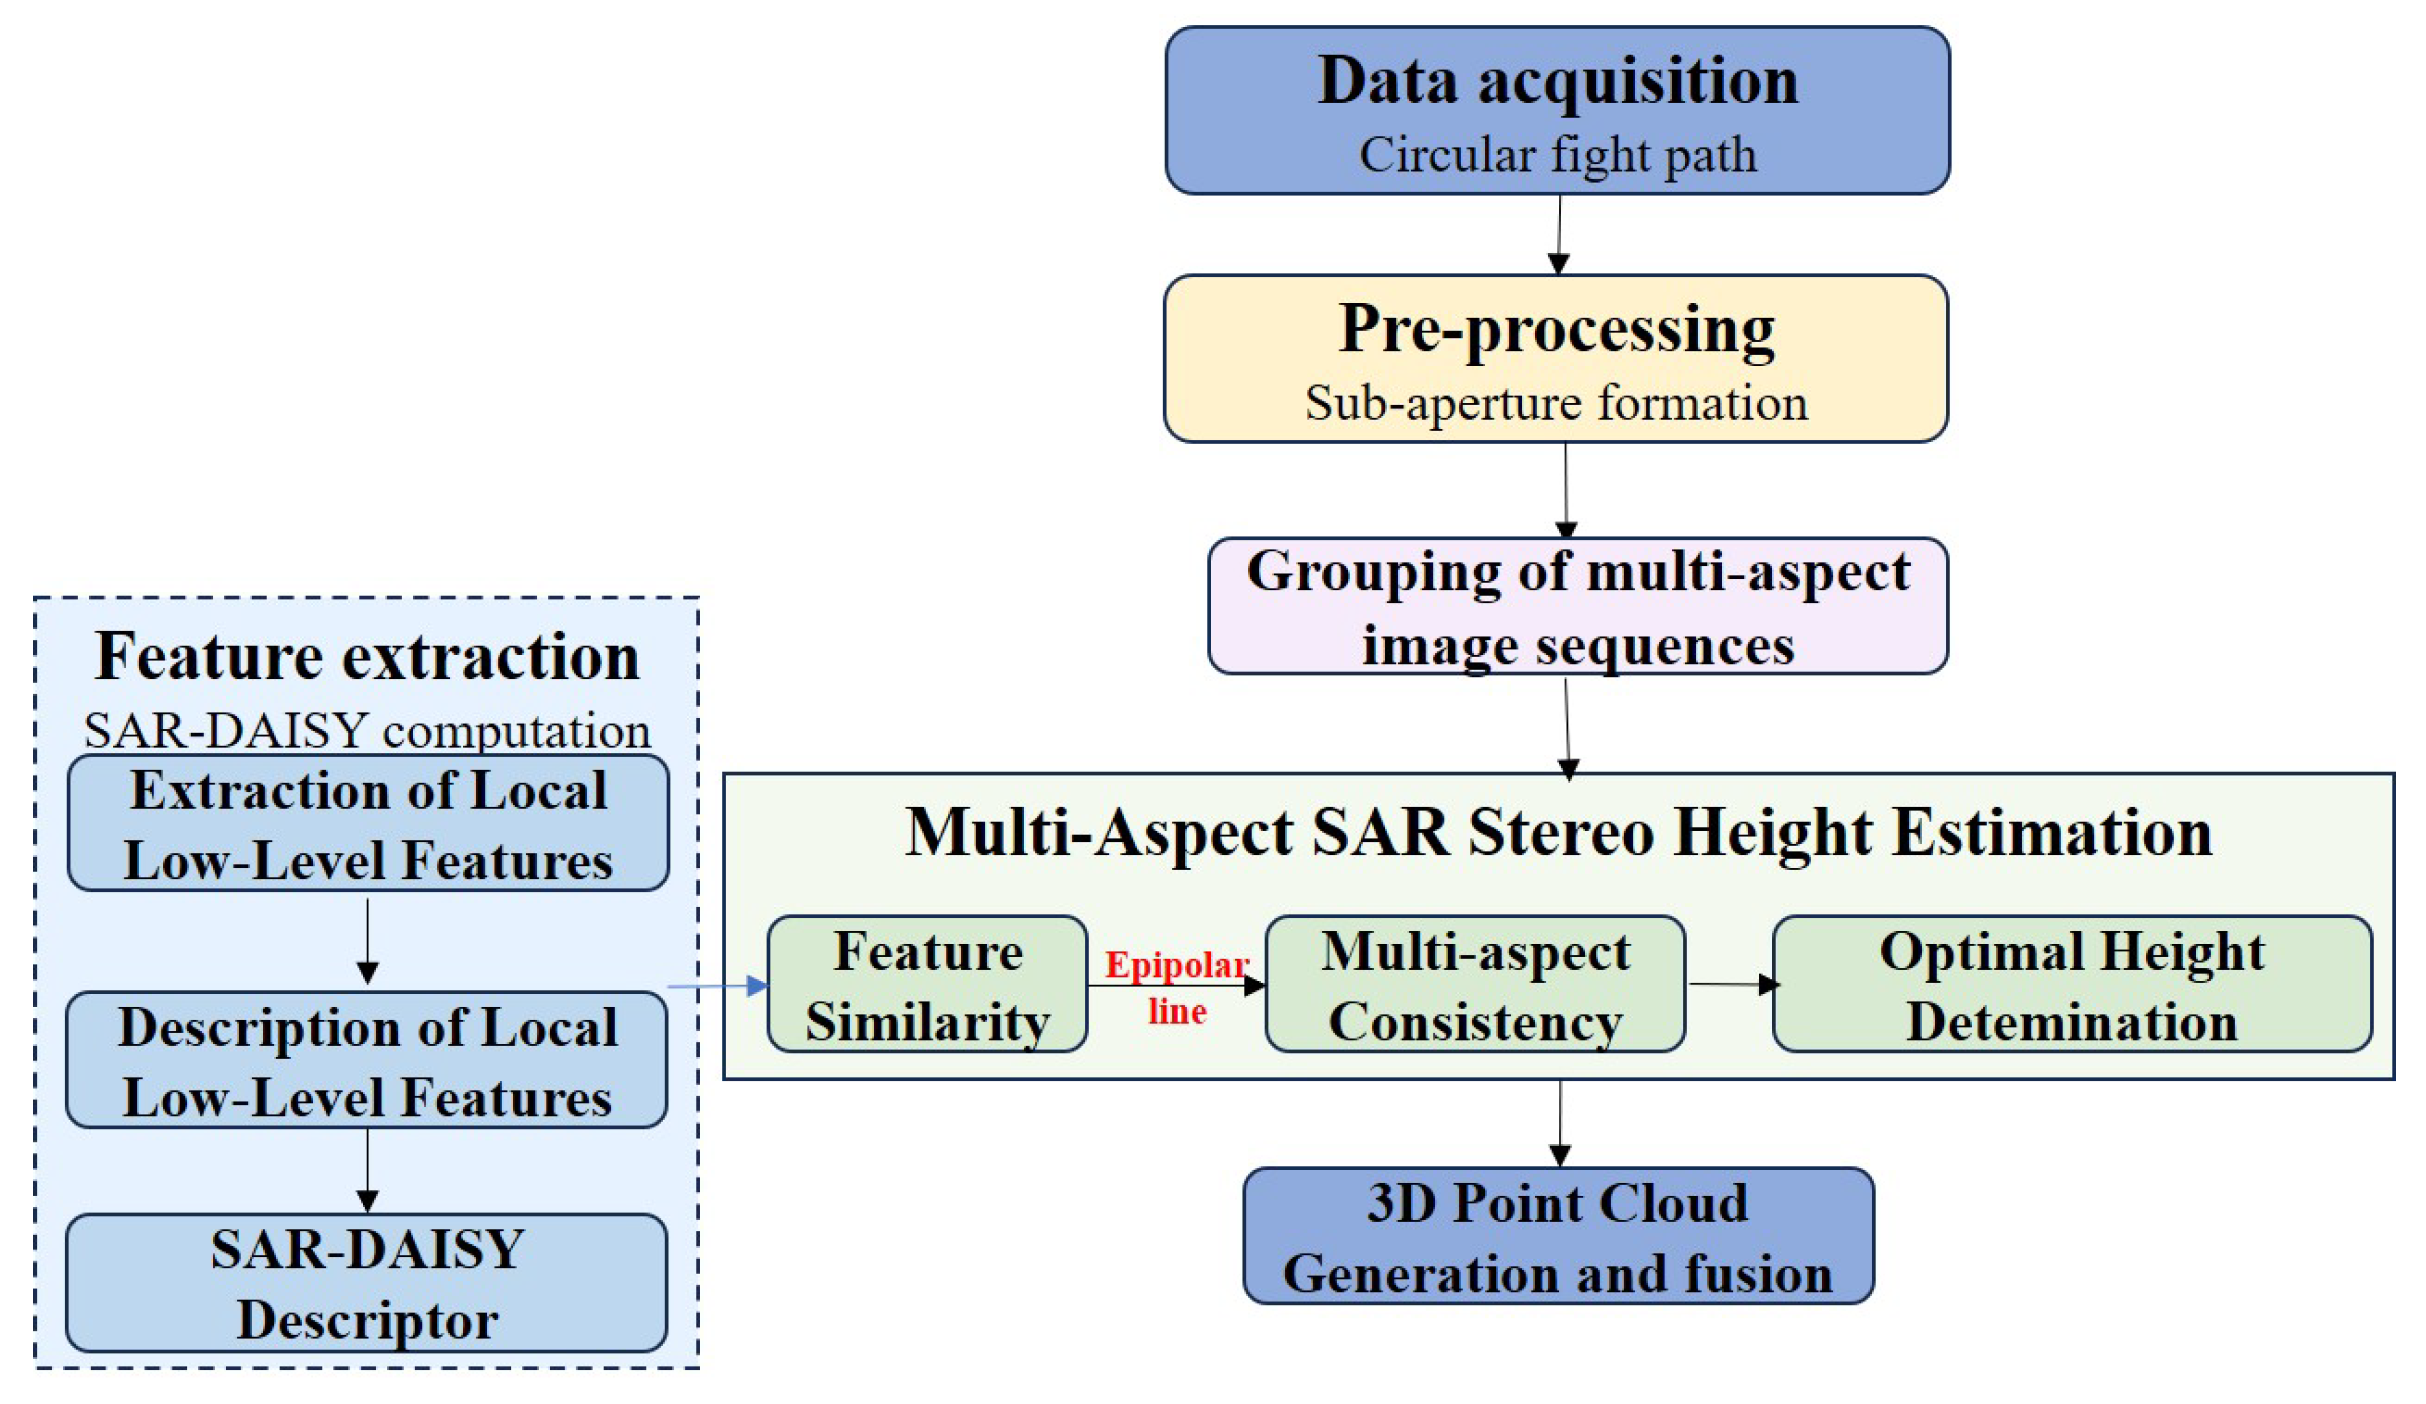
Figure 1 illustrates our comprehensive 3D reconstruction workflow, which consists of the following main stages.
Data Acquisition and Pre-processing: We acquire SAR data from multiple aspect angles using a circular flight path. The raw data are divided into non-overlapping sub-apertures and processed to form 2D SAR images. This initial stage establishes the foundation of multi-aspect observation data required for comprehensive 3D reconstruction.
Multi-Aspect SAR Stereo Height Estimation: In this stage, we determine the optimal height for each pixel through a similarity-based approach under multi-aspect epipolar constraints. To achieve reliable dense matching between images acquired from different aspect angles, we employ the SAR-DAISY descriptor. For each reference image pixel, we compute the SAR-DAISY descriptor using the GR gradient operator, which provides robust gradient calculation in speckle-affected imagery while maintaining rotation invariance. The height yielding maximum similarity across aspect angles is selected as optimal, with multi-aspect consistency constraints further enhancing estimation reliability.
Three-dimensional Point Cloud Generation and Fusion: Based on the matching results and the SAR imaging geometry, we determine the 3D coordinates of matched points by solving the Range-Doppler (RD) equations. This generates a dense 3D point cloud representing the urban scene. The fusion of point clouds from multiple reference aspect angles creates a comprehensive spatial representation of the target area.
The key contribution of our method lies in the SAR-DAISY descriptor, which achieves an effective balance between computational efficiency and matching accuracy. By adopting a more efficient polar sampling grid and robust gradient calculation method, SAR-DAISY significantly reduces the computational burden of traditional feature descriptors in dense matching while maintaining high feature discriminative power.
In the following sections, we provide detailed descriptions of the principles and methodological foundations behind each processing stage, beginning with the basic principles of multi-aspect SAR stereo height estimation, followed by the design concept and construction method of the SAR-DAISY descriptor.
2.2. Multi-Aspect SAR Stereo Height Estimation
Multi-aspect SAR stereo height estimation is based on spatial geometric consistency principles and multi-aspect consistency constraints. Its theoretical foundation lies in the fact that ground targets appear at different positions in SAR images from different aspect angles due to imaging geometry, and this displacement is directly related to the height of the target. While scattering characteristics of the same 3D point may change across different aspect angles, consistency can still be established through robust feature matching approaches. By projecting candidate heights onto multiple images and evaluating them through similarity metrics, the optimal height estimate can be determined. This multi-aspect integrated constraint mechanism effectively eliminates ambiguous matches caused by speckle noise and geometric distortion while improving the accuracy and reliability of height estimation, especially in complex urban environments.
2.2.1. Multi-Aspect SAR Observation Model
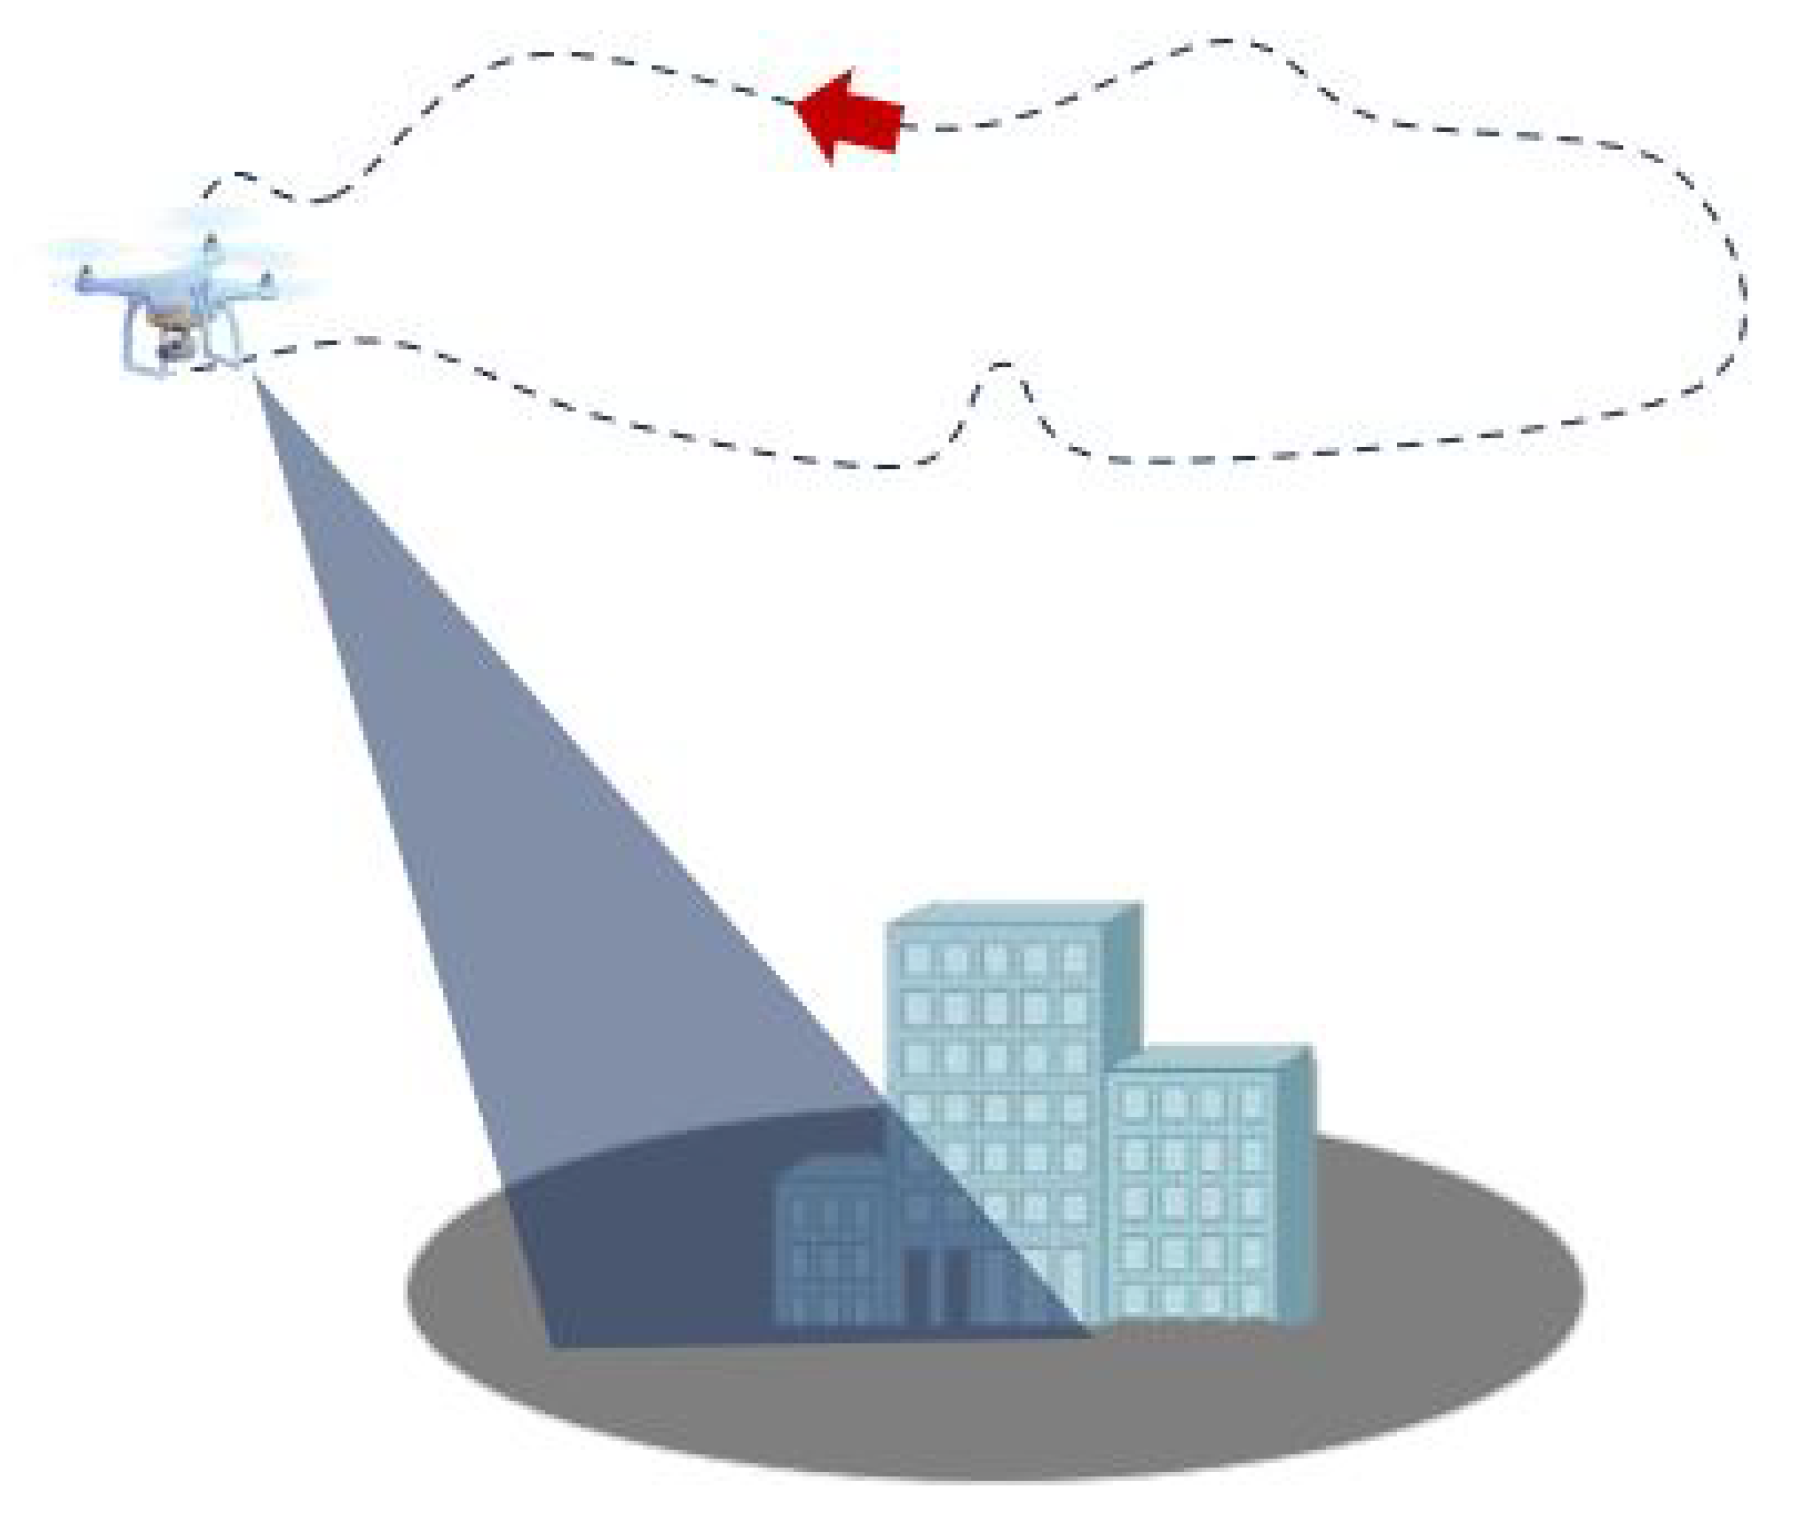
In multi-aspect SAR imaging systems, the target area is observed by radar from different aspect angles. Common data collection methods include circular flight paths, which provide multi-aspect observation capabilities, as shown in
Figure 2. These multiple-aspect angles offer rich geometric information for three-dimensional reconstruction of targets.
When the radar system does not support wide-angle coherent imaging, the complete aperture is divided into several sub-apertures, with each sub-aperture processed independently to form 2D SAR images. In this case, the traditional Range-Doppler (RD) imaging model remains applicable for stereo reconstruction [
29].
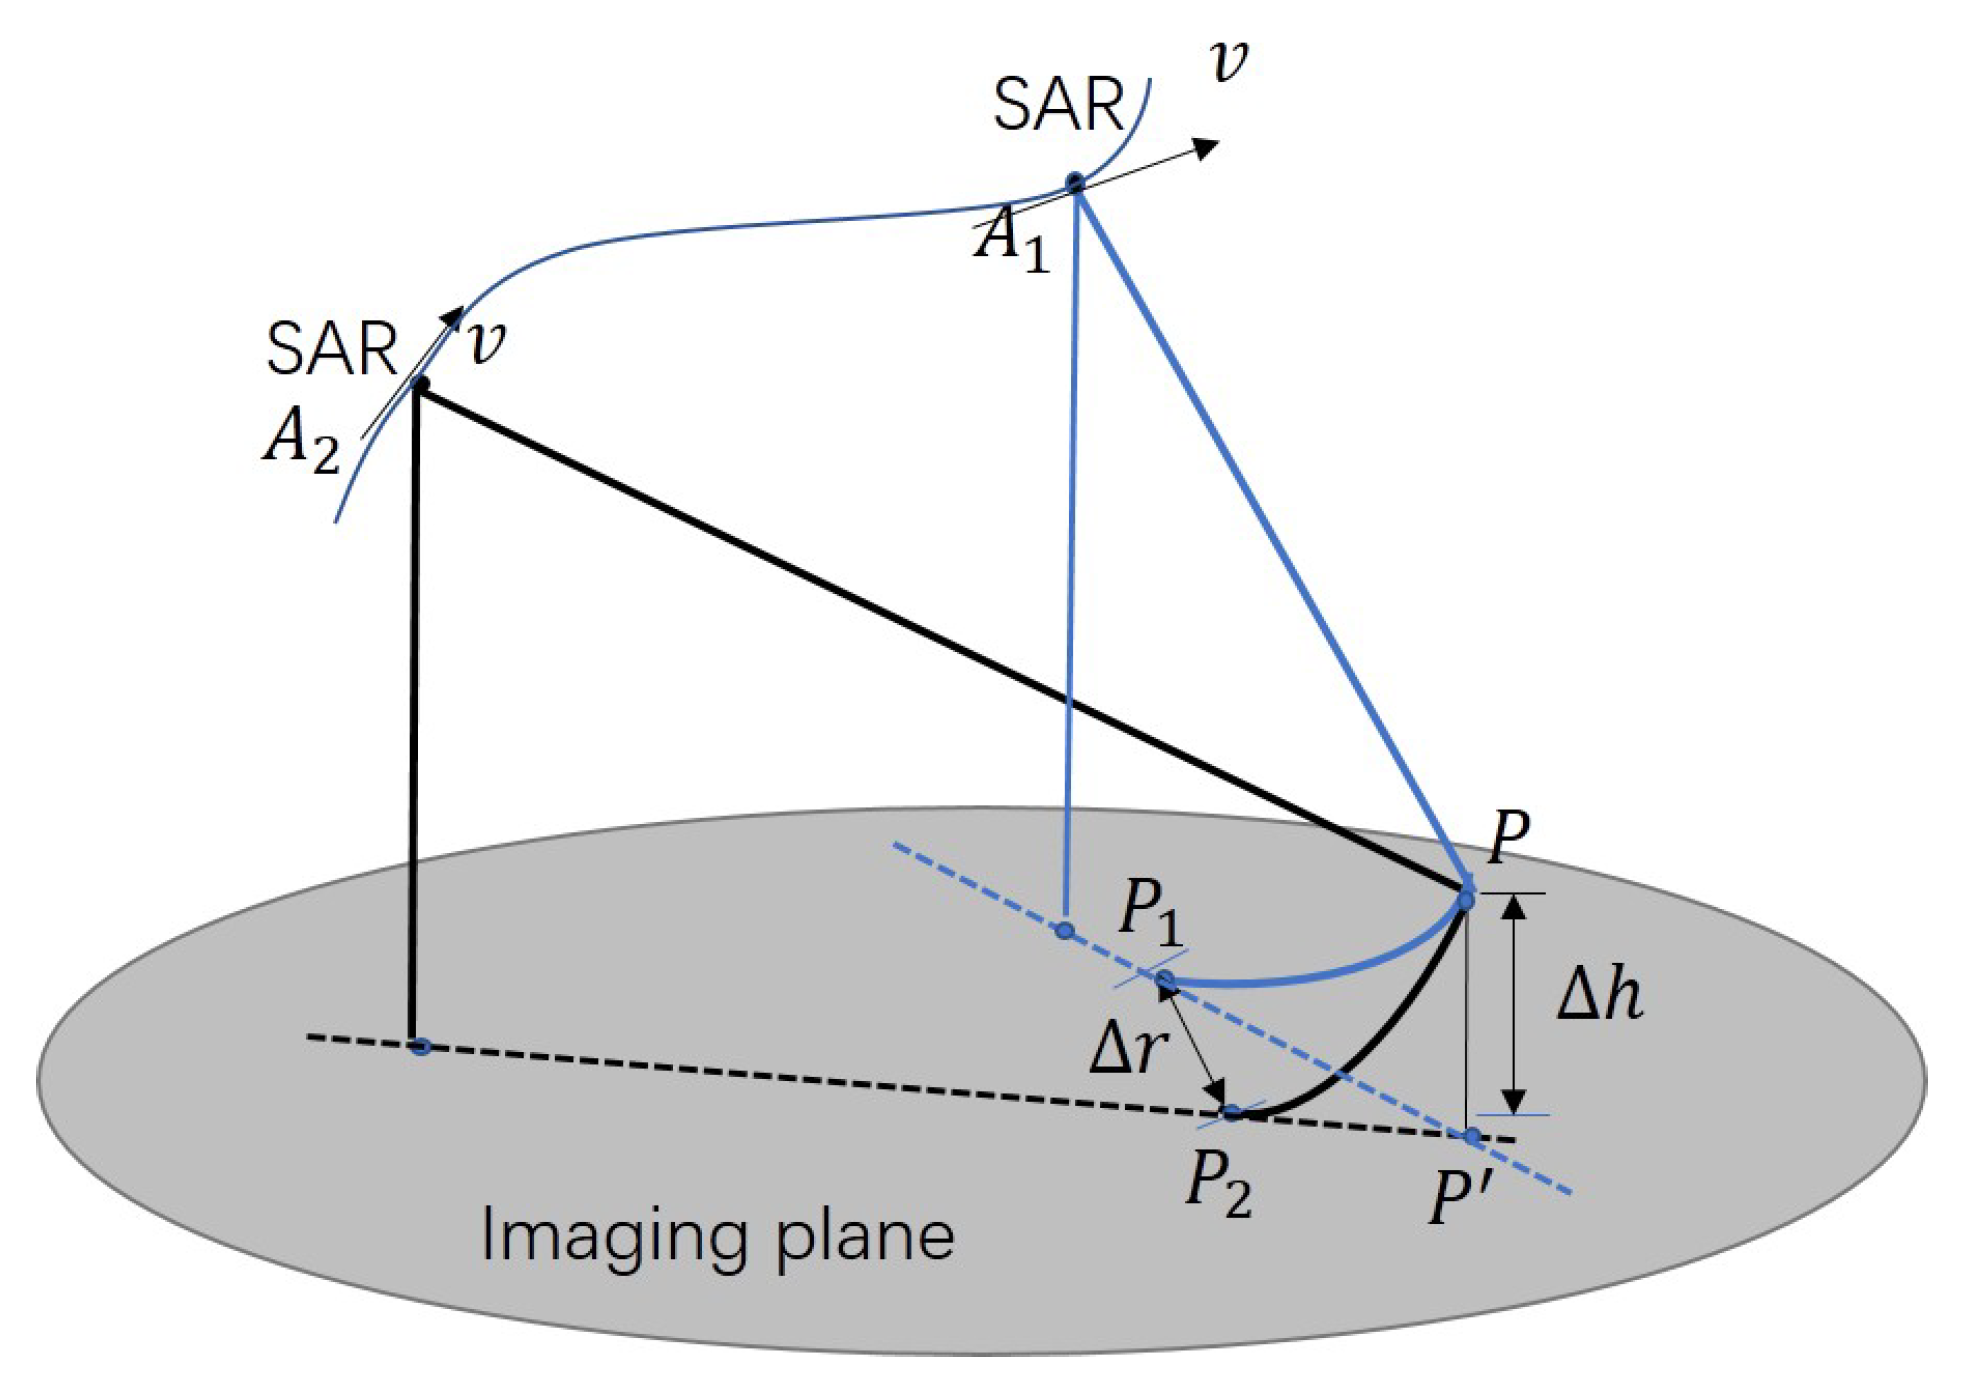
The observation model is based on the following geometric relationship: the same ground target point appears at different imaging positions in SAR images taken from different angles, as is shown in
Figure 3. The displacement contains key geometric information about the target’s three-dimensional position.
We assume a target point located at height z above the ground reference plane. This point is imaged as point in the first SAR image and as point in the nth SAR image . The corresponding radar Antenna Phase Centers (APCs) are and , with radar platform velocity vectors and .
For point
in SAR image
, its imaging position is determined by the RD model:
where
is the slant range from the radar to the target. The case is similar for the corresponding point
in SAR image
:
The set of equations forms the basic model for multi-aspect SAR observation, describing the relationship between three-dimensional position of the target and its projected positions in various SAR images.
2.2.2. Multi-Aspect Consistency Constraint
Based on the observation model above, we introduce the multi-aspect consistency constraint to achieve accurate three-dimensional reconstruction. This constraint utilizes the consistent appearance of targets across multiple SAR images, effectively improving reconstruction accuracy and robustness.
As shown in
Figure 4, for any point
p in the reference SAR image
, we first construct a series of candidate three-dimensional positions
within the height range
. According to the RD model of
, each height
h corresponds to a unique three-dimensional coordinate.
Subsequently, each candidate position
is projected onto the secondary SAR images
obtaining a series of projection points
. This projection mapping can be expressed as
where
is the projection function based on the RD model of the
nth image:
The projection establishes an epipolar constraint, narrowing the search space for cross-image matching. In multi-aspect SAR, the search trajectory formed by this constraint has nonlinear characteristics specific to SAR geometry.
To evaluate the plausibility of various candidate heights, we calculate the similarity between the reference point p and the projection points in each secondary image. A similarity measure is defined to represent the degree of matching, which can be based on image patch correlation, mutual information, or other measures suitable for SAR image characteristics.
The multi-aspect consistency constraint is achieved by aggregating the matching similarities from the involved viewpoints:
where
is the weight factor for the
nth image, which can be determined based on image quality, observation geometry, and other factors. Luo et al. demonstrated that normalizing equations and assigning weights based on statistical properties of equation residuals significantly improved positioning accuracy when using data with different levels of accuracy [
30]. This weighting mechanism can be adapted for airborne SAR systems, where flight path accuracy and platform stability often vary between acquisitions. Though our experiments use equal weights, a more sophisticated approach could incorporate flight trajectory accuracy, altitude variations, incidence angle effects, and local image quality metrics. Such a strategy could enhance reconstruction in challenging scenarios with complex terrain or varying atmospheric conditions, representing a promising direction for future work.
The optimal height estimate is obtained by maximizing the total similarity:
After determining the optimal height , the three-dimensional coordinates of the target point can be solved using the RD equations. This method, based on multi-aspect consistency, utilizes the geometric complementarity of multi-aspect SAR observations, effectively improving the accuracy and reliability of three-dimensional reconstruction, particularly suitable for fine structure reconstruction in the complex scenes.
2.3. SAR-DAISY: A Local Feature Descriptor for Dense Stereo Matching in SAR Images
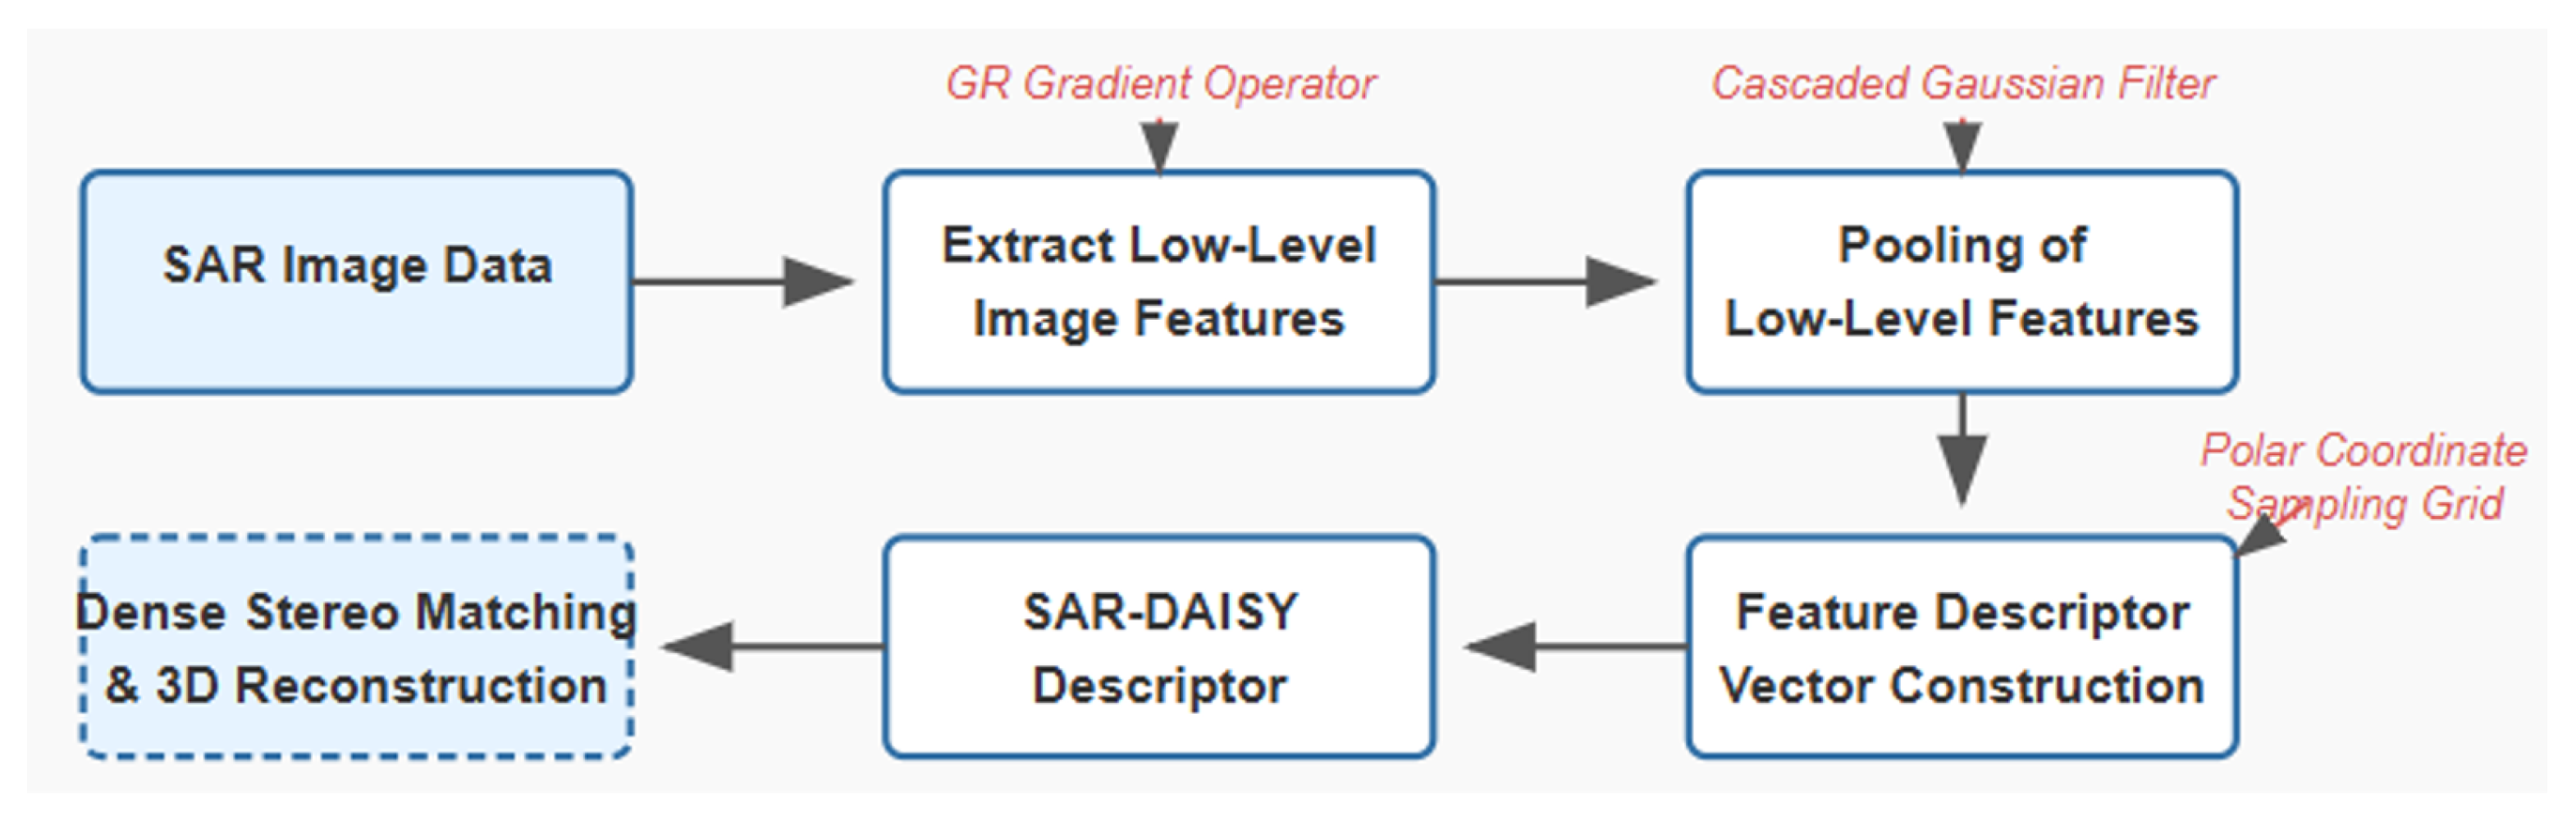
When the imaging model parameters of SAR images are known, stereo reconstruction becomes a task of matching corresponding points. The SAR-DAISY descriptor design is based on three core principles: robustness to speckle noise, adaptability to angular variations, and balance between computational efficiency and feature discriminative power. Based on existing methods, we propose a local feature descriptor, SAR-DAISY, designed for dense matching in wide-angle stereo imagery. This approach improves the computational efficiency of traditional feature descriptors while achieving rotational invariance. The computation of SAR-DAISY descriptors contains two main steps: extraction of local low-level feature and description of local low-level feature. These steps are illustrated in
Figure 5 and ensure efficient and robust feature matching for dense stereo reconstruction.
2.3.1. Extraction of Local Low-Level Features
In multi-aspect SAR images, man-made targets exhibit strong anisotropy [
3] (i.e., the variation of target backscattering power with different aspect angles). However, gradient features generally offer higher repeatability. Hence, SAR image gradients are utilized as the low-level features for constructing the SAR-DAISY descriptor.
Due to the coherent imaging mechanism, where both amplitude and phase information from radar signals are coherently processed, SAR images are primarily affected by multiplicative speckle noise [
31]. Gradient extraction algorithms based on differential methods, which are commonly used in optical images, are highly sensitive to speckle noise [
21]. This sensitivity often results in random high-frequency components and subsequently reduces the reliability and consistency of gradient calculations. In comparison, gradient extraction methods based on operators such as Ratio Of Average (ROA) and Ratio Of Exponentially Weighted Averages (ROEWA) have been proven to achieve gradient detection results with constant false alarm characteristics [
32,
33]. Therefore, they are considered to be gradient extraction algorithms that are robust in SAR images.
The ROEWA operator is a two-dimensional separable filter consisting of two orthogonal one-dimensional Infinite Symmetric Exponential Filters (ISEFs). For a SAR image
I, we let
represent the pixel value at point
. The horizontal gradient
and vertical gradient
of the image calculated by the ROEWA operator are given by
where
represents the pixel value of the SAR image at position
.
M and
N represent the size of the calculation window for the ROEWA operator, and
is the scale parameter.
Equation (
7) describes how the ROEWA operator calculates the horizontal and vertical gradients of the SAR image by employing an exponentially weighted summation over a local neighborhood.
The ROEWA operator was originally designed for edge detection tasks and performs well in such applications. However, its limitations appear when applied to other tasks. In certain cases, the ROEWA operator fails to provide consistent gradient directions for image points [
21]. In this work, the SAR-DAISY descriptor requires calculating gradient information in multiple directions for each pixel.
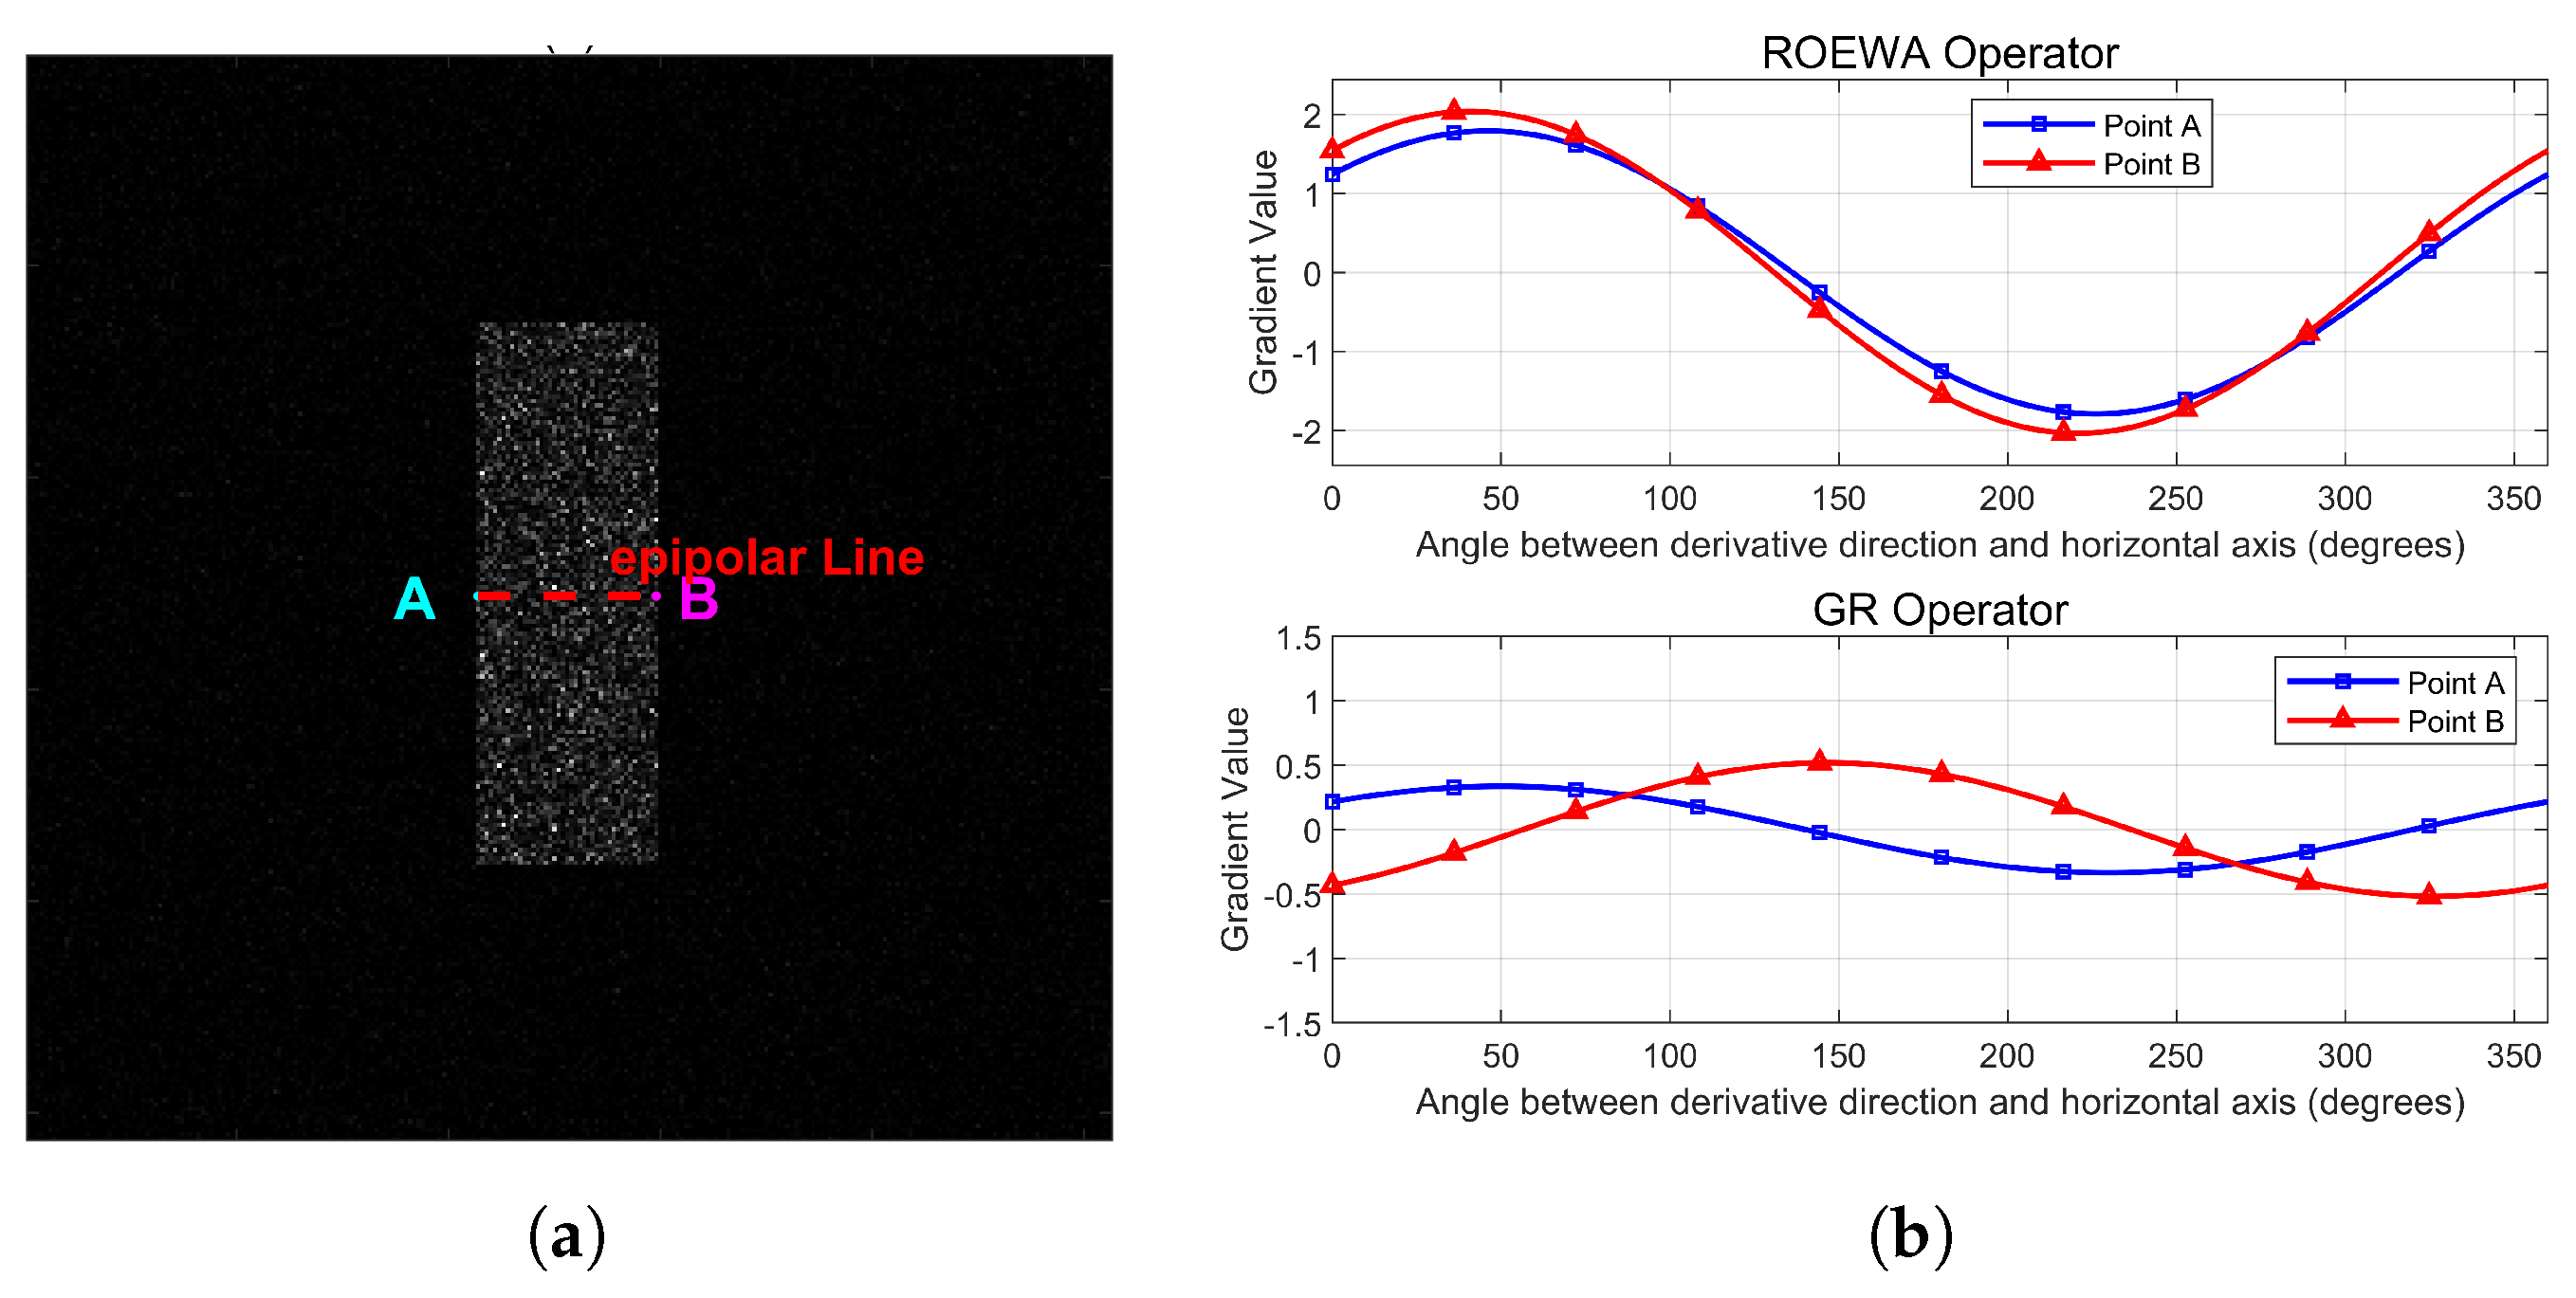
For instance, we consider points
A and
B in
Figure 6a which are pixels in a SAR image lying on the same epipolar line. Using the ROEWA operator, we calculate the directional gradients of these points over the angular range
. These points should have distinct gradient characteristics to be differentiable during matching. For points
A and
B, the directional gradients calculated using the ROEWA operator over the angular range
are shown in the upper graph of
Figure 6b. Despite being different points, their gradient curves are remarkably similar. Both curves follow nearly identical trajectories across the entire angle range, peaking and dipping at the same angles with almost identical magnitudes. This similarity is confusing because points that should be distinguishable appear nearly identical in gradient space, making reliable matching across different aspect angles extremely difficult. In dense matching scenarios, this leads to numerous mismatches that compromise reconstruction quality.
To overcome the limitations of the ROEWA operator, we adopt the GR gradient operator proposed by Fjortoft et al. [
34]. Based on Equation (
7), the horizontal gradient
and the vertical gradient
calculated using the GR gradient operator are defined as follows:
The ROEWA operator calculates the ratio of exponentially weighted averages, with results that are multiplicative in nature. For two different points A and B, although these values may be mathematical reciprocals, they often display similar curve profiles in image space because ROEWA focuses on proportional changes rather than absolute differences. When applying the GR operator, the previously similar positive and negative ratio values are separated into positive and negative sides of logarithmic space, creating distinctly opposite curve trends.
As is shown in the lower graph of
Figure 6b, the resulting directional gradients display significantly different curves. At only multiple angles, such as 75°, 175°, and 275°, one curve shows positive values while the other shows negative values throughout the angular range.
Figure 7 shows the comparative effects of the ROEWA operator and GR operator in processing simulated SAR images containing rectangular targets shown in
Figure 6a. In
Figure 7a, the gradient map calculated by the ROEWA operator fails to effectively distinguish between the two opposite edges of the rectangular target. Despite these edges being in different spatial positions, in the gradient map of the ROEWA operator, these two parallel edges exhibit similar gradient values. This leads to ambiguity in edge representation, making it difficult to differentiate between different structural features.
Figure 7b shows the gradient map processed by the GR operator, displaying significant improvement. In this representation, the opposite edges of the rectangular target are clearly distinguished, with each edge having unique gradient features that accurately reflect their different geometric properties. In the image processed by the GR operator, the gradient values of the two opposite edges of the rectangle are markedly different, thereby avoiding the confusion problem that exists in the ROEWA operator. This improved edge differentiation ability helps maintain feature consistency across different aspect angles, which is particularly important for complex urban scenes.
2.3.2. Description of Local Low-Level Features
The low-level feature extraction process generates H directional derivative maps, each corresponding to a specific direction. These maps are pooled and sampled within local image patches around each pixel, producing a feature descriptor vector for every pixel. Following the SIFT method, the local patch is divided into smaller regions, and directional derivative histograms are computed for each region. These histograms are then combined to form the final feature descriptor.
Many SAR image descriptors effectively distinguish features, while their computational cost limits their use in dense stereo matching. For example, SIFT relies on a square sampling grid. Each sampling point generates an orientation histogram, and the resulting histograms are combined into a 128-dimensional feature vector. For dense stereo matching, the above process is repeated for all pixels, resulting in great computational cost.
The DAISY method, inspired by upright-SIFT and GLOH [
35], reduces computational complexity. It uses convolutional filters to compute orientation histograms. The method is applied in our work for SAR feature extraction.
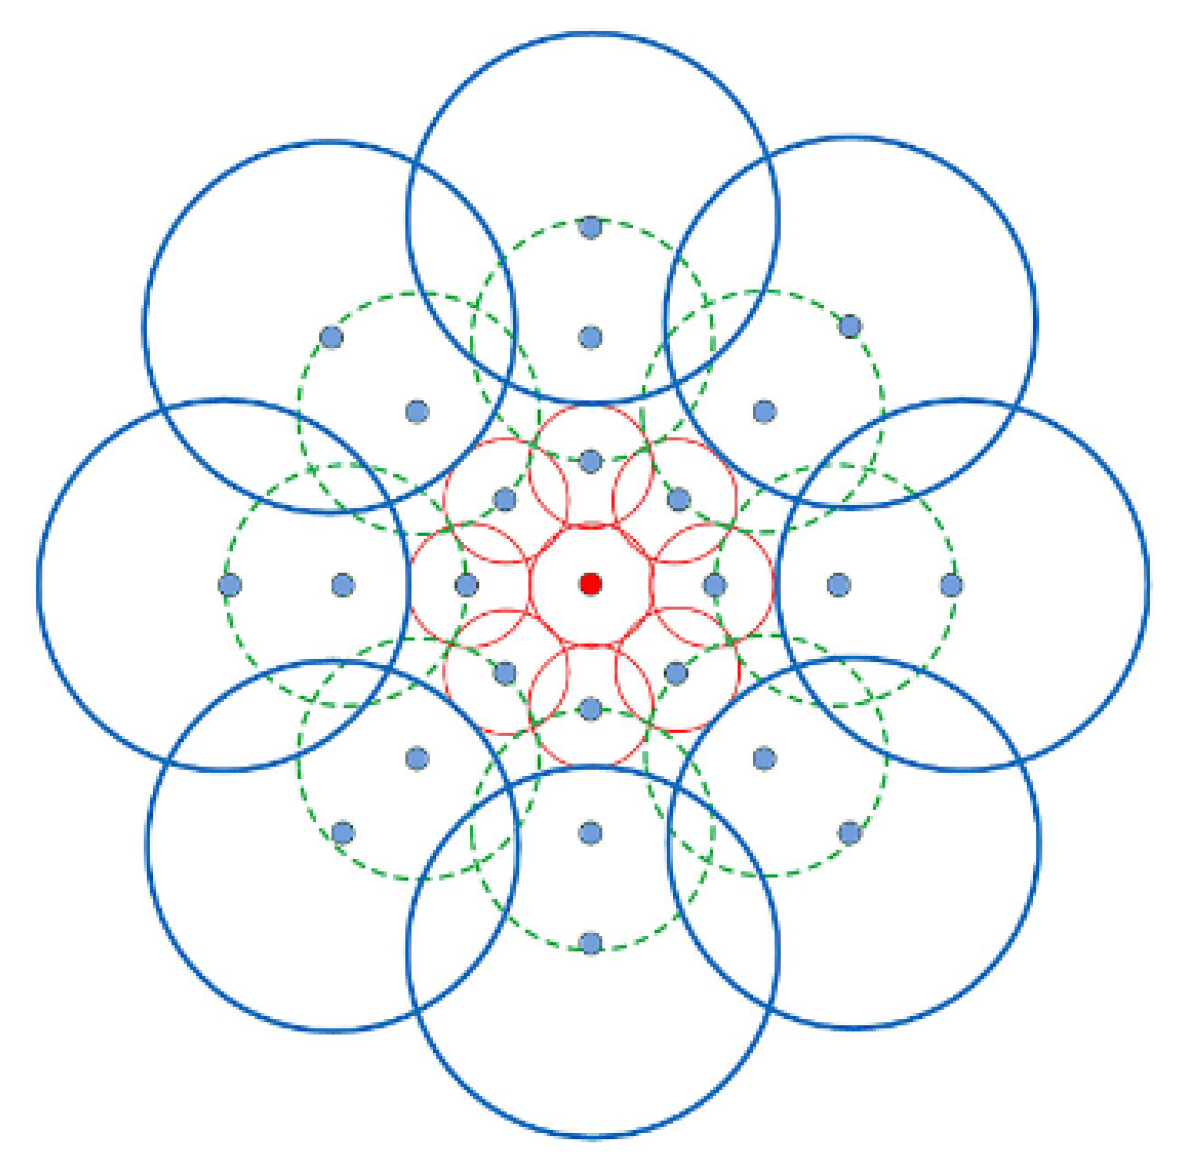
Figure 8 shows the sampling structure of the DAISY method, which uses a polar grid composed of circular regions at three scales. Unlike the square sampling grid in SIFT, the DAISY method computes weighted sums of directional histograms within these circular regions. The pooled features are combined to form the final vector. In
Figure 8, the ‘•’ markers represent the centers of circular pooling regions where gradient pooling is performed. The polar grid enables efficient rotation and interpolation, with increasing radii ensuring complete directional coverage.
Table 1 lists the parameters of the SAR-DAISY method, along with their default values.
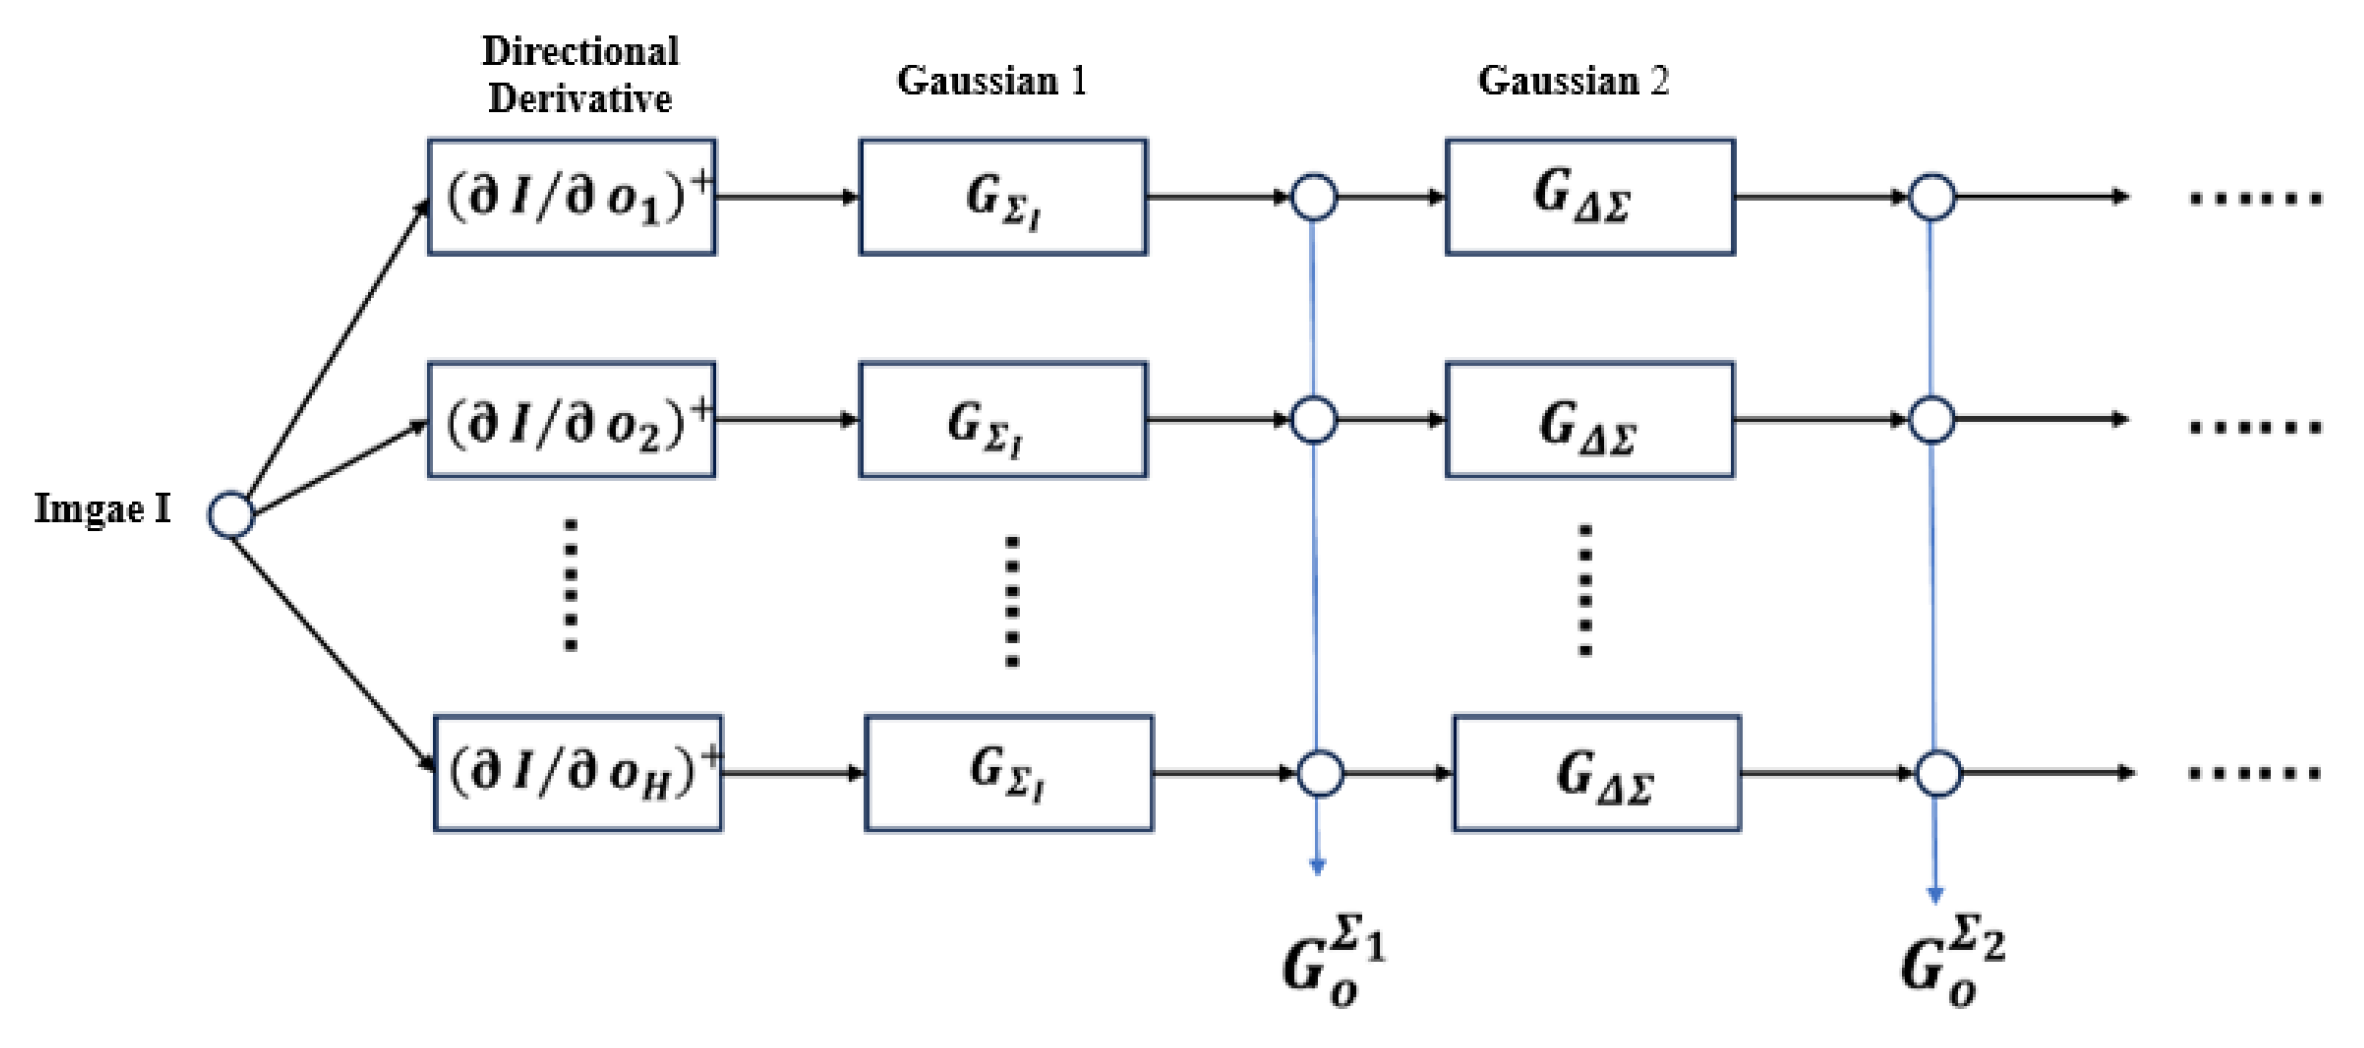
The GR gradient operator is used to compute the directional gradient
of the SAR image in
u different directions, forming directional gradient maps. For pixel
in direction
o, the directional gradient value
is defined as
Here, the directional gradient
is calculated using the GR gradient operator, as defined in Equation (
8).
The directional gradient
is convolved with Gaussian kernels
of varying scales to generate pooled directional gradient maps
:
In this expression,
represents a Gaussian kernel with standard deviation
, determined by the radii of the concentric circular regions in
Figure 9, and ∗ denotes convolution. By convolving
with Gaussian kernels of different scales, pooled feature vectors corresponding to different regions are obtained.
Pooling operations reuse Gaussian kernels for efficiency. Specifically, the difference
between radii
and
simplifies the following computation:
Here,
.
Figure 9 provides a flowchart of the SAR-DAISY computation process.
After pooling, histograms for
H directions are computed. Each direction is divided into
T bins, producing
histogram values:
The SAR-DAISY feature vector is formed by combining histograms from all directions within each sampling region:
In this equation, represents the pixel intensity at , pooled over direction j () with radius R.
The sampling points in each layer of the SAR-DAISY grid (• points in
Figure 8) are uniformly distributed along a circle. This design simplifies computations. Specifically, when the image needs to be rotated and the SAR-DAISY descriptor recalculated, it is sufficient to rotate the sampling points and gradient histograms of the grid shown in
Figure 8. The interpolation step can then be performed based on Equation (
13), avoiding the need to recalculate the gradient histograms from scratch, as required by the SIFT descriptor.
The Gaussian kernel used in the SAR-DAISY descriptor follows the approach proposed by Tola et al. [
27]. It is defined as follows:
Here, the subscript
i refers to the
ith layer of the SAR-DAISY sampling grid. In the polar coordinate system, the coordinates of the sampling points in the SAR-DAISY grid are denoted as
. Specifically, the coordinates of the
j-th sampling point in the
ith layer (
Figure 8) are expressed as
2.3.3. Computational Analysis of SAR-DAISY Descriptor
Regarding the computational complexity of the SAR-DAISY descriptor, theoretical analysis shows that if an image has a total of P pixels, calculating the SAR-DAISY descriptors for all pixels requires one-dimensional convolution operations, interpolations, multiplications, and addition operations.
We can further assume that in a single one-dimensional convolution operation, a convolution kernel of length N is used, meaning that N multiplications and additions need to be performed for each pixel in the image. Therefore, generating a SAR-DAISY descriptor for each pixel in the image requires approximately multiplication operations, addition operations, and S interpolation operations.
In comparison, for a SIFT descriptor, assuming it is calculated within an image patch of size pixels pixels, computing a SIFT descriptor for a pixel in the image requires interpolations, multiplications, and addition operations.
We can compare the computational complexity of SAR-DAISY and SIFT descriptors (
Table 2). For the SAR-DAISY descriptor, we use the default parameters in
Table 1; for the SIFT descriptor, we set
to 88 (to be equivalent to the radius value
of the SAR-DAISY descriptor). Through the above analysis, for each pixel in the image, generating a SIFT descriptor requires approximately 38,720 multiplications, 15,488 additions, and 7744 sampling (interpolation) operations, while calculating a SAR-DAISY descriptor only requires 722 multiplications, 719 additions, and 25 interpolations.
The difference in computational complexity between the two is about 2 orders of magnitude (this conclusion does not yet consider the need for descriptor rotation, otherwise the difference in computational complexity would be even greater). Regarding the actual performance of DAISY-type descriptors, Satnik provided test results based on optical MVS image datasets [
28]. In the experimental environment of that paper, the computational efficiency of the DAISY descriptor was approximately 2 orders of magnitude higher than that of the SIFT descriptor.
3. Experiments and Results
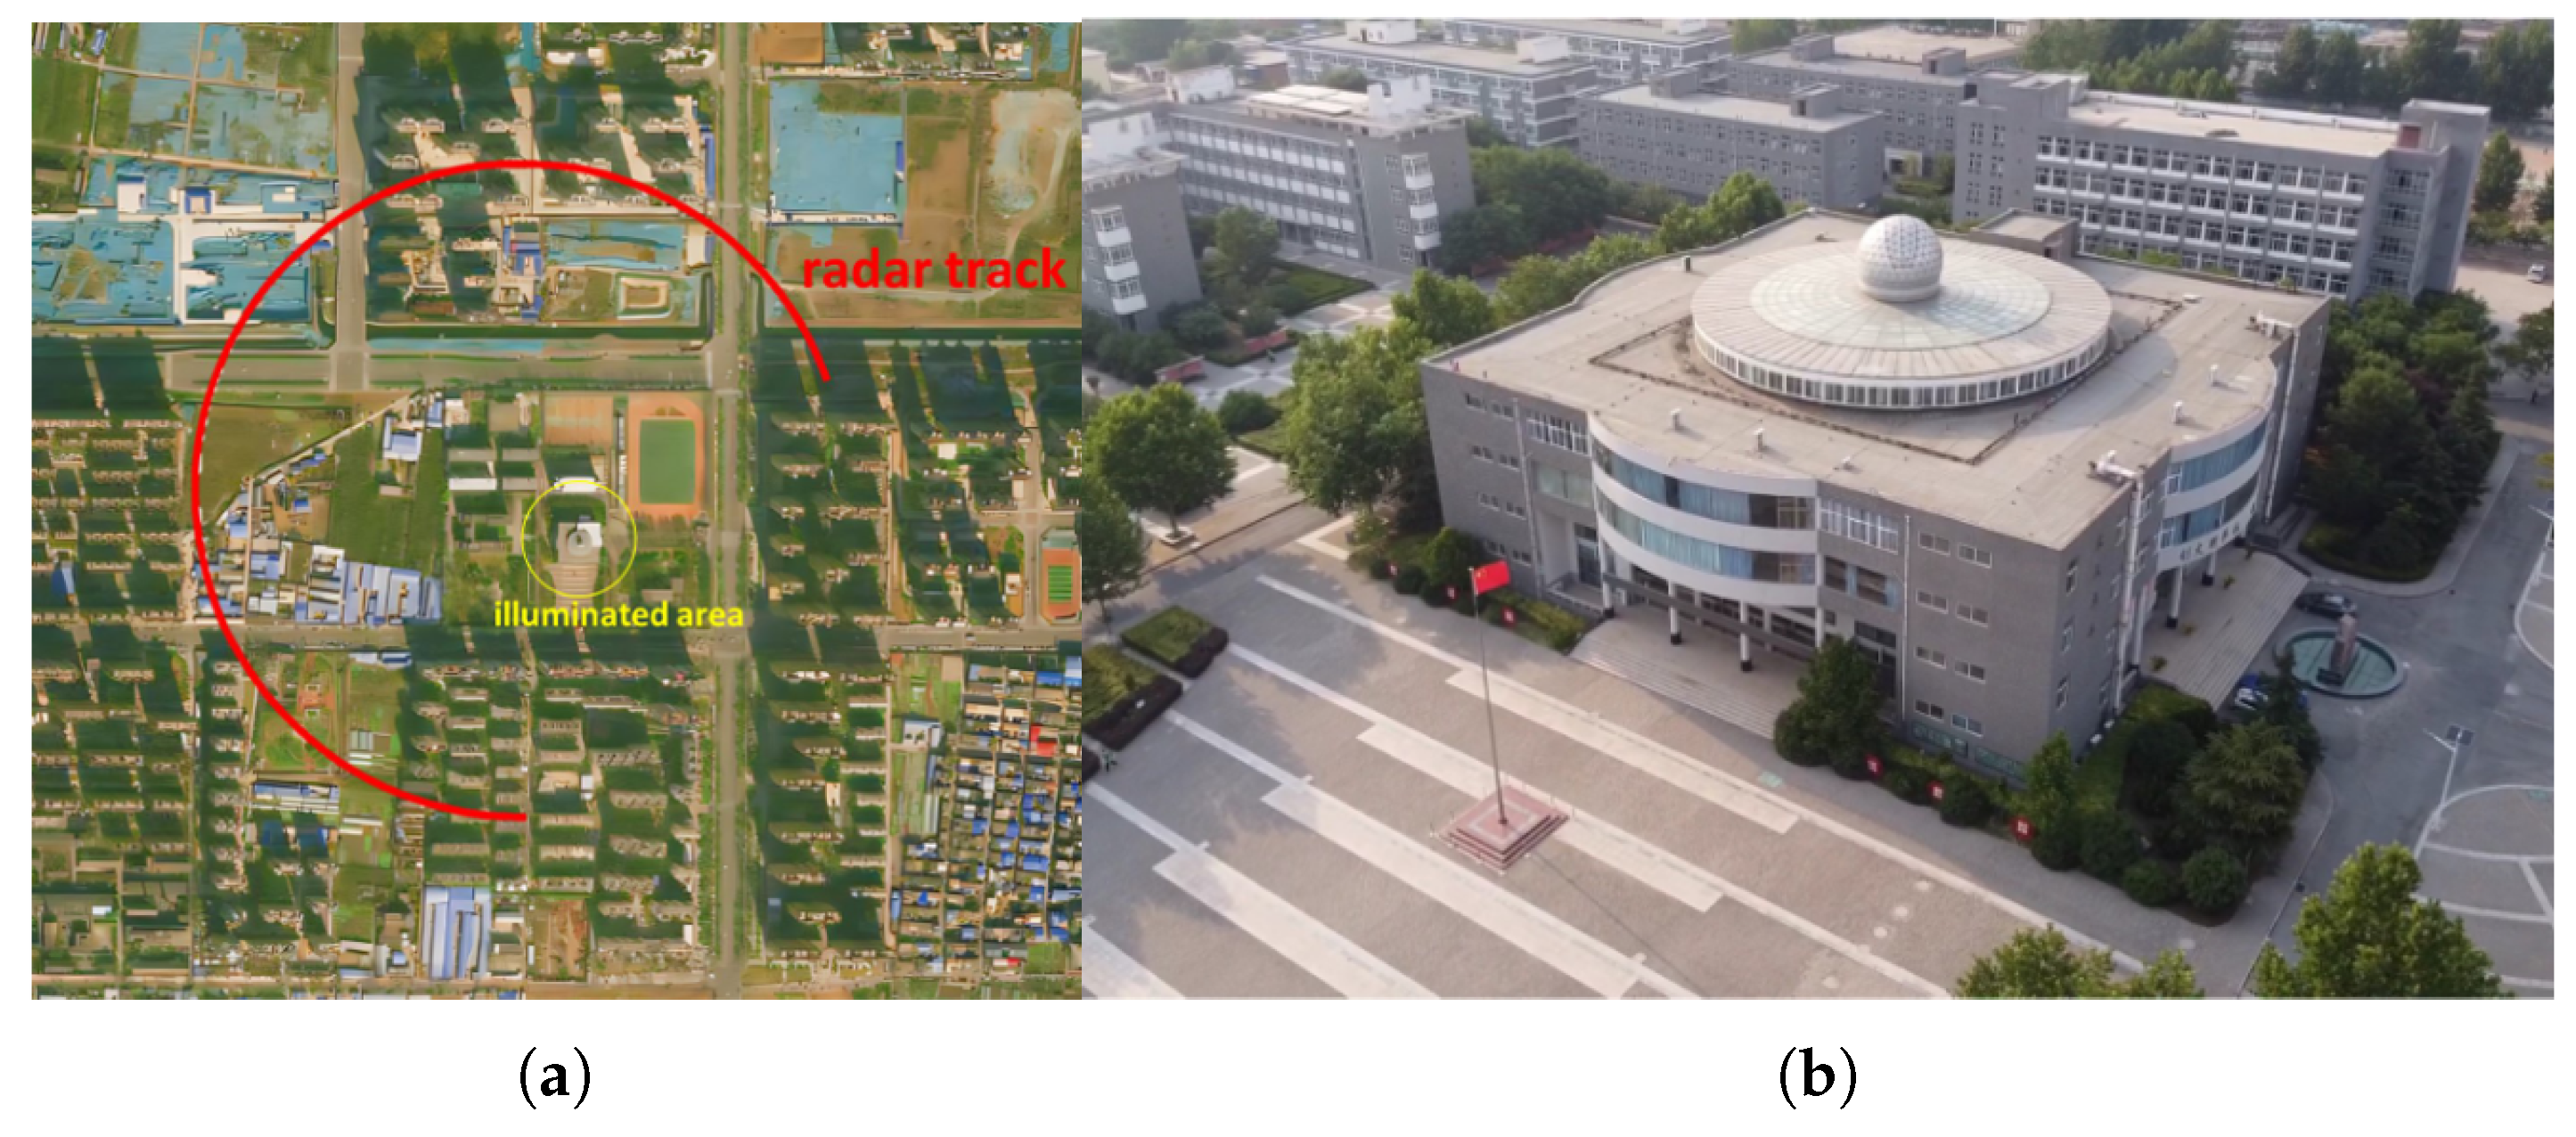
In 2020, we acquired circular SAR (CSAR) data using an experimental W-band single-channel radar system developed by the Nanjing Research Institute of Electronics Technology (NRIET). As shown in
Figure 10a, the radar was mounted on a compact fixed-wing drone with GPS technology that provides horizontal positioning accuracy of 0.5 m.
The acquisition followed a circular flight pattern at approximately 500 m altitude with a radius of around 1000 m. Due to the drone’s limited onboard storage, we collected data from only about 75% of the planned circular path. The target area was positioned about 200 m from the flight path’s center, with the radar illuminating a region approximately 100 m in diameter. Our proposed algorithm works effectively with data collected along various curved trajectories, not just perfect circles.
Figure 10b displays the target area—a school campus in Henan province, China, with the radar spot center being a four-story teaching building featuring a square base.
Table 3 contains the additional technical specifications of the radar system and the data processing parameters we used.
We processed the collected CSAR data by dividing it into several non-overlapping sub-apertures, each achieving a spatial resolution of 0.25 m × 0.25 m.
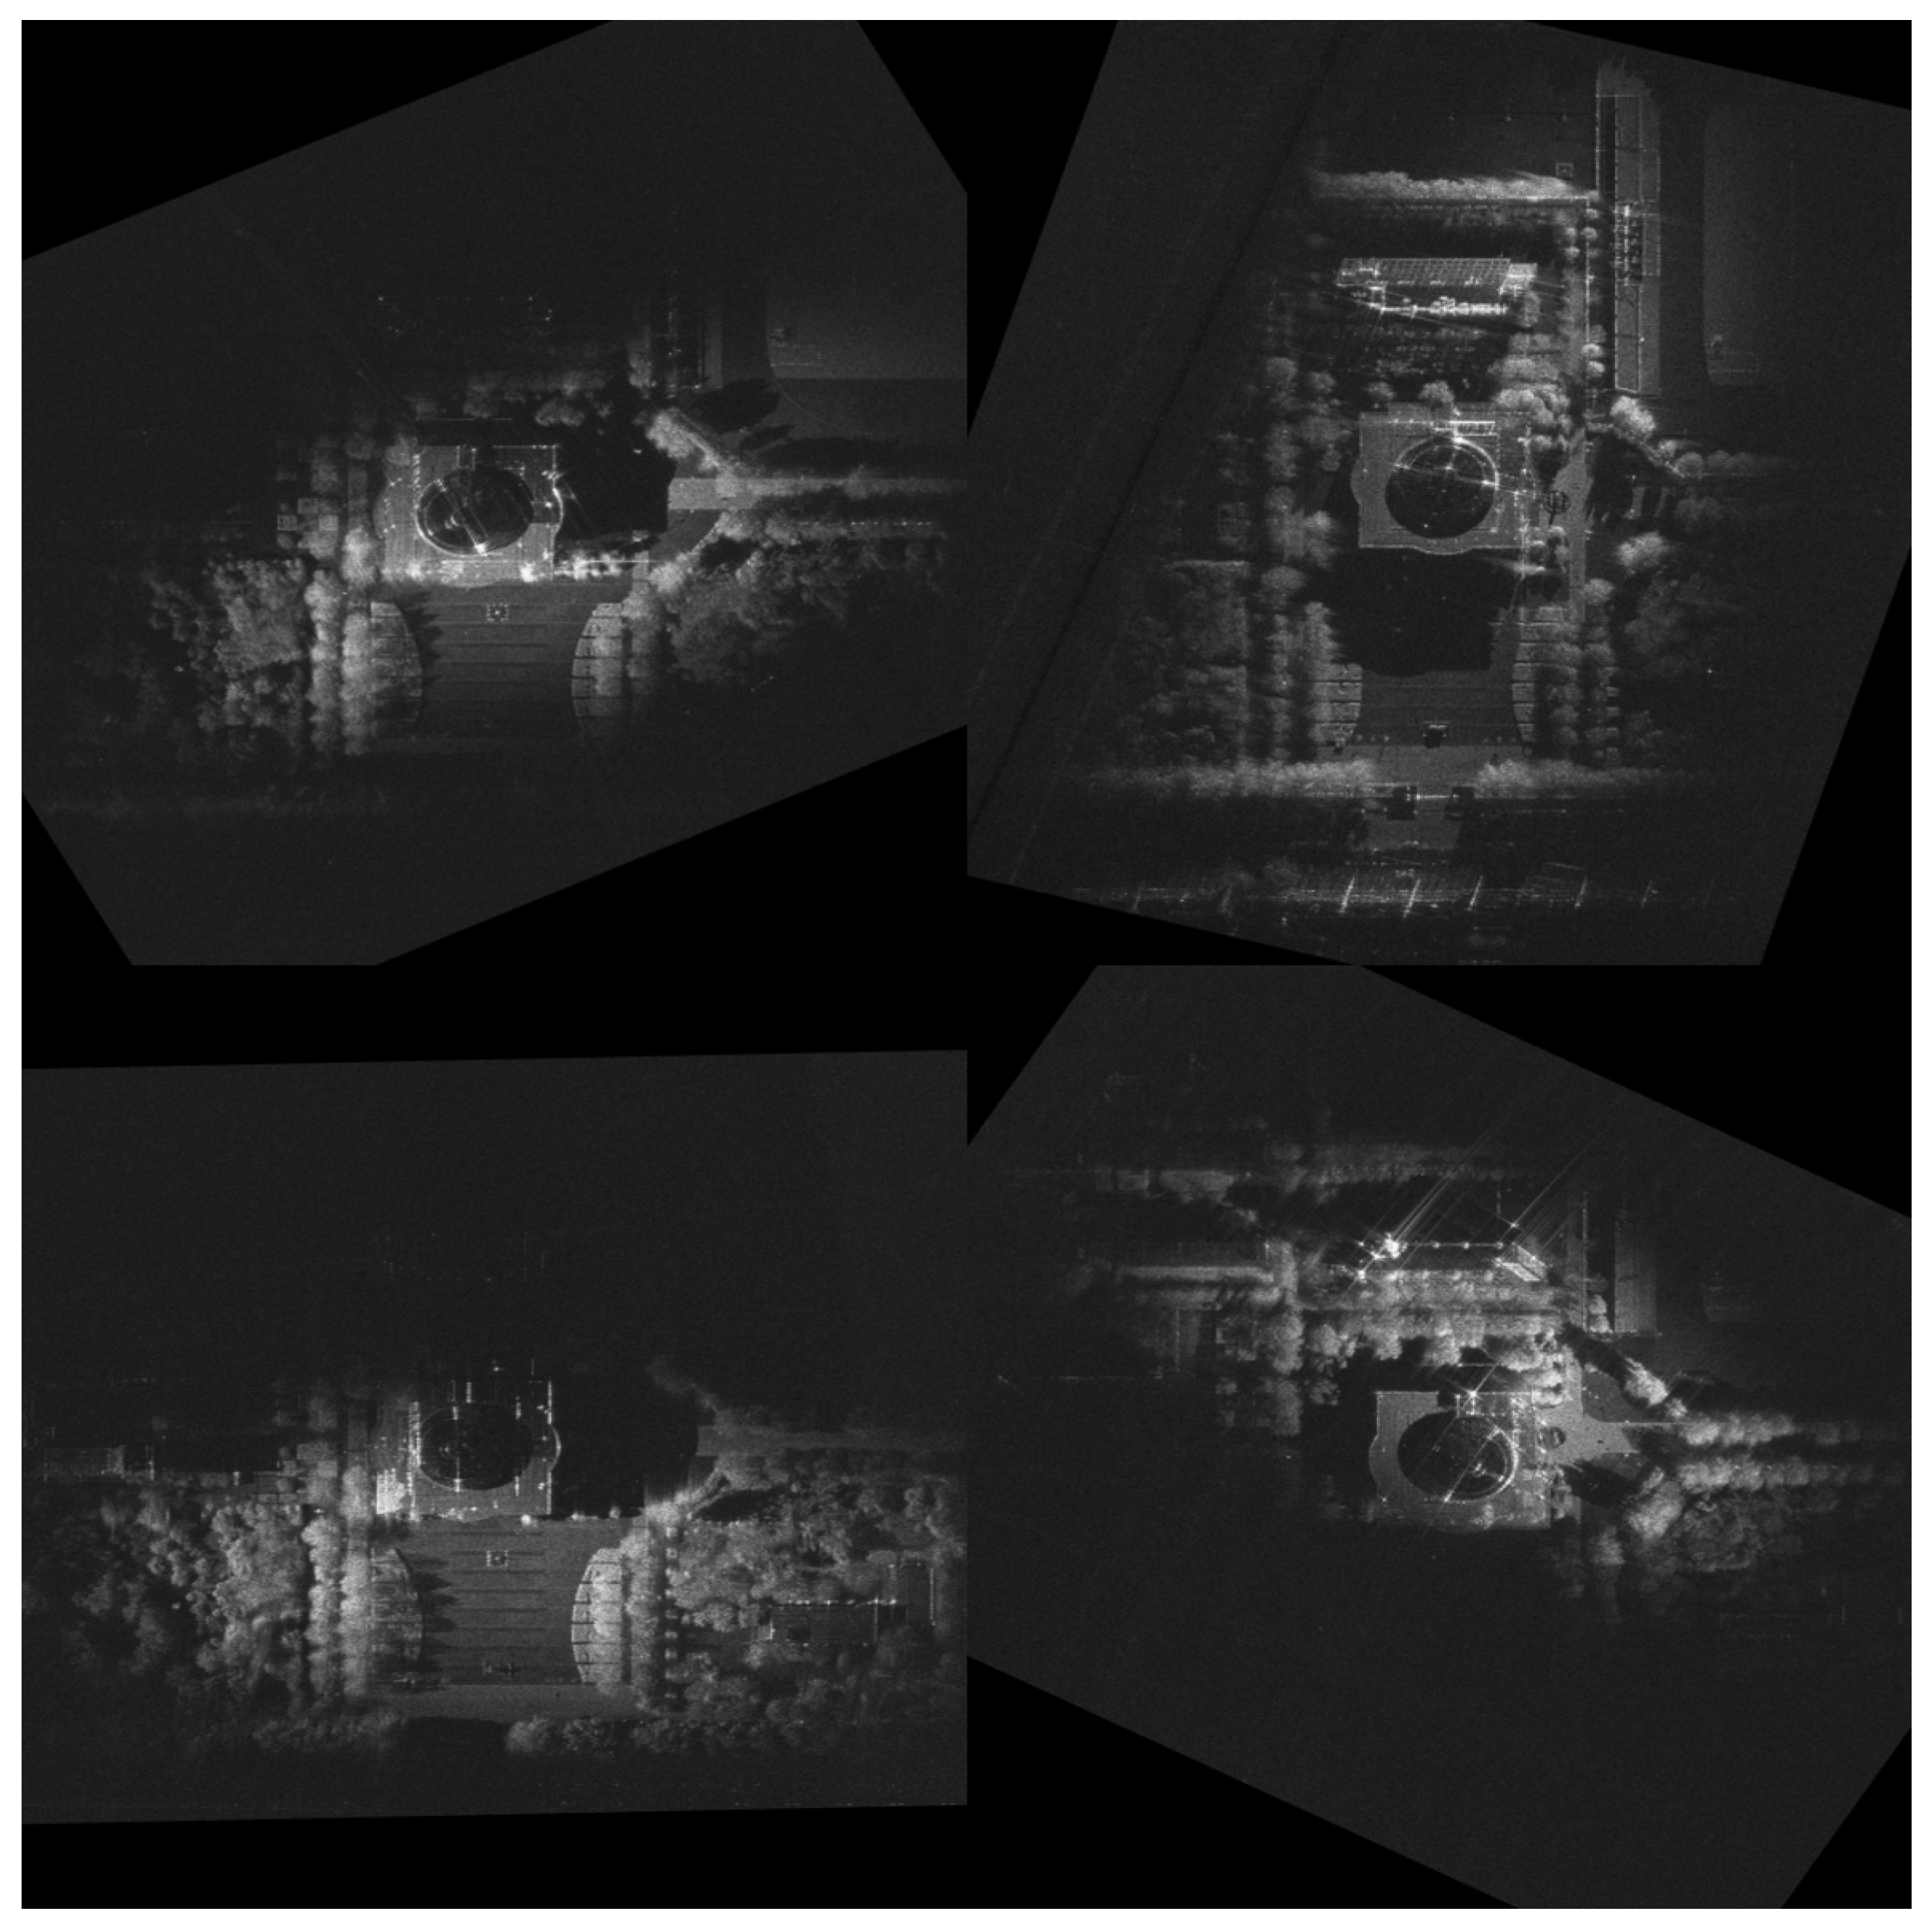
Figure 11 presents a selection of these sub-aperture images, each representing a different aspect angle of the target scene. Across these varying aspect angles, several characteristic phenomena of SAR imaging are evident. The square-shaped teaching building exhibits different geometric distortions in each sub-aperture due to angle-dependent layover, foreshortening, and shadow effects. The scattering characteristics of SAR images at each angle change with variations in radar observation aspect angle, and simultaneously, for targets with height above the imaging plane, their imaging positions also shift with aspect angle.
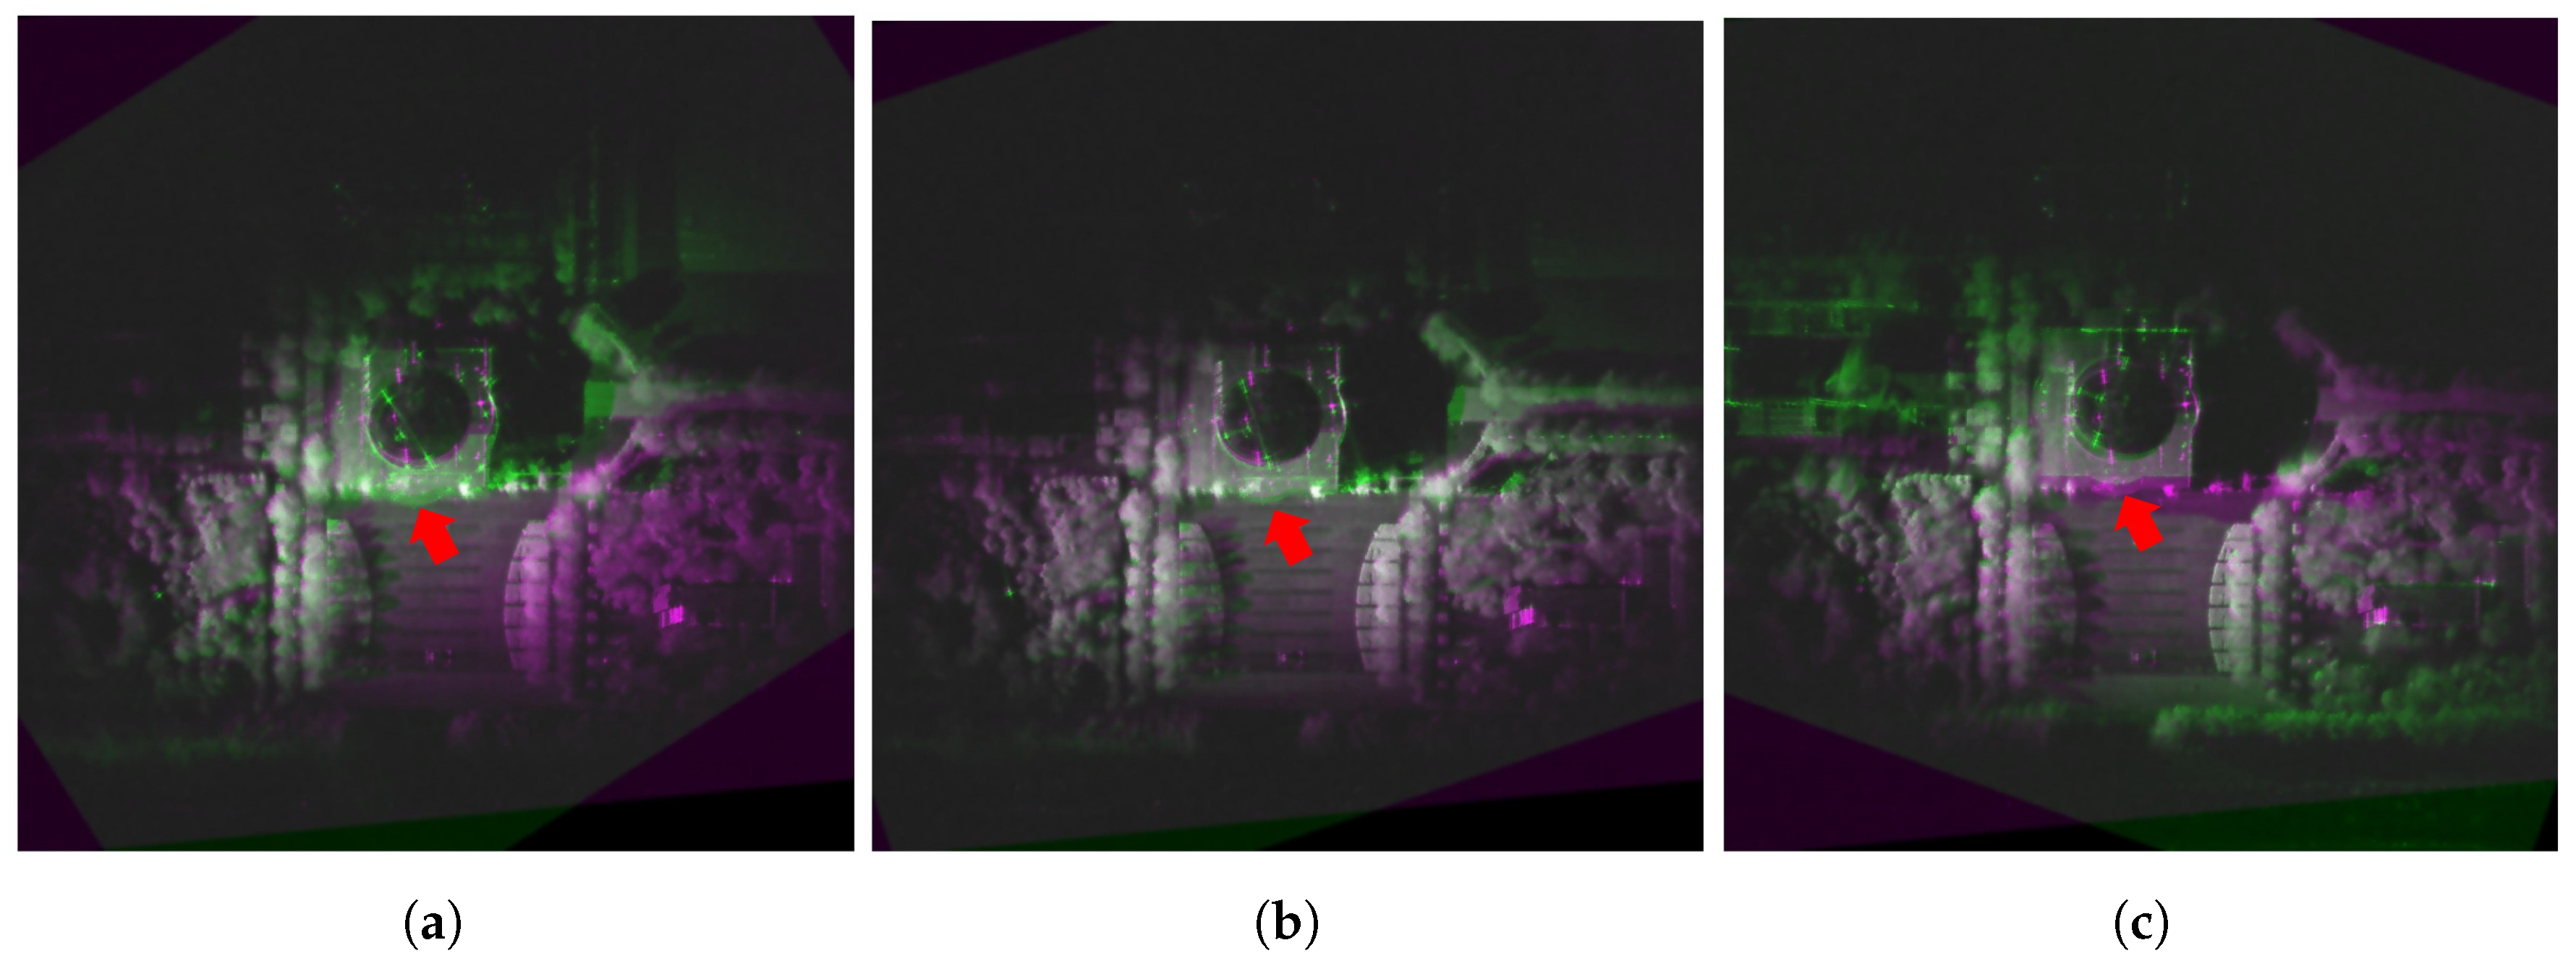
Figure 12 illustrates the effect of varying aspect angles on SAR image matching. We selected a reference image at 20-degree aspect angle (displayed in purple) and compared it with three images acquired at different aspect angles: 5 degrees (
Figure 12a), 15 degrees (
Figure 12b), and 35 degrees (
Figure 12c) (displayed in green). The color overlay visually demonstrates the displacement between matched features across different aspect angles. As evident in
Figure 12, the displacement correlates with the angular difference between images. In
Figure 12b, where the angular difference is only 5 degrees (between 15-degree and 20-degree images), the central building area shows minimal displacement with almost alignment between features. Conversely,
Figure 12a,c, both representing 15-degree angular differences from the reference (5 degrees and 35 degrees, respectively), exhibit obviously larger displacements. The red arrows point to specific examples of feature displacement, showing corresponding points across images that demonstrate how displacement increases with larger angular differences. This displacement pattern is particularly obvious at building edges and corners where geometric distortions are most evident.
The non-linear intensity varies across different aspect angles. These non-linear gray value changes make traditional intensity-based methods like NCC less effective for establishing reliable correspondences, particularly when the angular difference exceeds 10 degrees. This observation further validates the necessity for more robust feature descriptors like our proposed SAR-DAISY, which can better handle the angle-dependent scattering characteristics of urban targets.
Three-dimensional reconstruction was performed on an i5-13600KF CPU with 32 GB of RAM. While Equation (
5) allows for different weighting in the multi-aspect consistency constraint, we assigned equal weights to all viewpoints in this study to focus on demonstrating the effectiveness of multi-aspect dense matching. Each stereo height estimation used 11 images: one central reference image and 10 slave images symmetrically distributed around it, which means 5 on each side at regular 5-degree angular intervals. For the SAR-DAISY descriptor, we set a radius of 15 pixels with 3 layers, balancing computational efficiency with the ability of descriptor to capture distinctive local features in SAR images. Using this configuration, 3D reconstruction of 48 primary images took 25.14 min with our proposed method.
The 3D point cloud reconstruction results obtained through the proposed SAR-DAISY descriptor provide valuable insights into the structure of the target area. As shown in
Figure 13, the SAR-DAISY method generated a detailed 3D point cloud that clearly captures the spatial characteristics of the square-shaped teaching building. The extensive 270° coverage of our multi-aspect SAR acquisition strategy enables the reconstruction of building profile that would be inaccessible from limited aspect angles. This comprehensive spatial representation consists of about 16 million 3D points. These points have remarkable visual clarity. Additionally, this reconstructed result demonstrates a low level of noise artifacts.
As seen, some SAR images could only capture portions of the entire scene due to radar illumination constraints. In the 3D reconstruction results, we incorporated all valid information from different aspect angles.
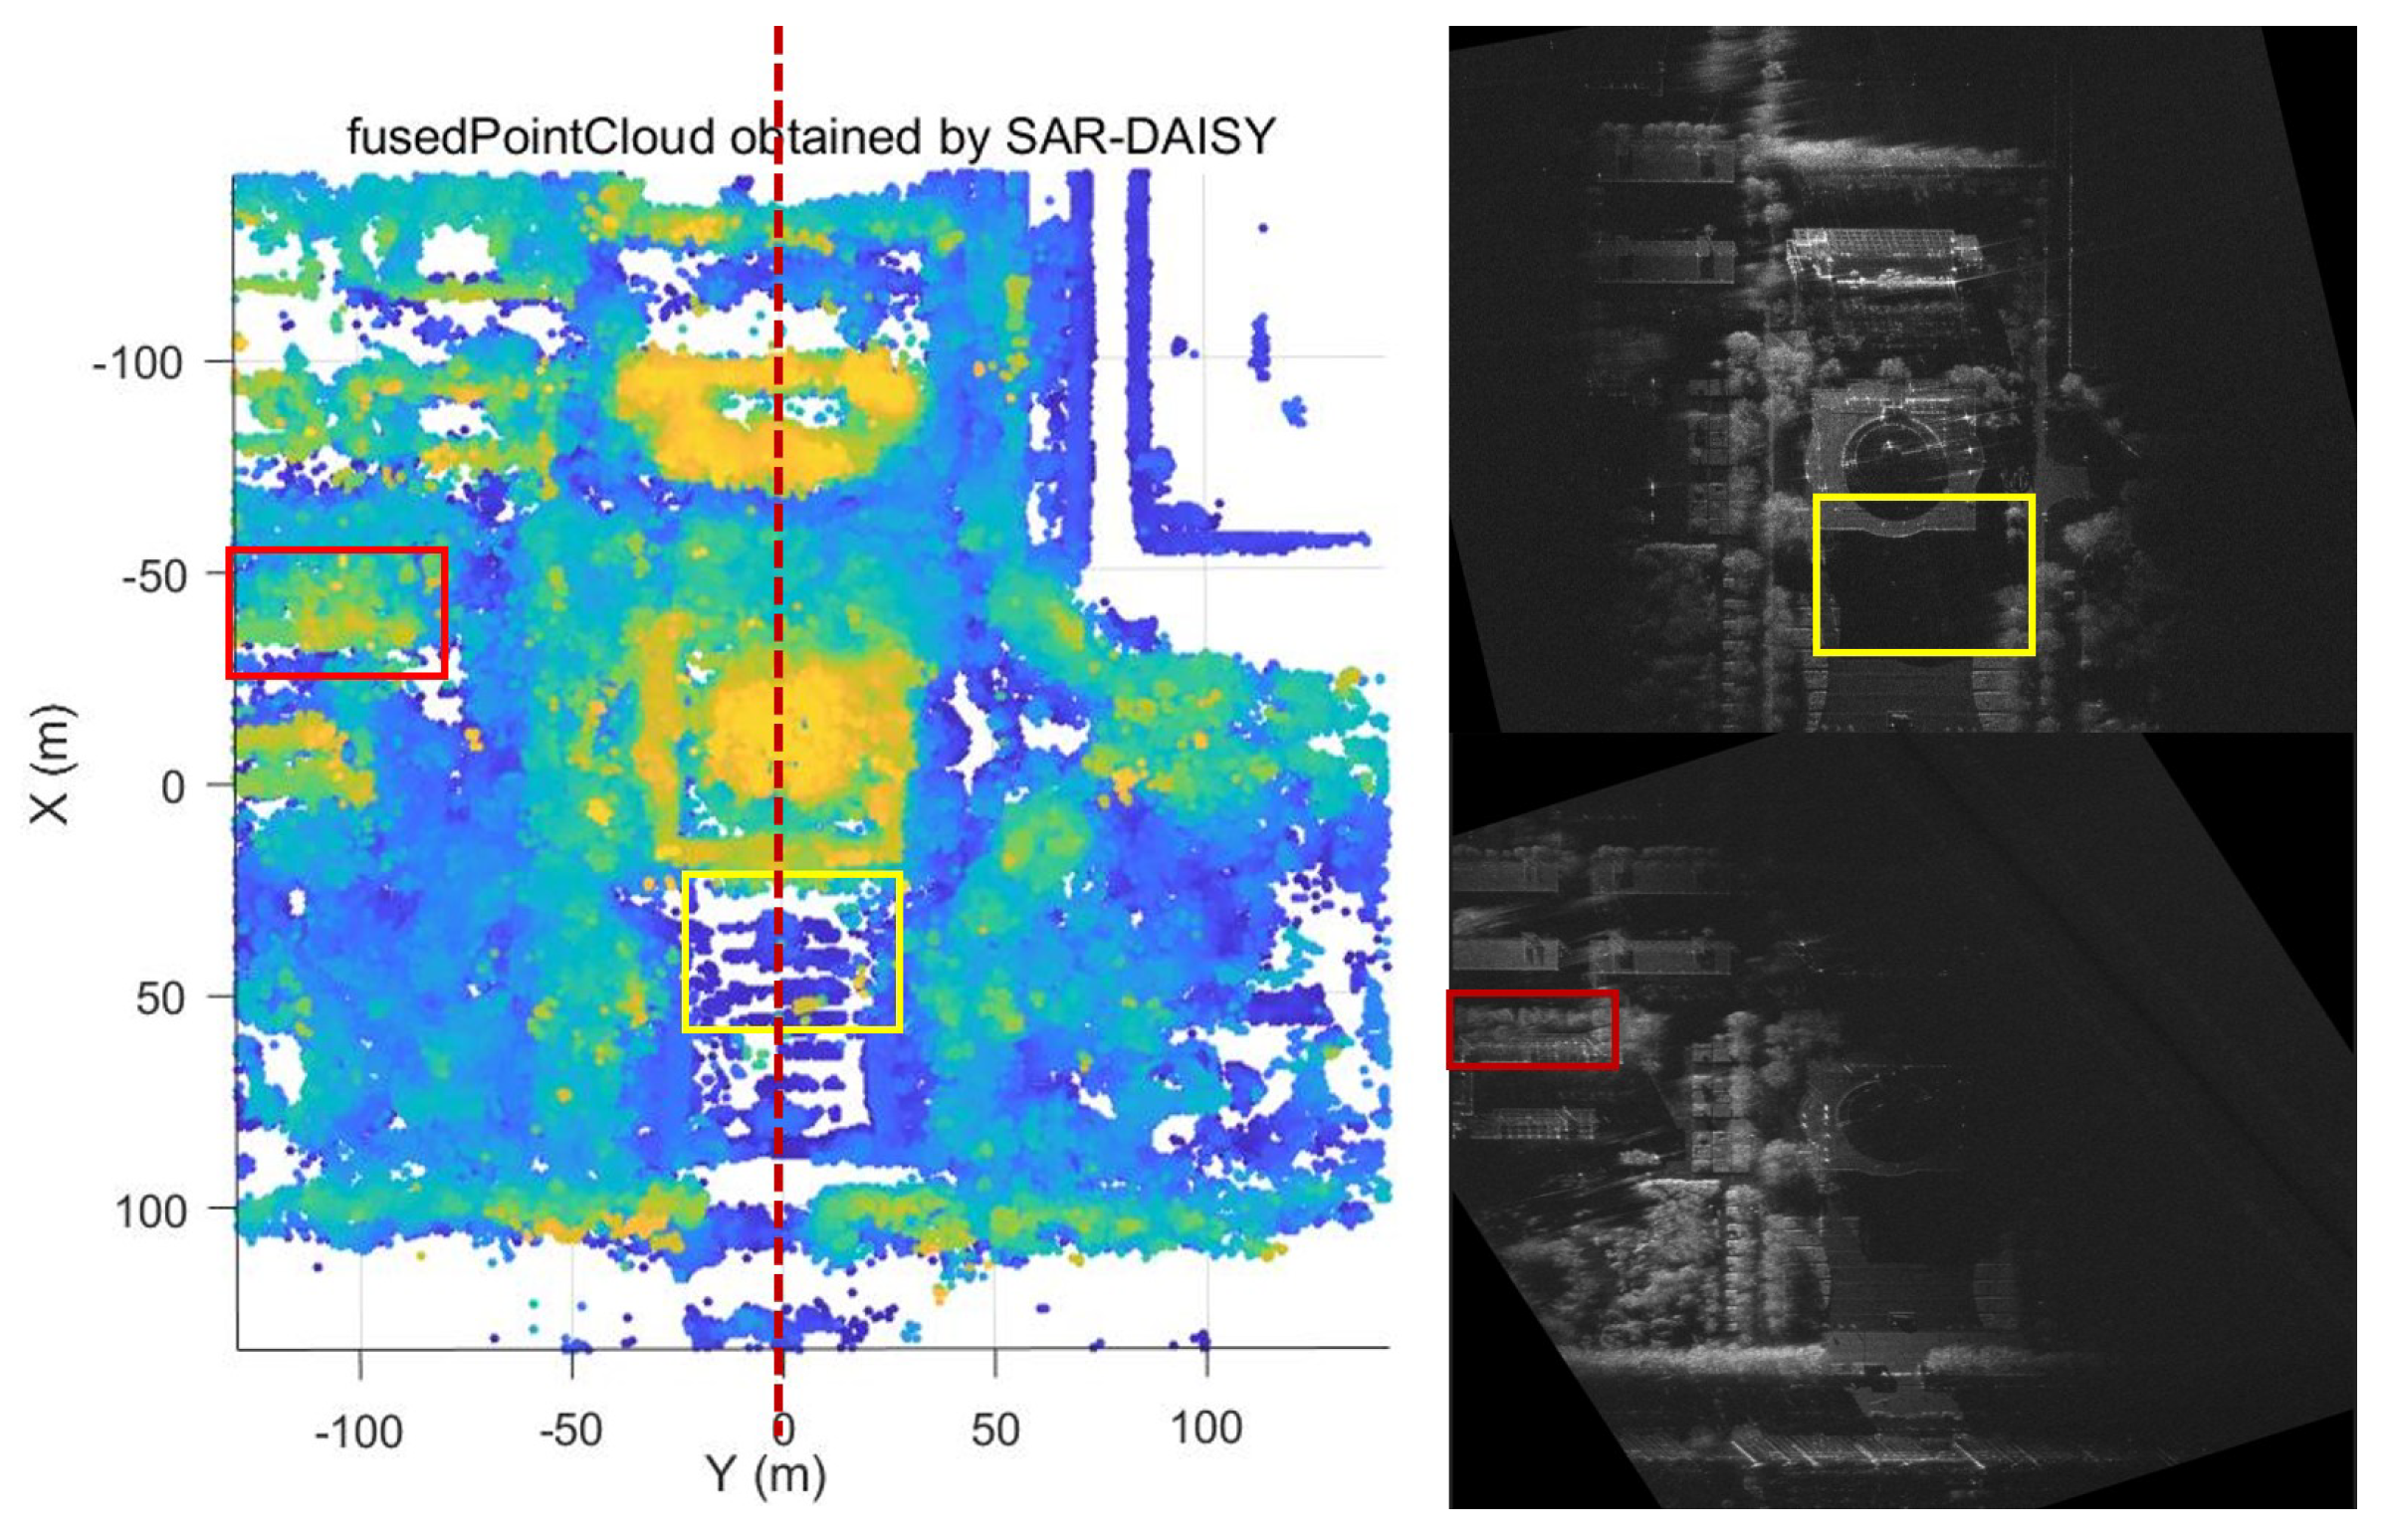
Figure 14 presents an orthographic top–down perspective of the reconstructed scene, highlighting the completeness of the structural representation. Compared to conventional two-dimensional SAR imagery, the proposed method employs complementary multi-aspect information to recover obscured areas and maintain structural integrity. Using the SAR-DAISY operator for dense matching, we extract height information for three-dimensional ortho-rectification, successfully correcting geometric distortions. Specifically, in the yellow-boxed region, the original SAR image shows a shadowed area where the flagpole is completely obscured due to radar shadowing effects from the adjacent building. However, in the reconstructed point cloud, this flagpole structure is successfully recovered with clear height information. This indicates how our method integrates complementary information from different aspect angles. The profile view presented later in the paper illustrates this recovery more clearly. Similarly, the red-boxed region in the SAR image displays ambiguous linear structures mixed with surrounding trees, making it difficult to determine their true spatial form. The corresponding area in the reconstruction shows coherent structural elements with well-defined building outlines and accurate height representation. This effectively eliminates the layover effects present in the original imagery. The central building exhibits severe layover distortion in single-view images, preventing accurate determination of its true layout. In the 3D reconstruction, it appears properly geo-rectified. Throughout the method, the point cloud provides intuitive height information that single SAR images cannot directly offer. The comparison demonstrates how the proposed method recovers features from shadowed areas, corrects geometric distortions, and integrates fragmented structural information into a comprehensive spatial representation.
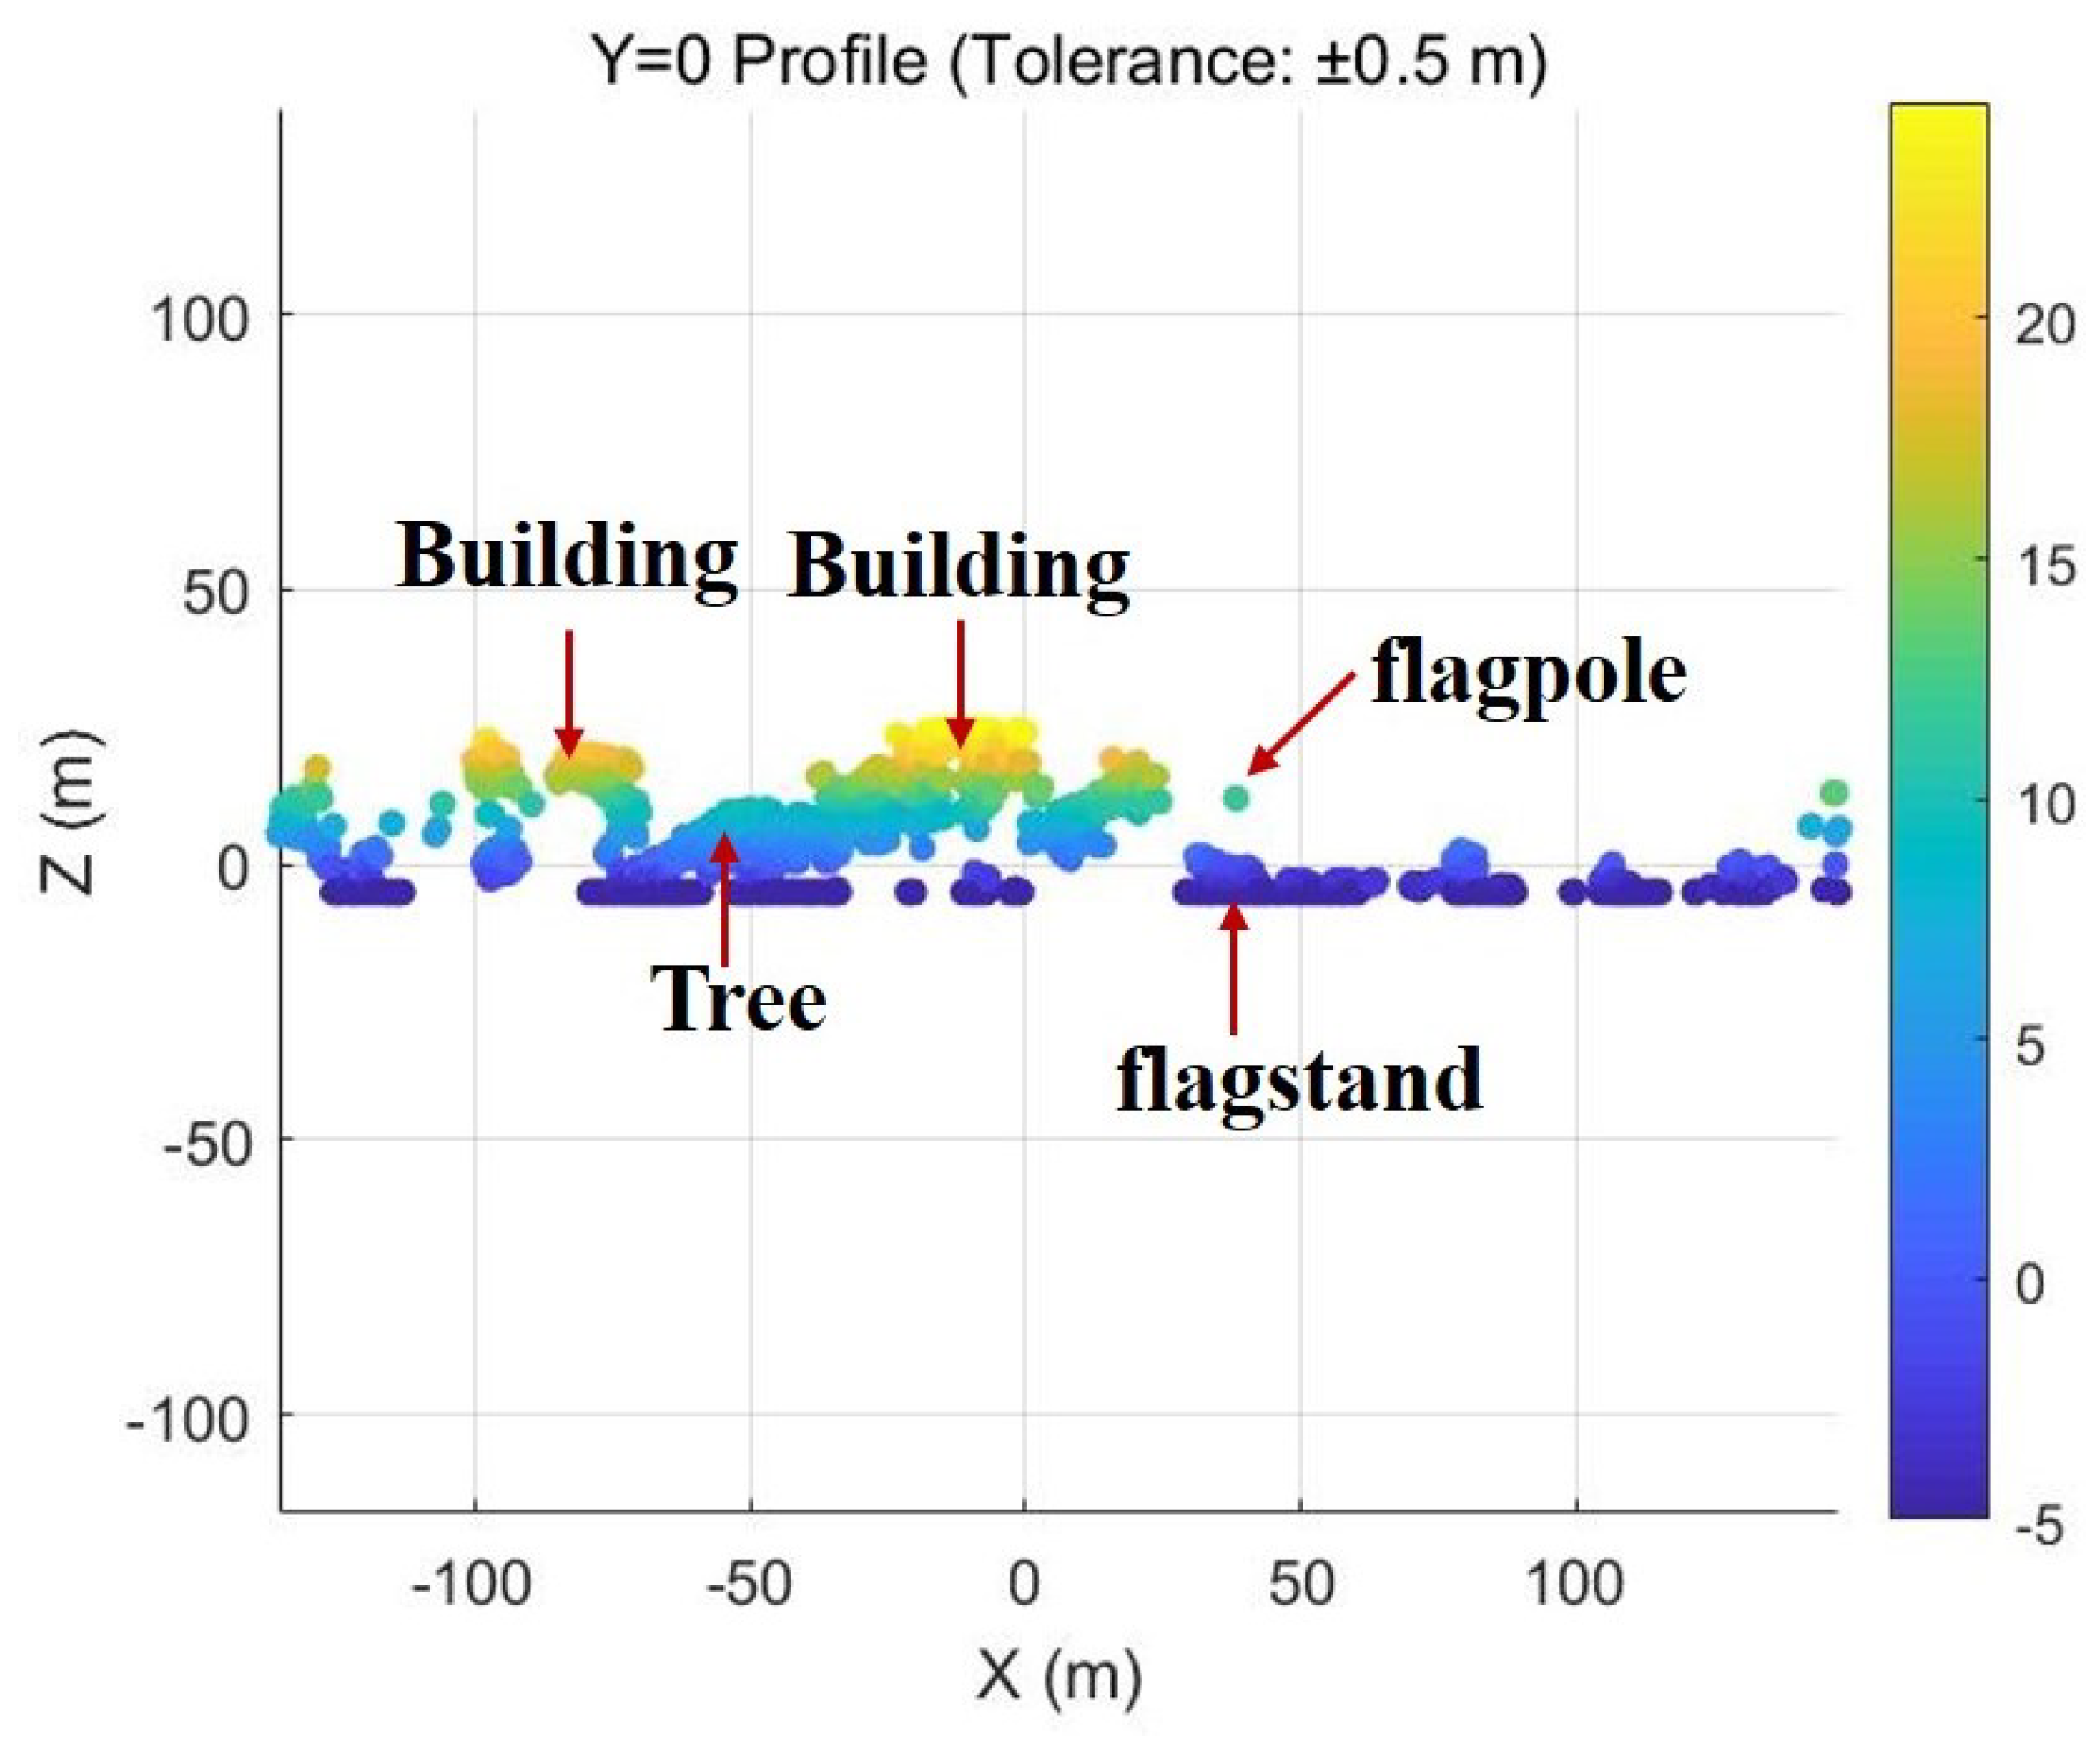
Figure 15 presents a vertical profile of the reconstructed scene at y = 0 (marked by a red dashed line in the figure). Through the analysis of the cross-section at y = 0, we can achieve a more precise visualization of the height variations corresponding to different structural elements of the scene as estimated by this method. The profile clearly reveals the vertical height patterns of various elements including buildings, trees, cement floors, and other objects. Most notably, the profile reveals the successful reconstruction of the flagpole structure reaching about 13 m in height along with its flagstand base. This profile visualization validates the capability of our method to accurately capture height variations across the scene while preserving fine structural details like the flagpole, lost in single-aspect SAR imagery.
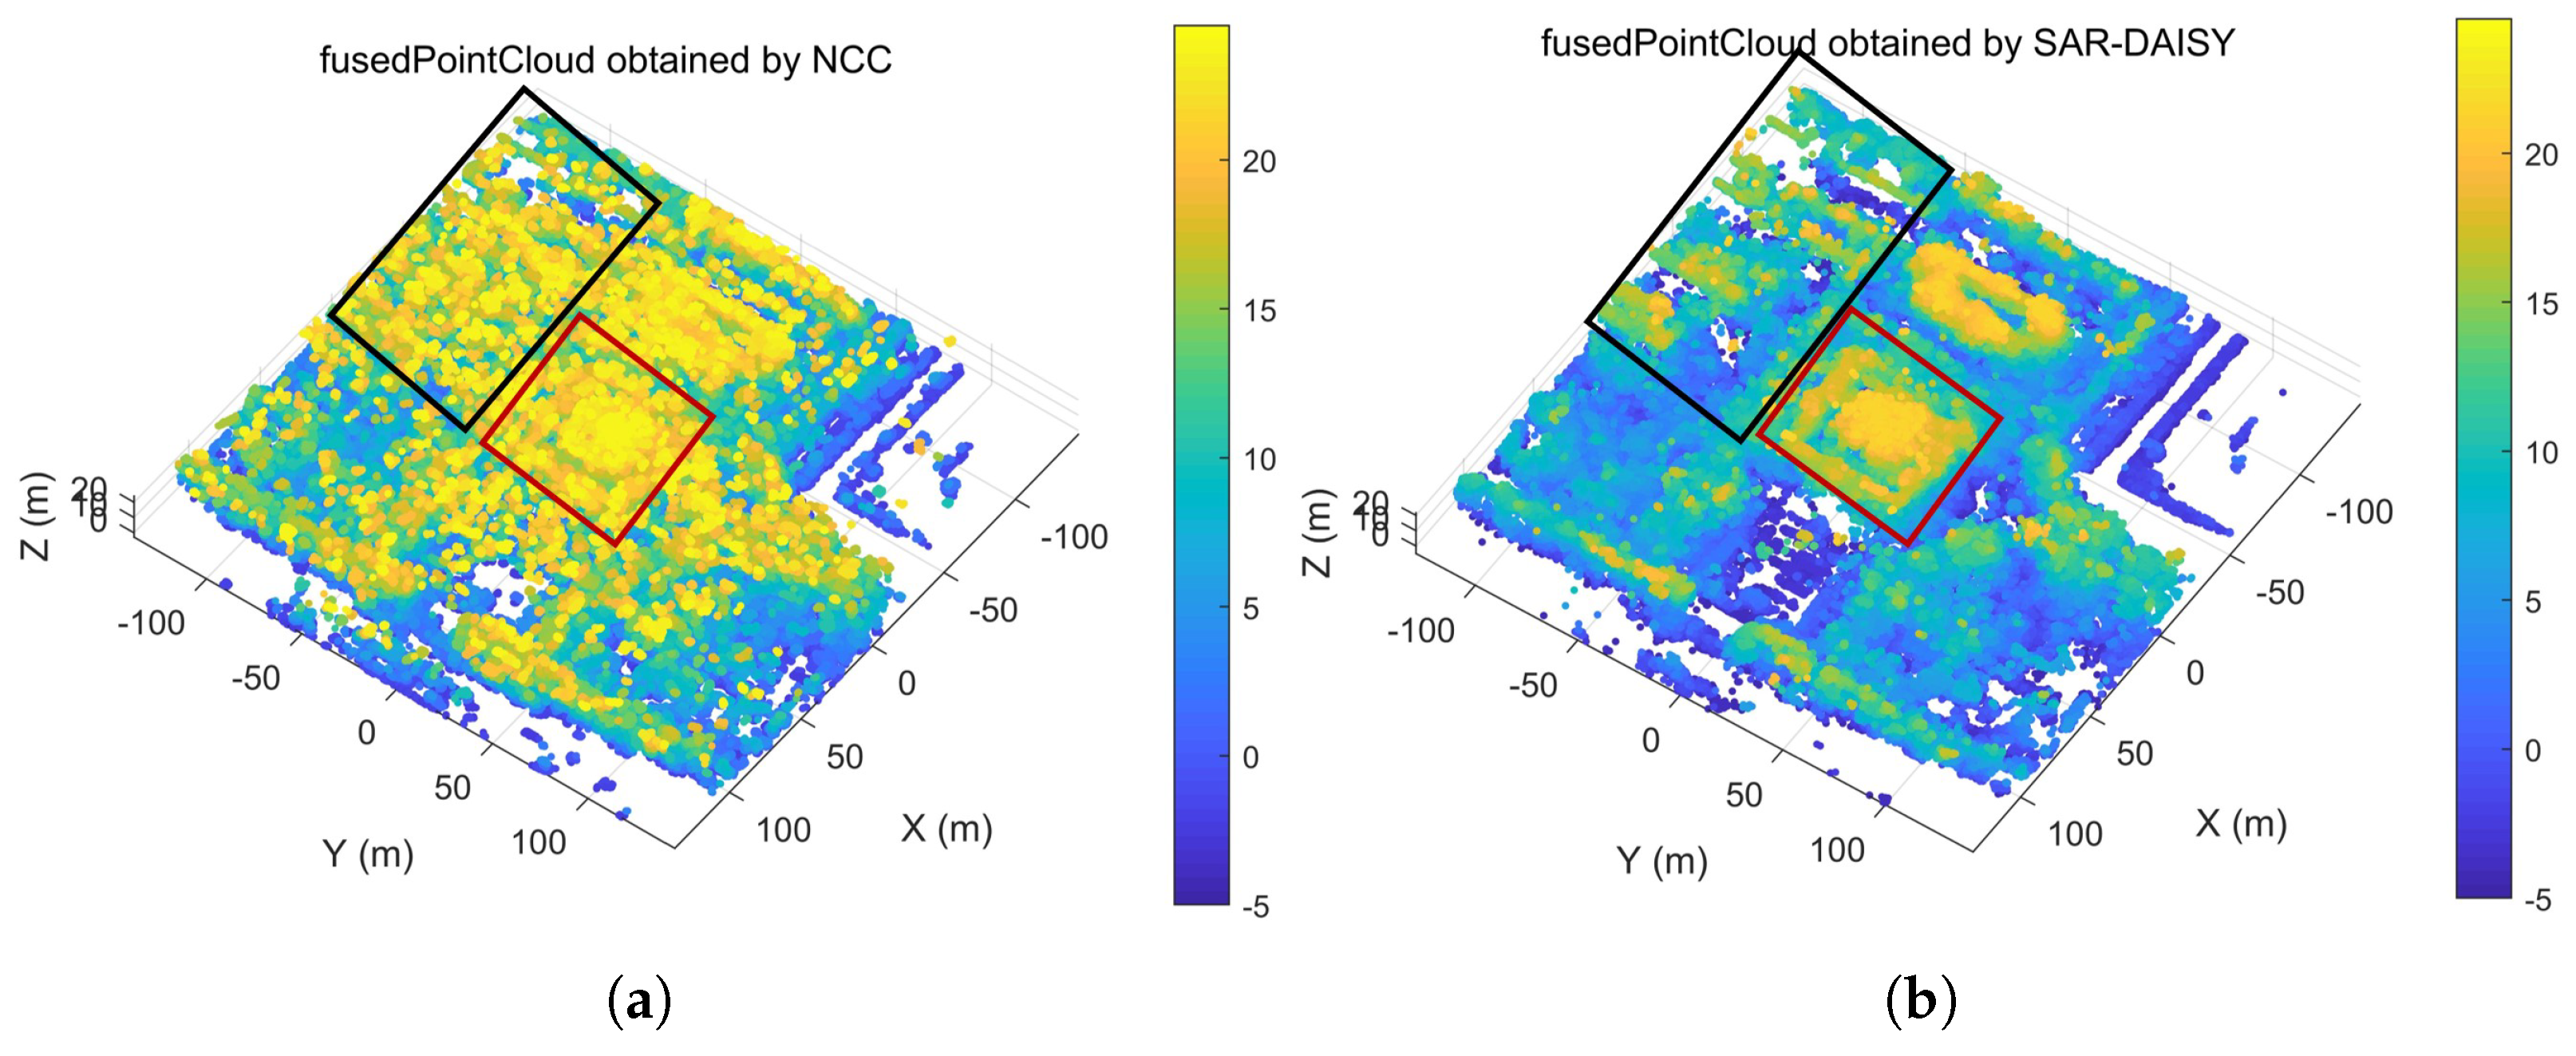
To validate the effectiveness of our proposed SAR-DAISY descriptor, we conducted comprehensive comparative experiments against the used NCC for multi-aspect SAR 3D reconstruction. The comparative evaluation was structured around two aspects: point cloud quality and computational efficiency. Both methods were evaluated using identical datasets consisting of 48 primary images with 10 secondary images per primary (distributed at 5-degree angular intervals), and comparable parameter settings (SAR-DAISY radius of 15 pixels with 3 layers versus NCC window size of 31 pixels).
As shown in
Figure 16a,b, the visual comparison reveals obvious differences between the two methods. The SAR-DAISY method (
Figure 16b) produces well-defined building outlines, clear structural boundaries, and consistent height distributions across the scene. Particularly notable improvements are visible in two key regions (highlighted by black and red boxes): the building in the upper left corner displays distinct structural outlines with SAR-DAISY while NCC is almost completely overwhelmed by noise, making it impossible to identify the main structure, and the central building shows accurate height distribution with SAR-DAISY versus inconsistent height values with NCC. Additionally, other areas in
Figure 16b, such as vegetation regions, have also been successfully recovered and are consistent with the optical image. In contrast, the NCC-based point cloud (
Figure 16a) exhibits substantial noise, randomly distributed mismatched points, and fragmented structural features. The comparison demonstrates that when processing multi-angle images containing complex structures or repetitive patterns, where features vary with aspect angle, intensity-based matching methods struggle significantly.
When processing the 48 image groups, our SAR-DAISY method completed the 3D reconstruction in 25.14 min compared to 30.59 min required by the NCC-based approach. The integration of the GR operator enhances gradient stability in speckle-affected regions, and the circular sampling pattern enables rapid histogram computations. The multi-resolution structure enables SAR-DAISY to characterize features across different scales with minimal computational overhead. This approach preserves feature distinctiveness even when matching across large viewing angle differences, a scenario where traditional intensity-based methods typically fail.
Table 4 presents a comprehensive comparison between the SAR-DAISY and NCC methods across several critical dimensions of performance. The metrics demonstrate that SAR-DAISY not only improves computational efficiency but also enhances reconstruction quality compared to traditional NCC-based approaches. These improvements are particularly important in complex SAR reconstruction tasks, where preserving building outlines, maintaining structural definition, and mitigating speckle effects determine the utility of the resulting 3D urban models for downstream applications.
4. Discussion
This study introduces the SAR-DAISY descriptor, a novel approach for dense matching in multi-aspect SAR images that shows notable improvements over conventional and advanced methods in urban 3D scene reconstruction. Our tests verify that the proposed technique successfully tackles three persistent problems in SAR image processing: geometric distortions, angle-dependent scattering variations, and speckle noise.
The contribution of this work lies in adapting the efficient DAISY structure to the characteristics of SAR imagery, extending its advantages from optical imaging to the more challenging SAR domain. By integrating the GR operator with the DAISY framework, our method achieves robust feature matching across large viewing angles.
Most current dense matching algorithms employ intensity-based methods to balance speed and accuracy. As our comparative analysis shows, these methods perform poorly when handling large angular variations and are highly susceptible to speckle noise, generating numerous mismatched points and fragmented structural features. Feature-based methods like SAR-SIFT improve robustness to speckle noise and angular variations, but as noted in the introduction, their computational complexity makes them unsuitable for dense matching tasks. The process of computing gradient direction histograms, assigning main orientations, and generating 128-dimensional feature descriptors in the SIFT algorithm creates an unsustainable processing burden when calculating features for all image pixels. Alternative methods such as SURF, ORB, and BRIEF have improved computational efficiency but still face limitations in SAR applications. Despite improvements over SIFT, SURF remains computationally expensive for dense matching. While ORB and BRIEF offer computationally efficient binary descriptors, they primarily encode intensity difference patterns without capturing the rich gradient orientation information essential for characterizing SAR features. BRISK implements multi-scale feature detection through a scale-space pyramid structure, but its processing approach requires individual Gaussian smoothing calculations for each keypoint. This creates large computational burden in dense matching scenarios requiring feature calculation for every image pixel. Addressing these limitations, our proposed SAR-DAISY descriptor uses convolution operations to simultaneously calculate gradients and employs a polar coordinate sampling grid, achieving computational efficiency while preserving gradient direction information. The integration of the GR operator provides robust gradient calculation in speckle-affected images, making SAR-DAISY particularly suitable for dense matching in multi-aspect SAR images.
Experimental results using the W-band airborne SAR system demonstrate that our method generates visually coherent and structurally accurate 3D reconstructions of complex urban environments. The approximately 16 million 3D points generated from multiple aspect angles effectively eliminate the geometric distortions inherent in single-view SAR images, such as layover and shadow effects that typically complicate urban analysis.
The parameter selection in our experiments balanced computational efficiency with feature distinctiveness. Using a 15-pixel radius reduced processing time while maintaining sufficient local context for accurate matching. The three-layer structure preserved multi-scale analysis capability, providing robustness against feature scale variations across different viewing angles. From a processing efficiency perspective, our experimental evaluation demonstrated the practical advantages of SAR-DAISY. The complete reconstruction workflow processed 48 primary images in just 25.14 min, 17.8% faster than the NCC method. Parameters were optimized for SAR image characteristics, recognizing that larger descriptors increase computational cost without improving accuracy due to speckle noise and geometric distortions. These results validate our method as a feasible solution for large-scale urban mapping applications, meeting both efficiency and precision requirements. Future work will present more detailed parameter optimization studies.
Profile analysis validates our method, with estimated building heights matching actual measurements. The highest point of central teaching building was reconstructed at approximately 23 m, while the main building structure stood about 18 m high. The 13 m flagpole was also accurately reconstructed. Such structures are typically obscured in single-view imagery. The reconstruction results showcase the ability of our method to leverage multi-aspect observations for recovering features from shadowed areas.
Future research will focus on reducing the required number of aspect angles while maintaining reconstruction quality, possibly through adaptive weighting schemes based on image quality metrics, incidence angles, or estimated information content. Additionally, extremely complex geometries or multiple scattering mechanism areas remain challenging even for SAR-DAISY, as evidenced by slightly blurred or merged structural details in some regions of the reconstructed point cloud. These complex scenes might benefit from additional constraints derived from semantic understanding of urban structures.


