Article

High Resolution Crop Type and Rotation Mapping in Farming–Pastoral Ecotone in China Using Multi-Satellite Imagery and Google Earth Engine

by
Zhenwei Hou
1,2,
Bangqian Chen
3,
Yaqun Liu
4,
Huadong Zang
1,2,
Kiril Manevski
5,6,
Fangmiao Chen
7,
Yadong Yang
1,2,
Junyong Ge
8 and
Zhaohai Zeng
1,2,*
1
State Key Laboratory of Maize Bio-Breeding, College of Agronomy and Biotechnology, China Agricultural University, Beijing 100193, China
2
Key Laboratory of Farming System, Ministry of Agriculture and Rural Affairs of China, China Agricultural University, Beijing 100193, China
3
Rubber Research Institute (RRI), Chinese Academy of Tropical Agricultural Sciences (CATAS), Hainan Danzhou Agro-Ecosystem National Observation and Research Station, State Key Laboratory Incubation Base for Cultivation and Physiology of Tropical Crops, Haikou 571101, China
4
Key Laboratory of Regional Sustainable Development Modeling, Institute of Geographic Sciences and Natural Resources Research, Chinese Academy of Sciences, Beijing 100101, China
5
Department of Agroecology, Aarhus University, Blichers Allé, 508830 Tjele, Denmark
6
Sino-Danish Center for Education and Research, Eastern Yanqihu Campus, University of Chinese Academy of Sciences, Beijing 101400, China
7
Aerospace Information Research Institute, Chinese Academy of Sciences, Beijing 100094, China
8
Zhangjiakou Academy of Agricultural Sciences, Zhangjiakou 075000, China
*
Author to whom correspondence should be addressed.
Remote Sens. 2025, 17(10), 1707; https://doi.org/10.3390/rs17101707
Submission received: 2 April 2025 / Revised: 5 May 2025 / Accepted: 10 May 2025 / Published: 13 May 2025

Abstract

:
The accurate mapping of crop types and rotation patterns is essential for promoting sustainable agricultural development, particularly in ecologically fragile regions such as the farming–pastoral ecotone of China (FPEC). This study focuses on Zhangjiakou, a representative area of the FPEC, to develop a multi-sensor remote sensing framework for monitoring crop distribution and analyzing rotation dynamics. After cloud removal and Savitzky–Golay filtering were applied to correct noise, we selected vegetation index features with maximum inter-class separability during the optimal classification window (June 15–August 20) and generated quarterly Sentinel-1 SAR composites. A Random Forest classifier was employed to perform crop classification based on these optimized features, enabling 10 m resolution crop mapping from 2019 to 2023. The proposed method achieved high classification accuracy (overall accuracy and Kappa > 0.90), with strong agreement between mapped and statistical crop areas (R2: 0.85–0.88; RMSE: 0.42–0.58 × 10⁴ ha). Spatial analysis revealed distinct distribution patterns: oats, potato, sesame, and vegetables were predominantly cultivated in northern Zhangjiakou, while maize dominated southern regions. We observed significant annual variations in crop area proportions and identified specific altitudinal preferences: maize, potato, and sesame were mainly grown at 480–520 m, while oats and other crops at 520–600 m. Slope analysis showed that most crops were cultivated on gentle slopes of 0–5°, with sesame extending to 4–10° slopes. Temporal analysis from 2019 to 2023 indicated that sesame, oats, and potato predominantly followed rotation patterns, while maize cultivation was primarily monoculture. Key drivers of rotation change included water scarcity, economic incentives, and continuous cropping constraints. These findings provide critical insights for optimizing crop rotation strategies, enhancing agricultural sustainability, and improving land-use efficiency in ecologically fragile regions.

1. Introduction

The accurate spatiotemporal mapping of crop types and rotation patterns constitutes a scientific foundation for advancing agricultural sustainability, optimizing land-use management, and safeguarding global food security [1,2]. As a pivotal component of precision agriculture, the reliable identification of crop rotation patterns not only facilitates the equilibrium between agricultural production and ecological conservation but also delivers actionable insights for policymakers to design adaptive strategies in soil management, resource allocation, and productivity enhancement [3]. These requirements are particularly critical in the farming–pastoral ecotones, transitional zones between semi-arid and arid climates, where rainfed agriculture coexists with livestock grazing systems [4,5]. Globally distributed across ecologically vulnerable regions, such as the Eurasian steppe belt, East Asian loess plateaus, African Sahel, and South American Altiplano, these ecotones exhibit heightened sensitivity to anthropogenic disturbances due to their fragmented landscapes, climatic variability, and delicate soil–water balances [6,7]. In such contexts, agricultural intensification directly modulates regional ecological stability, necessitating high-precision crop mapping to reconcile productivity goals with environmental sustainability [8]. Consequently, the spatiotemporally explicit monitoring of agricultural land use emerges as both a scientific imperative and technical challenge for implementing the United Nations Sustainable Development Goals in these marginal environments.
The evolution of satellite remote sensing has revolutionized agricultural monitoring by enabling synoptic, repetitive, and cost-effective earth observation [9,10]. While moderate-resolution sensors (e.g., MODIS at 250–500 m) suffice for continental-scale crop surveillance, their limited spatial fidelity impedes smallholder field delineation in fragmented farmlands [11]. Although Landsat’s 30 m imagery (freely accessible since 2008) improved spatial granularity, its 16-day revisit cycle often fails to capture critical phenophases essential for crop discrimination [12,13,14]. For instance, mixed pixel effects persist when field sizes fall below sensor resolution thresholds, while temporal gaps may obscure rapid vegetation changes during key growth stages. Recent advancements in satellite constellations have partially addressed these limitations: Sentinel-2’s enhanced capabilities (10–20 m resolution; 5-day revisit) enable improved crop phenology tracking and operational crop mapping, as evidenced by successful implementations in European agricultural systems [15,16,17,18]. Complementary Sentinel-1 Synthetic Aperture Radar (SAR) data provide all-weather observation capacity, yet their standalone utility remains constrained by speckle noise and complex backscatter interpretation challenges [19,20]. Despite the synergistic use of optical-SAR fusion in crop classification, current methodologies predominantly focus on dominant monocultures in homogeneous landscapes, leaving critical gaps in characterizing heterogeneous agroecosystems with intricate crop mixtures and rotations [21]. This technological shortcoming is acutely manifested in the farming–pastoral ecotones, where smallholder farming systems exhibit high spatiotemporal heterogeneity in cropping patterns, necessitating integrated multi-sensor approaches for accurate land-use characterization.
Previous investigations into crop pattern dynamics have established foundational methodologies but continue to exhibit notable limitations in scope and generalizability across complex landscapes [17,22]. In China, existing studies have primarily concentrated on staple cereals such as maize, wheat, and rice, while regionally significant cash crops and intricate multi-crop rotation systems remain underexplored [23,24,25,26,27,28]. For example, MODIS-EVI time series have facilitated the mapping of winter wheat–summer maize rotations in the North China Plain, and Landsat-based analyses have captured rice intensification in southern basins [29,30,31,32]. However, research in the farming–pastoral ecotone of China (FPEC) has largely prioritized land-use conversions such as cropland abandonment and reclamation, using MODIS or Sentinel data to differentiate broad categories like cropland versus fallow, rather than detailed crop-type mapping [5,33,34,35]. Recent localized efforts have applied deep learning models to Sentinel-2 imagery for early-season crop identification [36], and satellite-based studies have begun to detect specialized systems such as green depression agriculture [37]. Yet, several critical challenges persist: (i) most existing studies focus on land cover change or single-season crop identification, lacking long-term, multi-crop rotation analysis; (ii) systematic assessments linking crop distribution to topographic gradients (elevation, slope) remain limited; and (iii) these issues are further exacerbated in the FPEC due to highly fragmented sub-hectare plots, frequent cloud cover during critical phenological stages, and substantial intra-class spectral variability arising from microclimates, varietal differences, and heterogeneous farming practices [38,39]. Consequently, existing frameworks exhibit limited generalizability across the FPEC, particularly in complex and fragmented terrains.
Zhangjiakou City, a representative region within FPEC, is characterized by significant ecological fragility, pronounced climatic variability, and fragmented agricultural landscapes. Agricultural practices here include complex and diverse cropping systems with both staple crops (maize) and regionally significant specialty crops (oats, potato, sesame, vegetables) [40]. Although large-scale maize mapping products have enhanced the understanding of dominant cereal distributions, comprehensive spatiotemporal analyses that capture major crops, along with rotation dynamics across heterogeneous landscapes, remain scarce. Addressing these gaps, this study aims to: (1) develop a robust crop classification framework by integrating multi-source satellite imagery to accurately map major crop types in Zhangjiakou (2019–2023) at 10 m resolution; (2) identify dominant crop rotation types and assess their temporal frequency and transition structure using transition matrix analysis; and (3) analyze altitudinal and slope gradient dependencies influencing crop distribution. The results could provide critical insights to optimize cropping strategies and improve agricultural management in ecologically fragile regions.

2. Study Area and Data Sources

2.1. Study Area

Zhangjiakou City (113°50′–116°30′E, 39°50′–42°50′N, Figure 1) is located at the intersection of Shanxi Province, Inner Mongolia Autonomous Region, and Beijing Municipality in China. It administers 16 districts and counties, covering a total area of approximately 36,800 km2, with an average elevation of 1600 m. The region has a temperate continental monsoon climate, with a frost-free period of 95–145 days per year and an average annual temperature between −1 and 15 °C. The multi-year average annual precipitation is around 400 mm. Due to limitations in low accumulated temperatures and hydrothermal conditions, the crop growing season is mainly concentrated between May and October [4]. According to the 2022 Zhangjiakou Statistical Yearbook, the major food crops in this region are maize, potato, oats, and sesame, which together account for over 50% of the total arable land area. Local farmers also grow small amounts of cold-tolerant and drought-resistant crops, such as millet and sunflowers. The region’s economic crop planting system is diverse, including vegetables, oilseeds, sugar crops, and medicinal herbs. Intensive agricultural activities, inappropriate farming practices, and climatic variability exacerbate environmental issues, highlighting the critical need for accurate remote sensing-based crop classification and continuous monitoring of cropping patterns to support sustainable agricultural management.

2.2. Data Sources

2.2.1. Satellite Data

To ensure multi-sensor data interoperability, this study implemented a synergistic remote sensing framework integrating optical and SAR observations: Landsat 8/9 Operational Land Imager (Collection 2, Level-2 surface reflectance), Sentinel-2A/B Multi-Spectral Instrument (Level-2A), and Sentinel-1 SAR data (Table 1). Within Google Earth Engine (GEE), Landsat series underwent cloud/shadow masking using the mask algorithm followed by least squares regression for temporal smoothing. Sentinel-2 Level-2A products, which have already undergone radiometric calibration, atmospheric correction, and band resampling to a unified resolution by the data generation (the European Space Agency), were further cloud masked using the QA60 band.
Although Landsat has a coarser spatial resolution (30 m), it provided supplementary observations during cloud-obstructed periods and was merged with Sentinel-2 to improve temporal continuity. Vegetation indices were then calculated from the combined optical dataset to construct classification features. Complementing optical limitations, Sentinel-1 C-band Ground Range-Detected data (VV + VH polarization) were processed through σ0 calibration, terrain correction, and multi-temporal filtering to mitigate speckle noise, effectively bypassing cloud obstruction challenges in agricultural monitoring [5]. The final classification model and all outputs were implemented at 10 m resolution, aligning with Sentinel-2 spatial granularity. This multi-modal integration capitalizes on SAR’s all-weather capability and optical sensors’ spectral richness, establishing a robust feature extraction baseline.

2.2.2. Field Crop Samples

A field survey was conducted in Zhangjiakou from mid-July to late August 2023 to create a ground database. Mobile GIS devices (Ovital v9.1.3) were used to record location and crop types at each sample point for accuracy assessment. To ensure consistency between reference and image data, a 10 m buffer was applied to each training sample [41]. The database included 363 sample points, covering maize, potato, oats, sesame, and other crops. Vegetables, sunflowers, rapeseed, wheat and sugar beets were also surveyed and classified as “other crops”. To account for interannual variability, additional field observations from 2021 and 2022 were used exclusively for validating historical classifications and were not included in model training (Figure 1). Samples were strategically distributed across diverse topographic zones and cropping systems, encompassing both irrigated lowlands and rainfed uplands. To ensure adequate representation of all crop types, samples were randomly divided into a training set (60%) and a validation set (40%). This ratio improves model generalization in fragmented and phenologically complex agricultural systems and aligns with practices in similar studies [42].

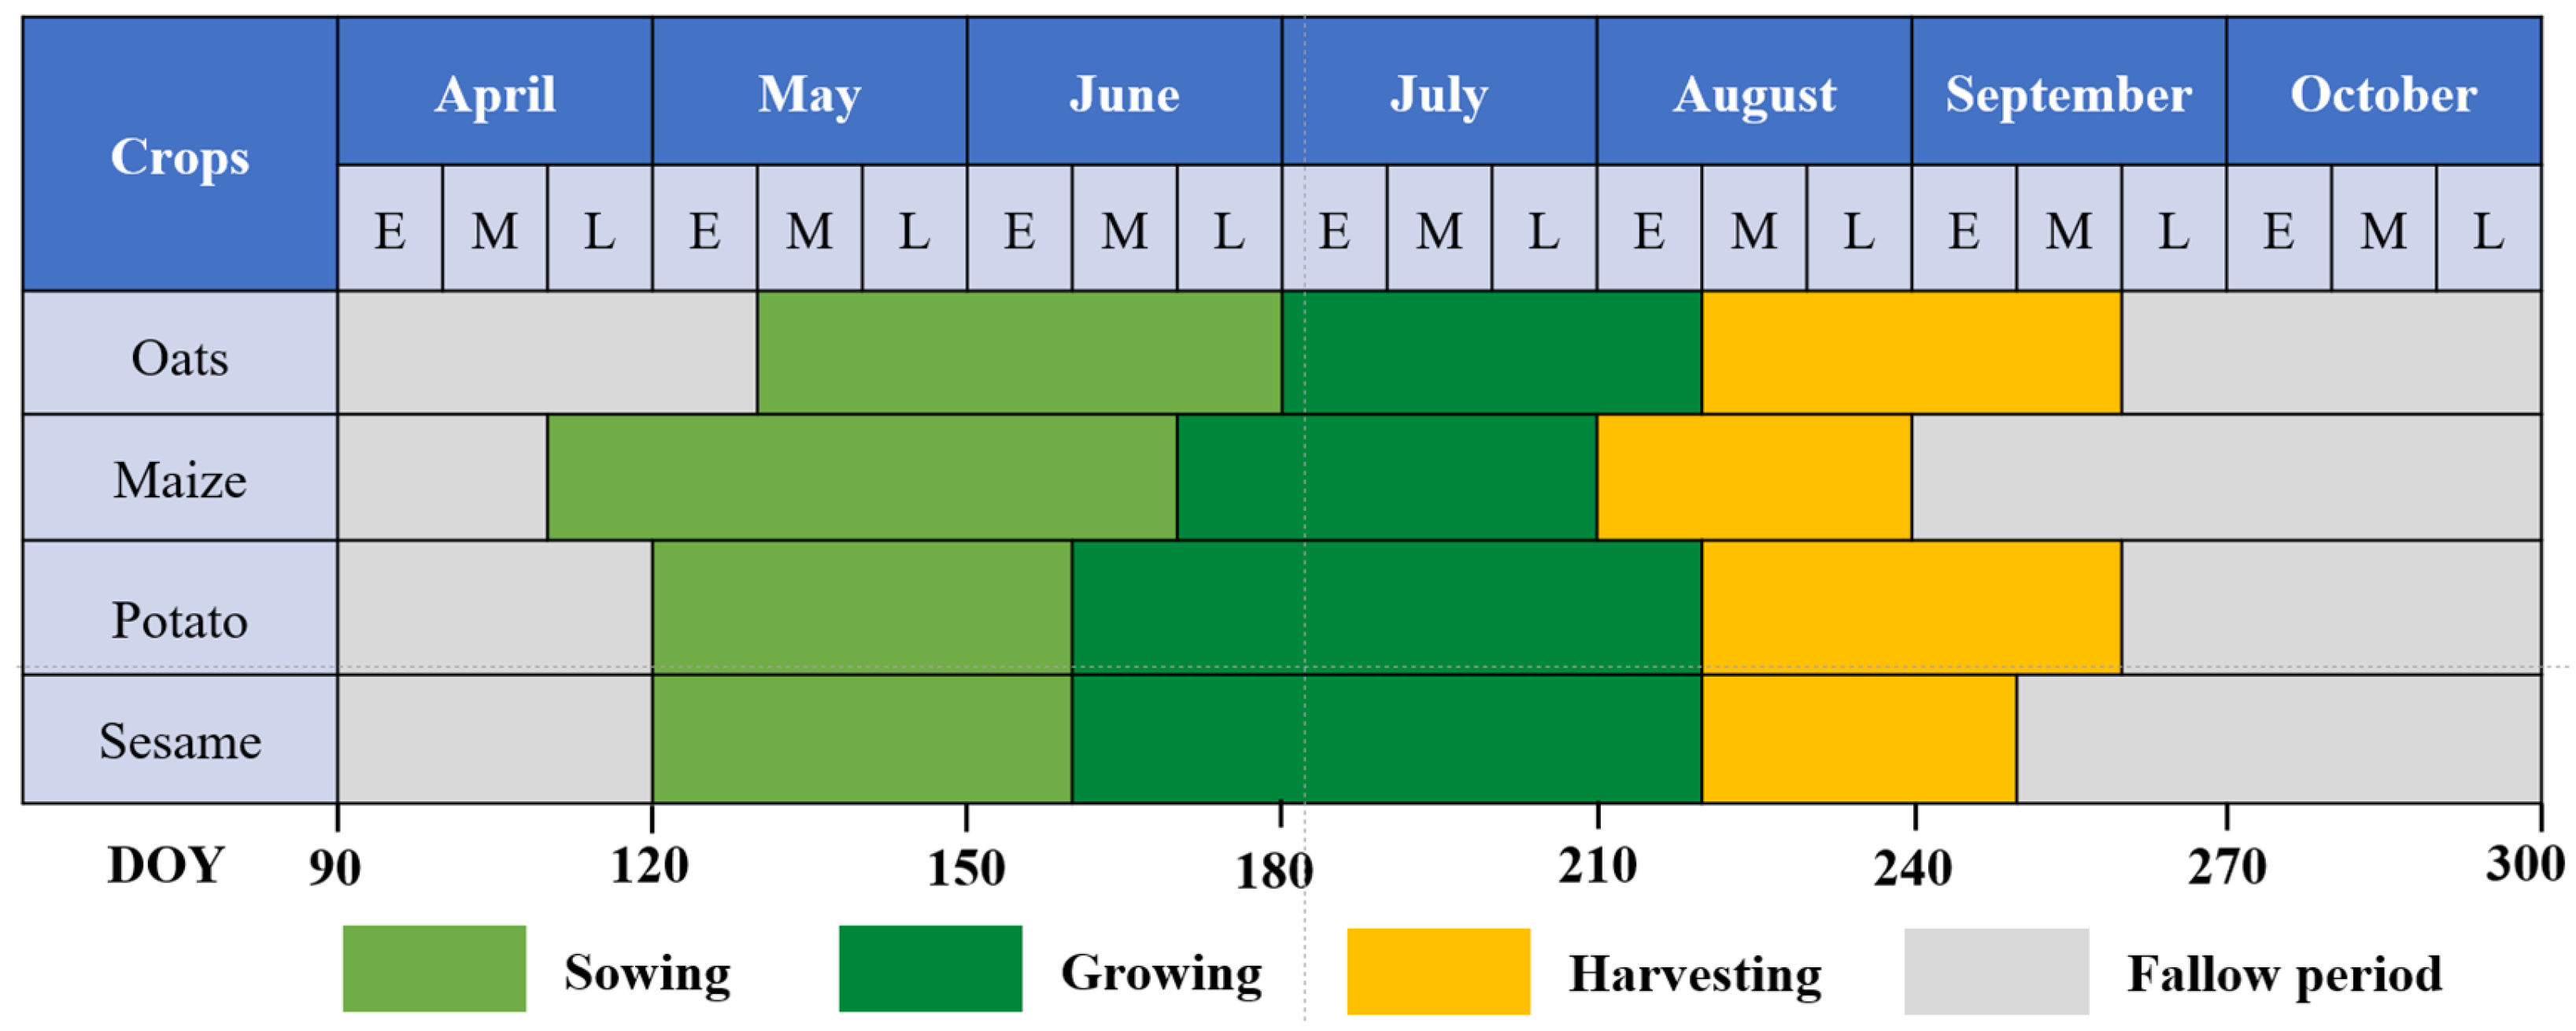
2.2.3. Phenological Data

Distinct phenological profiles across crop types not only serve as critical determinants for optimal satellite data acquisition windows but also form the fundamental basis for constructing crop-specific vegetation index time series [15,43]. Phenological observations from 2019 to 2023 were obtained from China Agrometeorological Station (https://data.cma.cn/). A total of nine agrometeorological stations within or near Zhangjiakou were used, covering diverse altitudes and cropping systems. In this region, oat is typically sown in early to mid-May and harvested in late September, whereas maize cultivation spans early April to early September; potato and sesame share a sowing window in early May but differ in harvest periods—mid-to-late September for potato versus early September for sesame. As seen in Figure 2 and depending on the crop, a considerable amount of time of the growing season is fallow, with potential to be integrated into crop rotation.

2.2.4. Ancillary Data
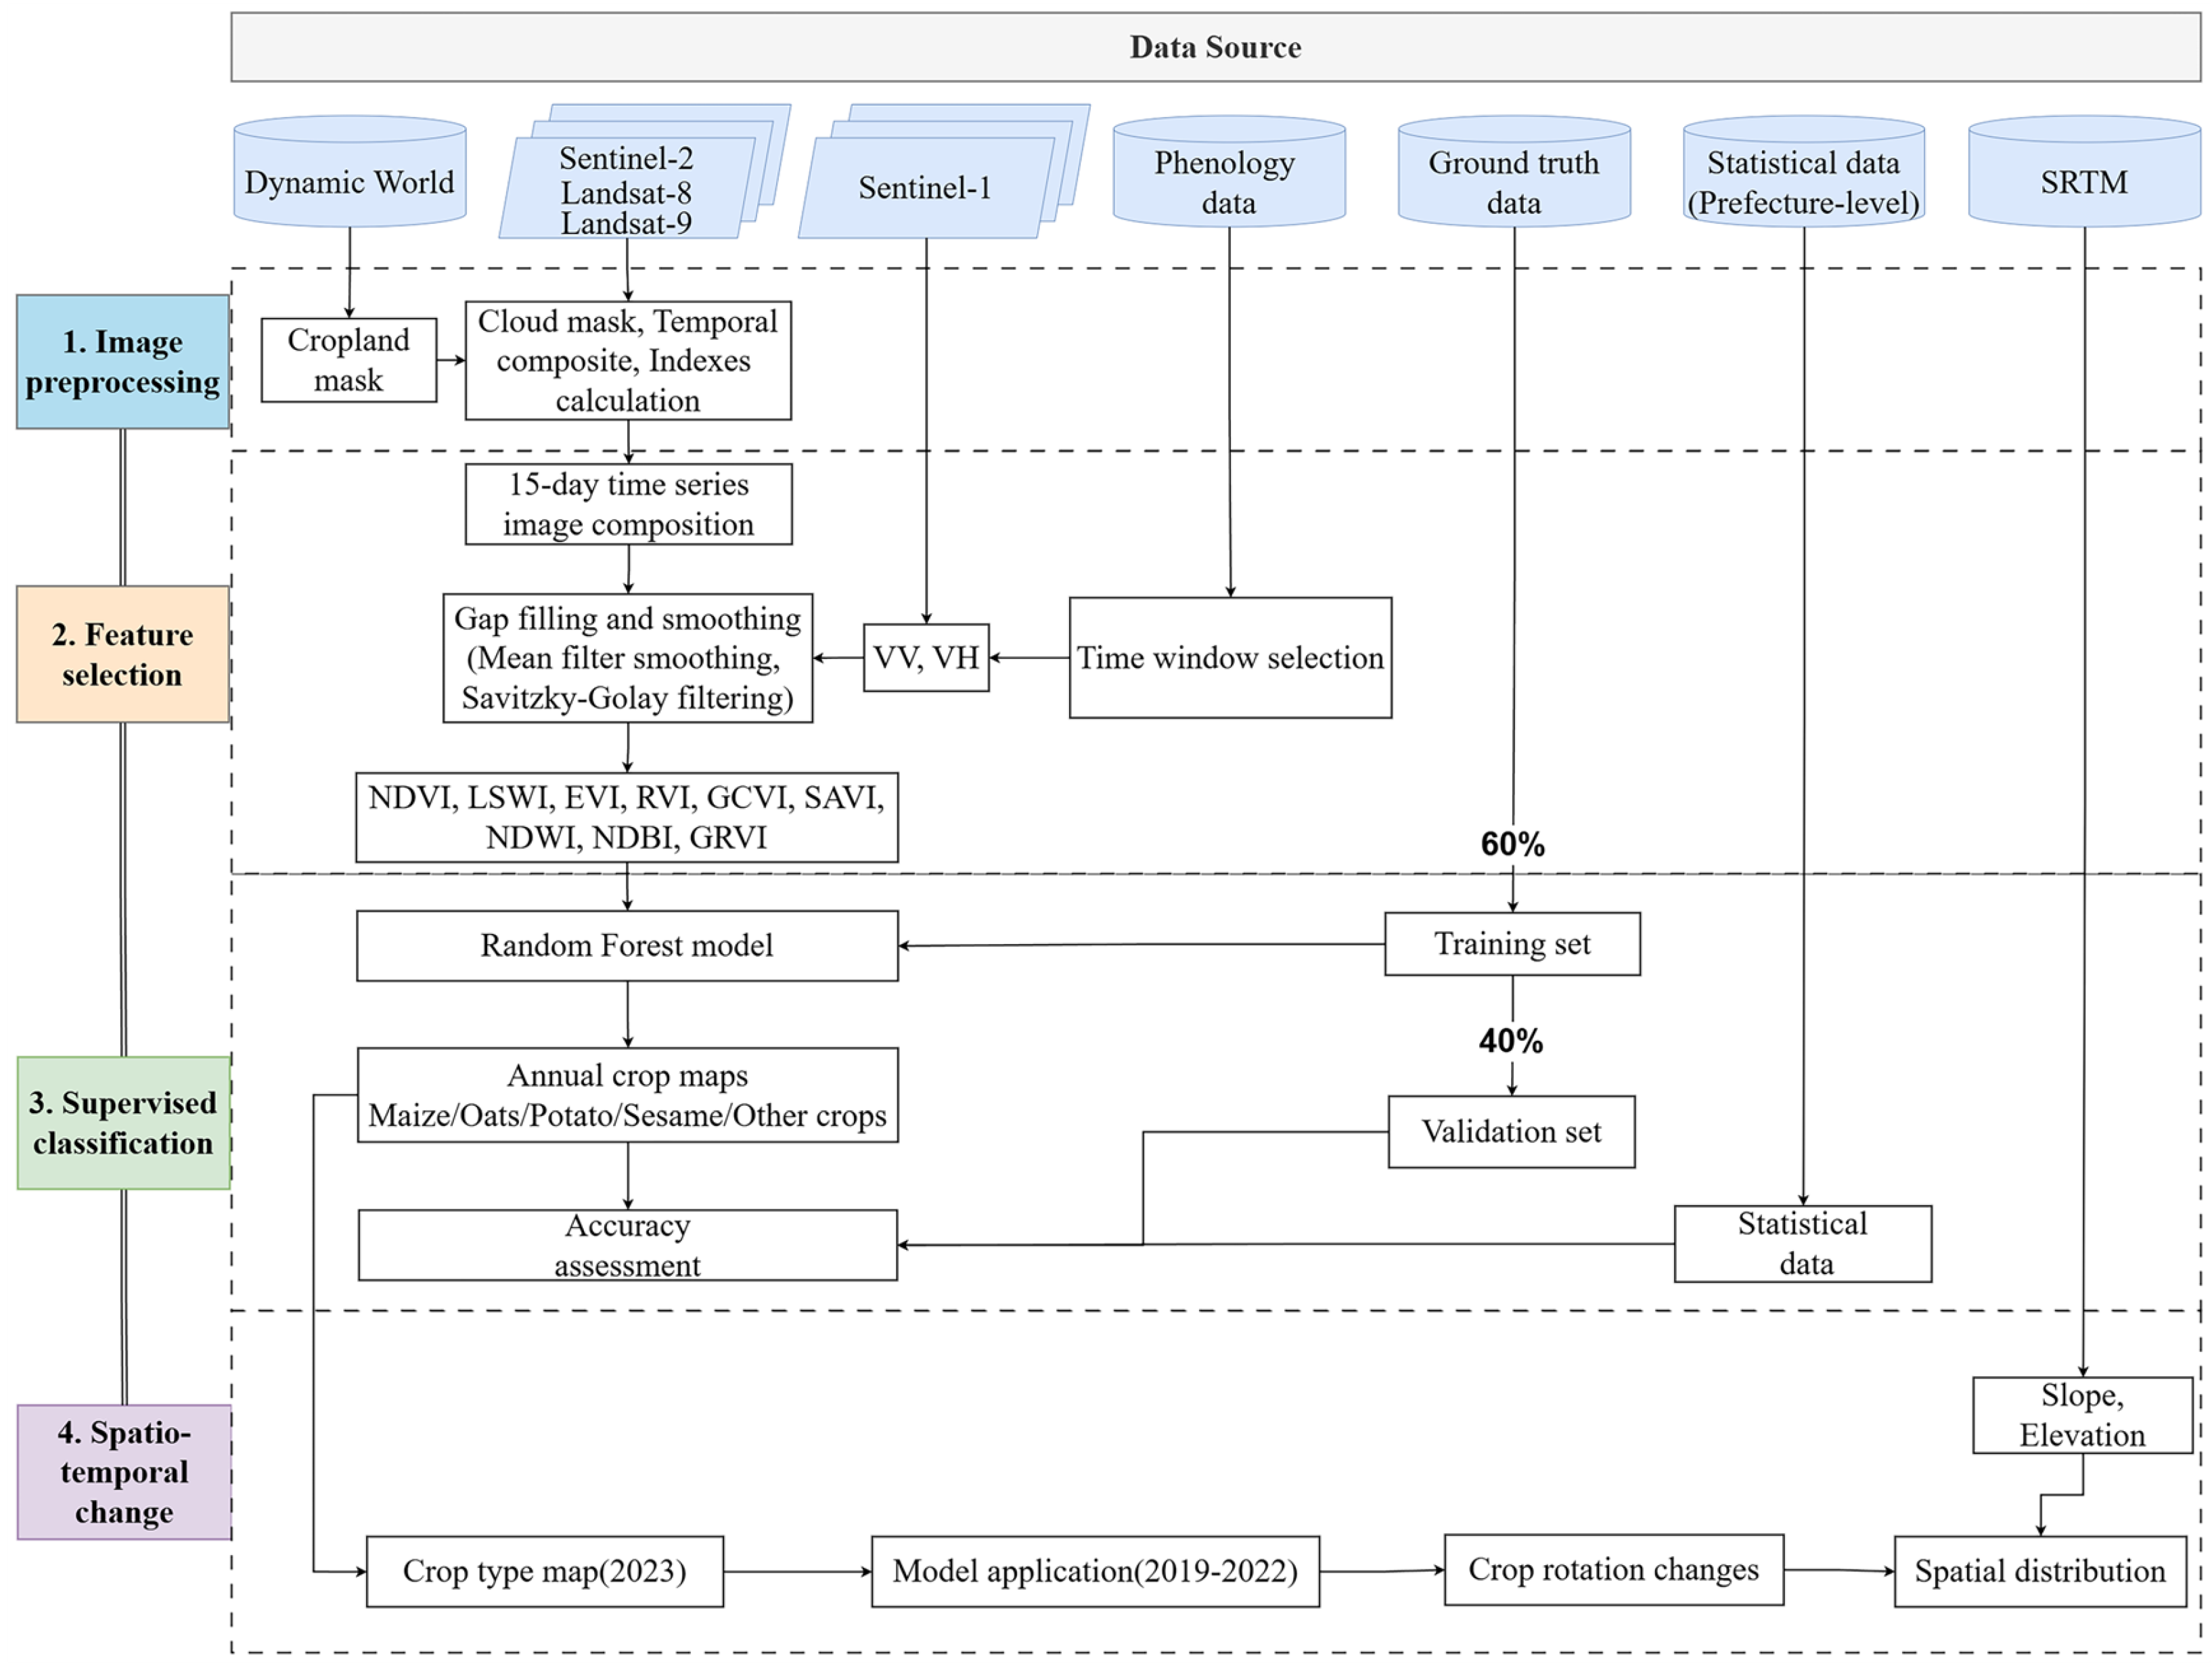
Non-arable land was excluded using the Dynamic World v1.2 dataset from GEE, which provides near-real-time global land cover classification at 10 m resolution based on Sentinel-2 imagery. Among its nine land cover classes, the ‘cultivated terrestrial vegetation’ category was used to extract cropland [44]. The dataset was filtered by study region and date range (January 1 to December 31), and each image was converted to a binary mask, where cropland pixels (label = 4) were assigned a value of 1. These masks were summed to calculate the frequency of cropland classification per pixel. Pixels identified as cropland in at least 60% of valid observations were defined as stable cropland. This threshold was chosen to retain consistently cultivated areas while minimizing the influence of transient vegetation and classification noise. Similar thresholds have been widely adopted in cropland mapping studies, supporting the reliability of this approach [45]. To validate spatial-temporal accuracy, county-level crop area statistics (2019–2022) from the Zhangjiakou Statistical Yearbook were compared against satellite-derived estimates from linear regression analysis. Finally, the morphometric analysis of cultivation patterns was conducted using GEE, quantifying crop distribution dependencies on elevation and slope (Table 1).

3. Methods

The methodological workflow (Figure 3) integrates four synergistic phases:
(1) Image preprocessing. Satellite imagery from Sentinel-2, Landsat-8/9, and Sentinel-1 SAR (2019–2023) was collected. Cropland areas were masked using the Dynamic World dataset to constrain the classification extent. Cloud and shadow masking was applied to optical imagery, followed by atmospheric correction. Vegetation indices (Table 2) were calculated, and SAR data were extracted.
(2) Feature selection. Vegetation index time series were composited at 15-day intervals and smoothed using Savitzky–Golay and mean filtering, followed by least squares fitting to preserve phenological trends. Based on these trends, the optimal classification window (June 15–August 20) was determined by analyzing intercrop separability. Statistical features within this window, along with seasonal SAR backscatter coefficients, were used as classification inputs.
(3) Supervised classification. A Random Forest model was trained using the selected features on the GEE platform. Annual crop-type maps distinguishing maize, oats, potato, sesame, and other crops were generated for 2023, with accuracy assessed through pixel-level confusion matrices and county-level area consistency evaluations.
(4) Spatiotemporal application and analysis. The trained model was retrospectively applied to classify crop distributions for 2019–2022 using the same procedures. Annual crop maps were produced, and interannual rotation dynamics were quantified using pixel-level crop transition matrices. Dominant rotation types were identified based on high-frequency transitions across consecutive years. Sankey diagrams were used to visualize the evolution of rotation trajectories. In addition, spatial distribution analyses related to topographic gradients (elevation and slope) were conducted.
Table 2. Calculation of each remote sensing indicator.
IndicatorsFormulaReference
Normalized Difference Vegetation Index (NDVI) N I R R e d N I R + R e d [46]
Land Surface Water Index (LSWI) N I R S W I R 1 N I R + S W I R 1 [13]
Enhanced Vegetation Index (EVI) 2.5 N I R R e d N I R + 6 R e d 7.5 B l u e + 1 [47]
Ratio Vegetation Index (RVI) N I R R e d [48]
Green Chlorophyll Vegetation Index (GCVI) N I R G r e e n 1 [49]
Soil-Adjusted Vegetation Index (SAVI)
Normalized
N I R R e d N I R + R e d + 0.5 × 1.5 [17]
Normalized Difference Built-up Index (NDBI) S W I R 1 N I R S W I R 1 + N I R [50]
Green Ratio Vegetation Index (GRVI) G r e e n R e d G r e e n + R e d [51]
Normalized Difference Water Index (NDWI) G r e e n N I R G r e e n + N I R [52]
Figure 3. Flowchart of the proposed method for crop-type mapping. Satellite data were sourced for 2019–2023. Ground truth data were sourced in 2023.
Remotesensing 17 01707 g003

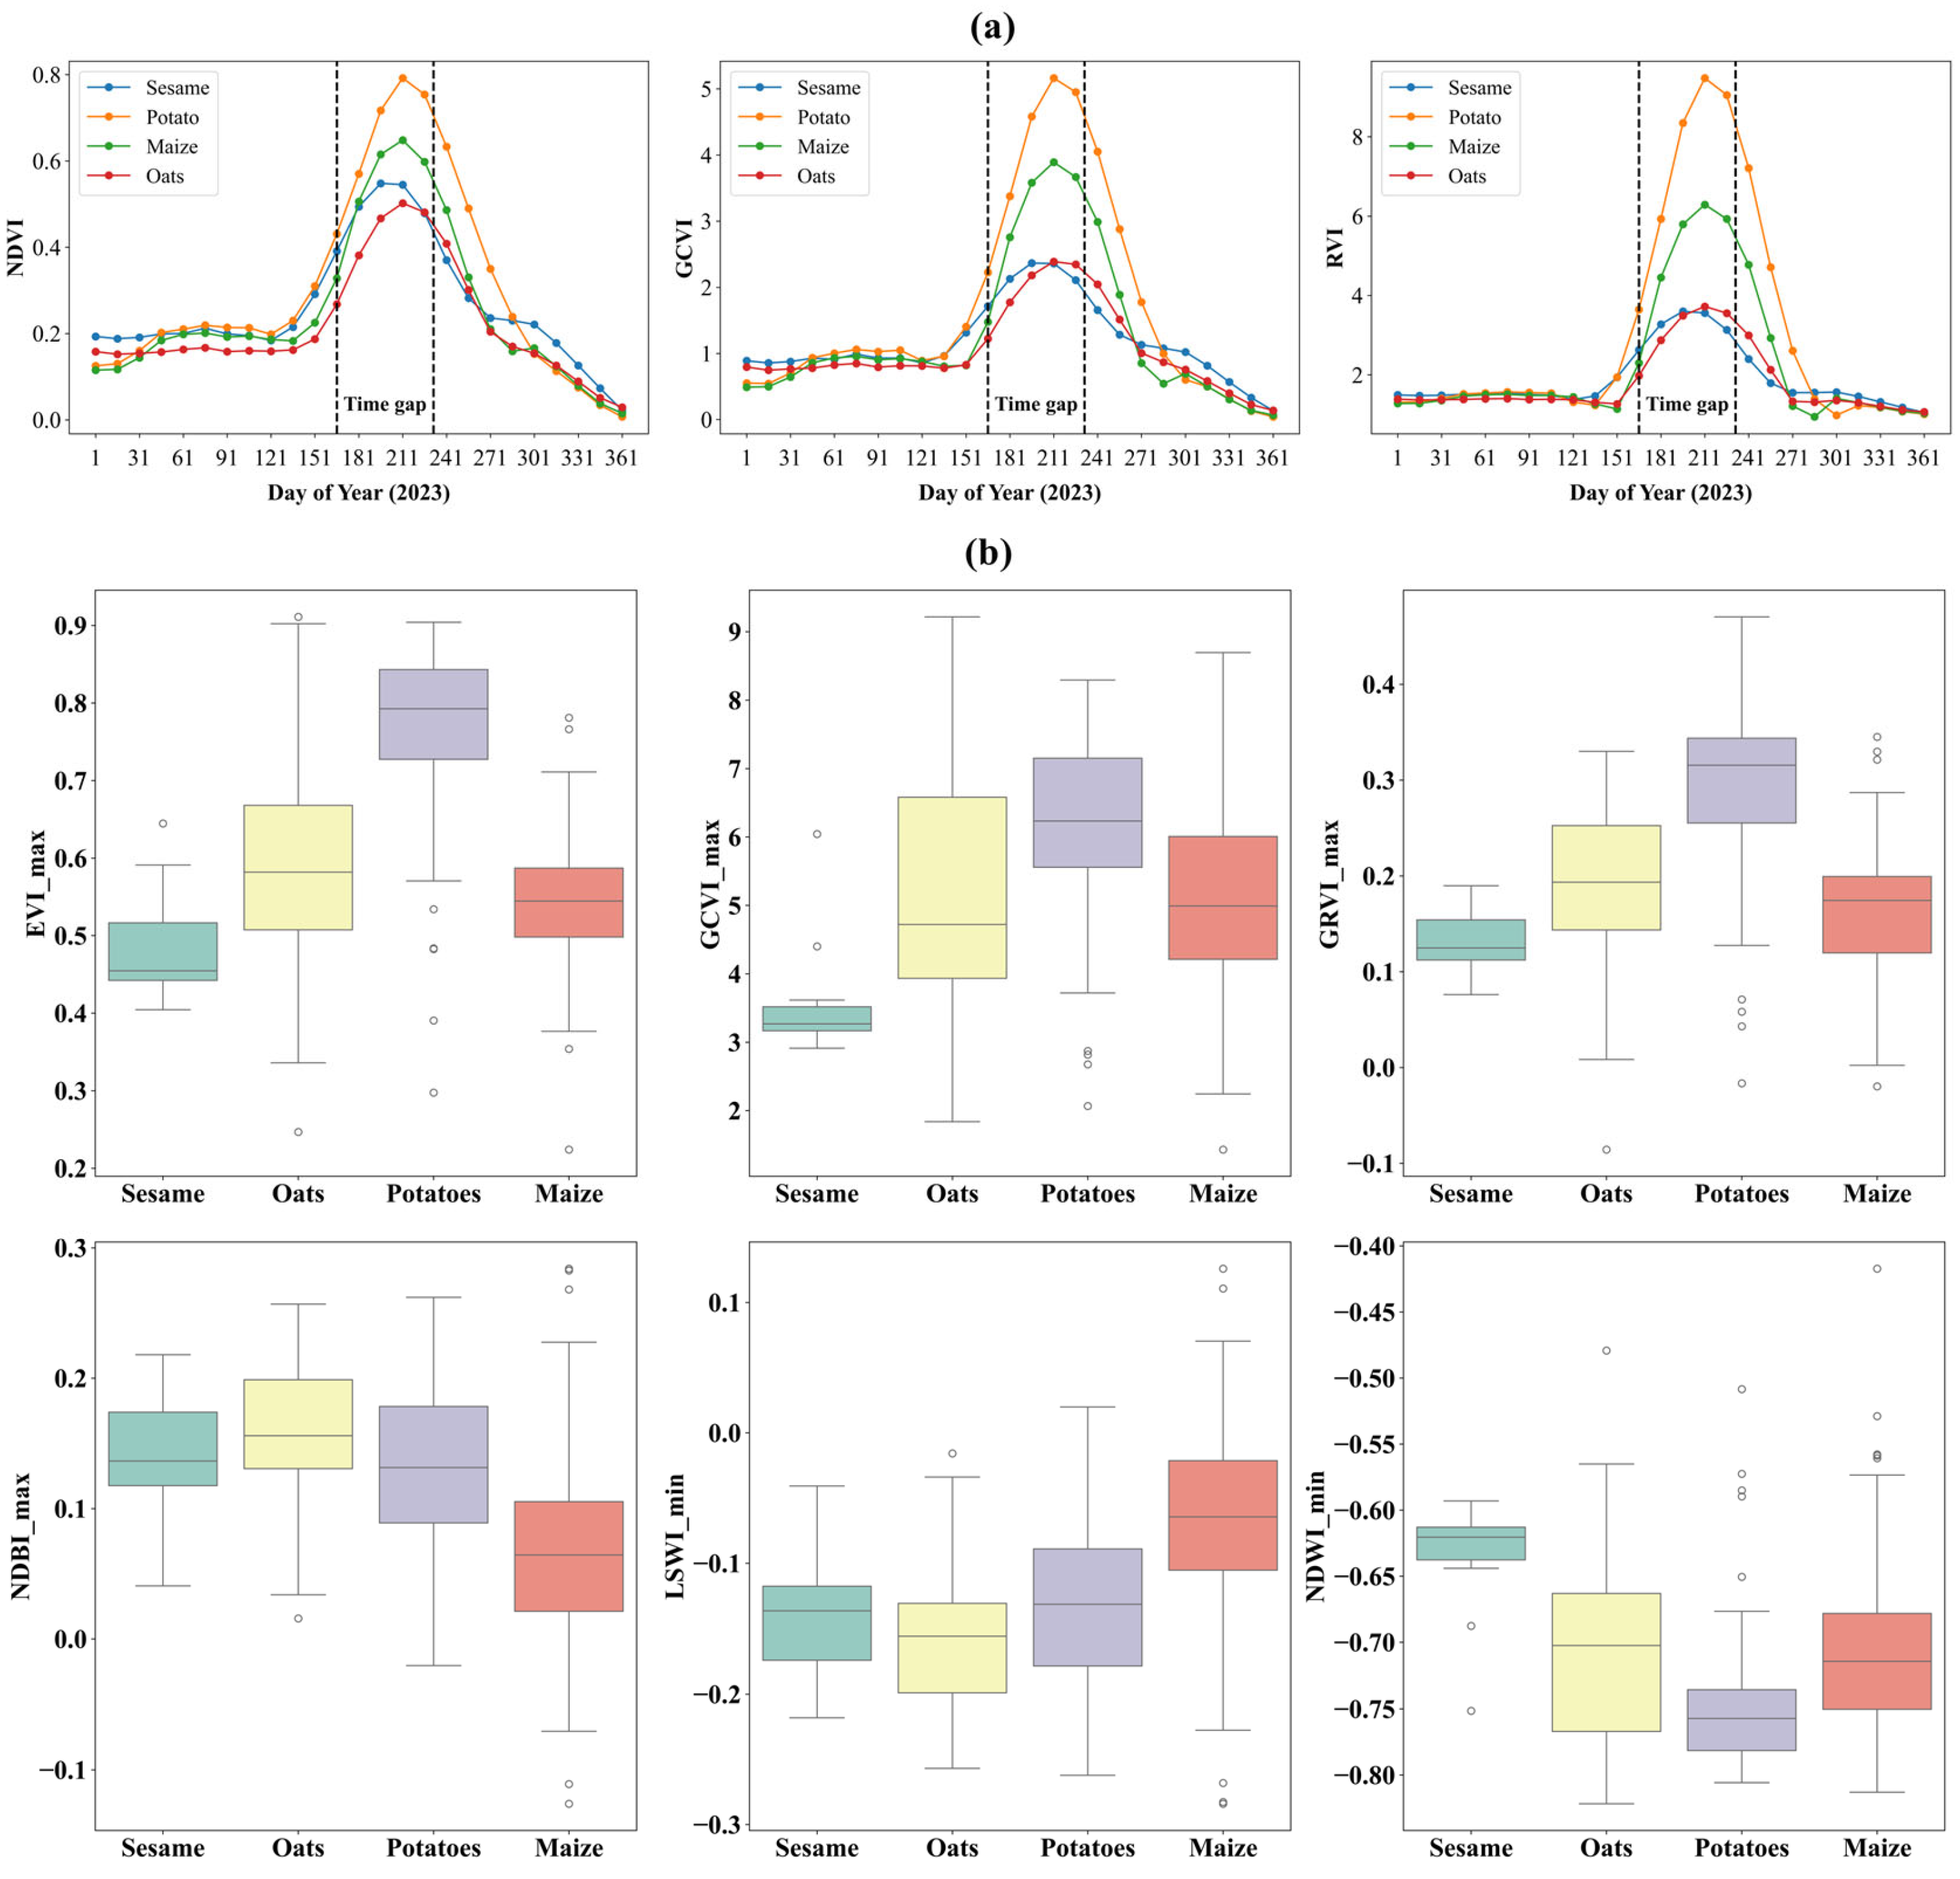
3.1. Construction of Vegetation Index Curves of Crops

Vegetation indices are widely used for the qualitative assessment of vegetation coverage and growth status and have become important indicators for crop monitoring. In this study, the average values of NDVI, EVI, GCVI, LSWI, NDWI, SAVI, RVI, NDBI, and GRVI during the growing season were selected for classifying the major crop types in the study area. The calculation formulas for each vegetation index are provided in Table 2.
Each crop type has a specific planting pattern and growth curve characteristics, which can be identified using remote sensing time-series imagery [25,52]. To address cloud contamination and irregular observation frequency [53], we employed temporal image compositing at 15-day intervals. Spectral indices derived from fused Landsat 8/9 and Sentinel-2 data were aggregated by calculating the mean value of all valid observations within each 15-day window, generating continuous time-series data. The Savitzky–Golay filter, proven effective for time-series reconstruction in complex terrain [11,13], was applied to smooth phenological curves. We employed linear least squares to fit a low-order (second-order) polynomial within a moving window (size = 9), effectively eliminating noise while preserving phenological trends [54].
The vegetation index time series highlighted distinct growth patterns and key phenological stages corresponding to specific image acquisition dates (Figure 4 and Figure 5). We identified June 15 to August 20 as the optimal classification window (Figure 5a), coinciding with peak developmental stages, when intercrop spectral differences become most pronounced. Based on this time window, we further selected vegetation index statistical features with strong separability (Figure 5b) to reduce the number of input features, thereby improving the computational efficiency and learning capability of the classifier. Meanwhile, to complement optical data limitations, SAR image composites were generated at three-month intervals across four phenologically distinct periods: January–March (dormant season), April–June (emergence phase), July–September (peak growth), and October–December (senescence stage). This multi-temporal SAR synthesis captured structural variations during critical growth transitions, particularly useful for cloud-prone regions.

3.2. Crop-Type Mapping Algorithms and Parameter Setting

Random Forest (RF), introduced in 2001, combines the bagging ensemble learning theory with the random subset method, making it a powerful and stable classifier [55,56]. RF has been widely applied in agricultural remote sensing for various crop classifications due to its strong generalization ability, resistance to overfitting, and capacity to handle high-dimensional, heterogeneous feature sets [57,58]. In this study, preliminary comparative experiments indicated that Support Vector Machine and Decision Tree classifiers yielded lower overall classification accuracies and less spatial stability across years compared to RF. Given these findings, RF was selected as the final classification algorithm to ensure higher accuracy, stability, and operational efficiency for crop mapping on the GEE platform. The number of trees was set to 100, while all other hyperparameters were maintained at default values [59].

3.3. Accuracy Assessment

This study evaluated crop distribution at both the pixel and county levels. At the pixel level, accuracy assessment was performed using a confusion matrix, with evaluation metrics, including User Accuracy, Producer Accuracy, overall accuracy, Kappa coefficient, and F1 score [60,61].
At the county level, the extracted areas were compared with statistical data. The evaluation was performed using the coefficient of determination (R2) and root mean square error (RMSE), with the following formulas:
R 2 = 1 i = 1 n   y i y ^ i 2 i = 1 n   y i y ¯ i 2
RMSE = i = 1 n   y i y ^ i 2 n
where y i and y ^ i represent the crop planting area statistical data and the extracted crop area for the i county, respectively. y ¯ i is the average statistical area, and n is the total number of counties.

4. Results

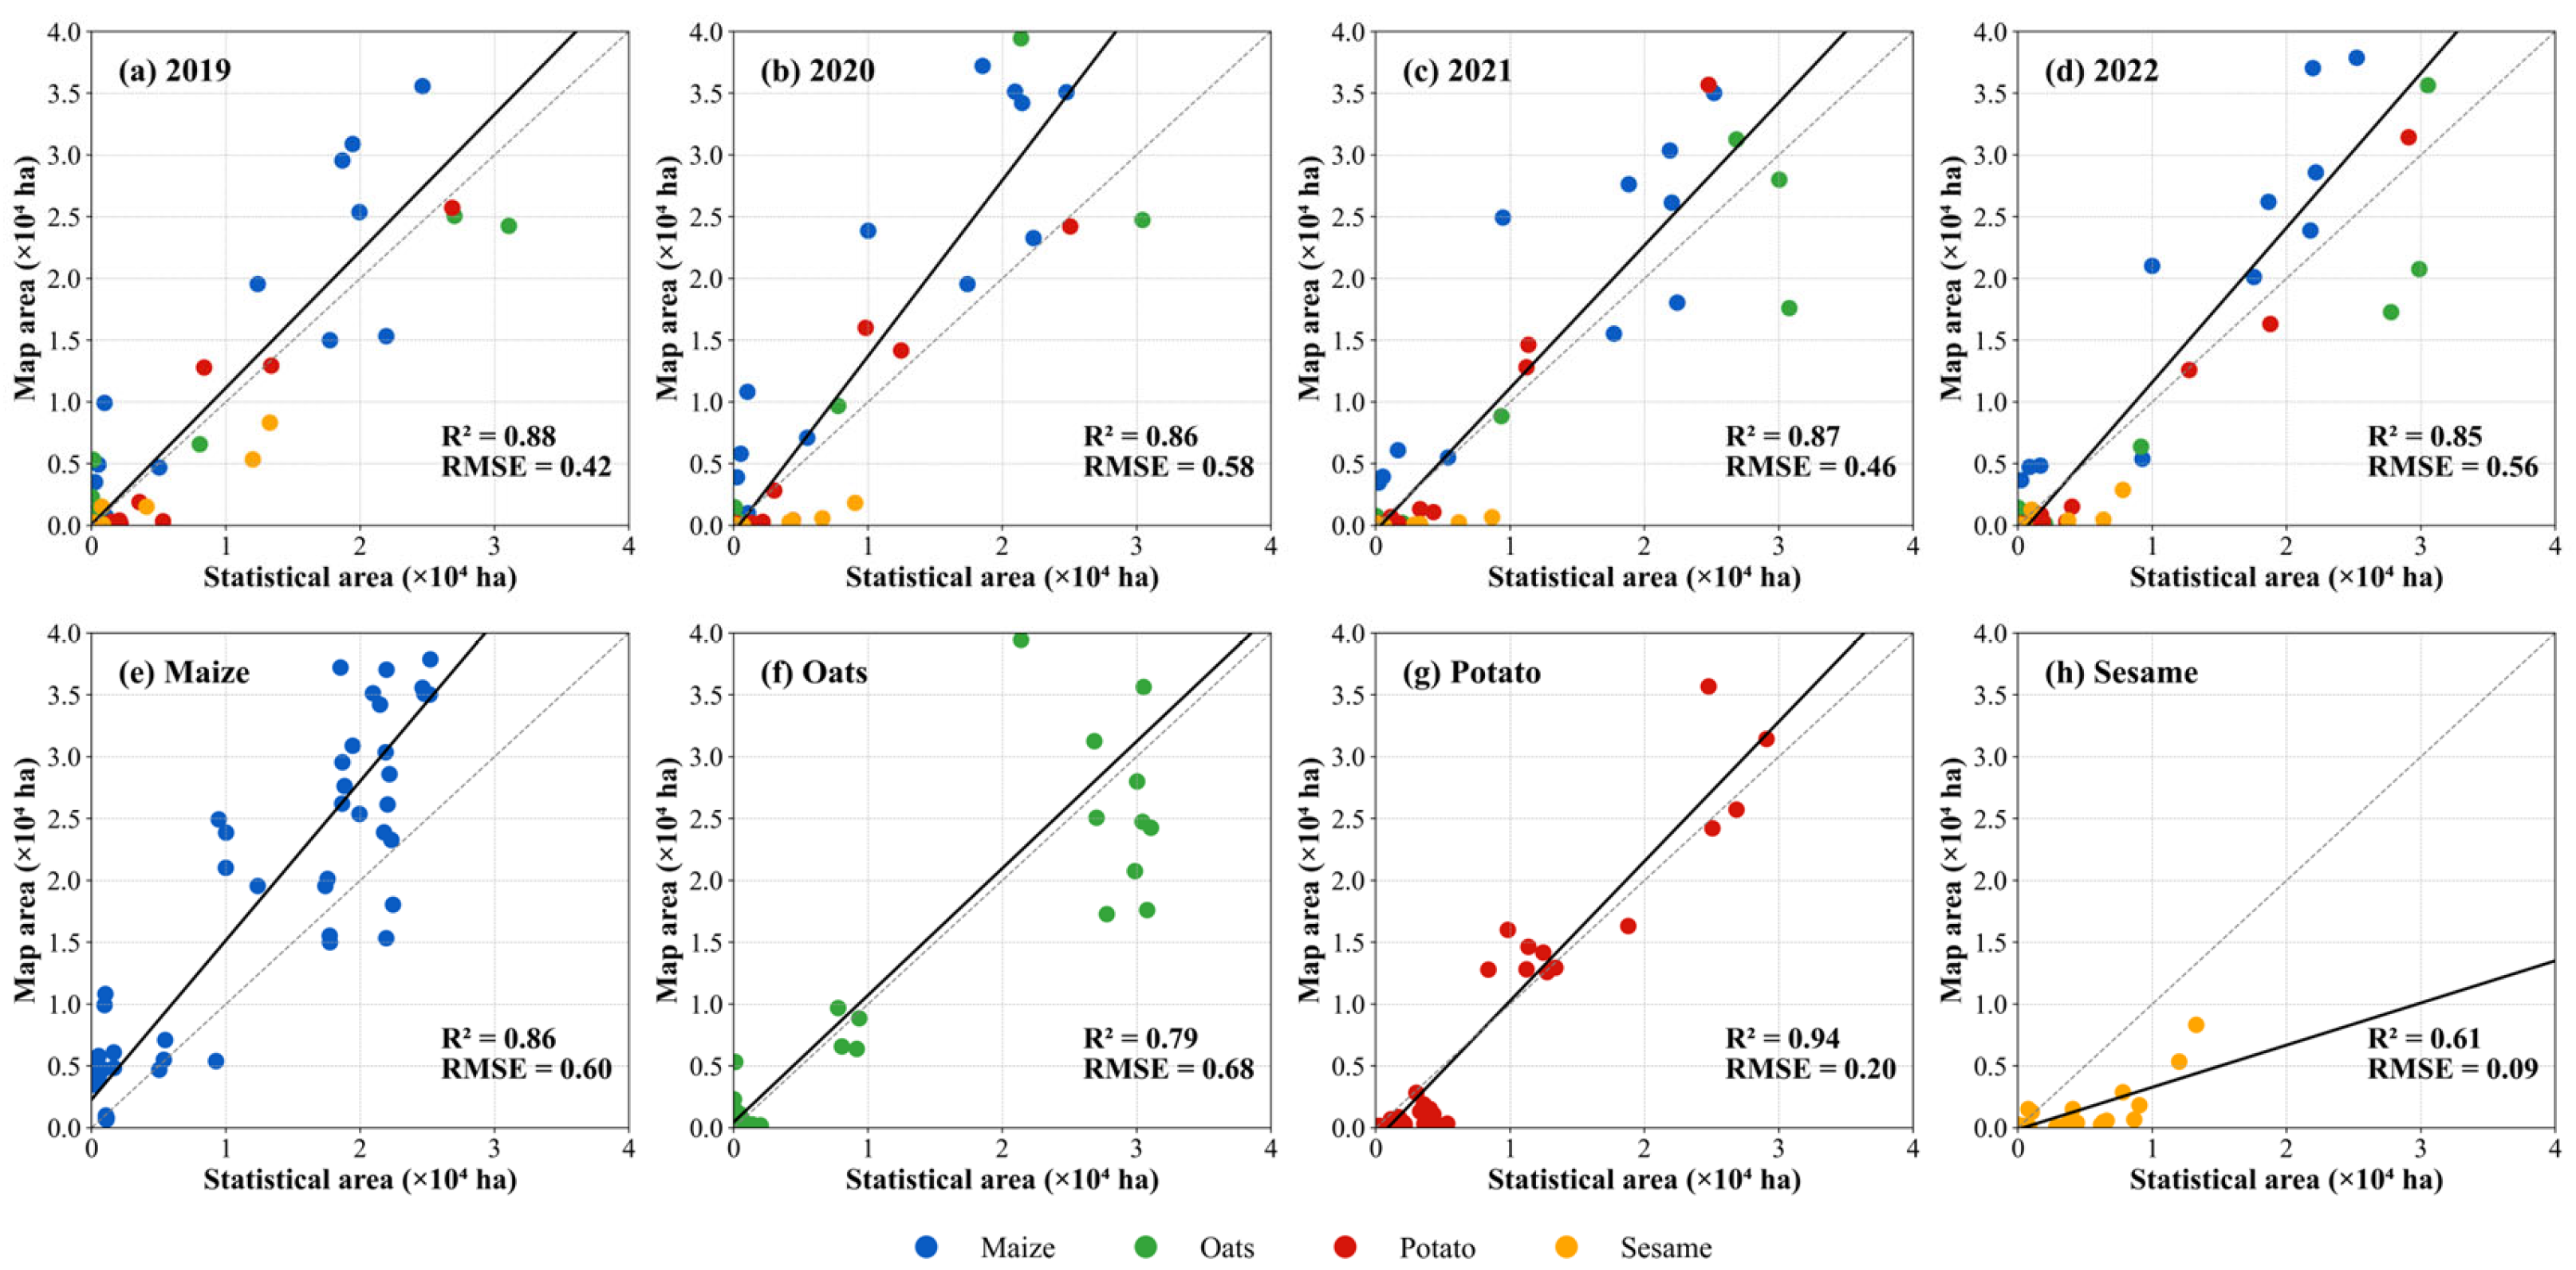
4.1. Classification Accuracy

The RF classification achieved an overall accuracy of 97.35% with a Kappa coefficient of 0.95 in 2023. Similarly, both the overall accuracy and Kappa coefficient exceeded 0.90 in 2021 and 2022, highlighting the model’s robust and reliable performance across years (Table 3). The scatter plots comparing mapped and statistical areas from 2019 to 2022 show R2 values ranging from 0.85 to 0.88 and RMSE values between 0.42 and 0.58 ha (Figure 6a–d), demonstrating strong agreement between predictions and statistical data. Crop-specific regression analysis yielded R2 of 0.86, 0.79, 0.94, and 0.61 for maize, oats, potato, and sesame, respectively (Figure 6e–h), with potato exhibiting the highest prediction accuracy and sesame showing a slightly lower fit, likely due to its smaller cultivation areas and fragmented planting patterns. Overall, RF demonstrated strong predictive capability, proving the effectiveness and accuracy of this model for crop distribution monitoring.
The spatiotemporal analysis of crop distribution patterns (2019–2023) revealed distinct agricultural zoning in Zhangjiakou (Figure 7). Aside from “other crops”, maize was the most widely planted crop, followed by oats, potato, and sesame. Maize was primarily distributed in the southern districts of Zhangjiakou, such as Zhuolu, Yuxian, Yangyuan, Xuanhua, Wanquan, Qiaoxi, and Huaian, and its proportion was 31% in 2019, peaked at 35.6% in 2020, and then decreased to 30% in 2023. Oats, potato, and sesame were mainly planted in the northern districts, including Kangbao, Guyuan, Shangyi, and Zhangbei, Oat proportion was 10% in 2019, reached 12.3% in 2020, dropped to 7.1% in 2022, and increased to 12.8% in 2023. The proportion of potato increased from 4.8% to 5.2%, with the largest planted area in 2021 at 7.3%. Sesame showed a continuous decline, decreasing from 1.6 to 0.4%. “Other crops”, primarily vegetables, were mainly distributed in the northern districts but also grew in other regions. Their proportion decreased slightly from 52.7% in 2019 to 52% in 2023. Interannual analysis revealed significant variability in the area proportions of each crop. Two distinct trends emerged: (1) gradual crop diversification in the northern highlands, and (2) stabilized planting patterns in the southern regions.

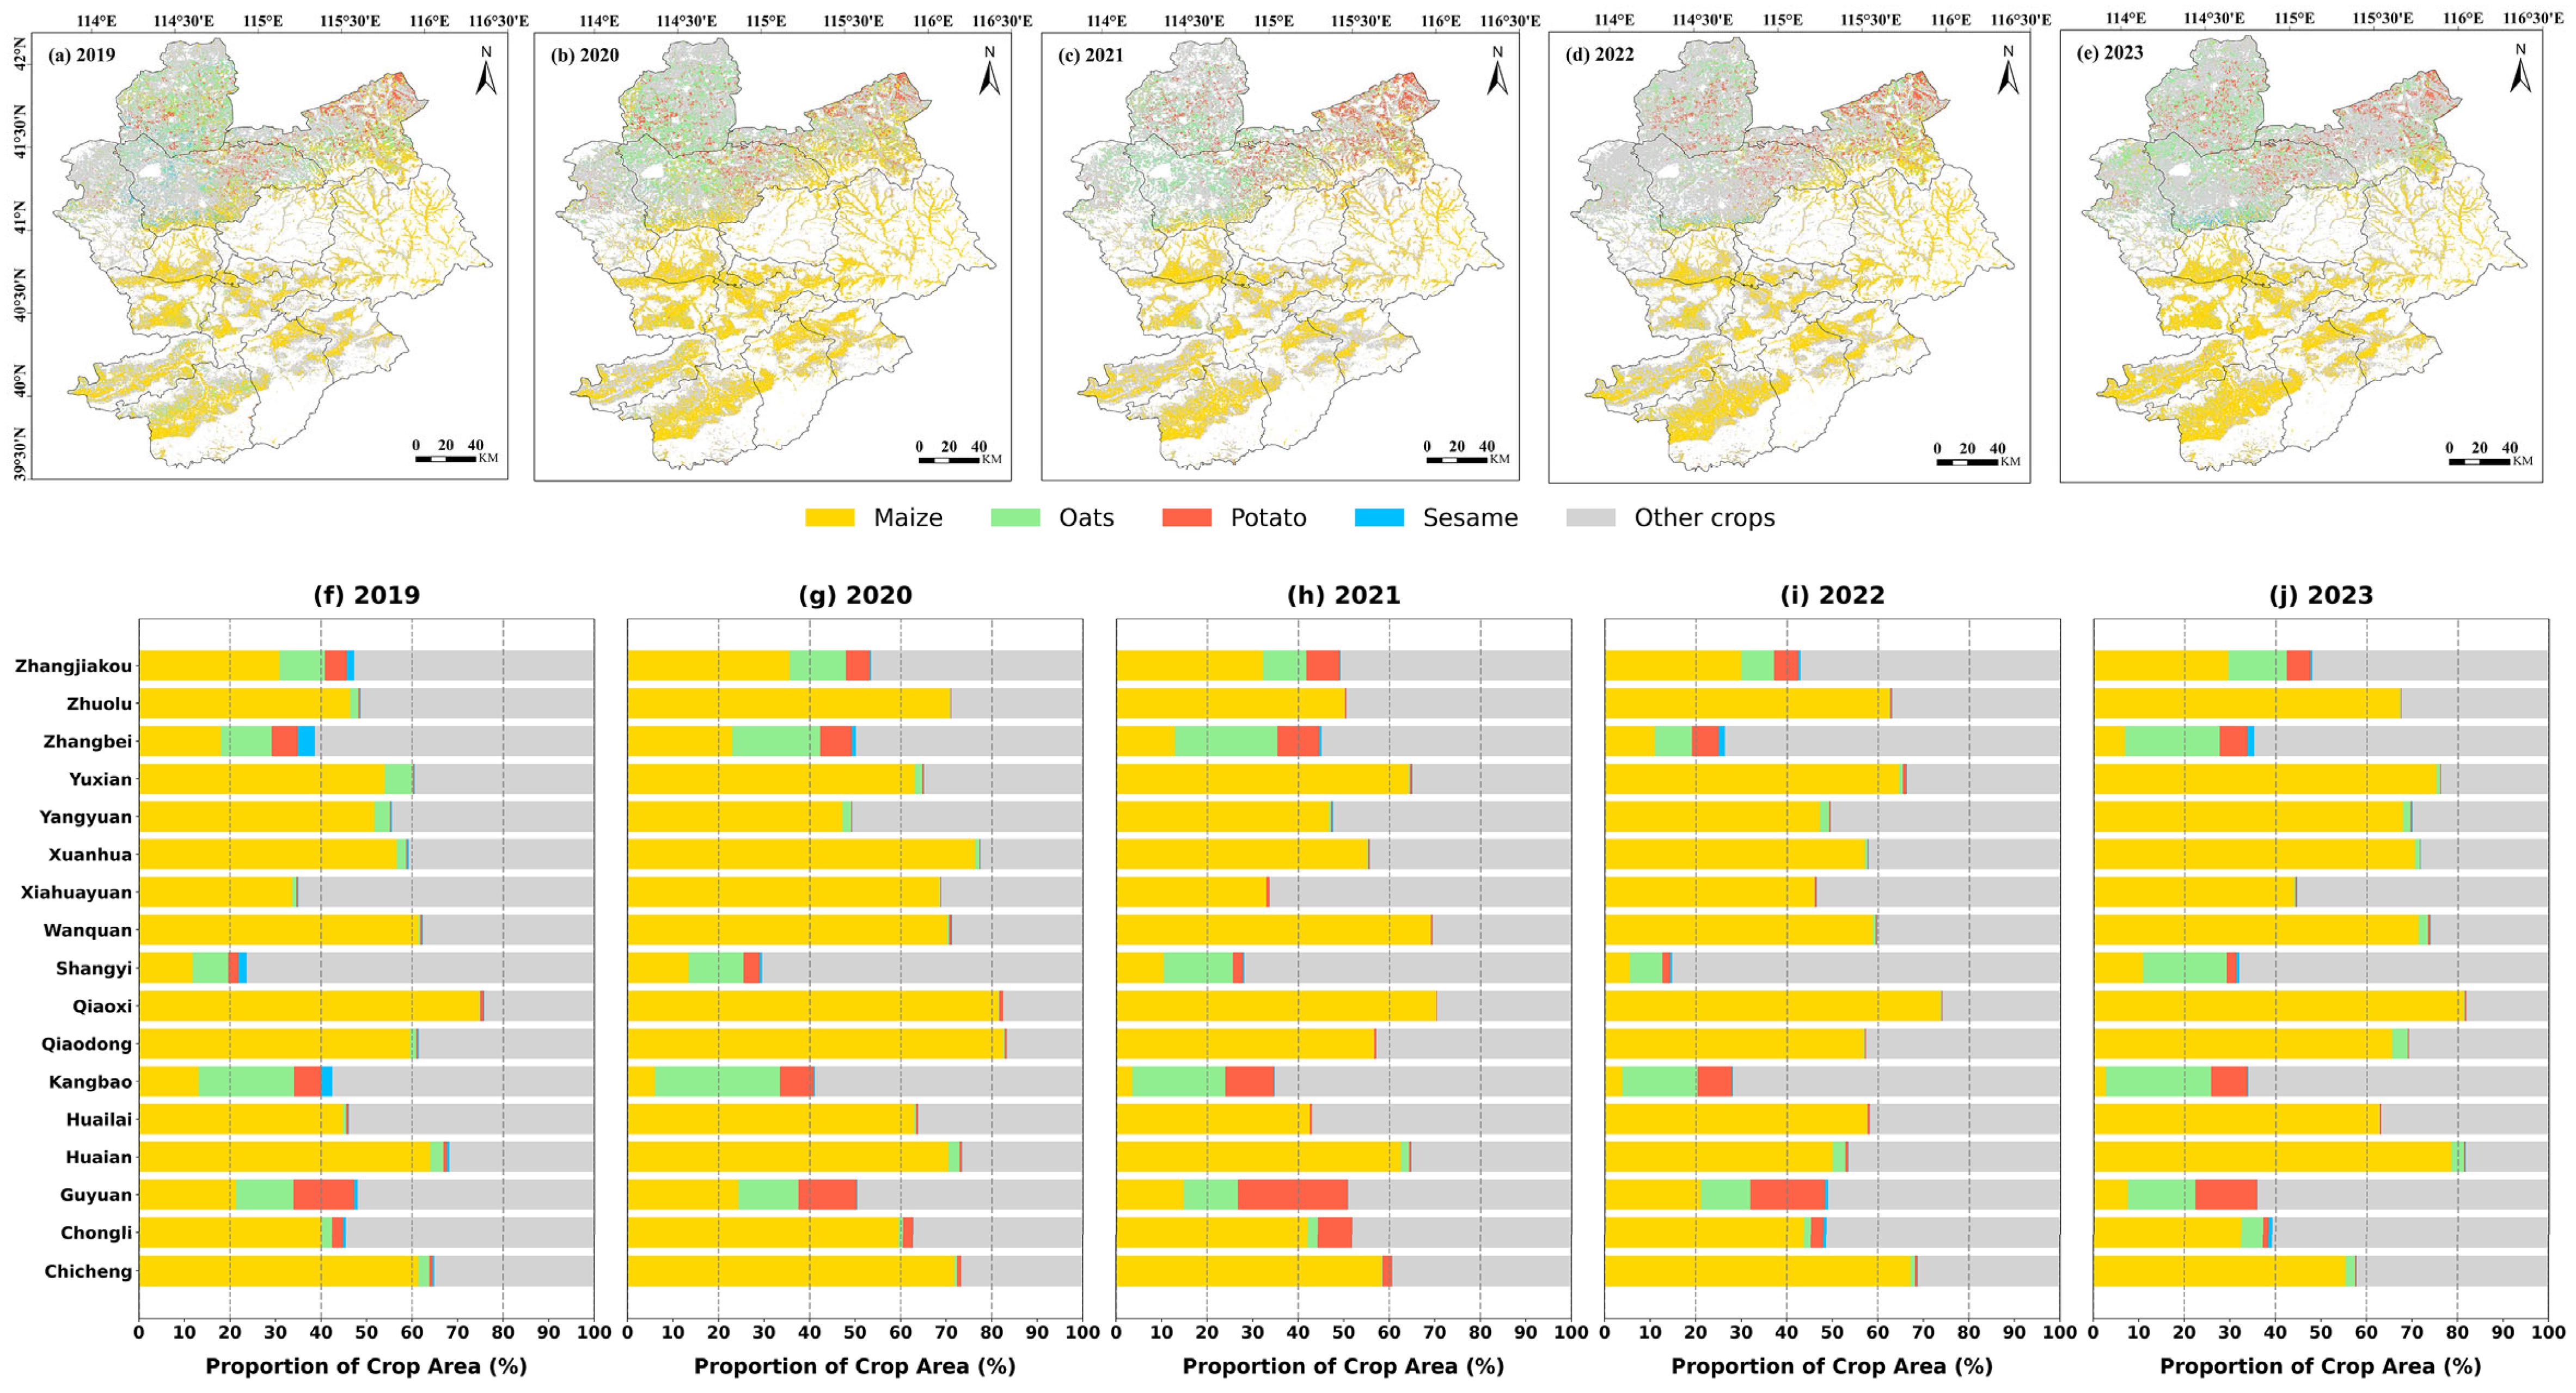
4.2. Crop Distribution Patterns in Relation to Elevation and Slope

From Figure 8, maize, potato, and sesame were primarily distributed in lower-elevation regions, especially between 470 and 520 m. Conversely, oat and other crops had a wider distribution range, with a substantial planting area still present at 520 to 600 m, showing greater adaptability. Overall, elevations from 470 to 600 m were the dominant growth zone for most crops. In terms of slope preferences, maize, potato, and oat were mainly concentrated at 0–5°, indicating these crops were well suited to relatively flat terrain. Conversely, sesame and other crops demonstrated adaptability to steeper slopes, with significant cultivation extending to areas of 4–10°. Thus, crop distribution patterns in Zhangjiakou closely corresponded to specific elevation and slope conditions, reflecting the adaptability of crops to local topographical characteristics.

4.3. Analysis of Crop Rotation

Crop rotation dynamics in Zhangjiakou demonstrated a clear dual pattern of both persistence and diversification (Figure 9 and Table 4). For instance, potato fields exhibit significant variation in rotation patterns. On average, 31.44% and 41.42% of potato fields were rotated with potato and other crops in the following year. Specifically, the rotation proportions for potato–oats, potato–maize, and potato–sesame are 10.63%, 14.89%, and 1.61%, respectively. From 2019 to 2023, the dominate crop rotation patterns included other crops–other crops (76.81%), maize–maize (72.82%), sesame–other crops (58.02%), oats–other crops (41.65%), and potato–other crops (41.42%). Additionally, the area proportions of oats, potato, and other crops fluctuated considerably over the years.
These findings indicate that crop rotation patterns in Zhangjiakou exhibit a high degree of stability, particularly the “other crops-other crops” and “maize-maize” rotations, which occupy a large proportion of the total area. Conversely, potato rotation patterns are more diverse, especially the rotations with oats, maize, and sesame, highlighting the diversity and flexibility of the region’s crop planting structure.

5. Discussion

5.1. Factor Analysis of Changes in Crop Rotation Patterns

The analysis of cropping patterns for sesame, oats, and potato from 2019 to 2023 revealed that crop rotation comprised a higher proportion of the planting system than monocropping, with maize predominantly grown as a monocrop and significant annual variations in crop area proportions (Figure 7, Figure 8 and Figure 9). The underlying reasons can be attributed to several factors:
Groundwater over-extraction and irrigation water scarcity in the FPEC significantly influence crop planting patterns, particularly in northern Zhangjiakou. The region’s arid conditions compel farmers to adopt crop rotation strategies as an effective means to optimize limited water resources and enhance soil moisture retention and fertility. Consequently, crop rotation emerges as an essential practice to alleviate pressure on scarce water resources and sustain long-term agricultural productivity. Additionally, crop rotation helps prevent soil degradation and nutrient depletion, which are prevalent issues in continuous monoculture systems, thus contributing to long-term agricultural stability [62].
Economic factors, including market supply and demand, crop prices, and profitability, directly influence farmers’ planting decisions. For example, in regions such as Kangbao, Guyuan, and Zhangbei, farmers frequently shift from staple crops (potato, maize, oats, and sesame) to economically profitable vegetables (cabbage, celery, beans, zucchini, peppers, onions) based on market-driven incentives [33,63]. The higher demand and more favorable prices of vegetables stimulate substantial annual fluctuations in cropping patterns, especially influencing the proportion of oats, potato, and other crops. Furthermore, initiatives by the Chinese Government aimed at improving water conservation and irrigation efficiency have further reshaped regional cropping structures. The introduction of advanced irrigation infrastructure in the FPEC has effectively expanded arable land areas, consequently altering spatial-temporal cropping distributions. Additionally, municipal initiatives positioning Zhangjiakou as China’s potato capital, with an emphasis on potato-based staple foods, have encouraged local farmers to expand cultivation areas for potato and oats.
Continuous cropping barriers constitute another critical consideration influencing planting decisions. The practice of continuous monoculture poses considerable threats to agricultural sustainability, such as nutrient depletion, increased susceptibility to drought conditions, soil degradation, and imbalanced soil microbial communities. In particular, continuous potato cropping has been associated with heightened disease prevalence in this region. To mitigate these negative impacts, farmers widely implement crop rotation to restore soil nutrients, control pests and diseases, and minimize production risks [64]. The high-resolution crop maps and rotation analyses produced in this study can directly support agricultural management. We recommend targeted rotations, such as oats–vegetables, maize–potato, oats–potato, and sesame–potato, in Zhangjiakou. Rotations combining deep-rooted and shallow-rooted crops improve soil moisture, nutrient cycling, and overall soil structure. By revealing precise crop distributions and rotation cycles, local governments can optimize water and fertilizer allocation and formulate informed rotation recommendations aligned with local climatic and soil conditions.

5.2. Innovations in Multi-Sensor Mapping of Crop Distribution in the FPEC

Extensive evidence supports that multi-source data fusion significantly improves crop classification accuracy, particularly in fragmented agricultural regions [12,65]. In China, smallholder farming systems with highly fragmented fields often lead to mixed classifications when using moderate-resolution imagery alone. Our study addresses this challenge by integrating SAR and optical data and optimizing phenological separability to achieve accurate crop-type mapping in a topographically complex zone. Our methodological framework innovatively combines three key components: (1) temporal optimization of optical features through fused Sentinel-2 and Landsat 8/9 time series, (2) strategic selection of phenological separation windows based on crop calendar analysis, and (3) incorporation of Sentinel-1 dual-polarization (VV/VH) time sequences at quarterly temporal resolution. The results indicate that Sentinel-1 backscatter from July to September served as a stable and discriminative input for improving crop classification performance (Figure 10). This multi-sensor integration approach achieves 10 m resolution crop mapping from 2019 to 2023, offering a transferable and effective solution tailored for smallholder agricultural landscapes.
Compared with existing studies, our approach exhibits several notable advances. While previous studies achieved 10 m resolution maize maps [66] but largely focused on a single crop, in contrast, our study captures multi-crop and rotation-specific dynamics and provides finer-scale, higher-accuracy classification tailored to the FPEC, which presents considerable challenges, including field fragmentation, phenological overlap, and intra-class variability. Similar studies in Southern China (e.g., rice intensification monitoring [31]) or the North China Plain (winter wheat–summer maize rotation [29,30]) achieved promising results, yet often neglected complex multi-cropping regimes or key economic crops (potato, oats, sesame) that are regionally important. In addition, recent efforts using deep learning [36] or transfer learning [34] achieved early-stage mapping with high accuracy but relied on extensive labeled samples and computational resources, which may limit scalability across large, diverse landscapes. By contrast, our approach balances performance and efficiency through the use of Random Forest classifiers, combined with interpretable feature selection and multi-temporal fusion.
Our findings further demonstrate that crop spatial distribution strongly correlates with climatic and hydrological conditions: maize cultivation concentrates in irrigated lowlands (<520 m), while drought-adapted crops (oats, sesame) dominate water-limited uplands (470–600 m) with integrated short-season vegetable rotations. This altitudinal zonation is clearly discernible along a north–south topographic gradient, where cooler northern highlands preferentially support cold-tolerant crops and vegetables, whereas southern lowlands sustain intensive maize production through irrigation. These insights provide critical baselines for optimizing crop allocation under evolving climate regimes.

5.3. Limitations and Future Directions for Crop Classification and Rotation Analysis

Despite these advances, several challenges remain:
First, complex cropping practices, including intercropping, sequential planting, and variable sowing dates, often generate spectral mixtures that degrade classification accuracy, especially for short-cycle crops like sesame. As noted in other studies [17,23], pixel-based approaches may underperform in highly heterogeneous regions. Future efforts should integrate crop-specific phenological modeling, sub-pixel unmixing, and temporal consistency constraints to reduce classification noise and error propagation in rotation analysis.
Second, conventional rotation matrices based on annual majority crop labels may oversimplify actual management patterns, especially in cases of short-cycle or overlapping crops. This can lead to systematic biases in transition detection. Studies such as Waldhoff et al. (2017) [22] and Blickensdörfer et al. (2022) [17] have stressed the importance of sub-annual classification and object-based methods in capturing fine-scale rotation details. Our results reaffirm this need and suggest integrating ancillary field data (e.g., farmer interviews, planting records) as a promising avenue.
Third, although multi-sensor fusion improved classification performance, hyperspectral imagery, UAV-based validation, and deep learning methods such as LSTM or CNNs offer promising routes to further enhance spatial and temporal resolution [9,20,47]. These tools can address class imbalance, intra-class variability, and mixed pixels more effectively, especially in complex terrain.
In conclusion, our study contributes a scalable and interpretable framework for crop mapping in smallholder-dominated, topographically diverse regions and provides high-resolution evidence on cropping patterns and rotation dynamics. Building on this foundation, future research should focus on the following: (i) refining rotation tracking in intercropped or multi-harvest systems, (ii) enhancing classification robustness across years and geographies, and (iii) leveraging AI-driven classification with expanded ground truth datasets to better support agricultural management and policy in ecologically fragile zones.

6. Conclusions

This study demonstrates that integrating Sentinel-1, Sentinel-2, and Landsat-8/9 effectively captures structural and phenological variations in fragmented agricultural landscapes within the farming–pastoral ecotone of China. The method achieved high classification accuracy, with overall accuracy and the Kappa coefficient exceeding 0.90 from 2021 to 2023, and strong agreement between mapped and statistical crop areas at the county level (R2: 0.85–0.88; RMSE: 0.42–0.58 × 10⁴ ha). Spatiotemporal analyses revealed distinct crop distribution patterns: oats, potato, sesame, and vegetables were predominantly cultivated in the northern Zhangjiakou, while maize dominated southern regions. Significant annual variations in crop area proportions were observed, along with specific altitudinal preferences: maize, potato, and sesame were primarily grown at 480–520 m, while oats and other crops were concentrated at 520–600 m. Most crops were cultivated on gentle slopes of 0–5°, with sesame extending to 4–10° slopes. Temporal analysis from 2019 to 2023 indicated that sesame, oats, and potato predominantly followed rotation patterns, while maize cultivation largely followed monoculture practices. These patterns were shaped by multiple interacting factors, including water availability, economic incentives, and the constraints of continuous cropping.
While the proposed framework proves robust and transferable for smallholder-dominated agroecosystems, certain limitations remain. Intercropping, short-cycle crops, and asynchronous planting schedules introduce spectral mixing, particularly for underrepresented crops such as sesame. These patterns are difficult to distinguish using pixel-based majority labels, potentially leading to rotation misclassification. Future efforts should explore sub-annual classification, object-based approaches, and the integration of field survey data to better capture local management practices. In addition, integrating UAV observations, hyperspectral imagery, and deep learning models could further enhance mapping precision and address spectral confusion in heterogeneous plots. Overall, these findings offer critical insights for optimizing crop rotation strategies, promoting agricultural sustainability, and enhancing land-use efficiency within ecologically vulnerable regions.

Author Contributions

Conceptualization, Z.Z. and B.C.; methodology, Z.H. and Y.L.; software, Z.H., Y.Y. and H.Z.; validation, Z.H., H.Z. and J.G.; formal analysis, Z.H., Y.L. and K.M.; investigation, Z.H. and Y.L.; resources, F.C., J.G. and B.C.; writing—original draft preparation, Z.H.; writing—review and editing, Z.Z., B.C., Y.L., H.Z. and K.M.; visualization, Y.Y.; project administration, Z.Z. and B.C.; funding acquisition, Z.Z. and B.C. All authors have read and agreed to the published version of the manuscript.

Funding

This research was supported by the Science and Technology Key Program of Inner Mongolia (2021ZD0002), and the earmarked fund for the China Agriculture Research System (CARS-07-B-5, and CARS-07-A-6).

Data Availability Statement

All satellite data used in this study are freely available. Other data and codes generated or analyzed during this study are available from the corresponding author upon reasonable request.

Conflicts of Interest

The authors declare no competing financial interests or personal relationships that could have influenced the work reported in this paper.

Abbreviations

The following abbreviations are used in this manuscript:
FPECthe farming–pastoral ecotone of China
SARSynthetic Aperture Radar
GEEGoogle Earth Engine
RFRandom Forest

References

  1. Shen, H.; He, Y.; Hu, W.; Geng, S.; Han, X.; Zhao, Z.; Li, H. The Temporal Evolution of Soil Erosion for Corn and Fallow Hillslopes in the Typical Mollisol Region of Northeast China. Soil Tillage Res. 2019, 186, 200–205. [Google Scholar] [CrossRef]
  2. Zhou, J.; Zhang, F.; Xu, Y.; Gao, Y.; Xie, Z. Evaluation of Land Reclamation and Implications of Ecological Restoration for Agro-Pastoral Ecotone: Case Study of Horqin Left Back Banner in China. Chin. Geogr. Sci. 2017, 27, 772–783. [Google Scholar] [CrossRef]
  3. Ali, A.; Hassan, M.U.; Kaul, H. Broad Scope of Site-Specific Crop Management and Specific Role of Remote Sensing Technologies Within It—A Review. J. Agron. Crop Sci. 2024, 210, e12732. [Google Scholar] [CrossRef]
  4. Li, S.; An, P.; Pan, Z.; Wang, F.; Li, X.; Liu, Y. Farmers’ Initiative on Adaptation to Climate Change in the Northern Agro-Pastoral Ecotone. Int. J. Disaster Risk Reduct. 2015, 12, 278–284. [Google Scholar] [CrossRef]
  5. Wuyun, D.; Sun, L.; Sun, Z.; Chen, Z.; Hou, A.; Teixeira Crusiol, L.G.; Reymondin, L.; Chen, R.; Zhao, H. Mapping Fallow Fields Using Sentinel-1 and Sentinel-2 Archives over Farming-Pastoral Ecotone of Northern China with Google Earth Engine. GISci. Remote Sens. 2022, 59, 333–353. [Google Scholar] [CrossRef]
  6. Chen, H.; Zhao, Y.; Fu, X.; Tang, M.; Guo, M.; Zhang, S.; Zhu, Y.; Qu, L.; Wu, G. Impacts of Regional Land-Use Patterns on Ecosystem Services in the Typical Agro-Pastoral Ecotone of Northern China. Ecosyst. Health Sustain. 2022, 8, 2110521. [Google Scholar] [CrossRef]
  7. Maestre, F.T.; Le Bagousse-Pinguet, Y.; Delgado-Baquerizo, M.; Eldridge, D.J.; Saiz, H.; Berdugo, M.; Gozalo, B.; Ochoa, V.; Guirado, E.; García-Gómez, M.; et al. Grazing and Ecosystem Service Delivery in Global Drylands. Science 2022, 378, 915–920. [Google Scholar] [CrossRef]
  8. Estel, S.; Kuemmerle, T.; Levers, C.; Baumann, M.; Hostert, P. Mapping Cropland-Use Intensity across Europe Using MODIS NDVI Time Series. Environ. Res. Lett. 2016, 11, 024015. [Google Scholar] [CrossRef]
  9. Zhou, Y.; Luo, J.; Feng, L.; Yang, Y.; Chen, Y.; Wu, W. Long-Short-Term-Memory-Based Crop Classification Using High-Resolution Optical Images and Multi-Temporal SAR Data. GISci. Remote Sens. 2019, 56, 1170–1191. [Google Scholar] [CrossRef]
  10. Pan, L.; Xia, H.; Zhao, X.; Guo, Y.; Qin, Y. Mapping Winter Crops Using a Phenology Algorithm, Time-Series Sentinel-2 and Landsat-7/8 Images, and Google Earth Engine. Remote Sens. 2021, 13, 2510. [Google Scholar] [CrossRef]
  11. Chen, Y.; Lu, D.; Moran, E.; Batistella, M.; Dutra, L.V.; Sanches, I.D.; da Silva, R.F.B.; Huang, J.; Luiz, A.J.B.; de Oliveira, M.A.F. Mapping Croplands, Cropping Patterns, and Crop Types Using MODIS Time-Series Data. Int. J. Appl. Earth Obs. Geoinf. 2018, 69, 133–147. [Google Scholar] [CrossRef]
  12. Wang, C.; Zhang, X.; Wang, W.; Wei, H.; Wang, J.; Li, Z.; Li, X.; Wu, H.; Hu, Q. Understanding the Potentials of Early-Season Crop Type Mapping by Using Landsat-8, Sentinel-1/2, and GF-1/6 Data. Comput. Electron. Agric. 2024, 224, 109239. [Google Scholar] [CrossRef]
  13. Wang, J.; Xiao, X.; Liu, L.; Wu, X.; Qin, Y.; Steiner, J.L.; Dong, J. Mapping Sugarcane Plantation Dynamics in Guangxi, China, by Time Series Sentinel-1, Sentinel-2 and Landsat Images. Remote Sens. Environ. 2020, 247, 111951. [Google Scholar] [CrossRef]
  14. Shen, Y.; Zhang, X.; Yang, Z. Mapping Corn and Soybean Phenometrics at Field Scales over the United States Corn Belt by Fusing Time Series of Landsat 8 and Sentinel-2 Data with VIIRS Data. ISPRS J. Photogramm. Remote Sens. 2022, 186, 55–69. [Google Scholar] [CrossRef]
  15. Ashourloo, D.; Shahrabi, H.S.; Azadbakht, M.; Rad, A.M.; Aghighi, H.; Radiom, S. A Novel Method for Automatic Potato Mapping Using Time Series of Sentinel-2 Images. Comput. Electron. Agric. 2020, 175, 105583. [Google Scholar] [CrossRef]
  16. Maponya, M.G.; van Niekerk, A.; Mashimbye, Z.E. Pre-Harvest Classification of Crop Types Using a Sentinel-2 Time-Series and Machine Learning. Comput. Electron. Agric. 2020, 169, 105164. [Google Scholar] [CrossRef]
  17. Blickensdörfer, L.; Schwieder, M.; Pflugmacher, D.; Nendel, C.; Erasmi, S.; Hostert, P. Mapping of Crop Types and Crop Sequences with Combined Time Series of Sentinel-1, Sentinel-2 and Landsat 8 Data for Germany. Remote Sens. Environ. 2022, 269, 112831. [Google Scholar] [CrossRef]
  18. Ibrahim, E.S.; Rufin, P.; Nill, L.; Kamali, B.; Nendel, C.; Hostert, P. Mapping Crop Types and Cropping Systems in Nigeria with Sentinel-2 Imagery. Remote Sens. 2021, 13, 3523. [Google Scholar] [CrossRef]
  19. Chen, S.; Useya, J.; Mugiyo, H. Decision-Level Fusion of Sentinel-1 SAR and Landsat 8 OLI Texture Features for Crop Discrimination and Classification: Case of Masvingo, Zimbabwe. Heliyon 2020, 6, e05358. [Google Scholar] [CrossRef]
  20. Fracastoro, G.; Magli, E.; Poggi, G.; Scarpa, G.; Valsesia, D.; Verdoliva, L. Deep Learning Methods For Synthetic Aperture Radar Image Despeckling: An Overview Of Trends And Perspectives. IEEE Geosci. Remote Sens. Mag. 2021, 9, 29–51. [Google Scholar] [CrossRef]
  21. Mercier, A.; Betbeder, J.; Baudry, J.; Le Roux, V.; Spicher, F.; Lacoux, J.; Roger, D.; Hubert-Moy, L. Evaluation of Sentinel-1 & 2 Time Series for Predicting Wheat and Rapeseed Phenological Stages. ISPRS J. Photogramm. Remote Sens. 2020, 163, 231–256. [Google Scholar] [CrossRef]
  22. Waldhoff, G.; Lussem, U.; Bareth, G. Multi-Data Approach for Remote Sensing-Based Regional Crop Rotation Mapping: A Case Study for the Rur Catchment, Germany. Int. J. Appl. Earth Obs. Geoinf. 2017, 61, 55–69. [Google Scholar] [CrossRef]
  23. Hufnagel, J.; Reckling, M.; Ewert, F. Diverse Approaches to Crop Diversification in Agricultural Research. A Review. Agron. Sustain. Dev. 2020, 40, 14. [Google Scholar] [CrossRef]
  24. Orynbaikyzy, A.; Gessner, U.; Conrad, C. Crop Type Classification Using a Combination of Optical and Radar Remote Sensing Data: A Review. Int. J. Remote Sens. 2019, 40, 6553–6595. [Google Scholar] [CrossRef]
  25. Luo, Y.; Zhang, Z.; Li, Z.; Chen, Y.; Zhang, L.; Cao, J.; Tao, F. Identifying the Spatiotemporal Changes of Annual Harvesting Areas for Three Staple Crops in China by Integrating Multi-Data Sources. Environ. Res. Lett. 2020, 15, 074003. [Google Scholar] [CrossRef]
  26. Qiu, B.; Hu, X.; Chen, C.; Tang, Z.; Yang, P.; Zhu, X.; Yan, C.; Jian, Z. Maps of Cropping Patterns in China during 2015–2021. Sci. Data 2022, 9, 479. [Google Scholar] [CrossRef]
  27. Du, G.; Yao, L.; Hou, D. The Spatio-Temporal Changes of Cropping Patterns in the Black Soil Area of China: Lessons from Wangkui County. Front. Environ. Sci. 2022, 10, 981721. [Google Scholar] [CrossRef]
  28. Yang, Z.; Chu, L.; Wang, C.; Pan, Y.; Su, W.; Qin, Y.; Cai, C. What Drives the Spatial Heterogeneity of Cropping Patterns in the Northeast China: The Natural Environment, the Agricultural Economy, or Policy? Sci. Total Environ. 2023, 905, 167810. [Google Scholar] [CrossRef]
  29. Liu, Z.; Liu, Y.; Dong, J.; Baig, M.H.A.; Chi, W.; Peng, L.; Wang, J. Patterns and Causes of Winter Wheat and Summer Maize Rotation Area Change over the North China Plain. Environ. Res. Lett. 2022, 17, 044056. [Google Scholar] [CrossRef]
  30. Li, J.; Lei, H. Tracking the Spatio-Temporal Change of Planting Area of Winter Wheat-Summer Maize Cropping System in the North China Plain during 2001–2018. Comput. Electron. Agric. 2021, 187, 106222. [Google Scholar] [CrossRef]
  31. He, Y.; Dong, J.; Liao, X.; Sun, L.; Wang, Z.; You, N.; Li, Z.; Fu, P. Examining Rice Distribution and Cropping Intensity in a Mixed Single- and Double-Cropping Region in South China Using All Available Sentinel 1/2 Images. Int. J. Appl. Earth Obs. Geoinf. 2021, 101, 102351. [Google Scholar] [CrossRef]
  32. Pan, L.; Xia, H.; Yang, J.; Niu, W.; Wang, R.; Song, H.; Guo, Y.; Qin, Y. Mapping Cropping Intensity in Huaihe Basin Using Phenology Algorithm, All Sentinel-2 and Landsat Images in Google Earth Engine. Int. J. Appl. Earth Obs. Geoinf. 2021, 102, 102376. [Google Scholar] [CrossRef]
  33. Chen, X.; Zhang, G.; Jin, Y.; Mao, S.; Laakso, K.; Sanchez-Azofeifa, A.; Jiang, L.; Zhou, Y.; Zhao, H.; Yu, L.; et al. Evaluating the Farmland Use Intensity and Its Patterns in a Farming—Pastoral Ecotone of Northern China. Remote Sens. 2021, 13, 4304. [Google Scholar] [CrossRef]
  34. Hu, Y.; Zeng, H.; Tian, F.; Zhang, M.; Wu, B.; Gilliams, S.; Li, S.; Li, Y.; Lu, Y.; Yang, H. An Interannual Transfer Learning Approach for Crop Classification in the Hetao Irrigation District, China. Remote Sens. 2022, 14, 1208. [Google Scholar] [CrossRef]
  35. Qi, H.; Qian, X.; Shang, S.; Wan, H. Multi-Year Mapping of Cropping Systems in Regions with Smallholder Farms from Sentinel-2 Images in Google Earth Engine. GISci. Remote Sens. 2024, 61, 2309843. [Google Scholar] [CrossRef]
  36. Li, G.; Cui, J.; Han, W.; Zhang, H.; Huang, S.; Chen, H.; Ao, J. Crop Type Mapping Using Time-Series Sentinel-2 Imagery and U-Net in Early Growth Periods in the Hetao Irrigation District in China. Comput. Electron. Agric. 2022, 203, 107478. [Google Scholar] [CrossRef]
  37. Chen, X.; An, P.; Laakso, K.; Arturo Sanchez-Azofeifa, G.; Wang, F.; Zhang, G.; Jiang, L.; Zhou, Y.; Lun, F.; Zou, L.; et al. Satellite-Based Observations of the Green Depressing Cropping System in a Farming-Pastoral Ecotone of Northern China. Int. J. Appl. Earth Obs. Geoinf. 2021, 98, 102312. [Google Scholar] [CrossRef]
  38. Yu, Q.; Hu, Q.; van Vliet, J.; Verburg, P.H.; Wu, W. GlobeLand30 Shows Little Cropland Area Loss but Greater Fragmentation in China. Int. J. Appl. Earth Obs. Geoinf. 2018, 66, 37–45. [Google Scholar] [CrossRef]
  39. Dong, Q.; Chen, X.; Chen, J.; Zhang, C.; Liu, L.; Cao, X.; Zang, Y.; Zhu, X.; Cui, X. Mapping Winter Wheat in North China Using Sentinel 2A/B Data: A Method Based on Phenology-Time Weighted Dynamic Time Warping. Remote Sens. 2020, 12, 1274. [Google Scholar] [CrossRef]
  40. Li, X.; Sun, C.; Meng, H.; Ma, X.; Huang, G.; Xu, X. A Novel Efficient Method for Land Cover Classification in Fragmented Agricultural Landscapes Using Sentinel Satellite Imagery. Remote Sens. 2020, 14, 2045. [Google Scholar] [CrossRef]
  41. Zurqani, H.A.; Post, C.J.; Mikhailova, E.A.; Schlautman, M.A.; Sharp, J.L. Geospatial Analysis of Land Use Change in the Savannah River Basin Using Google Earth Engine. Int. J. Appl. Earth Obs. Geoinf. 2018, 69, 175–185. [Google Scholar] [CrossRef]
  42. Mohammed, I.; Marshall, M.; de Bie, K.; Estes, L.; Nelson, A. A Blended Census and Multiscale Remote Sensing Approach to Probabilistic Cropland Mapping in Complex Landscapes. ISPRS J. Photogramm. Remote Sens. 2020, 161, 233–245. [Google Scholar] [CrossRef]
  43. Foerster, S.; Kaden, K.; Foerster, M.; Itzerott, S. Crop Type Mapping Using Spectral–Temporal Profiles and Phenological Information. Comput. Electron. Agric. 2012, 89, 30–40. [Google Scholar] [CrossRef]
  44. Brown, C.F.; Brumby, S.P.; Guzder-Williams, B.; Birch, T.; Hyde, S.B.; Mazzariello, J.; Czerwinski, W.; Pasquarella, V.J.; Haertel, R.; Ilyushchenko, S.; et al. Dynamic World, Near Real-Time Global 10 m Land Use Land Cover Mapping. Sci. Data 2022, 9, 251. [Google Scholar] [CrossRef]
  45. Phalke, A.R.; Özdoğan, M.; Thenkabail, P.S.; Erickson, T.; Gorelick, N.; Yadav, K.; Congalton, R.G. Mapping Croplands of Europe, Middle East, Russia, and Central Asia Using Landsat, Random Forest, and Google Earth Engine. ISPRS J. Photogramm. Remote Sens. 2020, 167, 104–122. [Google Scholar] [CrossRef]
  46. Zhang, H.; Du, H.; Zhang, C.; Zhang, L. An Automated Early-Season Method to Map Winter Wheat Using Time-Series Sentinel-2 Data: A Case Study of Shandong, China. Comput. Electron. Agric. 2021, 182, 105962. [Google Scholar] [CrossRef]
  47. Wei, P.; Ye, H.; Qiao, S.; Liu, R.; Nie, C.; Zhang, B.; Song, L.; Huang, S. Early Crop Mapping Based on Sentinel-2 Time-Series Data and the Random Forest Algorithm. Remote Sens. 2023, 15, 3212. [Google Scholar] [CrossRef]
  48. Obour, A.K.; Silveira, M.L.; Vendramini, J.M.B.; Jawitz, J.; O’Connor, G.A.; Sollenberger, L.E. A Phosphorus Budget for Bahiagrass Pastures Growing on a Typical Florida Spodosol. Agron. J. 2011, 103, 611–616. [Google Scholar] [CrossRef]
  49. Zhang, H.; Xiao, F.; He, W.; Chai, Z.; Ewe, H.-T. Multiyear Automated Mapping and Price Analysis of Garlic in Main Planting Areas of China Using Time-Series Remote Sensing Images. IEEE J. Sel. Top. Appl. Earth Obs. Remote Sens. 2022, 15, 5222–5233. [Google Scholar] [CrossRef]
  50. Zha, Y.; Gao, J.; Ni, S. Use of Normalized Difference Built-up Index in Automatically Mapping Urban Areas from TM Imagery. Int. J. Remote Sens. 2003, 24, 583–594. [Google Scholar] [CrossRef]
  51. Motohka, T.; Nasahara, K.N.; Oguma, H.; Tsuchida, S. Applicability of Green-Red Vegetation Index for Remote Sensing of Vegetation Phenology. Remote Sens. 2010, 2, 2369–2387. [Google Scholar] [CrossRef]
  52. Gumma, M.K.; Thenkabail, P.S.; Panjala, P.; Teluguntla, P.; Yamano, T.; Mohammed, I. Multiple Agricultural Cropland Products of South Asia Developed Using Landsat-8 30 m and MODIS 250 m Data Using Machine Learning on the Google Earth Engine (GEE) Cloud and Spectral Matching Techniques (SMTs) in Support of Food and Water Security. GISci. Remote Sens. 2022, 59, 1048–1077. [Google Scholar] [CrossRef]
  53. Griffiths, P.; Nendel, C.; Hostert, P. Intra-Annual Reflectance Composites from Sentinel-2 and Landsat for National-Scale Crop and Land Cover Mapping. Remote Sens. Environ. 2019, 220, 135–151. [Google Scholar] [CrossRef]
  54. Savitzky, A.; Golay, M.J.E. Smoothing and Differentiation of Data by Simplified Least Squares Procedures. Anal. Chem. 1964, 36, 1627–1639. [Google Scholar] [CrossRef]
  55. Hudait, M.; Patel, P.P. Crop-Type Mapping and Acreage Estimation in Smallholding Plots Using Sentinel-2 Images and Machine Learning Algorithms: Some Comparisons. Egypt. J. Remote Sens. Space Sci. 2022, 25, 147–156. [Google Scholar] [CrossRef]
  56. Wang, H.; Magagi, R.; Goïta, K.; Trudel, M.; McNairn, H.; Powers, J. Crop Phenology Retrieval via Polarimetric SAR Decomposition and Random Forest Algorithm. Remote Sens. Environ. 2019, 231, 111234. [Google Scholar] [CrossRef]
  57. You, N.; Dong, J.; Huang, J.; Du, G.; Zhang, G.; He, Y.; Yang, T.; Di, Y.; Xiao, X. The 10-m Crop Type Maps in Northeast China during 2017–2019. Sci. Data 2021, 8, 41. [Google Scholar] [CrossRef]
  58. Zhang, J.; Feng, L.; Yao, F. Improved Maize Cultivated Area Estimation over a Large Scale Combining MODIS–EVI Time Series Data and Crop Phenological Information. ISPRS J. Photogramm. Remote Sens. 2014, 94, 102–113. [Google Scholar] [CrossRef]
  59. Pelletier, C.; Valero, S.; Inglada, J.; Champion, N.; Dedieu, G. Assessing the Robustness of Random Forests to Map Land Cover with High Resolution Satellite Image Time Series over Large Areas. Remote Sens. Environ. 2016, 187, 156–168. [Google Scholar] [CrossRef]
  60. Foody, G.M. Status of Land Cover Classification Accuracy Assessment. Remote Sens. Environ. 2002, 80, 185–201. [Google Scholar] [CrossRef]
  61. Huang, X.; Huang, J.; Li, X.; Shen, Q.; Chen, Z. Early Mapping of Winter Wheat in Henan Province of China Using Time Series of Sentinel-2 Data. GISci. Remote Sens. 2022, 59, 1534–1549. [Google Scholar] [CrossRef]
  62. Zhang, G.; Chen, X.; Zhou, Y.; Zhao, H.; Jin, Y.; Luo, Y.; Chen, S.; Wu, X.; Pan, Z.; An, P. Land Use/Cover Changes and Subsequent Water Budget Imbalance Exacerbate Soil Aridification in the Farming-Pastoral Ecotone of Northern China. J. Hydrol. 2023, 624, 129939. [Google Scholar] [CrossRef]
  63. Yang, Y.; Wang, K.; Liu, D.; Zhao, X.; Fan, J. Effects of Land-Use Conversions on the Ecosystem Services in the Agro-Pastoral Ecotone of Northern China. J. Clean. Prod. 2020, 249, 119360. [Google Scholar] [CrossRef]
  64. Chen, X.; Jiang, L.; Zhang, G.; Meng, L.; Pan, Z.; Lun, F.; An, P. Green-Depressing Cropping System: A Referential Land Use Practice for Fallow to Ensure a Harmonious Human-Land Relationship in the Farming-Pastoral Ecotone of Northern China. Land Use Policy 2021, 100, 104917. [Google Scholar] [CrossRef]
  65. Liu, Y.; Xiao, X.; Li, J.; Wang, X.; Chen, B.; Sun, C.; Wang, J.; Tian, P.; Zhang, H. Tracking Changes in Coastal Land Cover in the Yellow Sea, East Asia, Using Sentinel-1 and Sentinel-2 Time-Series Images and Google Earth Engine. ISPRS J. Photogramm. Remote Sens. 2023, 196, 429–444. [Google Scholar] [CrossRef]
  66. Peng, Q.; Shen, R.; Li, X.; Ye, T.; Dong, J.; Fu, Y.; Yuan, W. A Twenty-Year Dataset of High-Resolution Maize Distribution in China. Sci. Data 2023, 10, 658. [Google Scholar] [CrossRef]
Figure 1. Study area and topography, crop distribution and sample observations in Zhangjiakou City, Hebei Province, China (2023). (a) Location of the farming–pastoral ecotone of China (FPEC) and the position of Zhangjiakou in FPEC; (b) administrative boundaries of Zhangjiakou and elevation (DEM, meters); (c) spatial distribution of ground samples for major crop types; (d) number of samples per crop type in 2021–2023; (e) surveyed crops: oats, potato, maize, and sesame.
Remotesensing 17 01707 g001
Figure 2. Phenological calendar for four crop types. “E”, “M”, and “L” represent the early, middle, and last 10-day periods of each month. DOY indicates the day of the year.
Remotesensing 17 01707 g002
Figure 4. Time series of vegetation indices for four crop types in 2023. The curves represent 15-day interval mean values of vegetation indices across the growing season.
Remotesensing 17 01707 g004
Figure 5. (a) Schematic of separability time windows based on vegetation index time series in 2023, with vertical lines showing maximum and minimum values of vegetation index statistical features. (b) Boxplots of vegetation index separability for four crop types within time windows.
Remotesensing 17 01707 g005
Figure 6. Regression validation of crop mapping accuracy for 2019–2022. (ad) Regression analysis of mapped versus statistical areas for four crop types (maize, oats, potato, and sesame) across counties from 2019 to 2022. (eh) Crop-specific regression analysis of area estimates for maize, oats, potato, and sesame over 2019–2022. RMSE is reported in hectares (ha).
Remotesensing 17 01707 g006
Figure 7. Spatiotemporal patterns of crop distribution in Zhangjiakou from 2019 to 2023. (ae) Annual maps of crop types across Zhangjiakou; (fj) county-level crop area proportions for each year.
Remotesensing 17 01707 g007
Figure 8. Descriptive statistics and cumulative distributions of elevation (ae) and slope (fj) for five crop types. The histograms represent the distribution of area (ha), and the red lines indicate the cumulative percentage (%) of the total area for each crop type.
Remotesensing 17 01707 g008
Figure 9. Sankey diagram illustrating crop rotation dynamics for major crop types in Zhangjiakou from 2019 to 2023.
Remotesensing 17 01707 g009
Figure 10. Random Forest variable importance (top 25). The vertical axis represents the feature bands, with the number suffix indicating the corresponding time phase of the band: _Jan–Mar for January–March, _Apr–Jun for April–June, _Jul–Sep for July–September, and _Oct–Dec for October–December.
Remotesensing 17 01707 g010
Table 1. Summary of data used in this study.
DataTimeResolutionData AccessLast Access (dd/mm/yyyy)
Sentinel-2 MSI2019, 2020, 2021, 2022, 202310 mhttps://developers.google.com/earth-engine/datasets/catalog/COPERNICUS_S208 January 2025
Landsat8/92019, 2020, 2021, 2022, 202330 mhttps://developers.google.com/earth-engine/datasets/catalog/LANDSAT_LC08_C02_T1_L2;
https://developers.google.com/earth-engine/datasets/catalog/LANDSAT_LC09_C02_T1_L2
08 January 2025
Sentinel-1 SAR2019, 2020, 2021, 2022, 202310 mhttps://developers.google.com/earth-engine/datasets/catalog/COPERNICUS_S1_GRD08 January 2025
The Shuttle Radar Topography Mission (SRTM)202330 mhttps://developers.google.com/earth-engine/datasets/catalog/USGS_SRTMGL1_00308 January 2025
Dynamic World2019, 2020, 2021, 2022, 202310 mhttps://developers.google.com/earth-engine/datasets/catalog/GOOGLE_DYNAMICWORLD_V116 October 2024
Agricultural statistics data2019–2022Countyhttps://www.zjk.gov.cn05 December 2024
Field survey sitesJuly 2023–August 2023In-situField surveyJuly–August 2023
Table 3. Random Forest classification accuracy assessment (confusion matrix) of the crop area from 2021 to 2023.
YearCropsMaizeOatsPotatoSesameOther CropsProducer’s
Acc.
F1
Score
Overall
Acc.
Kappa
2023Maize218100398.1999.0997.350.95
Oats016420894.2594.25
Potato031310693.5795.97
Sesame06019270.3782.60
Other crops0000611198.46
User’s Acc.194.2598.49196.98
2022Maize222200099.1199.1196.4494.51
Oats0230011593.4994.26
Potato006027585.71
Sesame0105083.3383.33
Other crops290040497.3596.65
User’s Acc.99.1195.0410083.3395.96
2021Maize213600097.2697.0495.7593.18
Oats472001083.7287.80
Potato103007585.71
Sesame00010100100
Other crops200022999.1397.45
User’s Acc.96.8292.3110010095.81
Table 4. Major crop rotation patterns in the study area (2019–2023) based on field area proportions (unit: %). P, O, M, S, OC represent potato, oat, maize, sesame and other crops, respectively.
Pattern in Cropping SystemCrop Rotation2019–20202020–20212021–20222022–2023Average
Potato-dominatedP-P31.8633.4027.9732.5431.44
P-O12.238.6411.2210.4310.63
P-M20.569.1817.5312.3014.89
P-S1.382.451.321.301.61
P-OC33.9646.3341.9543.4341.42
Oats-dominatedO-P7.1210.586.8310.758.82
O-O40.6330.5921.7940.7833.45
O-M25.666.2612.2112.6414.19
O-S1.103.111.801.521.88
O-OC25.4949.4557.3734.341.65
Maize-dominatedM-P3.114.912.442.573.26
M-O5.485.613.105.434.91
M-M77.460.2078.1175.5672.82
M-S0.861.451.031.151.12
M-OC13.1527.8215.3215.317.90
Sesame-dominatedS-P5.197.676.365.076.07
S-O20.679.727.3012.9212.65
S-M27.3111.114.3616.9517.43
S-S4.795.603.509.395.82
S-OC42.0365.9168.4755.6758.02
Other crops-dominatedOC-P4.736.254.293.934.80
OC-O7.955.204.539.436.78
OC-M14.425.699.0810.649.96
OC-S1.872.111.161.481.66
OC-OC71.0380.7480.9574.5376.81
Disclaimer/Publisher’s Note: The statements, opinions and data contained in all publications are solely those of the individual author(s) and contributor(s) and not of MDPI and/or the editor(s). MDPI and/or the editor(s) disclaim responsibility for any injury to people or property resulting from any ideas, methods, instructions or products referred to in the content.

