Article

Declining Snow Resources Since 2000 in Arid Northwest China Based on Integrated Remote Sensing Indicators

by
Siyu Bai
1,2,
Wei Zhang
3,
An’an Chen
1,2,*,
Luyuan Jiang
4,
Xuejiao Wu
1,2 and
Yixue Huo
1,2
1
Shaanxi Key Laboratory of Earth Surface System and Environmental Carrying Capacity, Xi’an 710127, China
2
Qiyi Glacier Station, Institute of Earth Surface System and Hazards, College of Urban and Environmental Sciences, Northwest University, Xi’an 710127, China
3
Koktokay Snow Station, Key Laboratory of Cryospheric Science and Frozen Soil Engineering, Northwest Institute of Eco-Environment and Resources, Chinese Academy of Sciences, Lanzhou 730000, China
4
The First Topographic Surveying Brigade of Ministry of Natural Resource of P.R.C., Xi’an 710054, China
*
Author to whom correspondence should be addressed.
Remote Sens. 2025, 17(10), 1697; https://doi.org/10.3390/rs17101697
Submission received: 27 March 2025 / Revised: 27 April 2025 / Accepted: 9 May 2025 / Published: 12 May 2025
(This article belongs to the Section Remote Sensing in Geology, Geomorphology and Hydrology)

Abstract

Snow cover variations significantly affect the stability of regional water supply and terrestrial ecosystems in arid northwest China. This study comprehensively evaluates snow resource changes since 2000 by integrating multisource remote sensing datasets and analyzing four key indicators: snow cover area (SCA), snow phenology (SP), snow depth (SD), and snow water equivalent (SWE). The results reveal a slight downtrend in SCA over the past two decades, with an annual decline rate of 7.13 × 10³ km2. The maximum SCA (1.28 × 10⁶ km2) occurred in 2010, while the minimum (7.25 × 10⁵ km2) was recorded in 2014. Spatially, SCA peaked in December in the north and January in the south, with high-altitude subregions (Ili River Basin (IRB), Tarim River Region (TRR), North Kunlun Mountains (NKM), and Qaidam Basin (QDB)) maintaining stable summer snow cover due to low temperatures and high precipitation. Analysis of snow phenology indicates a significant shortening of snow cover duration (SCD), with 62.40% of the study area showing a declining trend, primarily driven by earlier snowmelt. Both SD and SWE exhibited widespread declines, affecting 75.09% and 84.85% of the study area, respectively. The most pronounced SD reductions occurred in TRR (94.44%), while SWE losses were particularly severe in North Tianshan Mountains (NTM, 94.61%). The total snow mass in northwest China was estimated at 108.95 million tons, with northern Xinjiang accounting for 66.24 million tons (60.8%), followed by southern Xinjiang (37.44 million tons) and the Hexi Inland Region (5.27 million tons). Consistency analysis revealed coherent declines across all indicators in 55.56% of the study area. Significant SD and SCD reductions occurred in TRR and Tuha Basin (THB), while SWE declines were widespread in NTM and IRB, driven by rising temperatures and decreased snowfall. The findings underscore the urgent need for adaptive strategies to address emerging challenges for water security and ecological stability in the region.

1. Introduction

Snow cover constitutes a critical component of the cryosphere, playing a pivotal role in Earth surface processes through its influence on energy and hydrological cycles [1]. Variations in snow cover directly modulate regional energy budgets and water balance, making it a key factor in climate change adaptation and water resource management strategies [2,3,4]. Primary indicators to assess snow cover variations mainly include snow cover area (SCA), snow phenology (SP), snow depth (SD), and snow water equivalent (SWE). However, systematic investigations into the consistency and interrelationships among these indicators remain limited [5].
Remote sensing has emerged as an indispensable tool for large-scale snow monitoring due to its extensive spatial coverage, temporal continuity, and capacity to overcome geographic limitations [6]. Multisource remote sensing datasets, including those from the Advanced Very High Resolution Radiometer (AVHRR), Sentinel satellites, and Moderate Resolution Imaging Spectroradiometer (MODIS), enable comprehensive evaluation of snow cover dynamics across spatiotemporal scales [7]. Among these, SCA and SP represent the most widely adopted indicators [8]. Recent intercomparison studies demonstrate that MODIS snow products achieve 93–97% accuracy in cloud-free conditions when validated against high-resolution Landsat-8 observations, though mountain regions show 10–15% higher omission errors [9]. The National Oceanic and Atmospheric Administration (NOAA) Climate Data Record (CDR) provides long-term SCA data with global coverage, though its coarse spatial resolution (~25 km) leads to underestimation of fractional snow cover in mountainous regions [5,6]. While Sentinel-2 offers high spatial resolution (10–20 m) snow mapping, its temporal coverage since 2015 limits applicability for decadal-scale analyses. MODIS products (MOD10A1/MYD10A1 at 500 m resolution) currently offer the optimal balance between spatiotemporal resolution (daily) and accuracy (>90% under clear-sky conditions), making them the primary data source for contemporary snow cover studies [8].
SD and SWE serve as critical indicators for quantifying snow mass and hydrological potential [10]. SWE estimation remains particularly challenging at regional scales due to limitations in ground validation data and high uncertainties in spaceborne retrievals [11]. A comprehensive evaluation of 18 global SWE products revealed that passive microwave-based estimates systematically underestimate peak SWE by 30–50% in deep snowpack regions compared to ground-based snow surveys [12]. Passive microwave remote sensing has become the principal method for SD monitoring [13], offering advantages in temporal coverage and spatial continuity compared to sparse ground station networks [8,9]. Recent advances in machine learning have enhanced SD retrieval accuracy over complex terrain [14,15,16], with deep neural network models integrating AMSR2 brightness temperatures and topographic parameters achieving 18% lower RMSE compared to traditional brightness temperature gradient methods [17]. These machine learning-derived SD products, now publicly available through the National Cryosphere Desert Data Center (https://www.ncdc.ac.cn/portal/, accessed on 20 February 2025), provide unprecedented opportunities for systematic snow research in China.
Arid northwest China, encompassing 25% of the nation’s land area but only 3.3% of its surface water resources, demonstrates exceptional dependence on snowmelt-derived hydrological inputs. Hydrological modeling studies estimate that 1 °C warming could advance snowmelt timing by 5–8 days and reduce summer runoff by 12–25% in Tianshan-fed catchments [18]. Snowmelt contributes 20–70% of total runoff across various basins in this ecologically fragile region [5]. Remote sensing analyses have revealed complex spatiotemporal patterns in snow cover characteristics. Studies of SP indicate that winter snow cover days showed an increasing trend at rates ranging from −2.0 to 7.9 days per decade during 1961–2010, while recent observations (2002–2017) documented a decreasing snow duration trend in the Tianshan Mountains [19,20]. Multisensor fusion approaches combining MODIS and passive microwave data have identified elevation-dependent snow decline patterns, with 300–500 m altitude zones experiencing most significant reduction in snow persistence [21]. Simultaneously, snow cover percentage (SCP) in the Altai Mountains exhibited a marginal decline of 0.88% per decade from 2001 to 2020 [22]. Spatial analyses further demonstrate that snow depth (SD) and snow water equivalent (SWE) distributions during 1978–2015 followed a distinct north–south gradient, with maximum values consistently observed in northern mountain ranges [23]. Ground-penetrating radar validation campaigns in Qilian Mountains confirm that satellite-derived SWE estimates capture 75–85% of spatial variability observed in field measurements [24].
Accurately quantifying snow resources in arid northwest China remains challenging due to sparse ground data and inconsistencies across remote sensing products. This study presents a comprehensive assessment of snow cover dynamics in arid northwest China since 2000, using multisource remote sensing data (MODIS, AMSR, GlobSnow v2.0, and Global Land Data Assimilation System [GLDAS v2.0/2.2]). We analyze spatiotemporal variations across four key indicators (SCA, SP, SD, and SWE) and evaluate inter-indicator consistency to improve the reliability of snow resource estimates derived from heterogeneous datasets. Our findings provide critical insights for water resource planning and climate change adaptation in this vulnerable region.

2. Study Area

Arid northwest China spans 73°E–107°E and 35°N–50°N, encompassing the Xinjiang, Hexi Corridors, and Qaidam Basin across a total area of 2.35 × 10⁶ km2. This region exhibits extreme topographic contrasts, with elevations ranging from the world’s highest peaks (>8000 m) in mountain ranges to −161 m, one of Earth’s lowest inland basins. Characterized by a hyper-arid climate, annual precipitation averages < 200 mm due to its continental interior position and orographic barriers posed by surrounding mountains, including the Altai, Tianshan, Kunlun, and Qilian ranges [25]. These unique geographic and topographic conditions create a climate-sensitive hotspot for studying cryospheric atmospheric interactions.
Based on China’s secondary basin classification system [26], the study area was subdivided into 11 hydrological subregions (Figure 1). The Taklimakan Desert and Tarim Basin were excluded due to negligible snowfall contributions. Nine analyzed subregions comprise: Altai Mountains (ATM), Qaidam Basin (QDB), Gurbantunggut Desert (GTD), Hexi Inland Region (HIR), North Kunlun Mountains (NKM), Tarim River Region (TRR), North Tianshan Mountains (NTM), Tuha Basin (THB), and Ili River Basin (IRB). The delineation of the study area explicitly incorporates mountain subsystems of the Qilian, Altai, Tianshan, and Kunlun ranges, as these orographic features constitute the predominant source of the region’s water resources through seasonal snow accumulation and melt processes.

3. Data and Methods

3.1. Data Source

3.1.1. Snow Cover Area

The SCA data were obtained from the Moderate Resolution Imaging Spectroradiometer (MODIS) 8-day composite snow product MOD10A2 (Collection 6) with a spatial resolution of 500 m [27]. This product effectively minimizes cloud contamination (mean cloud coverage < 15%) through temporal aggregation [28]. We performed data calibration using preprocessing tools provided by the National Snow and Ice Data Center (NSIDC) and applied an enhanced cloud-masking algorithm to fill residual data gaps. The study period spans 23 hydrological years (HY) from 1 September 2000 to 31 August 2023. All temporal analyses were synchronized using the NASA-standard Julian Date System, with spatial projections uniformly converted to the WGS84/UTM zone 45N coordinate system.

3.1.2. Snow Phenology

SP, including snow cover duration (SCD), snow onset date (SOD), and snow end date (SED), were obtained from the National Cryosphere Desert Data Center (http://www.ncdc.ac.cn, accessed on 8 May 2025) for 2000–2020 [29]. The dataset integrates cloud-free Landsat-5 TM and Landsat-8 OLI imagery (500 m resolution), optimized for Chinese terrain through forest/non-forest classification adjustments, spatiotemporal Hidden Markov Modeling for cloud removal, and interpolation with microwave-derived snow depth data. Validation results demonstrated strong agreement with ground observations: SCD achieved an R2 of 0.94 (RMSE = 12.09 d, MAE = 7.60 d), SOD showed R2 = 0.79 (RMSE = 12.24 d, MAE = 4.6 d), and SED yielded R2 = 0.56 (RMSE = 19.89 d, MAE = 7.74 d).

3.1.3. Snow Depth

SD data (2000–2023, 0.25° resolution) were acquired from the National Tibetan Plateau Data Center (https://data.tpdc.ac.cn/, accessed on 8 May 2025). The dataset was generated using a random forest algorithm trained on 43,340 ground stations, incorporating passive microwave observations (AMSR-E/AMSR2), satellite-derived products (NHSD, Northern Hemisphere Snow Depth Dataset, GlobSnow v2.0), reanalysis data (ERA-Interim, MERRA-2), and environmental covariates such as elevation and land cover [30]. This multisource integration enables robust SD estimation across heterogeneous landscapes.

3.1.4. Snow Water Equivalent

The SWE dataset (2000–2023, 0.25° spatial resolution) was obtained from the Global Land Data Assimilation System (GLDAS Versions 2.0/2.2, accessible via https://search.earthdata.nasa.gov, accessed on 8 May 2025). This multi-decadal reanalysis product integrates three key components: (1) Princeton Global Meteorological Forcing Data with bias-corrected precipitation inputs [31], (2) an upgraded Noah Land Surface Model (Version 3.6) incorporating fractional snow cover dynamics and snow density-temperature coupling mechanisms, and (3) assimilated passive microwave observations from AMSR-E (2002–2011) and SSM/I (2000–2002) satellites. The ensemble Kalman filter technique was implemented to minimize uncertainties in snowpack stratification simulations [32].

3.1.5. Meteorological Data

Monthly temperature and precipitation data (2000–2023) at 0.1° × 0.1° horizontal resolution were obtained from ERA5, the fifth-generation ECMWF reanalysis product. This dataset integrates advanced 4D-Var data assimilation with Cycle 41r2 of the Integrated Forecasting System (IFS). Data access via the Copernicus Climate Data Store (https://cds.climate.copernicus.eu, accessed on 8 May 2025) followed CAMS-312 protocol validation procedures [33]. To survey the linkages between SCA changes and climate variations, the monthly temperature and precipitation data from 2000 to 2023 are extracted from this dataset.

3.1.6. Digital Elevation Model

A 30 m Shuttle Radar Topography Mission (SRTM) digital elevation model (DEM) from the USGS Earth Explorer platform (https://earthexplorer.usgs.gov, accessed on 8 May 2025) was used. Subregional elevation characteristics were quantified through zonal averaging of the DEM data.

3.2. Research Methods

3.2.1. Snow Indicators

(a)
Snow cover area
The snow cover area was calculated as the ratio of snow-covered area to total land area within each subregion [34], expressed as:
S C A = N s N t × S
where N s represents the number of pixels classified as snow cover, N t denotes the total number of pixels in the study area, and S represents the total area of the study area (unit: km2). Daily SCA values were derived from MOD10A2 8-day composites, aggregated to annual means using hydrological year.
(b)
Snow phenology
Three indicators were used: SCD, SOD, and SED. The SCD is defined as the number of days in which a certain grid point is covered by snow in a hydrological year. It is calculated with the following equation:
S C D = i = 1 n i s s n o w i
where i s s n o w i = 1 indicates that the pixel is covered by snow, whereas i s s n o w i = 0 indicates snow-free conditions. n represents the total number of days within the hydrological year. SOD values greater than 365 were classified into the next year, while SOD values less than 1 were classified into the previous year. The start and end of the snow-cover season were defined based on the fixed date method that was described in the work by Wang and Xie [35].
S O D = D 1 S C D 1
where D 1 represents the Julian day of 20 January, corresponding to the date when the snow cover area reaches its maximum in arid northwest China. S C D 1 denotes SCD from 1 September of that year to 20 January of the following year.
S E D = D 2 + S C D 2
where D 2 represents the Julian day of 21 January and S C D 2 denotes SCD from 21 January to 31 August.
(c)
SD and SWE
SD for each pixel was calculated by hydrological year:
S D m a x ( i , j ) = m a x ( S D 1 ( i , j ) , S D 2 ( i , j ) , , S D n ( i , j ) )
where S D m a x i , j represents the maximum SD for the pixel i , j , and S D 1 i , j ,   S D 2 i , j , , S D n i , j denotes the SD values for the pixel i , j across different images.
A similar calculation method was used for SWE.
(d)
Snow mass
S n o w   m a s s = i = 1 n S W E i × S i
where i represents the pixel of the study area and S represents the area of the study area. We obtained the total snow mass in kilograms or tons.

3.2.2. Trend Analysis

In this study, the Mann–Kendall (MK) method was used for trend analysis. The MK nonparametric statistical test does not require samples to follow a specific distribution and is not affected by a few outliers [36]. Based on the given n time series variables x 1 , x 2 , x n , the test statistic S is defined as follows:
S = j = 1 n 1 k = j + 1 n s g n ( x k x j )
where x k and x j represent variable values for years k and j ( k > j ), respectively. The value of s g n ( x k x j ) corresponds to 1, 0, and −1 when x k x j is positive, zero, and negative, respectively.
Further, S was tested using the Z M K value as follows:
  Z M K S 1 v a r S , S > 0   0   ,   S = 0 S + 1 v a r S , S < 0
where v a r S represents the variance in S. At a specified significance level α , if Z 1 α / 2 < Z M K < Z 1 α / 2 , the time series exhibits no significant trend. Meanwhile, if Z M K Z 1 α / 2 or Z M K > Z 1 α / 2 , the time series show a significant increasing or decreasing trend.
The variation trend of the snow indicators in arid northwest China was calculated using Sen’s slope method [37].
S e n i = M e d i a n x j x k j k
where x k and x j represent the variable values for years k and j   k < j , respectively, and i N * . If each period has a data value (with t representing the period), then n = t t 1 / 2 .   S e n i is determined from the parity of n :
S e n = S e n t + 1 / 2 ,   n = 2 k + 1 S e n t / 2 + S e n t / 2 / 2 , n = 2 k

3.2.3. Consistency Evaluation

To evaluate the consistency among different indicators, we employed Spearman’s rank correlation coefficient for correlation analysis. This coefficient measures the correlation between the rankings of two variables. If the values of these two variables exhibit a monotonically decreasing or increasing trend, the Spearman coefficient ranges from −1 to 1. When the Spearman rank correlation coefficient approaches 1, the two variables are perfectly positively correlated; when the coefficient equals −1, they are perfectly negatively correlated. If the coefficient equals 0, the two variables are uncorrelated [38].
ρ = 1 6 d i 2 n n 2 1
where d i represents the difference in rankings for each data pair and n represents the sample size. In this study, we standardized multisource datasets of SCA, SCD, SD, and SWE to a uniform spatial resolution of 0.25° using bilinear resampling, and subsequently applied Spearman’s rank correlation coefficient to analyze their interdependencies.

4. Results and Discussion

4.1. Variation in SCA

4.1.1. SCA in Arid Northwest China

The interannual variation in maximum SCA across arid northwest China from 2000 to 2023 exhibited marked fluctuations (Figure 2a). Over the study period, SCA displayed an overall declining trend at a rate of 7.13 × 10³ km2 per year, with annual maxima ranging from 7.25 × 10⁵ km2 (2014) to 1.28 × 10⁶ km2 (2010) and a mean value of 9.30 × 10⁵ km2. Between 2000 and 2010, SCA showed frequent high-amplitude fluctuations with a nonsignificant increasing trend (1.45 × 10⁴ km2 per year). After 2010, the fluctuation amplitude decreased, accompanied by an insignificant declining trend (1.32 × 10⁴ km2 per year).
Monthly SCA followed distinct seasonal patterns (Figure 2b). Snow cover began accumulating in October, peaked in January (1.29 × 10⁶ km2), and underwent rapid ablation from March to April across the study area. The snowmelt rate slowed after May, reaching minimum SCA values in July.

4.1.2. Annual SCA in Each Subregion

The vast spatial extent and climatic heterogeneity of northwest China’s arid regions drive substantial spatiotemporal variability in snow cover characteristics. Monthly SCA analysis across subregions (Figure 3) revealed distinct seasonal patterns. ATM and IRB exhibited maximum SCA during November-March, peaking in December (ATM: 9.53 × 10⁴ km2, IRB: 8.85 × 10⁴ km2) and January (NKM: 1.54 × 10⁵ km2, QDB: 1.72 × 10⁵ km2). Notably, four subregions (IRB, TRR, NKM, and QDB) maintained summer SCA values near 20%, coinciding with higher mean elevations (>2700 m) and cool, wet conditions in July-August (Figure 4, Table 1).
Snow ablation timing varied latitudinally, with northern areas experiencing melt initiation around March compared to February in southern zones. The GTD exhibited the most rapid spring melt (March–April), attributable to synergistic effects of rising temperatures, intense solar radiation, low humidity, and sparse vegetation facilitating wind-driven sublimation [39,40]. Minimum SCA occurred in August for all subregions except the IRB, where July minima aligned with observed precipitation increases since 2000 [41]. Interannual SCA variations further confirmed the IRB’s unique summer moisture regime, demonstrating peak precipitation in July.

4.2. Spatiotemporal Variations in SP

SP serves as a critical indicator for evaluating snowpack dynamics in arid northwest China. Temporal trends in SP indicators were analyzed using the MK test and Sen’s slope estimator, with variation magnitudes categorized in Table 2. Spatial analysis revealed that SOD occurred earlier in mountainous regions than in desert region (Figure 5a), with 59.40% of the study area exhibiting advancing SOD trends. The ATM, characterized by high latitude and elevation, experienced the earliest SOD in September, while the GTD typically recorded SOD in November.
SED displayed contrasting spatial patterns, persisting later in mountainous areas and earlier in low-altitude regions (Figure 5c). The latest SED extended to August in the ATM, June-July in the NTM and NKM, mid-October in the HIR, and September–October in the QDB. Trend analysis demonstrated that 75.06% of the region experienced earlier SED, particularly pronounced in northern subregions, with 83.57% of the GTD and 80.35% of the ATM showing this trend (Figure 5d).
SCD in arid northwest China exhibited a pronounced north–south gradient, with elevated values in mountainous zones contrasting sharply with minimal durations in desert basins (Figure 5e). Northern regions demonstrated a modal SCD of 10–50 days, while mean values ranged between 100 and 150 days. The ATM, NTM, and NKM exhibited exceptional SCD persistence, surpassing 300 days. In contrast, southern regions including the HIR and QDB maintained substantially shorter mean SCD durations of 1–50 days. Analysis of temporal trends (Figure 5f) revealed a declining SCD pattern across 62.40% of the study area, most notably in the ATM, NKM, and IRB. This reduction principally resulted from accelerated snowpack ablation linked to earlier SED in these regions.
SP displayed marked spatial heterogeneity, with northern mountain systems characterized by earlier SOD, delayed SED, and consequently prolonged SCD relative to southern lowlands. Interannual analysis demonstrated increasing SCD durations in northern mountainous areas concurrent with advancing SOD. This shift in the SOD may be attributed to alterations in precipitation patterns associated with regional warming [42].

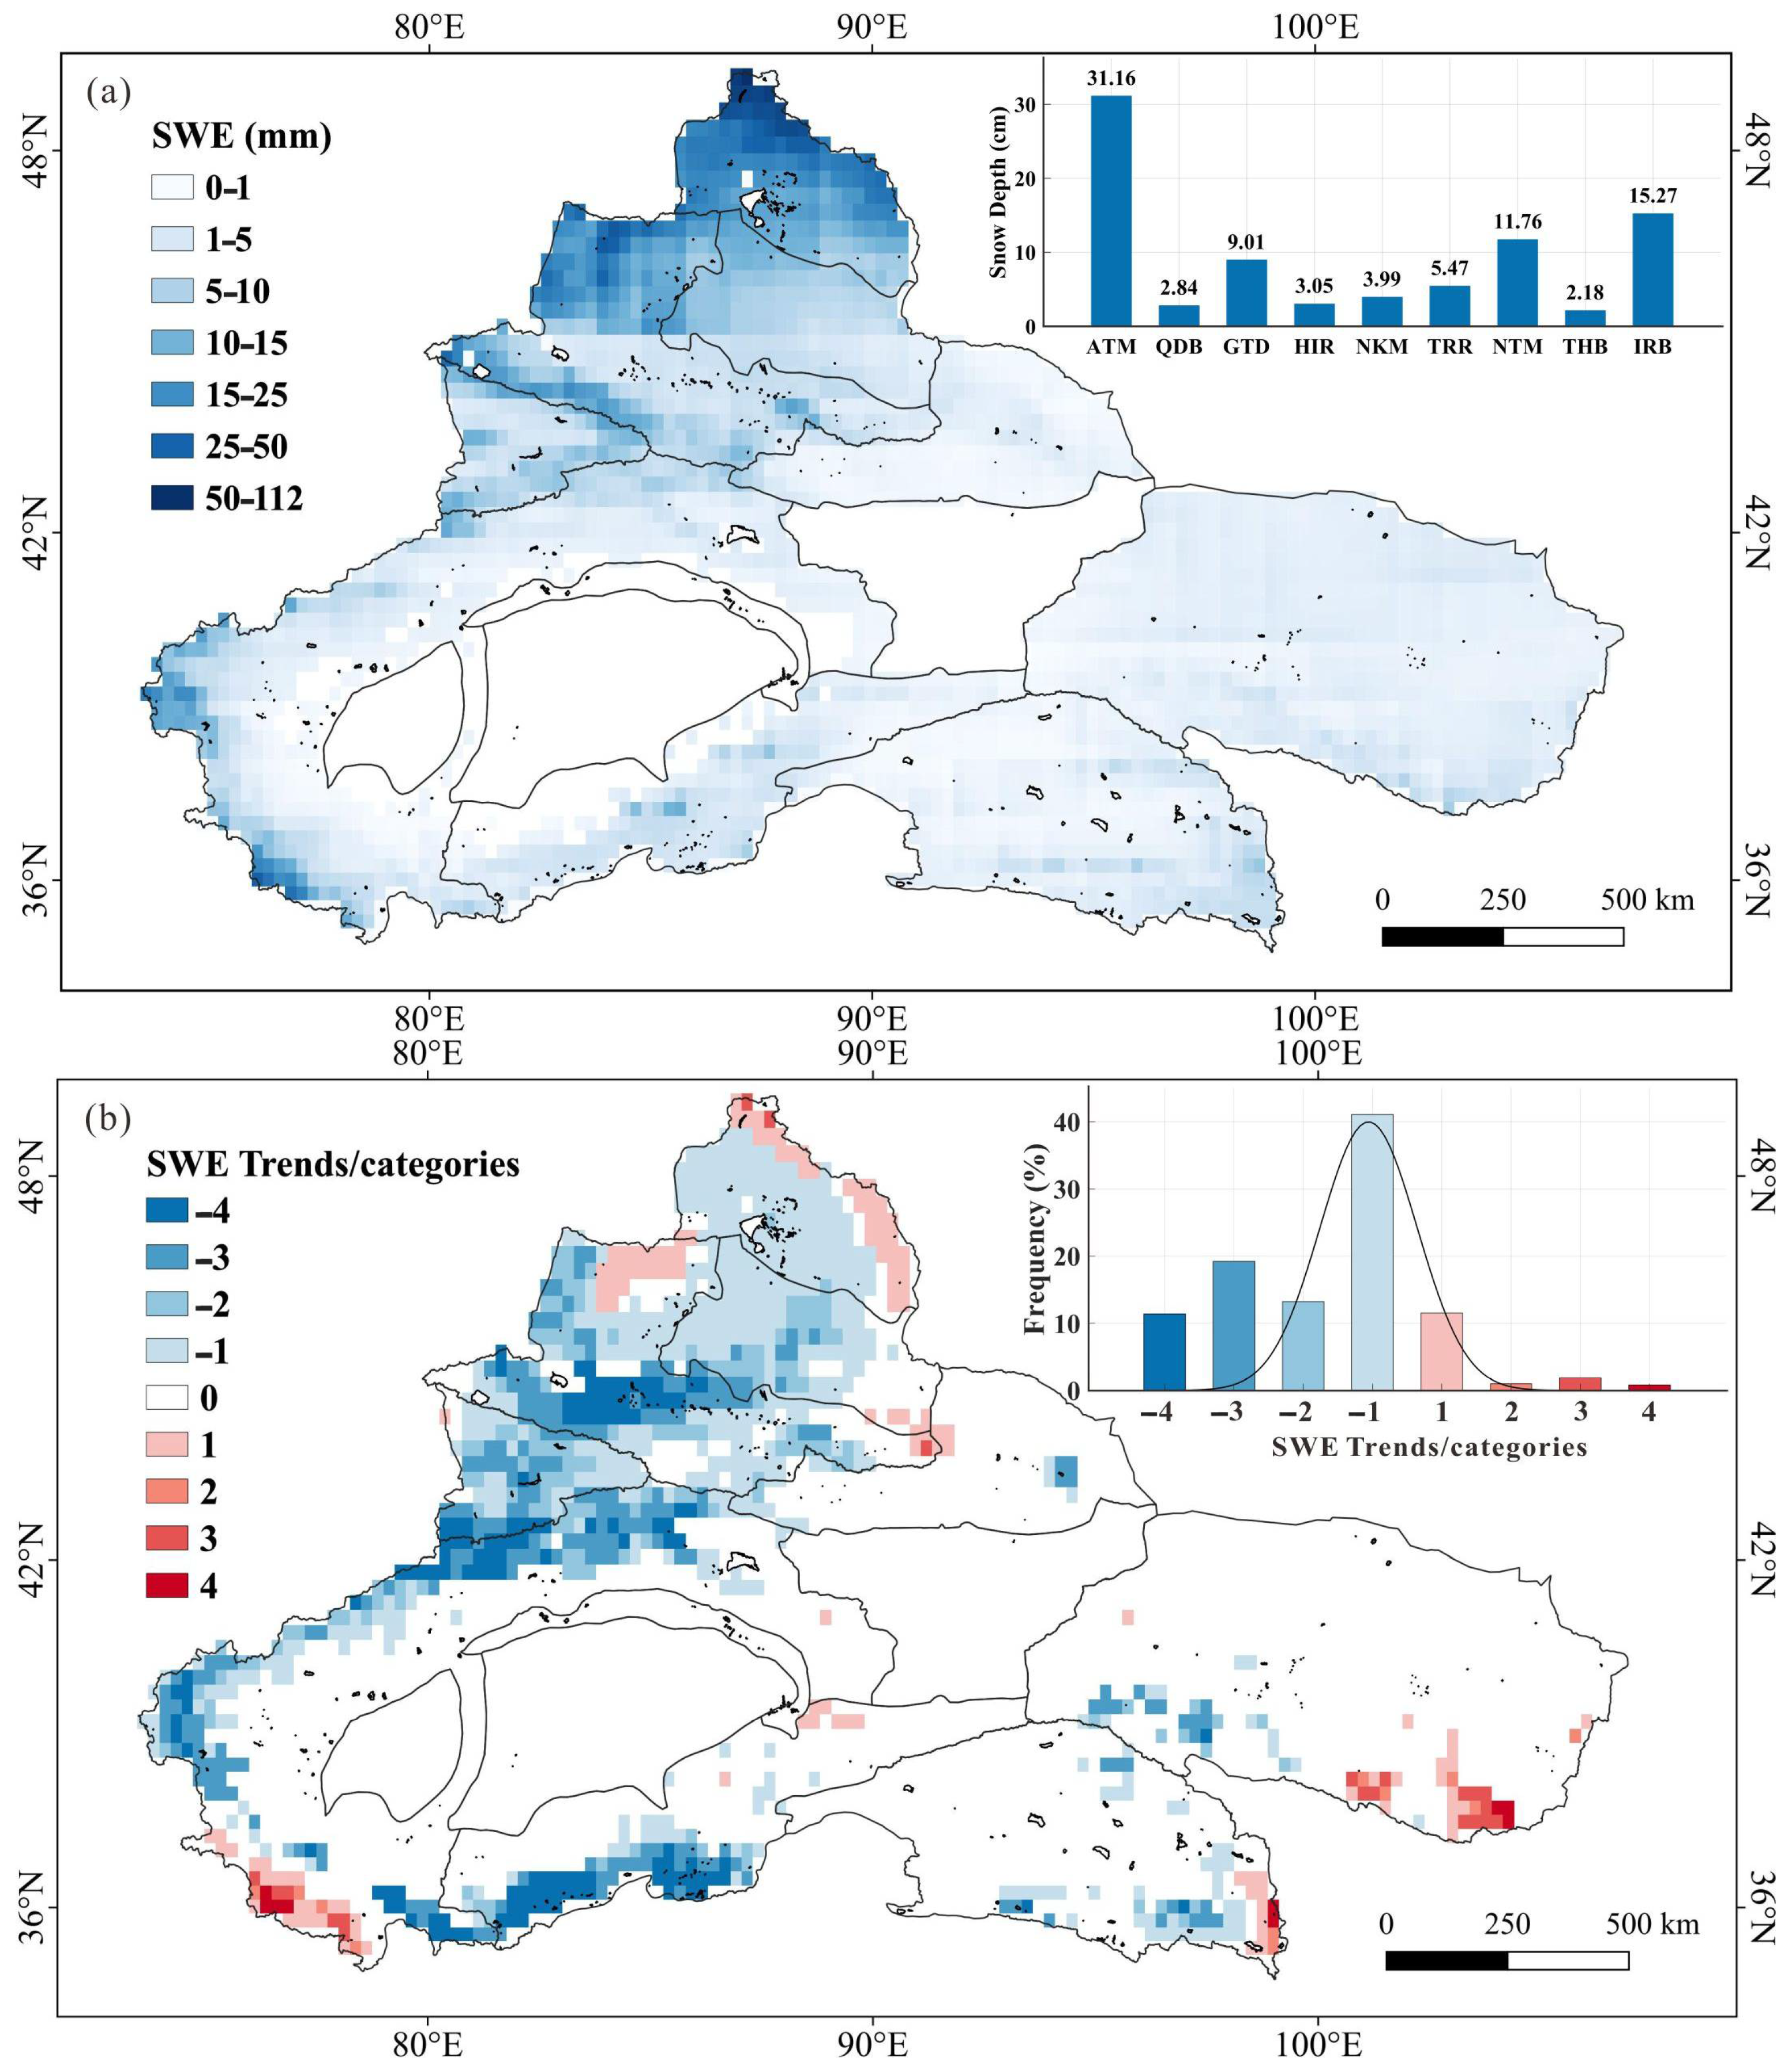
4.3. Spatiotemporal Variations in SD and SWE

The spatial distribution of SD in arid northwest China during 2000–2023 revealed a pronounced latitudinal gradient, with maximum values in northern mountainous zones and minimum values in southern zones (Figure 6a). Northern zones exhibited extreme SD magnitudes up to 143 cm, contrasting sharply with southern regions where SD remained ≤10 cm. Subregional analysis identified moderate SD ranges (20–60 cm) in the ATM, NTM, and GTD. The northern ATM sector maintained exceptional snow accumulation (>100 cm mean SD), while the southwestern QDB and HIR recorded minimal values of 4.4 cm and 3.6 cm, respectively.
Trend analysis demonstrated widespread SD reductions across 75.09% of the study area from 2000 to 2023 (Figure 6b). The TRR and THB experienced the most severe declines, with SD decreases affecting 94.44% and 85.80% of their respective areas. In contrast, the IRB and NKM exhibited localized SD increases, showing positive trends across 51.72% and 56.94% of their spatial extents, respectively.
The spatial distribution of SWE in arid northwest China during 2000–2020 demonstrated distinct geographic heterogeneity (Figure 7a). Maximum SWE values (>100 mm) clustered in northern sectors and southern NKM, with the ATM exhibiting both the peak single-point measurement (112.61 mm) and highest regional mean (31.16 mm). This spatial pattern reflects combined effects of orographic precipitation enhancement and prolonged SCD in mountainous zones. Secondary maxima occurred in the NTM (11.76 mm mean) and IRB (15.26 mm), while the QDB maintained minimal SWE values (0–5 mm).
Interannual SWE variations revealed a dominant depletion trend, with 84.85% of the study area experiencing declines from 2000–2020 (Figure 7b). The most severe reductions occurred in the NTM (94.61% area affected) and IRB (90.64%), followed by the TRR (86.18%). These trends contrast with the ATM’s relative stability, highlighting divergent hydrological responses to regional climate changes across mountain-basin systems.
The total snow mass in arid northwest China is estimated at approximately 108.95 million tons, with pronounced spatial heterogeneity in its distribution. Northern Xinjiang dominates the regional snow storage, containing 66.24 million tons (60.8% of the total) across five subregions: the ATM, GTD, NTM, IRB, and THB. Southern Xinjiang accounts for 37.44 million tons (34.4%), primarily distributed in the TRR and NKM. The HIR retains the residual 5.27 million tons.

4.4. Consistency Analysis

Table 3 demonstrates statistically robust positive correlations among the four snow indicators, confirming strong internal consistency across the dataset. Due to shared data provenance, both SCA and SP indicators originated from MODIS, and direct consistency evaluation between SCA and SCD was excluded. Correlations exceeded thresholds of practical significance, with SCA versus SD and SCD versus SD pairs showing Spearman rank >0.96. The SD–SWE relationship remained highly significant (Spearman rank = 0.8636), particularly in subregions experiencing marked SD reductions such as the TRR and QDB, where SD declines drove measurable SWE depletion.
Integrated analysis of the four snow indicators across arid northwest China reveals marked spatial heterogeneity in snow cover trends (Figure 8). A dominant decline pattern emerged, with 55.56% of the study area experiencing >50% reductions in SCA, SCD, SD, and SWE. This depletion was most severe in the THB, where all four indicators decreased by >85%, indicating substantial snow resource depletion. Similarly, declining trends affected >60% of the ATM, NKM, and TRR. In contrast, the QDB exhibited positive trends, with 56.70% and 68.28% of its area showing SCD and SCA increases, respectively, a pattern potentially enhancing water resource availability and ecosystem resilience in this hyper-arid basin.
Analysis of indicator consistency revealed that 55.56% of the study area exhibited complete multi-indicator coherence, defined as four or more snow indicators showing unidirectional trends across over 50% of the subregion. Strong consistency (three concordant indicators) characterized 33.33% of the area, with the remainder demonstrating moderate agreement. The SD in the NTM and IRB showed an increasing trend, but SCA, SWE, and SCD were decreasing. This result could be attributed to increased precipitation in these subregions, leading to enhanced snow accumulation [43]. Notably, the higher temperatures of these two subregions might have accelerated the snowmelt process. Both SCD and SCA increased in the QDB, whereas SWE and SD decreased. Liu [44] indicated that the QDB, although receiving little snowpack on the Tibetan Plateau, exhibited the annual average SCD, with variations showing a decrease of 4.81 days per decade from 1981 to 2010. The QDB experienced a conspicuous wet-warm climate shift during the growing season between 2000 and 2021 [45], a major factor underlying the improvements in surface greenness. Increased precipitation and accelerated snowmelt due to climate change will likely decrease the SD and SWE.
Subregional vulnerability patterns highlighted differential responses to climate change. The TRR experienced pronounced SD reductions (85% area affected), whereas the THB showed extreme SCD contraction (94.44% area). Mountain systems including the NTM, GTD, and IRB exhibited widespread SWE declines (>80% area), consistent with Northern Hemisphere mid-latitude snowpack reductions driven primarily by warming-induced precipitation phase shifts [46]. Mankin and Diffenbaugh [47] reported that rising temperatures are the primary drivers of reductions in SWE, although changes in precipitation may also contribute in some regions. SWE in the mid-latitude regions of the Northern Hemisphere is expected to decrease significantly in the coming decades, particularly during the spring. Furthermore, forest canopies influence the under-canopy snowpack net total radiation energy balance by enhancing longwave radiation [48], which, in turn, can potentially accelerate snowmelt [49].
Increasing temperatures are the primary factors leading to a decrease in snow resources in the mid-latitude areas of the Northern Hemisphere, as they shorten the SCD and accelerate snowmelt. Although precipitation patterns influence SCA, temperature is the dominant factor affecting its trends [42]. Even though mountain areas may experience increased snowfall, faster snowmelt and shorter snow accumulation periods will result in an overall reduction in SD [50]. Gottlieb and Mankin [51] found that as global temperatures increase, snow cover will persistently diminish, entailing significant consequences for water resources, ecosystems, and human activities. In conclusion, global warming contributes to the reduction of SCD, SCA, and SD, as accelerated snowmelt and shorter snow periods collectively drive their decline.
The spatial heterogeneity of snowpack dynamics observed in arid northwest China exhibits both consistencies and divergences with broader Northern Hemisphere trends [8]. At hemispheric scales, mid-latitude snow-dominated regions have experienced widespread declines in SWE and SCD over recent decades, driven predominantly by warming-induced precipitation phase shifts and accelerated melt [52]. This aligns with the pronounced SWE reductions (>80% area) observed in mountainous subregions (NTM, GTD, IRB), where rising temperatures have destabilized seasonal snow reservoirs despite increased precipitation [53,54]. Similarly, the extreme SCD contraction in the THB (94.44% area) mirrors hemispheric patterns of compressed snow seasons, particularly in low-elevation basins vulnerable to rain–snow transitions [55,56]. However, the transient increases in SCA and SCD within the QDB contrast sharply with these trends, underscoring the modulating role of localized atmospheric interactions [57]. Such subregional exceptions highlight the limitations of extrapolating hemispheric-scale generalizations to topographically complex zones [58]. Notably, the divergent responses of SD and SWE in the NTM and IRB—where SD increased despite SWE declines—reflect a critical divergence from global patterns. In most Northern Hemisphere regions, warming synchronously reduces both SD and SWE by shortening accumulation periods and enhancing melt [8]. Here, increased cold-season precipitation temporarily elevates SD, but higher temperatures and enhanced longwave radiation under forest canopies preferentially deplete SWE, decoupling these indicators [59]. This underscores the region’s transitional vulnerability: while still receiving moisture sufficient for snow accumulation, rising energy fluxes are progressively overwhelming its capacity to retain seasonal snow [60].
The reduction in snow resources is expected to have wide-ranging and substantial impacts on arid northwest China. Snowmelt serves as a critical source of water replenishment for rivers and reservoirs within this area. Consequently, a decline in snow resources can considerably reduce surface runoff, leading to a decrease in water resource availability and affecting agricultural irrigation [61]. Moreover, the reduction lowers surface albedo, exacerbating surface warming and accelerating regional climate change. As climate change intensifies, arid northwest China may experience more frequent and severe extreme weather events, such as heavy rainfall and flooding [62]. This synthesis establishes warming as the principal driver of cryospheric degradation in arid northwest China, with spatially heterogeneous impacts governed by orographic and atmospheric interactions. The differential subregional responses—from QDB’s transient snow gains to TRR’s acute SD losses—underscore the necessity for adaptive water management strategies addressing both diminishing snow reserves and escalating climate risks.

5. Conclusions

Multisource remote sensing reveals complex snow cover changes across arid northwest China since 2000, with significant regional differences and accelerating cryospheric changes. The annual SCA showed a slight decline of 7.13 × 10³ km2, punctuated by extreme interannual variability. SCA reached a peak of 1.28 × 10⁶ km2 during the 2010 snow anomaly and dropped to a low of 7.25 × 10⁵ km2 in 2014. Seasonal snow patterns varied, with northern regions peaking in December and southern regions in January. High-altitude areas such as the IRB, TRR, NKM, and QDB maintained summer snow cover due to cooler temperatures and increased precipitation.
SCD has shortened in 62.4% of the study area, mainly due to earlier SED. A clear north–south gradient was observed in SD, with 75.09% of the region experiencing decreases, most notably in the TRR, where 94.44% of the area was affected. In contrast, 51.72% of the IRB showed increases in SD. SWE showed similar patterns, decreasing in 84.85% of the region, with the most severe losses in the NTM, where 94.61% of the area was affected. Regional snow mass estimates a total of 108.95 million tons, distributed as 66.24 million tons (northern Xinjiang), 37.44 million tons (southern Xinjiang), and 5.27 million tons (HIR).
Overall, about 55.56% of the study area showed a decline in snow cover, with strong consistency among all snow indicators in most subregions, except for the QDB. Significant reductions in SD and SCD were observed in the TRR and THB, while extensive SWE loss occurred in the NTM and IRB. These changes are largely driven by rising temperatures and reduced snowfall.
In summary, snow resources across arid northwest China have declined significantly since 2000, posing growing challenges for ecological protection and water-dependent socioeconomic development in this climate-sensitive region.

Author Contributions

Conceptualization, S.B., W.Z. and A.C.; methodology, S.B., W.Z. and A.C.; software, S.B.; formal analysis, S.B. and W.Z.; writing—original draft preparation, S.B., W.Z. and A.C.; writing—review and editing, S.B., W.Z., A.C., L.J., X.W. and Y.H.; visualization, S.B. and W.Z.; supervision, A.C., X.W. and Y.H.; project administration, W.Z. and A.C.; funding acquisition, W.Z., A.C. and X.W. All authors have read and agreed to the published version of the manuscript.

Funding

This work was supported by the National Key R&D Program of China (2024YFE0113200), National Natural Science Foundation of China (No. 42471162, 42471512), Natural Science Foundation of Gansu Province (23JRRA583), and Natural Science Basic Research Program of Shaanxi Province (No. 2023–JC–QN–0300).

Data Availability Statement

The results of the analysis are available upon request to the authors of the paper. The MOD10A2 products are freely available from https://earthdata.nasa.gov/, accessed on 8 May 2025. Snow phenology data were acquired from the National Cryosphere Desert Data Center (http://www.ncdc.ac.cn, accessed on 8 May 2025). Snow depth data were acquired from the National Tibetan Plateau Data Center (https://data.tpdc.ac.cn/, accessed on 8 May 2025). Snow water equivalent data were derived from the Global Land Data Assimilation System (https://search.earthdata.nasa.gov, accessed on 8 May 2025). ERA5 data are openly available from Copernicus Climate Change Service at https://cds.climate.copernicus.eu/, accessed on 8 May 2025. DEM were acquired from the USGS Earth Explorer platform (https://earthexplorer.usgs.gov, accessed on 8 May 2025).

Conflicts of Interest

The authors declare no conflicts of interest.

References

  1. Bookhagen, B.; Burbank, D.W. Toward a Complete Himalayan Hydrological Budget: Spatiotemporal Distribution of Snowmelt and Rainfall and Their Impact on River Discharge. J. Geophys. Res. Earth Surf. 2010, 115, 2009JF001426. [Google Scholar] [CrossRef]
  2. Deng, G.; Tang, Z.; Hu, G.; Wang, J.; Sang, G.; Li, J. Spatiotemporal Dynamics of Snowline Altitude and Their Responses to Climate Change in the Tienshan Mountains, Central Asia, during 2001–2019. Sustainability 2021, 13, 3992. [Google Scholar] [CrossRef]
  3. Tang, Z.; Wang, X.; Deng, G.; Wang, X.; Jiang, Z.; Sang, G. Spatiotemporal Variation of Snowline Altitude at the End of Melting Season across High Mountain Asia, Using MODIS Snow Cover Product. Adv. Space Res. 2020, 66, 2629–2645. [Google Scholar] [CrossRef]
  4. Tang, Z.; Deng, G.; Hu, G.; Zhang, H.; Pan, H.; Sang, G. Satellite Observed Spatiotemporal Variability of Snow Cover and Snow Phenology over High Mountain Asia from 2002 to 2021. J. Hydrol. 2022, 613, 128438. [Google Scholar] [CrossRef]
  5. Yang, Y.; Chen, R.; Liu, G.; Liu, Z.; Wang, X. Trends and Variability in Snowmelt in China under Climate Change 2021. Hydrol. Earth Syst. Sci. 2021, 2021, 1–35. [Google Scholar]
  6. Deng, J.; Huang, X.; Feng, Q.; Ma, X.; Liang, T. Toward Improved Daily Cloud-Free Fractional Snow Cover Mapping with Multi-Source Remote Sensing Data in China. Remote Sens. 2015, 7, 6986–7006. [Google Scholar] [CrossRef]
  7. Deng, G.; Liu, X.; Shen, Q.; Zhang, T.; Chen, Q.; Tang, Z. Remote Sensing Data Assimilation to Improve the Seasonal Snow Cover Simulations Over the Heihe River Basin, Northwest China. Int. J. Climatol. 2024, 44, 5621–5640. [Google Scholar] [CrossRef]
  8. Brown, R.D.; Mote, P.W. The Response of Northern Hemisphere Snow Cover to a Changing Climate. J. Clim. 2009, 22, 2124–2145. [Google Scholar] [CrossRef]
  9. Fan, Y.; Yu, J.; Liu, W. Cross-Comparison of Snow Albedo Products Derived from Satellite (Sentinel-2 and Landsat 8) Optical Data. IOP Conf. Ser. Earth Environ. Sci. 2021, 658, 012048. [Google Scholar] [CrossRef]
  10. Bormann, K.J.; Brown, R.D.; Derksen, C.; Painter, T.H. Estimating Snow-Cover Trends from Space. Nat. Clim. Change 2018, 8, 924–928. [Google Scholar] [CrossRef]
  11. Kuraś, P.K.; Weiler, M.; Alila, Y. The Spatiotemporal Variability of Runoff Generation and Groundwater Dynamics in a Snow-Dominated Catchment. J. Hydrol. 2008, 352, 50–66. [Google Scholar] [CrossRef]
  12. Hancock, S.; Baxter, R.; Evans, J.; Huntley, B. Evaluating Global Snow Water Equivalent Products for Testing Land Surface Models. Remote Sens. Environ. 2013, 128, 107–117. [Google Scholar] [CrossRef]
  13. Wang, J.; Che, T.; Dai, L.Y.; Yue, S.N.; Zheng, Z.J. Spatio-Temporal Comparison of Snow Depth between Passive Microwave Remote Sensing Inversion Data and Meteorological Station Observation Data. Natl. Remote Sens. Bull. 2023, 27, 2060–2071. [Google Scholar] [CrossRef]
  14. Wang, J.; Hao, X.; He, D.; Wang, J.; Li, H.; Zhao, Q. Snow Discrimination Algorithm in the Northern Hemisphere Based on AVHRR Image. J. Glaciol. Geocryol. 2022, 44, 316–326. [Google Scholar] [CrossRef]
  15. Wang, J.; Wang, Y.; Zhou, M.; Liu, C.; Huang, X. Retrieved Snow Depth over the Tibetan Plateau Using Random Forest Algorithm with AMSR2 Passive Microwave Data. J. Glaciol. Geocryol. 2020, 42, 1077–1086. [Google Scholar] [CrossRef]
  16. Yang, J.; Jiang, L.; Pan, J.; Shi, J.; Wu, S.; Wang, J.; Pan, F. Comparison of Machine Learning-Based Snow Depth Estimates and Development of a New Operational Retrieval Algorithm over China. Remote Sens. 2022, 14, 2800. [Google Scholar] [CrossRef]
  17. Li, H.; Ke, C.-Q.; Zhu, Q.; Li, M.; Shen, X. A Deep Learning Approach to Retrieve Cold-Season Snow Depth over Arctic Sea Ice from AMSR2 Measurements. Remote Sens. Environ. 2022, 269, 112840. [Google Scholar] [CrossRef]
  18. Chen, Y.; Li, Z.; Fan, Y.; Wang, H.; Deng, H. Progress and Prospects of Climate Change Impacts on Hydrology in the Arid Region of Northwest China. Environ. Res. 2015, 139, 11–19. [Google Scholar] [CrossRef]
  19. Ma, R.; Zhang, M.; Wang, S.; Wang, J.; Yang, S.; Chen, R. Variation Characteristics of Snow Cover Days in Winter in Arid Region of Northwest China in Last 50 Years. J. Nat. Resour. 2018, 33, 127–138. [Google Scholar] [CrossRef]
  20. Zhang, B.; Li, X.; Qin, Q. Evolution and Driving Factors of Snow Phenology in the Chinese Tianshan Mountainous Region. Remote Sens. Technol. Appl. 2022, 37, 1350–1360. [Google Scholar] [CrossRef]
  21. Wang, H.; Zhang, X.; Xiao, P.; Zhang, K.; Wu, S. Elevation-dependent Response of Snow Phenology to Climate Change from a Remote Sensing Perspective: A Case Survey in the Central Tianshan Mountains from 2000 to 2019. Int. J. Climatol. 2022, 42, 1706–1722. [Google Scholar] [CrossRef]
  22. Li, H.; Li, Z.; Chen, P. Spatio-Temporal Variation of Snow Cover in Altai Mountains of Xinjiang in Recent 20 Years and Its Influencing Factors. Arid Zone Res. 2023, 40, 1040. [Google Scholar] [CrossRef]
  23. Yang, Z.; Chen, R.; Liu, Z.; Zhang, W. Estimating Snow Water Equivalent Using Observed Snow Depth Data in China. J. Hydrol. Reg. Stud. 2024, 51, 101664. [Google Scholar] [CrossRef]
  24. McGrath, D.; Webb, R.; Shean, D.; Bonnell, R.; Marshall, H.-P.; Painter, T.H.; Molotch, N.P.; Elder, K.; Hiemstra, C.; Brucker, L. Spatially Extensive Ground-Penetrating Radar Snow Depth Observations During NASA’s 2017 SnowEx Campaign: Comparison With In Situ, Airborne, and Satellite Observations. Water Resour. Res. 2019, 55, 10026–10036. [Google Scholar] [CrossRef]
  25. Chen, Y.; Yang, Q.; Luo, Y.; Shen, Y.; Pan, X.; Li, L.; Li, Z. Ponder on the Issues of Water Resources in the Arid Region of Northwest China. Arid Land Geogr. 2012, 35, 1–9. [Google Scholar] [CrossRef]
  26. Shen, Y. National 1:250000 Three-Level River Basin Data Set. Natl. Cryosphere Desert Data Cent. 2019. [Google Scholar] [CrossRef]
  27. Deng, G.; Tang, Z.; Dong, C.; Shao, D.; Wang, X. Development and Evaluation of a Cloud-Gap-Filled MODIS Normalized Difference Snow Index Product over High Mountain Asia. Remote Sens. 2024, 16, 192. [Google Scholar] [CrossRef]
  28. Gafurov, A.; Bárdossy, A. Cloud Removal Methodology from MODIS Snow Cover Product. Hydrol. Earth Syst. Sci. 2009, 13, 1361–1373. [Google Scholar] [CrossRef]
  29. Zhao, Q.; Hao, X.; Wang, J.; Sun, X.; Li, H. A Dataset of Snow Cover Phenology in China Based on MODIS during 2000–2020. China Sci. Data 2022, 7. [Google Scholar] [CrossRef]
  30. Hu, Y.; Che, T.; Dai, L.; Xiao, L. Snow Depth Fusion Based on Machine Learning Methods for the Northern Hemisphere. Remote Sens. 2021, 13, 1250. [Google Scholar] [CrossRef]
  31. Wei, Q.; Zhong, X.; Zhao, W.; Zhang, T. Spatiotemporal Characteristics of Snow Water Resources in the Third Pole and the Arctic. J. Glaciol. Geocryol. 2023, 45, 665–675. [Google Scholar] [CrossRef]
  32. Takala, M.; Luojus, K.; Pulliainen, J.; Derksen, C.; Lemmetyinen, J.; Kärnä, J.-P.; Koskinen, J.; Bojkov, B. Estimating Northern Hemisphere Snow Water Equivalent for Climate Research through Assimilation of Space-Borne Radiometer Data and Ground-Based Measurements. Remote Sens. Environ. 2011, 115, 3517–3529. [Google Scholar] [CrossRef]
  33. Hersbach, H.; Bell, B.; Berrisford, P.; Hirahara, S.; Horányi, A.; Nicolas, J.; Peubey, C.; Radu, R.; Simmons, A.; Soci, C.; et al. The ERA5 Global Reanalysis. Q. J. R. Meteorol. Soc. 2020, 146, 1999–2049. [Google Scholar] [CrossRef]
  34. Qin, Y.; Ding, J.; Zhao, Q.; Liu, Y. Spatial-Temporal Variation of Snow Cover in the Tianshan Mountains from 2001 to 2015, and Its Relation to Temperature and Precipitation. J. Glaciol. Geocryol. 2018, 40, 249–260. [Google Scholar] [CrossRef]
  35. Wang, X.; Xie, H. New Methods for Studying the Spatiotemporal Variation of Snow Cover Based on Combination Products of MODIS Terra and Aqua. J. Hydrol. 2009, 371, 192–200. [Google Scholar] [CrossRef]
  36. Hamed, K.H.; Ramachandra Rao, A. A Modified Mann-Kendall Trend Test for Autocorrelated Data. J. Hydrol. 1998, 204, 182–196. [Google Scholar] [CrossRef]
  37. Sen, P.K. Estimates of the Regression Coefficient Based on Kendall’s Tau. J. Am. Stat. Assoc. 1968, 63, 1379–1389. [Google Scholar] [CrossRef]
  38. Kendall, M.G. A New Measure of Rank Correlation. Biometrika 1938, 30, 81–93. [Google Scholar] [CrossRef]
  39. Gao, J.; Wang, Y.; Hajigul, S.; Ali, M.; Liu, Y.; Zhao, X.; Yang, X.; Huo, W.; Yang, F.; Zhou, C. Characteristics of Surface Radiation Budget in Gurbantunggut Desert. J. Desert Res. 2021, 41, 47. [Google Scholar] [CrossRef]
  40. Wang, X.; Zhang, Y.; Jiang, J.; Chen, J.; Song, C. Variation Pattern of Soil Water Content in Longitudinal Dune in the Southern Part of Gurbantêggêt Desert: How SnowMelt and Frozen Soil Change Affect the Soil Moisture. J. Glaciol. Geocryol. 2006, 28, 262–268. [Google Scholar] [CrossRef]
  41. Sun, H.; Chen, Y.; Li, W.; Li, F.; Chen, Y.; Hao, X.; Yang, Y. Variation and Abrupt Change of Climate in Ili River Basin, Xinjiang. J. Geogr. Sci. 2010, 20, 652–666. [Google Scholar] [CrossRef]
  42. Ma, N.; Yu, K.; Zhang, Y.; Zhai, J.; Zhang, Y.; Zhang, H. Ground Observed Climatology and Trend in Snow Cover Phenology across China with Consideration of Snow-Free Breaks. Clim. Dyn. 2020, 55, 2867–2887. [Google Scholar] [CrossRef]
  43. Che, T.; Li, X.; Jin, R.; Armstrong, R.; Zhang, T. Snow Depth Derived from Passive Microwave Remote-Sensing Data in China. Ann. Glaciol. 2008, 49, 145–154. [Google Scholar] [CrossRef]
  44. Liu, Y.; Sun, Y.; Zhong, X.; Wang, S.; Xiao, X.; Ma, L.; Su, H.; Zhao, W.; Zhang, T. Changes of Snow Cover in the Third Pole and the Arctic. J. Glaciol. Geocryol. 2021, 43, 61–69. [Google Scholar] [CrossRef]
  45. Cao, X.; Zhu, C.; Chen, G.; Sun, S.; Zhao, H.; Zhu, W.; Zhou, B. Surface Greenness Change and Topographic Differentiation over Qaidam Basin from 2000 to 2021. Ecol. Environ. 2022, 31, 1080–1090. [Google Scholar] [CrossRef]
  46. Blau, M.T.; Kad, P.; Turton, J.V.; Ha, K.-J. Uneven Global Retreat of Persistent Mountain Snow Cover alongside Mountain Warming from ERA5-Land. Npj Clim. Atmos. Sci. 2024, 7, 278. [Google Scholar] [CrossRef]
  47. Mankin, J.S.; Diffenbaugh, N.S. Influence of Temperature and Precipitation Variability on Near-Term Snow Trends. Clim. Dyn. 2015, 45, 1099–1116. [Google Scholar] [CrossRef]
  48. Kraft, M.; McNamara, J.P.; Marshall, H.-P.; Glenn, N.F. Forest Impacts on Snow Accumulation and Melt in a Semi-Arid Mountain Environment. Front. Water 2022, 4, 1004123. [Google Scholar] [CrossRef]
  49. Roth, T.R.; Nolin, A.W. Forest Impacts on Snow Accumulation and Ablation across an Elevation Gradient in a Temperate Montane Environment. Hydrol. Earth Syst. Sci. 2017, 21, 5427–5442. [Google Scholar] [CrossRef]
  50. Musselman, K.N.; Clark, M.P.; Liu, C.; Ikeda, K.; Rasmussen, R. Slower Snowmelt in a Warmer World. Nat. Clim. Change 2017, 7, 214–219. [Google Scholar] [CrossRef]
  51. Gottlieb, A.R.; Mankin, J.S. Evidence of Human Influence on Northern Hemisphere Snow Loss. Nature 2024, 625, 293–300. [Google Scholar] [CrossRef] [PubMed]
  52. Pulliainen, J.; Luojus, K.; Derksen, C.; Mudryk, L.; Lemmetyinen, J.; Salminen, M.; Ikonen, J.; Takala, M.; Cohen, J.; Smolander, T.; et al. Patterns and Trends of Northern Hemisphere Snow Mass from 1980 to 2018. Nature 2020, 581, 294–298. [Google Scholar] [CrossRef] [PubMed]
  53. Zhang, Y.; Ma, N. Spatiotemporal Variability of Snow Cover and Snow Water Equivalent in the Last Three Decades over Eurasia. J. Hydrol. 2018, 559, 238–251. [Google Scholar] [CrossRef]
  54. Zhong, X.; Zhang, T.; Su, H.; Xiao, X.-X.; Wang, S.; Hu, Y.-T.; Wang, H.-J.; Zheng, L.; Zhang, W.; Xu, M.; et al. Impacts of Landscape and Climatic Factors on Snow Cover in the Altai Mountains, China. Adv. Clim. Change Res. 2021, 12, 95–107. [Google Scholar] [CrossRef]
  55. Chen, X.; Liang, S.; Cao, Y.; He, T.; Wang, D. Observed Contrast Changes in Snow Cover Phenology in Northern Middle and High Latitudes from 2001–2014. Sci. Rep. 2015, 5, 16820. [Google Scholar] [CrossRef]
  56. Sospedra-Alfonso, R.; Melton, J.R.; Merryfield, W.J. Effects of Temperature and Precipitation on Snowpack Variability in the Central Rocky Mountains as a Function of Elevation. Geophys. Res. Lett. 2015, 42, 4429–4438. [Google Scholar] [CrossRef]
  57. Dong, B.; Sutton, R.T.; Shaffrey, L.; Harvey, B. Recent Decadal Weakening of the Summer Eurasian Westerly Jet Attributable to Anthropogenic Aerosol Emissions. Nat. Commun. 2022, 13, 1148. [Google Scholar] [CrossRef]
  58. Henderson, G.R.; Peings, Y.; Furtado, J.C.; Kushner, P.J. Snow–Atmosphere Coupling in the Northern Hemisphere. Nat. Clim. Change 2018, 8, 954–963. [Google Scholar] [CrossRef]
  59. Musselman, K.N.; Molotch, N.P.; Margulis, S.A.; Kirchner, P.B.; Bales, R.C. Influence of Canopy Structure and Direct Beam Solar Irradiance on Snowmelt Rates in a Mixed Conifer Forest. Agric. For. Meteorol. 2012, 161, 46–56. [Google Scholar] [CrossRef]
  60. Viviroli, D.; Dürr, H.H.; Messerli, B.; Meybeck, M.; Weingartner, R. Mountains of the World, Water Towers for Humanity: Typology, Mapping, and Global Significance. Water Resour. Res. 2007, 43, 2006WR005653. [Google Scholar] [CrossRef]
  61. Qin, D.; Liu, S.; Li, P. Snow Cover Distribution, Variability, and Response to Climate Change in Western China. J. Clim. 2006, 19, 1820–1833. [Google Scholar] [CrossRef]
  62. Yang, Z.; Chen, R.; Liu, Z.; Zhao, Y.; Liu, Y.; Wu, W. Spatiotemporal Variability of Rain-on-Snow Events in the Arid Region of Northwest China. J. Arid Land 2024, 16, 483–499. [Google Scholar] [CrossRef]
Figure 1. Regional division of the study area.
Remotesensing 17 01697 g001
Figure 2. Interannual variations in the maximum SCA (a) and monthly SCA (b) in arid northwest China from 2000 to 2023 (The blue solid line represents the changing trend of SCA, and the black dashed line represents the linear fitting curve).
Remotesensing 17 01697 g002
Figure 3. Monthly SCA in each subregion of arid northwest China.
Remotesensing 17 01697 g003
Figure 4. Average precipitation (a) and temperature (b) in each subregion.
Remotesensing 17 01697 g004
Figure 5. Spatial distribution and frequency of (a) SOD, (c) SED, and (e) SCD, and the spatial distribution trends and frequency of (b) SOD, (d) SED, and (f) SCD from 2000 to 2020 in arid northwest China. Notes: trend categories (e.g., “Extremely significant increase”) follow the p-value thresholds in Table 2 (p ≤ 0.01: extremely significant; 0.01 < p ≤ 0.05: significant; 0.05 < p ≤ 0.10: slightly significant; p > 0.10: not significant). Red/blue shades indicate increasing/decreasing trends (β ≠ 0), while gray indicates no trend (β = 0).
Remotesensing 17 01697 g005
Figure 6. Spatial distribution of SD (a), and the spatial distribution trend categories and frequency (b) from 2000 to 2023 in arid northwest China.
Remotesensing 17 01697 g006
Figure 7. Spatial distribution of SWE (a), and the spatial distribution trend categories and frequency (b) from 2000 to 2020 in arid northwest China.
Remotesensing 17 01697 g007
Figure 8. Spatial classification of snow indicator trend consistency across subregions. Classification criteria define three tiers: (1) complete consistency requires all four indicators (SCA, SCD, SD, and SWE) to display unidirectional decreasing or increasing trends covering >50% of the subregion; (2) strong consistency applies where three indicators exhibit concordant trends; (3) moderate consistency occurs when two indicators show directional agreement.
Remotesensing 17 01697 g008
Table 1. Average elevation of each subregion.
RegionATMQDBGTDHIRNKMTRRNTMTHBIRB
Elevation (m)13123600730172528792428127412142058
Table 2. Trend categories in the MK statistical test.
βp-ValueTrend CategoriesTrend Characteristics
β > 0p ≤ 0.014Extremely significant increase
0.01 < p ≤ 0.053Significant increase
0.05 < p ≤ 0.102Slightly significant increase
p > 0.101Not significantly increase
β = 0-0No change
β < 0p > 0.10−1Not significantly reduction
0.05 < p ≤ 0.10−2Slightly significant reduction
0.01 < p ≤ 0.05−3Significantly reduction
p ≤ 0.01−4Extremely significant reduction
Table 3. Calculation results of Spearman’s rank correlation coefficient.
Spearman Rank Correlation Coefficientp Value
SCA and SWE0.84550.001 **
SCA and SD0.96391 × 10−6 **
SCD and SWE0.84590.001 **
SCD and SD0.96341 × 10−6 **
SWE and SD0.86360.0006 **
** p < 0.01.
Disclaimer/Publisher’s Note: The statements, opinions and data contained in all publications are solely those of the individual author(s) and contributor(s) and not of MDPI and/or the editor(s). MDPI and/or the editor(s) disclaim responsibility for any injury to people or property resulting from any ideas, methods, instructions or products referred to in the content.

