Article

Spatiotemporal Evolution of Urban Driving Factors and Seasonal Heat Island Response from the Perspective of Local Climate Zones: A Case Study of Xiamen City, China

1
School of Geo-Science & Technology, Zhengzhou University, Zhengzhou 450001, China
2
School of Management, Zhengzhou University, Zhengzhou 450001, China
*
Author to whom correspondence should be addressed.
Remote Sens. 2025, 17(10), 1678; https://doi.org/10.3390/rs17101678
Submission received: 22 March 2025 / Revised: 23 April 2025 / Accepted: 8 May 2025 / Published: 10 May 2025

Abstract

:
Understanding the mechanisms driving the urban heat island (UHI) phenomenon is essential for urban sustainability. This study investigated the spatiotemporal dynamics and underlying factors of surface urban heat island (SUHI) in Xiamen. Utilizing the radiation conduction equation, we calculated surface urban heat island intensity (SUHII) for the summers and winters of 2003, 2005, 2010, 2015, and 2020, followed by spatial distribution analysis. The local climate zone (LCZ) method was employed to assess surface morphology and spatial structure in 2010 and 2020. Urban driving factors, including built-up areas, building height, gross domestic product (GDP) per capita, industrial structure, and population density, were analyzed using the Geodetector model to explore their influence on SUHI across seasons. Based on different LCZ types, a more detailed analysis was conducted on SUHI and the performance of influencing factors using Pearson’s correlation. Key findings indicate that (1) the proportion of SUHI areas in built-up LCZ types always exceeds that of natural LCZ types and is more pronounced in the summer than in the winter. (2) In built-up LCZ types, open mid-rise built (LCZ 5) showed the highest average proportion of SUHI areas in the summer (95.95%), and large low-rise built (LCZ 8) had the highest average proportion in the winter (95.28%). In natural LCZ types, bare rock or paved (LCZ E) had the highest average proportion of SUHI areas in both the summer (61.86%) and winter (51.26%), and water (LCZ G) had the lowest average proportion in the summer (6.16%) and winter (4.92%). (3) Significantly, building height and proportion of the secondary industry intensified the SUHI in the summer, with dynamic changes observed during the winter. This study provides more targeted insights into mitigating SUHI in Xiamen and other similar coastal cities.

1. Introduction

Surface urban heat island (SUHI) refers to a phenomenon where the temperatures in urban centers are significantly higher than are those in the surrounding rural areas [1,2]. In recent years, SUHI has emerged as one of the most critical environmental issues stemming from the rapid urbanization in China [3]. The thermal radiative properties of urban surfaces play a key role in contributing to the heat island effect [4]. Factors such as large-scale population movement, rapid industrialization, severe air pollution, the proliferation of heat-retaining structures such as streets and buildings, and the reduction of waterbodies and greenspaces have significantly increased urban surface temperatures compared with those of suburban areas [5,6,7]. This persistent increase in temperatures leads to higher energy consumption in cities [8,9] and exacerbates air pollution, creating a vicious cycle that further intensifies the SUHI phenomenon [10,11]. The SUHI effect poses significant risks to human health [12,13] and disrupts ecological balance [14], resulting in various environmental challenges [15]. Consequently, the study of the SUHI impact mechanism and alleviating SUHI effects has become of urgent importance [16,17].
SUHI is often assessed using surface temperature as the primary indicator [18]. The primary drivers of SUHI include urban expansion and changes in the underlying surface properties [19]. Traditional studies on surface urban heat island intensity (SUHII) have commonly used a binary urban–rural classification to quantify SUHI by measuring surface temperature differences between urban and rural areas [20]. However, the boundaries between urban areas and the surrounding rural areas are often indistinct. These traditional urban–rural binary approaches treat cities as homogeneous units and overlook the internal spatial complexity of urban environments [21]. Furthermore, many studies have focused on the influence of two-dimensional landscape patterns on SUHI, with limited exploration of three-dimensional urban morphology [22].
To address these limitations, Stewart and Oke introduced the local climate zone (LCZ) classification, which incorporates elements such as land cover, subsurface structures, and building geometry [23]. This framework provides a standardized approach to studying SUHI [24] by categorizing urban areas into 10 built-up types and 7 natural types, thus allowing for a more nuanced understanding of urban diversity and heterogeneity in a three-dimensional space [25,26]. Additionally, it overcomes the limitations of previous studies, which have primarily focused on built-up areas [27,28]. By analyzing the spatial characteristics of heat island across different LCZs, targeted SUHI mitigation strategies can be developed to improve urban living environments, enhance climate resilience, and mitigate the risks associated with climate change [29,30,31].
At present, there are mainly two types of LCZ classification methods. One is GIS-based LCZ classification. This method requires high-precision and high-resolution building data, land-use data, and other data to classify land types [32], making data acquisition difficult. Another approach is to use the world urban database and access portal tools (WUDAPT) for classification [33,34], which simplifies the LCZ-mapping process and reduces operational complexity. Zheng et al. [35] used WUDAPT to draw LCZ maps, and the results showed that the accuracy of LCZ mapping was higher than 75% every year, indicating that the classification results were reliable. In contrast, the WUDAPT classification method has the advantages of easy operation and high partition efficiency. In practical operation, it can usually achieve good classification accuracy after multiple iterations.
The selection of influencing factors for exploring and analyzing SUHI has been a key focus in existing research, with many studies emphasizing topographical and ecological variables [36,37]. For example, Dai et al. [38] found that grasslands, trees, waterbodies, and shade significantly lower urban land surface temperatures (LST). Wang et al. revealed a strong positive correlation between population density and UHI intensity while observing that LST decreased logarithmically with increasing elevation [39]. Chang demonstrated that developed areas with an impervious surface coverage of less than 49% can effectively mitigate SUHI impacts [40]. Although topographical and ecological factors contribute directly or indirectly to the formation of SUHI, urban spatial and socioeconomic factors play critical roles. The research on SHUI under the LCZ framework mainly includes the differences in SUHI under different LCZs and the impact of different influencing factors on SUHI under different LCZs. Cai et al. [41] compared different cities in the Yangtze River Delta region of China, and the results showed that there were significant differences in LST between different LCZs. The SUHII of LCZ building types was usually higher than that of land cover types. Wang et al. [42] studied the spatiotemporal dynamic characteristics of the LCZ in the Pearl River Delta region of China during the winter of 2000–2015. The research results showed that the expansion of LCZ building types led to an increase in LST, especially LCZ 8 and LCZ 6. Zheng et al. [43] found that urban morphology has a significant impact on the development of local scale UHI by monitoring changes in UHI at the local level during summer. Mo et al. [44] investigated the correlation between LST, altitude, and slope of different LCZs in Guilin City and found that the results varied in different seasons. Zhou et al. [45] studied the impact of land cover on SUHI in Macau under the LCZ framework in summer and found that the cooling effect of large low growing plants was not significant. In addition, most studies have primarily focused on the isolated impacts of individual factors during specific seasons, with limited attention paid to how these factor interactions influence SUHI across different seasons.
However, there has been no in-depth study on the impact mechanism and related mitigation strategies of urban spatial and socio-economic factors on the heat island effect in different seasons under the LCZ framework. To address this question, this study investigated the developmental status and spatiotemporal distribution of LCZs and SUHI in Xiamen City, and the following contributions results. Firstly, this study mapped the standard deviation ellipses of spatial and economic indicators and analyzed urban development trends. Secondly, it created LCZ and SUHI maps for summer and winter, analyzed their spatiotemporal distributions, and compared SUHII variations across LCZ types. Thirdly, it explored both the independent and synergistic effects of urban spatial and socio-economic factors on SUHI. Results could characterize the internal structure of the city of Xiamen and the local climate to provide scientific guidance for mitigating SUHI and urban planning.

2. Materials and Methods
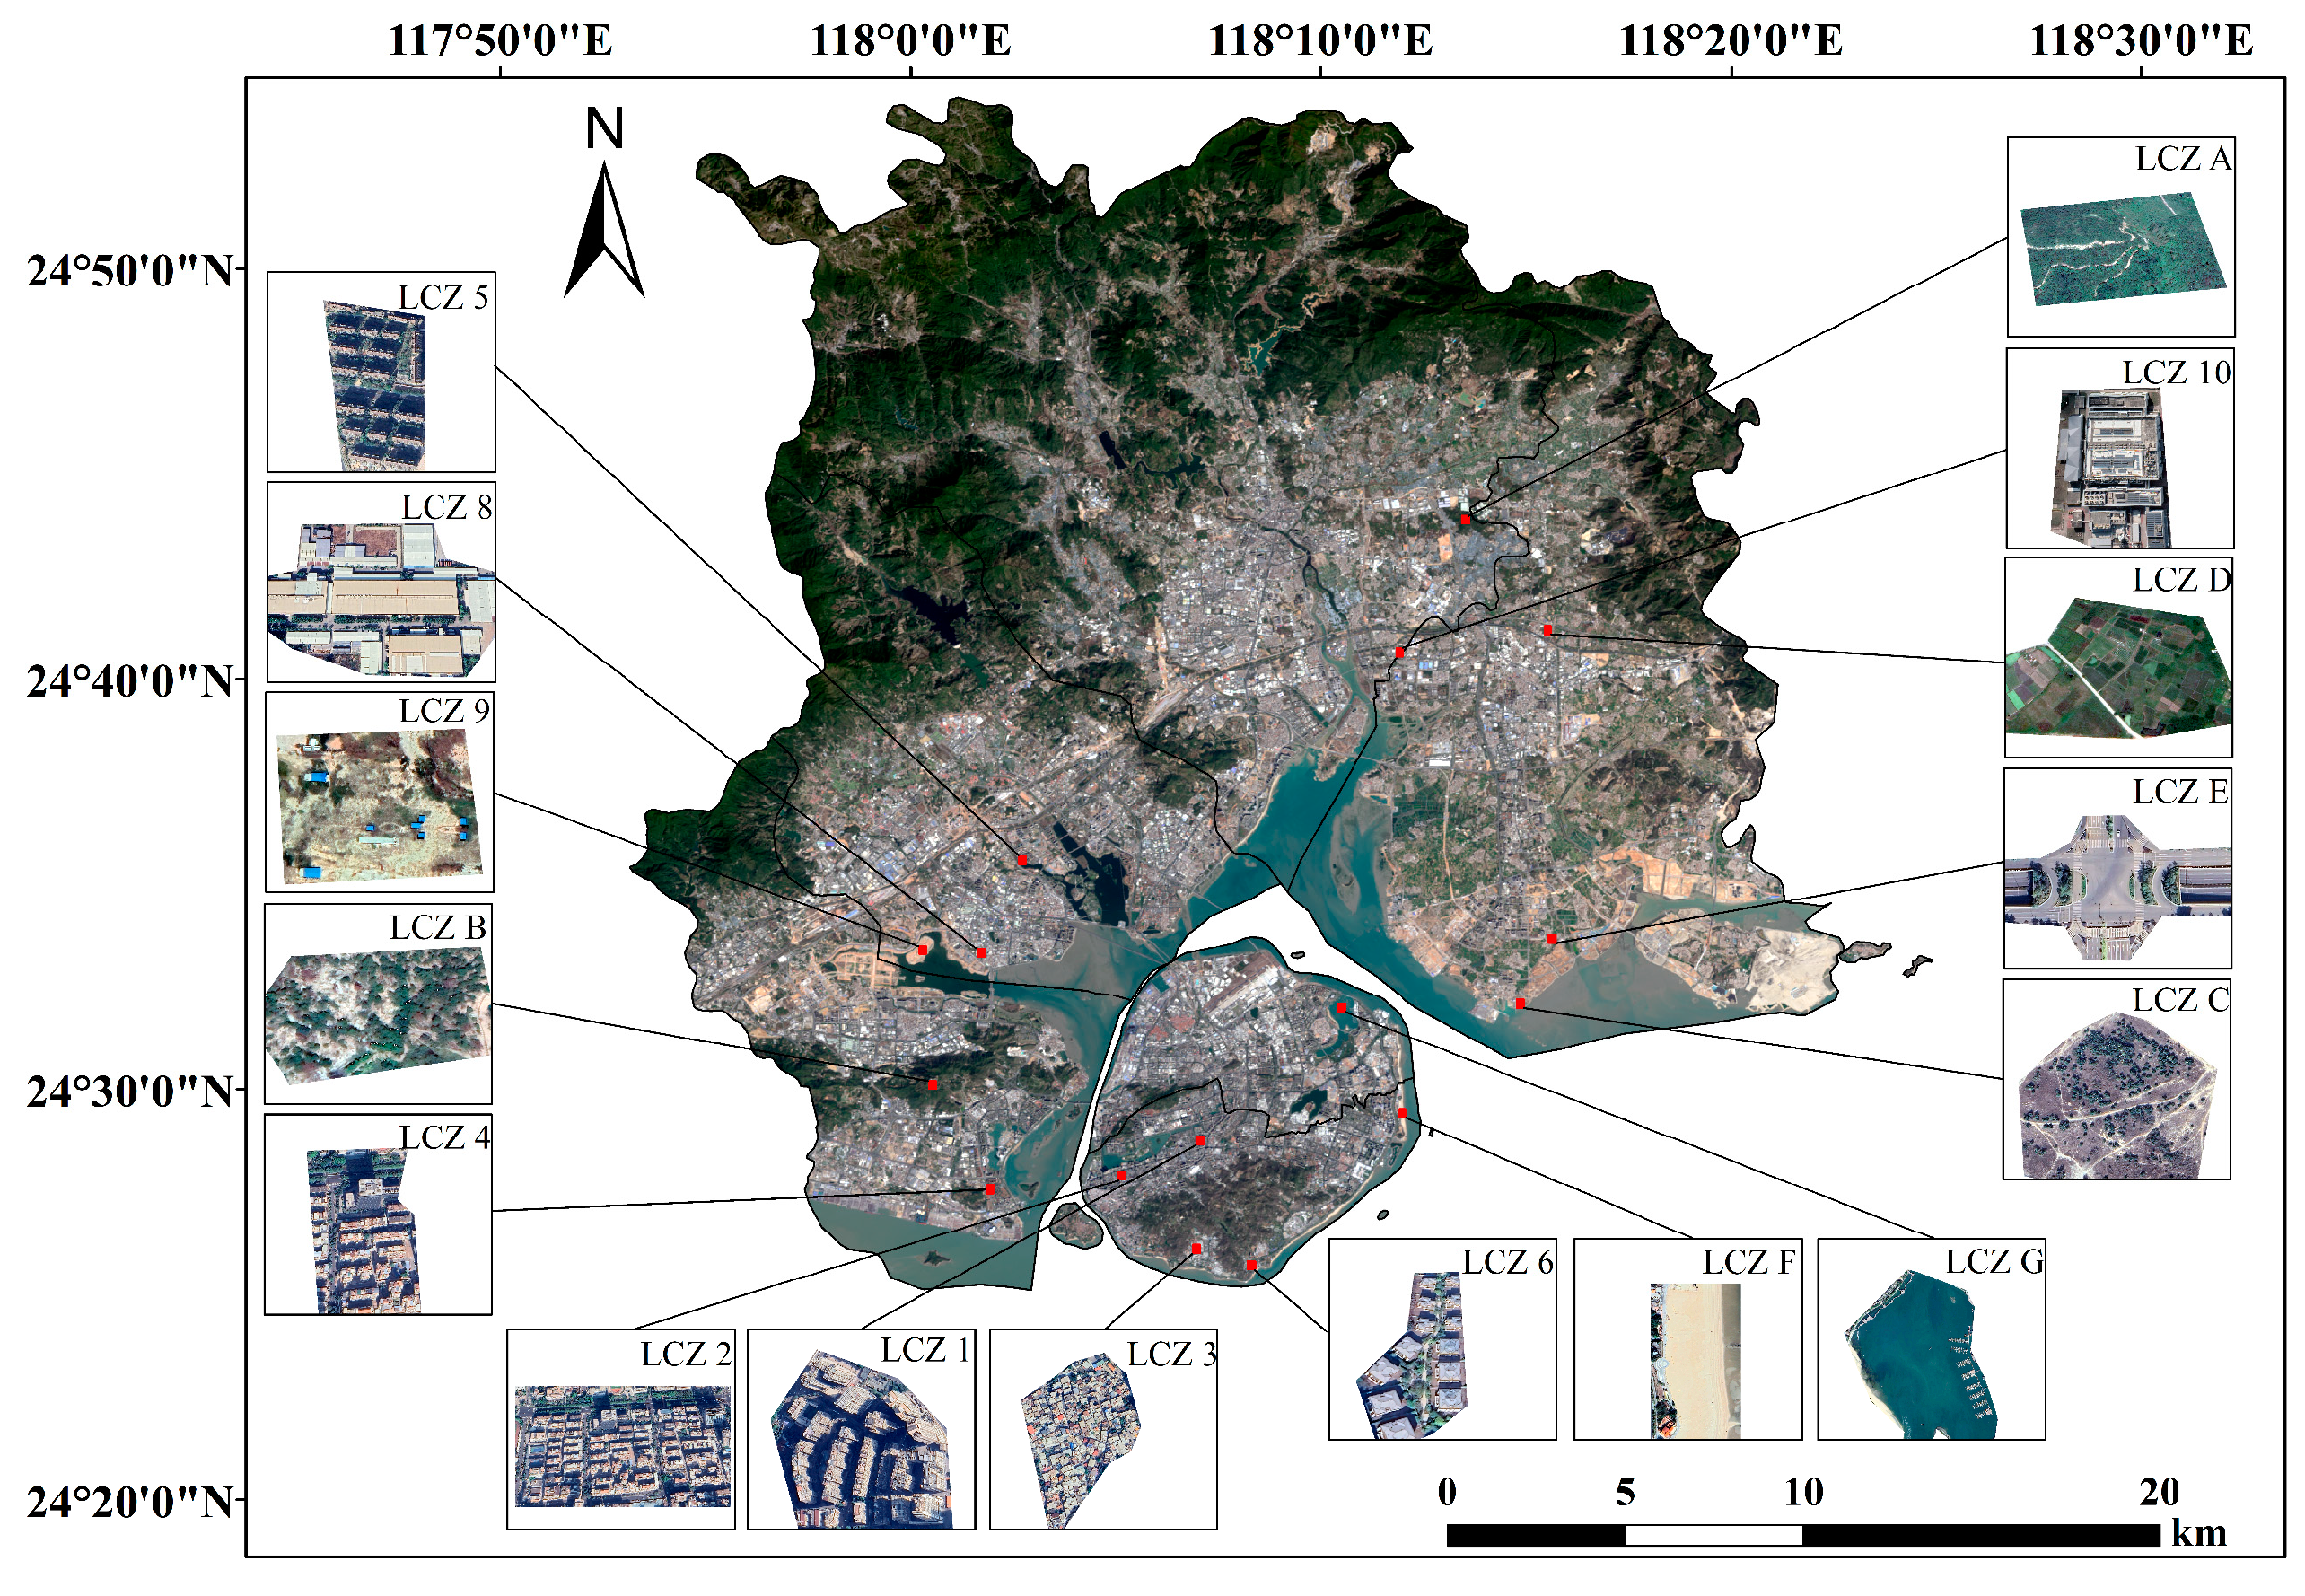
2.1. Study Area

Xiamen City (24°23′N–24°54′N, 117°53′E–118°26′E), located along the southeastern coast of Fujian Province, serves as a major economic center in the Min Delta region. The city has undergone rapid urbanization and is characterized by diverse landscapes, including coastal plains, terraces, and hills. Xiamen’s subtropical marine monsoon climate leads to high humidity and frequent rainfall. The low elevation of Xiamen’s urban areas, combined with the surrounding mountains that obstruct monsoon winds, often results in heat accumulation. The city comprises the Siming, Huli, Haicang, Jimei, Tong’an, and Xiang’an districts. Figure 1 shows the urban spatial layout in the study area comprising 16 LCZ categories.

2.2. Data Sources

The data used in this study are summarized in Table 1. Landsat remote-sensing imagery was obtained from the United States Geological Survey (USGS). To ensure data consistency and quality, all selected Landsat images were acquired at approximately 2:30 a.m. GMT with cloud cover less than 5% and were evenly distributed throughout the study period. Initially, the goal was to select images representing both the summer (July to September) and winter (November to January) seasons at five-year intervals from 2000 to 2020. However, due to the adjustment of the administrative divisions of Xiamen City in 2003, only data from 2003 and after were used. Moreover, in 2010 and 2015, no high-quality cloud-free and rain-free winter images were available. As a result, winter images from the neighboring years of 2011 and 2016 were selected. Building footprint data for 2020 were obtained from Gaode Maps. Building height data were obtained from the China Building Height Dataset (http://www.geodata.cn (accessed on 12 June 2024)). Wu et al. compared the 10 m building height product against existing datasets with resolutions of 30 m, 500 m, and 1000 m. The results demonstrated that the 10 m building height product offers greater detail and more accurately reflects the spatial distribution of building heights in urban areas [46]. Nighttime light data for 2003, 2005, 2010, 2015, and 2020 were retrieved from the National Oceanic and Atmospheric Administration (NOAA). Population density data with a resolution of 100 m were collected from WorldPop (https://hub.worldpop.org/ (accessed on 3 June 2024)). In addition, data on built-up areas, gross domestic product (GDP), and industrial structure of Xiamen were obtained from the Statistical Yearbook of Xiamen and Statistical Yearbook of Fujian Province.

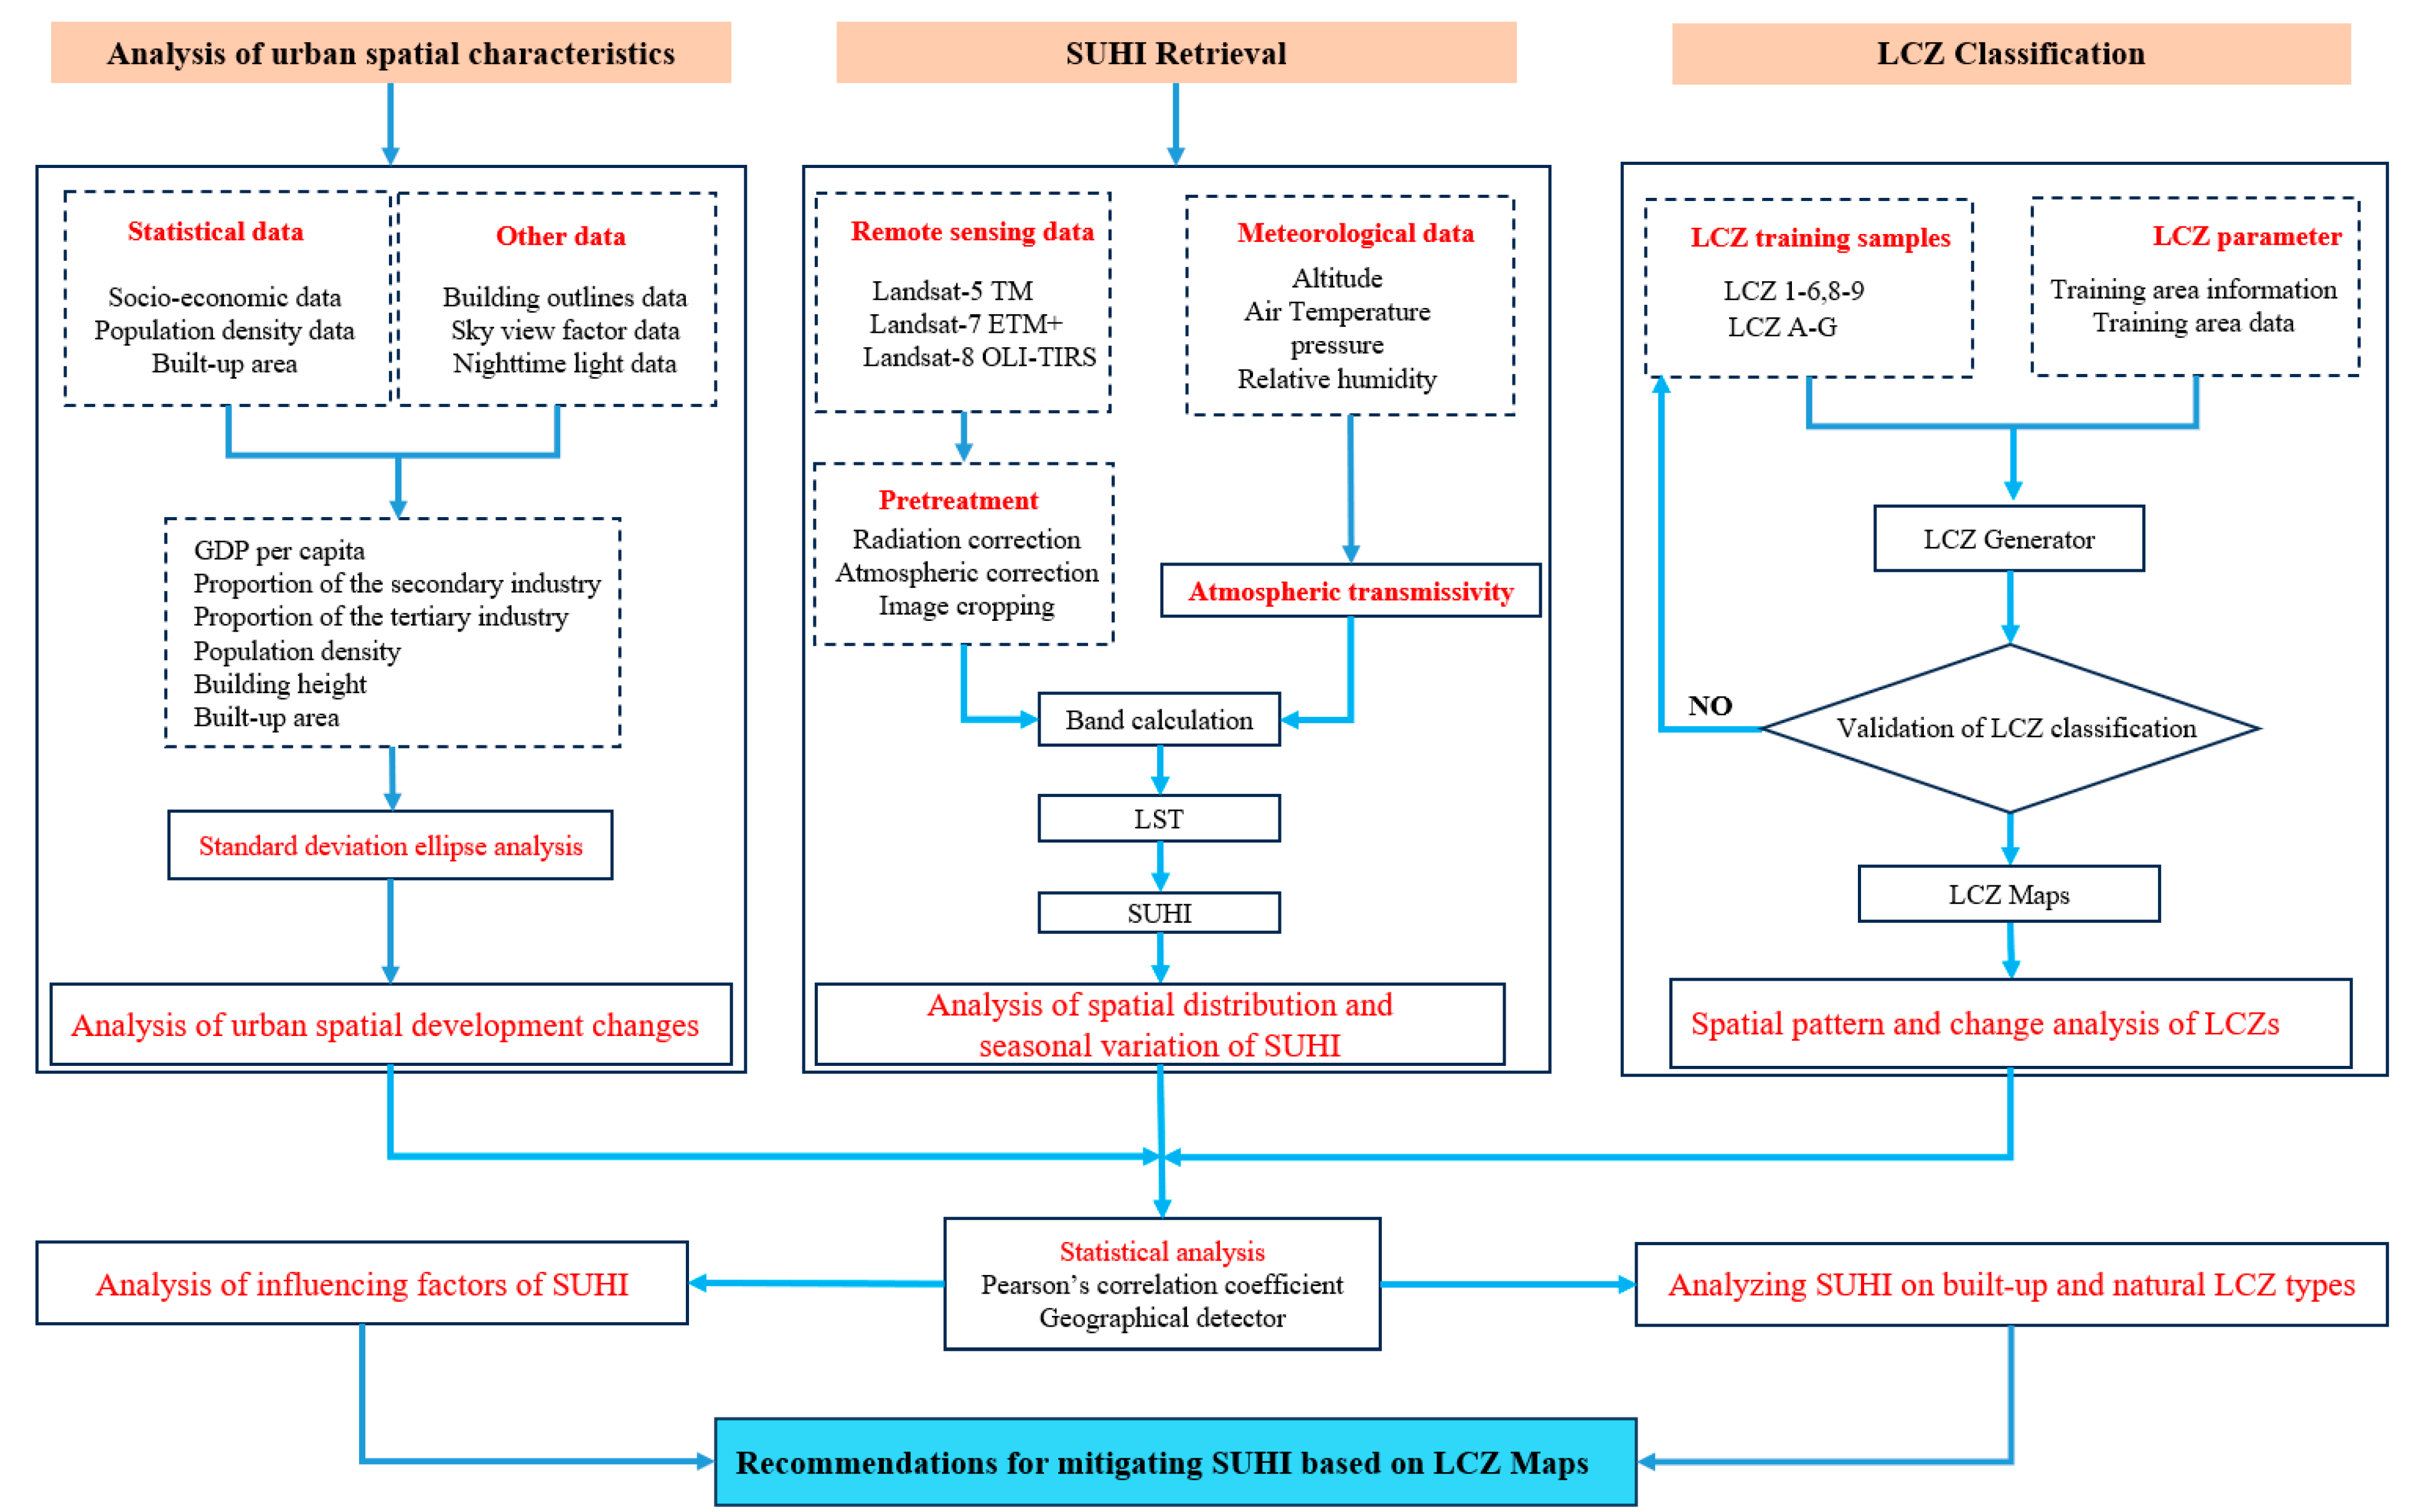
2.3. Research Methods and Process

As shown in Figure 2, the research methodology comprised three main stages as follows: (1) Data on built-up areas, GDP, industrial structure, building height, building outlines, nighttime lights, and population density were collected. These data were processed to obtain raster data of impact factors with 100 m resolution and then used to map urban expansion and standard deviation ellipses of the development indicators in ArcGIS. (2) Landsat imagery from 2003, 2005, 2010, 2015, and 2020 was preprocessed for both the summer and winter seasons. The surface temperature was retrieved using the radiation transfer equation, and the SUHII was calculated as the difference between urban and suburban temperatures. The relationships between SUHII and influencing factors were analyzed using the GeoDetector model, and the explanatory power of individual and interacting factors were explored. (3) LCZ maps for 2010 and 2020 were generated using the LCZ Generator tool [33], and a more detailed analysis was conducted on SUHI and the performance of influencing factors using Pearson’s correlation [47] based on different LCZ types. Finally, based on the different heat island effects exhibited by different LCZ types, targeted recommendations for alleviating SUHI were provided.

2.3.1. Urban Built-Up Area Extraction and Expansion Indicators

Built-up areas boundaries were extracted using the comparative thresholding method. This method cumulatively summed the pixel gray values of NTL images from high to low. The threshold was determined when the difference between the extracted areas and the urban built-up areas recorded in the statistical yearbook for the corresponding year was minimized. Regions with pixel gray values greater than or equal to this threshold were defined as urban built-up areas [48].
To quantify urban expansion, the urban expansion speed index (V) was calculated, representing the absolute spatial increment of urban expansion over different periods and reflecting the average annual growth of an urbanized areas [49]. The urban expansion intensity index (U) serves as a crucial metric, measuring the extent and rate of land-use changes within a specified period. The formula for U is the ratio of newly developed urban land areas to the total areas within a spatial unit over that period. A higher U value indicates a faster urban expansion rate, while a lower U implies slower expansion. This index also mitigates the impact of size differences among spatial units, enabling comparisons of urban land growth rates across different periods and regions. The calculation formulas are as follows:
V = S n + 1 S n T ,   U = V S n
where V represents the annual expansion speed of urbanized land; U denotes the annual expansion intensity index of urban land; Sn and Sn+1 refer to the areas of urban built-up land at the beginning and end of the study period, respectively; and T represents the time interval measured in years.

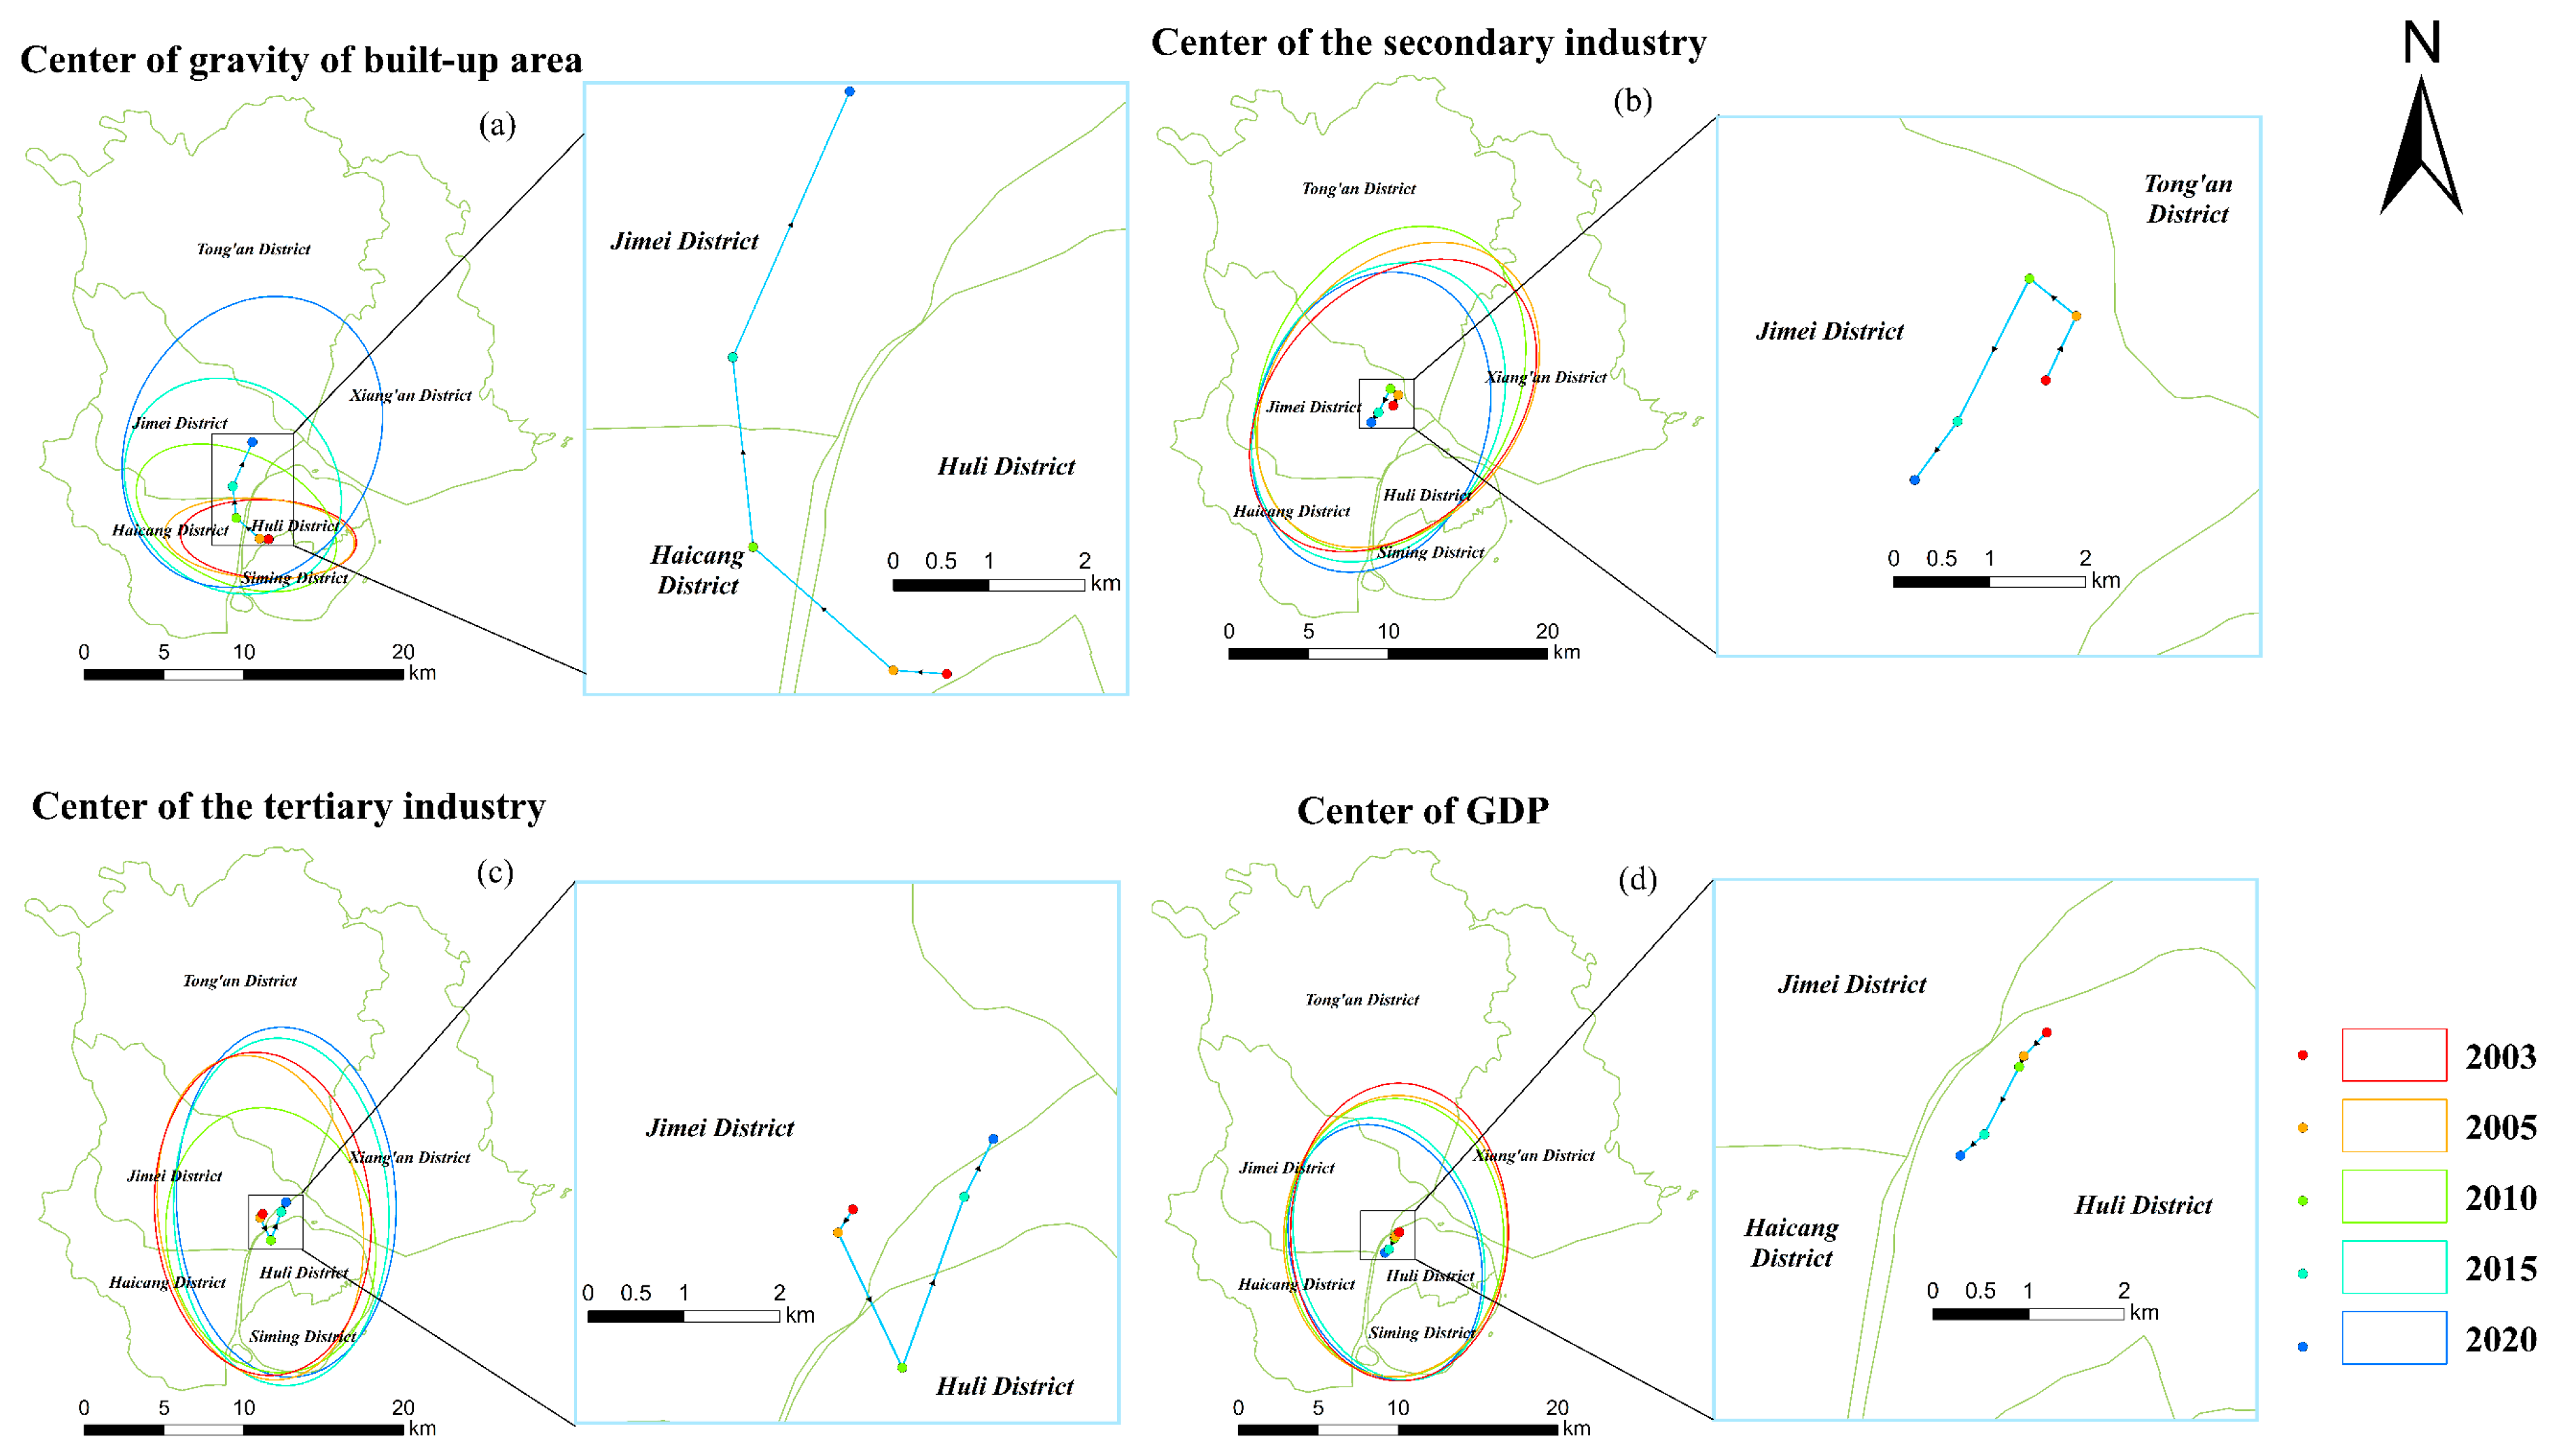
2.3.2. Standard Deviation Ellipse Analysis

The standard deviation ellipse method reveals the spatial characteristics and trends of urban development. The flatness of the ellipse indicates the direction of development, with larger differences between the major and minor axes signifying more pronounced expansion trends. The weighted center (X, Y) of the ellipse was calculated as follows:
X ¯ = i = 1 n X i W i i = 1 n W i , Y ¯ = i = 1 n Y i W i i = 1 n W i
where X ¯ and Y ¯ represent the longitude and latitude values of the ellipse center, respectively; Xi and Yi denote the longitude and latitude values of the centers of subregions, respectively, which correspond to the geographic center coordinates; i represents the i-th study unit; n is the total number of study units; and Wi is the weight of the region.
The standard deviation ellipse method can effectively highlight the spatial characteristics of geographic elements by revealing not only the center’s location but also its orientation. This facilitates a visual analysis of changes in urban distribution trends over time [50]. Gray values reflect the density of urbanized areas. In this context, the standard deviation ellipse method, weighted by the pixel gray values of the imagery, was used to analyze center migration in Xiamen.

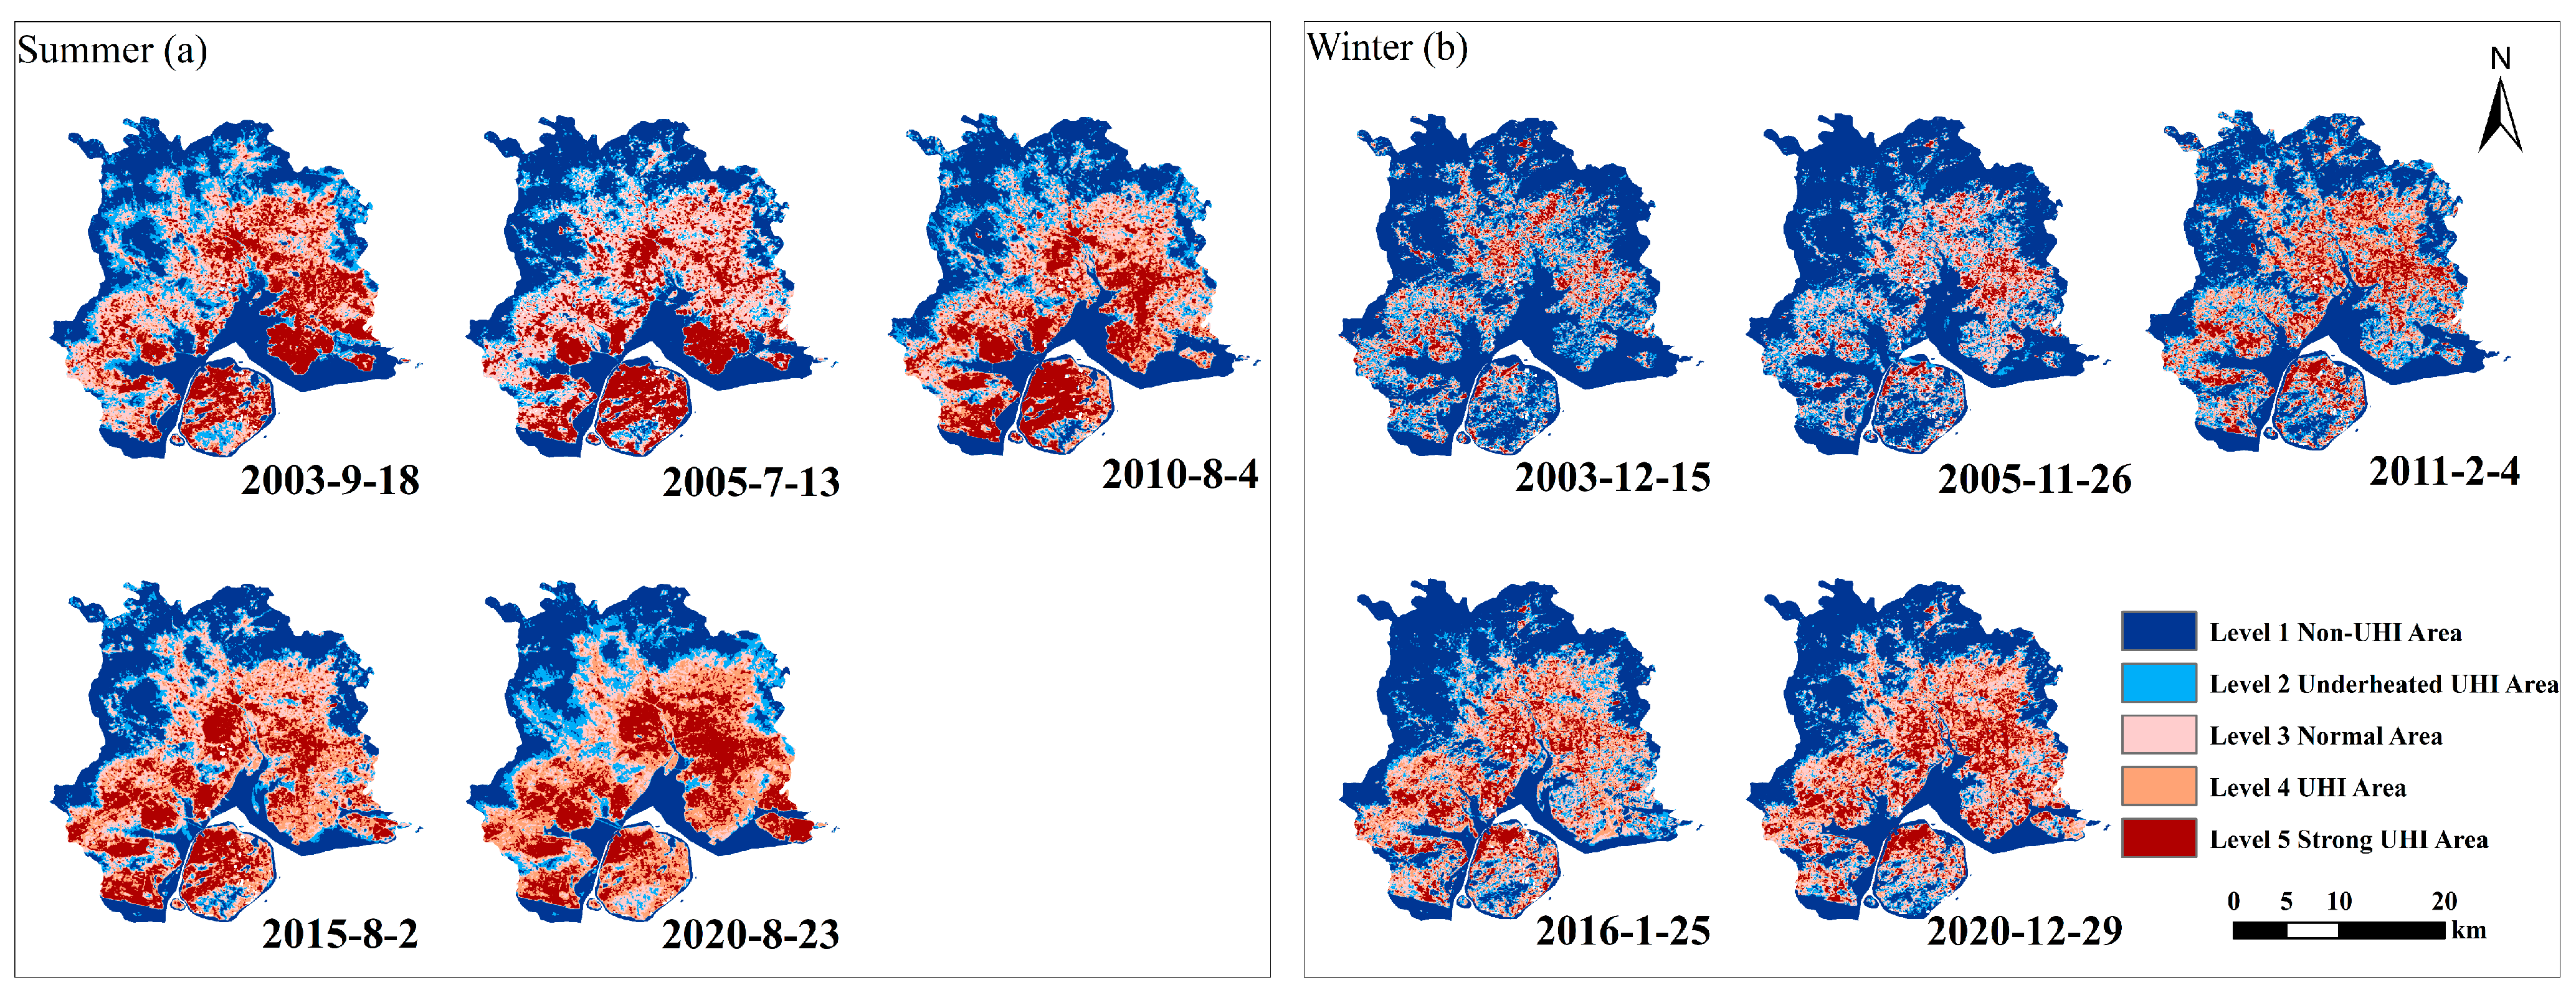
2.3.3. SUHII Calculation and Temperature Normalization

In order to verify the accuracy of the inversion results, Xiamen and Tong’an meteorological stations were selected as the center to create a 100 m buffer zone. The average LST value within the buffer zone was calculated and compared with the daily average surface temperature measured by the meteorological station on the same day. The data came from the China Ground Climate Data Daily Value Database (http://data.cma.cn/ (accessed on 18 May 2024)). With the exclusion outliers, the maximum error between the two was no more than 3 °C, and the Pearson correlation coefficient was as high as 0.86. The correlation analysis results were significant at the 0.01 level, and the inversion accuracy met the requirements of this study. This method quantifies the intensity of the heat island effect in specific regions. The calculation is as follows:
S U H I I i = L S T i L S T a = L S T i L S T L C Z   D
where SUHIIi is the heat island intensity of the pixels, LSTi is the LST of the pixels, LSTa is the average LST of the study areas, and LSTLCZ D is the average surface temperature of LCZ D.
To enhance the reliability and comparability of the retrieved LST results across years, the calculated LST values were normalized [51]. The formula for calculating the normalized temperature value (T) is as follows:
T = t t min t max t min
where t, tmax, and tmin represent the unprocessed, maximum, and minimum LST, respectively. According to the natural breaks method, SUHII is classified [52,53]. To clearly represent the variation characteristics of the heat island, the heat island areas and strong heat island areas were combined into a single heat island area, defined as regions with normalized temperature values greater than 0.6. Conversely, the non-heat island areas and transition areas were merged into a single non-heat island area, which referred to regions with normalized temperature values less than 0.6, as shown in Table 2.

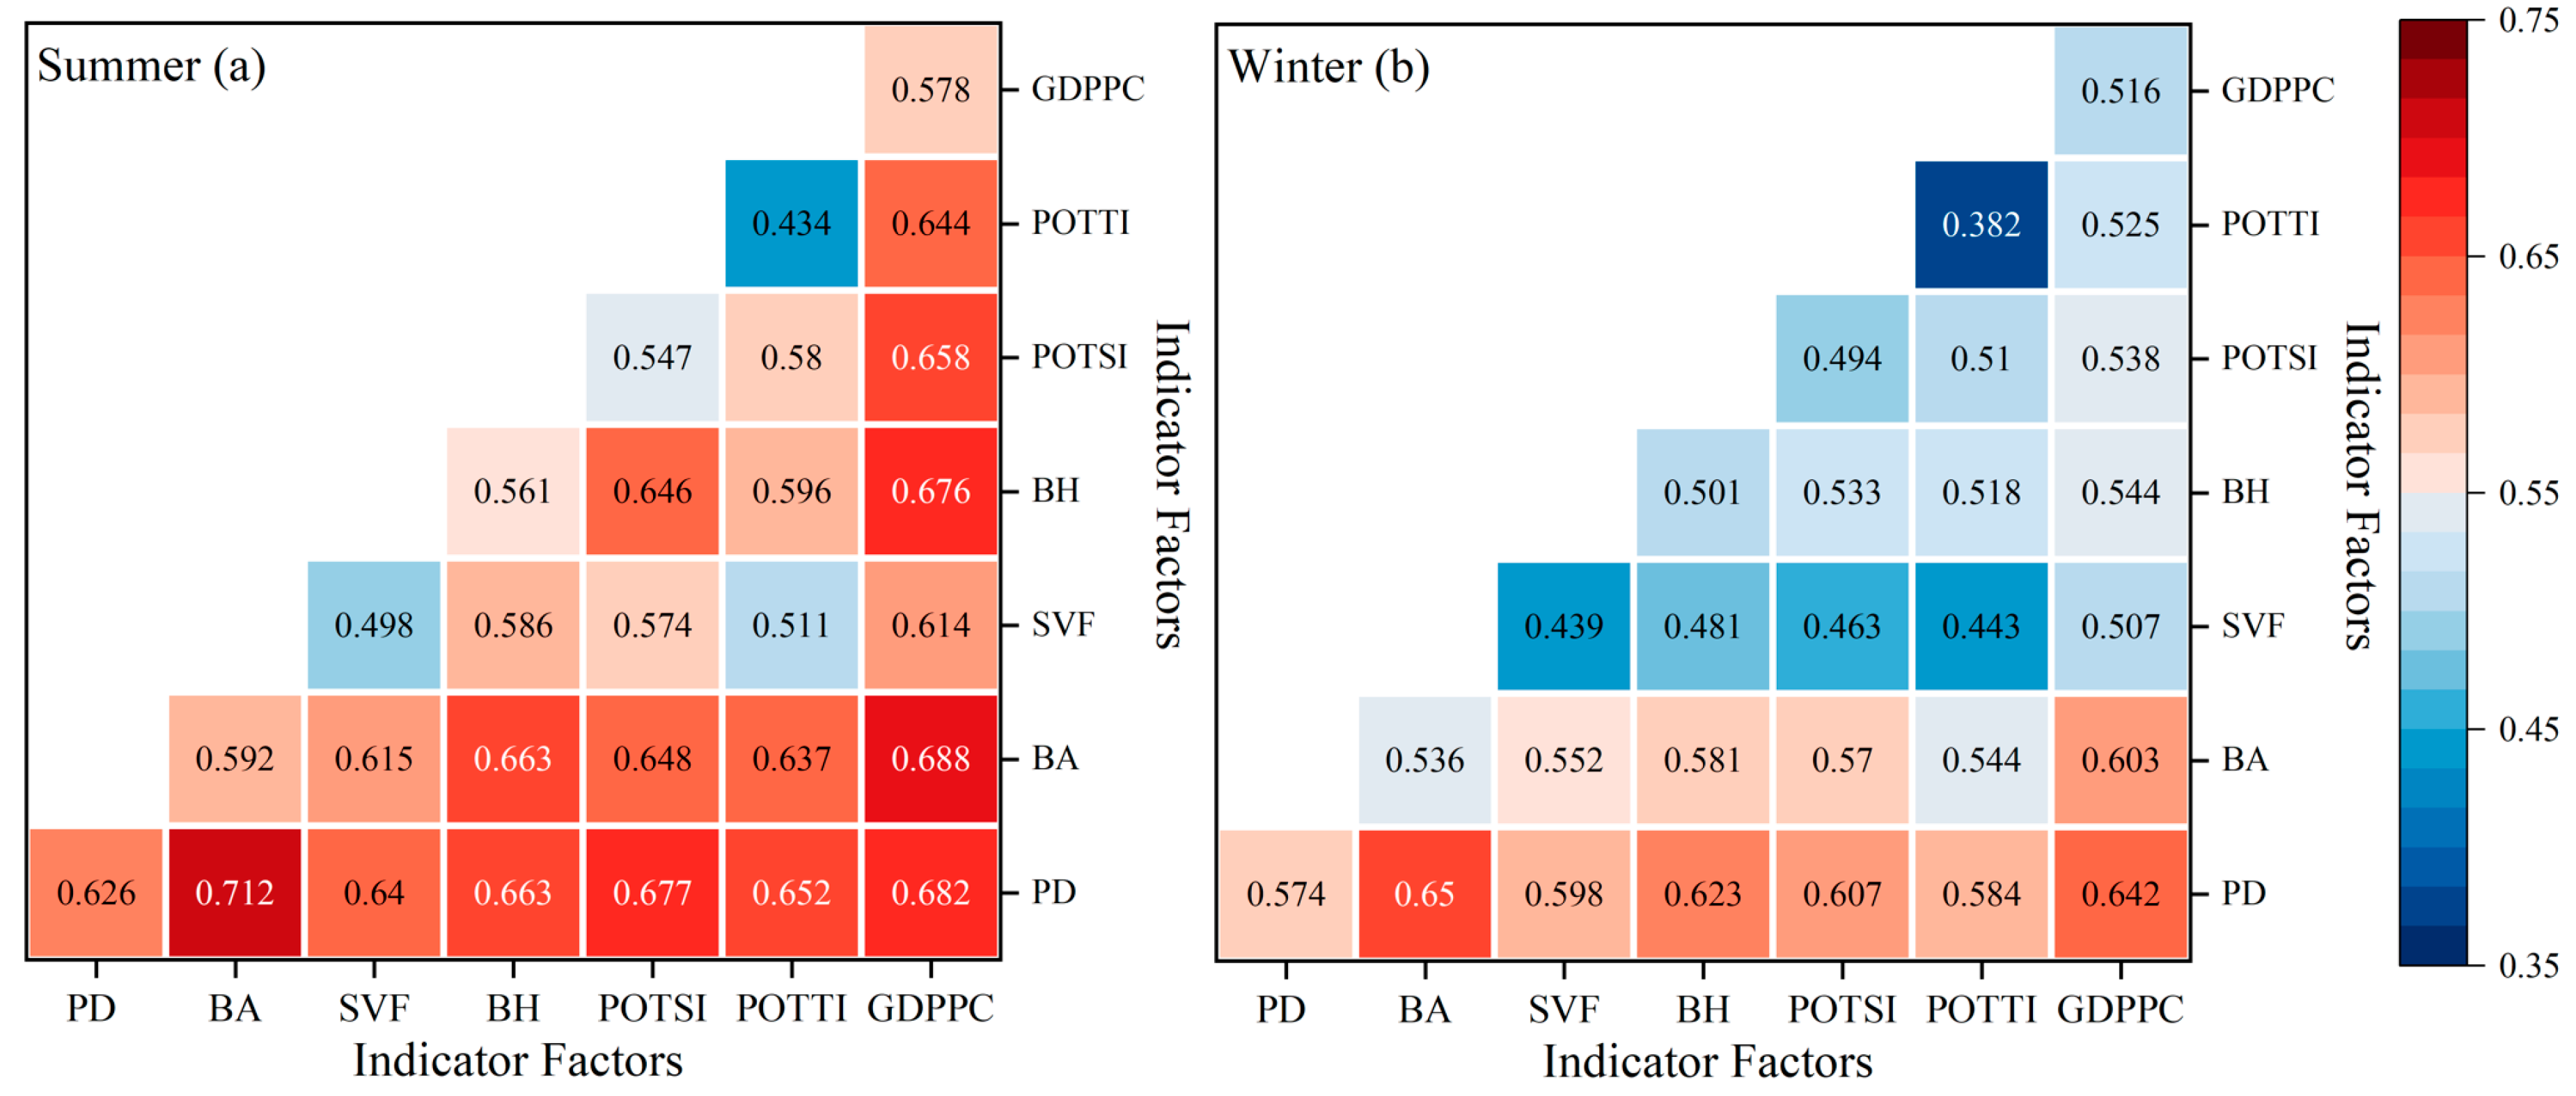
2.3.4. GeoDetector Model
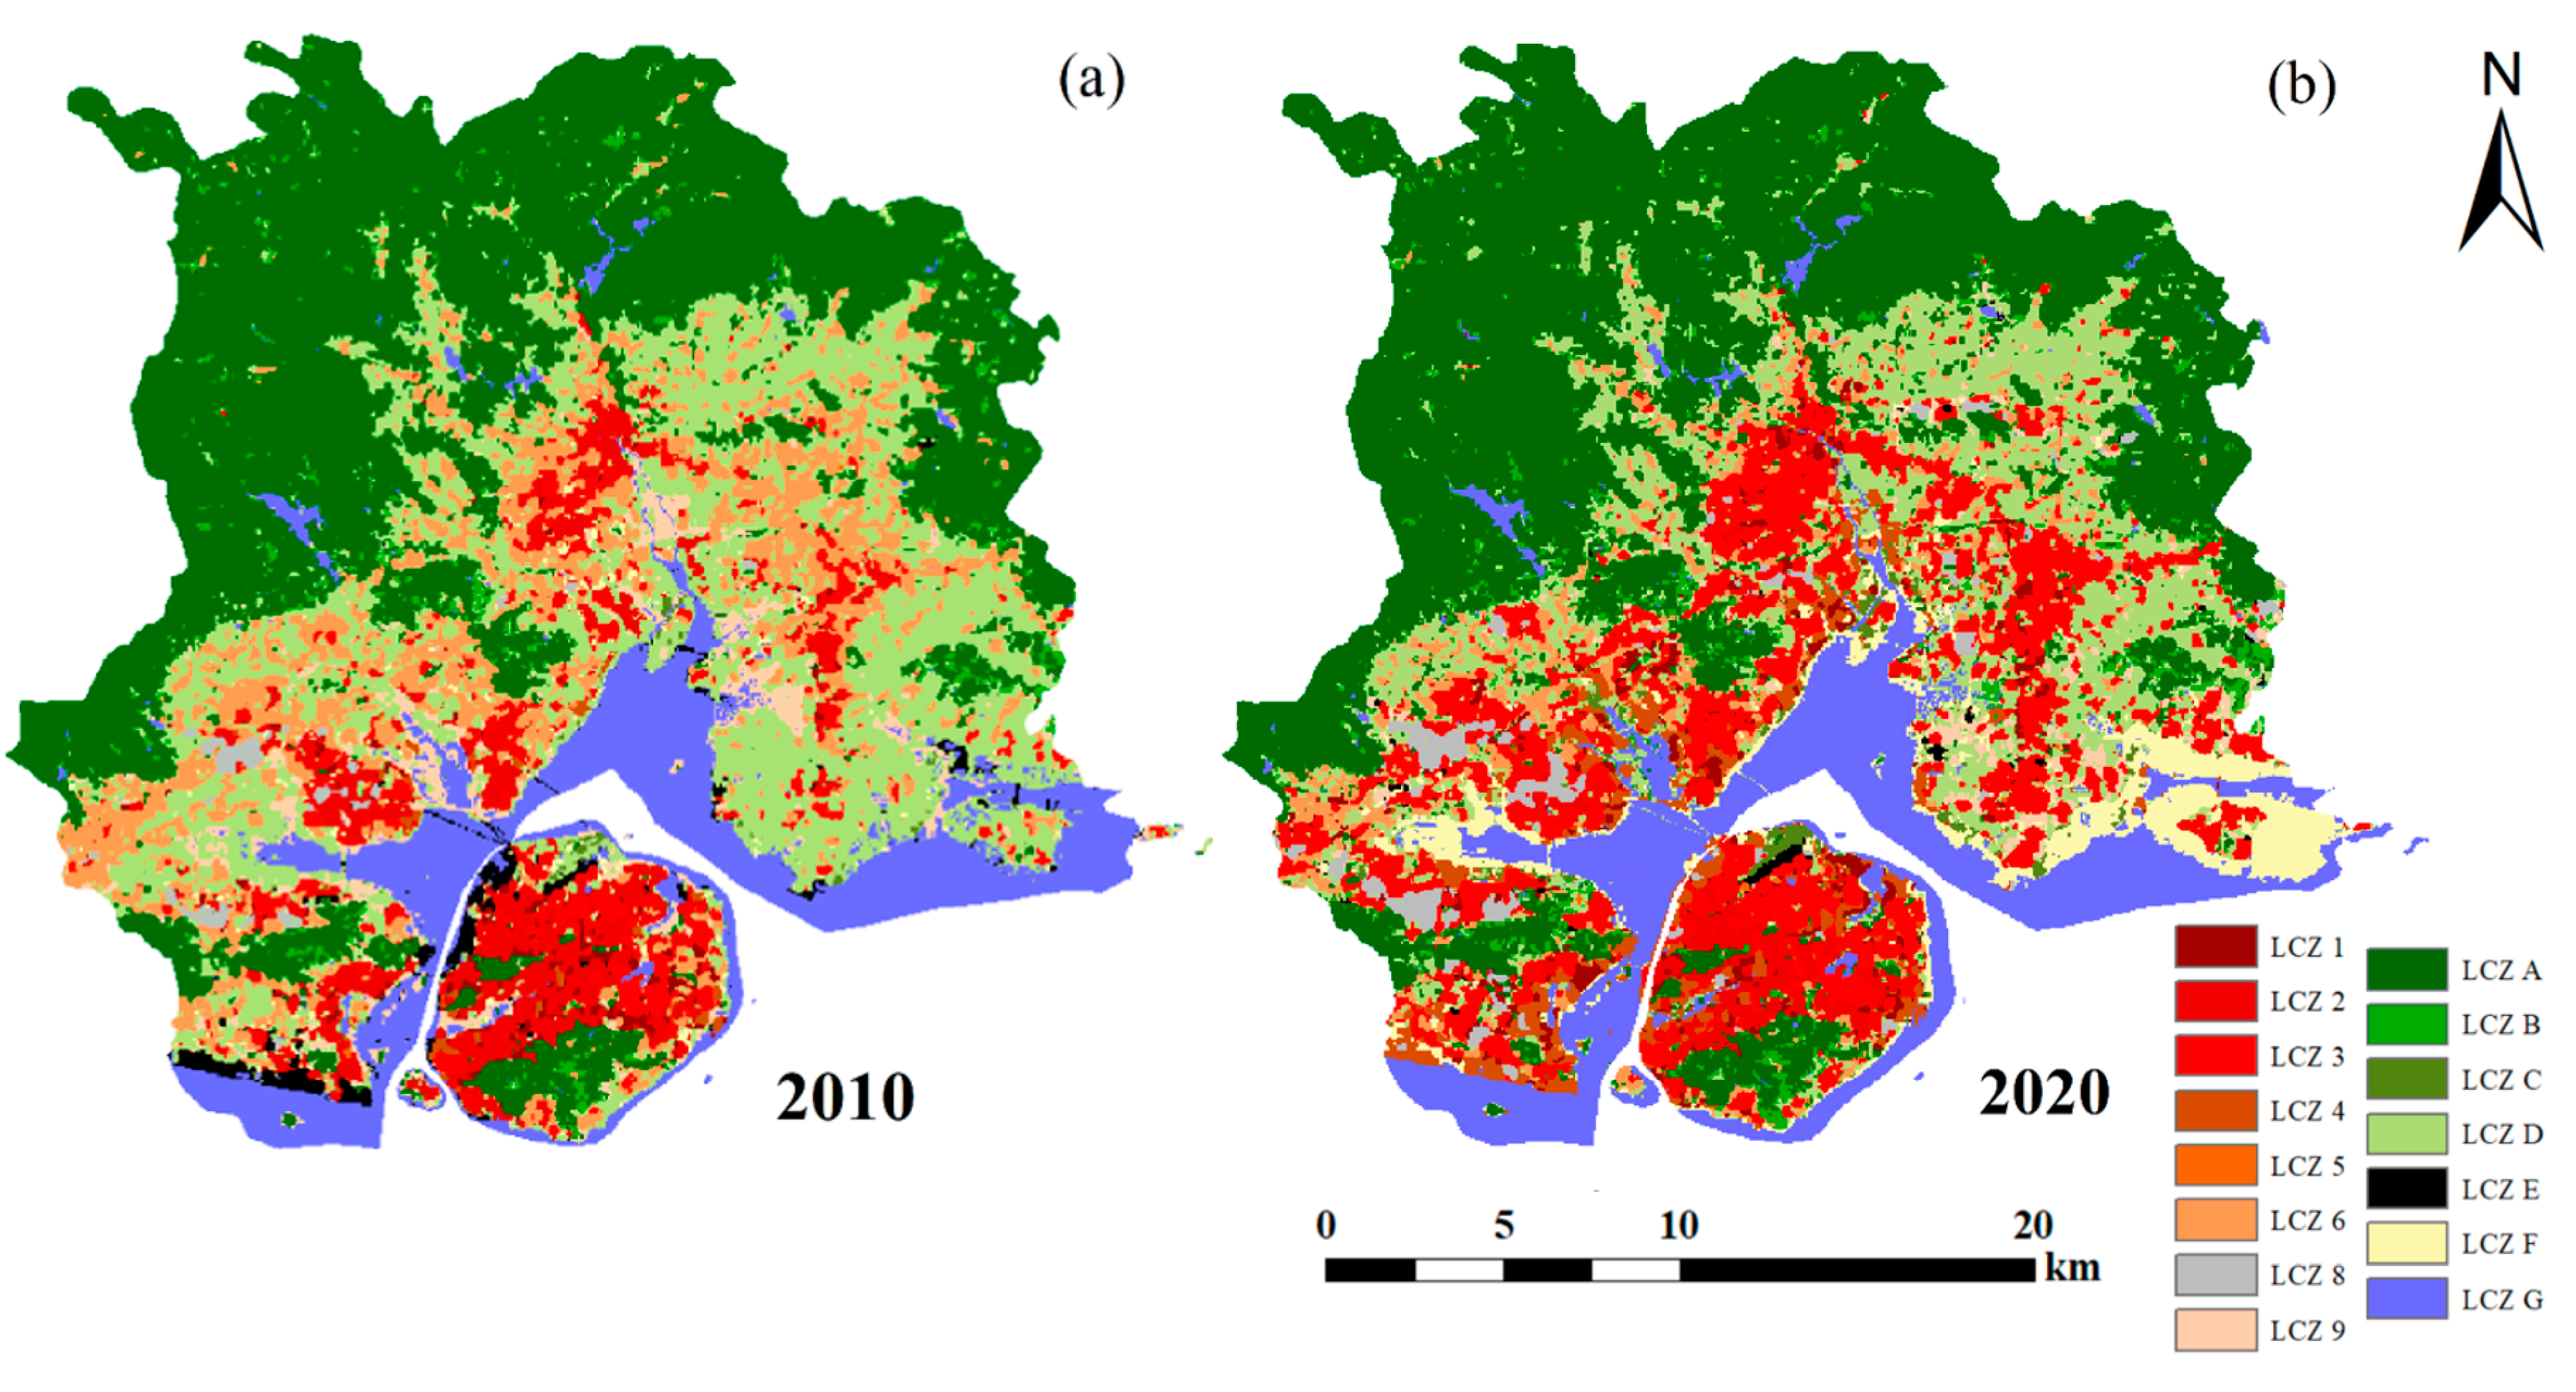
The GeoDetector model, proposed by Wang and Xu [54], is a robust analytical framework designed to examine the driving forces and influencing factors of various phenomena, as well as the interactions between multiple factors. It is primarily used to detect spatial variability of geographical elements. In this study, the model was applied to analyze the relative importance and spatial differentiation of various factors influencing the SUHI intensity. The factor detector analysis was used to assess the explanatory power of each factor on SUHII, while the interaction detector quantitatively analyzed how the interaction between two factors affected their relative influence compared to individual factors. The model variables are summarized in Table 3. Data were discretized into five levels and converted into categorical variables to facilitate effective analysis.
The specific formula for calculating the explanatory power (q) of the independent variable on the dependent variable is as follows:
q = 1 1 N σ 2 h = 1 L N h σ h 2
where 0 ≤ q ≤ 1, and when q = 0, it indicates that the SUHII is not driven by the influencing factors. The larger the q value is, the greater the explanatory power of the factor on SUHII. N represents the total number of sample units in the entire region; σ2 is the variance of the dependent variable in the entire region; L is the total number of strata for the factors in the region; h = 1, 2, …; L represents the stratification of variables or factors; Nh is the number of sample units in stratum h; and σ h 2 is the variance of the dependent variable in stratum h.

2.3.5. LCZ Mapping

The LCZ system serves as a surface classification framework widely used in SUHI studies. As shown as Table 4, this system integrates factors such as urban morphology, building characteristics, and surface cover to categorize urban areas into distinct climate zones, facilitating a more precise analysis of urban thermal environments and their spatiotemporal variations [24]. In this study, LCZ mapping was performed using LCZ Generator. During the mapping process, sample datasets generated using Google Earth were divided into training (70%) and testing (30%) datasets. Based on the submitted parameter information and these sample datasets, the LCZ Generator selects appropriate images from the Earth observation datasets available in the WUDAPT database through the Google Earth Engine platform. A random forest classifier was employed to generate LCZ maps with a resolution of 100 m.
The LCZ classification scheme categorized urban surface morphology into built-up and natural surface types. It included 17 types: 10 built-up environment types (LCZ 1–LCZ 10) and 7 natural environment types (LCZA–LCZG). Each type was characterized by a set of standardized urban morphological indicators, such as building height and density, within defined value ranges. Given the surface morphology of Xiamen, LCZ 7 and LCZ 10 were excluded due to their insufficient representativeness. Approximately 500 samples were selected for the LCZ classification based on their morphological characteristics. The accuracy information and suspicious polygons returned by the LCZ Generator were utilized to refine the classification further. Reclassification was performed by adding or modifying sample data until the results accurately reflected the actual conditions.

3. Results

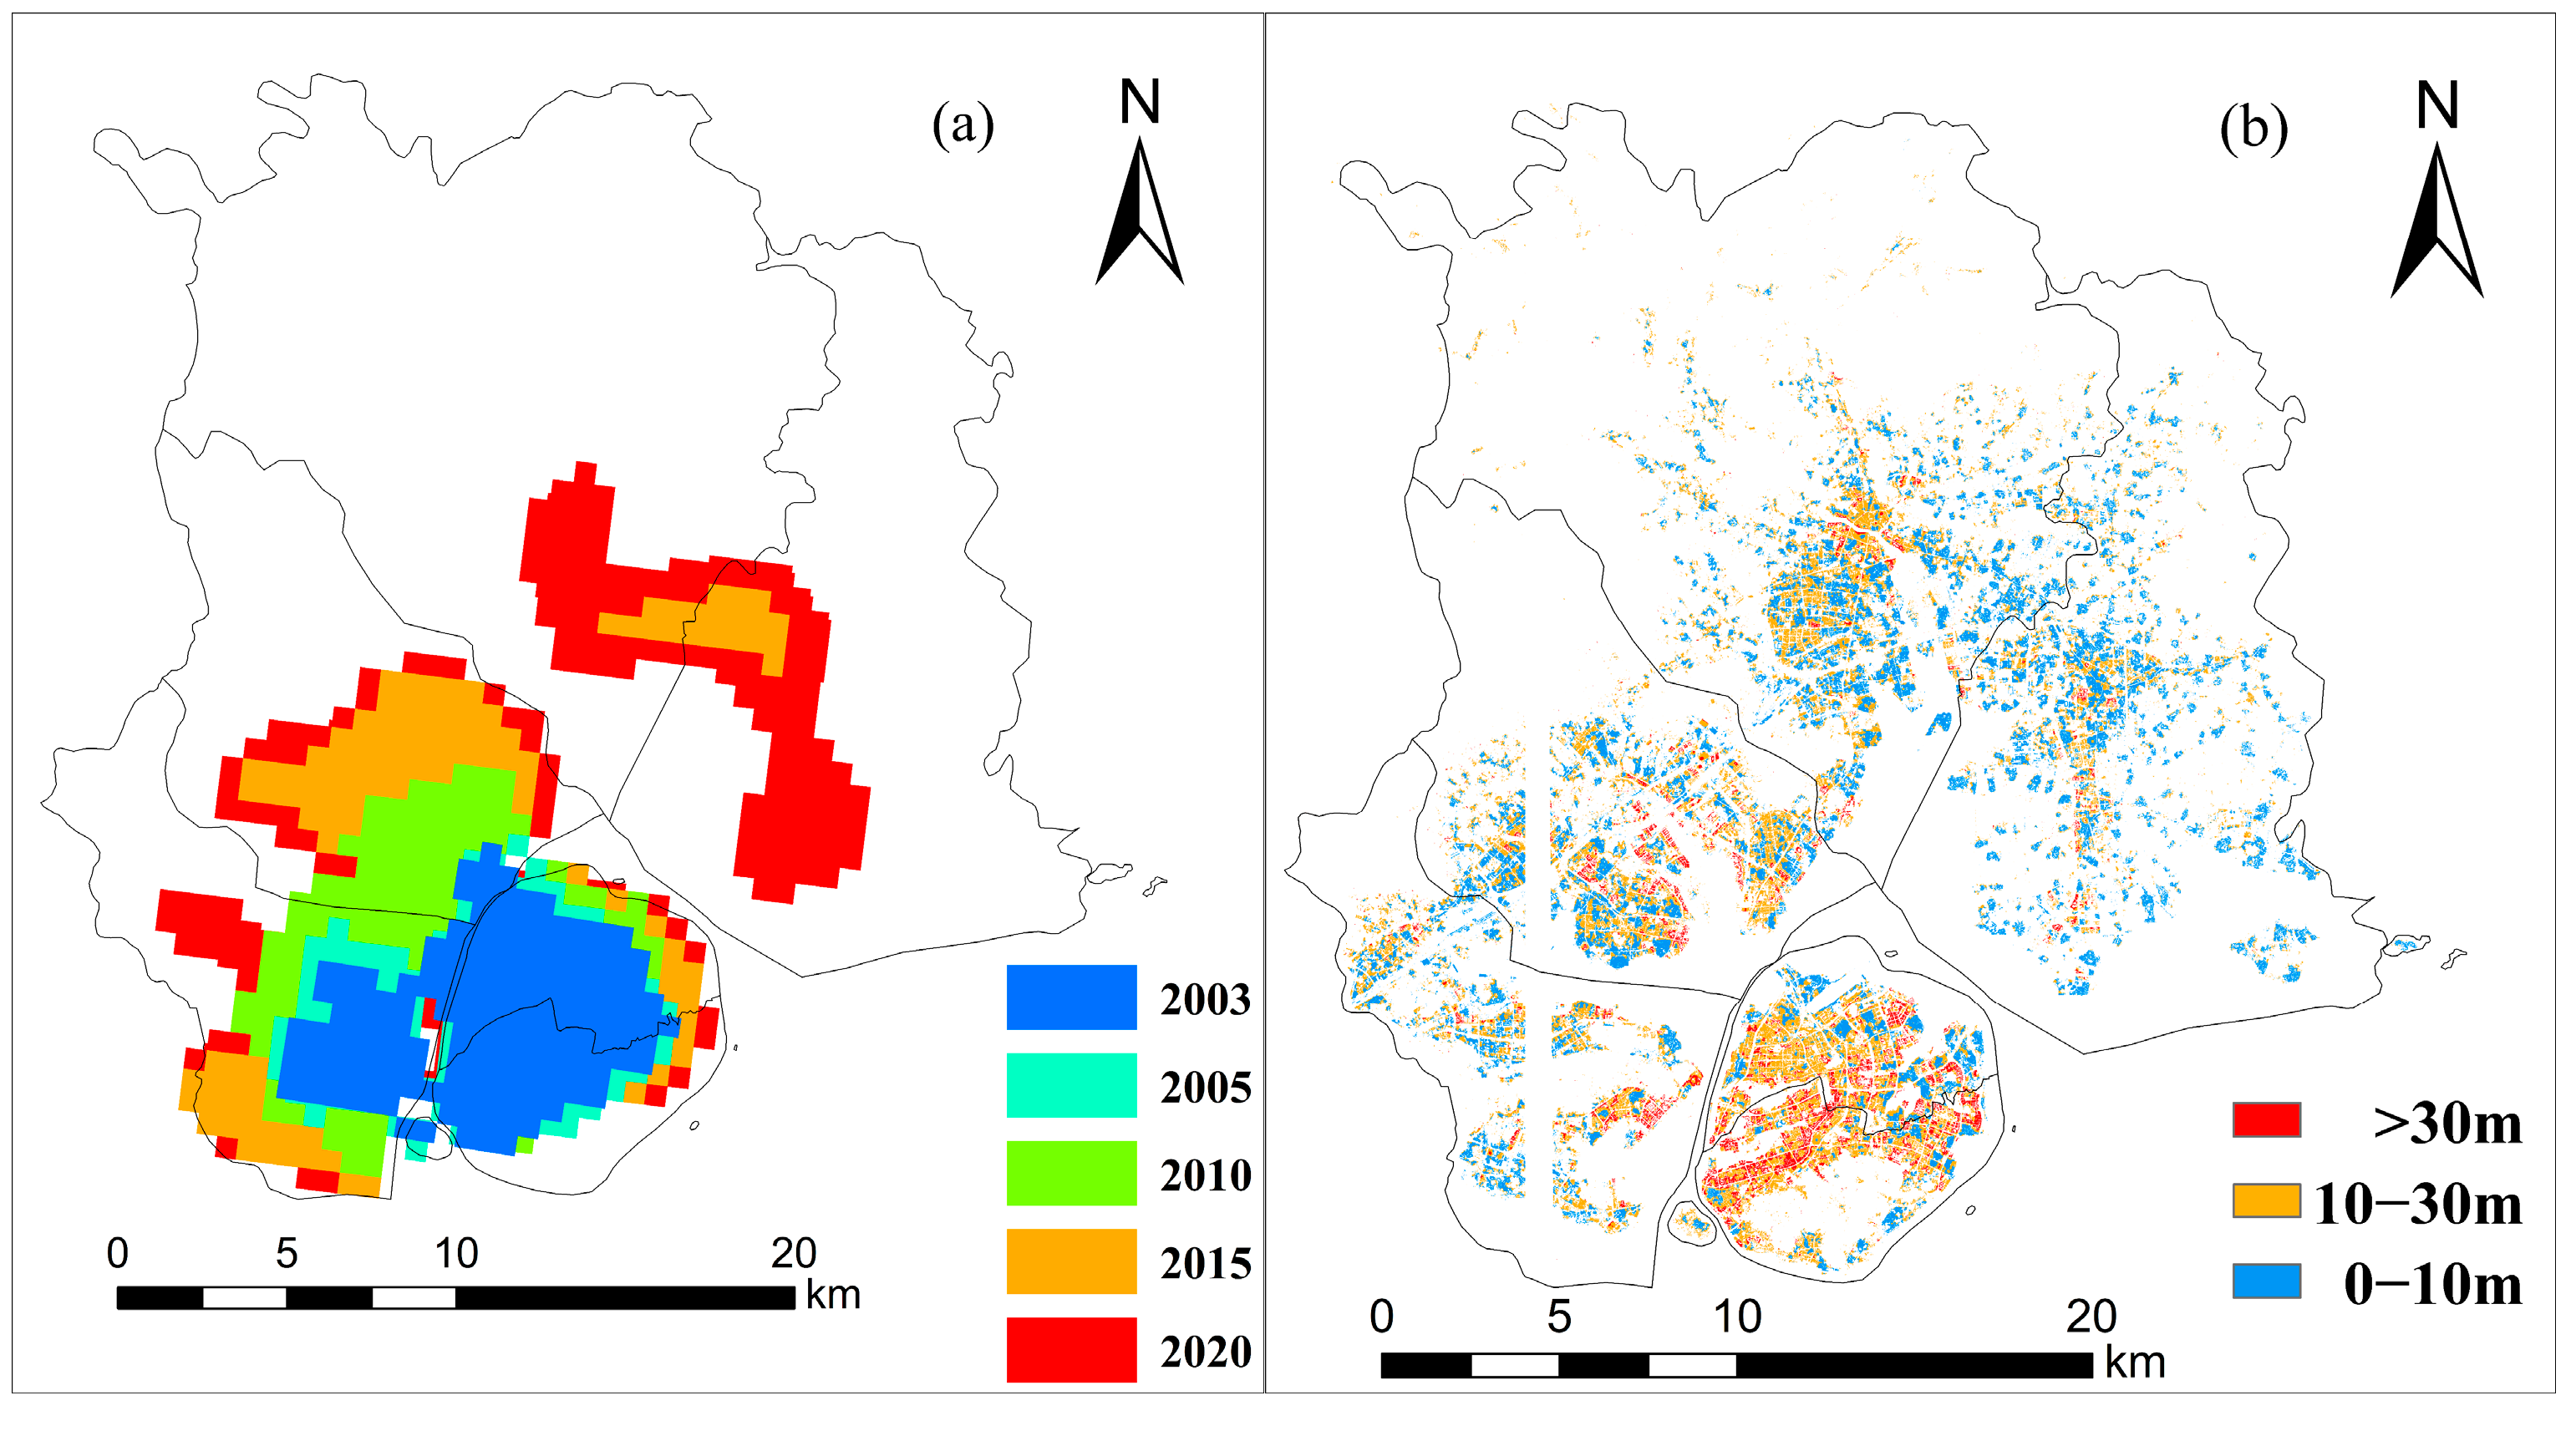
3.1. Analysis of Urban Spatial Expansion Characteristics

As shown in Figure 3b, the distribution of building heights within the Xiamen District reveals distinct regional characteristics. The core business areas and emerging development zones feature taller buildings, whereas traditional residential and industrial zones primarily consist of low-rise buildings. High-rise buildings exceeding 30 m are predominantly concentrated in the central urban areas of Xiamen, including the Siming and Huli districts. These areas serve as the economic and commercial hubs of the city, housing numerous high-rise buildings such as commercial office towers, office buildings, and residential complexes.
In contrast, medium-rise buildings, ranging from 10 to 30 m, are more evenly distributed throughout the region. They are primarily located in major residential areas, both within and outside Xiamen Island. These buildings are typically mid-rise residential complexes and low-rise commercial structures designed to support high population densities. Low-rise buildings, ranging from 0 to 10 m, are mainly situated on the outskirts of the island, particularly in Tong’an and Xiang’an Districts. These areas predominantly feature low-rise buildings, including residential homes, rural buildings, and industrial facilities.
As shown in Figure 3a and Table 5, the built-up areas of Xiamen increased rapidly from 108.52 km2 in 2003 to 413.99 km2 in 2020. The period from 2005 to 2010 recorded the highest rates of expansion, with an average increase of 21.29 km2 per year and an intensity of 15.74%. Following this peak, the rate and intensity of expansion slowed during the subsequent periods, with 2010–2015 and 2015–2020 experiencing annual growth rates of 18.10 km2/year (7.49%) and 16.37 km2/year, (4.93%), respectively. This trend indicates a shift toward more stable development patterns over time.
The standard deviation ellipse method exhibits directional characteristics of urban expansion, with the elongation of the ellipse representing the primary direction of urban growth. A greater difference between the major and minor axes signifies more pronounced elongation, indicating a clearer direction of expansion. As shown in Figure 4 and Table 6, the center of the standard deviation ellipse for built-up areas in 2003 was located at the junction of the Siming and Huli districts. Over time, this center shifted toward Tong’an District, passing through the Haicang and Jimei districts, reflecting a general south-to-north direction.
From 2003 to 2020, the areas encompassed by the built-up zone’s standard deviation ellipse increased from 110.87 km2 to 597.03 km2, showing an overall expansion from the northeast toward the southwest. Furthermore, the most significant average center shift of the built-up areas occurred between 2015 to 2020, with a maximum shift of 4.89 km.
The center of the standard deviation ellipse remained largely within the Jimei District, showing a southwestward trend, which suggests that the concentration of secondary industries is higher than that in other districts. Conversely, the center of the standard deviation ellipse for the tertiary industry showed a southeastward shift from 2003 to 2010, followed by northeastward migration from 2010 to 2020, and presents a U-shaped trajectory in the opposite direction to the secondary industry, which is in line with the actual situation of a decrease in the proportion of the secondary industry and an increase in the proportion of the tertiary industry.
The center of GDP mainly moves within the Huli District, generally moving toward the southwest, indicating that the economic growth rate of the Huli District and Siming District is greater than that of the other regions. The most significant center shift occurred between 2010 and 2015, moving 1.28 km, while the smallest shift occurred between 2005 and 2010, being only 0.20 km. The overall deviation distance was relatively small, indicating that the spatial distribution of economic development is increasingly concentrated in the main direction.

3.2. Analysis of SUHI Influencing Factors

To investigate the relationship between urban development factors and the intensity of the SUHI effect, LST for Xiamen during the summer and winter from 2003 to 2020 were retrieved using ENVI 5.3. These results were normalized using a range normalization processes, enabling the generation of heat island maps using ArcGIS 10.8.1, which allowed for the analysis of the spatial distribution of the heat island effects.
As shown in Figure 5, the areas of level 5 heat island exceeded that of level 4 heat island in the summer, whereas in the winter, level 4 heat island consistently occupied larger areas than did level 5 heat island. Across both seasons, the proportion of heat island areas within built-up zones gradually decreased, indicating that the intensity of heat island effects in the central urban areas became more dispersed over time. Furthermore, waterbodies and specific low-lying vegetation types were observed to play significant roles in mitigating heat island effects. Level 1 non-heat island zones were primarily located in low-temperature regions, such as waterbodies, greenspaces, and mountainous areas within Xiamen’s urban core, where temperatures were notably lower than those in suburban areas.
The transitional heat island zones, categorized as level 2 and level 3, were predominantly distributed in suburban farmlands, nature reserves, and greenspaces. These areas underwent urbanization that led to temperatures approaching those of suburban zones. In contrast, level 4 and level 5 heat island zones were concentrated in built-up areas with cement, asphalt, and concrete surfaces, which possess higher heat capacity and thermal conductivity compared to suburban greenspaces, allowing them to absorb more heat. These hot zones typically include densely populated residential, commercial, and industrial areas with high levels of human activity.
Rapid urbanization, accelerated expansion of construction land, and large-scale population influx have contributed to land scarcity in Xiamen. Consequently, it is anticipated that land-use efficiency will substantially increase in the future to meet the growing demand for urban spaces. Analysis of the spatiotemporal distribution of heat island intensity in Xiamen over the past 17 years revealed a northwest–northeast expansion trend. The heat island effect has intensified significantly, with both its magnitude and extent increasing substantially, which is consistent with the scale and direction of Xiamen’s rapid urban development. As shown in Table 7, the areas of the summer heat island expanded from 266.24 km2 in 2003 to 440.53 km2 in 2020, while the winter heat island grew from 124.08 km2 to 227.16 km2. The summer exhibited the fastest expansion rate, with an average annual increase of 10.25 km2. The most significant growth occurred in the level 4 heat island zones during the summer, with an increase of 113.34 km2. In contrast, the largest decline occurred in level 1 heat island zones during winter, with a reduction of 131.58 km2.

3.3. Analysis of Influencing Factors of SUHI

The factor detector and interaction detector modules were used to investigate the explanatory power of seven potential factors driving seasonal changes in the heat island effect. Figure 6 visually represents the q-values for individual factors and their interactions, with statistical significance confirmed by p-value tests (p < 0.01). Given the relatively limited geographical scope of the study, the q-values of these factors exhibited notable seasonal variations.
For both summer and winter, the explanatory power of the factors influencing the SUHII in Xiamen was ranked as follows: population density (x1) > built-up areas (x2) > GDP per capita (x7) > building height (x4) > secondary industry proportion (x5) > sky view factor (x3) > tertiary industry proportion (x6). Among these, population density (x1) emerged as the most prominent factor affecting the spatial and seasonal variability of the SUHI, with q-values of 0.626 and 0.574 in the summer and winter, respectively. The q-values for built-up areas (x2) and GDP per capita (x7) were also significantly higher than those of other factors in both seasons, highlighting their importance.
In addition, the interaction effects of the influencing factors significantly shaped the spatial heterogeneity of the heat island effect. In the comparison of the influence of each pair of factors, the combined effects of population density (x1) and GDP per capita (x7) with other factors exhibited stronger explanatory power. In the summer, the factor combinations with the highest explanatory power included x1 ∩ x2 (0.712), x2 ∩ x7 (0.688), and x1 ∩ x7 (0.682). In the winter, the combinations with the highest explanatory power were x1 ∩ x2 (0.650), x1 ∩ x7 (0.642), and x1 ∩ x4 (0.623). This analysis indicates the complex interplay of urban factors and highlights the significance of population density and economic activity in shaping the SUHI phenomenon in Xiamen.

LCZ Mapping Analysis for XIAMEN in 2010 and 2020

The result of continuously modifying the samples and reclassifying them was an OA value of 0.78 in 2010 and 0.81 in 2020. The average overall accuracy of all LCZ categories exceeds the minimum accuracy of 50% recommended [55]. In addition, the kappa coefficients were calculated using the confusion matrix on Envi software, which were 0.77 and 0.79, respectively. Figure 7 and Table 8 illustrate the spatial distribution of LCZ types in Xiamen for 2010 and 2020, as well as the areas transitions between LCZ categories during this period. In 2010, the areas of natural LCZs were larger than areas of the built-up LCZs. However, by 2020, 6.98% of natural LCZ areas had transitioned to built-up LCZ areas. The primary LCZ types in Xiamen were LCZ A, LCZ D, and LCZ G, which together accounted for 50.31% of the total areas in 2010 and decreased to 43.33% by 2020.
Among the built-up LCZ types, LCZ 2 accounted for the largest proportion of core urban areas in 2010. By 2020, however, LCZ 3 emerged as the dominant type, predominantly concentrated in the Siming and Huli districts. In districts surrounding the urban core, LCZ 6 remained the predominant type, covering 81.86 km2 in 2010 and 53.87 km2 in 2020. LCZ 1 occupied the smallest areas, increasing from 17.18 km2 in 2010 to 31.18 km2 in 2020.
Among the natural LCZ types, LCZ D covered the largest areas but decreased from 188.48 km2 in 2010 to 151.84 km2 in 2020. LCZ A decreased from 150.90 km2 to 126.84 km2 during the same period. LCZ G exhibited minimal changes, with only 4.69 km2 of its areas transitioning.
Regarding changes within built-up LCZ types, LCZ 3 exhibited the most significant growth, expanding by 33.99 km2, whereas LCZ 6 experienced the largest reduction of 27.99 km2. Among the natural LCZ types, LCZ E and LCZ F were the only categories that increased in areas, expanding by 16.87 km2 and 15.93 km2, respectively. LCZ D showed the greatest decrease of 36.64 km2. These data highlight the dynamic shifts in land use and the transition between natural and built environments in Xiamen, reflecting the effects of urbanization on local climate zones.

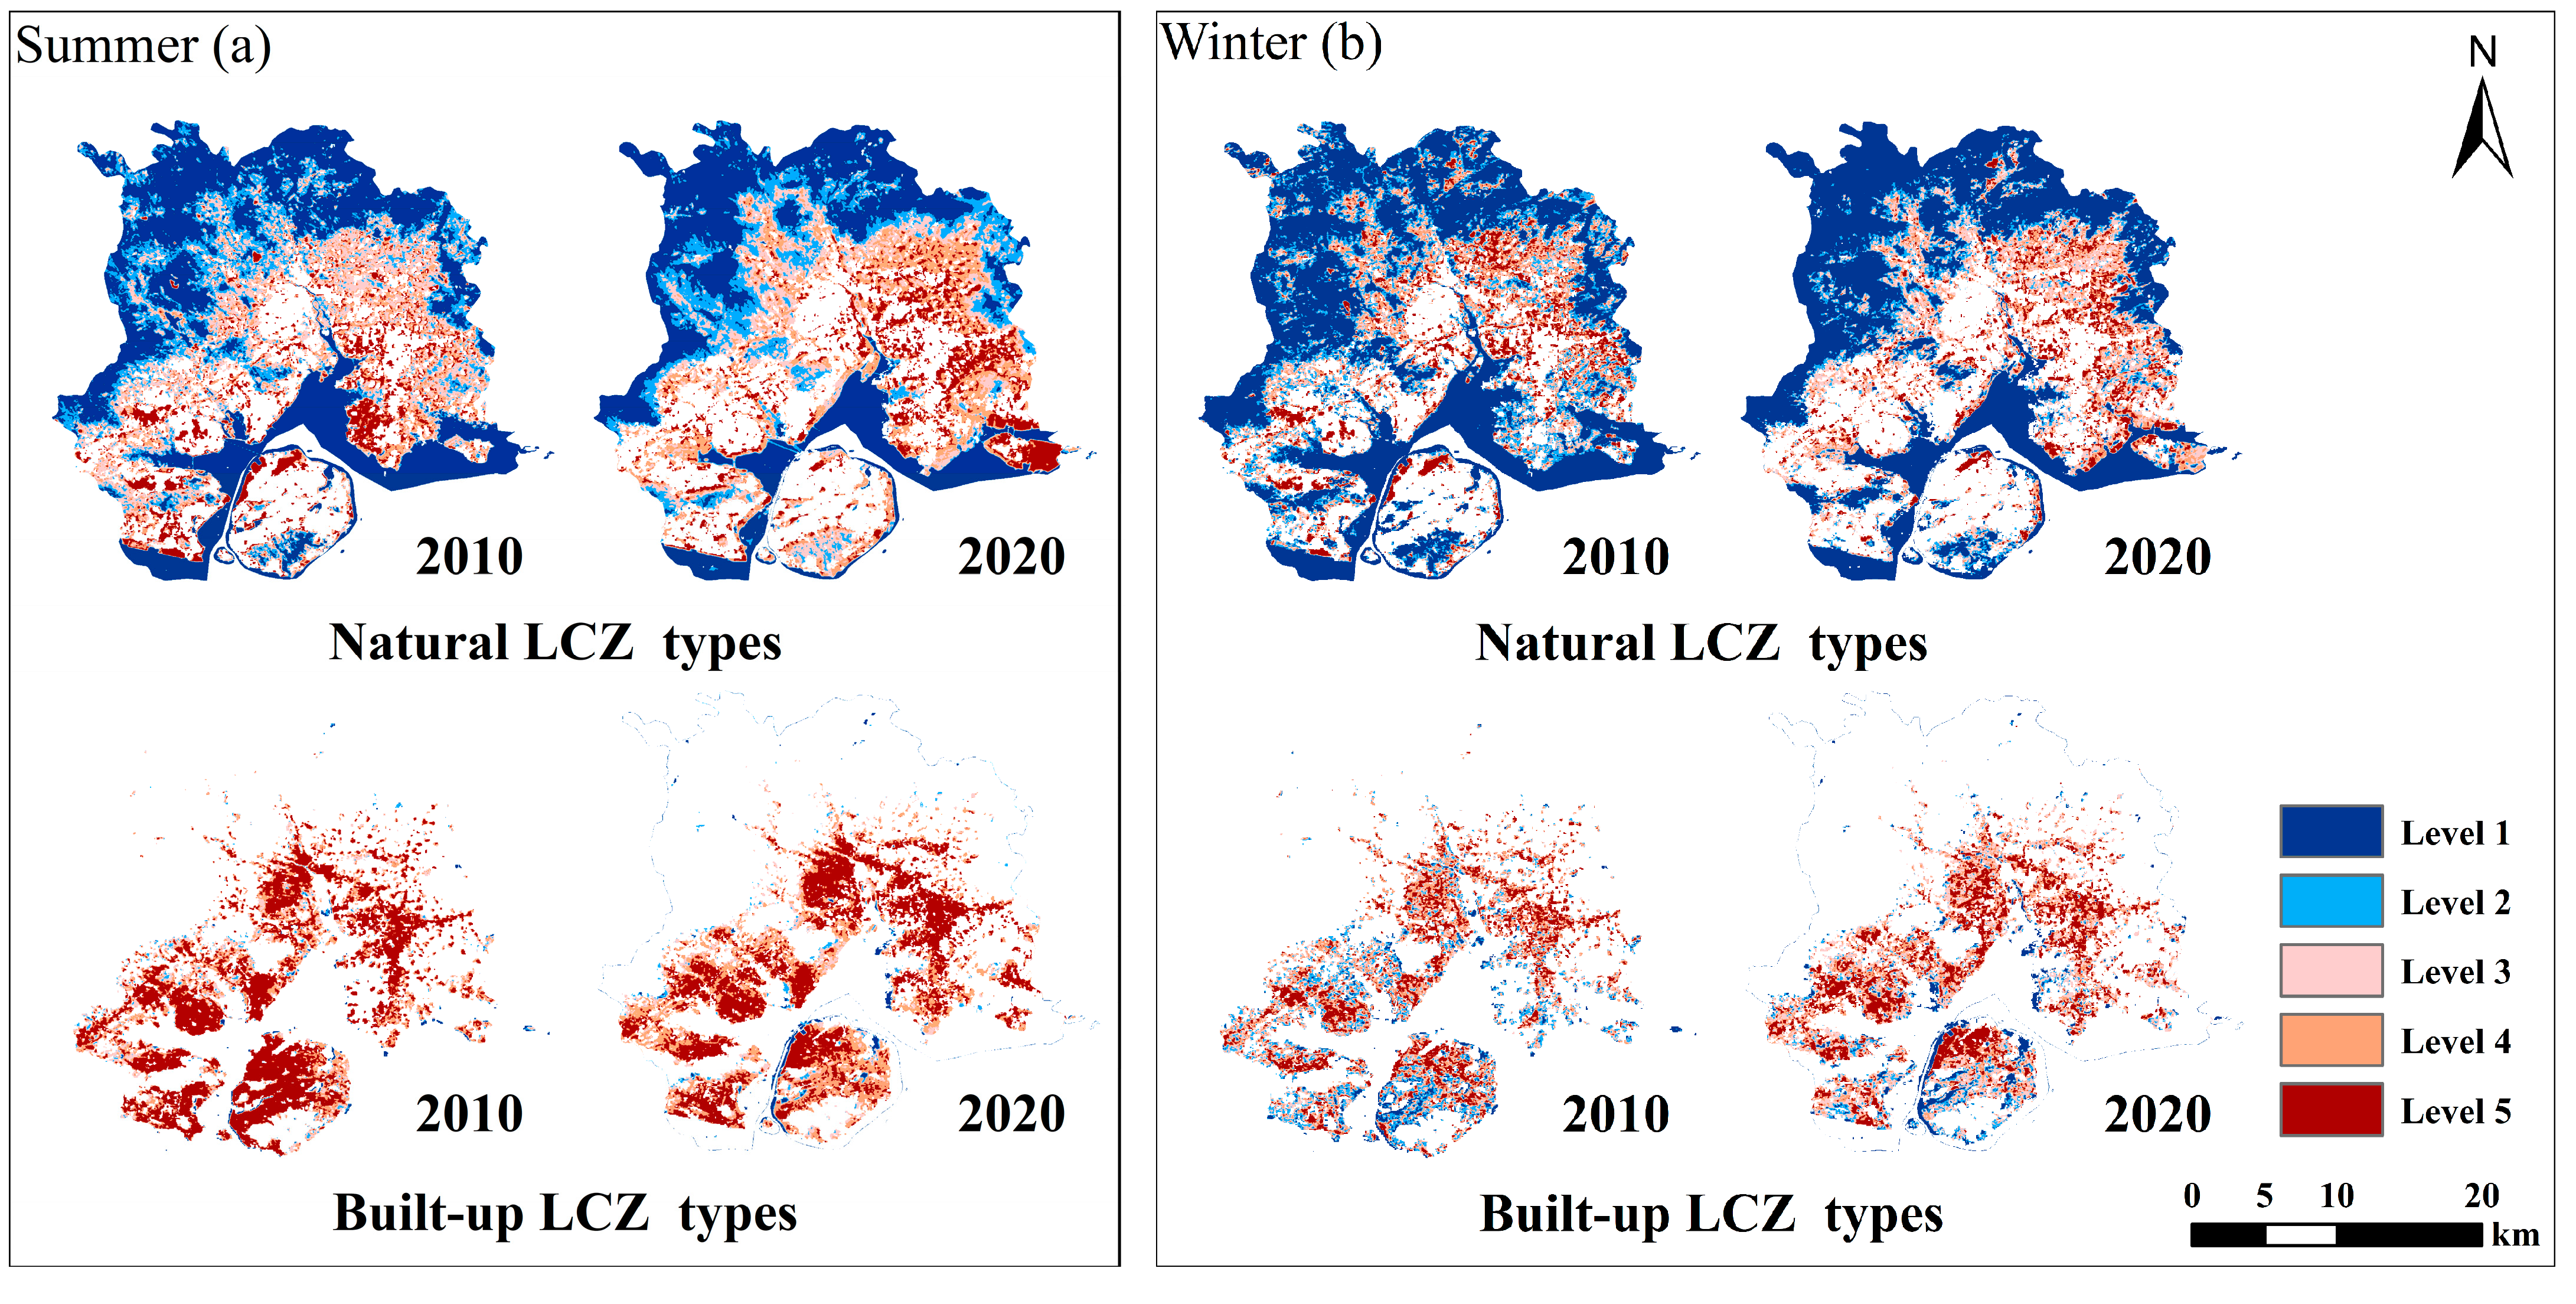
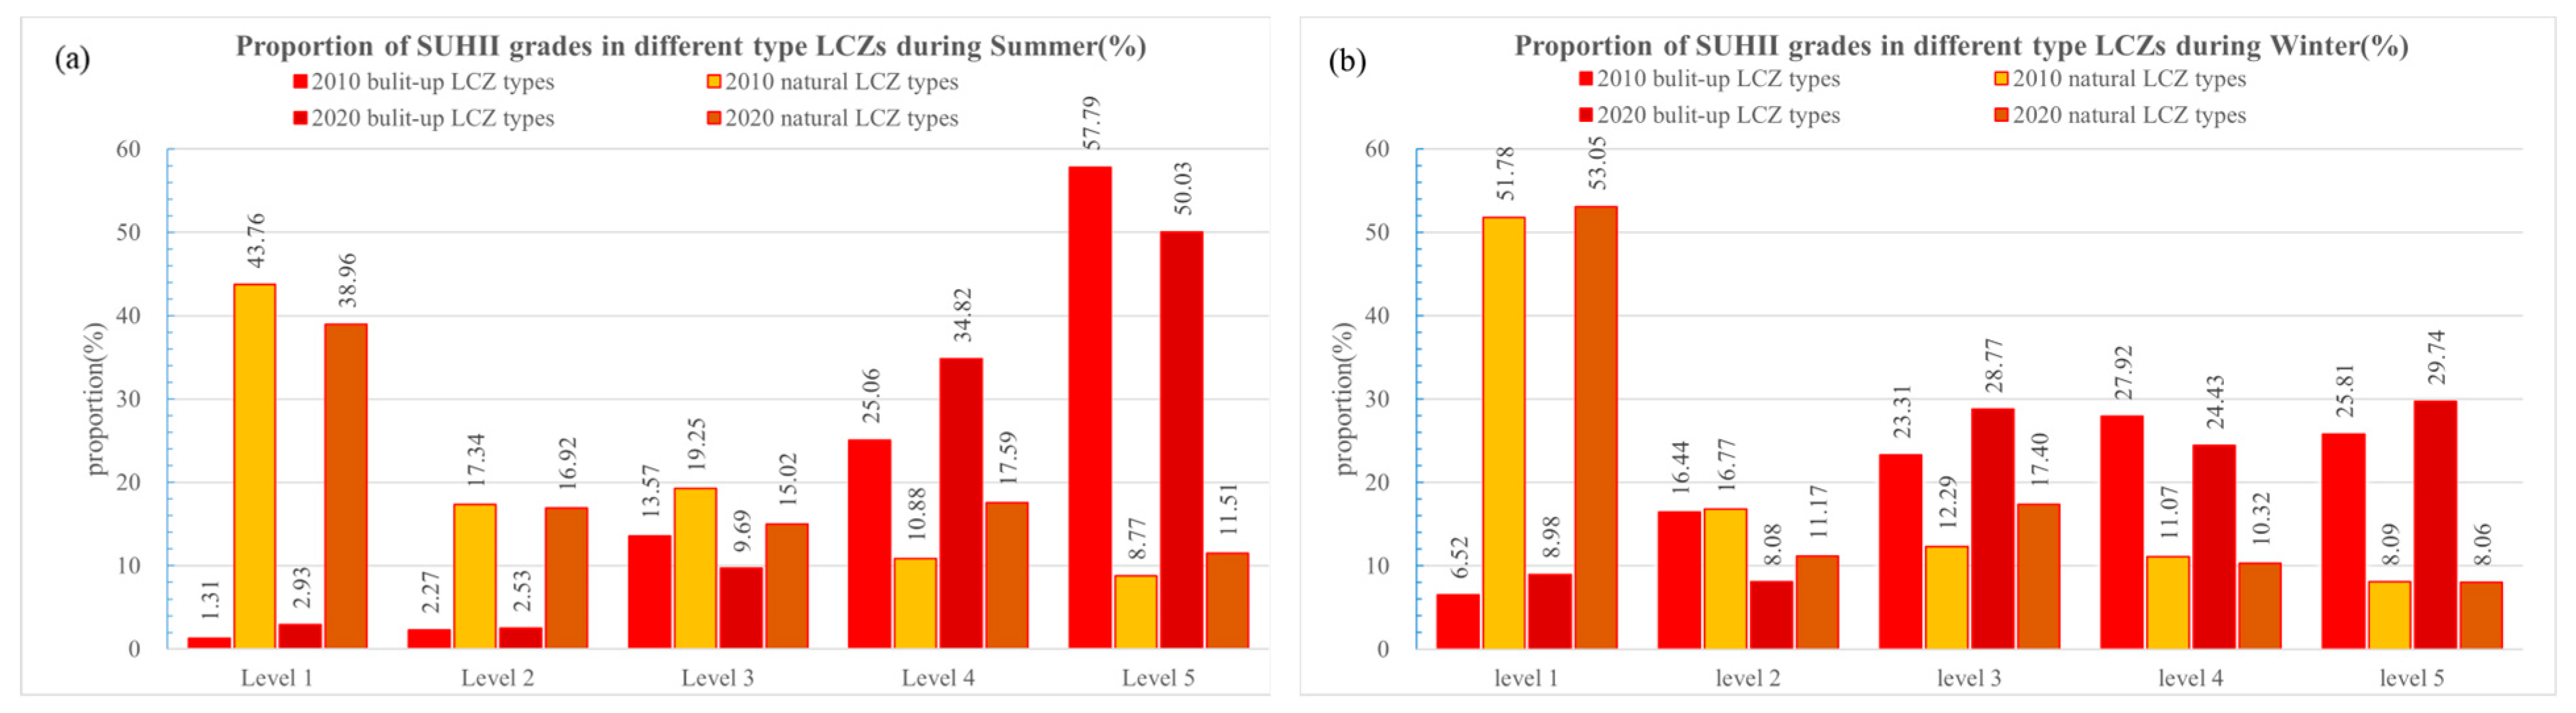
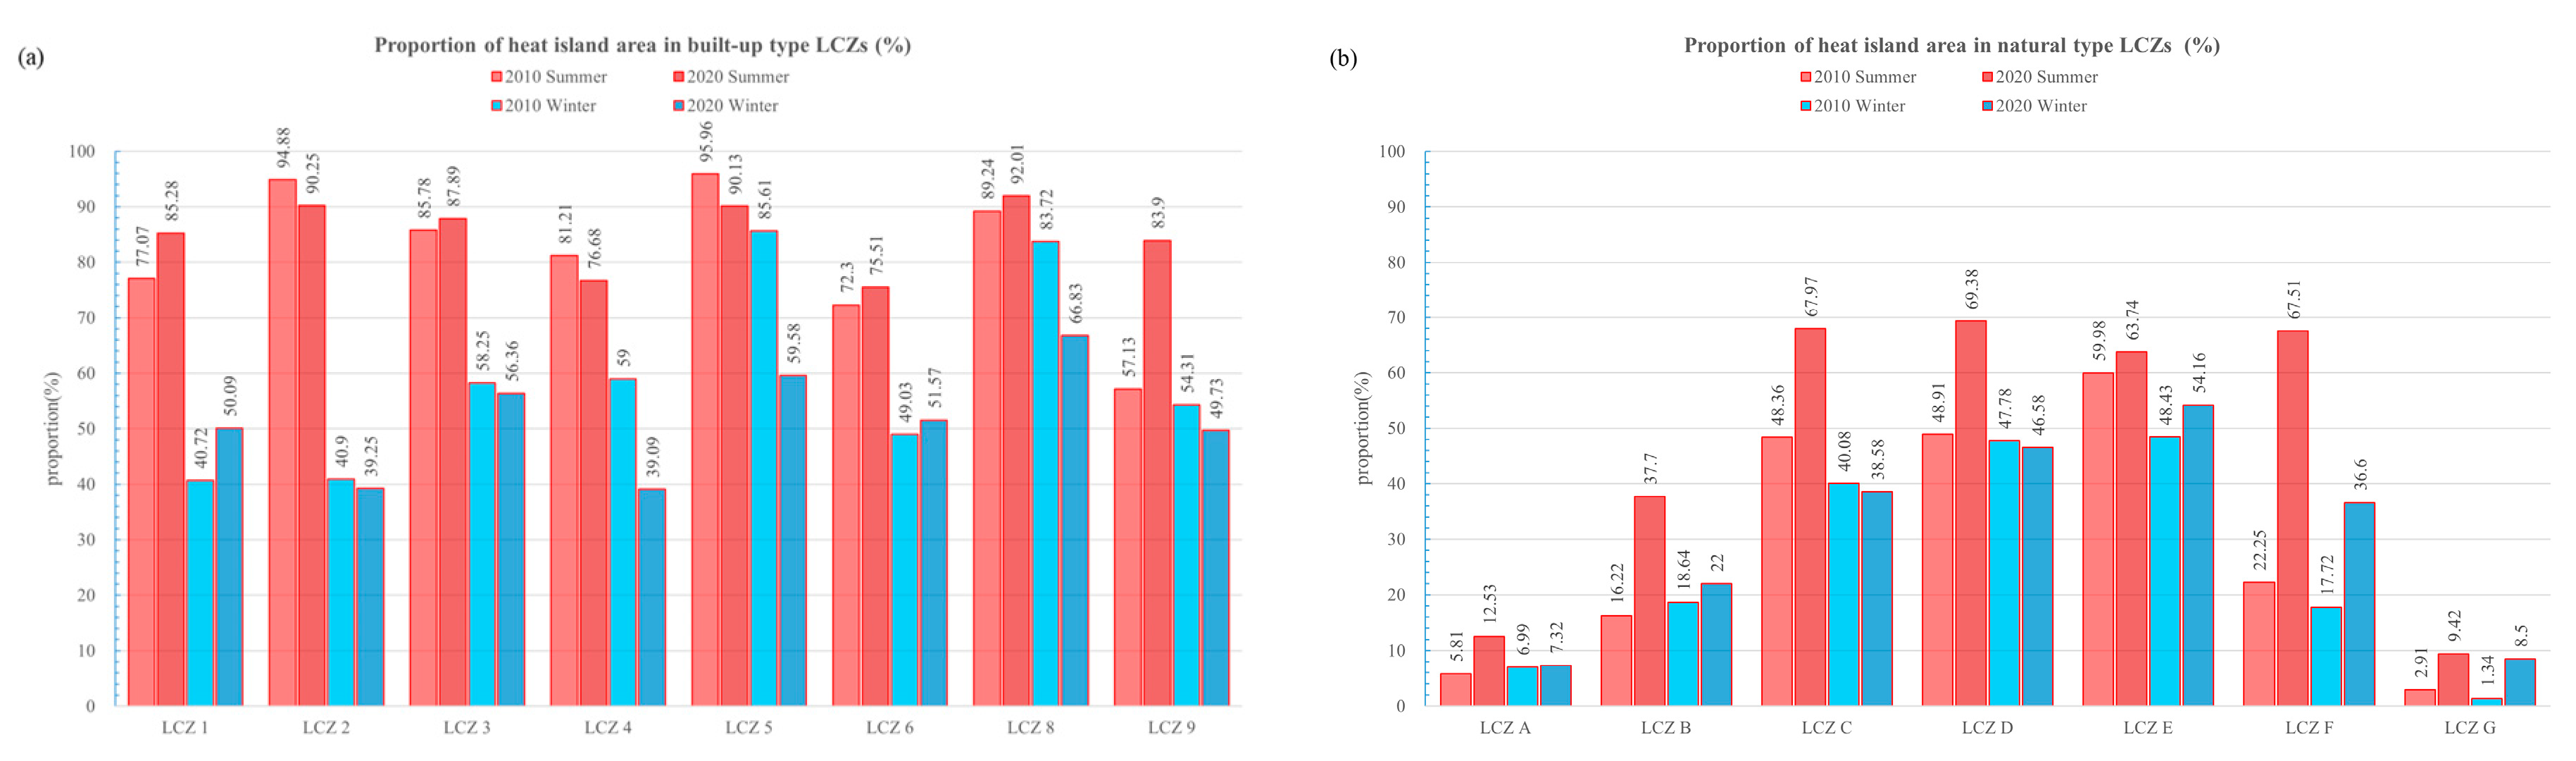
3.4. Analysis of SUHI Influencing Factors Based on LCZ

The SUHII within different LCZs is crucial for understanding urban and natural thermodynamics, which plays a vital role in local climate regulation and urban planning. Figure 8 and Figure 9 show the distribution and proportion of SUHII in natural LCZs and built-up LCZ types during the summer and winter of 2010 and 2020, respectively. In the summer and winter of 2010 and 2020, the proportion of level 4 and level 5 built-up LCZ types was higher than that of natural LCZ types, but the same was true for level 3 in the winter. The proportion of level 1 in the winter was higher than that in the summer, with an increase of 8.02% in 2010 and over 14.09% in 2020. The proportion of level 2 in the winter was slightly lower than that in the summer.
Figure 10 shows that LCZ 5 exhibited the highest proportion of heat island areas during the summer of 2010 in built-up areas, reaching as high as 95.95%, and also showed the highest average proportion of heat island areas in summer. This was followed by LCZ 2, which typically includes large-scale mid-rise buildings with concrete structures, steel roofs, and extensive impervious surfaces. However, in the winter, LCZ 8 had the highest average proportion of heat island areas. These industrial buildings often use materials such as metal panels and concrete, which have high thermal conductivity and heat storage capacity. This effect is particularly pronounced in the winter when solar radiation is weaker than in the summer, and nighttime temperatures are lower, making the heat island effect more significant.
Regarding natural types, LCZ E exhibited the highest proportion of heat island areas in both the summer and winter, reflecting the thermal impact imposed by impervious surfaces (such as natural hard-paved or paved areas). These areas are typically composed of asphalt, concrete, or stone, which have high thermal conductivity and heat capacity, allowing them to quickly absorb and store large amounts of solar radiation. Compared to trees, water bodies, or farmland, these surfaces have a lower albedo, absorbing more solar energy and converting it into heat, leading to significantly elevated surface temperatures. Moreover, LCZ E areas lack vegetation and moisture, resulting in minimal evapotranspiration, which limits the dissipation of heat through this mechanism, thereby intensifying the heat island effect. In contrast, LCZ G exhibited the lowest average proportion of heat island areas. The differing heat island effects of various LCZ types across seasons highlight the importance of implementing tailored heat mitigation strategies.
Figure 11 shows the driving mechanisms influencing the heat island effect based on LCZ data from 2010 and 2020. Correlation coefficients were used to assess the enhancing and suppressing effects of various factors on heat island effects. The results indicated that positive correlations between the heat island effect and population density (x1), built-up areas (x2), sky view factor (x3), and GDP per capita (x7) were particularly pronounced in areas dominated by built-up LCZ types. Conversely, the proportion of the tertiary industry (x6) demonstrated a suppressive effect on the heat island effect in both the summer and winter. Additionally, factors such as building height (x4) and secondary industry proportion (x5) enhanced the heat island effect during the summer, but exhibited variable impacts during the winter.

4. Discussion

4.1. Attribution of Urban Spatial Expansion

Between 2003 to 2020, Xiamen experienced substantial urbanization, evidenced by increased population density and amplified commercial activity. However, the SUHI effect showed signs of mitigation, which can be attributed to the optimization and upgrading of industrial structures alongside rational adjustments to industrial layouts. The city’s economic framework gradually transitioned from a secondary and tertiary industry focus to a more tertiary-sector-led economy. The tertiary industry plays a crucial role in stabilizing the overall economic development; thus, a rational adjustment of industrial structures is essential for promoting urban growth. As the economic stability enhances industrial optimization, a synergistic relationship between these factors emerges.
Analysis of the LCZ and SUHI distribution maps for 2010 and 2020 indicated that most manufacturing plants were relocated from central urban areas, replaced by the rapid development of modern service industries. This transition optimized the spatial layout of the city, reduced heat sources in the central urban zones, and alleviated the SUHI effect.
Xiamen’s main urban areas exhibited nonlinear growth, reflecting the challenges posed by limited land resources. Improving land-use efficiency remains a critical challenge; however, it is essential to avoid indiscriminate expansion of built-up areas or increases in building heights. Instead, comprehensive planning strategies that consider the impact of SUHI should be developed to achieve optimal developmental outcomes. Additionally, heat island patches in proximity tended to merge into larger clusters; however, the presence of natural barriers, such as waterbodies and mountains, prevented these patches from connecting, thereby preventing more severe heat island effects. As urban areas continue to grow, it is essential to factor in the roles of blue and greenspaces and make adjustments based on local conditions.

4.2. Discussion on the Main Factors Affecting SUHI

The study identified population density as the most significant factor influencing the SUHI effect. This finding correlates with Zhimin’s [56] conclusion drawn from a comprehensive analysis of urbanization and heat island intensity in Urumqi, which indicated that population density growth had the strongest positive correlation with the heat island effect. As human activities become more concentrated, anthropogenic heat emissions also increase, leading to higher temperatures. While various influencing factors can be managed during urban planning to mitigate the heat island effect, the feasibility of implementing different strategies should be carefully considered. In contrast, building height is a variable that can be more easily regulated. In most climate zones, building height is positively correlated with heat island intensity in summer but negatively correlated in winter. This phenomenon may arise from the increased sunlight exposure in summer, which raises urban surface temperatures. Taller buildings typically capture more solar radiation, and high-rise buildings in densely populated urban areas tend to accumulate more heat, contributing to the increase in local heat island intensity.
In the winter, lower temperatures result in less heat storage in buildings and urban areas, leading taller buildings to potentially reduce heat accumulation. Additionally, tall buildings can block sunlight and hinder heat exchange between the atmosphere and the ground, thereby weakening the heat island effect [57]. In general, studies suggest that height difference in buildings is negatively correlated with heat island intensity, whereas building volume density tends to have a positive correlation [58]. This relationship emerges because higher average building heights and increased height differences enhance vertical air movement, promoting heat dissipation. Conversely, increased building volume density reduces the spaces between buildings, which limits air exchange and hinders heat dissipation.
In addition, the significant seasonal differences among different LCZ types emphasize the importance of developing precise strategies for mitigating the heat island effect in different regions and seasons. The contribution of LCZ types in built-up areas to the heat island effect increases with the degree of urbanization and seasonal changes, and natural LCZ types play an important role in mitigating the heat island effect. The proportion of built-up LCZ types at level 4 and 5 was higher than that of natural LCZ types in both the summer and winter, indicating the contribution of accelerated urbanization to the urban heat island effect. In built-up LCZ types, LCZ 5 showed the highest proportion of heat island areas in the summer of 2010 (95.95%), and the average proportion of heat island in the summer was also the highest. LCZ 8 had the highest average proportion of heat island areas in winter, reflecting a stronger thermal storage effect of industrial areas and metal building materials in low-temperature environments. In natural LCZ types, LCZ E had the highest average proportion of heat island areas in both the summer and winter, indicating a significant impact of impermeable surfaces on the heat island effect. LCZ G had the lowest average proportion of heat island areas in the summer and winter, indicating that the natural surface has the strongest mitigating effect on the heat island effect.
To effectively mitigate the SUHI in Xiamen, the municipal government could implement the following measures:
(1)
Prioritize implementing green roofs and vertical vegetation systems for LCZ 5 in summer to reduce surface and environmental temperatures. Use reflective and high reflectivity materials on the exterior walls and road surfaces of buildings. In the winter, introduce vegetation buffer zones and wind corridors in LCZ 8 to promote heat dissipation.
(2)
Use porous materials as the new generation of environmentally friendly pavement materials and increase roadside greenery. In addition, protect existing water bodies and integrate them into a broader urban cooling network. Additionally, ensure hydrological connectivity between water bodies and green infrastructure to amplify cooling effects.
(3)
Finally, incorporate LCZ classification into the urban planning process to better monitor more refined urban heat island.

5. Conclusions

This study utilized multiyear remote sensing, statistical, and open-source datasets to extract urban built-up areas, retrieve LSTs, and analyze urban development and SUHI responses in Xiamen City. Employing standard deviation ellipse analysis, LCZ mapping, and geographical detection models, the research examined the factors influencing SUHI and their interactions. The key conclusions drawn from this study are as follows:
(1)
Urban expansion: From 2003 to 2020, the built-up area significantly increased in the northwest and northeast directions. The proportion of the tertiary industry increased with the decrease of the proportion of the secondary industry, mainly concentrated in the Jimei District. The spatial distribution of GDP development was increasingly concentrated in the Huli District and Siming District.
(2)
Non-linear SUHI expansion: The SUHI effect shows non-linear growth with urbanization, consistent with the expansion and development direction of built-up areas. The explanatory power of various influencing factors on SUHII in Xiamen was ranked as follows: population density (x1) > built-up areas (x2) > per capita GDP (x7) > building height (x4) > secondary industry proportion (x5) > sky openness (x3) > tertiary industry proportion (x6). Population density was identified as the most significant factor influencing SUHI, with q-values of 0.626 in the summer and 0.574 in the winter. The interactions between factors were also found to significantly shape the spatial heterogeneity of the SUHI effect, with the highest explanatory combinations reflecting strong interactions.
(3)
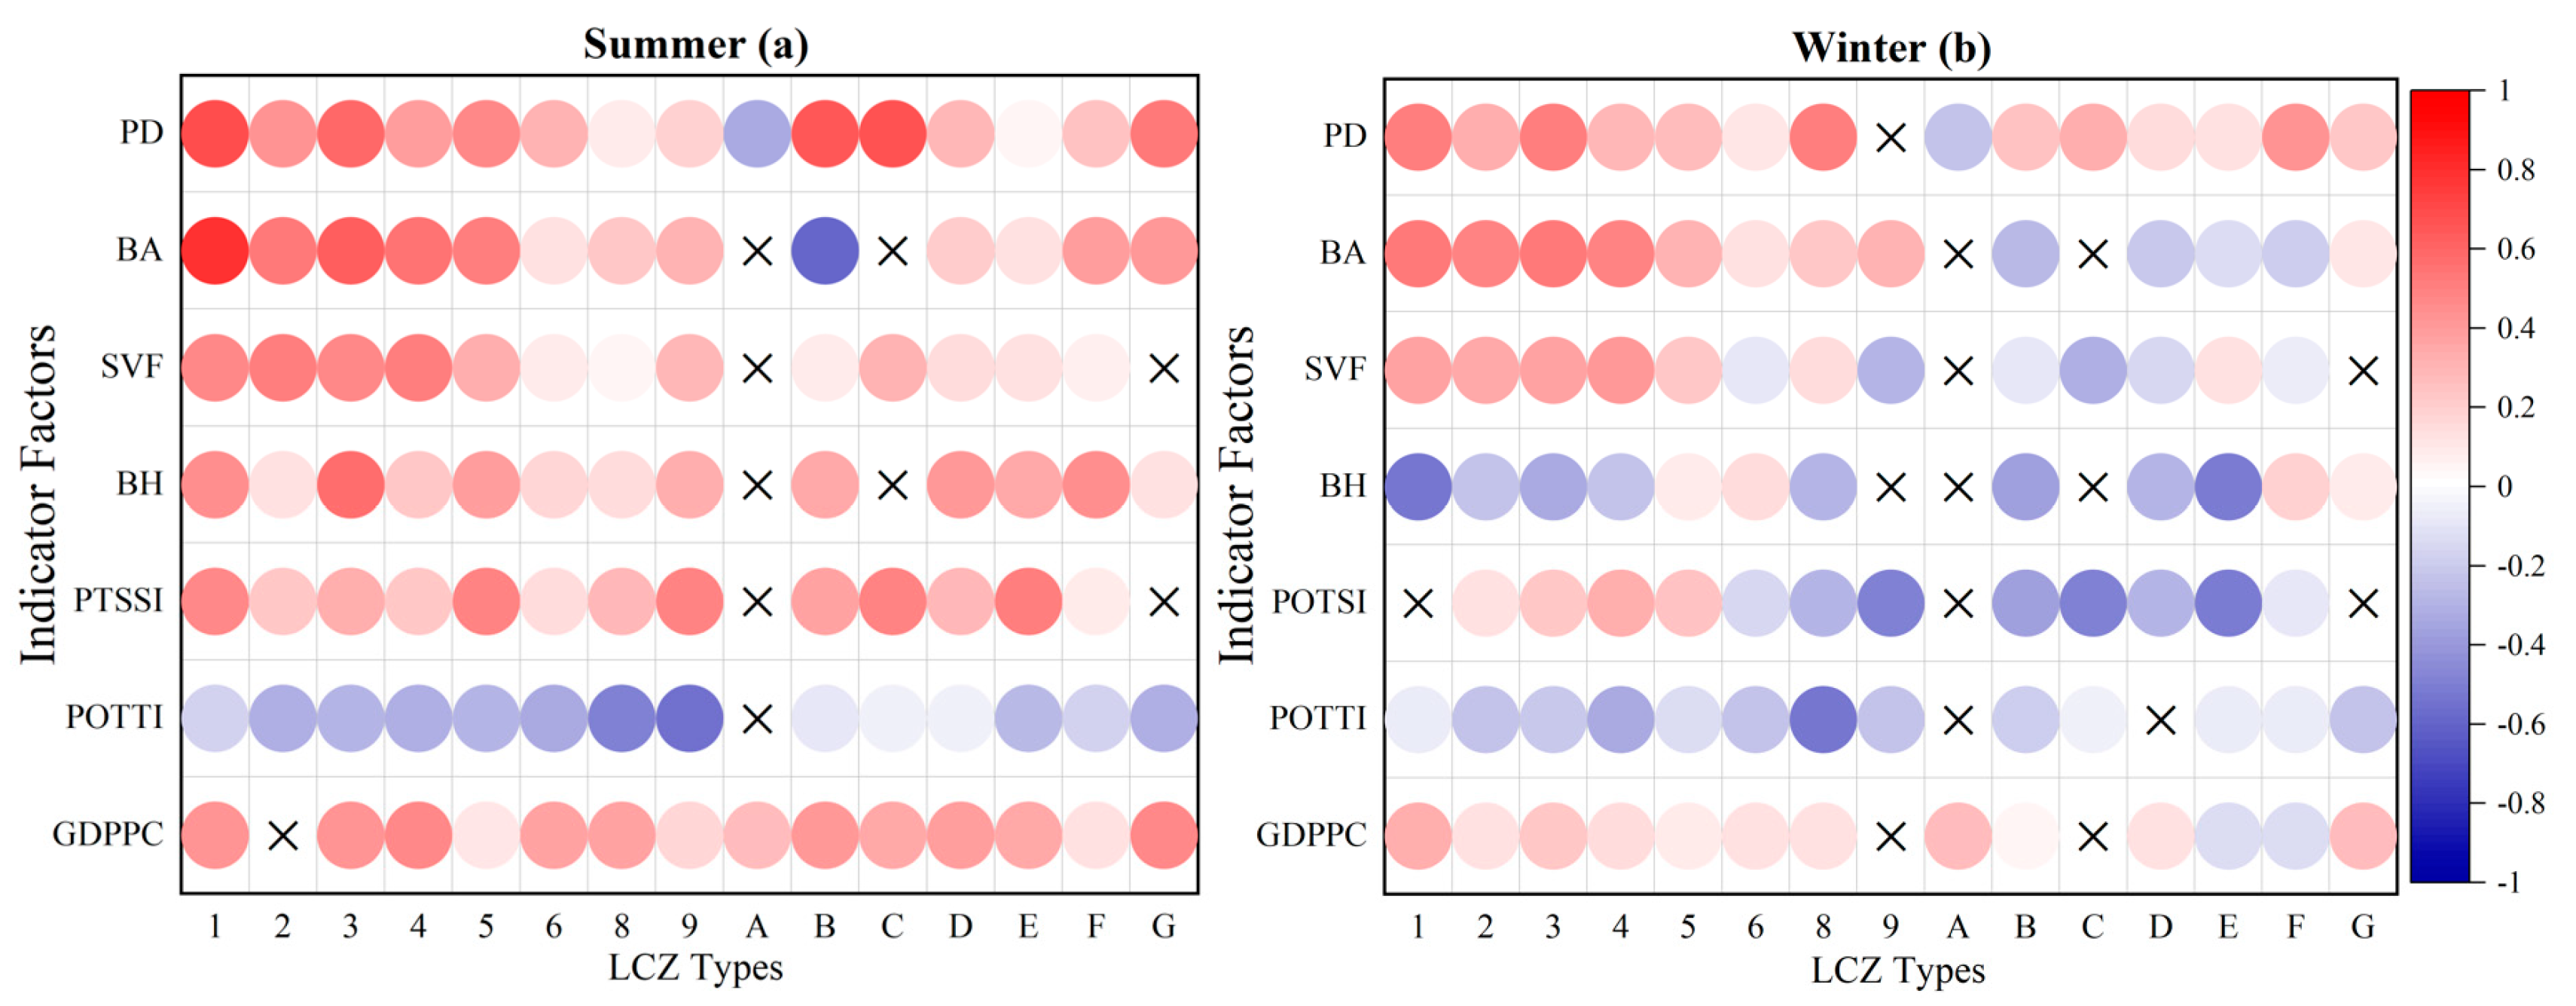
Based on LCZ type analysis: The relationship between the SUHI effect and urban characteristic variables showed significant seasonality and spatial heterogeneity. Positive correlations between population density (x1), built-up areas (x2), sky view factor (x3), and GDP per capita (x7) with the SUHI effect were particularly pronounced in both the summer and winter, especially in built-up LCZs. Conversely, the proportion of the tertiary industry (x6) exhibited an inhibitory effect on the SUHI effect in both the summer and winter. Building height (x4) and the secondary industry proportion (x5) intensified the SUHI effect in the summer, with dynamic changes observed during the winter.
This study proposes urban development indicators and their correlation with SUHI in both the winter and summer. Future research will further explore the practical applications of these findings. Potential applications include developing strategies to mitigate urban heat by integrating urban spatial characteristics or linking urban development with LCZ classification to predict thermal comfort in spatial planning, contributing to sustainable low-carbon urban development. However, this study had limitations, as it focused on a single city without considering varying urban climate conditions, which may lead to different results. Future research could involve comparative studies across regions with diverse climatic conditions to enhance the understanding of climate impacts on SUHI.

Author Contributions

Conceptualization, J.W.; formal analysis, J.W.; writing—original draft, J.W.; project administration, J.W.; investigation, J.W.; writing—review and editing, L.S.; visualization, L.S.; software, L.S.; methodology, L.S.; data curation, L.S.; validation, T.L.; supervision, T.L.; resources, T.L.; funding acquisition. T.L. All authors have read and agreed to the published version of the manuscript.

Funding

This research was funded by Henan Province Key Research and Promotion Project (Science and Technology Tackle; grant number 242102320060).

Data Availability Statement

The data presented in this study are available upon request from the corresponding author due to privacy.

Conflicts of Interest

The authors declare no conflicts of interest.

References

  1. Rahman, M.N.; Rony, M.R.H.; Jannat, F.A.; Chandra Pal, S.; Islam, M.S.; Alam, E.; Islam, A.R.M.T. Impact of Urbanization on Urban Heat Island Intensity in Major Districts of Bangladesh Using Remote Sensing and Geo-Spatial Tools. Climate 2022, 10, 3. [Google Scholar] [CrossRef]
  2. Ren, Y.; Raffaele, L.; Vincenzo, G.; Giovanni, S.; Zhang, X.; Chengyang, X. The unrelenting global expansion of the urban heat island over the last century. Sci. Total Environ. 2023, 880, 163276. [Google Scholar] [CrossRef] [PubMed]
  3. Susca, T.; Pomponi, F. Heat island effects in urban life cycle assessment: Novel insights to include the effects of the urban heat island and UHI-mitigation measures in LCA for effective policy making. J. Ind. Ecol. 2020, 24, 410–423. [Google Scholar] [CrossRef]
  4. Zhao, S.; Zhou, D.; Liu, S. Data concurrency is required for estimating urban heat island intensity. Environ. Pollut. 2016, 208 Pt A, 118–124. [Google Scholar] [CrossRef]
  5. Yao, Y.; Chen, X.; Qian, J. Research progress on the thermal environment of the urban surfaces. Acta Ecol. Sin. 2018, 38, 1134–1147. [Google Scholar] [CrossRef]
  6. Meng, Q.; Zhang, L.; Sun, Z.; Meng, F.; Wang, L.; Sun, Y. Characterizing spatial and temporal trends of surface urban heat island effect in an urban main built-up areas: A 12-year case study in Beijing, China. Remote Sens. Environ. 2018, 204, 826–837. [Google Scholar] [CrossRef]
  7. Yang, J.; Ren, J.; Sun, D.; Xiao, X.; Xia, J.; Jin, C.; Li, X. Understanding land surface temperature impact factors based on local climate zones. Sustain. Cities Soc. 2021, 69, 826–837. [Google Scholar] [CrossRef]
  8. Zhu, R.; Zhao, N.; Wang, Q.; Meng, C.; Liu, M.; Li, G. Research on the influence of urban heat island (UHI) intensity on energy consumption for heating and cooling of existing residential buildings in different climate zones. South Archit. 2020, 5, 16–20. [Google Scholar] [CrossRef]
  9. He, B.-J.; Wei, W.; Ayyoob, S.; Liu, X. Progress, knowledge gap and future directions of urban heat mitigation and adaptation research through a bibliometric review of history and evolution. Energy Build. 2023, 287, 112976. [Google Scholar] [CrossRef]
  10. Han, S.; Tang, Q.; Xu, D.; Yang, Z. Impacts of urbanization and agricultural development on observed changes in surface air temperature over mainland China from 1961 to 2005. Theor. Appl. Climatol. 2019, 135, 1595–1607. [Google Scholar] [CrossRef]
  11. Lin, D.; Xie, Y.; Ou, L.; Cao, D. Study on urban heat island effect in Loudi city, Hunan Province. Build. Sci. 2020, 36, 84–88. [Google Scholar] [CrossRef]
  12. Yang, Z.; Chen, Y.; Qian, Q.; Wu, Z.; Zheng, Z.; Huang, Q. The coupling relationship between construction land expansion and high-temperature areas expansion in China’s three major urban agglomerations. Int. J. Remote Sens. 2019, 40, 6680–6699. [Google Scholar] [CrossRef]
  13. Qiu, G.; Zhang, X. China’s urbanization and its ecological environment challenges in the 21st century. Adv. Earth Sci. 2019, 34, 640–649. [Google Scholar] [CrossRef]
  14. Pan, Y.; Cui, L.; Liu, C.; Chen, L.; Zhang, L. Spatio-temporal analysis of urban heat island effect in Chongqing based on MODIS data. Chin. J. Ecol. 2018, 37, 3736–3745. [Google Scholar] [CrossRef]
  15. Han, X.; Yu, J.; Shi, L.; Zhao, X.; Wang, J. Spatiotemporal evolution of ecosystem service values in an areas dominated by vegetation restoration: Quantification and mechanisms. Ecol. Ind. 2021, 131, 108191. [Google Scholar] [CrossRef]
  16. Peng, J.; Cheng, X.; Hu, Y.; Corcoran, J. A landscape connectivity approach to mitigating the urban heat island effect. Landsc. Ecol. 2022, 37, 1707–1719. [Google Scholar] [CrossRef]
  17. Liu, Y.; Mu, K.; Han, B.; Zhang, M.; Bao, J.; Yang, Y. Surface urban heat island effect of local climate zone. J. Harbin Inst. Technol. 2021, 53, 192–200. [Google Scholar] [CrossRef]
  18. Liu, T.; Qi, Y.; Cao, G.; Liu, H. Spatial patterns, driving forces, and urbanization effects of China’s internal migration: County-level analysis based on the 2000 and 2010 censuse. J. Geogr. Sci. 2015, 25, 236–256. [Google Scholar] [CrossRef]
  19. Yang, X.; Yao, L.; Jin, T.; Jiang, Z.; Peng, L.; Ye, Y. Temporal and spatial variations of local temperatures in the summer of Nanjing. J. Civ. Environ. Eng. 2019, 41, 160–167. [Google Scholar] [CrossRef]
  20. Moffett, B.K.; Makido, Y.; Shandas, V. Urban-Rural Surface Temperature Deviation and Intra-Urban Variations Contained by an Urban Growth Boundary. Remote Sens. 2019, 11, 2683. [Google Scholar] [CrossRef]
  21. Yang, X.; Yao, L.; Jin, T.; Peng, L.L.; Jiang, Z.; Hu, Z.; Ye, Y. Assessing the thermal behavior of different local climate zones in the Nanjing metropolis, China. Build. Environ. 2018, 137, 171–184. [Google Scholar] [CrossRef]
  22. Bai, Y.; Wang, K.; Ren, Y.; Li, M.; Ji, R.; Wu, X.; Yan, H.; Lin, T.; Zhang, G.; Zhou, X.; et al. 3D compact form as the key role in the cooling effect of greenspace landscape pattern. Ecol. Indic. 2024, 160, 111776. [Google Scholar] [CrossRef]
  23. Stewart, I.D.; Oke, T.R. Local Climate Zones for Urban Temperature Studies. Bull. Am. Meteorol. Soc. 2012, 93, 1879–1900. [Google Scholar] [CrossRef]
  24. Geletič, J.; Lehnert, M. GIS-based delineation of local climate zones: The case of medium-sized Central European cities. Morav. Geogr. Rep. 2016, 24, 2–12. [Google Scholar] [CrossRef]
  25. Liu, H.; He, B.; Gao, S.; Zhan, Q.; Yang, C. Influence of non-urban reference delineation on trend estimate of surface urban heat island intensity: A comparison of seven methods. Remote Sens. Environ. 2023, 296, 113735. [Google Scholar] [CrossRef]
  26. Hidalgo, J.; Dumas, G.; Masson, V.; Petit, G.; Bechtel, B.; Bocher, E.; Foley, M.; Schoetter, R.; Mills, G. Comparison between local climate zones maps derived from administrative datasets and satellite observations. Urban Clim. 2019, 27, 64–89. [Google Scholar] [CrossRef]
  27. Wang, X.; Yang, J.; Yu, W.; Yu, H.; Xiao, X.; Xia, J. Spatial effect of urban morphology on land surface temperature from the perspective of local climate zone. Remote Sens. Appl. Soc. Environ. 2024, 36, 101324. [Google Scholar] [CrossRef]
  28. Zhang, L.; Nikolopoulou, M.; Guo, S.; Song, D. Impact of LCZs spatial pattern on urban heat island: A case study in Wuhan, China. Build. Environ. 2022, 226, 109785. [Google Scholar] [CrossRef]
  29. Kotharkar, R.; Bagade, A. Evaluating urban heat island in the critical local climate zones of an Indian city. Landsc. Urban Plan. 2018, 169, 92–104. [Google Scholar] [CrossRef]
  30. Zhao, Z.; Sharifi, A.; Dong, X.; Shen, L.; He, B.J. Spatial Variability and Temporal Heterogeneity of Surface Urban Heat Island Patterns and the Suitability of Local Climate Zones for Land Surface Temperature Characterization. Remote Sens. 2021, 13, 4338. [Google Scholar] [CrossRef]
  31. Dimitris, P.; Dimitris, F.; Thomas, B.; Constantinos, N.K. Impact of urban heat island development on buildings’ energy consumption. Fresenius Environ. Bull. 2013, 22, 2087–2092. [Google Scholar]
  32. Quan, S.J.; Bansal, P. A systematic review of GIS-based local climate zone mapping studies. Build. Environ. 2021, 196, 107791. [Google Scholar] [CrossRef]
  33. Demuzere, M.; Kittner, J.; Bechtel, B. LCZ Generator: A web application to create Local Climate Zone maps. Front. Environ. Sci. 2021, 9, 637455. [Google Scholar] [CrossRef]
  34. Bechtel, B.; Alexander, P.J.; Böhner, J.; Ching, J.; Conrad, O.; Feddema, J.; Mills, G.; See, L.; Stewart, I. Mapping local climate zones for a worldwide database of the form and function of cities. ISPRS Int. J. Geo-Inf. 2015, 4, 199–219. [Google Scholar] [CrossRef]
  35. Zheng, B.; Chen, Y.; Hu, Y. Analysis of land cover and SUHII pattern using local climate zone framework—A case study of Chang-Zhu-Tan main urban area. Urban Clim. 2022, 43, 101153. [Google Scholar] [CrossRef]
  36. Lin, J.; Qiu, S.; Tan, X.; Zhuang, Y. Measuring the relationship between morphological spatial pattern of green space and urban heat island using machine learning methods. Build. Environ. 2023, 228, 109910. [Google Scholar] [CrossRef]
  37. Guo, G.; Zhou, X.; Wu, Z.; Xiao, R.; Chen, Y. Characterizing the impact of urban morphology heterogeneity on land surface temperature in Guangzhou, China. Environ. Model. Softw. 2016, 84, 427–439. [Google Scholar] [CrossRef]
  38. Dai, Z.; Guldmann, J.M.; Hu, Y. Thermal impacts of greenery, water, and impervious structures in Beijing’s Olympic areas: A spatial regression approach. Ecol. Indic. 2019, 97, 77–88. [Google Scholar] [CrossRef]
  39. Wang, G.; Zhang, Q.; Xiao, R.; Guan, D. On impacts of land use, population density and altitude on the urban heat island. J. Yunnan Univ. Nat. Sci. 2019, 41, 82–90. [Google Scholar] [CrossRef]
  40. Chang, Y.; Xiao, J.; Li, X.; Zhou, D.; Wu, Y. Combining GOES-R and ECOSTRESS land surface temperature data to investigate diurnal variations of surface urban heat island. Sci. Total Environ. 2022, 823, 153652. [Google Scholar] [CrossRef]
  41. Cai, M.; Ren, C.; Xu, Y.; Lau, K.; Wang, R. Investigating the relationship between local climate zone and land surface temperature using an improved WUDAPT methodology—A case study of Yangtze River Delta, China. Urban Clim. 2018, 24, 485–502. [Google Scholar] [CrossRef]
  42. Wang, R.; Cai, M.; Ren, C.; Bechtel, B.; Xu, Y. Detecting multi-temporal land cover change and land surface temperature in Pearl River Delta by adopting local climate zone. Urban Clim. 2019, 28, 100455. [Google Scholar] [CrossRef]
  43. Zheng, Y.; Ren, C.; Shi, Y.; Yim, S.H.; Lai, D.Y.; Xu, Y.; Fang, C.; Li, W. Mapping the spatial distribution of nocturnal urban heat island based on Local Climate Zone framework. Build. Environ. 2023, 234, 110197. [Google Scholar] [CrossRef]
  44. Mo, N.; Han, J.; Yin, Y.; Zhang, Y. Seasonal analysis of land surface temperature using local climate zones in peak forest basin topography: A case study of Guilin. Build. Environ. 2024, 247, 111042. [Google Scholar] [CrossRef]
  45. Zhou, M.; Wang, R.; Guo, Y. How urban spatial characteristics impact surface urban heat island in subtropical high-density cities based on LCZs: A case study of Macau. Sustain. Cities Soc. 2024, 112, 105587. [Google Scholar] [CrossRef]
  46. Wu, W.B.; Ma, J.; Banzhaf, E.; Meadows, M.E.; Yu, Z.-W.; Guo, F.-X.; Sengupta, D.; Cai, X.-X.; Zhao, B. A first Chinese building height estimate at 10 m resolution (CNBH-10 m) using multi-source earth observations and machine learning. Remote Sens. Environ. 2023, 291, 113578. [Google Scholar] [CrossRef]
  47. Lu, L.; Weng, Q.; Xiao, D.; Guo, H.; Li, Q.; Hui, H. Spatiotemporal variation of surface urban heat island in relation to land cover composition and configuration: A multi-scale case study of Xi’an, China. Remote Sens. 2020, 12, 2713. [Google Scholar] [CrossRef]
  48. Wang, Y.; Shen, Z. Comparing Luojia 1-01 and VIIRS nighttime light data in detecting urban spatial structure using a threshold-based kernel density estimation. Remote Sens. 2021, 13, 1574. [Google Scholar] [CrossRef]
  49. Wang, H.; Hu, Z.; Li, F.; Zhou, Y. Research on the Spatial-Temporal Process of Urbanization in Chengdu-Chongqing Region based on Nighttime Light from 2000 to 2018. Remote Sens. Technol. Appl. 2022, 37, 897–907. [Google Scholar]
  50. Yan, Y.; Lei, H.; Chen, Y.; Zhou, B. Analyzing the Dynamic Spatiotemporal Changes in Urban Extension across Zhejiang Province Using NPP-VIIRS Nighttime Light Data. Remote Sens. 2022, 14, 3212. [Google Scholar] [CrossRef]
  51. Qiao, Z.; Huang, N.; Xu, X.; Sun, Z.; Wu, C.; Yang, J. Spatio-temporal pattern and evolution of the urban thermal landscape in metropolitan Beijing between 2003 and 2017. Acta Geogr. Sin. 2019, 74, 475–489. [Google Scholar] [CrossRef]
  52. Kim, S.W.; Brown, R.D. Urban heat island (UHI) intensity and magnitude estimations: A systematic literature review. Sci. Total Environ. 2021, 779, 146389. [Google Scholar] [CrossRef]
  53. Lu, Y.; He, T.; Xu, X.; Qiao, Z. Investigation the robustness of standard classification methods for defining urban heat island. IEEE J. Sel. Top. Appl. Earth Obs. Remote Sens. 2021, 14, 11386–11394. [Google Scholar] [CrossRef]
  54. Wang, J.; Xu, C. Geodetector: Principle and prospective. Acta Geogr. Sin. 2017, 72, 116–134. [Google Scholar] [CrossRef]
  55. Bechtel, B.; Alexander, P.J.; Beck, C.; Böhner, J.; Brousse, O.; Ching, J.; Demuzere, M.; Fonte, C.; Gál, T.; Hidalgo, J.; et al. Generating WUDAPT level 0 data—Current status of production and evaluation. Urban Clim. 2019, 27, 24–45. [Google Scholar] [CrossRef]
  56. Zhao, Z. The analyse on urban heat-island effect factors and the countermeasures on the issue. Environ. Monit. China 2008, 24, 77–79. [Google Scholar] [CrossRef]
  57. Taripanah, F.; Ranjbar, A. Quantitative analysis of spatial distribution of land surface temperature (LST) in relation Ecohydrological, terrain and socio-economic factors based on Landsat data in mountainous areas. Adv. Space Res. 2021, 68, 3622–3640. [Google Scholar] [CrossRef]
  58. Shen, Z.; Zeng, J. Spatial relationship of heat island intensity to correlated land surface factors in Xiamen City. Sci. Geogr. Sin. 2020, 40, 842–852. [Google Scholar] [CrossRef]
Figure 1. The geographical distribution of the study areas.
Remotesensing 17 01678 g001
Figure 2. General research workflow.
Remotesensing 17 01678 g002
Figure 3. Changes in (a) built-up areas and (b) building height of Xiamen City from 2003 to 2020.
Remotesensing 17 01678 g003
Figure 4. The migration path of Xiamen’s center of gravity of (a) built-up area, (b) the secondary industry, (c) the tertiary industry, and (d) GPD from 2003 to 2020.
Remotesensing 17 01678 g004
Figure 5. Grade distribution map of the (a) summer and (b) winter SUHII in Xiamen City from 2003 to 2020.
Remotesensing 17 01678 g005
Figure 6. Contributions of factor interactions with SUHII in (a) summer and (b) winter.
Remotesensing 17 01678 g006
Figure 7. LCZ maps of the main districts of Xiamen City in (a) 2010 and (b) 2020.
Remotesensing 17 01678 g007
Figure 8. Seasonal SUHII in built-up (a) and (b) natural LCZ types.
Remotesensing 17 01678 g008
Figure 9. Proportion of SUHII grades in built-up and natural LCZ types in (a) summer and (b) winter. The first to fourth columns on each level represent the 2010 built-up LCZ types, 2010 natural LCZ types, 2020 built-up LCZ types, and 2020 natural LCZ types, respectively.
Remotesensing 17 01678 g009
Figure 10. Proportion of seasonal heat island areas in the (a) built-up and (b) natural LCZ types.
Remotesensing 17 01678 g010
Figure 11. Pearson correlation analysis and significance levels between LCZ-based factors and SUHII in (a) summer and (b) winter. Note: Red/blue hues denote positive/negative correlations, respectively, with color saturation reflecting correlation strength (darker shades = stronger associations). Circle: p < 0.05; ×: p > 0.05).
Remotesensing 17 01678 g011
Table 1. List of datasets used in this study.
DateTimeSpatial ResolutionSource
Landsat-5 TM
Landsat-7 ETM+
Landsat-8 OLI-TIRS
18 September 200330 mUGSS
13 July 2005
4 August 2010
2 August 2015
23 August 2020
15 December 2003
26 November 2005
4 February 2011
25 January 2016
29 December 2020
Building height202010 mCNBH-10 m
Building outlines2020-Amap
Nighttime light image2003–2020500 mNOAA
Population density2003–2020100 mWorldPop
Table 2. Classification of SUHI.
Level of SUHINormalized Temperature Value
Level 1: Non-SUHI areas0.00–0.20
Level 2: Underheated SUHI areas0.20–0.40
Level 3: Normal areas0.40–0.60
Level 4: SUHI areas0.60–0.80
Level 5: Strong SUHI areas0.80–1.00
Table 3. Selected driving factors.
VariableAbbreviationSymbol
Proportion of SUHI effect areasy
Population densityPDx1
Built-up areasBAx2
Sky view factorSVFx3
Building heightBHx4
Proportion of the secondary industryPOTSIx5
Proportion of the tertiary industryPOTTIx6
GDP per capitaGDPPCx7
Table 4. LCZ classification criteria (originating from Stewart and Oke’s definition [23]).
CategoryCharacteristicsCategoryCharacteristics
LCZ 1
Compact high-rise
Compact buildings of 10 stories or more, paved surfaces,
limited greenspaces and trees.
LCZ A
Dense trees
Dense evergreen or deciduous tree forests; permeable surfaces primarily composed of low vegetation.
LCZ 2
Compact mid-rise
Compact buildings of 3 to 9 stories,
paved surfaces,
limited greenspaces and trees.
LCZ B
Scattered trees
Sparse evergreen or deciduous tree forests; permeable surfaces primarily composed of low vegetation.
LCZ 3
Compact low-rise
Compact buildings of 1 to 3 stories,
paved surfaces,
Limited greenspaces and trees.
LCZ C
Bush scrub
Shrubs or very few trees;
permeable surfaces primarily composed of bare soil or sand.
LCZ 4
Open high-rise
Low-density, relatively open buildings of 10 stories or more,
abundant trees and greenspaces.
LCZ D
Low plants
Low vegetation or herbaceous plants; very few trees or no trees.
LCZ 5
Open mid-rise
Low-density, relatively open buildings of 3 to 9 stories, abundant trees and greenspaces.LCZ E
Bare rock or paved
Rock or paved surfaces;
very few trees or no trees.
LCZ 6
Open low-rise
Low-density, relatively open buildings of 1 to 3 stories, abundant trees and greenspaces.LCZ F
Bare soil or sand
Soil or sandy areas;
very few trees or no trees.
LCZ 8
Large low-rise
Large and open buildings of 1 to 3 stories, paved surfaces,
minimal greenspaces and trees.
LCZ G
Water
Large waterbodies such as rivers, lakes, and seas; small waterbodies
such as ponds and reservoirs.
LCZ 9
Sparsely built
Sparse medium-to-small buildings in a natural environment, abundant trees and greenspaces.
Table 5. Statistics of built-up areas in Xiamen City from 2003 to 2020.
Time20032005201020152020
Expansion Characteristic
Built-up areas (km2)108.52135.21241.64332.14413.99
Growth areas (km2)26.69106.4390.5081.85
Growth rate (km2/a)13.3421.2918.1016.37
Growth intensity (%)12.3015.747.494.99
Table 6. Transfer parameters of various features in Xiamen City from 2003 to 2020.
Time20032005201020152020
Standard Ellipse Deviation
Center of gravity offset distance (km)0.903.143.214.89
Built-up areasRotation angle (°)99.07100.15117.94123.8548.77
Areas (km2)110.87121.91220.60371.31597.03
The secondaryCenter of gravity offset distance (km)1.201.012.691.22
industryRotation angle (°)34.6057.6053.1842.0443.10
Areas (km2)612.34556.74528.15441.16595.84
The tertiaryCenter of gravity offset distance (km)0.462.513.051.09
industryRotation angle (°)3.52178.55175.176.926.61
Areas (km2)494.13482.97388.83500.57516.68
Center of gravity offset distance (km)0.550.201.280.54
GDPRotation angle (°)10.51167.3916.6511.03167.39
Areas (km2)631.37564.72661.46682.83564.72
Table 7. Change in areas of the surface heat island effect in Xiamen city from 2003 to 2020.
TimeGraded Areas of SUHI Effect/km2Areas of SUHI/km2
Level 1Level 2Level 3Level 4Level 5
Summer2003326.37150.05191.9497.32171.60266.24
2005319.74145.46204.0587.54180.50268.04
2010302.92151.21184.93108.85219.38328.23
2015283.30108.81172.03176.85196.30373.15
2020258.89111.69127.01210.66229.87440.53
Winter2003528.15149.84135.2367.8756.21124.08
2005506.75131.36163.0073.8562.33136.18
2010452.99167.16149.1684.5485.45167.99
2015405.07148.79173.91116.23103.29209.52
2020396.57119.94193.62114.42112.74227.16
Table 8. LCZ transfer matrix of the study areas from 2010 to 2020 (km2).
202012345689ABCDEFGTotal (2010)Change (2010)
2010
111.320.830.621.030.280.180.430.150000.081.360.52017.184.83
22.3128.450.530.360.410.550.290.860000.362.670.08036.878.42
31.811.6421.860.970.110.240.310.670.060.1100.230.310.11028.436.57
43.841.442.3710.450.580.050.350.580.03001.761.581.65024.6814.23
52.462.120.540.9611.791.710.270.183.520.050.390.620.720.29025.6213.83
61.296.6713.537.232.4241.222.771.3400.360.680.412.371.57081.8640.64
81.121.521.642.143.782.0924.550.15000.570.210.510.34038.6214.07
90.323.525.626.324.680.270.629.120.330.470.240.130.720.16032.5223.40
A02.168.431.828.290.490.451.42115.563.740.484.523.520.020150.9035.34
B2.231.553.565.131.753.643.380.583.6153.150.123.435.292.56089.9836.83
C0.711.810.130.170.080.031.780.2000.1112.420.472.063.560.5224.0511.63
D3.5600.6310.793.061.230.5603.404.120.8134.477.9717.580.31188.4854.01
E0.0902.871.731.491.843.110.4600.0201.6221.302.110.2336.8715.57
F0.120.030.090.140.960.338.930.220.331.610.013.181.939.891.2929.0619.17
G0000.180000000.530.351.434.55125.12132.167.04
Total31.1851.7462.4249.839.6853.8747.815.93126.8463.7416.24151.8453.7444.99127.47937.28
(2020)
Change18.8323.2940.5639.3527.8912.6523.256.8111.2810.593.8217.3732.4435.102.35
(2020)
Increase14.0014.8733.9925.1214.06−27.999.18−16.59−24.06−26.24−33.01−36.6416.8715.93−4.69
Disclaimer/Publisher’s Note: The statements, opinions and data contained in all publications are solely those of the individual author(s) and contributor(s) and not of MDPI and/or the editor(s). MDPI and/or the editor(s) disclaim responsibility for any injury to people or property resulting from any ideas, methods, instructions or products referred to in the content.

