Abstract
This study applied high-resolution satellite data to address the siting and evaluation challenges for potential cage aquaculture areas of large yellow croaker in Zhejiang Province. A typical template of water environmental factors for large yellow croaker cage aquaculture was developed, incorporating various environmental parameters and considerations that were not fully addressed in previous studies. This paper established the Site Selection Method for Large Yellow Croaker potential aquaculture (SSM-LYC) based on the template. Site selection and grading evaluation of potential cage aquaculture areas were performed using SSM-LYC. The findings include the following: (1) Potential aquaculture sites for large yellow croaker include 11 areas with water depths of 15–60 m along the coast of Zhejiang Province from 27° to 31° north latitude, of which 7 are in water depths of less than 40 m, and 4 are in water depths of 40–60 m. (2) Assessment and scoring for potential aquaculture sites were performed, pinpointing 4 central locations of first-level aquaculture areas offering scientific evidence for the feasibility of deep-sea aquaculture of large yellow croaker along the Zhejiang coast. (3) The conclusions drawn from this research provide significant guidance for future aquaculture strategies and regional planning. Moreover, SSM-LYC can be applied to other coastal waters in the world.
1. Introduction
Large yellow croaker (Larimichthys crocea) belongs to Perciformes, Sciaenidae family, Larimichthys genus. It is an important economic fish unique to offshore China, mainly distributed in the south of the Yellow Sea and the East China Sea [1]. Daiqu large yellow croaker refers to the Lusi Ocean, Daiqu Ocean, and Maotou Ocean spawning groups mainly along the coast of Zhejiang Province; it is one of the four major economic fish in the Zhoushan fishery. Fishing grounds off the coast of Zhejiang Province in the 1950s to 1970s, after high-intensity fishing in the fishing grounds off the coast of Zhejiang Province, large yellow croaker resources declined sharply, and the annual output dropped nearly 99.2% [2]. Since the 1990s, measures began to be taken to prevent the depletion of large yellow croaker resources. These measures included closing the port and suspending fishing, establishing large yellow croaker juvenile conservation areas [2], and developing large yellow croaker artificial culture technology, breeding, and releasing. The efforts alleviated the deteriorating momentum of large yellow croaker resources [3].
The most direct methods to improve the quantity of large yellow croakers are aquaculture and release to restore large yellow croaker resources [4]. Cage culture techniques for large yellow croakers date back to the 1980s [5]. After decades of development, the technology of large yellow croaker cage culture tends to be mature, and the yield and quality are constantly improving.
Many studies have been performed to explore suitable habitats or aquaculture areas for economic fish [6,7,8,9]. Fernandez Tejedor Margarita et al. [10] used Sentinel-2 satellite data to propose a new inversion model of Chlorophyll-a (Chl-a), which could more accurately estimate the distribution of Chl-a in offshore areas (northwestern Mediterranean), thus providing help for the location of shellfish culture areas. Claude E. Boyd et al. [8] analyzed the elements of North American catfish and seawater environment through element analysis to find suitable breeding locations for catfish. Furthermore, scholars [11] also pointed out that the influence of environmental factors on the physiology and biochemistry of large yellow croakers should be determined. Meanwhile, a series of horizontal experiments on temperature, salinity, and biological factors were conducted in artificial large yellow croaker areas, and environmental conditions suitable for the growth and survival of large yellow croaker were obtained. Environmental DNA (Deoxyribonucleic Acid) [12] was applied to study the distribution and abundance of large yellow croaker in the East China Sea and established a prediction model of the large yellow croaker fish situation based on relevant environmental parameters. However, there is a lack of research focusing on environmental factor templates based on existing aquaculture areas and multi-source high-resolution data to evaluate potential aquaculture sites.
This research constructs an environmental factor template for the large yellow croaker aquaculture area, considering the intricate environmental factors present in such areas. The specific factors included in the template are Sea Surface Temperature (SST), Chlorophyll-a (Chl-a), Nutrients, Suspended Sediment Concentration (SSC), Current, Wind, Disaster Frequency, Average Depth of Aquaculture, Salinity, Upwelling, River plume, Market Proximity, and Marine Traffic. Subsequently, the study develops a method for the graded evaluation of potential aquaculture sites for large yellow croakers. Utilizing this methodology, a site selection plan and a grading system are implemented to identify and prioritize prospective aquaculture zones for large yellow croakers along the Zhejiang coast of China. From the perspective of marine remote sensing, this study intends to summarize the known environmental characteristics of the propagation and aquaculture areas of large yellow croakers through high-resolution marine satellite data, find the potential cage aquaculture areas of large yellow croakers, and construct an evaluation system of large yellow croaker aquaculture areas.
The data and methods are presented in the second part of this study, the results are in the third part, and the discussion and conclusion are, respectively, in the fourth and fifth parts (Figure 1).
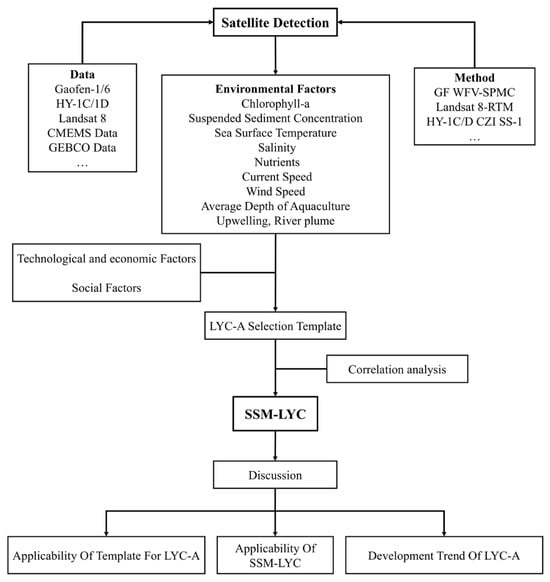
Figure 1.
Framework of the Study. This diagram illustrates the overall structure and organization of the manuscript. It outlines the key sections of the paper, including Introduction, Data and Methods, Results, Discussion, and Conclusion. The arrows indicate the logical flow and interconnection between the sections. The abbreviations in the figure are as follows: CMEMS (Copernicus Marine Environment Monitoring Service), GEBCO (General Bathymetric Chart of the Oceans), SPMC (Suspended Particulate Matter Concentration), RTM (Radiative Transfer Model), LYC-A (Large Yellow Croaker Aquaculture Area), and SSM-LYC (Site Selection Method for Large Yellow Croaker).
2. Data and Methods
2.1. Study Area
Zhejiang Province, located on the southeast coast of China, is famous for its rich Marine resources and developed aquaculture industry [13]. This study focuses on the cage aquaculture area of the large yellow croaker along the coast of Zhejiang Province, which is characterized by a unique marine environment (numerous bays, zigzag coastlines and complex continental shelves, rich marine resources, diverse water types, and wide sea area) (Figure 2a) and climatic conditions (located in the transitional zone between subtropical and temperate zones, with obvious seasonal alternations and mild and humid climate). It is an ideal place for aquaculture. In addition, Zhejiang Province has a long tradition of marine fisheries and rich experience and technology in aquaculture, which also helps develop marine aquaculture in Zhejiang Province [14].
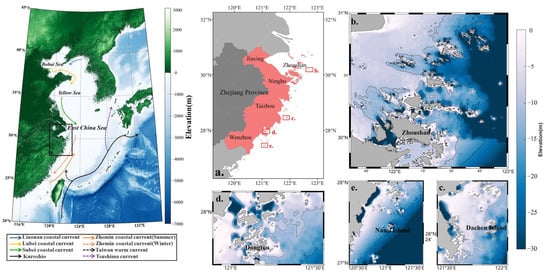
Figure 2.
Topographic map of the study area. (a) Coastal map of Zhejiang Province. The red boxes in (a) are typical large yellow croaker cage aquaculture areas. (b–e) represent the locations of Zhoushan City in Zhejiang Province, Da Chen Island in Taizhou City, Dongtou District in Wenzhou City, and Nanji Island in Wenzhou City, respectively.
The economy of Zhejiang Province is developing rapidly, and the aquaculture industry plays an important role in the local economy. As a fish with high economic value, the large yellow croaker cage aquaculture area, an important aquaculture base in the province [15], not only plays a significant role in promoting local economic development but also plays a non-negligible role in promoting biodiversity protection and maintaining ecological balance [16]. As a kind of seafood with high economic value, the development of the large yellow croaker aquaculture industry has led to the prosperity of related industrial chains, created a lot of employment opportunities for local communities, and increased the income level of fishermen. In addition, through scientific aquaculture management and technological innovation, the aquaculture industry in the region also helps to reduce dependence on wild fishery resources and promote the sustainable use of fishery resources, which is of great significance for the protection of marine ecosystems and the realization of the sustainable development of fisheries.
2.2. Satellite Data
Since the propagation and aquaculture area of the large yellow croaker is small, it is very important to use satellite sensors with high resolution.
2.2.1. HY-1C/HY-1D
HY-1C satellite was launched in 2018, and HY-1D satellite was launched in 2020 [17]. Both satellites are equipped with a Chinese Ocean Color and Temperature Scanner (COCTS), Coastal Zone Imager (CZI), Ultraviolet Imager (UVI), Satellite Calibration Spectrometer (SCS), and Automatic Identification System (AIS). In this study, the efficiency of CZI in the inversion of marine chlorophyll-a concentration is discussed. In addition, the CZI sensor has a width of 1000 km, a resolution of 50 m, and an imaging observation frequency of three days at a time (Table 1), which is mainly used for watercolor monitoring of coastal water bodies [18,19,20].

Table 1.
HY-1C/D CZI satellite payload parameters.
2.2.2. Gaofen (GF) Series Satellite
GF-1 satellite, launched in 2013, is China’s first high-resolution Earth observation satellite. The panchromatic resolution of the satellite is 2 m, and the multispectral resolution is 8 m [21,22]. GF-1 is equipped with a high-resolution multispectral camera, which has the strongest performance among China’s Earth observation satellites in operation. The wide-width multispectral camera of the GF-1 satellite has a width of 800 km. The repetition period of similar satellites in the world is mostly ten days, while GF-1 only takes four days. Therefore, it can be said that GF-1 achieves the perfect combination of high temporal and spatial resolution [7].
The GF-6 satellite was successfully launched by the Jiuquan Satellite Launch Center in China in 2018. Notably, GF-6 incorporates a “red edge” band, a spectral band highly sensitive to the developmental status of green vegetation [23]. This satellite is primarily dedicated to catering to agricultural and rural domains, as well as addressing the needs of natural resource management, emergency response, and ecological assessment [24]. An exceptional attribute of GF-6 is its expansive coverage capacity. Following its deployment into orbit, GF-6 is poised to establish a synergistic satellite network alongside GF-1, enhancing the collective observational capabilities.
GF-1 and GF-6 are equipped with two types of cameras, namely the high-resolution camera PMS and the wide-format camera WFV (Table 2). The PMS camera can obtain 2 m of panchromatic black and white image, 8 m of multispectral color image, and 2 m of true color image after the fusion of multispectral and panchromatic image [23,25].
Table 2.
GF-1 and GF-6 satellite payload parameters.
2.2.3. Landsat 8
Landsat 8, launched in 2013, is equipped with two main payloads: the Operational Land Imager (OLI) and the Thermal Infrared Sensor (TIRS) (Table 3). The TIRS sensor is specifically designed to measure thermal radiation from the Earth’s surface, providing crucial data for understanding surface temperature dynamics [26].
Table 3.
Landsat 8 TIRS satellite payload parameters.
TIRS consists of two thermal infrared bands with a spatial resolution of 100 m, operating in the wavelength range of 10.60–11.19 μm (Band 10) and 11.50–12.51 μm (Band 11). These bands are capable of sensing thermal radiation from targets, making them ideal for applications such as surface temperature retrieval, fire detection, soil moisture assessment, and nocturnal imaging [27].
Furthermore, the application of an improved radiative transfer equation algorithm for SST retrieval from Landsat 8 has shown significant improvements in both atmospheric transmittance and SST deviation [28], with biases and root mean square errors reduced to negligible levels in nearshore areas. This indicates that Landsat 8 data, through refined algorithms, can provide reliable SST information, which is crucial for various oceanographic and environmental studies. In conclusion, Landsat 8’s TIRS sensor offers a robust tool for SST retrieval, particularly in coastal regions where detailed thermal dynamics are essential. The high resolution and quality of Landsat 8 data, combined with advanced retrieval algorithms, make it a valuable resource for monitoring and studying sea surface temperatures.
2.2.4. Other Sources of Data
Copernicus is a collaborative Earth observation initiative supported by the European Space Agency and EUMETSAT, offering comprehensive global Earth observation data that include marine data. The data are accessible to the public and scientific community through the Copernicus Marine Environment Monitoring Service (CMEMS), which provides ocean observation and prediction products for various oceanic parameters and indicators across the world’s oceans. Additionally, topographic data were sourced from GEBCO2023, the General Bathymetric Chart of the Oceans, while marine disaster data for Zhejiang Province were obtained from the Department of Natural Resources of Zhejiang Province. A detailed list of the sources of oceanic and atmospheric data, along with relevant information, can be found in Table 4.
Table 4.
Data sources of oceanic and atmospheric data.
2.3. Methods
2.3.1. Large Yellow Croaker Culture Area Extraction: FRI 2 (Fishery Ranching Index 2)
To extract cage aquaculture areas of large yellow croaker near the coast of the East China Sea, we refer to an extraction algorithm, FRI 2, for cage aquaculture areas, which is detailed as follows [29].
B1, B2, B3, and B4 represent the reflectance of bands 1 to 4 of GF PMS.
2.3.2. New Site Selection Method for Large Yellow Croaker (SSM-LYC)
To address the problem of selecting sites for large yellow croaker cage aquaculture along the coast of Zhejiang Province, this study proposes a novel site selection evaluation method. This method is based on a large yellow croaker cage aquaculture area environmental factor template summarized from multi-source data, as well as the grey relational analysis method to assess the interrelationships among different factors within the system. The method encompasses five steps as follows.
Step 1: Determine the reference sequence and the comparison sequence (i = 1, 2, …, n).
Reference sequence : This usually refers to the sequence of indicator values in the ideal or optimal state or the target state desired by the decision maker. The reference sequence was determined by combining the actual influencing factors for the establishment of cage aquaculture areas for large yellow croaker (Figure 3) and the corresponding parameters of existing typical cage aquaculture areas for large yellow croaker.
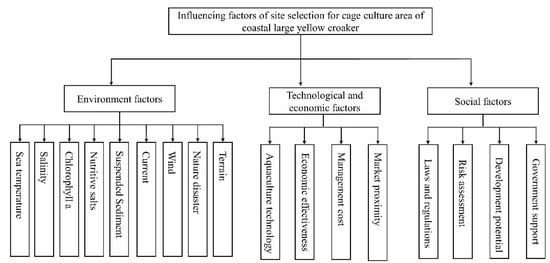
Figure 3.
Influencing factors of site selection for cage aquaculture area of coastal large yellow croaker.
Comparison sequence : A sequence of specific index values for each potential site.
Step 2: Dimensionless data processing.
Since the raw data may have different dimensions, it needs to be dimensionless. The common method is Min − Max Normalization, which ensures that the data are between 0 and 1.
where is the original data point and min() and max() are the minimum and maximum values in the data set, respectively.
Step 3: Calculate the absolute difference.
For each data point, the absolute difference between the normalized reference sequence and the comparison sequence is calculated as follows:
Step 4: Calculate the correlation degree.
The purpose of calculating the degree of association is to quantify and compare the degree of similarity between sequences (the observed values of factors) and a reference sequence (values representing an optimal or target state). Therefore, this section uses the formula used in GRA to calculate the correlation degree [30].
The correlation degree is calculated as follows:
is the grey correlation coefficient between the comparison sequence and the reference sequence. is the resolution coefficient, usually ranging from 0 to 1, used to adjust the sensitivity of the model. The correlation degree ranges from 0 to 1, and the larger the value, the higher the correlation degree between the two sequences. n refers to the number of parameters in the reference sequence.
Step 5: Sort by correlation degree.
Each comparison sequence is sorted according to the calculated correlation degree, . The higher the correlation degree, the higher the similarity between the sequence and the reference sequence, and correspondingly, the higher the suitability of the location.
2.3.3. Satellite Inversion Method of Extracting Environmental Factors
The method of Suspended Particulate Matter Model (SPM-CT) was used to extract the Suspended Sediment Concentration (SSC). SPM-CT is a model made up of the red band and near-infrared band used to estimate Suspended Particulate Matter Concentration (SPMC) in seawater, especially suitable for high turbidity waters such as Hangzhou Bay. By analyzing the relationship between SPMC and reflectance at different wavelengths, linear regression analysis is used to establish the relationship between SPMC and reflectance at the red band and near-infrared band. It was found that in the red and near-infrared bands, the near-infrared band showed the highest correlation with SPMC. Through the verification of the field data set, the regression formula of the model is obtained, and the highly significant correlation coefficient and determination coefficient are calculated. The model verification results show a good agreement with the measured values. Therefore, the SPM-CT model is suitable for the study area and provides a reliable method for the estimation of suspended particulate matter concentration [31].
where B3 and B4 are the reflectance values of band 3 (Red) and band 4 (NIR) of GF WFV data.
SPMC = 314.435 × B3 + 3805.982 × B4 + 28.54
Landsat 8 RTM (Radiative Transfer Model) is used to extract the Sea Surface Temperature (SST). The SST of the large yellow croaker aquaculture areas can be obtained from the thermal infrared band of Landsat 8 satellite images. RTM [32,33] was selected with higher accuracy for the SST inversion of Zhoushan marine ranching.
Firstly, radiometric calibration can turn a DN image into a radiance image. The following is the calculation formula for the radiometric calibration.
where DN is the gray value, h is the offset, and Gain is the absolute scaling coefficient gain. The above data can be obtained from the thermal infrared data header file of Landsat 8.
Then, the blackbody radiation and brightness temperature inversion were performed. According to the thermal infrared radiation transfer model, the brightness of surface radiation can be expressed as the following formula [28].
where is the effective bandpass upwelling radiance, and is the effective bandpass downwelling radiance. is the sea surface emissivity. is the atmospheric path transmittance from the sensor to the target. is the band average atmospheric transmission. This set of data was obtained from the Atmospheric Correction Parameter Calculator (https://atmcorr.gsfc.nasa.gov/ (accessed on 1 September 2023)).
Model coefficients K1 and K2 can be obtained from the Landsat 8 data header file. For the tenth band, K1 is 774.8853, and K2 is 1321.0789.
Chlorophyll-a extraction: HY-1C CZI SS-1 [17]
where ρ is the Chl-a concentration, the unit is ug/L; B1, B2, and B3 are the reflectance of the first, second, and third bands of the CZI data, respectively.
3. Results
3.1. Distribution of Large Yellow Croaker Aquaculture Area (LYC-A)
The cage aquaculture regions (Figure 4) for large yellow croakers are distributed across the entire coastal stretch of Zhejiang Province, with the northernmost area situated in Shengsi County, Zhoushan, at approximately 30°42′N latitude, and the southernmost located on Nanji Island in Wenzhou, Zhejiang Province, at about 27°30′N latitude. The cage aquaculture areas exhibit a compact arrangement. Typically, the horizontal configuration is generally linked by 2 to 4 cages, while the vertical count is determined based on the extent of the culture area.
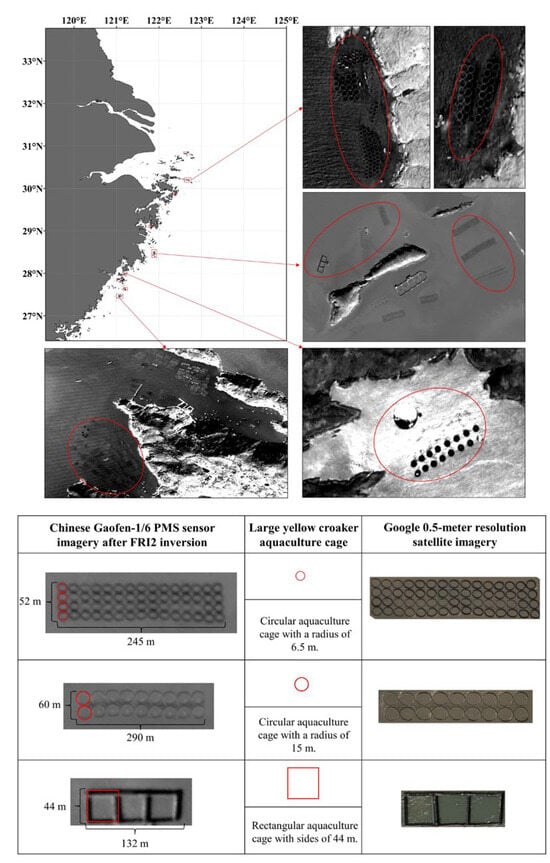
Figure 4.
Extraction results and typical cage size of large yellow croaker cage aquaculture area in coastal Zhejiang Province. The red circles are the extracted large yellow croaker cage aquaculture area.
Furthermore, based on the spatial resolution of the satellite imagery, it can be deduced that there is variability in the size and shape of the cages within the large yellow croaker cage culture areas (Figure 4). The cages can be categorized by shape into circular (Figure 4) and rectangular designs (Figure 4). The circular cages can be roughly classified by radius into two sizes, approximately 6.5 m and 15 m in diameter (Figure 4). The rectangular cages can be approximated by the side length, with one size being around 44 m (Figure 4). This indicates diversity in the structural dimensions of the cage systems utilized in the aquaculture of large yellow croakers.
3.2. Template of Environmental Factors for LYC-A
The siting study for large yellow croaker cage aquaculture in Zhejiang Province’s coastal waters necessitates careful consideration of the region’s extensive latitudinal span and the pronounced variation in environmental factors across its diverse water bodies. To address these variations, this paper divides the research area into two parts at 30°N for analysis. This line serves as a logical ecological and geographical boundary for several reasons. It delineates the transition between subtropical and temperate climate zones, exerting a significant influence on the local climate, including solar radiation and precipitation patterns. These climatic factors, in turn, have a cascading effect on the marine environment, impacting critical parameters such as water temperature, salinity, and ocean currents, which are pivotal in determining the distribution and growth of marine life. North of the 30°N latitude, distinctive marine environmental features like Hangzhou Bay and the Yangtze River Estuary are found, each with its own set of ecological characteristics that can shape local marine life and require tailored management and conservation approaches. The presence of Hangzhou Bay, a notable geographical landmark for Zhejiang Province, near this latitude further underscores the significance of the 30°N line as a natural boundary separating distinct marine environmental attributes.
The distribution of suspended sediment concentration is a critical metric in the assessment of the cage aquaculture environment. Gaining insights into this distribution assists in evaluating the water quality and the ecological health of the aquaculture zones, thereby offering a scientific foundation for informed aquaculture management decisions. Moreover, in large yellow croaker aquaculture areas, the chlorophyll content in the water environment is an important indicator of significant importance for assessing and monitoring the ecological health and productivity of the culture area.
3.2.1. Water Color Factors Contributing to the Template for LYC-A
To achieve this, the SPM-CT suspended sediment concentration inversion formula (Equation (6)) was utilized in conjunction with remote sensing data from the Chinese GF satellite series, specifically GF-WFV imagery. The corresponding satellite image processing software was employed to generate a spatial distribution map of the suspended sediment concentration. The coastal waters of Zhejiang province were designated as the study area, with the observation period spanning from 2020 to 2022. In addition, the SS-1 Chl-a inversion formula (Equation (6)) was utilized in conjunction with remote sensing data from the Chinese HY-1C/D CZI sensor series. The corresponding satellite image processing software was employed to generate a spatial distribution map of the Chl-a concentration. The coastal waters of Zhejiang province were designated as the study area, with the observation period spanning from 2022 to 2023.
The spatial distribution of SSC in the coastal waters of Zhejiang province shows significant seasonal variation and spatial heterogeneity (Figure 5a). The nearshore region, particularly in Hangzhou Bay, exhibits higher suspended sediment concentration due to the combined effects of tidal effects, the hydrological dynamic mechanism leading to sediment accumulation, and the bay’s trumpet-shaped topography, which results in silting and scouring on the northern and southern banks. Seasonally, Hangzhou Bay experiences higher suspended sediment content, with sediment accumulating in spring and summer and being exported in autumn and winter. In the cage aquaculture area located above 30°N latitude, the concentration of suspended sediment ranges from 130 to 150 mg/L during spring and summer (Figure 5a(B–E)) and increases to 260 to 300 mg/L during autumn and winter (Figure 5a(A,F–I)). In contrast, the cage aquaculture area situated below 30°N latitude generally has lower suspended sediment content, with spring and summer levels between 150 and 180 mg/L (Figure 5a(J)) and autumn and winter levels between 170 and 200 mg/L (Figure 5a(G,H)).
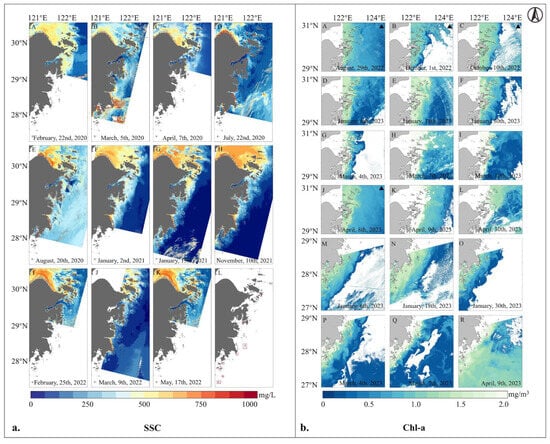
Figure 5.
Ocean color distribution in the study area from 2020 to 2023. The distribution of SSC is (a), and the distribution of Chl-a is (b). The red boxes in (a) are typical large yellow croaker cage culture areas. The black triangle in (b) represents HY-1C CZI satellite data, and the rest is HY-1D CZI satellite data.
The spatial and temporal distribution characteristics of Chl-a in the coastal waters of Zhejiang Province are evident, with higher concentrations closer to the coast (Figure 5b). Throughout the year, the concentration of Chl-a in summer and autumn is lower than that in winter and spring (Figure 5b(A–L)). The regions with high Chl-a concentrations are consistent with areas of low SST within the same season, suggesting a relationship with the upwelling phenomenon. In the cage aquaculture area for large yellow croaker located north of 30°N, the Chl-a concentration in spring ranges from 1 to 1.5 mg/m3 (Figure 5b(G–L)), in summer from 0.8 to 1.0 mg/m3 (Figure 5b(A)), in autumn from 1.2 to 1.4 mg/m3 (Figure 5b(B,C)), and in winter from 2 to 2.2 mg/m3 (Figure 5b(D–F)). In the cage farming area for large yellow croaker located south of 30°N, the Chl-a concentration in spring, summer, autumn, and winter is in the range of 0.8–1.0, 1.1–1.3, 0.7–0.9, and 1.5–1.7 mg/m3, respectively (Figure 5b(D–F,M–R)). Quantitative analysis reveals that the Chl-a concentration in the large yellow croaker farming area north of 30°N is higher than that in the area south of 30°N (Figure 5b).
In addition to the seasonal variations in suspended sediment concentration and Chl-a, the influence of the river plume on these water quality parameters should also be considered. River plumes, particularly from large rivers such as the Yangtze River, can significantly affect the distribution of suspended sediments and nutrients in the coastal waters. These plumes bring a large influx of freshwater, sediment, and nutrients into the coastal zone, influencing SSC and Chl-a concentrations. During periods of high river discharge, elevated levels of suspended sediments and nutrients are transported into the study area, contributing to higher SSC and nutrient availability, which can enhance phytoplankton growth and increase Chl-a concentrations. The impact of river plumes was particularly evident in the nearshore regions, where higher SSC and nutrient levels were observed, aligning with the seasonal patterns of increased sediment accumulation in the spring and summer. This effect was especially noticeable in the northern regions of Zhejiang Province, where the proximity to river mouths leads to higher levels of suspended sediments and nutrient concentrations, further influencing the ecological conditions in large yellow croaker aquaculture zones.
3.2.2. Marine Hydrological Factors Contributing to the Template for LYC-A
Considering that the change in SST influences the growth of large yellow croaker, it should be analyzed comprehensively from 2020 to 2023.
SST distribution maps (Figure 6) showed variations in temperature across different marine areas. The color variations indicate temperature fronts, which are regions where water bodies of different temperatures meet. These fronts can significantly impact marine ecosystems (Figure 6I,J,O). The SST along the coast of Zhejiang Province is influenced by seasonal changes, with higher temperatures in the summer and lower temperatures in the winter. By examining the SST distribution maps, we can identify the range of water temperatures in the aquaculture areas and pinpoint areas that match the ideal growth conditions for the species being cultured. Referring to Section 3.1, which details the location of the large yellow croaker aquaculture zones, it is evident that north of 30°N, the SST ranges from 12 to 13 °C in spring (Figure 6D,J,K,O), 25–26 °C in summer (Figure 6), 24–25 °C in autumn (Figure 6M,P), and 11–12 °C in winter (Figure 6A–C,F–I). South of 30°N, the SST in the large yellow croaker aquaculture areas varies seasonally as follows: 13–14 °C in spring (Figure 6D,J,K,O), 25–27 °C in summer (Figure 6E,L), 25–26 °C in autumn (Figure 6M,P), and 11–12 °C in winter (Figure 6A–C,F–I,N).
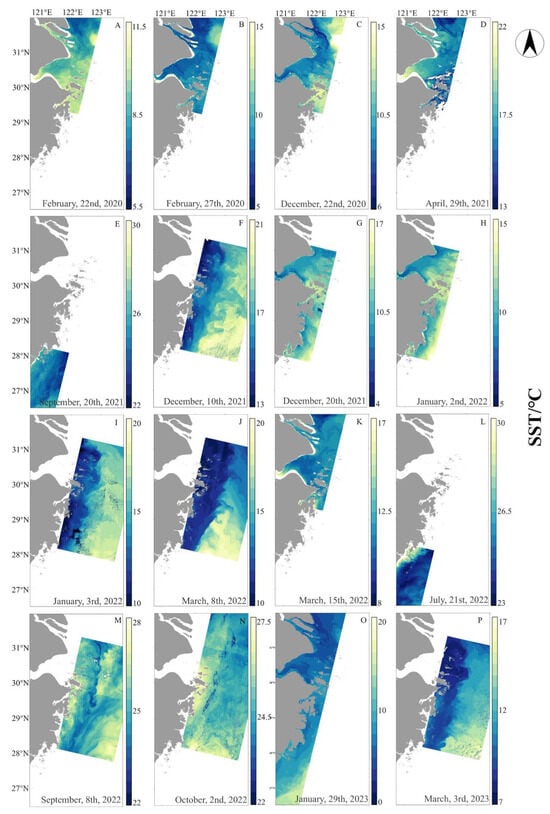
Figure 6.
Sea surface temperature distribution maps of the study area from 2020 to 2023, derived from Landsat 8 imagery. Subfigure (A–P) Lists the parameters in chronological order. The maps utilize a gradient of color intensity to represent temperature levels, with warmer colors indicating higher SST and cooler colors indicating lower SST.
The study of salinity and temperature profiles is essential for comprehensive environmental monitoring in large yellow croaker cage aquaculture areas. It aids in maintaining the health of the cultured species, optimizing production conditions, and ensuring the long-term sustainability of aquaculture operations.
In the scope of the current large yellow croaker cage aquaculture along the Zhejiang coast, studies focusing on the upper 20 m of the water column reveal significant temperature change. Seasonal variations in sea temperature are evident within this depth, with distinct patterns emerging. During the summer and autumn months, higher sea surface temperatures are observed due to solar radiation, contrasting with the lower temperatures in winter and spring (Figure 7a). This temperature variation is particularly notable, highlighting the impact of solar heating on the sea surface.
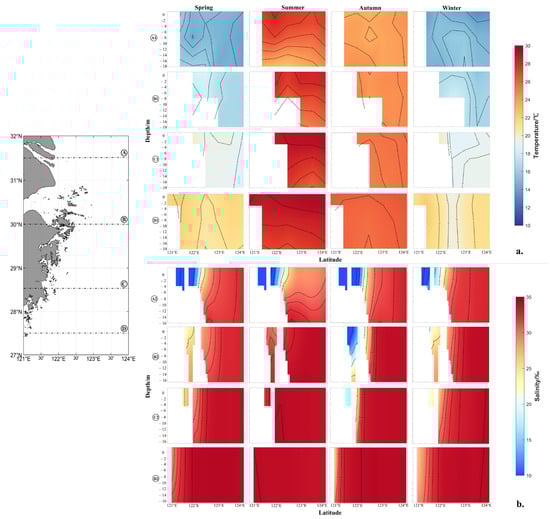
Figure 7.
Sea temperature profile and salinity profile of typical large yellow croaker cage aquaculture area in coastal Zhejiang province. A–D are the four latitudinal profiles of the study area. (a) is the temperature profile, and (b) is the salinity profile.
An interesting phenomenon identified through temperature profiles is the presence of upwelling in the Zhoushan fishing ground during the summer, specifically within the longitude range of 122°E to 123°E (Figure 7b(B)—summer). This upwelling, characterized by a vertical movement of water, can significantly influence the local marine ecosystem and the conditions within aquaculture cages. Salinity profiles also exhibit a pronounced gradient in the nearshore areas north of 30°N, with this gradient being more accentuated in the summer (Figure 7b). This suggests that freshwater inputs, likely from river runoff, play a substantial role in shaping the marine environment in these regions. When considering potential sites for large yellow croaker cage aquaculture, these findings are pivotal. The seasonal sea temperature patterns, the occurrence of upwelling, and the significant salinity gradients must be factored into the decision-making process. Understanding these environmental dynamics is crucial for optimizing aquaculture practices and ensuring the sustainability of fish aquaculture operations in the area.
Other hydrological elements include sea surface temperature and salinity, current velocity, and wind speed. A comprehensive assessment of the background fields along the Zhejiang coast is essential for delineating the hydrodynamic characteristics of large yellow croaker cage aquaculture zones. This study encompasses a detailed analysis of wind patterns, ocean currents, and other critical water column properties, which are pivotal for characterizing the environmental conditions conducive to fish growth and health. By integrating these large-scale environmental factors, a nuanced understanding of water quality, nutrient dynamics, and thermal stratification is achieved. This synthesis is crucial for identifying areas with optimal conditions, facilitating the strategic identification and demarcation of prospective aquaculture sites. Such delineation enhances the productivity and sustainability of aquaculture operations while ensuring the ecological integrity of the marine environment, aligning with broader goals of environmental stewardship and economic prosperity.
In the large yellow croaker cage aquaculture areas north of 30°N, the current velocity exhibits distinct seasonal variations (Figure 8I–K). During spring, the flow rates range from 0.07 to 0.09 m/s (Figure 8I), escalating to 0.1 to 0.2 m/s in summer (Figure 8J). The autumn months witness a further increase, with currents ranging between 0.2 and 0.24 m/s (Figure 8K), while winter experiences the highest velocities, fluctuating between 0.17 and 0.26 m/s (Figure 8L). These variations in current velocity are crucial for understanding the hydrodynamic conditions that influence the aquaculture environment and the physiological responses of the fish. South of 30°N, the seasonal current velocities are notably different. In spring and summer, the flow rates are relatively lower, with ranges of 0.04 to 0.05 m/s (Figure 8I) and 0.1 to 0.16 m/s (Figure 8J), respectively. Autumn and winter currents are moderate, with velocities in the range of 0.11 to 0.14 m/s (Figure 8K) and 0.12 to 0.14 m/s (Figure 8L), respectively.
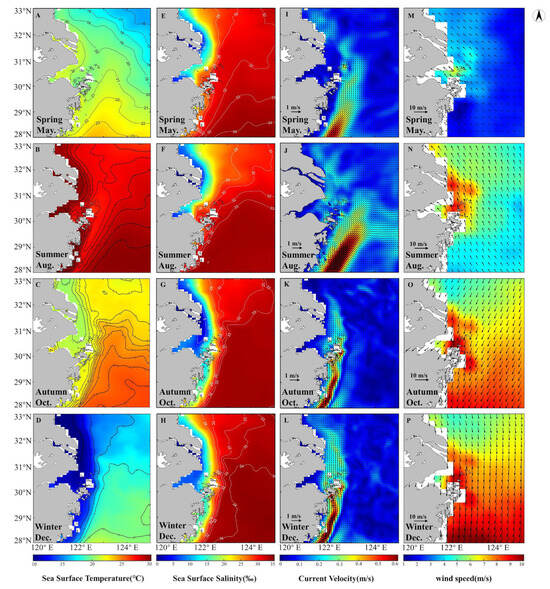
Figure 8.
The coastal hydrological element map of the study area. Panels (A–D) show the seasonal average sea surface temperature distribution maps of the study area, including isotherms. Panels (E–H) present the seasonal average sea surface salinity distribution maps, including isohalines. Panels (I–L) depict the flow field distribution, while panels (M–P) illustrate the wind field distribution. Data sources are detailed in Table 4.
In terms of wind speed, the large yellow croaker cage aquaculture areas north of 30°N experience a significant increase from spring to winter. Spring winds average between 3 and 3.6 m/s (Figure 8M), peaking in summer at 6 to 7 m/s (Figure 8N) and further intensifying in autumn to 7 to 8 m/s (Figure 8O), culminating in the strongest winds in winter, ranging from 8 to 9 m/s (Figure 8P). Conversely, in the regions south of 30°N, the wind speed profiles show a different pattern, with spring and summer winds at 2 to 3 m/s (Figure 8M) and 4 to 5 m/s (Figure 8N), respectively. The highest wind speeds are observed in autumn and winter, with velocities reaching 8 to 9 m/s (Figure 8O) and 9 to 10 m/s (Figure 8P), respectively. These pronounced seasonal and latitudinal variations in wind speed are integral to the assessment of the overall meteorological conditions.
As shown in Figure 2, the typical water depth in the large yellow croaker aquaculture areas along the Zhejiang coastline is around 20 m. This depth is primarily influenced by the nearshore water depth of the region, where the coastal waters generally have depths close to 20 m. It is more convenient to breed large yellow croaker in shallow waters near the coast, but it does not mean that the appropriate depth of large yellow croaker farming is in shallow waters. The suitability of a site for aquaculture is influenced by a combination of factors, including water quality, hydrodynamics, sediment concentration, and ecological conditions. Waters with suitable conditions mentioned above, even with a depth of 15–60 m, can also be selected as aquaculture areas. Meanwhile, other environmental and logistical considerations will play a key role in the final site selection for future large yellow croaker aquaculture development.
3.2.3. The Value of the Template for LYC-A
According to the above environmental factors, we summarized the environmental factor template of large yellow croaker cage aquaculture, as shown in Table 5.
Table 5.
The template of large yellow croaker cage aquaculture area.
Based on Table 5, a reference sequence of environmental and operational parameters corresponding to the spatial and temporal characteristics of potential aquaculture areas can be derived for typical large yellow croaker cage aquaculture areas in Zhejiang Province. This sequence includes key factors such as SST, Salinity, Chl-a, Nutrient levels, SSC, Current speed, Wind speed, Disaster frequency, Average Depth of Aquaculture, Market Proximity, and Marine Traffic. These elements correspond to the factors influencing site selection for large yellow croaker cage aquaculture, as outlined in Figure 3, specifically aligning with SSM-LYC. For example, Market Proximity falls under Technological and Economic Factors, while Marine Traffic is categorized under Social Factors, including government regulations. These parameters vary according to seasonal and geographic conditions, providing a comprehensive framework for assessing the suitability and optimization of aquaculture operations in the region. The public shipping lanes were analyzed in the study area when selecting potential aquaculture sites. Potential aquaculture sites must be located away from the route and avoid marine traffic lanes.
3.3. Potential Large Yellow Croaker Cage Aquaculture Area
Based on Table 5, the potential areas for nearshore cage aquaculture of large yellow croaker and the prospective regions for distant cage aquaculture in the future have been delineated within the coastal waters of Zhejiang Province. Subsequently, suitable specific sites are identified from the available ranges and evaluated using the SSM-LYC evaluation method. This evaluation is conducted to establish a hierarchy of priorities for the establishment of aquaculture zones (Figure 9).
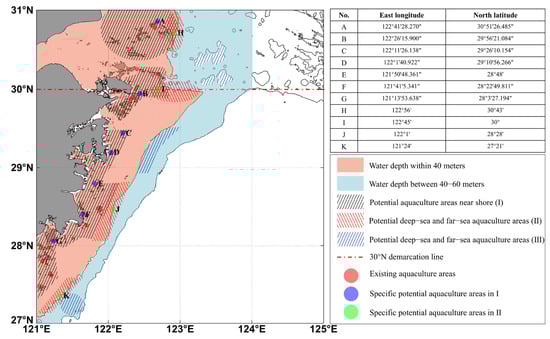
Figure 9.
Potential large yellow croaker cage aquaculture area. In Figure 9, the blue potential aquaculture areas are A–G from north to south, and the green potential deep-sea and far-sea marine aquaculture areas are H–K from north to south.
According to step 4 in SSM-LYC, the correlation degree between different potential aquaculture areas and the LYC-A template was calculated. Potential aquaculture areas demonstrating a correlation degree above 70% are classified as first-level site selections, indicating their high suitability for fish farming. Areas with a correlation degree between 60% and 70% are categorized as second-level site selections, signifying a moderate suitability for aquaculture. Regions with a correlation degree below 60% are termed third-level site selections, reflecting a lesser degree of appropriateness for establishing aquaculture operations (Figure 10).
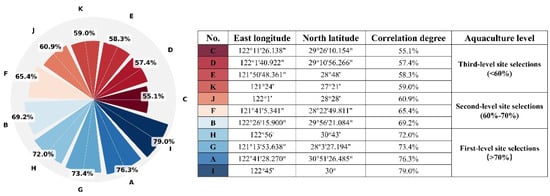
Figure 10.
Results of SSM-LYC evaluation system for each potential cage aquaculture area of large yellow croaker.
According to Figure 10, the potential large yellow croaker cage aquaculture zones are strategically tiered, with I, A, G, and H identified as first-level site selections, B, F, and J as second-level site selections, and K, E, D, and C as third-level site selections.
4. Discussion
4.1. Applicability of Template of LYC-A
When establishing a template for large yellow croaker net cage aquaculture zones, a holistic approach is essential, integrating environmental factors, technological and economic factors, and social factors [34]. This multifaceted evaluation ensures that the chosen sites are not only conducive to the health and growth of the fish but also economically viable and socially responsible, aligning with the broader goals of sustainable development and community well-being.
4.1.1. The Rationality Selection of Environmental Factors in the Template
Ocean temperature and salinity, chlorophyll-a and nutrient concentrations, suspended sediment concentration, sea currents, wind, the frequency of natural disasters, and sea depth and terrain are all important factors affecting site selection for coastal aquaculture areas [35,36,37,38,39,40].
SST is a critical environmental factor in the cage aquaculture of large yellow croaker. Fluctuations in SST can directly affect the physiological activities and growth rates of large yellow croaker and may also indirectly impact their health and aquaculture efficiency by influencing other environmental factors such as nutrient salts and chlorophyll-a content [11,12]. For instance, an optimal SST can enhance the metabolism and appetite of large yellow croaker, thereby increasing their growth velocity and aquaculture yield. However, SST that is either excessively high or low can lead to impeded growth and even trigger diseases and mortality in large yellow croaker [41]. Continuous monitoring of SST distribution enables the aquaculture areas to adjust their husbandry strategies in a timely manner, optimize the layout of their cages, and ensure the sustainability and economic benefits of large yellow croaker aquaculture. This approach is crucial for maintaining the health of the cultured species and for adapting to the dynamic thermal conditions of the marine environment.
Investigating the salinity and temperature profiles in large yellow croaker cage aquaculture areas is essential for maintaining the health and productivity of the species. Salinity is a key factor in marine ecosystems, impacting the physiological processes of aquatic organisms by influencing osmotic balance. It is crucial for the health and growth of the large yellow croaker, and variations in salinity can signal changes in water origin, such as freshwater inflow or mixing with oceanic waters, affecting species distribution within aquaculture zones [35]. Monitoring salinity profiles is thus vital for understanding and managing water quality parameters critical to fish well-being. Similarly, the study of sea temperature profiles is vital for aquaculture, particularly in regions like the large yellow croaker cage aquaculture areas. It is essential because these temperature profiles directly affect the physiological processes of marine species, influencing their metabolic rates, growth, and reproduction. High temperatures can lead to increased metabolic demands and potential stress, while lower temperatures can slow growth and affect reproductive success. Considering the changes in profile temperature and salinity during site selection is helpful in evaluating whether the water environment in the culture area is suitable for the growth of large yellow croaker.
In assessing the water environment for cage aquaculture along Zhejiang’s coast, besides sea temperature and salinity, factors such as suspended sediment concentration, Chlorophyll a (Chl-a), nutrient availability, water depth, and the risks of red tides and storm surges are also crucial [35]. Suspended sediment, a key water quality parameter, can impede gas exchange, affecting aquatic organisms’ health and dissolved oxygen levels. Chl-a is indicative of water productivity and phytoplankton biomass and reflects nutrient status, which is essential for the nutritional needs of large yellow croaker [36,37]. Nutrient concentration, influenced by river inputs, is vital for phytoplankton growth and the croaker’s food source, with high values typically nearshore. Water depth is critical for light penetration, currents, temperature stratification, and biodiversity, providing an optimal habitat while reducing disaster risks and ensuring the sustainability of aquaculture. Red tides and storm surges pose significant threats, with red tides linked to nutrient enrichment negatively impacting croaker health and growth and storm surges potentially damaging infrastructure [38,39]. Considering these factors in site selection is vital for preventive measures to protect the aquaculture industry’s health and economic viability [40].
In conclusion, the integration of these environmental parameters as a template for the existing large yellow croaker net cage farming zones is both rational and imperative. Through a scientific assessment of these environmental factors, optimal conditions can be established for the cultivation of large yellow croaker, thereby ensuring the success and economic viability of the aquaculture endeavors.
4.1.2. Other Factors in the Template
When siting cage aquaculture for large yellow croaker in Zhejiang Province, crucial factors include aquaculture technology, economic benefits, management costs, and market proximity. Advanced technology, such as enclosure wild-raising, enhances growth and quality while reducing environmental impact. Economic effectiveness, influenced by market potential and management efficiency, ensures investment returns and attracts capital [42,43,44]. Management costs, including labor and operational expenses, must be optimized for profitability. Market proximity reduces logistics costs and enhances market responsiveness, with Zhejiang’s location facilitating quick product distribution [45,46].
Societal factors like laws, development potential, and government support are pivotal for project legality, feasibility, and benefits. Assuming equal societal support for all sites, the focus shifts to geographical, environmental, and market factors [47]. This streamlined approach, reflecting Zhejiang’s commitment to aquaculture, aids in the efficient identification of optimal sites for sustainable industry growth [48].
4.2. Applicability of Site Selection Method for Large Yellow Croaker (SSM-LYC)
The SSM-LYC represents a multi-source data-based methodology tailored for the assessment of prospective cage aquaculture sites. The SSM-LYC method is delineated through a sequence of steps. Determining the template of YLC-A is the first step in SSM-LYC; therefore, the applicability of the template is also an important support for the reasonableness and applicability of SSM-YLC. Initially, a rational template for the Large Yellow Croaker Aquaculture Area (LYC-A) is constructed based on the various factors influencing it, which serves as our reference sequence. The comparative sequence is then derived from the environmental conditions of potential LYC-A sites and organized in the same order as the reference sequence. Given that the units of different factors vary, dimensionless data processing is applied to both the reference and comparative sequences. Subsequently, a correlation analysis is conducted on the two sequences, employing the grey relational degree calculation formula from grey system theory, chosen for its suitability in multi-factor correlation analysis and predictive evaluation [30].
Upon elucidating the SSM-LYC method, it becomes evident that the determination of the reference and comparative sequences significantly impacts the site selection evaluation for LYC-A. Consequently, this study integrates multi-source data to ascertain these sequences, encompassing high-resolution satellite imagery, reanalysis data, measurements, and numerical simulation data. The SSM-LYC method is suitable for class II waters (the optical properties are influenced by phytoplankton and their detritus, inorganic suspended particles, and yellow substances, also known as dissolved organic matter (DOM)) in the world.
The integration of high-resolution satellite imagery, oceanic reanalysis data, in situ measurement data, and numerical simulation data within the site selection evaluation for LYC-A demonstrates a synergistic approach that underscores the rationality and superiority of our methodology. High-resolution satellite imagery offers detailed observations of the surface characteristics, enhancing the precision of environmental assessments. Oceanic reanalysis data provide long-term climatic trends, enabling a deeper understanding of environmental dynamics [17,49]. In situ measurement data serve as a crucial validation tool, ensuring the reliability of our findings by corroborating remote sensing and reanalysis data. Numerical simulation data, on the other hand, offer predictive capabilities, allowing for the anticipation of future environmental changes and potential risks [17,38]. This multifaceted approach not only ensures a comprehensive and scientifically rigorous assessment but also optimizes cost-efficiency and timeliness, providing decision-makers with robust support for informed and timely decision-making in aquaculture site selection.
4.3. The Development Trend of Potential LYC-A from near Shore to Deep-Sea and Far-Sea
Deep-sea and far-sea aquaculture is gaining momentum globally [50], with notable examples, such as Norway’s salmon farming in the fjords and Japan’s offshore fishery operations. These cases demonstrate the viability and potential of moving aquaculture into the open ocean, where conditions are more stable, and space is less contested [51,52]. The success of such endeavors underscores the broader applicability of this approach to other marine species, including the large yellow croaker. Zhejiang Province, with its abundant marine resources and strong seafood sector, is well-positioned to lead in deep-sea aquaculture. Its long coastline and maritime economy, along with its infrastructure and marine tech innovation, make it an ideal pioneer for advanced aquaculture.
In this study, the rules of site selection evaluation of potential large yellow croaker cage aquaculture areas along the coast of Zhejiang Province are consistent with the development layout and trend from near shore to deep-sea and far-sea. Deep-sea and far-sea aquaculture in Zhejiang Province is significant for ecological conservation and sustainable development, reducing pressure on nearshore ecosystems, aiding marine habitat recovery, and preserving biodiversity. It also sustains a high-quality seafood supply and meets market demands to uphold Zhejiang’s reputation in sustainable seafood production. Moreover, the advancement of deep-sea and far-sea aquaculture in Zhejiang can serve as a model for other coastal regions, both domestically and internationally [53,54,55,56,57]. By demonstrating the feasibility and benefits of such operations, Zhejiang can contribute to the global dialogue on sustainable aquaculture and set a precedent for environmentally responsible practices in the marine sector. This leadership role is crucial in an era where the sustainable use of marine resources is increasingly recognized as essential for the health of our oceans and the livelihoods of coastal communities.
Remote sensing technologies have found widespread application in environmental monitoring and post-installation validation of aquaculture zones. By utilizing satellite imagery and remote sensing data, various water quality parameters, such as sea surface temperature, suspended sediment concentrations, and chlorophyll-a levels, can be monitored in real time [58]. These data provide valuable insights into the impacts of aquaculture activities on coastal ecosystems, allowing for the assessment of environmental changes over time. Remote sensing facilitates the identification of environmental stressors, supports sustainable aquaculture management, and aids in the optimization of site selection and monitoring strategies [59].
Future studies should consider the impact of Dissolved Organic Carbon (DOC) [60] and pharmaceuticals [61] on aquaculture environments, as these factors influence water quality and fish health. Additionally, the orientation of aquaculture cages relative to ocean currents, as well as the potential pollution from nearby urban, industrial, and port areas, should be explored [62]. Addressing these aspects will help optimize cage placement, improve environmental sustainability, and mitigate pollution risks in aquaculture zones. Typhoons can be effectively detected and monitored using satellite remote sensing technology, which provides critical data on the storm’s development, track, and intensity [63]. Moreover, satellite remote sensing is also instrumental in assessing the impact of typhoons on fishing grounds by detecting changes in suspended matter concentration, chlorophyll levels, primary productivity, and sea surface temperature. These parameters are essential for understanding typhoons’ ecological and economic implications on marine environments [64].
5. Conclusions
This study constructed a comprehensive template for the large yellow croaker cage aquaculture areas, which encompasses three key elements: environmental factors, aquaculture techniques, and economic and social factors. Furthermore, the SSM-YLC was established based on the template, and the potential cage aquaculture areas in Zhejiang Province were selected and evaluated (Figure 11).
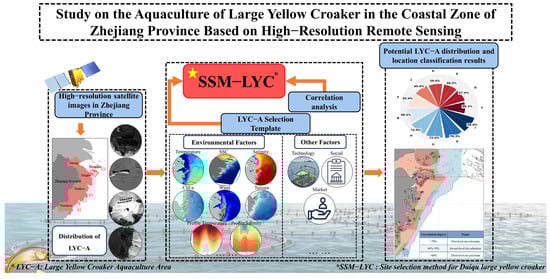
Figure 11.
Study on large yellow croaker aquaculture in the coastal zone of Zhejiang province based on high-resolution remote sensing.
This study clarifies the potential range of aquaculture, further delineating the potential areas for deep-sea aquaculture. In the coastal area of Zhejiang Province, there are 11 potential breeding sites for large yellow croaker. Among them, seven sites have a water depth of less than 40 m, and four sites have a water depth ranging from 40 to 60 m. By innovatively applying the SSM-YLC evaluation method, we conducted a comprehensive assessment and scoring of these potential areas, identifying the central locations of the first-class aquaculture areas, with specific coordinates as follows: I: 122°45′ east longitude, 30° north latitude; A: 122°41′28.270″E longitude, 30°51′26.485″N latitude; G: 121°13′53.638″E longitude, 28°3′27.194″N latitude; H: 122°56′14.467″E longitude, 30°42′53.806”N latitude.
Furthermore, this study explored the feasibility of deep-sea aquaculture of large yellow croaker along the coast of Zhejiang Province, providing a scientific basis for future aquaculture strategies and regional planning. The conclusions of this study not only provide a new perspective for the large yellow croaker aquaculture industry but also offer important references for the sustainable utilization and management of marine resources.
Author Contributions
Conceptualization, J.Y. and L.C.; methodology, L.C.; software, J.Y.; validation, J.Y. and L.C.; formal analysis, J.Y., L.C. and X.Y.; investigation, J.Y., L.C., X.Y., and J.Y.; data curation, J.Y. and J.L.; writing—review and editing, J.L. and B.Z.; writing—review and editing, L.C. and X.Y.; visualization, J.Y.; supervision, L.C. and X.Y.; project administration, L.C.; funding acquisition, X.Y. All authors have read and agreed to the published version of the manuscript.
Funding
This work is supported by the following research projects: The National Key Research and Development Program of China under contract Nos 2023YFD2401900; the Basic Public Welfare Research Program of Zhejiang Province (LGF21D010004); the Science Foundation of Donghai Laboratory (Grant No. DH-2022KF01010); the Science and Technology Plan of Dongtou District (N2022K04); the Research on group ideological and political subject teaching model of ocean remote sensing (132).
Data Availability Statement
Publicly available datasets were analyzed in this study. GF-4/PMS satellite data are available at https://data.cresda.cn/#/home (accessed on 7 November 2022).
Acknowledgments
The authors would like to thank the China Centre for Resources Satellite Data for providing GF satellite data free of charge.
Conflicts of Interest
The authors declare no conflicts of interest.
References
- Ting, Y.L.; Yan, J.; Qing, X.; Mao, D.G.; Yi, C.X.; Min, L. Reproductive Dynamics of the Large Yellow Croaker Larimichthys crocea (Sciaenidae), A Commercially Important Fishery Species in China. Front. Mar. Sci. 2022, 9, 868580. [Google Scholar] [CrossRef]
- Yu, C.; Yan, X.; Jiang, Q.; Zhang, Y. Analysis on the causes of resource change and reconstruction strategy of Daiqu large yellow croaker in East China Sea. J. Fish. China 2022, 46, 616–625. (In Chinese) [Google Scholar] [CrossRef]
- Zhao, S.; Wang, R.; Liu, X. Reasons of Exhaustion of Resources of Pseudosciaenacrocea in Zhoushan Fishing Ground andthe Measures of Protection and Proliferation. J. Zhejiang Ocean Univ. (Nat. Sci.) 2002, 21, 160–165. (In Chinese) [Google Scholar] [CrossRef]
- Aixia, D.; Yier, H. Experiment on breeding of large yellow croaker of Daiqu nationality in Zhoushan. China Fish. 2010, 2, 67–68. (In Chinese) [Google Scholar] [CrossRef]
- Zhang, Q.; Hong, W.; Chen, X. Stock changes and resource protection of the large yellow croaker (Larimichthys crocea) and ribbon fish (Trichiurus japonicus) in coastal waters of China. J. Appl. Oceanogr. 2017, 36, 8. (In Chinese) [Google Scholar] [CrossRef]
- Li, Y.; Wu, Y.; You, G.; Kong, Z.; Xi, X.; Lei, L.; Zhao, D. Information Extraction of Sea-Enclosed Aquaculture Based on Sentinel-2 Remote Sensing Images. Coast. Eng. 2022, 41, 173–180. (In Chinese) [Google Scholar] [CrossRef]
- Fu, Y.; You, S.; Zhang, S.; Cao, K.; Zhang, J.; Wang, P.; Bi, X.; Gao, F.; Li, F. Marine aquaculture mapping using GF-1 WFV satellite images and full resolution cascade convolutional neural network. Int. J. Digit. Earth 2022, 15, 2047–2060. [Google Scholar] [CrossRef]
- Li, L.; Boyd, C.E.; Odom, J. Identification of Pacific white shrimp (Litopenaeus vannamei) to rearing location using elemental profiling—ScienceDirect. Food Control 2014, 45, 70–75. [Google Scholar] [CrossRef]
- Buitrago, J.; Rada, M.; Hernández, H.; Buitrago, E. A Single-Use Site Selection Technique, Using GIS, for Aquaculture Planning: Choosing Locations for Mangrove Oyster Raft Culture in Margarita Island, Venezuela. Environ. Manag. 2005, 35, 544–556. [Google Scholar] [CrossRef]
- Soriano-González, J.; Angelats, E.; Fernández-Tejedor, M.; Diogene, J.; Alcaraz, C. First Results of Phytoplankton Spatial Dynamics in Two NW-Mediterranean Bays from Chlorophyll-a Estimates Using Sentinel 2: Potential Implications for Aquaculture. Remote Sens. 2019, 11, 1756. [Google Scholar] [CrossRef]
- Wang, Q.F.; Shen, W.L.; Liu, C.; Mu, D.L.; Wu, X.F.; Guo, N.G.; Zhu, J.Q. Effects of multi-environmental factors on physiological and biochemical responses of large yellow croaker, Larimichthys crocea. Chemosphere 2017, 184, 907–915. [Google Scholar] [CrossRef] [PubMed]
- Wang, X.; Lu, G.; Zhao, L.; Yang, Q.; Gao, T. Assessment of fishery resources using environmental DNA: The large yellow croaker (Larimichthys crocea) in the East China Sea. Fish. Res. 2020, 235, 105813. [Google Scholar] [CrossRef]
- Lina, Y.; Yang, L. Comparative Study of Distant Fishery Competitiveness of Zhejiang Province Based on the Analytic Hierarchy Process. Issues Agric. Econ. 2014, 35, 94–102+112. (In Chinese) [Google Scholar] [CrossRef]
- Wang, W.; Liang, J.; Bi, Y.; Feng, M.; Zhou, S.; Yu, B. Status and Prospects of Marine Ranching Construction in Zhejiang Province. J. Zhejiang Ocean Univ. (Nat. Sci.) 2016, 35, 181–185. (In Chinese) [Google Scholar] [CrossRef]
- Yamin, S. Hydrological characteristics of Zhoushan Islands. J. China Hydrol. 2001, 06, 59–62. (In Chinese) [Google Scholar] [CrossRef]
- Gao, Q. A Research of the Transformation and Upgrading Path and the Development Bottlenecks of Fishery Industry in Zhejiang Province. Issues Agric. Econ. 2015, 36, 83–89+112. (In Chinese) [Google Scholar] [CrossRef]
- Cai, L.; Yu, M.; Yan, X.; Zhou, Y.; Chen, S. HY-1C/D Reveals the Chlorophyll-a Concentration Distribution Details in the Intensive Islands’ Waters and Its Consistency with the Distribution of Fish Spawning Ground. Remote Sens. 2022, 14, 4270. [Google Scholar] [CrossRef]
- Cai, L.; Zhou, M.; Yan, X.; Liu, J.; Ji, Q.; Chen, Y.; Zuo, J. HY-1C Coastal Zone Imager observations of the suspended sediment content distribution details in the sea area near Hong Kong-Zhuhai-Macao Bridge in China. Acta Oceanol. Sin. 2022, 41, 126–138. [Google Scholar] [CrossRef]
- Luo, W.; Li, R.; Shen, F.; Liu, J. HY-1C/D CZI Image Atmospheric Correction and Quantifying Suspended Particulate Matter. Remote Sens. 2023, 15, 386. [Google Scholar] [CrossRef]
- Men, J.; Liu, J.; Xia, G.; Yue, T.; Tong, R.; Tian, L.; Arai, K.; Wang, L. Atmospheric correction for HY-1C CZI images using neural network in western Pacific region. Geo-Spat. Inf. Sci. 2022, 25, 13. [Google Scholar] [CrossRef]
- Huang, X.; Xuan, F.; Dong, Y.; Su, W.; Wang, X.; Huang, J.; Li, X.; Zeng, Y.; Miao, S.; Li, J. Identifying Corn Lodging in the Mature Period Using Chinese GF-1 PMS Images. Remote Sens. 2023, 15, 894. [Google Scholar] [CrossRef]
- Zhou, Y.; Lin, C.; Wang, S.; Liu, W.; Tian, Y. Estimation of Building Density with the Integrated Use of GF-1 PMS and Radarsat-2 Data. Remote Sens. 2016, 8, 969. [Google Scholar] [CrossRef]
- Han, J.; Tao, Z.; Xie, Y.; Li, H.; Guan, X. A Novel Radiometric Cross-Calibration of GF-6/WFV with MODIS at the Dunhuang Radiometric Calibration Site. IEEE J. Sel. Top. Appl. Earth Obs. Remote Sens. 2020, 14, 1645–1653. [Google Scholar] [CrossRef]
- Qi, B.; Zhang, Z.; Long, T.; He, G.; Wang, G.; Peng, Y.; Xu, Z. High resolution (30 m) burned area product improves the ability for carbon emission estimation in Africa. Earth’s Future 2024, 11, 5. [Google Scholar] [CrossRef]
- Zhang, Q.; Chen, P. Application of Gaofen No.6 Satellite in Vegetation Ecological RemoteSensing Monitoring. J. Agric. 2021, 11, 56–59+111. [Google Scholar] [CrossRef]
- Roy, D.P.; Wulder, M.A.; Loveland, T.R.; Woodcock, C.E.; Allen, R.G.; Anderson, M.C.; Helder, D.; Irons, J.R.; Johnson, D.M.; Kennedy, R. Landsat-8: Science and product vision for terrestrial global change research. Remote Sens. Environ. 2014, 145, 154–172. [Google Scholar] [CrossRef]
- Barsi, J.A.; Schott, J.R.; Hook, S.J.; Raqueno, N.G.; Markham, B.L.; Radocinski, R.G. Landsat-8 Thermal Infrared Sensor (TIRS) Vicarious Radiometric Calibration. Remote Sens. 2014, 6, 607–626. [Google Scholar] [CrossRef]
- Hu, D.; Qiao, K.; Wang, X.; Zhao, L.; Ji, G. Comparison of Three Single-window Algorithms for Retrieving Land-Surface Temperature with Landsat 8 TIRS Data. Geomat. Inf. Sci. Wuhan Univ. 2017, 42, 869–876. (In Chinese) [Google Scholar] [CrossRef]
- Cai, L.; Yin, J.; Yan, X.; Zhou, Y.; Tang, R.; Yu, M. The environmental analysis and site selection of mussel and large yellow croaker aquaculture areas based on high resolution remote sensing. Acta Oceanol. Sin. 2024, 43, 66–86. [Google Scholar] [CrossRef]
- Liu, S.; Cai, H.; Yang, Y.; Cao, Y. Advance in grey incidence analysis modelling. Syst. Eng. Theory Pract. 2013, 33, 2041–2046. (In Chinese) [Google Scholar] [CrossRef]
- Cai, L.; Tang, D.; Levy, G.; Liu, D. Remote sensing of the impacts of construction in coastal waters on suspended particulate matter concentration—The case of the Yangtze River delta. Int. J. Remote Sens. 2015, 37, 2132–2147. [Google Scholar] [CrossRef]
- Xu, H. Retrieval of the reflectance and land surface temperature of the newly-launched Landsat 8 satellite. Chin. J. Geophys. 2015, 58, 741–747. (In Chinese) [Google Scholar] [CrossRef]
- Chen, H.; Zhu, L.; Li, J.; Fan, X. A comparison of two mono-window algorithms for retrieving sea surface temperature from Landsat8 data in coastal water of Hongyan River nuclear power station. Remote Sens. Nat. Resour. 2018, 37, 164–174. (In Chinese) [Google Scholar] [CrossRef]
- Jiang, B.; Boss, E.; Kiffney, T.; Hesketh, G.; Bourdin, G.; Fan, D.; Brady, D.C. Oyster Aquaculture Site Selection Using High-Resolution Remote Sensing: A Case Study in the Gulf of Maine, United States. Front. Mar. Sci. 2022, 9, 802438. [Google Scholar] [CrossRef]
- Reese, D.C.; O’Malley, R.T.; Brodeur, R.D.; Churnside, J.H. Epipelagic fish distributions in relation to thermal fronts in a coastal upwelling system using high-resolution remote-sensing techniques. ICES J. Mar. Sci./J. Du Cons. 2011, 68, 1865–1874. [Google Scholar] [CrossRef]
- Teng, Y.; Zou, B.; Ye, X. Study on the chlorophyll a concentration retrieved from HY-1C satelite coastal zone imager data. Haiyang Xuebao 2022, 44, 25–34. (In Chinese) [Google Scholar] [CrossRef]
- Nieto, K.; Mélin, F. Variability of chlorophyll-a concentration in the Gulf of Guinea and its relation to physical oceanographic variables. Prog. Oceanogr. 2017, 151, 97–109. [Google Scholar] [CrossRef]
- Cai, L.; Tang, R.; Yan, X.; Zhou, Y.; Jiang, J.; Yu, M. The spatial-temporal consistency of chlorophyll-a and fishery resources in the water of the Zhoushan archipelago revealed by high resolution remote sensing. Front. Mar. Sci. 2022, 9, 1022375. [Google Scholar] [CrossRef]
- Tlusty, M.F.; Wikgren, B.; Lagueux, K.; Kite-Powell, H.; Jin, D.; Hoagland, P.; Kenney, R.D.; Kraus, S.D. Co-Occurrence Mapping of Disparate Data Sets to Assess Potential Aquaculture Sites in the Gulf of Maine. Rev. Fish. Sci. Aquac. 2018, 25, 409–420. [Google Scholar] [CrossRef]
- Zhang, M.; Wang, X.; Liu, C.; Cui, J.; Tian, Y.; Xu, X. Analysis of aquaculture safety in marine cage culture area of Maniao bay under the effect of typhoon. Appl. Ocean Res. 2024, 144, 103902. [Google Scholar] [CrossRef]
- Ji, D.; Li, M.; Wang, T.; Zhang, C.; Xu, Z.; Xu, W. Effects of Low Temperature Stress Periods on Serum Biochemical Indexes in Large Yellow Croaker Pseudosciaena crocea. Fish. Sci. 2009, 75, 227–233. [Google Scholar] [CrossRef]
- Zheng, J.L.; Wan, F.G.; Chen, Y.L.; Jiang, L.H.; Zhan, Q.H.; Chen, T.H.; Chen, S.; Zhu, Q.L.; Li, W.Y.; Liu, Y.F. Comparative study on the morphological characteristics, nutritional quality, and tastes of large yellow croaker from five cage culture areas: Relay farming improved fish quality. Aquaculture 2024, 590, 741030. [Google Scholar] [CrossRef]
- Ermgassen, P.S.E.Z.; Bonai, K.; Boudry, P.; Bromley, C.A.; Cameron, T.C.; Colsoul, B.; Coolen, J.W.P.; Franki, A.; Hancock, B.; Have, T.M.V.D. Forty questions of importance to the policy and practice of native oyster reef restoration in Europe. Aquat. Conserv. Mar. Freshw. Ecosyst. 2020, 30, 2038–2058. [Google Scholar] [CrossRef]
- Johansson, D.; Juell, J.E.; Oppedal, F.; Stiansen, J.E.; Ruohonen, K. The influence of the pycnocline and cage resistance on current flow, oxygen flux and swimming behaviour of Atlantic salmon (Salmo salar L.) in production cages. Aquaculture 2007, 272, 501–510. [Google Scholar] [CrossRef]
- Zong, H.; Xu, X.; Cui, L.; Chen, Y.; Shang, J.; Yuan, X. Study on ecological risk evaluation method of mariculture zones. Mar. Environ. Sci. 2022, 41, 915–920. (In Chinese) [Google Scholar] [CrossRef]
- Zhang, Y.; Li, M.F.; Fang, X.H. Efficiency Analysis of China Deep-Sea Cage Aquaculture Based on the SBM–Malmquist Model. Fishes 2023, 8, 529. [Google Scholar] [CrossRef]
- Lü, H.; Xu, J.; Haegen, G.V. Supplementing Marine Capture Fisheries in the East China Sea: Sea Ranching of Prawn Penaeus orientalis, Restocking of Large Yellow Croaker Pseudosciaena crocea, and Cage Culture. Rev. Fish. Sci. 2008, 16, 366–376. [Google Scholar] [CrossRef]
- Li, B.; Jin, X.; Yang, J.; Han, Z.; Su, F. Spatio-temporal evolution and influencing factors for marine fisheries industry ecosystem vulnerability in China. Acta Ecol. Sin. 2019, 39, 4273–4283. (In Chinese) [Google Scholar] [CrossRef]
- Li, J.; Chen, W.; Sun, X. The present and future of the European Copernicus Project. Satell. Appl. 2024, 3, 53–57. (In Chinese) [Google Scholar] [CrossRef]
- Li, G.; Yao, Z.; Hu, Y.; Lian, A.; Yuan, T.; Pang, G.; Huang, X. Deep Learning-Based Fish Detection Using Above-Water Infrared Camera for Deep-Sea Aquaculture: A Comparison Study. Sensors 2024, 24, 2430. [Google Scholar] [CrossRef]
- Zhang, L.; Zhen, X.; Duan, Q.; Huang, Y.; Chen, C.; Li, Y. Hydrodynamic Characteristics Analysis and Mooring System Optimization of an Innovative Deep-Sea Aquaculture Platform. J. Mar. Sci. Eng. 2023, 12, 972. [Google Scholar] [CrossRef]
- Zhao, Y.-P.; Liu, H.-F.; Bi, C.-W.; Cui, Y.; Guan, C.-T. Numerical study on the flow field inside and around a semi-submersible aquaculture platform. Appl. Ocean Res. 2021, 114, 102932. [Google Scholar] [CrossRef]
- Liu, H.F.; Zhao, T.H.; Liu, Y. Investigation on dynamic performance of semi-submersible aquaculture platform in two mooring forms. Ocean Eng. 2024, 297, 117092. [Google Scholar] [CrossRef]
- Liu, H.F.; Liu, Y. Numerical investigation on the dynamic response of the semi-submersible aquaculture platform in regular waves. Ocean Eng. 2024, 294, 116718. [Google Scholar] [CrossRef]
- Ding, W.W.; Jiang, J.Q.; Yue, W.Z.; Li, Y.Z.; Wang, W.S.; Sheng, S.W.; Chen, M. Numerical Study on Hydrodynamic Performance of a New Semi-Submersible Aquaculture Platform. Appl. Sci. 2023, 13, 12652. [Google Scholar] [CrossRef]
- Yue, W.; Wang, W.; Sheng, S.; Ye, Y.; Hong, T. Analysis of the wave load and dynamic response of a new semi-submersible wave-energy-powered aquaculture platform. Ocean Eng. 2022, 248, 110346. [Google Scholar] [CrossRef]
- Liu, H.-F.; Bi, C.-W.; Xu, Z.; Zhao, Y.-P. Hydrodynamic assessment of a semi-submersible aquaculture platform in uniform fluid environment. Ocean Eng. 2021, 235, 109656. [Google Scholar] [CrossRef]
- Chatziantoniou, A.; Spondylidis, S.C.; Zachou, O.S.; Papandroulakis, N.; Topouzelis, K. Dissolved oxygen estimation in aquaculture sites using remote sensing and machine learning. Remote Sens. Appl. Soc. Environ. 2022, 28, 100865. [Google Scholar] [CrossRef]
- Gernez, P.; Palmer, S.C.J.; Thomas, Y.; Forster, R. Editorial: Remote Sensing for Aquaculture. Front. Mar. Sci. 2021, 7, 638156. [Google Scholar] [CrossRef]
- Xu, S.; Shi, S.; Li, L.; Tian, X.; Gao, Q.; Dong, S. Effects of deep-sea cage culture on water quality and stable carbon and nitrogen isotopes of suspended particulate organic matter in the Yellow Sea Cold Water Mass. Mar. Pollut. Bull. 2024, 209, 117099. [Google Scholar] [CrossRef]
- Kayode-Afolayan, S.D.; Ahuekwe, E.F.; Nwinyi, O.C. Impacts of pharmaceutical effluents on aquatic ecosystems. Sci. Afr. 2022, 17, 01288. [Google Scholar] [CrossRef]
- Jiang, H.Z.; Ji, Y.; Zhang, M. Modeling impact of culture facilities on hydrodynamics and solute transport in marine aquaculture waters of North Yellow Sea. Water Sci. Eng. 2023, 16, 26–35. [Google Scholar] [CrossRef]
- Li, X.; Han, G.; Yang, J.; Wang, C. Remote Sensing Analysis of Typhoon-Induced Storm Surges and Sea Surface Cooling in Chinese Coastal Waters. Remote Sens. 2023, 15, 1844. [Google Scholar] [CrossRef]
- Liu, X.; Zhang, Y.; Liang, C.; Cheng, B.; Yang, Y.; Huang, W.; Jia, N. Storm Surge Damage Interpretation by Satellite Imagery: Case Review. Remote Sens. 2021, 13, 746. [Google Scholar] [CrossRef]
Disclaimer/Publisher’s Note: The statements, opinions and data contained in all publications are solely those of the individual author(s) and contributor(s) and not of MDPI and/or the editor(s). MDPI and/or the editor(s) disclaim responsibility for any injury to people or property resulting from any ideas, methods, instructions or products referred to in the content. |
© 2024 by the authors. Licensee MDPI, Basel, Switzerland. This article is an open access article distributed under the terms and conditions of the Creative Commons Attribution (CC BY) license (https://creativecommons.org/licenses/by/4.0/).