1. Introduction
Marine gravity anomalies are widely used in both military and scientific fields. In the military, marine gravity anomalies refer to the basic information of the naval battlefield environment, which can be used for the flight trajectory correction of strategic missiles and the gravity-matching underwater navigation of submarines [
1,
2,
3,
4,
5]. In the scientific realm, marine gravity anomalies can be used to determine the shape and internal structure of the Earth and delineate deep-sea oil and gas, as well as solid mineral resources such as hydrothermal sulfides and nodules on the seabed [
6,
7,
8,
9,
10]. Marine gravimeters are the main tools for acquiring marine gravity anomalies using moving-based platforms, and they have proven to be the primary technique for efficiently obtaining medium- to short-wavelength gravity anomalies [
4,
11].
At present, different marine gravimeters of varying measurement principles are widely used around the world, such as two-axis stable platform gravimeter systems, including L&R (Micro-g LaCoste, Lafayette, CO, USA), MGS-6 (Micro-g LaCoste), DGS (Dynamic Gravity System), ZLS (ZLS Corporation, Austin, TX, USA), KSS-31M (Bodenseewerk), CHZ-II (Innovation Academy for Precision Measurement Science and Technology, CAS), and ZL11-1A (Tianjin Navigation Instrument Research Institute, Tianjin, China); gimbaled inertial navigation gravimeter systems, including GT-2M (Canadian Micro Gravity, Canada), MarineGrav (Sander Geophysics Ltd., Ottawa, ON, Canada), BGM3 (Bell Aerospace, Buffalo, NY, USA), and Chekan-AM (Central Scientific Electrical Research Institute of Russia, Moscow, Russia); and strapdown gravimeter systems, including SAG-2M (Beijing Institute of Aerospace Control Devices, Beijing, China) and SGA-WZ (National University of Defense Technology, Changsha, China) [
12,
13,
14,
15,
16,
17,
18,
19]. They all show different precision levels in real applications.
The performance evaluation of shipborne/airborne gravimeters is mainly achieved through synchronized comparison tests on the same platform, and their precision is validated with their crossover points and repeat lines. Studinger et al. [
20] evaluated the relative performance and suitability of the airborne gravimeters AIRGrav and GT-1A compared to BGM-3 and L&R during a flight test over the Canadian Rocky Mountains near Calgary. They showed that AIRGrav and GT-1A could achieve higher resolution and precision than the others. Forsberg et al. [
21] compared the gravimeters L&R and Chekan-AM in Nepal and found that these two systems could obtain good agreement as a result. Ouyang et al. [
22] tested five sea–air gravimeters of four different types equipped onboard the same Y-8 fixed-wing aircraft using their repeat lines and crossover points, which showed that the airborne gravimeter GT-1A from Russia had the best technical index of comprehensive performance. Zhang et al. [
23] tested the gravimeters GT-2M, KSS-31M, and ZLS in the same vessel and found that the results of the three marine gravimeters were quite different when the vessel speed and heading changed or if they were under adverse sea conditions, with the gravimeter GT-2M achieving the highest precision. Through a comprehensive analysis, the gravimeter GT-2M by Canadian Micro Gravity was recognized as the best, achieving the highest precision result in the same measuring environment. Wang et al. [
16] compared the gravimeters SAG-2M and L&R on the same vessel in the South China Sea. Their results showed that the leveled root mean square (RMS) of the crossover points of SAG-2M was 0.69 mGal, better than the value of 0.95 mGal found for L&R. Yuan et al. [
11] validated the performance of the marine gravimeters CHZ-II, ZL11-1A, SGA-WZ, and SAG-2M by comparing them with the widely used commercial gravimeters GT-2M (No. 39) and L&R (No. S129). The results showed that all six gravimeters could meet the precision requirement of their marine gravity survey. Meanwhile, the precision results of the gravimeters CHZ-II, ZL11-1A, SGA-WZ, and SAG-2M could approach the precision of the GT-2M gravimeter, higher than the precision of the L&R gravimeter. However, all of the abovementioned synchronized comparison tests were carried out in different places to estimate the performance of different marine gravimeters, lacking a standard test site.
However, several test sites have been established to estimate the performance of airborne gravimeters and airborne gravity gradiometers. The Kauring test site was established near Perth to allow interested individuals and organizations to compare airborne gravity and airborne gravity gradiometer data with the detailed ground gravity data (or products derived from these data) to validate their performance [
24,
25,
26,
27,
28,
29,
30]. In 2020, an airborne gravity gradient test site was established using the same method as the Kauring test site at the Weishan Volcano area in Wudalianchi, Heilongjiang Province, China [
31,
32,
33,
34]. The company Sander Geophysics established an airborne gravity test site to the east of Ottawa, with the “air truth” free air gravity anomaly of a repeat line being measured more than 100 times to quantify the precision of the AIRGrav gravimeter [
35].
Therefore, in order to establish a marine gravimeter test site, in this study, the shipborne gravity round-trip data, measured three times, obtained from a total of 12 widely used marine gravimeters of eight different types used in the north of the South China Sea were used to establish the “air truth” free air gravity anomaly as a standard to quantify the performance of different kinds of new marine gravimeters.
2. Method of Establishing “Air Truth” Free Air Gravity Anomaly
Although measured gravity anomalies are filtered using a low-pass filter, some residual noise remains. An accurate understanding of the noise characteristics of a measured gravity anomaly after zero drift correction, Eötvös correction, and normal gravity correction, i.e., the free air gravity anomaly, is important to establish the “air truth” free air gravity anomaly as a standard for estimating the performance of different gravimeters. Therefore, the corrected free air gravity anomaly can be the sum of the standard free air gravity anomaly and the residual noise:
where
is the measured free air gravity anomaly of the
th point of the
th measure of the repeat line;
is the standard free air gravity anomaly of the
th point; and
is the residual noise of
th point of the
th measure of the repeat lines.
Green and Lane [
36] provided an alternative method to compute the three averages over lines, locations, and both together, as follows:
Then, the residual noise can be calculated by
that is independent of ground response terms. If we have enough samples, we might expect that the averages of these noise terms to be zero, and thus, the residuals become estimates for the noise. We can obtain
After the residual noise is removed, we can use the separated free air gravity anomaly to establish the standard “air truth” free air gravity anomaly value to validate the performance of different gravimeters.
In order to evaluate the precision of the free air gravity anomaly, the root mean square error (RMSE), standard deviation (STD), and correlation coefficient (CC) of the repeat lines are used as the main technology specifications to determine the precision and consistency of the gravity anomaly before and after the residual noise has been removed [
37,
38].
For the multi-measured repeat line, we use a combination of any two of the repeat times to estimate the RMS precision, which can reflect the reliability and stability of the gravimeter more comprehensively. The RMS of any two repeat lines can be calculated using Equations (7) and (8).
where
is the difference between the two measurement values
and
in the repeat line
, and
is the number of observed points in each repeat line.
The STD of the repeat line can be calculated using Equation (9).
3. Data Source
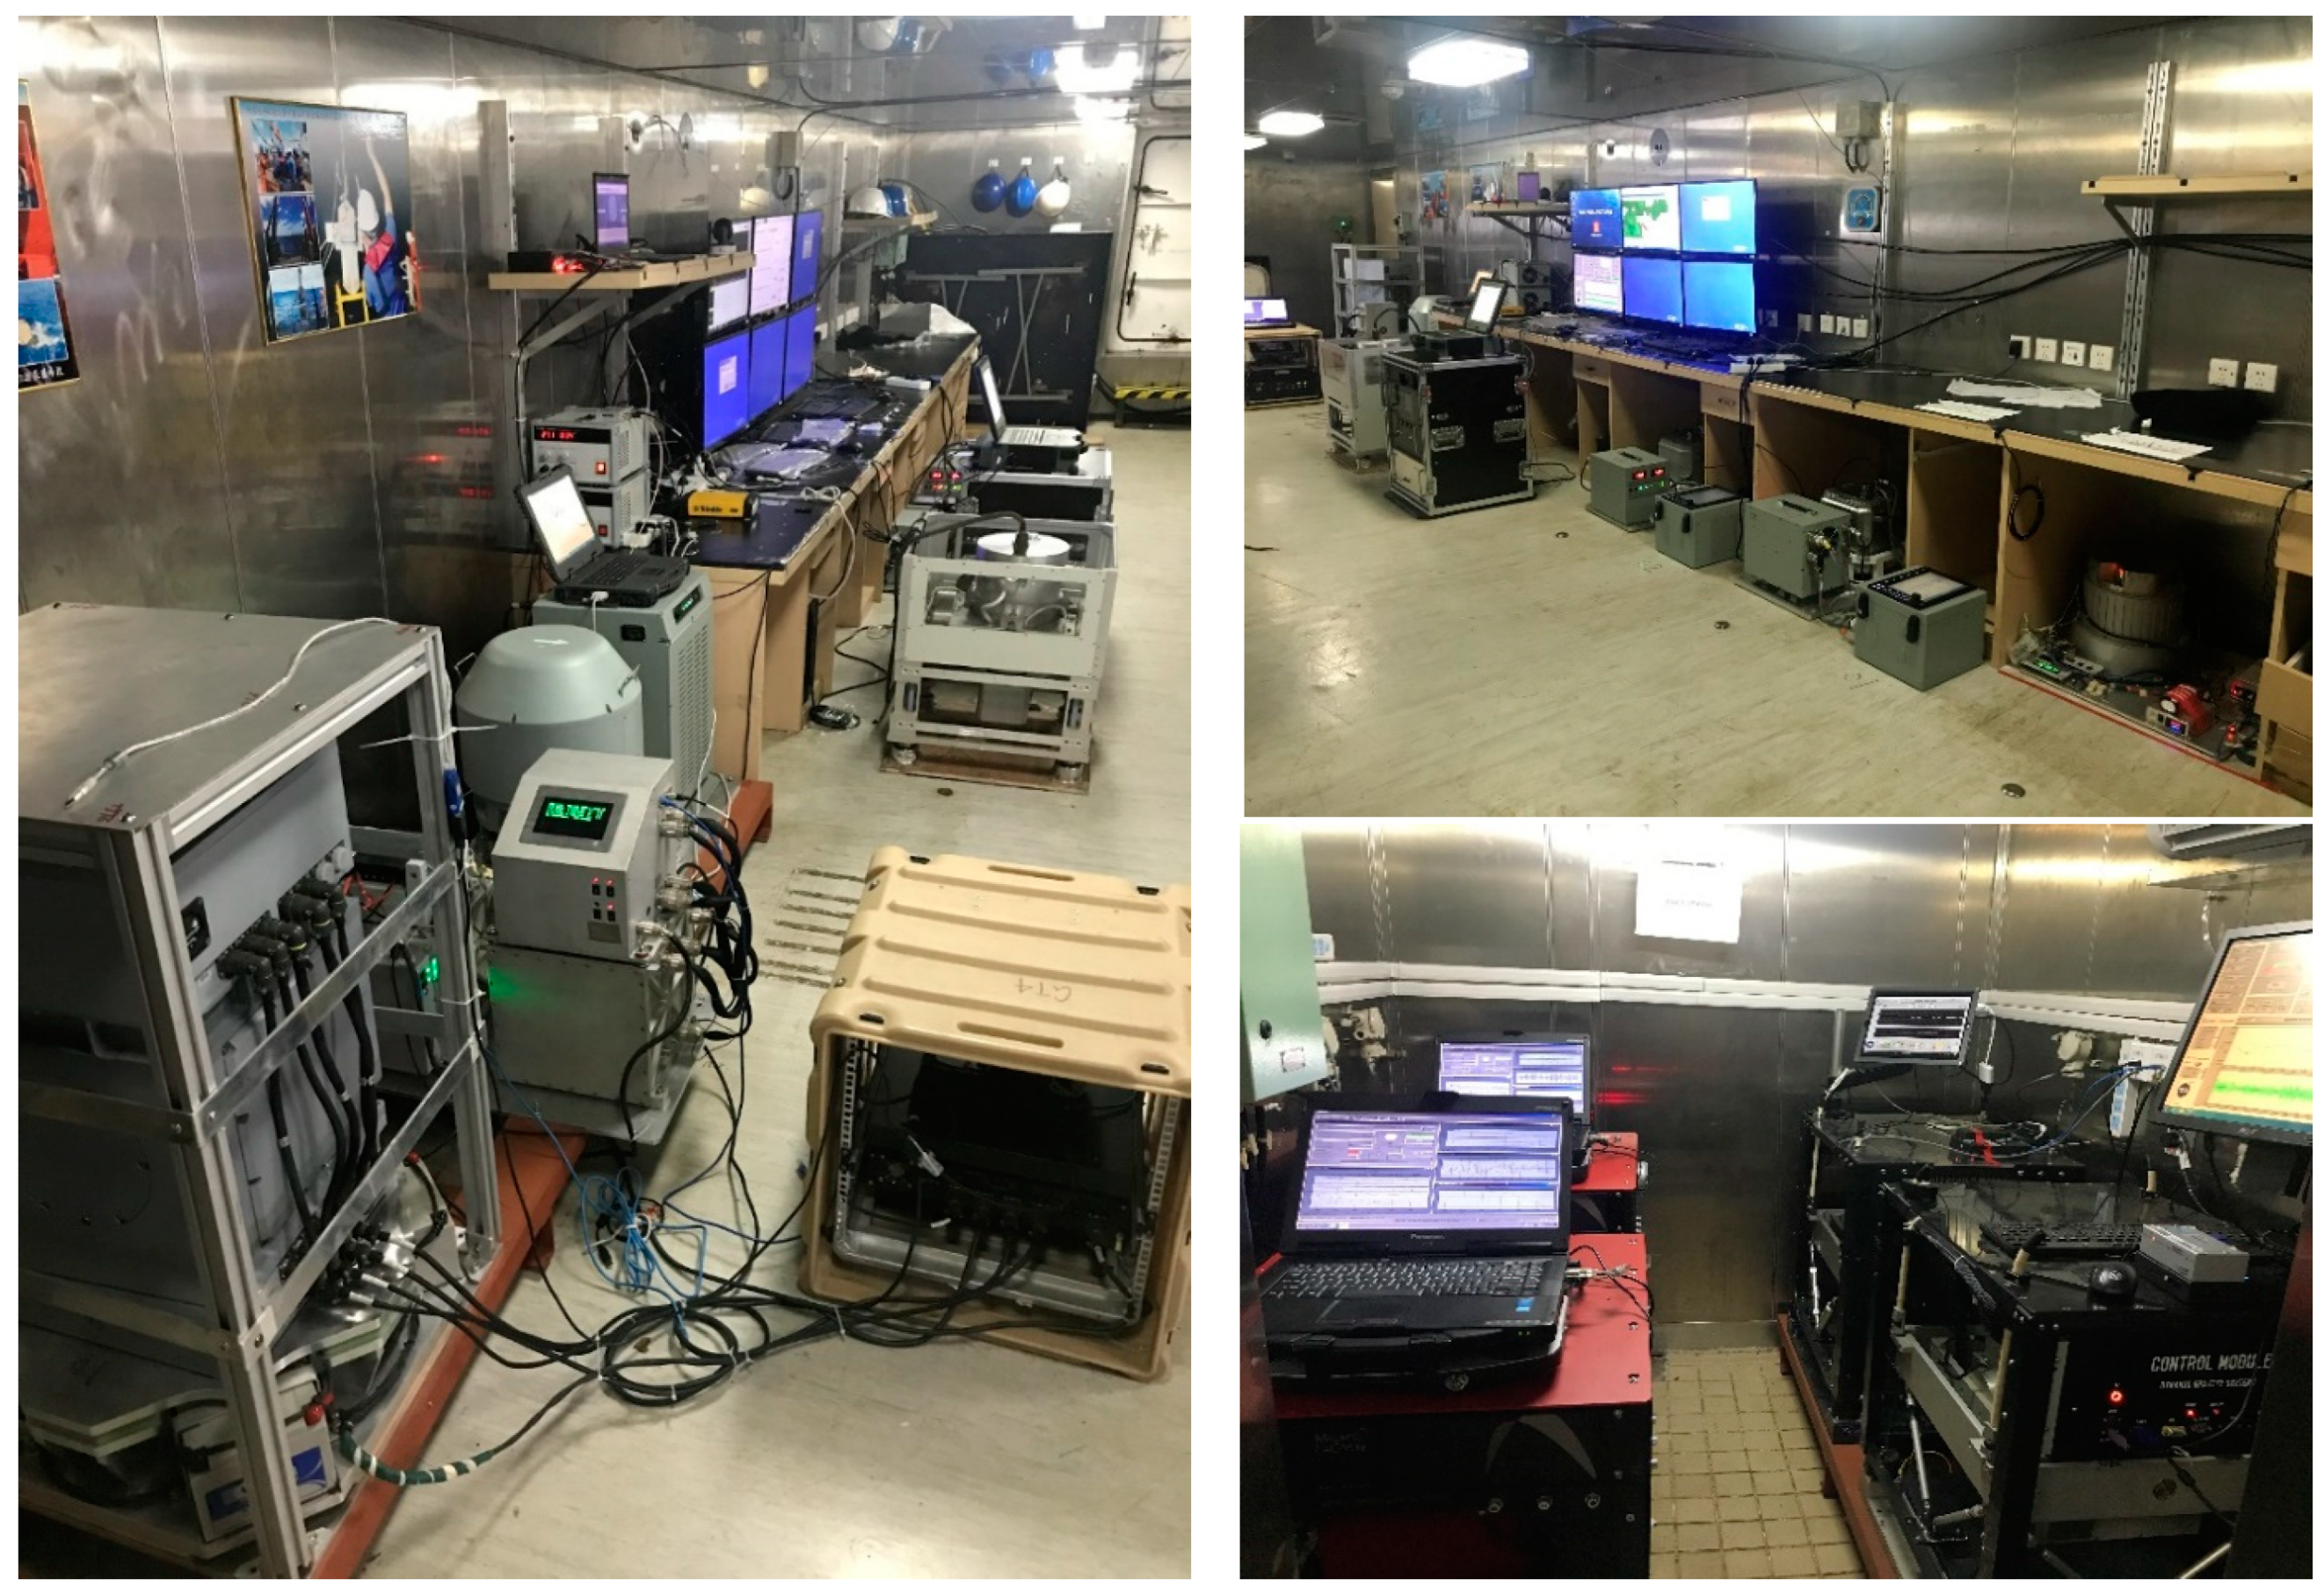
Between 4 June 2018 and 25 June 2018, the acquisition of synchronous gravity data was carried out in the north of South China Sea using a total of 12 widely used marine gravimeters of eight types, including GT-2M (No. 039), L&R (No. S129), MAG-6, DGS, SAG-2M, SGA-WZ, CHZ-II, and ZL11-1A, arranged on the same vessel, R/V Xiangyanghong No. 06 (
Figure 1).
The gravimeters were all installed along the central axis of the middle part of the vessel, which is the most stable area. The maximum deviation distance from the central axis does not exceed 5 m. During the surveying, the navigation positioning data for all of the gravimeters came from the same GNSS (Global Navigation Satellite System) receiver, SF3050, installed on the top of the vessel to avoid signal blocking. A vessel coordinate system was established to correct the lever-arm effects of the different gravimeters to allow the position of the GNSS to coincide exactly with the position of the gravimeters [
39]. The position coordinates of the gravimeters and the GNSS are shown in
Table 1. The survey lasted 22 days at an average sailing speed of 10 knots. We completed 13 effective gravity profiles, shown in
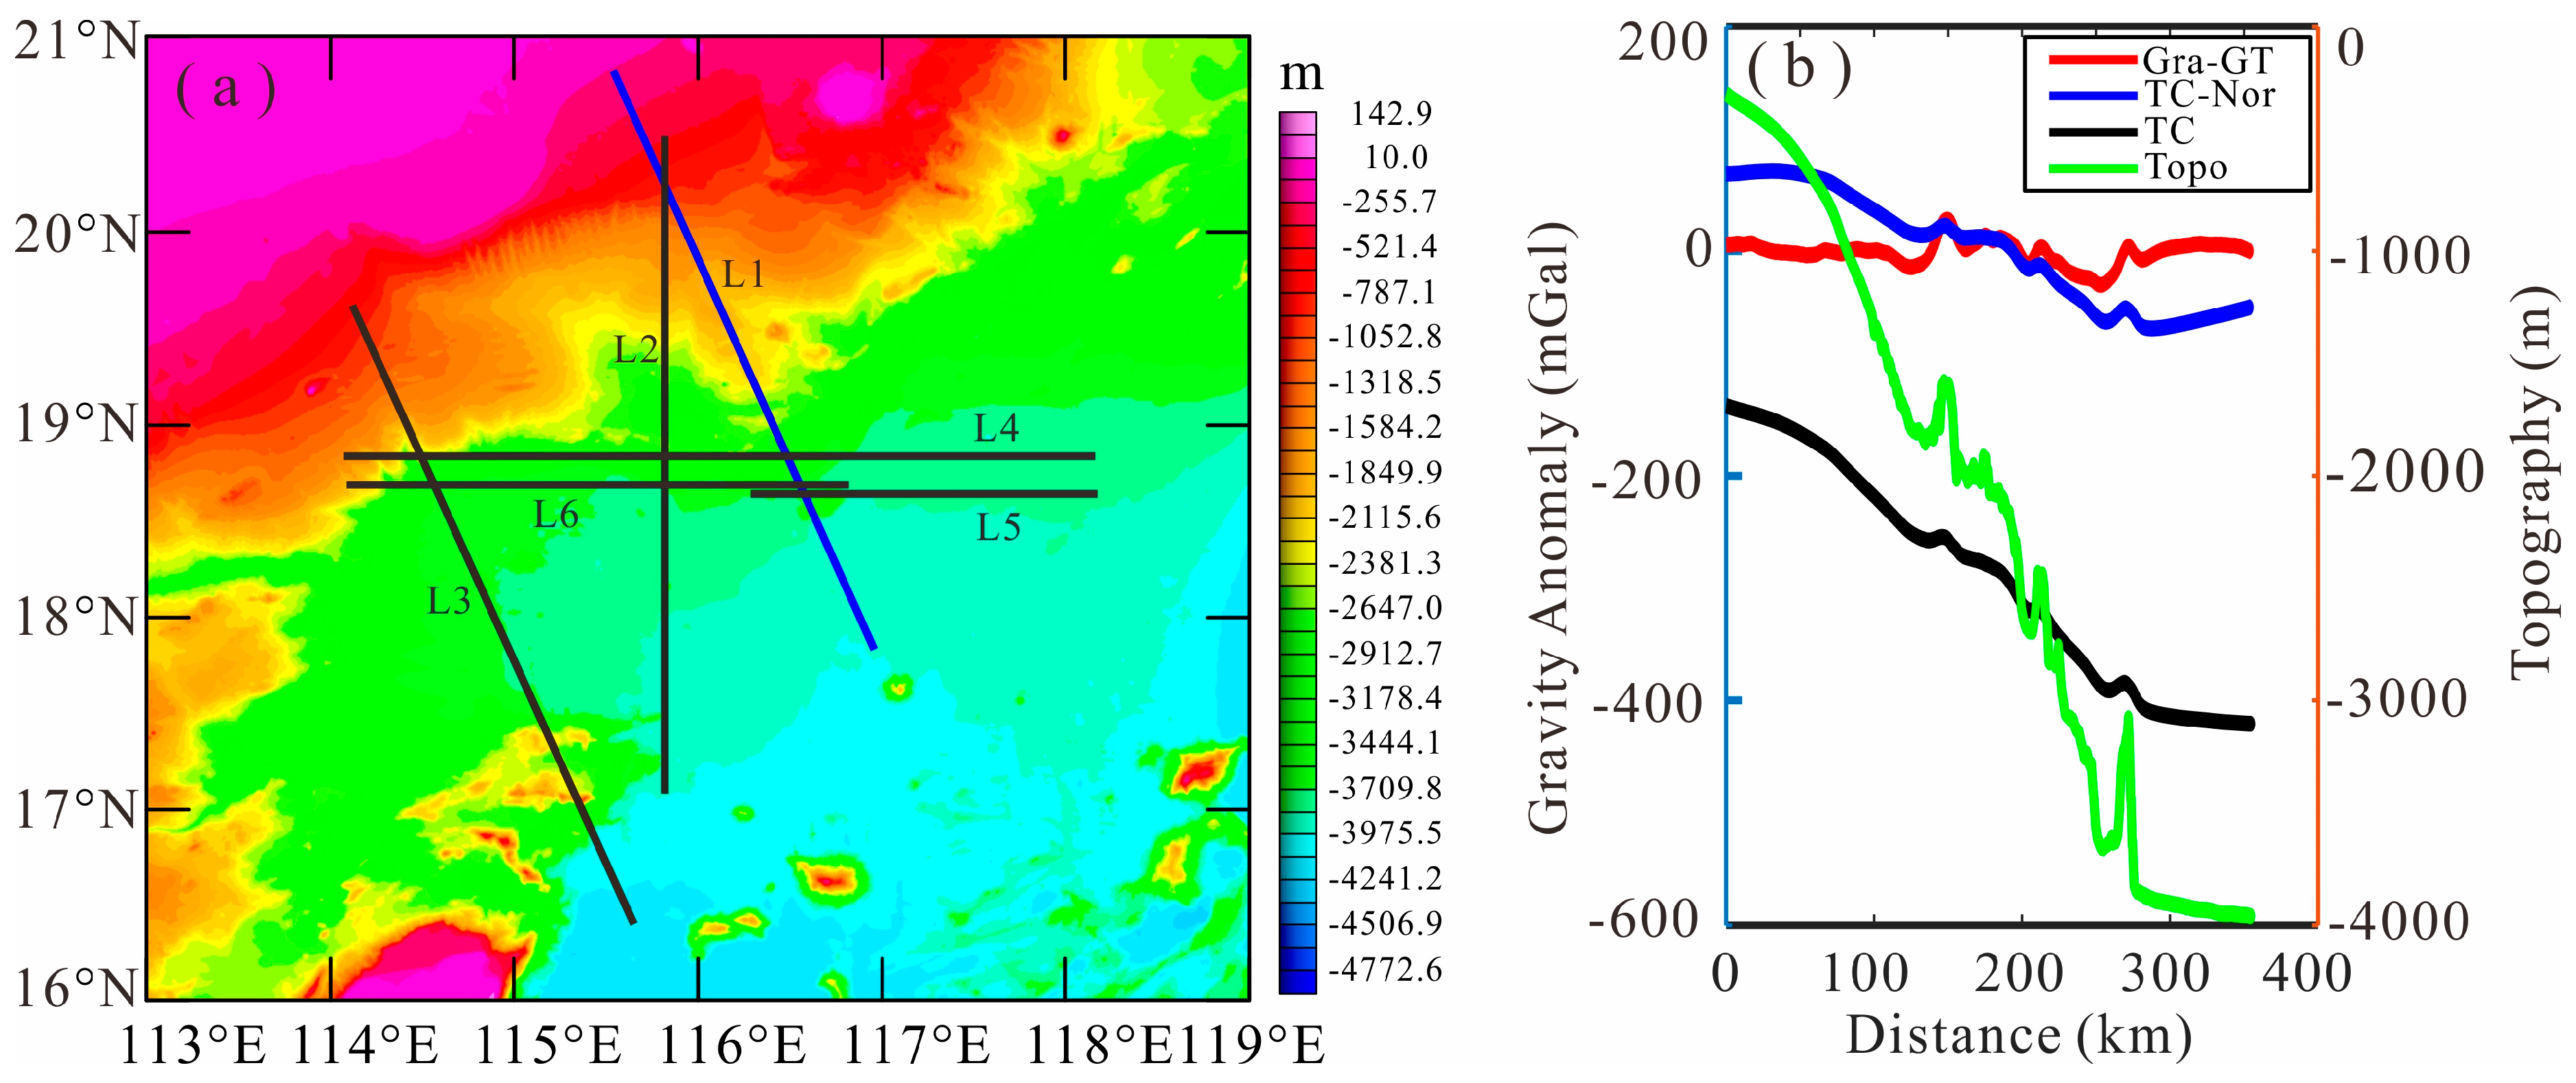
Figure 2a, with lines L1, L2, and L3 being round-trip-measured three times and line L6 two times, and 39 crossover points were obtained.
In order to validate the resolution of the measured gravity anomaly, we compared the measured free air gravity anomaly with the forward gravity anomaly of the seafloor topography. High-resolution multi-beam bathymetric data were used to calculate the gravity anomaly affected by topography in the spherical coordinate system [
40] and were then compared with the measured free air gravity anomaly of GT-2M, shown in
Figure 2b, where the red line is the gravity measured by GT-2M; the green line is the submarine topography; the black line is the gravity of the topography; and the blue line is the gravity of the topography after the removal of the attraction of the reference ellipsoid and the mean value. We can see that the measured free air gravity anomaly has higher spatial resolution and more obvious amplitude characteristics than the gravity anomaly affected by topography. Therefore, we only used the measured gravity anomaly to construct the “air truth” gravity anomaly of the test site without merging the forward gravity anomaly of the topography.
4. Establishing the “Air Truth” Free Air Gravity Anomaly in the South China Sea
Due to the influence of ocean swell, ship speed, and pilot operation, it is impossible to completely fit the track lines of repeated measurements for each survey line, and the intervals of adjacent sampling points are not the same. Therefore, in order to establish the sea gravity comparison field standard survey line, a resampled standard straight line with an interval value of 5 m was established.
Yuan et al. [
11] demonstrated that the GT-2M, SAG-2M, and ZL11-1A gravimeters can achieve the best performance in rough seas with the minimum RMS, systematic deviation (SD), and mean error (ME) in the statistic errors of the repeat lines with a combination of two repeated times with different gravimeters and crossover points, respectively, and an RMS precision less than 0.5 mGal. However, the authors did not estimate the external consistency between the studied gravimeters. In order to do this, we statistically analyzed the RMS, STD, and CC of a combination of two of the repeated measurements from GT-2M, SAG-2M, and ZL11-1A on the repeat line L1, as shown in
Table 2,
Table 3 and
Table 4.
From
Table 2, it can be seen that the internal consistency RMS errors of GT-2M and SAG-2M measured on repeat line L1 are smaller than 0.2 mGal, and the internal consistency RMS error of ZL11 is smaller than 0.5 mGal. The RMS error between any pair of gravimeter measurements from the GT-2M, SAG-2M, and ZL11-1A gravimeter measurements on repeat line L1 is smaller than 0.5 mGal.
From
Table 3, we can see that the STDs between any pair of three repeated measurements on line L1 of GT-2M and SAG-2M and the first measurement of ZL11-1A are smaller than 0.2 mGal. However, the STD between the second and the third time measurement for ZL11-1A and any time measurement for GT-2M, SAG-2M, and ZL11-1A is larger than 0.2 mGal, and the maximum STD is 0.45 mGal. Therefore, we can conclude that the three repeated measurements from GT-2M and SAG-2M and the first time measurement have good consistency, with good data quality. The data quality of the second and the third time measurements from ZL11-1A is relatively poor.
CC is another index that can be used to evaluate the quality of the repeated measurement of different gravimeters. From
Table 4, we can see that the CC between all of the repeated measurements from different gravimeters is larger than 0.998, which indicates that all of the repeated measurements have good consistency. However, the CC between the second and the third time measurement from ZL11-1A and any time measurement from GT-2M, SAG-2M, and ZL11-1A is smaller overall than the others. Similarly, we can conclude that the data quality of the second and the third time measurements from ZL11-1A is relatively poor. The statistical results shown in
Table 2,
Table 3 and
Table 4 indicate that due to the environment effect and the system noise, the repeated measurements from all of the gravimeters have some residual error.
In order to establish the “air truth” free air gravity anomaly to validate the performance of the different gravimeters, the residual noise and the separated standard free air gravity anomaly of each measurement on the repeat lines obtained from the different gravimeters should be separated using the method described in
Section 2.
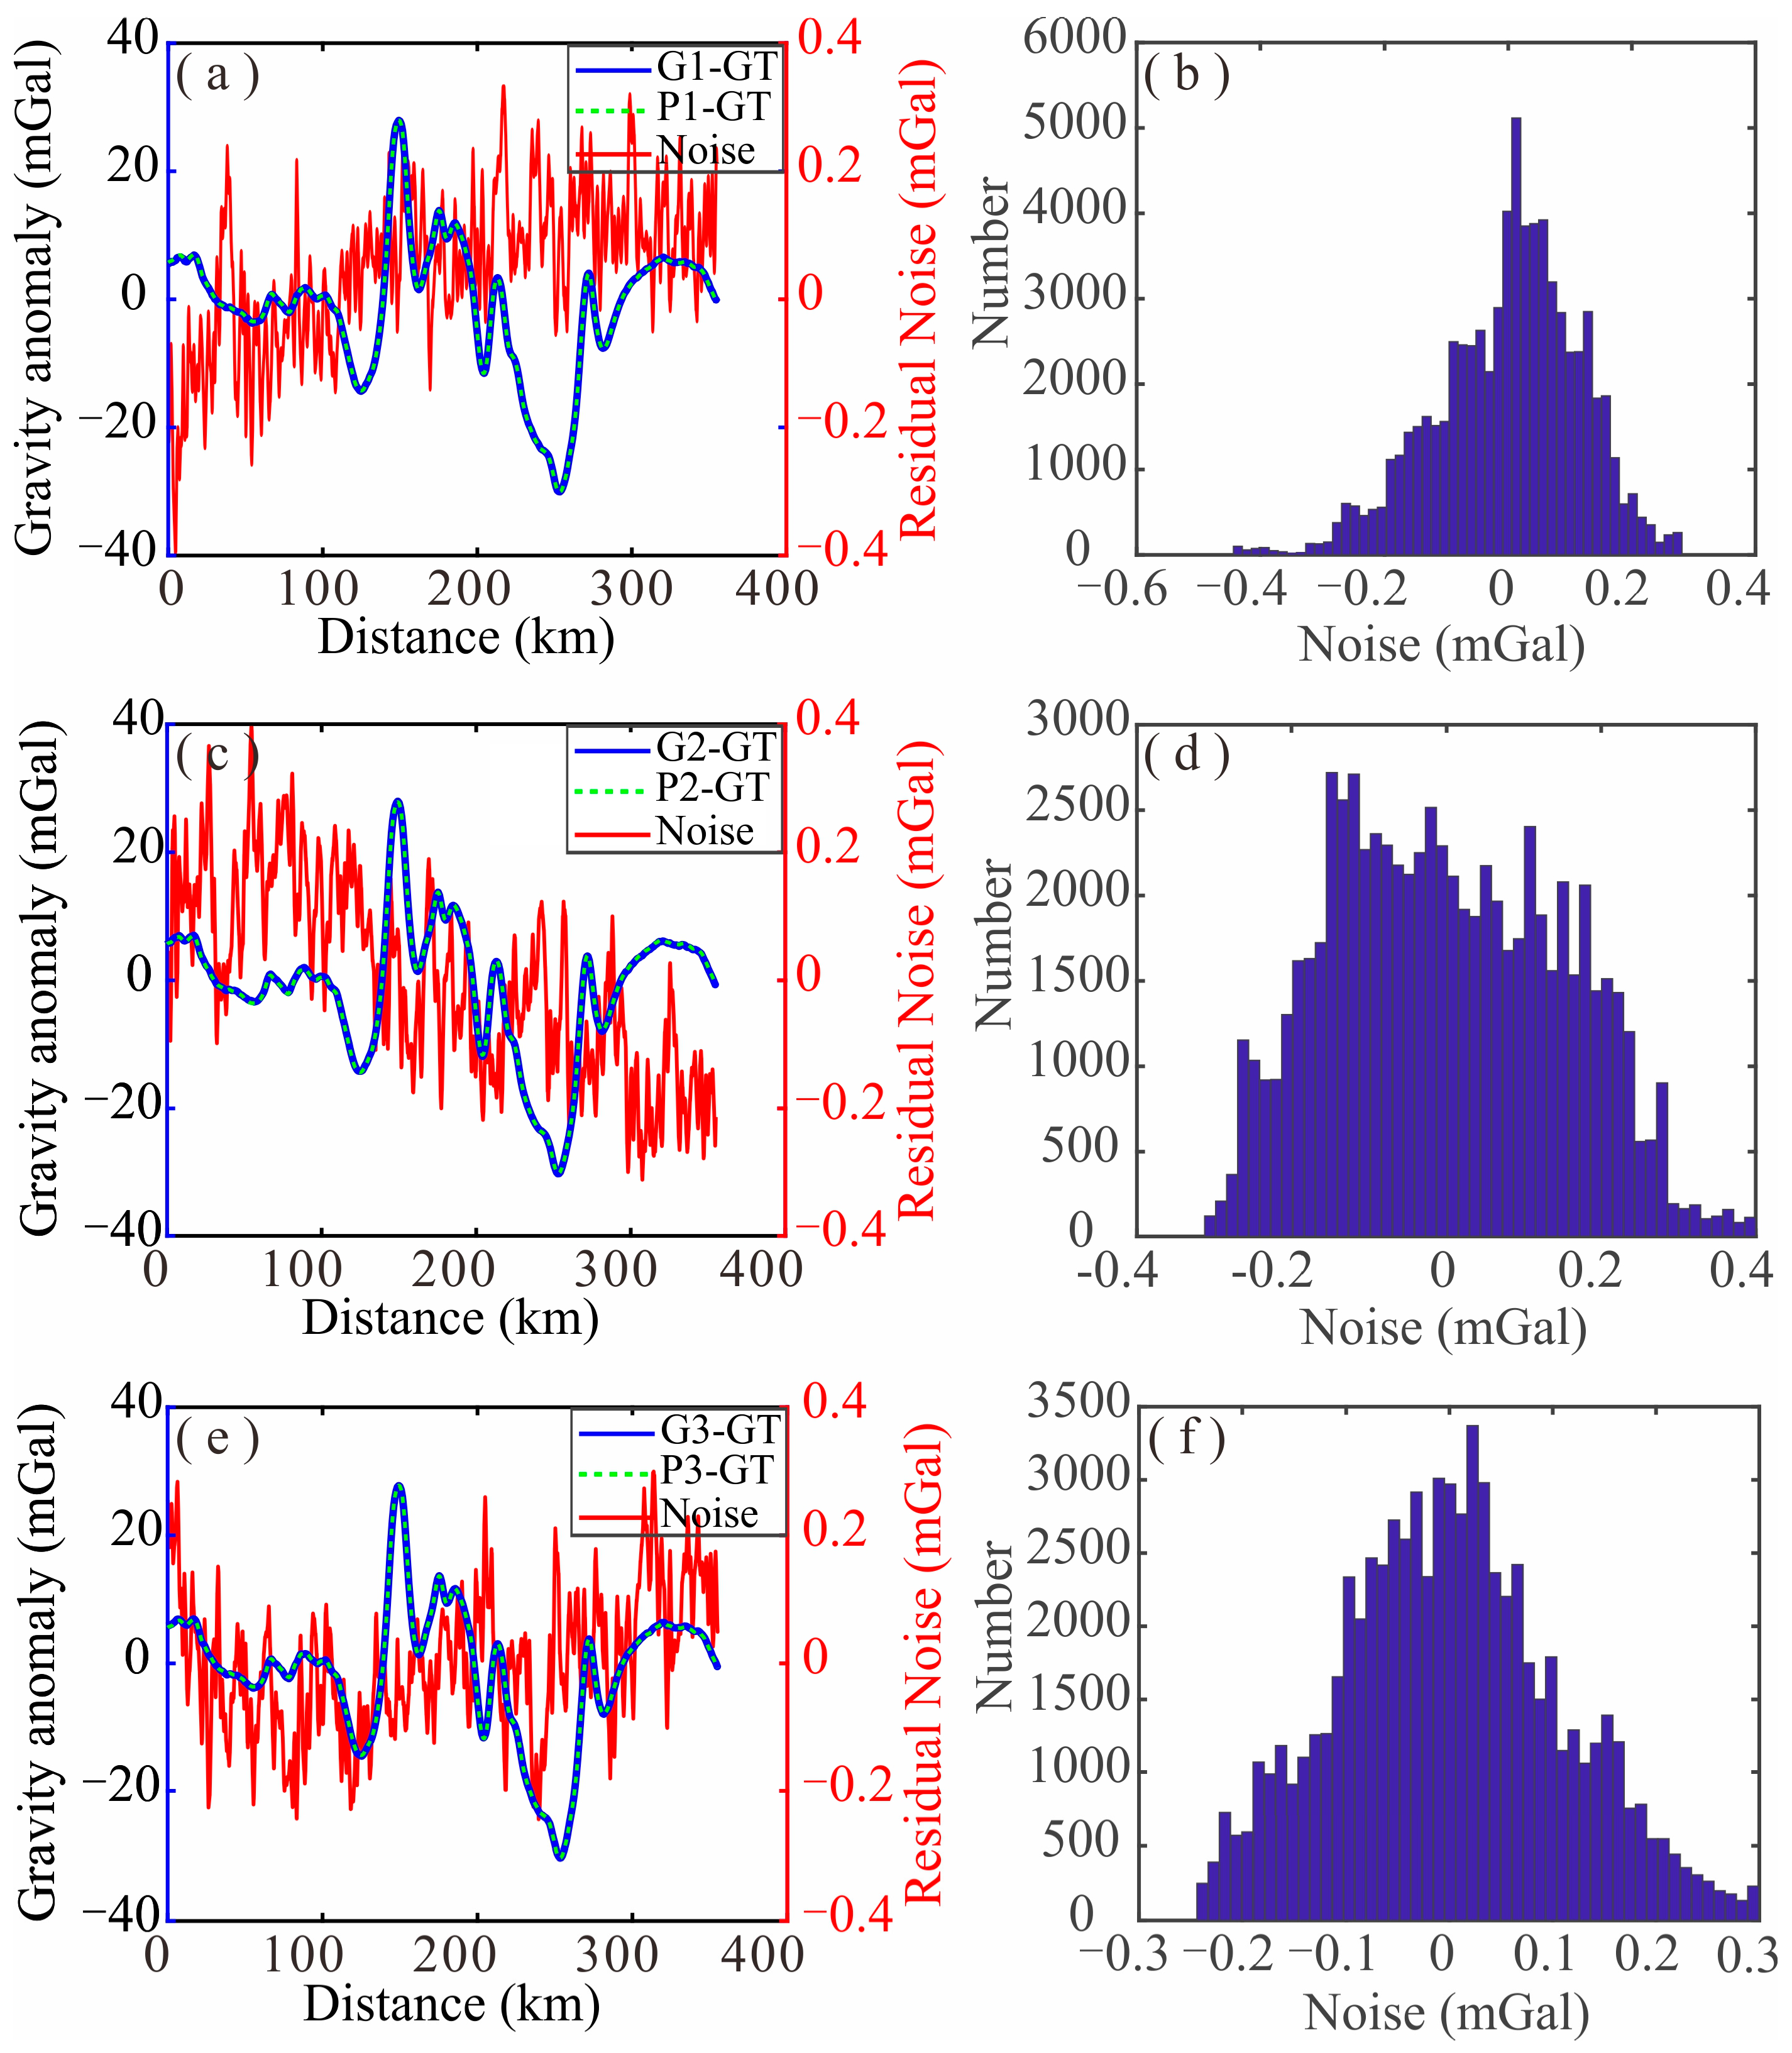
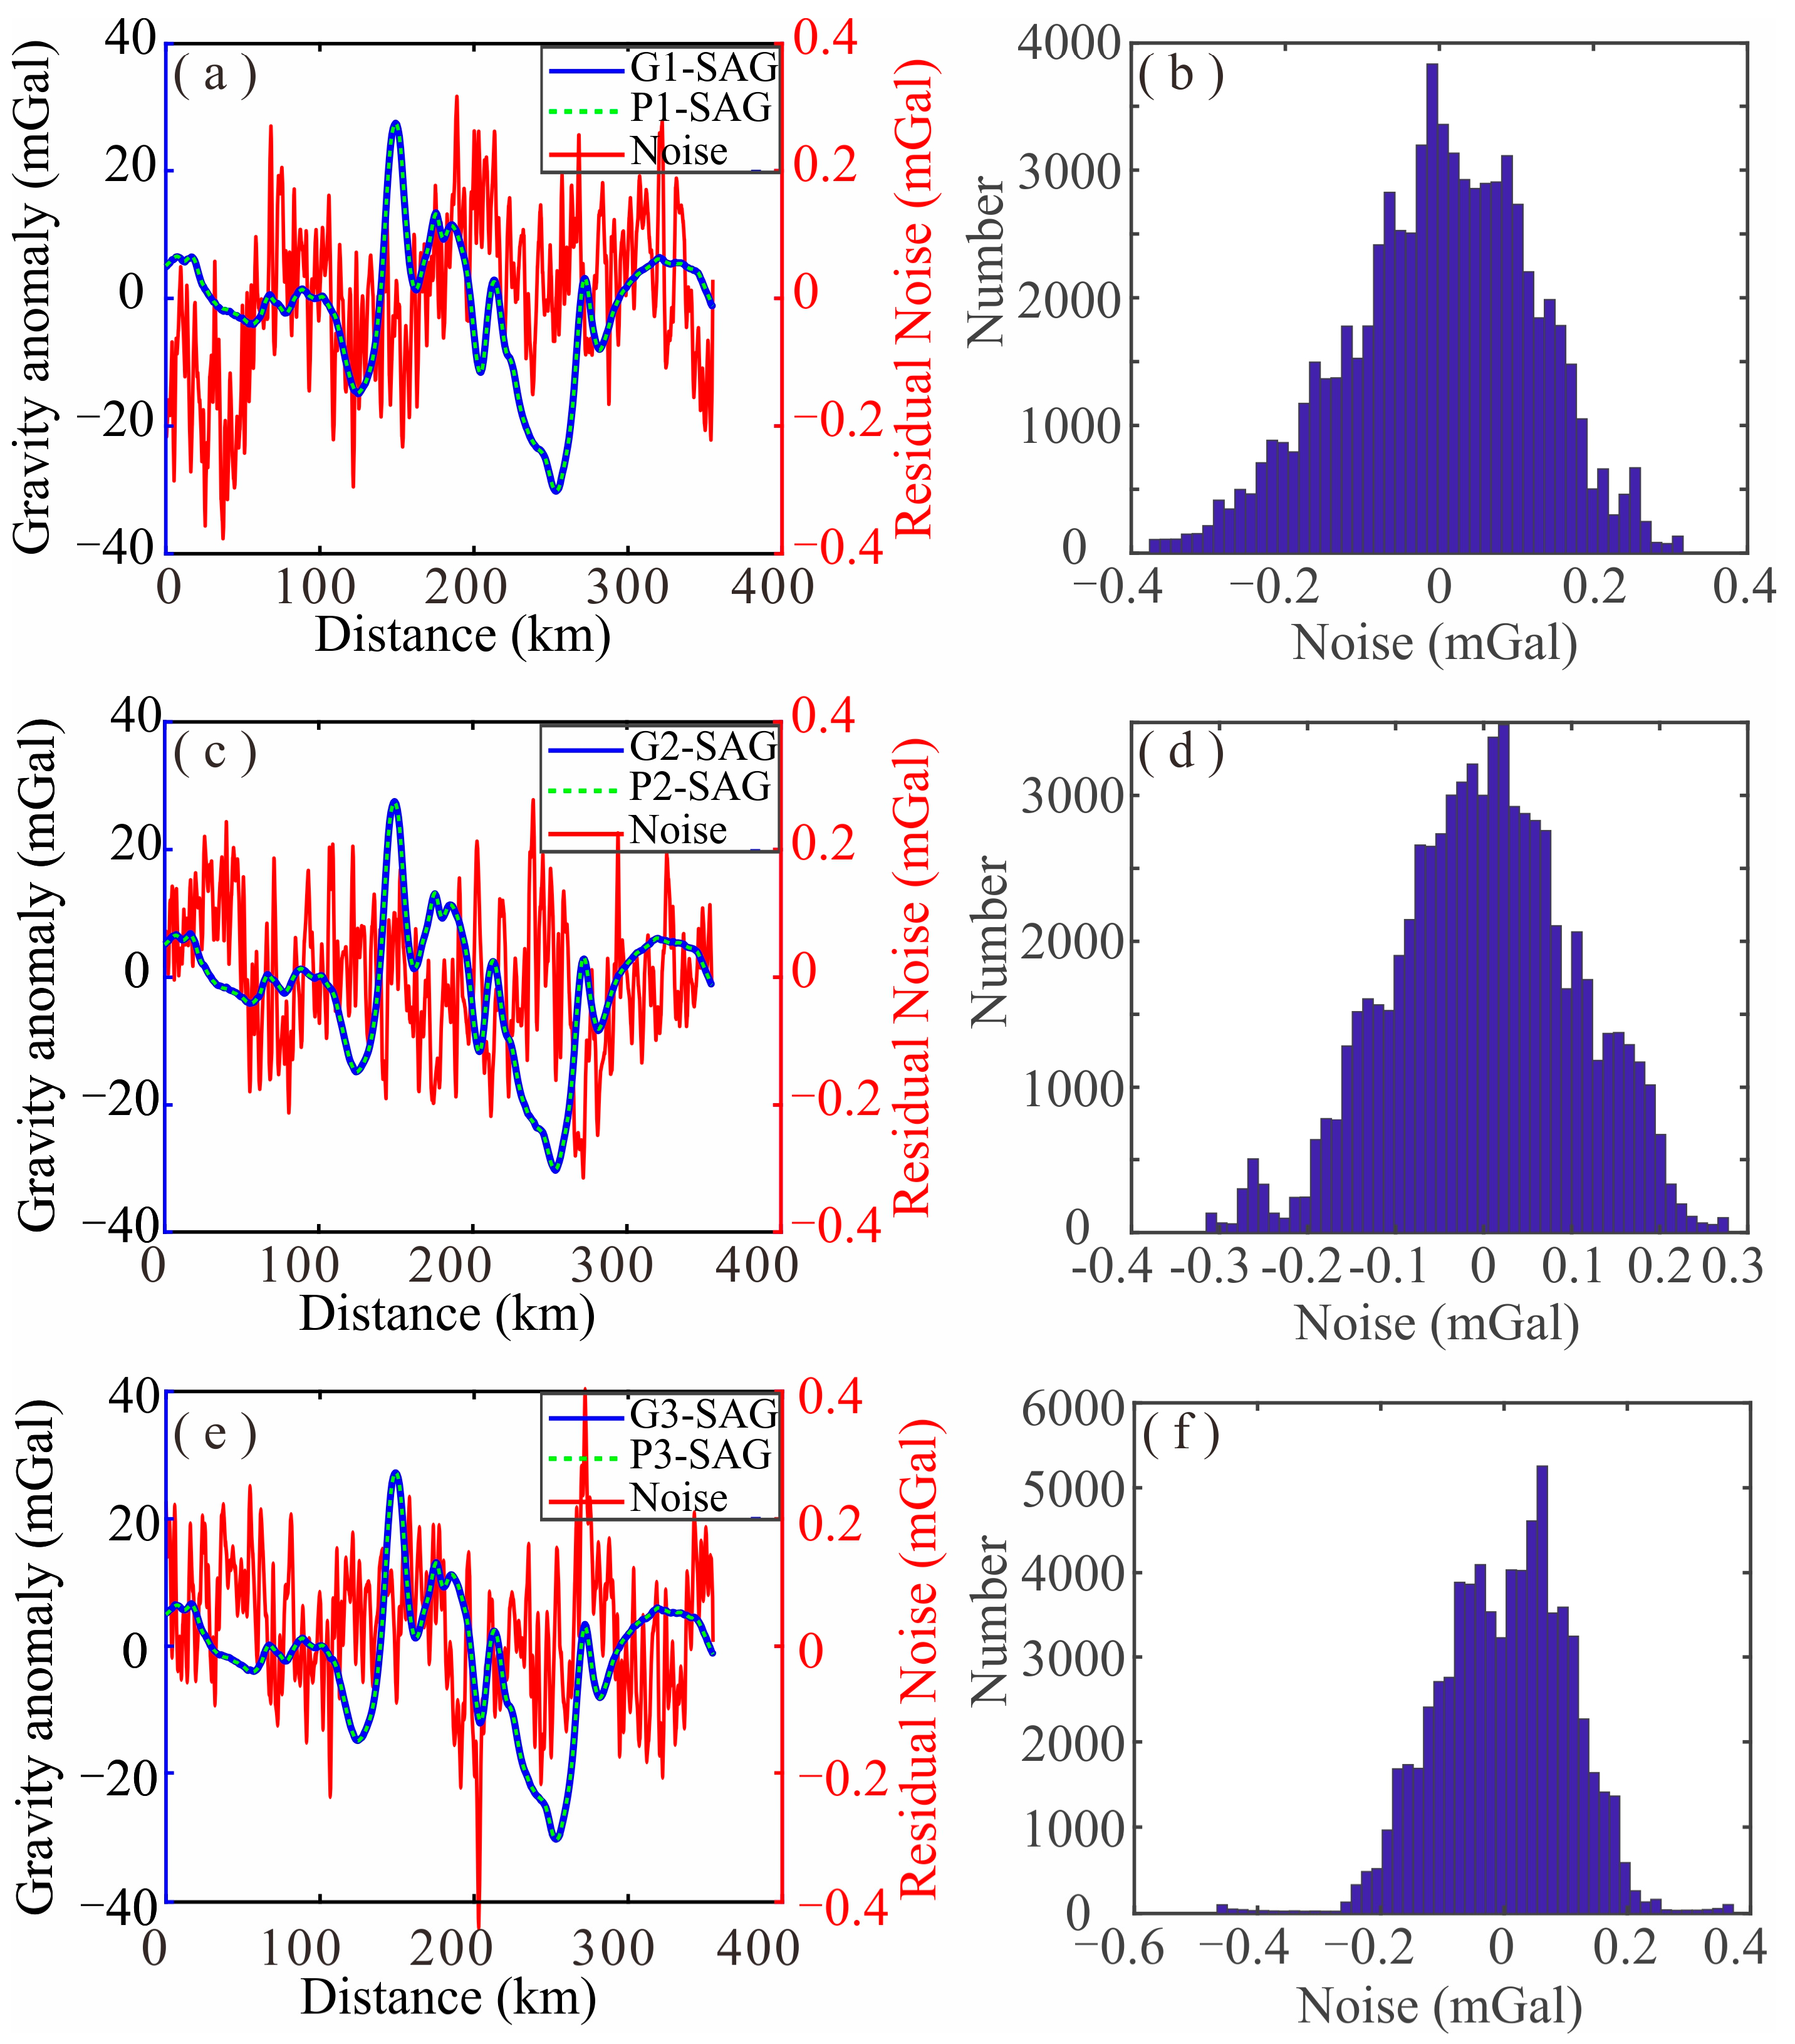
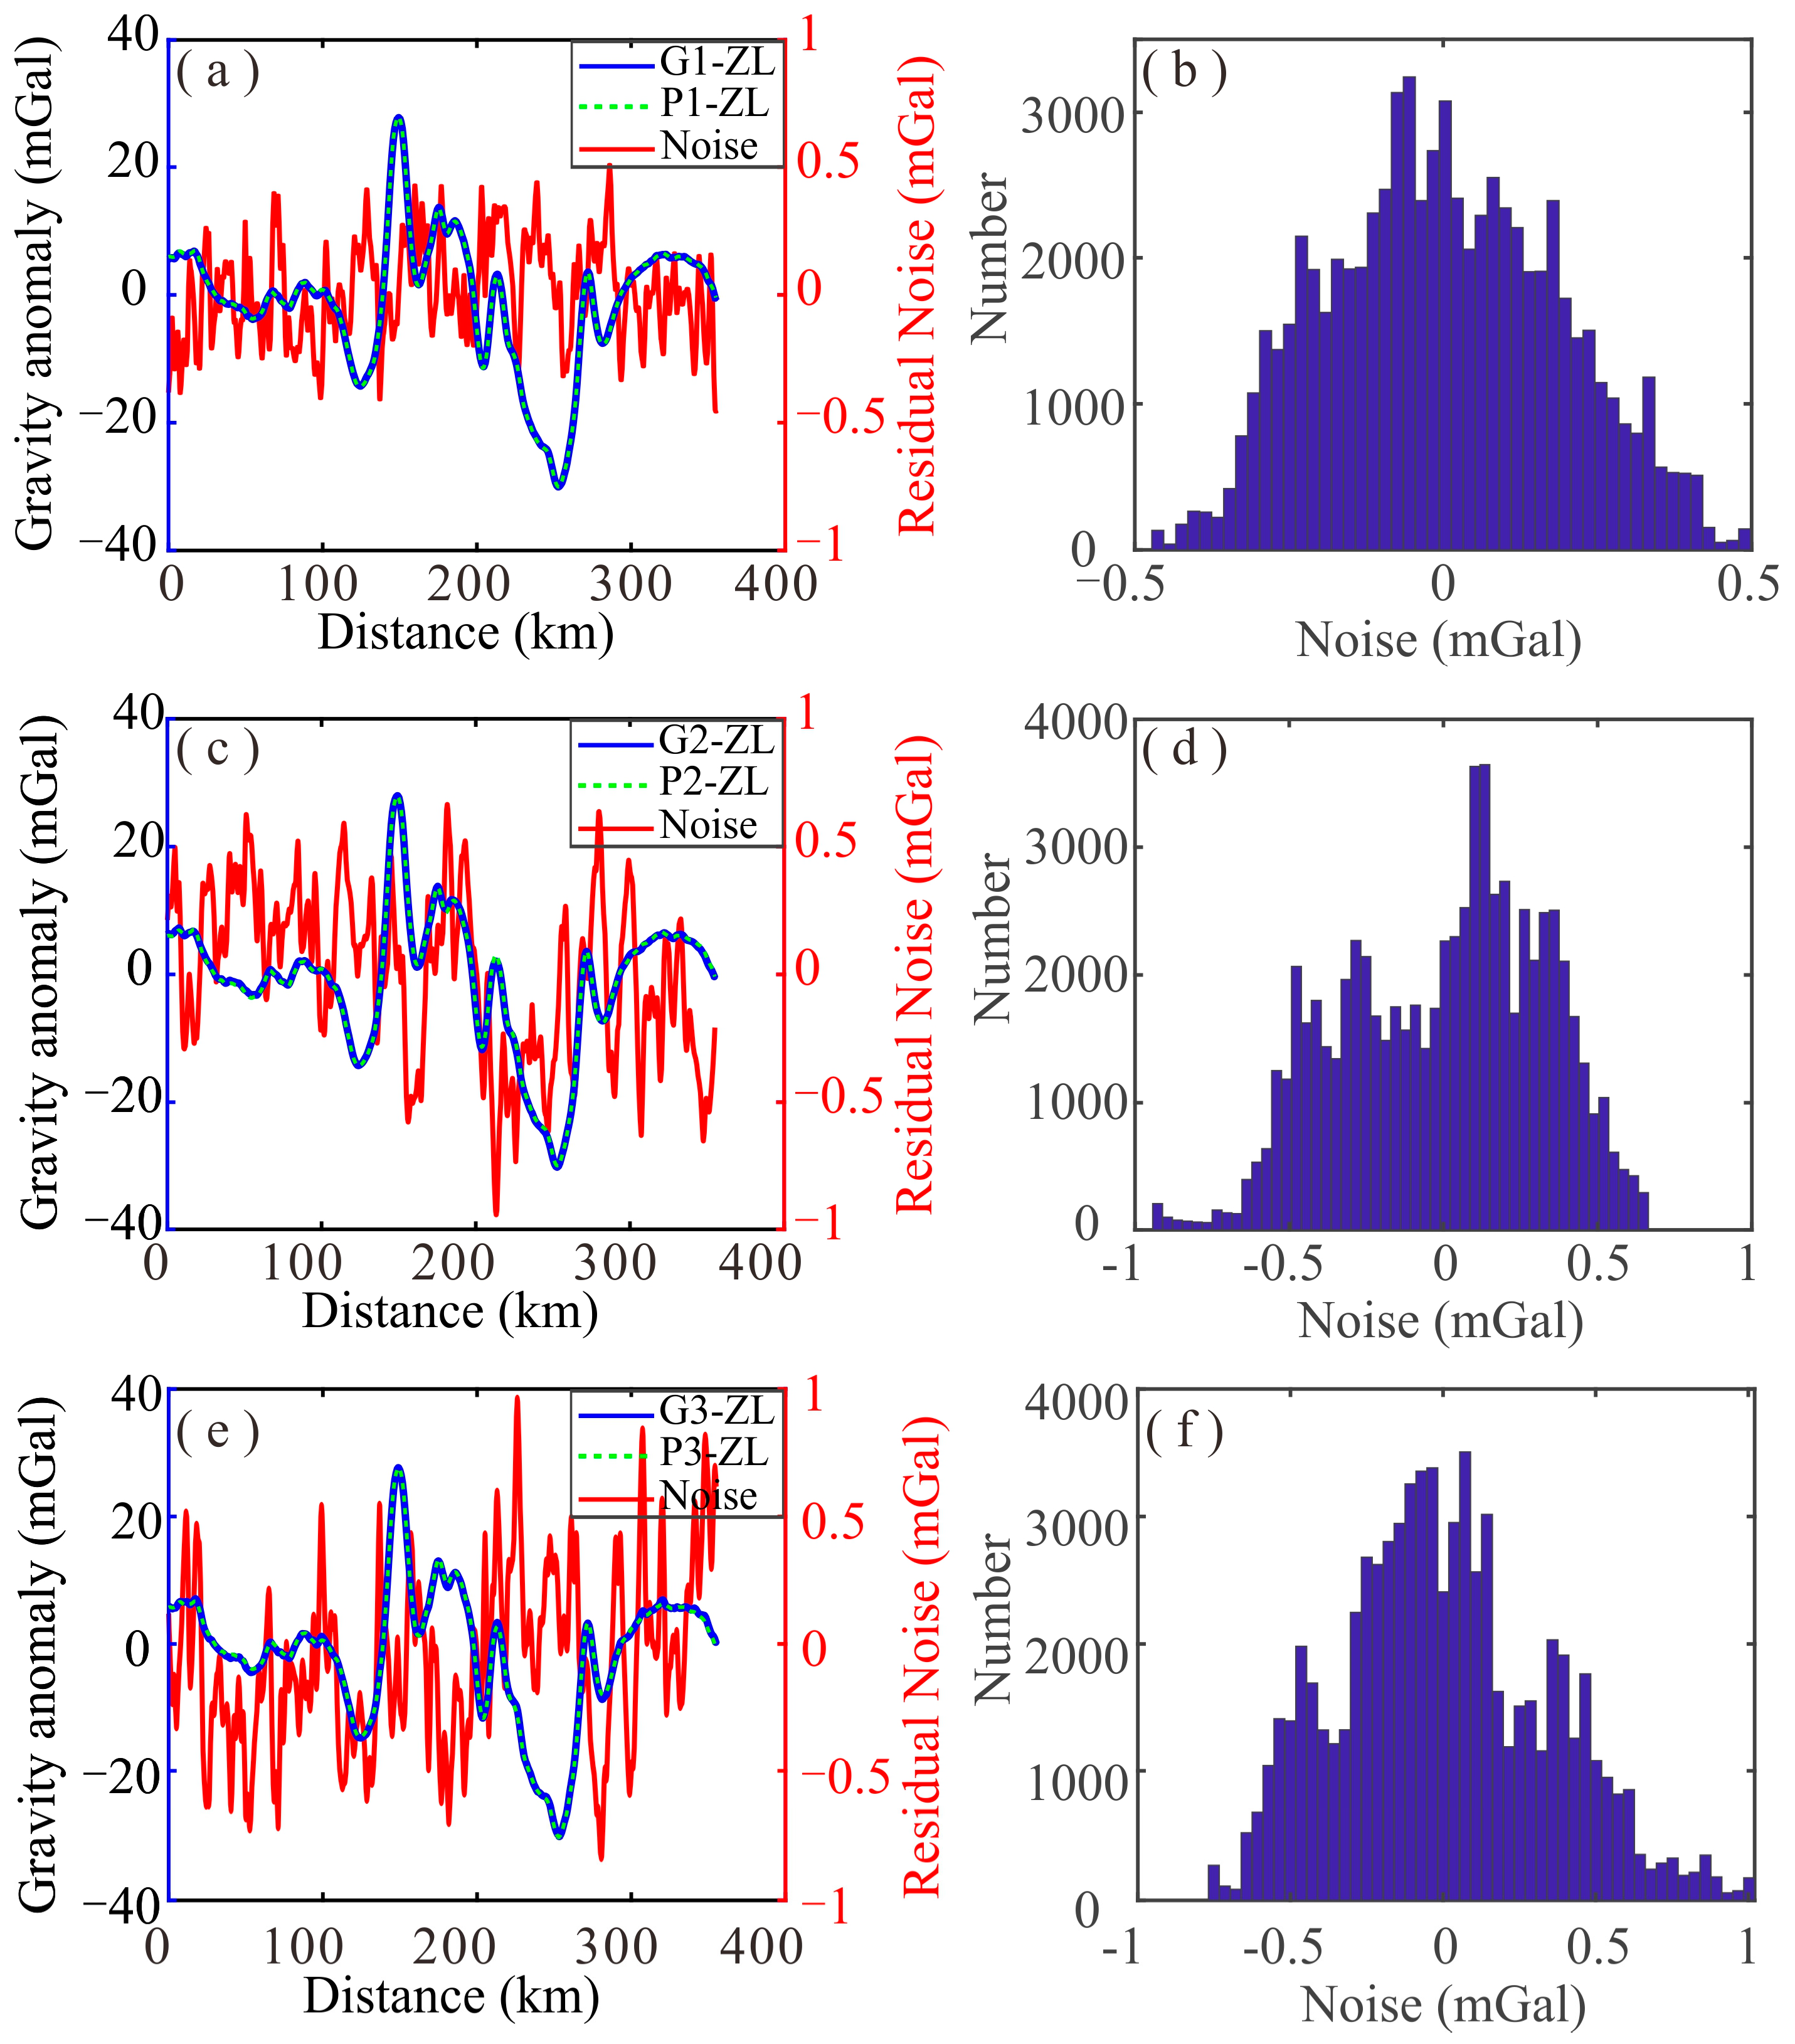
Figure 3,
Figure 4 and
Figure 5 display the separated results and the noise statistics of the three measurements taken from gravimeters GT-2M, SAG-2M, and ZL11-1A, where the blue line represents the measured free air gravity anomaly, the green dotted line represents the separated standard free air gravity anomaly, and the red line represents the separated noise. We can see that the separated noise satisfies the standard normal distribution, regarded as random white noise, proving that the residual noise separation method is correct.
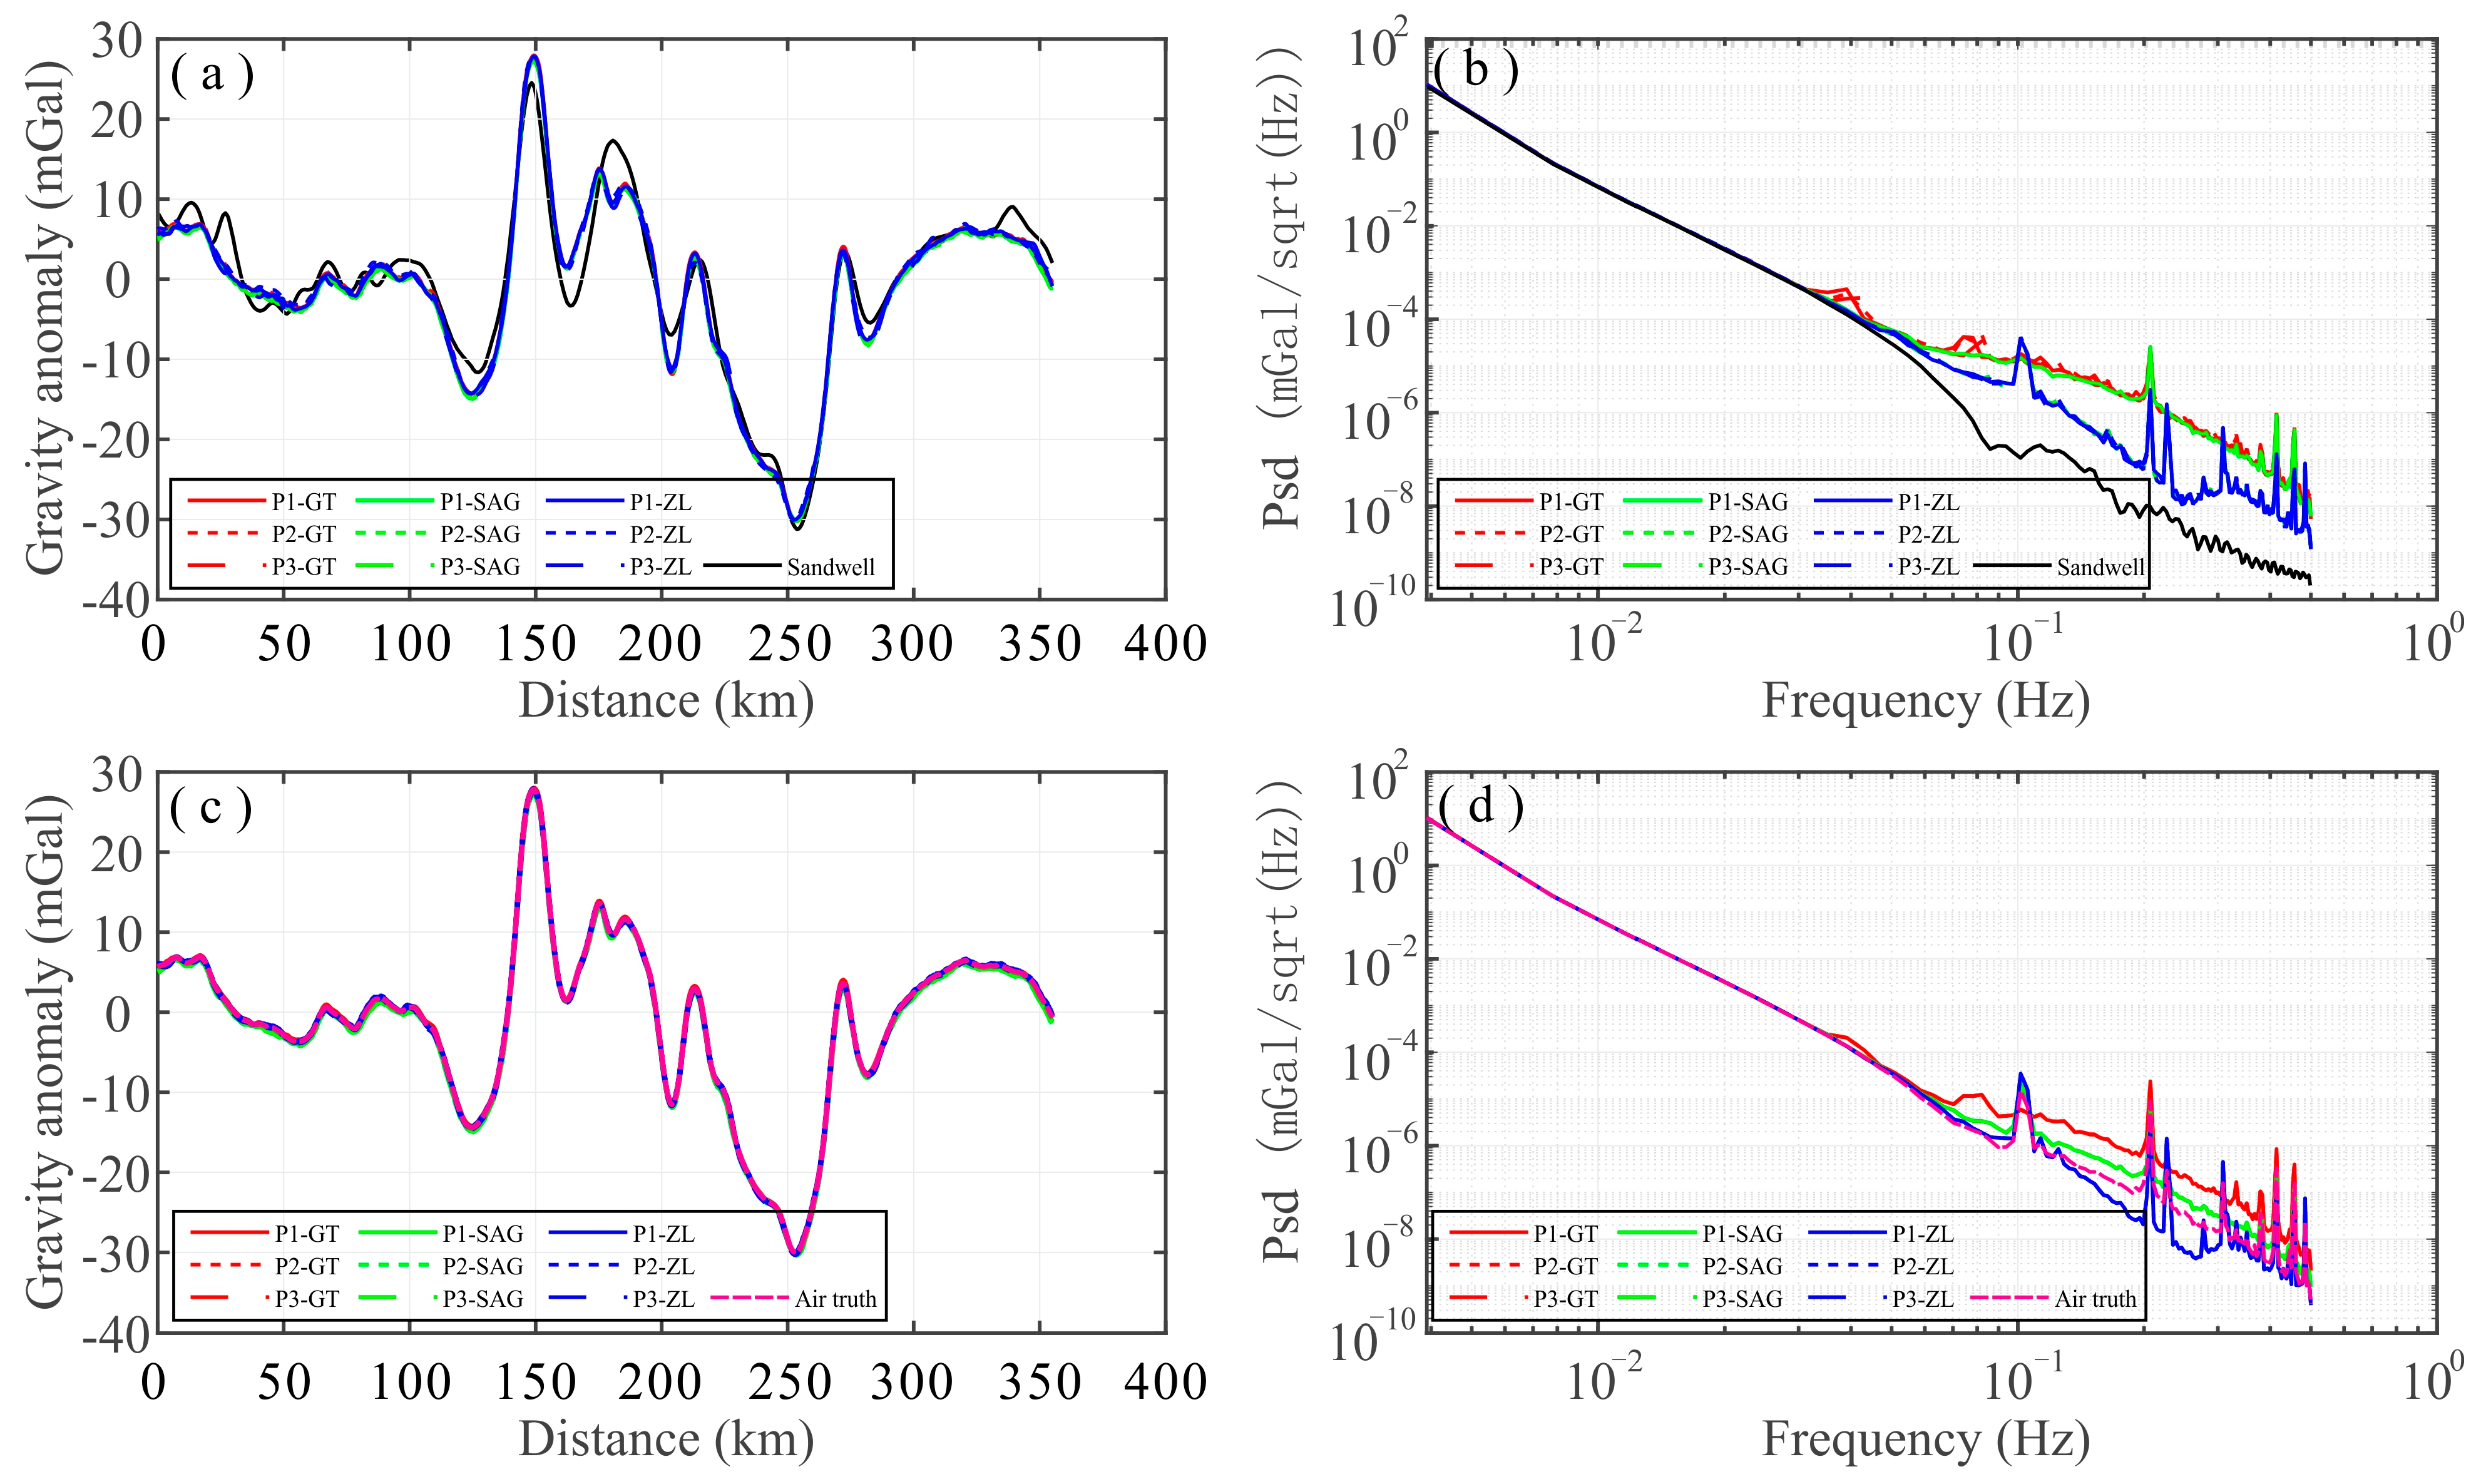
Figure 6 shows a comparison of the measured free air gravity anomalies, the global marine gravity model V23.1 by Sandwell [
4], and the separated standard gravity anomalies with their power spectral density calculated using the Welch method.
Figure 6a,b illustrate significant differences between the global marine gravity model V23.1 and the measured free air gravity anomaly, especially in terms of the high-frequency information. This is because the resolution of the global marine gravity model is 6 km, and the accuracy is ~2 mGal, which is lower than that of the measured free air gravity anomaly. By comparing
Figure 6b and 6d, it can be seen that the consistency of the measured free air gravity anomaly at frequencies of 0.03 Hz to 0.06 Hz has been improved with the residual noise removed.
Table 5,
Table 6 and
Table 7 show the RMS, STD, and CC statistical results between each standard free air gravity anomaly separated from each measurement by gravimeters GT-2M, SAG-2M, and ZL11-1A, as measured on repeat line L1. Comparing
Table 2,
Table 3 and
Table 4 and
Table 5,
Table 6 and
Table 7, we can observe that the RMS, STD, and CC statistical results of the separated standard gravity anomaly have been improved by removing the residual noise, where the STD between the three separated standard free air gravity anomaly of each gravimeter is 0 and the CC is 1. Therefore, we can conclude that the three separated standard free air gravity anomalies of each gravimeter are the same, indicating that there is no deviation. Therefore, the weight of the three separated standard gravity anomaly measurements from each gravimeter is the same when establishing the “air truth” free air gravity anomaly.
However, there is a standard deviation in the separated standard free air gravity anomalies obtained from the different gravimeters. The standard deviation between GT-2M and SAG-2M is 0.11 mGal; between ZL11-1A and GT-2M, it is 0.14 mGal; and between SAG-2M and ZL-11, it is 0.15 mGal. Thus, we use the average values of the three separated standard free air gravity anomalies obtained by each gravimeter to establish the “air truth” free air gravity anomaly, with the weight of GT-2M, SAG-2M, and ZL11-1A being determined by calculating the inverse of the RMS between two of them and normalizing it. The weights of GT-2M, SAG-2M, and ZL11-1A are 0.3912, 0.3335, and 0.2753, respectively, and the weighted result of the three average values for the gravimeters is the established “air truth” free air gravity anomaly, shown in
Figure 6c. Based on the established “air truth” free air gravity anomaly, the RMS, STD, and CC statistical results between each measured and separated standard free air gravity anomaly with the established “air truth” anomaly are shown in
Table 8 and
Table 9, and can be used to estimate the performance of the GT-2M, SAG-2M, and ZL11-1A gravimeters. We can see that the RMS precision of the measured free air gravity anomaly of GT-2M is better than 0.2 mGal and that of SAG-2M and ZL11-1A is better than 0.45 mGal. The STD of the measured free air gravity anomaly of GT-2M and SAG-2M is better than 0.2 mGal, and that of ZL11-1A is better than 0.41 mGal. Moreover, the maximum value of CC of the measured free air gravity anomaly of GT-2M, SAG-2M, and ZL11-1A is 0.9999, and the minimum value of CC is 0.9993. However, for the standard free air gravity anomaly with residual noise removed, the RMS precision of the separated standard free air gravity anomaly of GT-2M is better than 0.13 mGal, and that of SAG-2M and ZL11-1A is better than 0.45 mGal. The STD of the separated standard free air gravity anomaly of GT-2M, SAG-2M, and ZL11-1A is better than 0.13 mGal. The CC of the separated standard free air gravity anomaly of GT-2M and SAG-2M is 1, and that of ZL11-1A is 0.9999.
5. Conclusions
Traditionally, a synchronized comparison test on the same platform is used to directly evaluate the performance of gravimeters, which is a relative comparison method. This study presents a new method to remove the residual noise from the measured gravity anomaly to establish an “air truth” free air gravity anomaly and use it as a standard to effectively evaluate the performance of different marine gravimeters. A comparison was made of the precision results obtained from different gravimeters used in the north of the South China Sea; round-trip measurements were taken three times, and the highest precision free air gravity anomaly measured by GT-2M, SAG-2M, and ZL11-1A was used to establish the “air truth” free air gravity anomaly by removing the residual noise. The findings show that the RMS, STD, and CC statistical results were improved. The three separated standard free air gravity anomalies of each gravimeter were the same, with no deviation. The external consistency of the free air gravity anomaly with the residual noise removed at frequencies of 0.03 Hz to 0.06 Hz was also improved. The weighted result of the three average values of GT-2M, SAG-2M, and ZL11-1A is the established “air truth” free air gravity anomaly, which can be used as a standard to estimate the performance of different kinds of marine gravimeters. Based on the established “air truth” free air gravity anomaly, the performance of the GT-2M, SAG-2M, and ZL11-1A gravimeters was estimated, with GT-2M achieving the best performance.


