Abstract
An Nd:YAG-based Raman lidar provides a mature technology to derive profiles of the optical properties of aerosols over a wide altitude range. However, the derivation of micro-physical parameters is an ill-posed problem. Hence, increasing the information content of lidar data is desirable. Recently, ceilometers and wind lidar systems, both operating in the near-infrared region, have been successfully employed in aerosol research. In this study, we demonstrate that the inclusion of additional backscatter coefficients from these two latter instruments clearly improves the inversion of micro-physical parameters such as volume distribution function, effective radius, or single-scattering albedo. We focus on the Arctic aerosol and start with the typical volume distribution functions of Arctic haze and boreal biomass burning. We forward calculate the optical coefficients that the lidar systems should have seen and include or exclude the backscatter coefficients of the ceilometer (910 nm) and wind lidar data (1500 nm) to analyze the value of these wavelengths in their ability to reproduce the volume distribution function, which may be mono- or bimodal. We found that not only the coarse mode but also the properties of the accumulation mode improved when the additional wavelengths were considered. Generally, the 1500 nm wavelength has greater value in correctly reproducing the aerosol properties.
1. Introduction
Aerosols impact the radiative budget of our planet via scattering, absorption, and cloud formation. All of these processes are not yet entirely understood [1]. Considering that both the sources and sinks of aerosols vary over time, aerosol-related uncertainties continue to pose a challenge for climate modeling [2].
This is especially true for the Arctic regions, which show a vulnerable climate with accelerated warming (“Arctic Amplification” [3,4]). Due to the high surface albedo and large solar zenith angles, aerosols can potentially warm the Arctic, which would otherwise cool the low- and mid-latitudes. Recently, refs. [5,6,7] provided overviews of the Arctic aerosol seasonal cycle, knowledge gaps, and possible future changes. In this work, the variable size distribution and chemical composition, which determine the complex index of refraction of the aerosol, will be especially important. Although the classic “Arctic Haze” phenomenon [8], the Arctic springtime air pollution, seems to decrease over time [9], other aerosol sources like biomass burning in summer are gaining importance [10].
Ny-Ålesund is a research village on Spitsbergen in the European Arctic at N, E. For many years, aerosol in situ measurements have been carried out at the nearby mountain station Zeppelin [11] and the ground station at Gruvebadet observatory [12]. Aerosol remote sensing is performed by photometry [13] and Raman lidar [14]. Therefore, Ny-Ålesund needs to be a key site for the validation of regional climate models with explicit treatment of aerosols. However, given the complex orography of the site with fjords, mountains, and glaciers, which introduce many micro-meteorological phenomena [15], aerosol measurements at different nearby locations may not agree on an hourly or even daily scale [16].
While lidar is a well-established instrument to measure the optical properties of aerosols [17], deriving micro-physical properties from this type of instrument requires solving the inverse scattering problem, which is ill-posed [18,19]. While successful comparisons between aerosol in situ and remote sensing instruments (“aerosol closure”) have already been performed in Ny-Ålesund [20,21], this is, generally speaking, a difficult task.
To constrain the impact of aerosols on the climate system, their vertical distribution is important [22,23]. Therefore, balloon-borne instruments have been employed at Ny-Ålesund, e.g., in [24]. As these balloons typically only cover the lowest atmosphere and can only be launched at calm wind speeds, it is important to increase the information retrieval of lidar data, as this instrument covers a much larger vertical fraction of the atmosphere.
One easy and obvious strategy to achieve this aim is to add more wavelengths to the evaluation. For the inversion of micro-physical aerosol properties from lidar data (essentially, the volume or size distribution and the complex refractive index), typically, the three backscatter coefficients at 355 nm, 532 nm, and 1064 nm, as well as the extinction coefficients at 355 nm and 532 nm, from an Nd:YAG-based system, are employed [17,18,25,26,27]. However, recently, wind lidar systems have become a reliable tool, as they also provide aerosol backscatter profiles [28,29]. Coherent Doppler wind lidars typically operate in the near-infrared, sometimes around 1.5 µm [30]. Further, ceilometers are also used to determine backscatter profiles [31,32]. Some of these instruments (e.g., from the manufacturer Vaisala) operate at 910 nm [33].
Hence, the aim of this work is to show the benefit of retrieving aerosol micro-physical properties using more wavelengths. In addition to the three backscatter coefficients (at 355 nm, 532 nm, and 1064 nm) and the extinction coefficients (at 355 nm and 532 nm) of a typical Nd:YAG laser, backscatter coefficients at 910 nm and 1500 nm are simulated based on Mie calculations of aerosol size distributions found in the Arctic.
2. Instruments
In this work, we used data from the traditional Raman lidar KARL (“Koldewey Aerosol Raman Lidar”). This is an Nd:YAG system that records the elastic channels of 355 nm, 532 nm, and 1064 nm with 50 Hz and around 10 W per color. Further, the inelastically scattered light from at 387 nm and 607 nm is recorded. The system uses a 70 cm mirror with a field of view of around 1.5 mrad. It has an overlap range of about 700 m, so no data are analyzed below this altitude. Further details of the system can be found in [34]. Typically, the aerosol classes visible in a lidar in the Arctic are Arctic haze [35] or biomass burning [36].
Moreover, at the Ny-Ålesund site, a CL51 Vaisala ceilometer, operating at 910 nm using a pulsed InGaAs laser, is located, which produces lidar backscatter profiles nominally up to a 15 km altitude. Even though the data quality of this instrument is lower than that of a Raman lidar, ceilometers of this type have been used to derive backscatter profiles from boreal forest fires [37] or Arctic aerosols [38]. However, absorption by water vapor needs to be considered at this wavelength [39].
Recently, wind lidar systems have also been used to derive aerosol profiles, e.g., instruments like the StreamLine series by Halo Photonics that operate at 1.56 µm [40]. This instrument also captures the particle depolarization [41]. The Alfred Wegener Institute plans to install such an instrument at Ny-Ålesund later this year.
3. Retrieval of Micro-Physical Particle Properties from Optical Data of Different Devices
The basic software used, which is able to retrieve micro-physical particle properties from multiwavelength Raman lidar data, was investigated in [19,42]. The detailed mathematical background can be found in [18,43,44,45]. Here, we briefly describe some basic properties and the software used for the convenience of the reader. The software was extended to deal not only with the standard Raman lidar wavelengths (355 nm, 532 nm, and 1064 nm) but also with variable wavelengths from other devices.
The optical parameters are connected with the particle volume size distribution (PVSD) by a Fredholm integral equation of the first kind
with the kernel function where is the wavelength, r is the radius, and are the appropriate lower and upper radii, m is the complex refractive index (CRI), denotes either the optical extinction or backscatter coefficients of all used devices, and Q stands for either the extinction or the backscatter efficiencies. Here, we investigate two additional optical backscatter coefficients at the wavelengths 910 nm and 1500 nm.
It is well known that problem (1) is an inverse ill-posed problem [46]. The software’s input data are the optical coefficients . Because of the ill-posedness, the inversion needs to be executed very carefully to retrieve the unknown PVSD . The software provides two regularization techniques to invert Equation (1). The first one is the Truncated Singular-Value Decomposition (TSVD) [18,42], whereas the second one is an iterative regularization. Here, a generalized Runge–Kutta iteration [47], also known as the Padé iteration [44,48] is implemented.
After the successful inversion of the PVSD, one can straightforwardly determine the micro-physical parameters. Here, we investigate the following:
- −
- The total volume concentration ();
- −
- The effective radius () with ();
- −
- The mean wavelength-independent CRI;
- −
- The single scattering albedo (SSA) at .
Since Equation (1) acts between function spaces, it is necessary for the implementation to use a discretization of Equation (1). We employ spline collocation for the discretization. The PVSD is approximated with B-spline functions of variable order (acting as a regularization parameter) by
The variable order has advantages, in particular, for the retrieval of a multimodal PVSD. The unknown coefficients may be computed by solving a linear equation system, namely , newly formed from Equation (1). The matrix elements of the linear system are determined by
where (), and B and are vectors.
The infinite-dimensional ill-posed problem (Equation (1)) is substituted by a finite-dimensional, frequently ill-conditioned system, i.e., the matrix equation (Equation (3)) has a large, often huge condition number. Therefore, the system cannot be solved by standard methods alone. We still need regularization techniques with a parameter choice rule (see [46,49]). As mentioned previously, two techniques are implemented.
First, utilizing the TSVD technique, the linear system is transformed by expanding the matrix using SVD. Potential noise in the input data and the calculated matrix (3) is amplified because the singular values cluster above zero. Regularization may prevent this behavior by including only a part of the singular values, i.e., defining a certain cutoff level k (acting as a regularization parameter), below which the noisiest solution parts are filtered out.
Second, using the Padé iteration, the linear system is solved by an iteration method with the initial vector (see above Equation (2)), whereas for well-conditioned matrices, the iteration may proceed “nearly” to infinity. However, in our case, we have to terminate the iteration after a few eligible iteration steps (acting as a regularization parameter) early enough to eliminate the amplification of the noise.
While the TSVD method works with a permanent node grid on the radius axis (equidistant or non-equidistant) throughout the procedure, the Padé iteration starts with an equidistant node grid on the radius axis. The number of nodes used is a variable, and one may increase this number if necessary, e.g., for a multimodal PVSD. For our case studies, we use 16 nodes. But, the node grid is non-permanent during the procedure, i.e., the nodes shift automatically from the initial equidistant grid to a non-equidistant grid. Strong slopes of the PVSD, which occur in a multimodal PVSD, need more and closer nodes. The advantage is that such multimodal PVSDs are better modulated. Moreover, the iteration is a projected iteration, meaning that potentially negative values of the PVSD during the iteration are projected onto zero (see [45]). For the case studies here, we use 100 iteration steps.
The kernel function in Equation (1) depends on the CRI, which is an unknown value. The software deals with a CRI grid of possible real and imaginary parts of the CRI [36,42]. Reasonable candidates for proper pairs of real and imaginary parts are often located in a diagonal pattern [18,43]. Therefore, the CRI cannot be uniquely retrieved. We only obtain a mean value of possible CRIs. Roughly speaking, a cluster of physically meaningful pairs on the CRI grid, which also produces a PVSD with a similar shape, is selected. With respect to the CRI grid in [26], Figures 6 and 7, and [50], the same property of a diagonal pattern is observed, which mostly covers the true CRI. The length and width of the diagonal pattern depend on the input noise level, the kind of noise, and the number of input coefficients used. In [26], the diagonal pattern is called a canyon trajectory.
4. Retrieval Results of Typical Arctic Aerosol Size Distribution
For our studies, we investigate six aerosol size distributions, each with two different Arctic-typical CRIs: (weak absorption) and (moderate absorption) (see Table 1). We select one synthetic monomodal log-normal distribution and five Arctic-typical bimodal distributions from the literature. The aerosol size distributions are described by three parameters per mode: the median radius of the distribution (), its width (), and the total number concentration () of particles per volume. The quantities of these parameters are presented in Table 1. The subscripts 1 and 2 denote the fine (accumulation) and coarse modes of the aerosols. The PVSDs for Examples 2 and 3 were obtained by retrieving Arctic lidar data from MOSAiC in spring 2020 [35] and from an intense biomass burning event measured over Ny-Ålesund in July 2015 [36] (Examples 4–6).

Table 1.
Six investigated examples: One monomodal PVSD and five Arctic bimodal PVSDs retrieved from Raman lidar measurements at Ny Ålesund. The first entries refer to the accumulation mode, and the second entries in brackets () refer to the coarse mode, if it exists.
Our software retrieves PVSD functions without any conditions or restrictions on the function type (e.g., log-normal or Gamma distribution), as was done in [26,27] with a fixed log-normal size distribution shape. The shape in our software is completely free. The five Arctic-typical bimodal distributions generally look very similar to log-normal distributions. Therefore, we fitted log-normal distributions to the retrieved bimodal distributions. The fitted log-normal parameters can be found in Table 1, as mentioned above. Next, we use these fitted bimodal log-normal distributions for our new simulations with additional infrared wavelengths and call them initial distributions.
The regarded radius range is between µm and µm. This is sufficient for long-range advected aerosols in the Arctic (see the figures later on).
It is known that there is a correlation between the observed particle radius and the wavelength of light in Mie scattering theory, which is used in the model (Equation (1)), and we need to respect this fact. Specifically, the radius should be approximately the same size as the wavelength. In the Mie model (Equation (1)), from a mathematical point of view, this fact is reflected by the kernel function i.e., it is transported into the surface property. Such an integral equation is mildly ill-posed in the case of a highly structured surface of the kernel function and severely ill-posed if the surface is smooth. In Figures 1 and 2 in [51,52], one can observe that the structure of the surface depends on the CRI and the size ratio
Regarding the CRI and using Equation (4), one can observe that the domain of s, where the retrieval of the PVSD works well, should not be bigger than approximately (rule of thumb). Therefore, for the wavelength nm, the radius should not exceed 3390 nm. Using an additional larger wavelength, e.g., nm, the radius range is enlarged to 4780 nm. But one needs to keep in mind that the smallest wavelength nm contributes input information only up to a radius of 1130 nm.
In fact, using an additional larger wavelength than nm improves the retrieval of the coarse mode. In our studies, we use two additional wavelengths, namely 910 nm and 1500 nm, first separately and then jointly.
Figure 1a–d show Example 3 (Arctic haze with a pronounced accumulation mode and a weak and widely separated coarse mode). As one can clearly see in Figure 1a,b, using only the current standard wavelengths (a) (3 and 2) or one additional wavelength of 910 nm (b), i.e., smaller than 1064 nm, the coarse mode is not retrieved at all. Using one additional wavelength of 1500 nm (c), i.e., larger than 1064 nm, or two additional wavelengths of 910 nm and 1500 nm (d), the coarse mode is well retrieved. Even the accumulation mode retrieval is somewhat improved, as the maximum value of the PVSD rises to about 40 µm3/(cm3 µm). Further, it can be seen from Figure 1b that the addition of the 910 nm wavelength, while improving the representation of the fine mode, shows an erroneous coarse mode around a 0.6 µm radius.
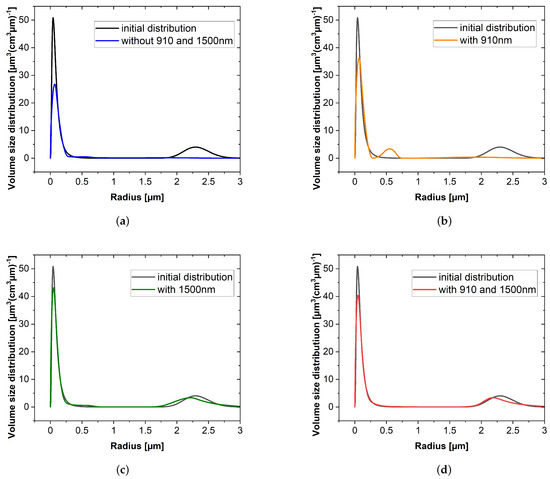
Figure 1.
Example 3 with , using different configurations of input coefficients.
When analyzing Example 4 (biomass burning with a strong bimodal distribution) (see Figure 2a–d), the result is slightly different. Here, it is enough to use an additional wavelength of 910 nm to retrieve both modes very well. A possible reason for this could be that both radii at the maximum peak height are smaller than those in Example 3, as no aerosol larger than 2 µm in radius is present in this example. Still, the inclusion of either the 910 nm or 1500 nm wavelengths significantly increases the representation of the coarse mode in terms of the median radius and widths of the distribution.
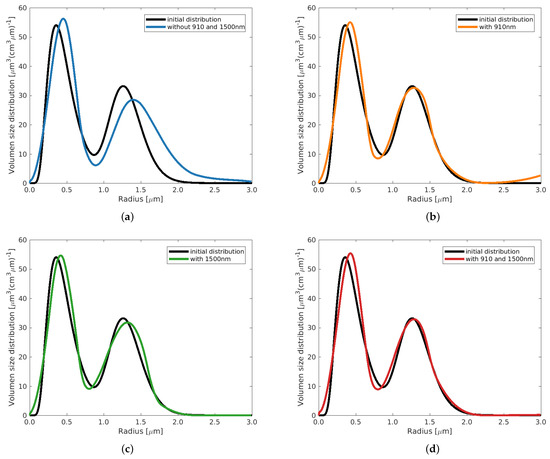
Figure 2.
Example 4 with , using different configurations of input coefficients.
When evaluating Example 2 (Arctic haze with close accumulation and coarse mode) (see Figure A1a–d in Appendix A), we observe a similar result as in Example 3. The accumulation and coarse modes are both only clearly retrieved using the long wavelength of 1500 nm. Neither a traditional 3 + 2 system nor the inclusion of the 910 nm wavelength is sufficient to correctly reproduce the initial PVSD.
Regarding Example 5 (weakly bimodal biomass burning) (see Figure A2a–d in Appendix A), the situation is as follows: Using only 3 + 2 wavelengths, the correct coarse mode is not retrieved, but a wrong second coarse mode is “found” with larger radii (see the blue line in Figure A2a between 1.7 and 3 µm). Using 4 (additionally 910 nm) + 2 wavelengths, the correct coarse mode appears in the solution, while the wrong coarse mode becomes weaker (see the orange line between 2.2 and 3 µm). One reason for retrieving a second wrong coarse mode could be an artificial mathematical oscillation because of the severe ill-posedness at larger radii. But again, if the retrieval uses an additional wavelength of 1500 nm, only one course mode, i.e., the correct one, is retrieved (see the green and red lines in Figure A2c,d).
Example 6 (almost monomodal biomass burning) (see Figure A3a–d), shows more or less the same properties as the previous example (Example 5) with a wrong coarse mode, but the previously described behavior is not so pronounced. The correct coarse mode (slightly hidden between 0.75 and 2.0 µm) can only be retrieved with the additional information of the 1500 nm wavelength. However, the inclusion of the backscatter at 910 nm clearly improves the retrieval compared to a 3 + 2 system.
Even the potentially easier case of a monomodal PVSD (Example 1, Figure A4a,b) clearly improves with the addition of both longer wavelengths of 910 nm and 1500 nm (see Figure A4a,b). As this distribution extends up to a 4 µm radius, the original 3 + 2 data again indicate a weak and erroneous coarse mode.
From these examples, we conclude that deriving the PVSD for aerosols larger than approximately 2 µm in radius is challenging and error-prone for a traditional 3 + 2 Raman lidar. Hence, a clear and precise separation of both the accumulation and coarse modes is challenging. An overview of the residuals of the retrievals for all six examples is depicted in Figure A5a–f in Appendix A. It can be seen that, in general, the information content is higher at 1500 nm compared to 910 nm. Only in Figure A5d (clearly bimodal with a radius < 2 µm) is the residual at 910 nm smaller.
5. Retrieval Results of Micro-Physical Properties
We investigated a few micro-physical properties, namely the effective radius ( [µm]), the total volume concentration [µm3/cm3], and the SSA (532 nm) (see Table 2, Table 3 and Table 4). Only the mean CRI was retrieved since it was not unique in the diagonal pattern, as previously discussed. We investigated Example 1 (monomodal) and Examples 2–6 (bimodal) with , each for two cases, i.e., first using only 3 and 2, and second using the full amount (5 and 2) (see Table 2). We analyzed whether the additional two IR wavelengths also improved the representation of the accumulation mode. As expected, we found that the total volume concentration was clearly better retrieved for all six examples using 5 and 2 (blue lettering). The same was true for the effective radius, with two small exceptions, and for the SSA (one tiny exception). It is worth mentioning that there was no difference for the CRI .

Table 2.
Micro-physical parameters for Examples 1–6 with for the smaller (accumulation) mode, considering two cases: one with 5 + 2 and one with 3 + 2 in brackets (). The values in blue indicate which solution, 5 + 2 or 3 + 2, is closer to the exact solution. It can be seen that the inclusion of longer wavelengths generally improves the representation of the small aerosol modes.

Table 3.
Micro-physical parameters for the monomodal example (Example 1), considering uncertainties in the lidar input data for two cases: one with 5 + 2 and one with 3 + 2 in brackets (). Blue values indicate stable results (lidar uncertainties hardly affect the micro-physical aerosol properties). Bold values indicate unstable results.

Table 4.
Micro-physical parameters for the bimodal example (Example 4) (accumulation mode), considering uncertainties in the lidar input data for two cases: one with 5 + 2 and one only with 3 + 2 in brackets (). Blue: stable results; bold: unstable results.
We are not only interested in previous differences but also the effect on the micro-physical properties when considering uncertainties in the lidar input data. First, we retrieved the micro-physical properties with “exact” (only computational rounding errors are included, similar to Table 2) input data for the backscatter and extinction coefficients. Second, we generated 10 cases of real uncertainties, which are described in Table 3 and Table 4. This uncertainty estimation was performed in a way that we assumed a ±10% error in the retrieval of the two extinction coefficients, a ±5% error in the retrieval of the backscatter coefficient from the Nd:YAG laser, and a ±7% error in the retrieval of the backscatter at 910 nm or 1500 nm (to account for the weaker signal quality in the latter wavelengths). Hence, “high” or “low” in Table 3 and Table 4 mean that the inversion of the micro-physical properties was performed using lidar input data, which were 5%, 7%, or 10% higher or lower than the exact input data.
Both examples show the same qualitative behavior. For the four cases— high and high, low and low, all low, and all high—the retrieval behavior is quite stable (blue lettering). For the other six cases, instabilities may occur (bold black lettering) independently of the two cases (3 and 2) (22 times) and one-third less for 5 and 2 (15 times).
The Ångström exponents of backscatter and extinction between two wavelengths and are defined as:
These Ångström exponents are related to the size of the aerosol (see e.g., [53]). We note that the cases that tend to instability have different Ångström exponents. As expected, the effective radius generally increases if the extinction ratio between shorter and longer wavelengths decreases, and vice versa. The instability in the inversion of micro-physical properties in these cases may be explained by the fact that the size of the aerosol, expressed by the Ångström exponents, contains most of the information.
Regarding all uncertainty cases, the standard deviation and the deviation from the exact value are slightly better for 5 and 2, namely 60%. This result is also easy to understand: when there are errors or uncertainties in two additional backscatter coefficients, or in the retrieval of one color, they can be more easily balanced by the information from the other wavelengths.
Finally, we qualitatively show six refractive index grids (RIGs) for Example 4 with (see Figure 3). The first column shows RIGs when one uses only 3 and 2 optical coefficients. The second column investigates cases when 5 and 2 optical coefficients are available. Figure 3a,b examines the case with “exact” input, whereas (c–f) show retrievals with noisy input, i.e., (c,d) represent a stable uncertainty case (all low), and (e,f) represent an unstable uncertainty case (all low, high, low). It is obvious that in all three cases (second column), the length and width of the diagonal pattern are smaller, indicating that even the retrieval of the CRI is stabilized using the additional backscatter coefficients at wavelengths of 910 and 1500 nm. Of course, it is still ambiguous, but it makes the retrieval of the mean CRI of all CRIs under consideration easier, i.e., to select a cluster of CRIs inside the diagonal pattern where the connected PVSDs have a similar shape. In Section 3, we remarked that the length and width of the diagonal pattern depend on the input noise level and the kind of noise. We clearly see that as the uncertainty noise increases from the “stable” uncertainty case (Figure 3c,d) to the unstable uncertainty case (Figure 3e,f), this holds true.
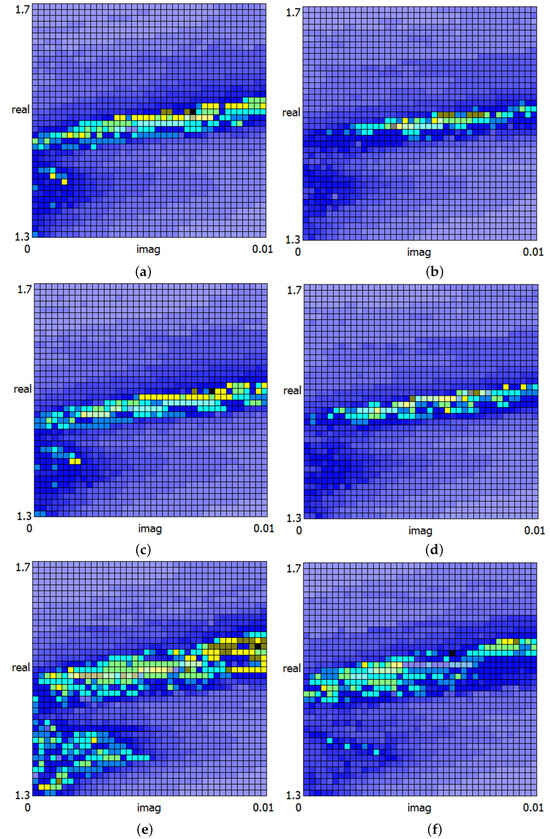
Figure 3.
(a–f) The refractive index grid for Example 4 with . (a,c,e) Retrieval with only 3 + 2 coefficients, i.e., without 910 and 1500 nm. (b,d,f) Retrieval with 5 + 2 coefficients, i.e., additionally using 910 and 1500 nm. (a,b) With “exact” input. (c,d) With “stable” uncertainty input, i.e., all low. (e,f) With “unstable” uncertainty input, i.e., all low, high, and low. Color scale: Inside the diagonal pattern (brown, yellow, green, cyan, and turquoise), the percentage of deviation from the “exact” optical coefficients ranges from about 0.02 to 0.6%; the boundary of the diagonal pattern (3 navy blue levels) corresponds to deviations of about 1.5–7.5%; and the 3 final light blue levels represent deviations larger than about 75%.
6. Summary and Outlook
In this work, we used particle volume size distributions (PVSDs) from Arctic haze and boreal biomass burning events, as well as a realistic monomodal size distribution, to analyze the extent to which an improved inversion of the micro-physical properties can be expected if additional backscatter coefficients from typical, commercially available instruments like ceilometers or wind lidars are included in addition to the Raman lidar.
We found that an improved representation, especially of the coarse mode, always occurred. This is relevant for Arctic conditions, as due to the increased gravitational sinking of large aerosols, the coarse mode in long-range advected air masses is typically only weak or even non-existent (but may wrongly show up in the evaluation, as seen in Examples 5 and 6 in Figure A2a and Figure A3a). Nevertheless, and somewhat surprisingly, the derivation of the fine (accumulation) mode also improved with the addition of backscatter coefficients at long wavelengths. Further, the stability of the inversion of the aerosol micro-physical properties with respect to uncertainties of the lidar input data also increased.
In five out of six cases, the additional information content at 1500 nm was larger than at 910 nm. This means that a wind lidar is a more useful complement to a Raman lidar compared to a ceilometer. This fact is positive from a data evaluation perspective for three reasons: Firstly, the choice of a lidar ratio (the ratio between aerosol extinction to backscatter) is absolutely uncritical for 1500 nm. This is because the extinction is negligibly low in any case; hence, the Klett solution [54] hardly depends on the value of the lidar ratio. Secondly, the 1500 nm wavelength is not affected by water vapor absorption, which needs to be corrected in the ceilometer. And finally, the data quality of long-range wind lidars is typically better than that of ceilometers (although at a clearly higher cost compared to the former instrument).
Still, the 910 nm information is useful as well. Our two cases, in which the volume distributions from the accumulation mode and coarse mode overlapped, showed different behavior depending on whether the 910nm channel contributed to a more precise retrieval of the aerosol modes.
Given the importance of aerosols (and their impact on clouds) to the climate system, an improved information content of lidar data is clearly desirable. For this reason, we suggest repeating a study like this for other aerosol distributions, typical of other regions of the world.
Author Contributions
Conceptualization, C.R. and C.B.; methodology, C.B. and C.R.; software, C.B.; validation, C.B., C.R. and S.G.; investigation, C.B.; writing—original draft preparation, C.B.; writing—review and editing, C.R.; visualization, C.B. and S.G. All authors have read and agreed to the published version of the manuscript.
Funding
This research received no external funding.
Institutional Review Board Statement
Not applicable.
Informed Consent Statement
Not applicable.
Data Availability Statement
The authors may provide the data upon request.
Acknowledgments
The lidar data of this work were recorded at AWIPEV station in Ny-Ålesund. We thank Wilfried Ruhe and Ingo Beninga from Impres for their great maintenance work on our lidar systems.
Conflicts of Interest
The authors declare no conflicts of interest.
Appendix A. Additional Figures
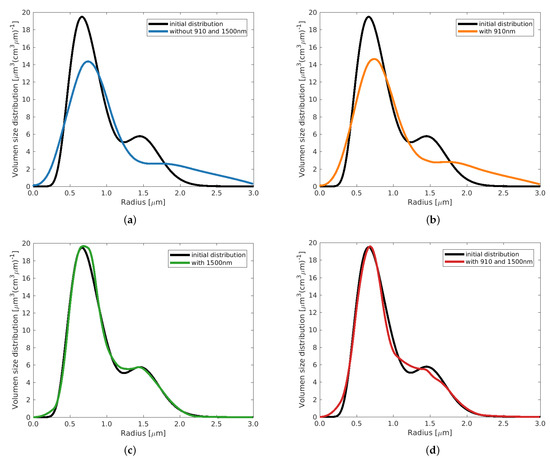
Figure A1.
Example 2 with , using different configurations of input coefficients.
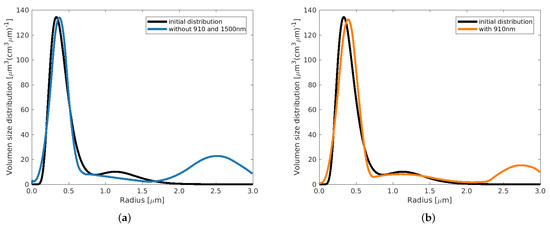
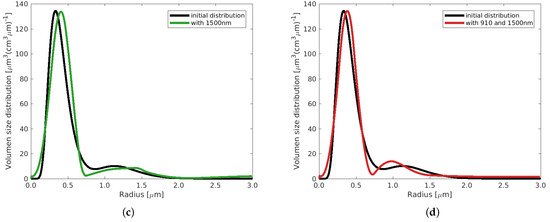
Figure A2.
Example 5 with , using different configurations of input coefficients.
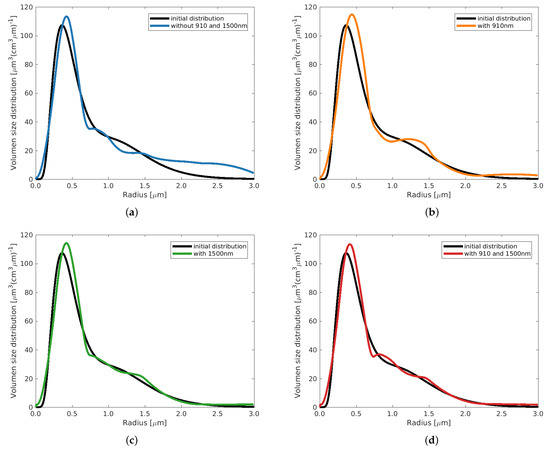
Figure A3.
Example 6 with m = 1.5 + 0.01i, using different configurations of input coefficients.
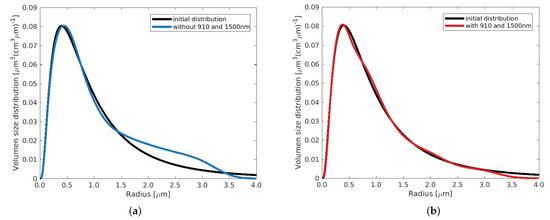
Figure A4.
Example 1 with m = 1.5 + 0.005i, using different configurations of input coefficients.
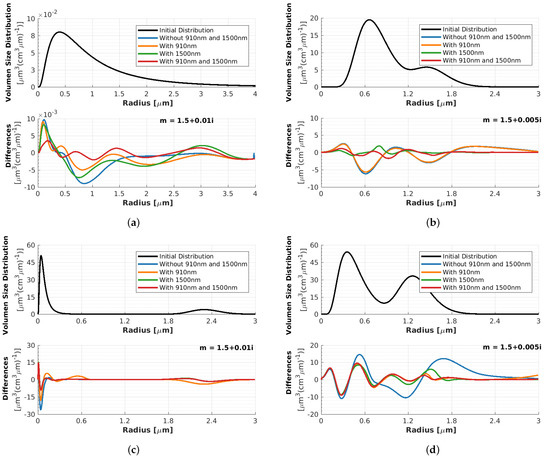
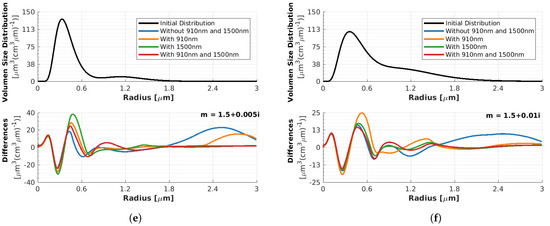
Figure A5.
(a–f) Top: Initial PVSDs (black lines) for the 6 examples from Table 1. (a–f) Bottom: Differences between the retrieved PVSDs and the initial ones for four cases (inclusion or omission of mentioned wavelengths), as described in the legends.
References
- Li, J.; Carlson, B.E.; Yung, Y.L.; Lv, D.; Hansen, J.; Penner, J.E.; Liao, H.; Ramaswamy, V.; Kahn, R.A.; Zhang, P.; et al. Scattering and absorbing aerosols in the climate system. Nat. Rev. Earth Environ. 2022, 3, 363–379. [Google Scholar] [CrossRef]
- Larson, E.; Portmann, R. Anthropogenic aerosol drives uncertainty in future climate mitigation efforts. Sci. Rep. 2019, 9, 16538. [Google Scholar] [CrossRef]
- Serreze, M.C.; Barry, R.G. Processes and impacts of Arctic amplification: A research synthesis. Glob. Planet. Chang. 2011, 77, 85–96. [Google Scholar] [CrossRef]
- Wendisch, M.; Brückner, M.; Crewell, S.; Ehrlich, A.; Notholt, J.; Lüpkes, C.; Macke, A.; Burrows, J.; Rinke, A.; Quaas, J.; et al. Atmospheric and surface processes, and feedback mechanisms determining Arctic amplification: A review of first results and prospects of the (AC) 3 project. Bull. Am. Meteorol. Soc. 2023, 104, E208–E242. [Google Scholar] [CrossRef]
- Willis, M.D.; Leaitch, W.R.; Abbatt, J.P. Processes Controlling the Composition and Abundance of Arctic Aerosol. Rev. Geophys. 2018, 56, 621–671. [Google Scholar] [CrossRef]
- Schmale, J.; Zieger, A.P. Aerosols in current and future Arctic climate. Nat. Clim. Chang. 2021, 11, 95–105. [Google Scholar] [CrossRef]
- Schmale, J.; Sharma, S.; Decesari, S.; Pernov, J.; Massling, A.; Hansson, H.C.; von Salzen, K.; Skov, H.; Andrews, E.; Quinn, P.K.; et al. Pan-Arctic seasonal cycles and long-term trends of aerosol properties from 10 observatories. Atmos. Chem. Phys. 2022, 22, 3067–3096. [Google Scholar] [CrossRef]
- Quinn, P.K.; Shaw, G.; Andrews, E.; Dutton, E.G.; Ruoho-Airola, T.; Gong, S.L. Arctic haze: Current trends and knowledge gaps. Tellus Chem. Phys. Meteorol. 2007, 59, 99–114. [Google Scholar] [CrossRef]
- Breider, T.J.; Mickley, L.J.; Jacob, D.J.; Ge, C.; Wang, J.; Payer Sulprizio, M.; Croft, B.; Ridley, D.A.; McConnell, J.R.; Sharma, S.; et al. Multidecadal trends in aerosol radiative forcing over the Arctic: Contribution of changes in anthropogenic aerosol to Arctic warming since 1980. J. Geophys. Res. Atmos. 2017, 122, 3573–3594. [Google Scholar] [CrossRef]
- Zielinski, T.; Bolzacchini, E.; Cataldi, M.; Ferrero, L.; Graßl, S.; Hansen, G.; Mateos, D.; Mazzola, M.; Neuber, R.; Pakszys, P.; et al. Study of chemical and optical properties of biomass burning aerosols during long-range transport events toward the arctic in summer 2017. Atmosphere 2020, 11, 84. [Google Scholar] [CrossRef]
- Tunved, P.; Ström, J.; Krejci, R. Arctic aerosol life cycle: Linking aerosol size distributions observed between 2000 and 2010 with air mass transport and precipitation at Zeppelin station, Ny-Ålesund, Svalbard. Atmos. Chem. Phys. 2013, 13, 3643–3660. [Google Scholar] [CrossRef]
- Udisti, R.; Bazzano, A.; Becagli, S.; Bolzacchini, E.; Caiazzo, L.; Cappelletti, D.; Ferrero, L.; Frosini, D.; Giardi, F.; Grotti, M.; et al. Sulfate source apportionment in the Ny-Ålesund (Svalbard Islands) Arctic aerosol. Rend. Fis. Acc. Lincei 2016, 27, 85–94. [Google Scholar] [CrossRef]
- Grassl, S.; Ritter, C. Properties of Arctic Aerosol Based on Sun Photometer Long-Term Measurements in Ny-Ålesund, Svalbard. Remote Sens. 2019, 11, 1362. [Google Scholar] [CrossRef]
- Ritter, C.; Neuber, R.; Schulz, A.; Markowicz, K.; Stachlewska, I.; Lisok, J.; Makuch, P.; Pakszys, P.; Markuszewski, P.; Rozwadowska, A.; et al. 2014 iAREA campaign on aerosol in Spitsbergen–Part 2: Optical properties from Raman-lidar and in-situ observations at Ny-Ålesund. Atmos. Environ. 2016, 141, 1–19. [Google Scholar] [CrossRef][Green Version]
- Lüers, J.; Bareiss, J. Direct near-surface measurements of sensible heat fluxes in the Arctic tundra applying eddy covariance and laser scintillometry—The Arctic Turbulence Experiment 2006 on Svalbard (ARCTEX-2006). Theor. Appl. Climatol. 2011, 105, 387–402. [Google Scholar] [CrossRef]
- Rader, F.; Traversi, R.; Severi, M.; Becagli, S.; Müller, K.J.; Nakoudi, K.; Ritter, C. Overview of Aerosol Properties in the European Arctic in Spring 2019 Based on In Situ Measurements and Lidar Data. Atmosphere 2021, 12, 271. [Google Scholar] [CrossRef]
- Weitkamp, C. Lidar: Range-Resolved Optical Remote Sensing of the Atmosphere; Springer Series in Optical Sciences; Springer: New York, NY, USA, 2005; Volume 102. [Google Scholar]
- Böckmann, C. Hybrid regularization method for the ill-posed inversion of multiwavelength lidar data in the retrieval of aerosol size distributions. Appl. Opt. 2001, 40, 1329–1342. [Google Scholar] [CrossRef] [PubMed]
- Müller, D.; Böckmann, C.; Kolgotin, A.; Schneidenbach, L.; Chemyakin, E.; Rosemann, J.; Znak, P.; Romanov, A. Microphysical particle properties derived from inversion algorithms developed in the framework of EARLINET. Atmos. Meas. Technol. 2016, 9, 5007–5035. [Google Scholar] [CrossRef]
- Hoffmann, A.; Osterloh, L.; Stone, R.; Lampert, A.; Ritter, C.; Stock, M.; Tunved, P.; Hennig, T.; Böckmann, C.; Li, S.M.; et al. Remote sensing and in-situ measurements of tropospheric aerosol, a PAMARCMiP case study. Atmos. Environ. 2012, 52, 56–66. [Google Scholar] [CrossRef]
- Ferrero, L.; Ritter, C.; Cappelletti, D.; Moroni, B.; Močnik, G.; Mazzola, M.; Lupi, A.; Becagli, S.; Traversi, R.; Cataldi, M.; et al. Aerosol optical properties in the Arctic: The role of aerosol chemistry and dust composition in a closure experiment between Lidar and tethered balloon vertical profiles. Sci. Total Environ. 2019, 686, 452–467. [Google Scholar] [CrossRef]
- Thomas, M.A.; Devasthale, A.; Tjernström, M.; Ekman, A.M. The relation between aerosol vertical distribution and temperature inversions in the Arctic in winter and spring. Geophys. Res. Lett. 2019, 46, 2836–2845. [Google Scholar] [CrossRef]
- Nakoudi, K.; Ritter, C.; Böckmann, C.; Kunkel, D.; Eppers, O.; Rozanov, V.; Mei, L.; Pefanis, V.; Jäkel, E.; Herber, A.; et al. Does the intra-Arctic modification of long-range transported aerosol affect the local radiative budget? (A case study). Remote Sens. 2020, 12, 2112. [Google Scholar] [CrossRef]
- Moroni, B.; Becagli, S.; Bolzacchini, E.; Busetto, M.; Cappelletti, D.; Crocchianti, S.; Ferrero, L.; Frosini, D.; Lanconelli, C.; Lupi, A.; et al. Vertical profiles and chemical properties of aerosol particles upon Ny-Ålesund (Svalbard Islands). Adv. Meteorol. 2015, 2015, 292081. [Google Scholar] [CrossRef]
- Veselovskii, I.; Kolgotin, A.; Griaznov, V.; Müller, D.; Wandinger, U.; Whiteman, D.N. Inversion with regularization for the retrieval of tropospheric aerosol parameters from multiwavelength lidar sounding. Appl. Opt. 2002, 41, 3685–3699. [Google Scholar] [CrossRef] [PubMed]
- Kolgotin, A.; Müller, D.; Romanov, A. Particle Microphysical Parameters and the Complex Refractive Index from 3β + 2α HSRL/Raman Lidar Measurements: Conditions of Accurate Retrieval, Retrieval Uncertainties and Constraints to Suppress the Uncertainties. Atmosphere 2023, 14, 1159. [Google Scholar] [CrossRef]
- Sorrentino, A.; Sannino, A.; Spinelli, N.; Piana, M.; Boselli, A.; Tontodonato, V.; Castellano, P.; Wang, X. A Bayesian parametric approach to the retrieval of the atmospheric number size distribution from lidar data. Atmos. Meas. Technol. 2022, 15, 149–164. [Google Scholar] [CrossRef]
- Illingworth, A.J.; Cimini, D.; Haefele, A.; Haeffelin, M.; Hervo, M.; Kotthaus, S.; Löhnert, U.; Martinet, P.; Mattis, I.; O’connor, E.; et al. How can existing ground-based profiling instruments improve European weather forecasts? Bull. Am. Meteorol. Soc. 2019, 100, 605–619. [Google Scholar] [CrossRef]
- Pentikäinen, P.; O’Connor, E.J.; Manninen, A.J.; Ortiz-Amezcua, P. Methodology for deriving the telescope focus function and its uncertainty for a heterodyne pulsed Doppler lidar. Atmos. Meas. Technol. 2020, 13, 2849–2863. [Google Scholar] [CrossRef]
- Shangguan, M.; Qiu, J.; Yuan, J.; Shu, Z.; Zhou, L.; Xia, H. Doppler Wind Lidar from UV to NIR: A Review with Case Study Examples. Front. Remote Sens. 2022, 2, 787111. [Google Scholar] [CrossRef]
- Heese, B.; Flentje, H.; Althausen, D.; Ansmann, A.; Frey, S. Ceilometer lidar comparison: Backscatter coefficient retrieval and signal-to-noise ratio determination. Atmos. Meas. Technol. 2010, 3, 1763–1770. [Google Scholar] [CrossRef]
- Román, R.; Benavent-Oltra, J.A.; Casquero-Vera, J.A.; Lopatin, A.; Cazorla, A.; Lyamani, H.; Denjean, C.; Fuertes, D.; Pérez-Ramírez, D.; Torres, B.; et al. Retrieval of aerosol profiles combining sunphotometer and ceilometer measurements in GRASP code. Atmos. Res. 2018, 204, 161–177. [Google Scholar] [CrossRef]
- Morris, V.; Winston, H.A. Laser Ceilometer CL51 Demonstration Field Campaign Report; Technical Report; DOE Office of Science Atmospheric Radiation Measurement (ARM) Program: Washington, DC, USA, 2016.
- Hoffmann, A. Comparative Aerosol Studies Based on Multi-Wavelength Raman LIDAR at Ny-Ålesund, Spitsbergen. Ph.D. Thesis, Universität Potsdam, Potsdam, Germany, 2011. [Google Scholar]
- Dube, J.; Böckmann, C.; Ritter, C. Lidar-Derived Aerosol Properties from Ny-Ålesund, Svalbard during the MOSAiC Spring 2020. Remote Sens. 2022, 14, 2578. [Google Scholar] [CrossRef]
- Ritter, C.; Burgos, M.A.; Böckmann, C.; Mateos, D.; Lisok, J.; Markowicz, K.; Moroni, B.; Cappelletti, D.; Udisti, R.; Maturilli, M.; et al. Microphysical properties and radiative impact of an intense biomass burning aerosol event measured over Ny-Ãlesund, Spitsbergen in July 2015. Tellus Chem. Phys. Meteorol. 2018, 70, 1–23. [Google Scholar] [CrossRef]
- Shang, X.; Mielonen, T.; Lipponen, A.; Giannakaki, E.; Leskinen, A.; Buchard, V.; Darmenov, A.S.; Kukkurainen, A.; Arola, A.; O’Connor, E.; et al. Mass concentration estimates of long-range-transported Canadian biomass burning aerosols from a multi-wavelength Raman polarization lidar and a ceilometer in Finland. Atmos. Meas. Technol. 2021, 14, 6159–6179. [Google Scholar] [CrossRef]
- Gryning, S.E.; Batchvarova, E.; Floors, R.; Münkel, C.; Sørensen, L.L.; Skov, H. Observed aerosol-layer depth at Station Nord in the high Arctic. Int. J. Climatol. 2023, 43, 3247–3263. [Google Scholar] [CrossRef]
- Wiegner, M.; Mattis, I.; Pattantyús-Ábrahám, M.; Bravo-Aranda, J.A.; Poltera, Y.; Haefele, A.; Hervo, M.; Görsdorf, U.; Leinweber, R.; Gasteiger, J.; et al. Aerosol backscatter profiles from ceilometers: Validation of water vapor correction in the framework of CeiLinEx2015. Atmos. Meas. Technol. 2019, 12, 471–490. [Google Scholar] [CrossRef]
- Vakkari, V.; Baars, H.; Bohlmann, S.; Bühl, J.; Komppula, M.; Mamouri, R.E.; O’Connor, E.J. Aerosol particle depolarization ratio at 1565 nm measured with a Halo Doppler lidar. Atmos. Chem. Phys. 2021, 21, 5807–5820. [Google Scholar] [CrossRef]
- Le, V.; Lobo, H.; O’Connor, E.J.; Vakkari, V. Long-term aerosol particle depolarization ratio measurements with HALO Photonics Doppler lidar. Atmos. Meas. Technol. 2024, 17, 921–941. [Google Scholar] [CrossRef]
- Samaras, S.; Nicolae, D.; Böckmann, C.; Vasilescu, J.; Binietoglou, I.; Labzovskii, L.; Toanca, F.; Papayannis, A. Using Raman-lidar-based regularized microphysical retrievals and Aerosol Mass Spectrometer measurements for the characterization of biomass burning aerosols. J. Comput. Phys. 2015, 299, 156–174. [Google Scholar] [CrossRef]
- Böckmann, C.; Mironova, I.; Müller, D.; Schneidenbach, L.; Nessler, R. Microphysical aerosol parameters from multiwavelength lidar. J. Opt. Soc. Am. A 2005, 22, 518–528. [Google Scholar] [CrossRef]
- Böckmann, C.; Kirsche, A. Iterative regularization method for lidar remote sensing. Comput. Phys. Commun. 2006, 174, 607–615. [Google Scholar] [CrossRef]
- Osterloh, L.; Böckmann, C.; Mamouri, R.E.; Papayannis, A. An Adaptive Base Point Algorithm for the Retrieval of Aerosol Microphysical Properties. Open Atmos. Sci. J. 2011, 5, 61–73. [Google Scholar] [CrossRef]
- Engl, H.W.; Hanke, M.; Neubauer, A. Regularization of Inverse Problems; Mathematics and Its Applications; Springer: Dordrecht, The Netherlands, 2000. [Google Scholar]
- Samaras, S.; Böckmann, C.; Ritter, C. Modeling a Spheroidal Particle Ensemble and Inversion by Generalized Runge-Kutta Regularizers from Limited Data. AppliedMath 2022, 2, 547–573. [Google Scholar] [CrossRef]
- Kirsche, A.; Böckmann, C. Padé iteration method for regularization. Appl. Math. Comput. 2006, 180, 648–663. [Google Scholar] [CrossRef]
- Kirsch, A. An Introduction to the Mathematical Theory of Inverse Problems; Springer Nature: Cham, Switzerland, 2021. [Google Scholar]
- Samoilova, S.; Kokhanenko, G.; Balin, Y. Advantages of an Additional Raman Channel in Laser Sounding at Wavelengths of 355–1064 nm for Retrieving Microphysical Parameters of Atmospheric Aerosol. Atmos. Ocean. Opt. 2024, 36, 701–715. [Google Scholar] [CrossRef]
- Osterloh, L.; Böckmann, C.; Nicolae, D.; Nemuc, A. Regularized inversion of microphysical atmospheric particle parameters: Theory and application. J. Comput. Phys. 2013, 237, 79–94. [Google Scholar] [CrossRef]
- Osterloh, L.; Böckmann, C.; Nicolae, D.; Nemuc, A. Corrigendum to “Regularized inversion of microphysical atmospheric particle parameters: Theory and application” [J. Comput. Phys. 237 (2013) 79–94]. J. Comput. Phys. 2014, 275, 696. [Google Scholar] [CrossRef]
- Jin, J.; Henzing, B.; Segers, A. How aerosol size matters in aerosol optical depth (AOD) assimilation and the optimization using the Ångström exponent. Atmos. Chem. Phys. 2023, 23, 1641–1660. [Google Scholar] [CrossRef]
- Klett, J.D. Lidar inversion with variable backscatter/extinction ratios. Appl. Opt. 1985, 24, 1638–1643. [Google Scholar] [CrossRef]
Disclaimer/Publisher’s Note: The statements, opinions and data contained in all publications are solely those of the individual author(s) and contributor(s) and not of MDPI and/or the editor(s). MDPI and/or the editor(s) disclaim responsibility for any injury to people or property resulting from any ideas, methods, instructions or products referred to in the content. |
© 2024 by the authors. Licensee MDPI, Basel, Switzerland. This article is an open access article distributed under the terms and conditions of the Creative Commons Attribution (CC BY) license (https://creativecommons.org/licenses/by/4.0/).