Communication

A Simple Artificial Neural Model to Predict Dambovita River Temperature Affected by Urban Heat Islands in Bucharest City

by
Cristina-Sorana Ionescu
1,
Ioana Opriș
2,*,
Daniela-Elena Gogoașe Nistoran
1 and
Cristian Copilău
2
1
Department of Hydraulics, Hydraulic Machinery and Environmental Engineering, Faculty of Energy Engineering, National University of Science and Technology Politehnica Bucharest, 060042 Bucuresti, Romania
2
Department of Power Generation and Use, Faculty of Energy Engineering, National University of Science and Technology Politehnica Bucharest, 060042 Bucuresti, Romania
*
Author to whom correspondence should be addressed.
Remote Sens. 2024, 16(9), 1513; https://doi.org/10.3390/rs16091513
Submission received: 23 March 2024 / Revised: 18 April 2024 / Accepted: 19 April 2024 / Published: 25 April 2024

Abstract

:
Water bodies can offer local microclimates that have the potential to attenuate the effects of urban heat islands by reducing local temperature. This capability is shaded when the river is channelized. In such cases, the river temperature rises during hot periods, leading to negative impacts on the water quality. The main aim of this paper is to develop a local simple model to predict the temperature of the Dâmbovița River at its exit from Bucharest City, the capital of Romania. The location is chosen based on the historical critical impacts, in terms of extreme heatwaves that took place during hot summers, as well as future possible risks due to climate change. The water temperature prediction model is based on an artificial neural network that uses the Levenberg–Marquardt algorithm, due to its stability and rapid convergence capabilities. The model forecasts, with an accuracy of ±1 °C, the water temperature in an ungauged, downstream location, as a function of measured air and upstream water temperatures. The proposed model represents a first attempt to provide water managers in Bucharest City with a useful tool that will allow them to take timely measures to counteract the unwanted effects that can be generated by high water temperatures.

1. Introduction

Climate change is increasingly putting an enormous stress on the inhabitants living in big cities, particularly in regions prone to extreme heatwaves. Land-use and land cover changes induced by growing urbanization and a reduction in green areas generate the so-called heat island effect. Since buildings and infrastructures absorb and retain heat more so than natural surfaces [1,2], new research on modern cooling materials to lower the temperature of constructions and urban open spaces started to develop [3]. Moreover, data show [4] a clear link between urban heat islands and urban pollution islands in big cities.
Water bodies, such as rivers, lakes and reservoirs can offer local microclimates that have the potential to attenuate the effects of urban heat islands by reducing local temperature during the daylight hours [5,6,7]. Several studies [7,8] analyzed the cooling distance and the maximum temperature drop near a water body, whereas other researchers revealed that even small water bodies (of the scale of 100 m) can reduce heat stress [9]. This capability is diminished in cases of anthropogenic impact, when the rivers are channelized, due to their concrete banks and bed structures, as well as the absence of cooler recharge from groundwater [10]. Moreover, in such cases, the raising of the river temperature during hot periods has a negative impact on the water quality, reducing the dissolved oxygen and threatening the aquatic life [11]. Forecasts regarding the health of river ecosystems are strongly relying on river water temperature [12]. Therefore, prediction of the water temperature would be beneficial to allow for quick measures to be taken, in due time, to avoid or at least reduce their undesired effects.
River water temperature prediction has recently been simulated based on artificial intelligence [13,14]. Among the important drivers that greatly increase the model efficiency are the discharge [15,16], the solar radiation, and the cloudiness [17,18].
Water temperature prediction models should rely on extensive local databases including time series of solar radiation, air and water temperature, wind speed and direction, atmospheric pressure, and humidity, among others. The task of developing a generalized model that could reliably simulate the meteorological data–river water temperature nexus is both difficult and time-consuming [19]. When such complex data lack for channelized rivers within urban areas that are exposed to extremely critical heatwaves, and quick measures need to be taken to avoid critical consequences on the water biota, simpler models should be developed and used.
Such models are based on artificial neural networks (ANNs), which are recommended when dealing with noisy data [20,21], which is the case with meteorological data [22]. In the field of ANNs, the Levenberg–Marquardt algorithm is considered to be suitable due to its stable and rapid convergence [23].
The main aim of this paper is to develop a simple model to rapidly predict the temperature of Dâmbovița River, downstream of Bucharest City, Romania. The location is chosen based on the historical critical impacts, in terms of the extreme heatwaves that took place during hot summers [24] that pose a risk to become more frequent due to climate change. The proposed model represents a first attempt to provide water managers in Bucharest City with a useful tool allowing them to take timely measures to counteract unwanted effects that can be generated by high water temperatures during summers.

2. Materials and Methods
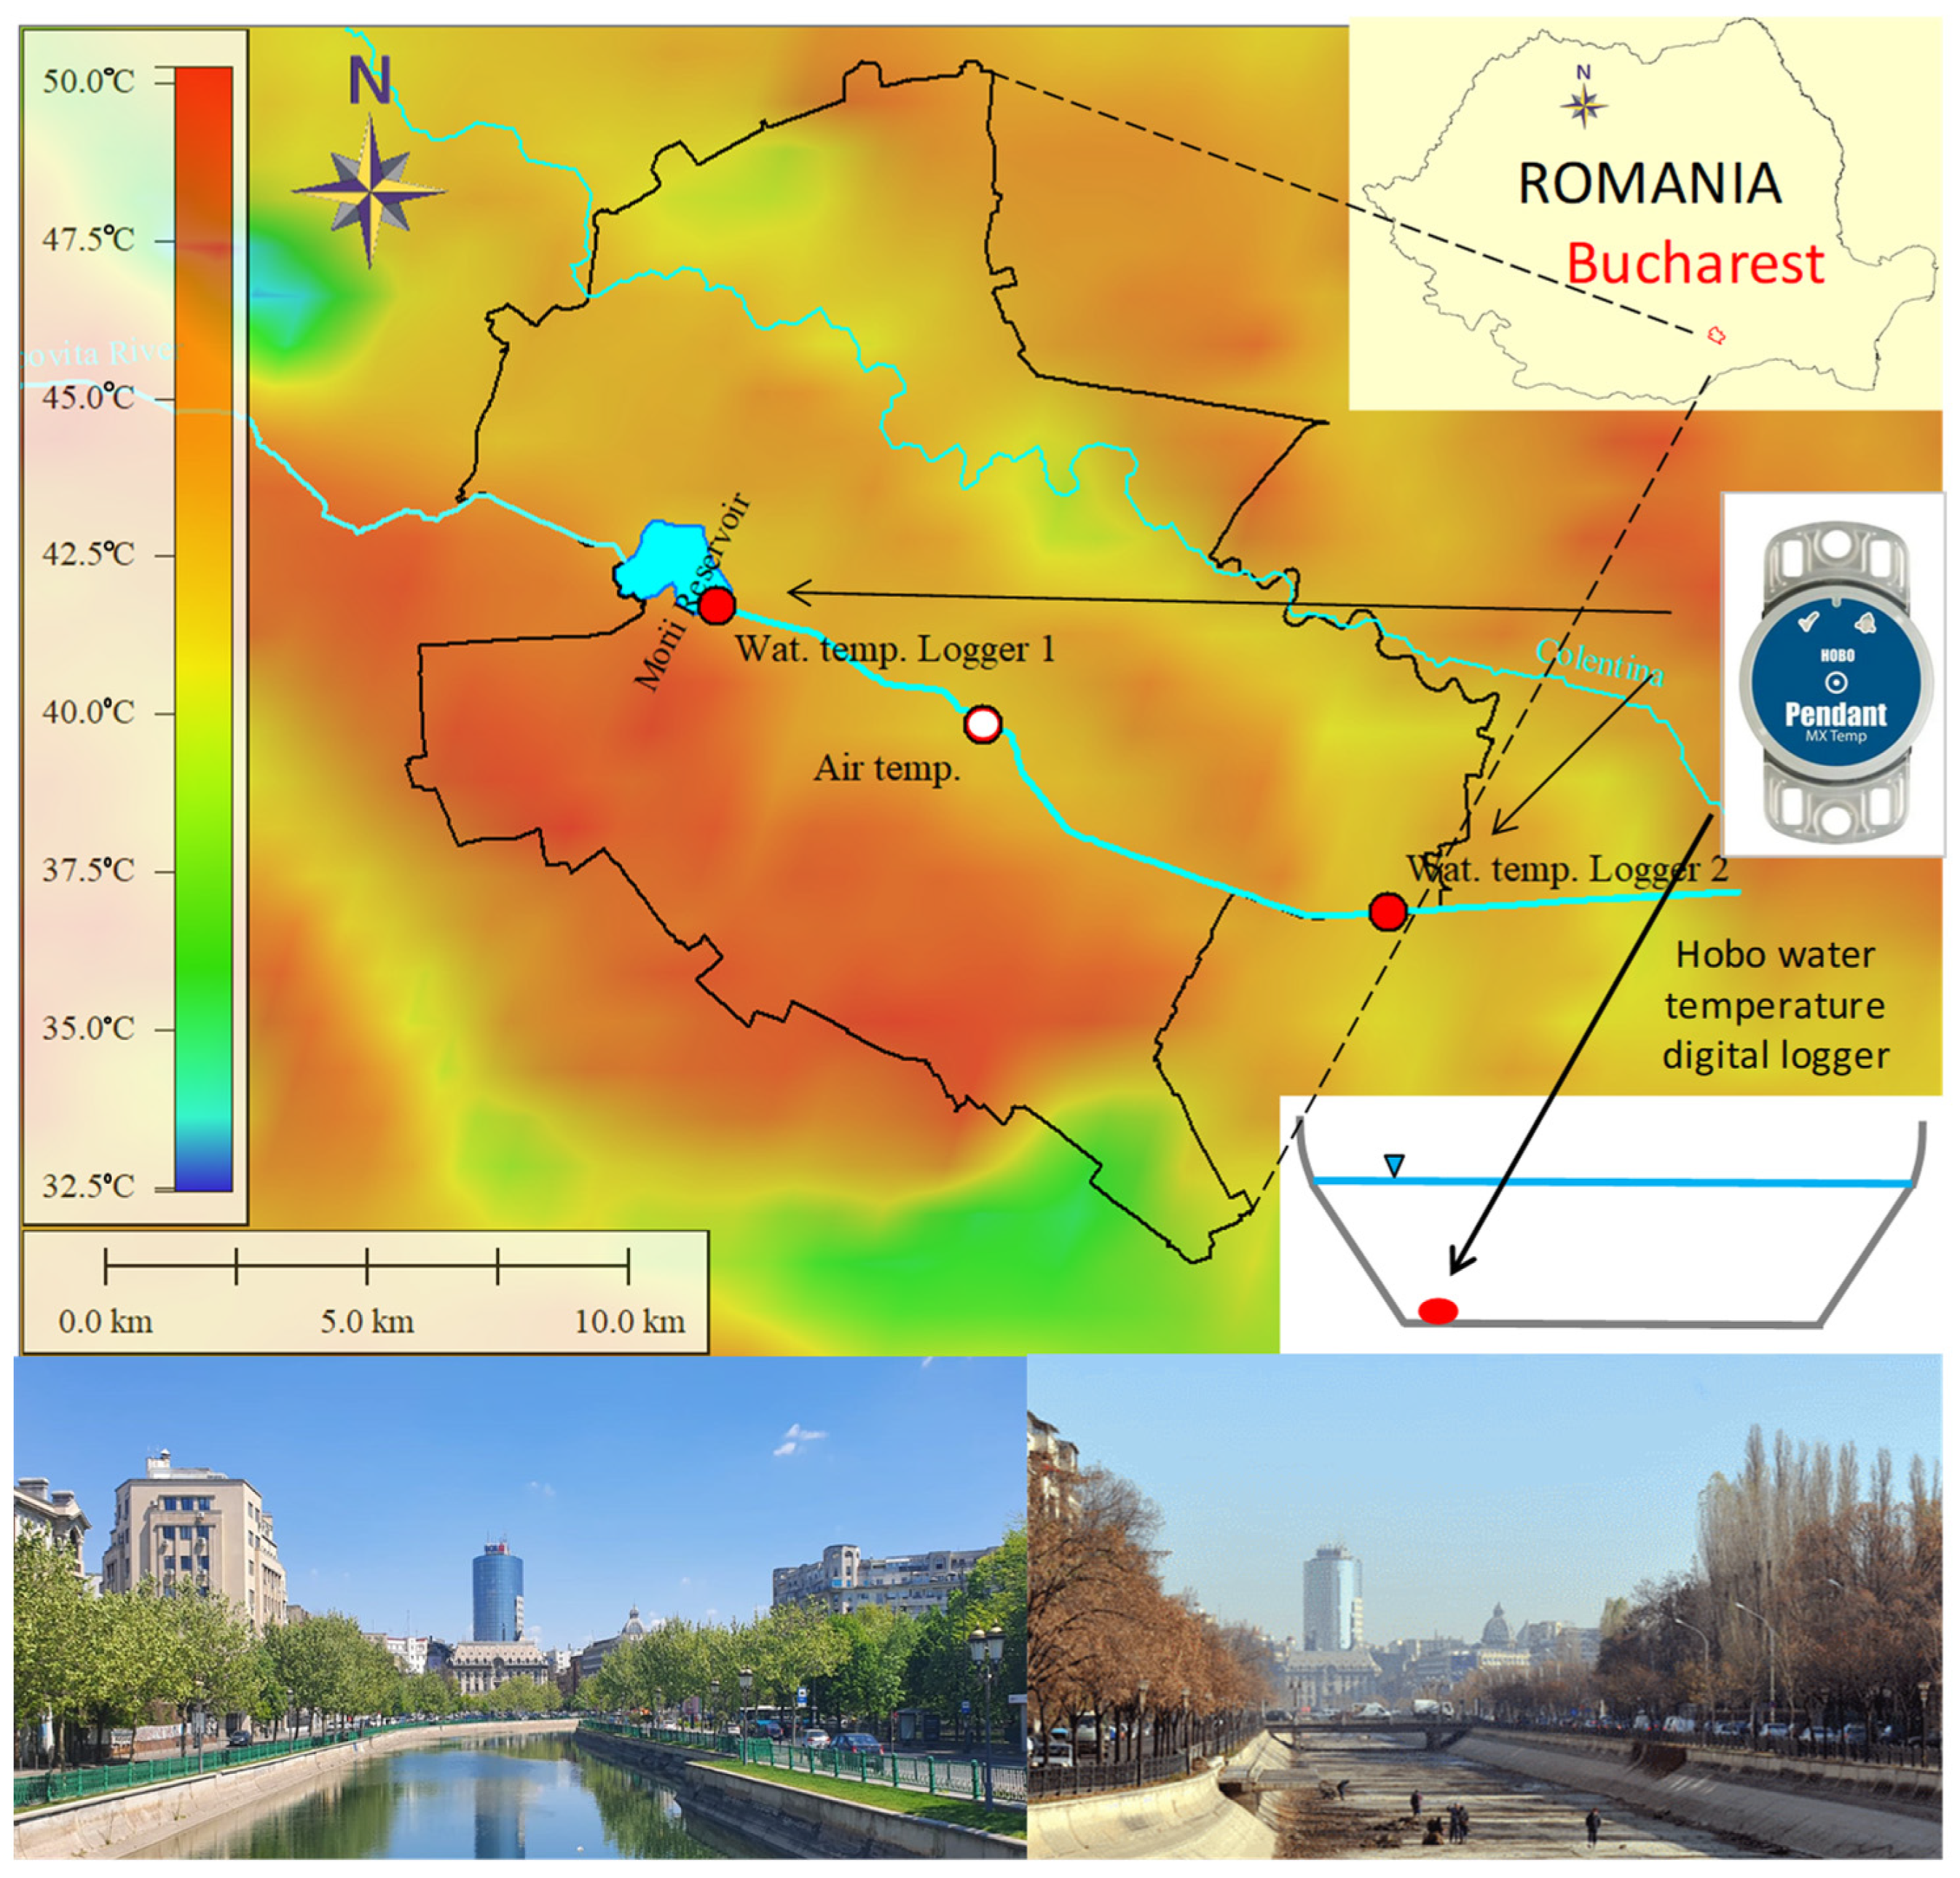
2.1. Study Area

Bucharest City, the capital of Romania, has a population of about 2.2 million inhabitants. 70% of its total area of 240 sqkm. is covered by buildings and different types of infrastructures. It is crossed from the northwest to the southeast by the following two streams: Dâmbovița River—highly anthropized—and Colentina River—mainly natural (Figure 1). In order to protect the city from flooding, to properly manage urban wastewater and runoff, and to avoid groundwater pollution, channelization engineering works were carried out at the end of the 1990s on the Dambovita River [25]. The cross-section of the urban river was enlarged and deepened for better landscape and possible navigation. At the entrance of the Dâmbovița River to Bucharest, an embankment dam, 15 m in height, (Ciurel dam) was built, giving rise to a 14.7 million m3 reservoir [26]. The Morii Reservoir has a maximum depth of 9 m and an area of 260 ha for the Normal Operation Pool elevation [27].
Summers can be quite hot in Bucharest, creating an urban heat island effect [28]. In 2020, expeditionary temperature measurements were conducted on the 27 July at several depths in the reservoir, which proved a decrease from 29.5 °C at the water surface to 25 °C at the bottom of the lake, near the dam. To take advantage of the temperature variability with the depth of this water body during hot summers, water managers release cooler water in the Dambovita canal through the City from the reservoir, by opening the bottom outlet gates instead of the surface flap gates at the dam. However, the temperature of the river water increases as it passes through the city.
To show the cooling effect of the two rivers and of the Morii Reservoir on the land surface temperatures (LSTs), Modis satellite images of daily mean LST (MOD11A1, Moderate Resolution Imaging Spectroradiometer), available from the Aqua platform [29,30], were retrieved for one of the hottest summer days in the last four decades and are displayed over the Bucharest map with the waterbodies (Figure 1).
Along its 17.5 km passing through Bucharest, the Dâmbovița River is channelized and divided into several connected pool reaches, separated by 11 control structures, consisting of gated, broad-crested weirs [31]. The dimensions of the trapezoidal cross section are as follows: top width—between 50 and 100 m; depth—between 1.5 and 4.5 m for normal pool level elevation along the reaches; and a mean bank slope of 1.5 over the entire stretch [31].
The river bed and banks are made of concrete, without any communication with the underground water. Along the river, there are intense traffic roads with multiple lanes, which intensify the urban heat during summers and increase the temperature of the water. This has led, over the last decade, to the development of algae blooming in the urban river—as other cases have reported [6,10,32]—as well as episodes of fish death in the Morii Reservoir (in 2017).
The discharge of the Dambovita River may range from the minimum value imposed by the ecological flow (3 m3/s) to a maximum value (45 m3/s), to avoid flooding the banks. However, hot summers in Bucharest are usually associated with droughts. Therefore, there is lack of water to increase the discharge over the summer, which could cool down the river. This is why water managers are forced to use only pulses of higher discharge, of a limited time, to decrease the water temperature.

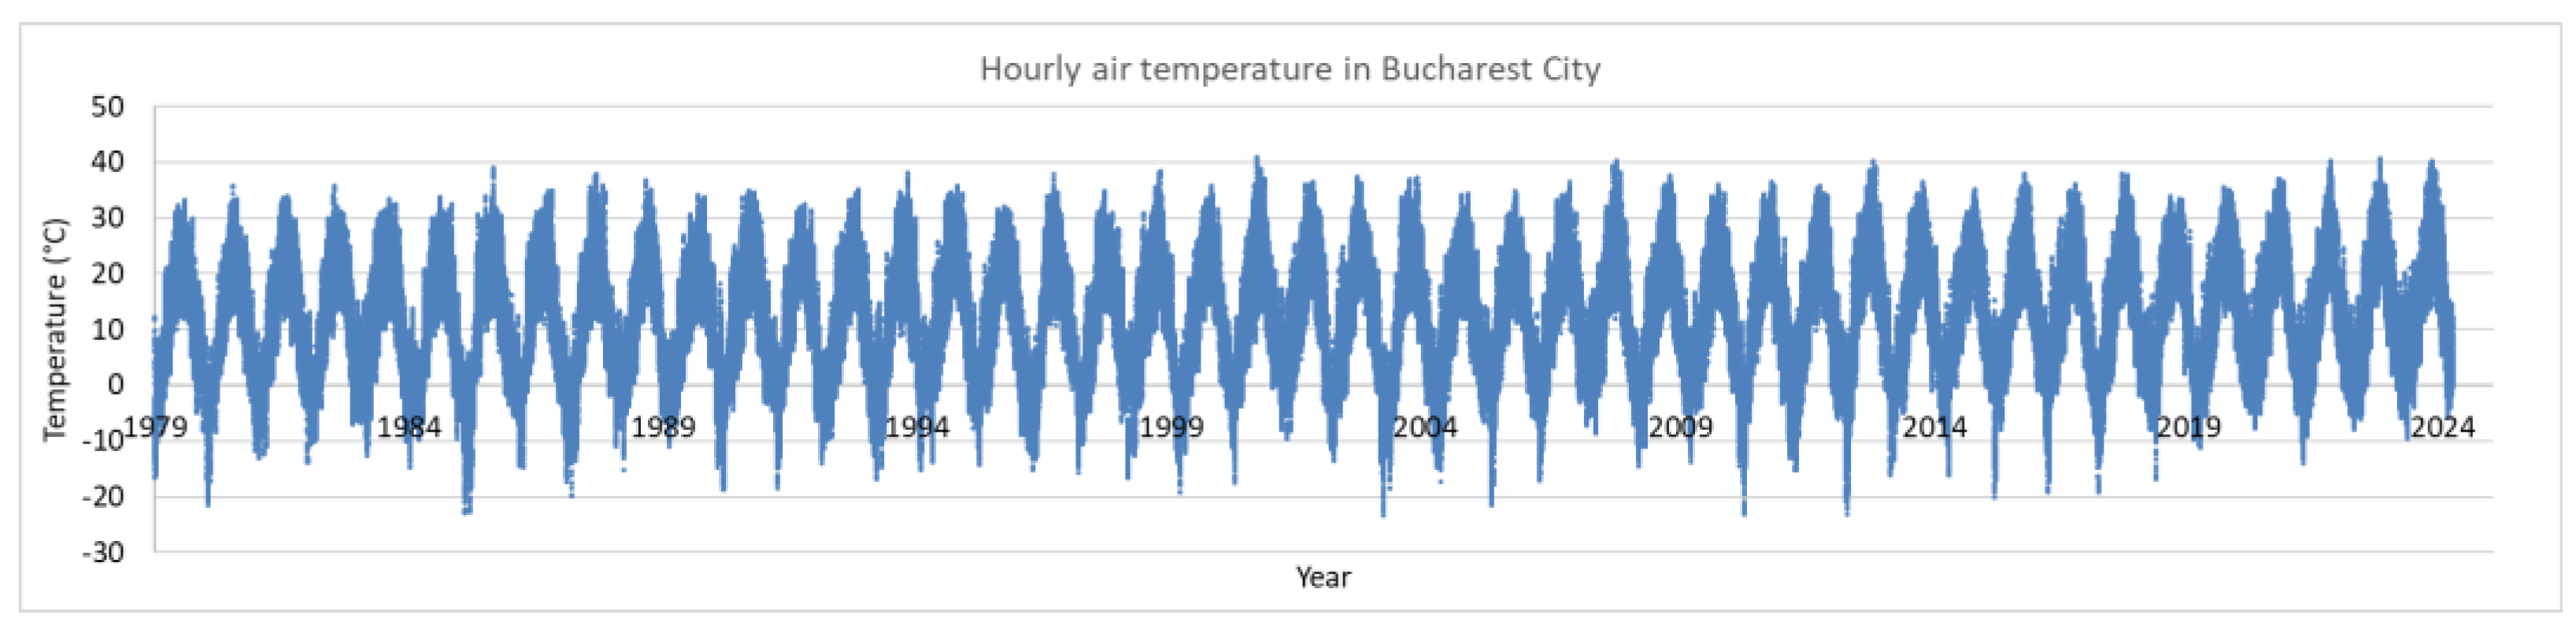
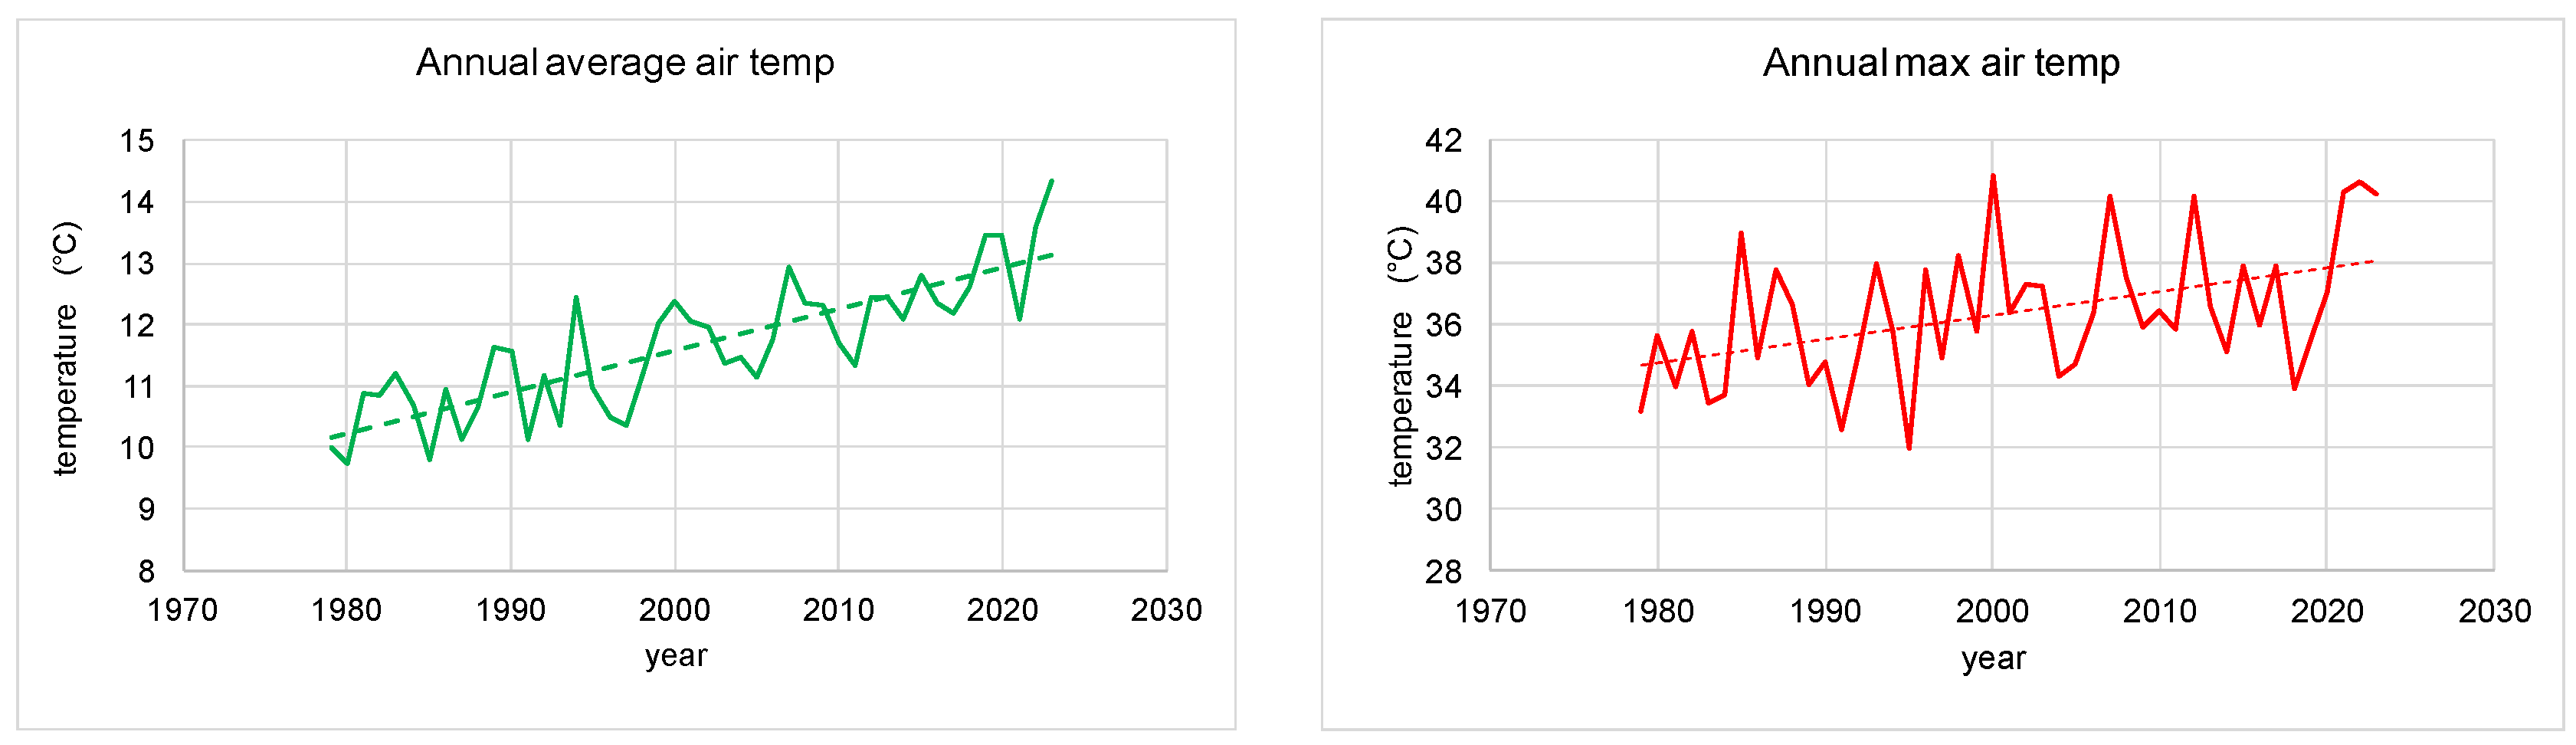
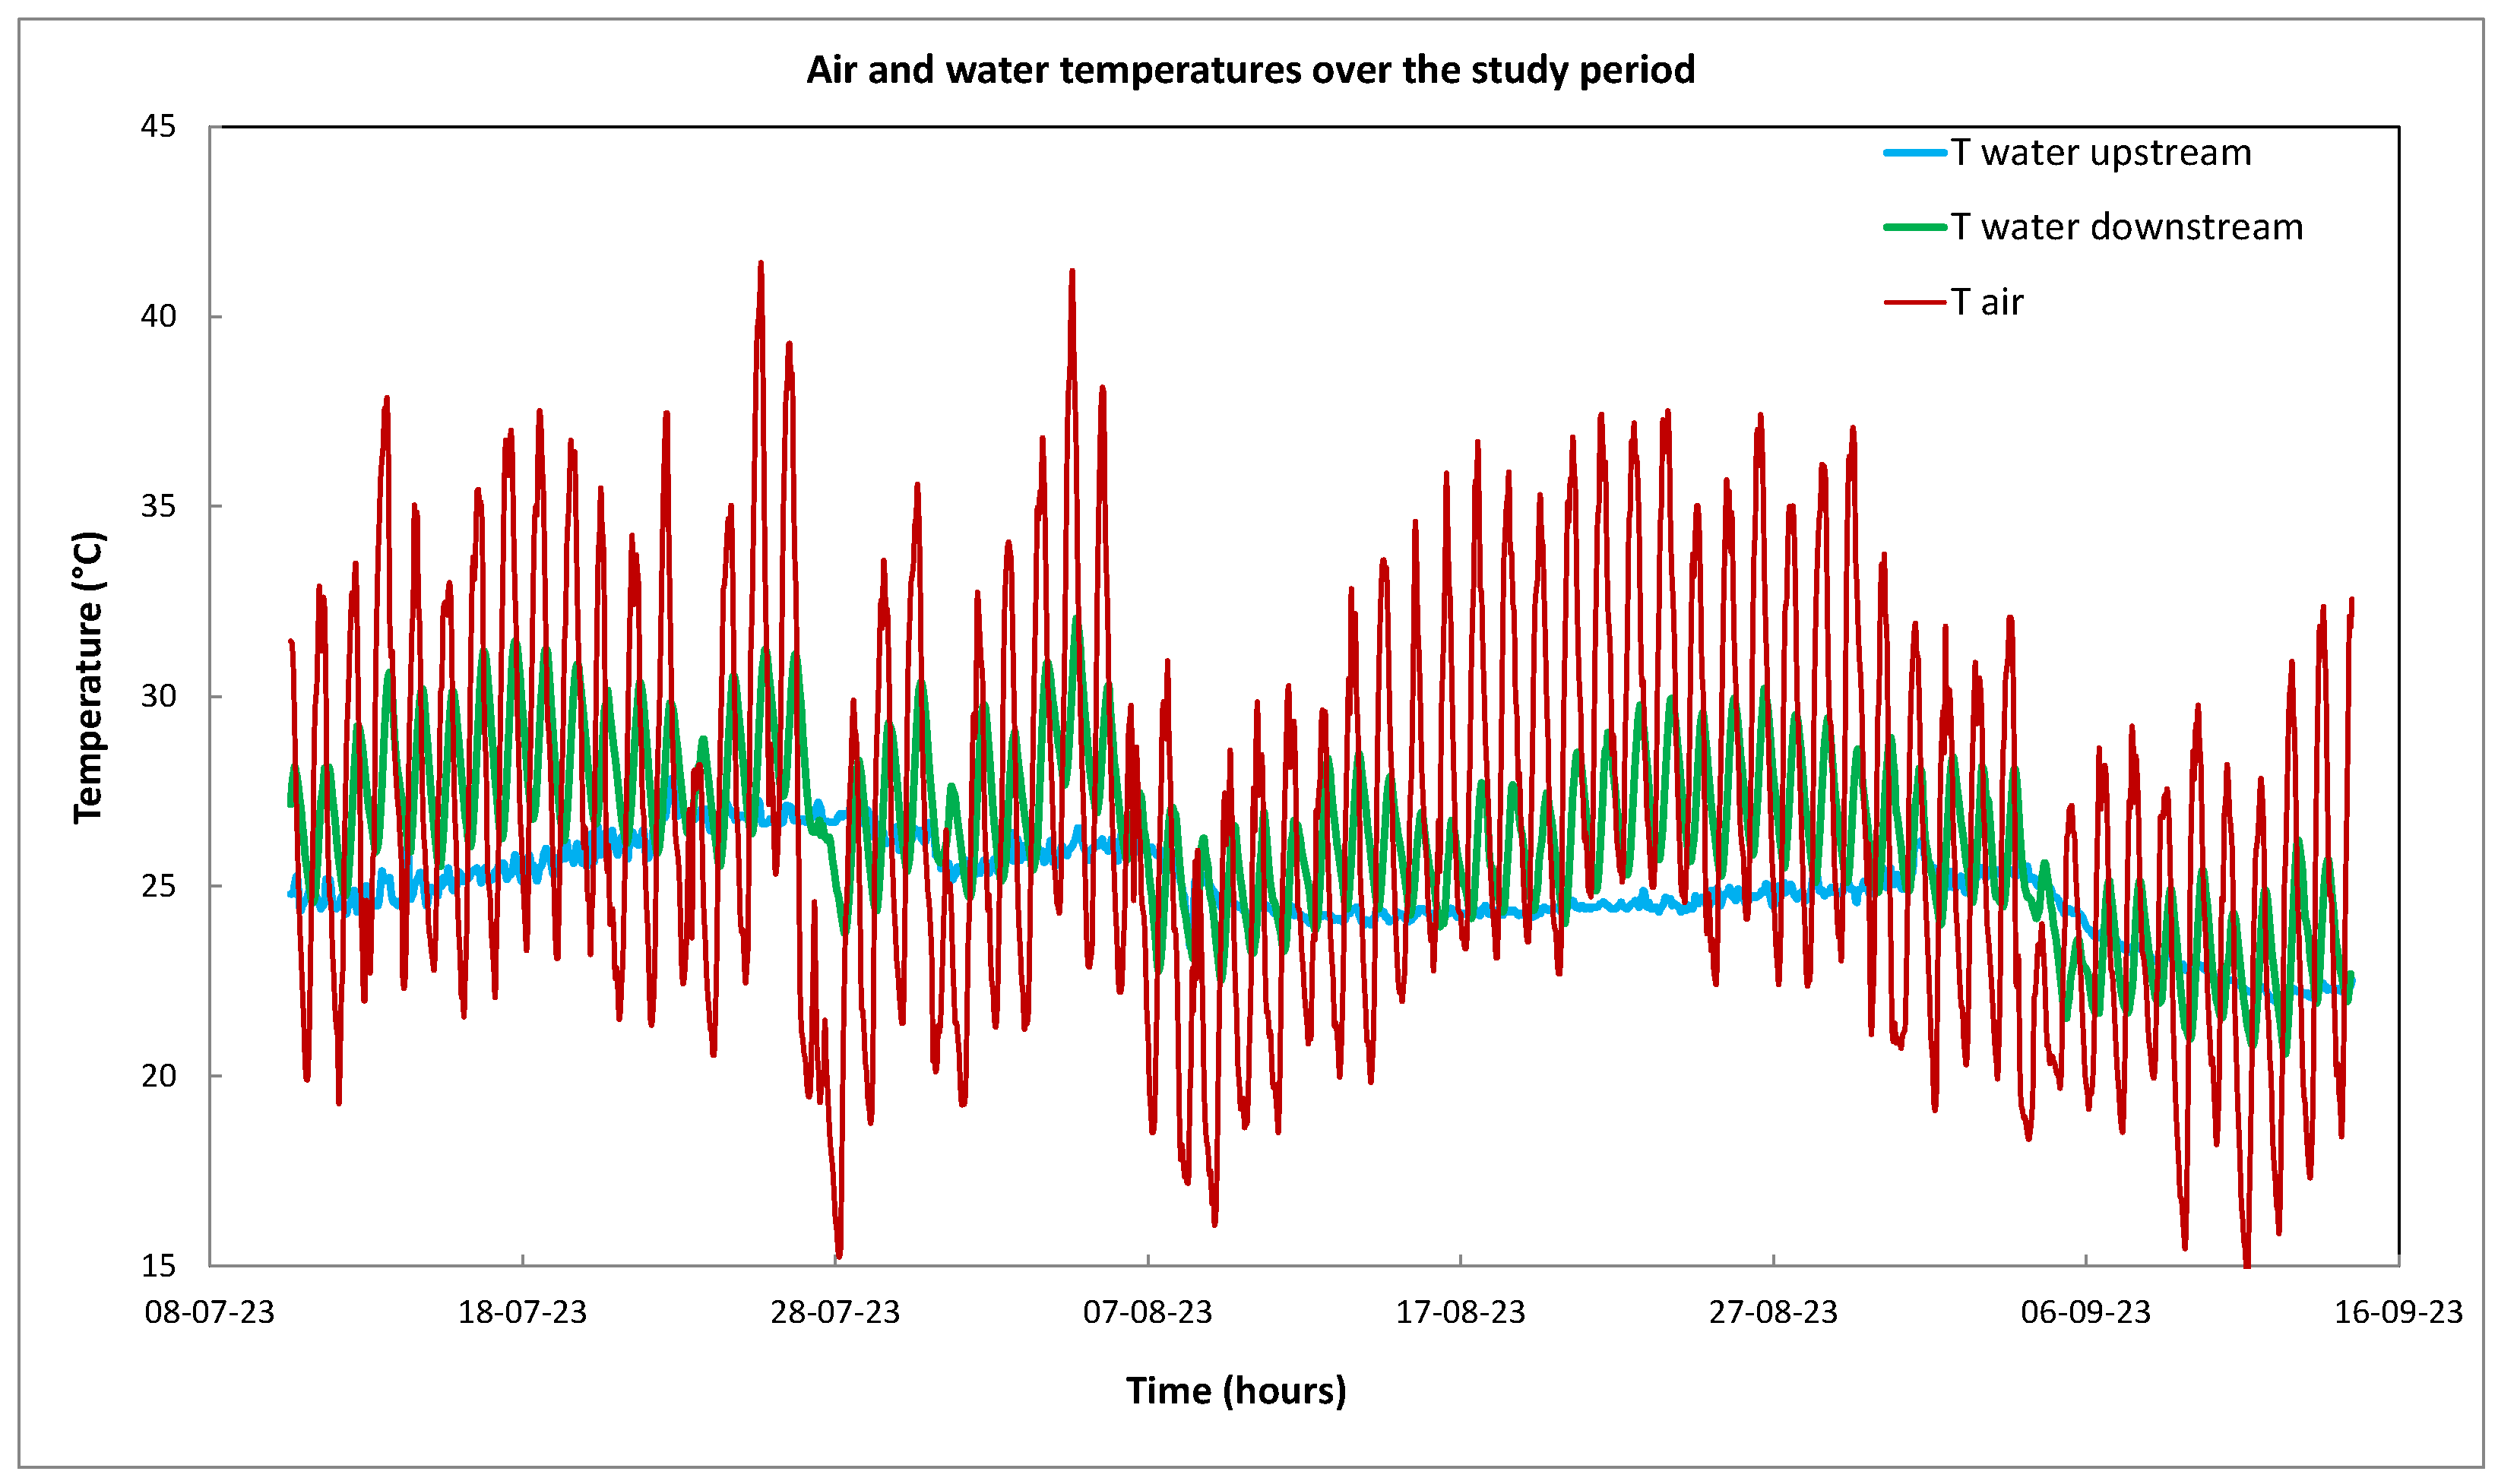
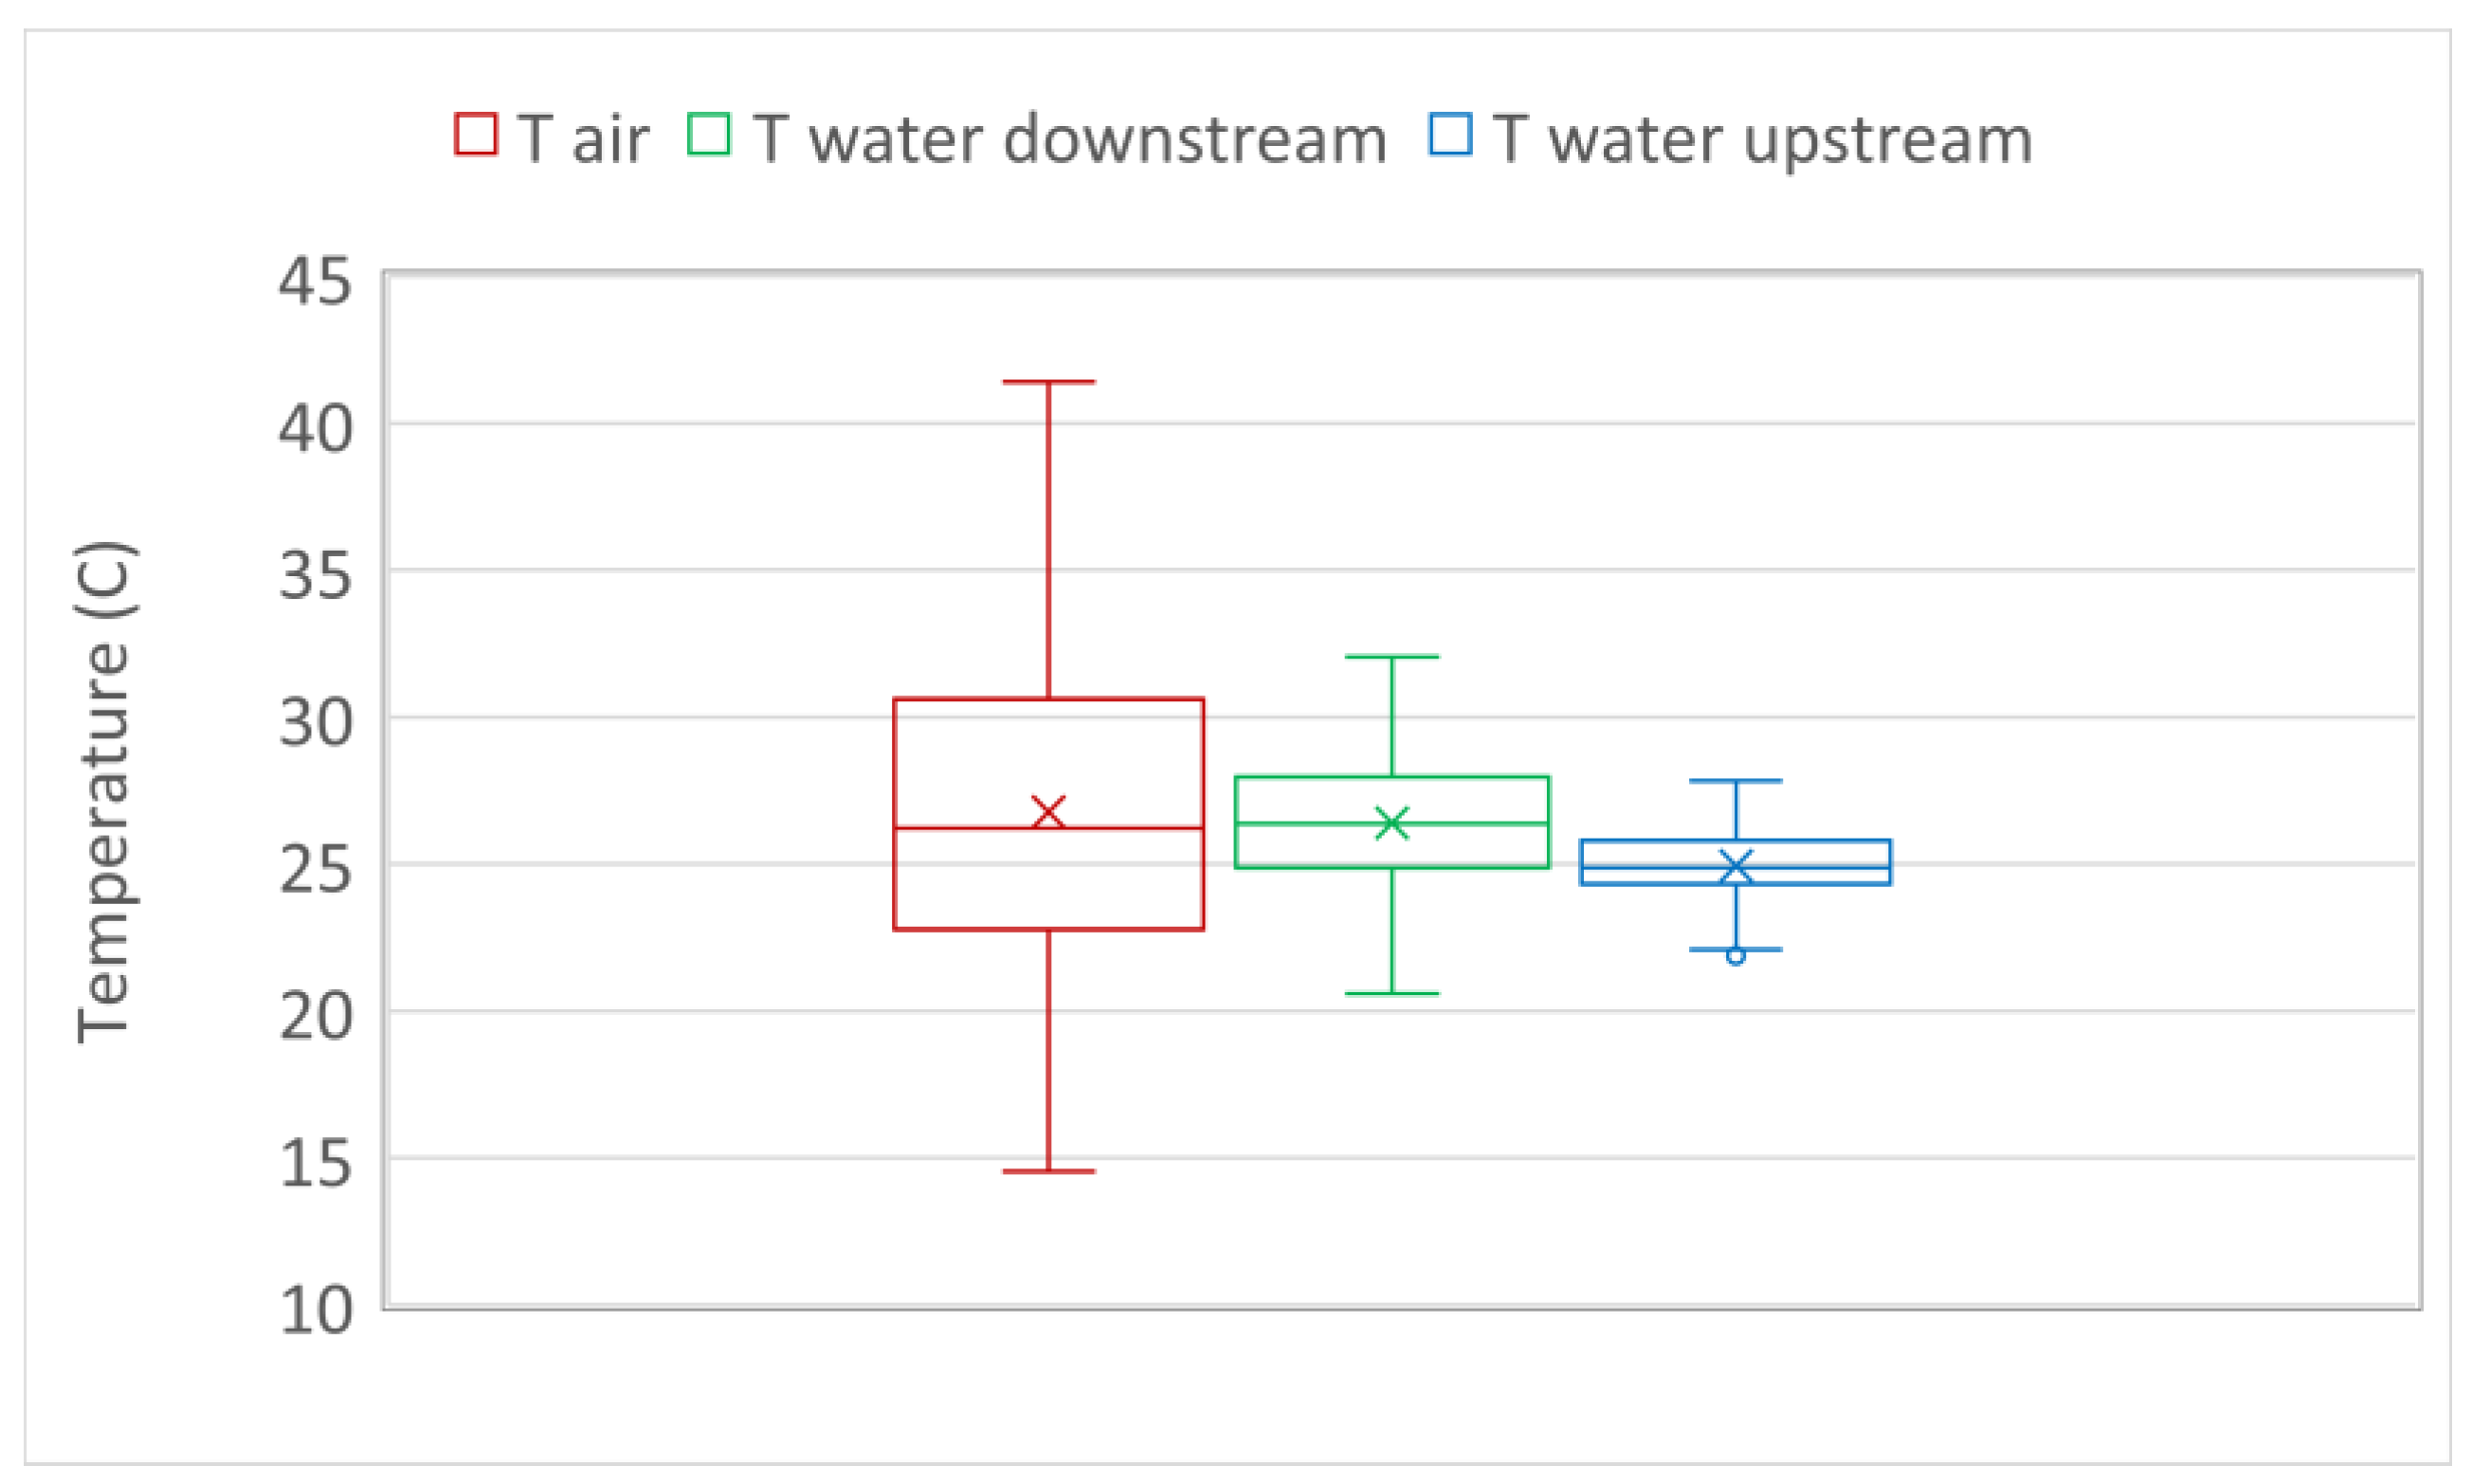
2.2. Air and Water Temperature Data

Historical data of the air temperature, with hourly steps, in Bucharest City, over the largest available period of 45 years, were obtained from OpenWeather [33]. The OpenWeather data are freely collected from multiple remote sensing and ground sources using technology such as satellites, radars, and a vast network of weather stations from different global meteorological companies, such as NOAA, Met Office, ECMWF, and Environment Canada [34]. The data are then processed over a spatial resolution of less than 2 km using the Openweather Numerical Weather prediction Model (NWM) algorithms, based on machine learning, to improve quality and accuracy.
OpenWeather carried out a test in a given location and a particular period for the processed air temperature data and indicated the following model performances: a Mean Absolute Error of about 0.5 °C, a Root Mean Square Error of less than 2 °C, a reliability higher than 90%, and an inaccuracy of 1% [35].
The variation in hourly air temperature data from OpenWeather in °C, between 1 January 1979 and 31 December 2023, in the center of Bucharest City (Piata Unirii, location co-ordinates, 44.43N, 26.10E), is shown in Figure 2.
To assess the trend of air temperature over the 45-year period, annual average and annual maximum values were computed and displayed (Figure 3). The plots show a continuous increase over the entire period, with a multi-annual hourly average value of 11.66 °C and a multi-annual hourly maximum value of 40.83 °C. Moreover, starting with the year 2000, one may observe an increase in the frequency of extreme values over 40 °C, such as in 2000, 2007, 2012, and, in particular, over the last three years—2021, 2022, and 2023.
Since water temperature is not measured along the Dambovita River by the National Water Authority—Romanian Waters—two digital loggers were placed on the canal invert near the right bank (Figure 1), at the upstream and downstream boundaries of the canal, to measure water temperature over the hottest summer period of 2023; one was placed in the stilling basin of the Ciurel dam and the other was placed at the exit of Bucharest City (Figure 1). The depth in the gauging cross-sections varies with discharge. Both loggers were placed at the same depth of 2 m, corresponding to the ecological flow of 3 m3/s.
The MX2201-type loggers are enabled with Bluetooth wireless technology. The accuracy indicated by the Onset manufacturing company is of ±0.5 °C, in the temperature range of −20 °C to 70 °C, with a resolution of 0.04 °C and a drift of 0.01 °C per year [36]. Hourly measurements of water temperature were acquired during a study period, between 10 July and 14 September 2023 (about 67 days, corresponding to 1600 h), and are displayed together with the air temperature in Figure 4.
A box plot of air and water temperature variability over this study period is shown in Figure 5. One may see a greater variability of river temperature at the city exit (green whiskers) compared to the water temperature released from the reservoir into the canal, at its upstream end (blue whiskers). Also, a greater difference, of about 10 °C, between the maximum air (upper red whisker) and maximum water temperature at the downstream river boundary (upper green whisker) may be observed in comparison with the corresponding minimum values, of only 6 °C (lower whiskers). Similar observations were reported by Briciu [37].

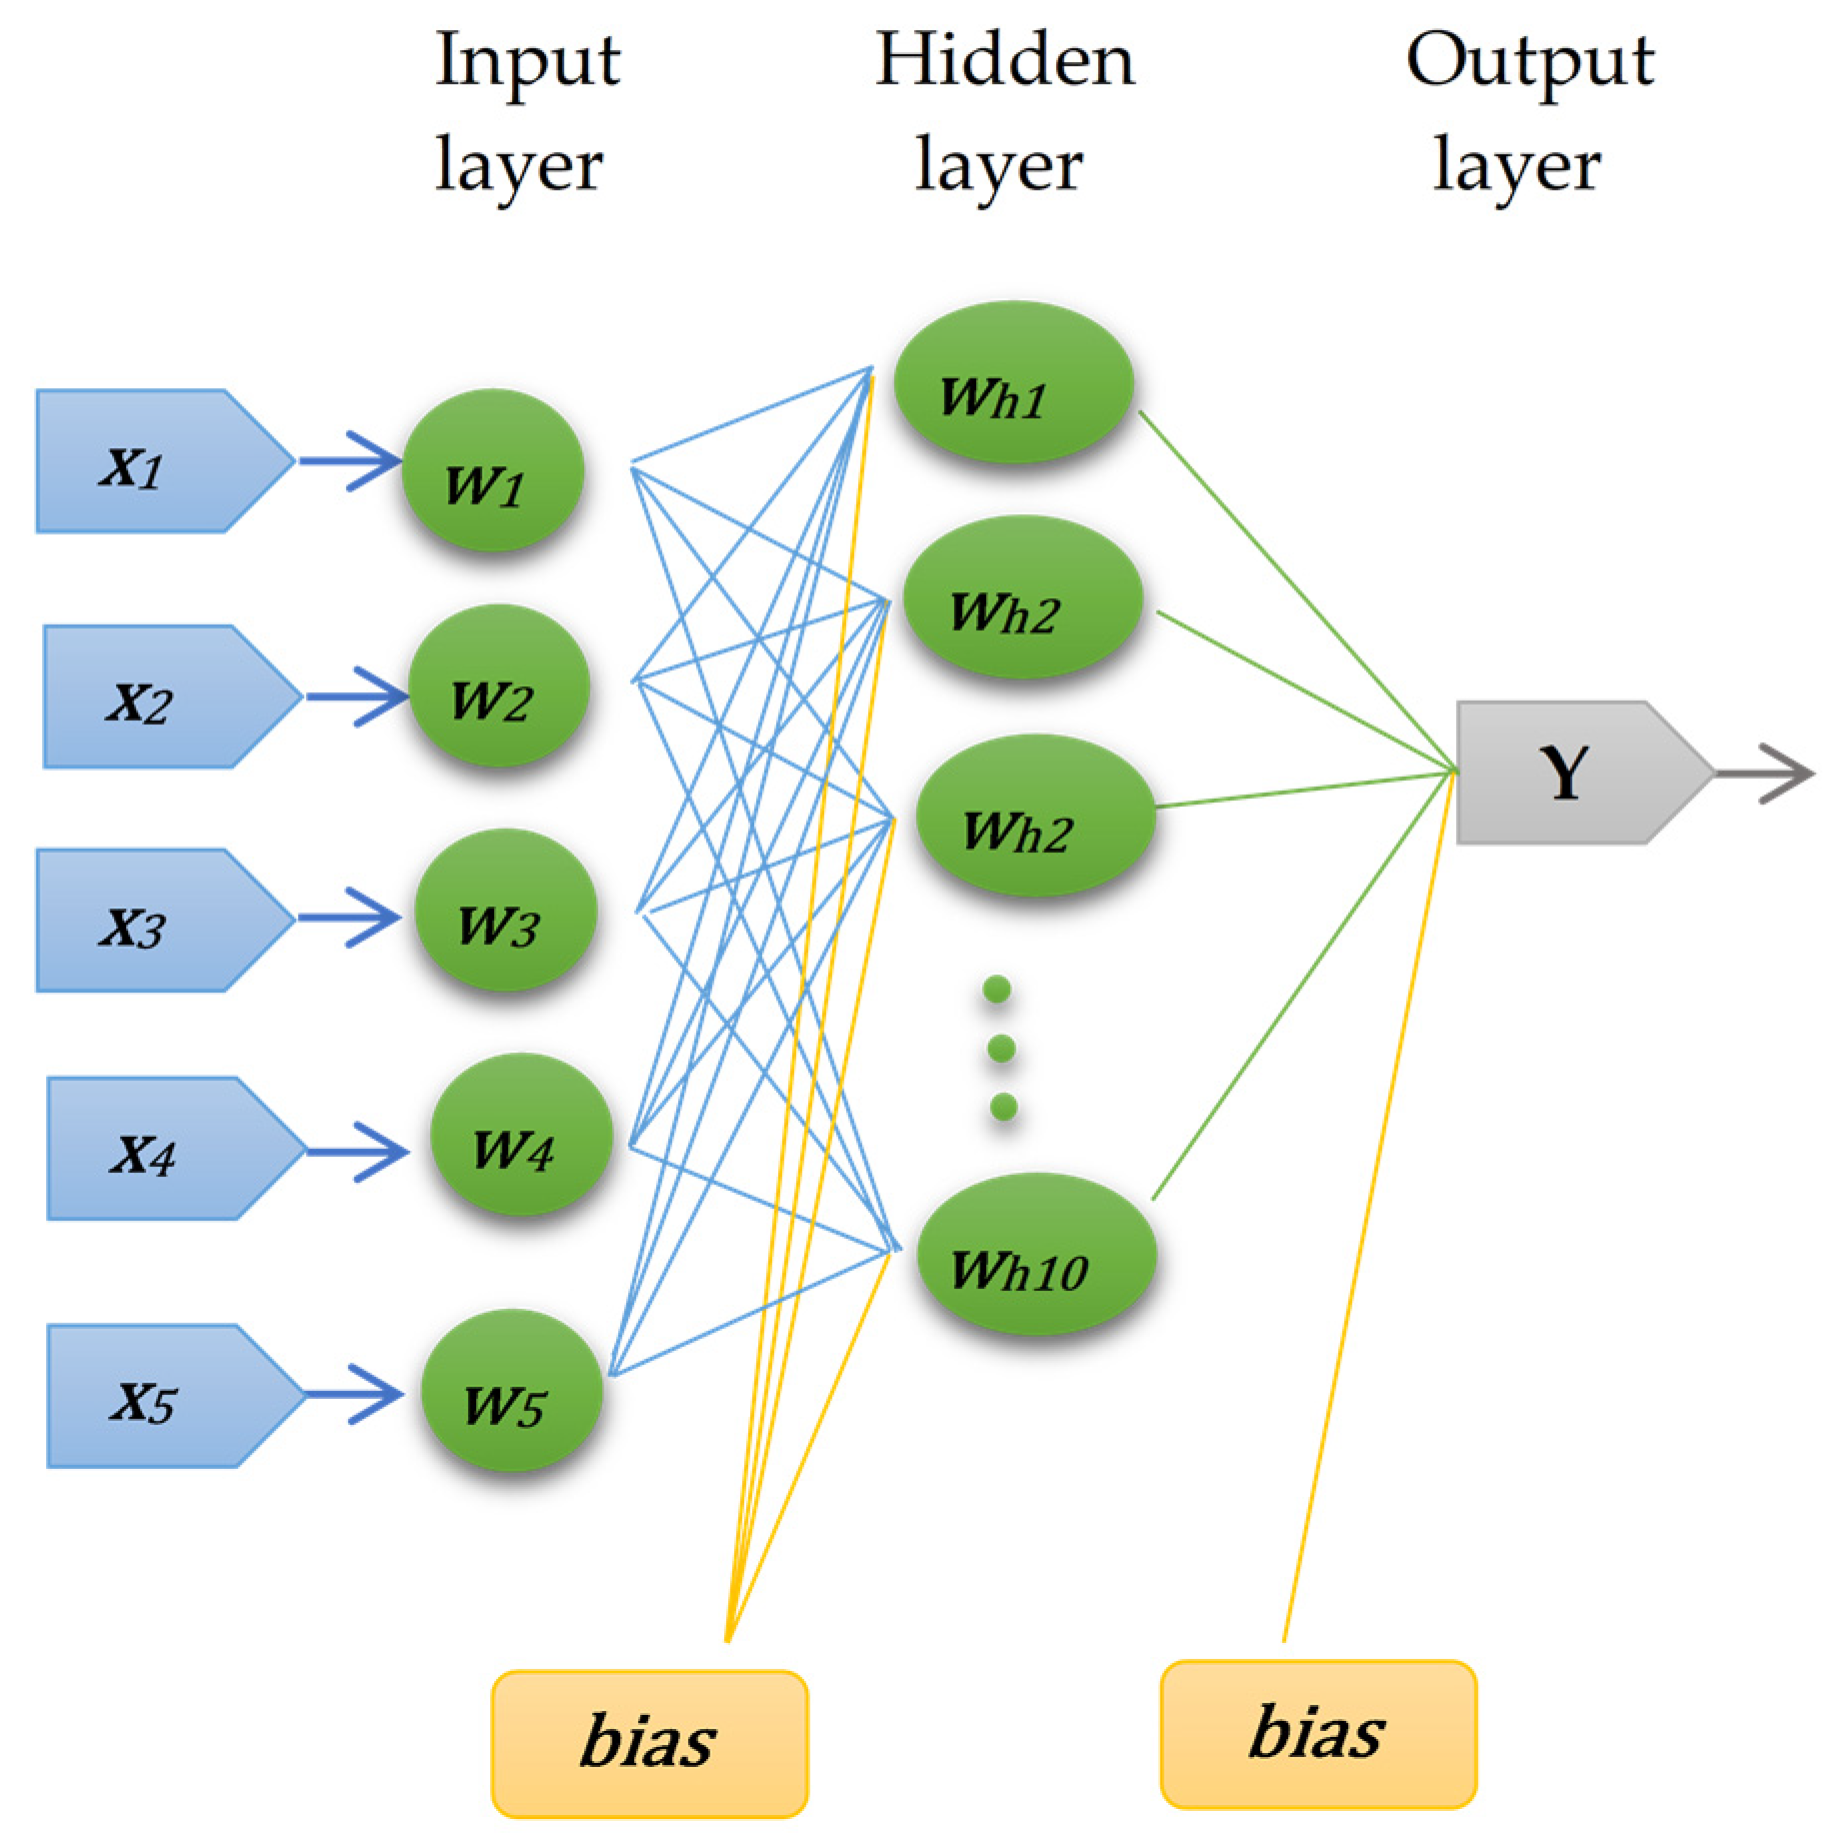
2.3. The ANN Water Temperature Prediction Model

Analytical deterministic water temperature prediction models depend on multiple meteorological and hydrological parameters. AI models have the advantage that they can provide similar or even better results by using fewer input variables [38].
Among the most used AI models to forecast the river water temperature, as mentioned by Zhu and Piotrowski [13], are artificial neural networks, adaptive neuro-fuzzy inference systems, Gaussian process regression, and wavelet–artificial intelligence integrated models. From these, neural networks have the advantage of a higher flexibility to solve problems involving unknown non-linear functions and have a higher capacity to approximate continuously differentiable functions. However, compared to other machine learning algorithms, neural networks require larger datasets and a higher computational power for training.
This paper proposes a water temperature prediction model that is based on an ANN that uses the Levenberg–Marquardt algorithm, due to its above-mentioned stability and rapid convergence capabilities [39,40].
ANNs comprise a sequence of layers, as follows: an input layer, one or more intermediate hidden layers, and an output layer. Each layer contains several neurons. To obtain a prediction, layer by layer, the neurons use weighted input information and give an output. The output, Y, of a neuron is calculated as the weighted sum of the input variables, x i , and a bias value (Figure 6), as follows:
Y = f i = 1 n x i · w i + b i a s ,
where f —the activation function by which the output value is calculated, depending on the type of problem; n —the number of input connections; x i —the input variables; w i —the weights corresponding to each x i ; b i a s —the bias.
The ANN is trained using a Feedforward Backpropagation (FB) process to determine the weights, so as to minimize the error of the output value. FB is a two-step process, as shown in Figure 7 [23,41].
  • Forward propagation—computation of input weights and calculation of the error (by using a second-order derivatives algorithm) are progressing in a forward step;
  • Backward propagation (the steepest descent algorithm)—adjustment of weights based on the error (by using a first-order derivatives algorithm) are progressing in a backward step.
Figure 7. Feedforward Backpropagation process.
Remotesensing 16 01513 g007
With the updated weights, the backpropagation begins the adjustment to reduce the error between the predicted and actual output. Backward propagation begins from the output layer and progresses towards the first layer. The FB process is repeated until the error becomes lower than an acceptable threshold value [42].
To feedforward training neural networks with backpropagation, the Levenberg–Marquardt (LM) algorithm is recommended, due to its robustness and optimization capabilities, built on a linear interpolation between the method of gradient descendent and the Gauss–Newton scheme to improve the weights [43,44]. When the parameters are close to their optimum, the LM algorithm uses the Gauss–Newton method. The Levenberg–Marquardt (LM) algorithm has the capability of minimizing the chance of iteration failure of the Gauss–Newton algorithm (when any column of the Jacobian matrix linearly depends on another, therefore leading to a singular Hessian matrix) [39].
As a second-order algorithm, the Gauss–Newton (GN) scheme converges very fast, as it evaluates the curvature of the error surface and, thus, adjusts its step sizes. But, the convergence of the GN scheme depends on the quadratic approximation of the error function, becoming divergent if the surface of the error function is not quadratic (for complex error space optimization). When the gradient is steep, a first-order algorithm is recommended; this method has the main advantages of simplicity and very good convergence characteristics that exceeds its slow convergence drawback [40]. Therefore, when the parameters are far from their optimums, the LM scheme uses the gradient-descent method and the sum of the squared errors is reduced by updating the parameters in the steepest-descent direction. Therefore, the LM algorithm capitalizes on the coupled advantages provided by the Gauss–Newton and steepest descent algorithms.
The error backpropagation (EBP) uses constant, small step sizes, avoiding oscillations around the minima [38].
Therefore, for error minimization, the Levenberg–Marquardt (LM) Training Algorithm is used.
Considering the Hessian and the Jacobian matrix, the LM algorithm is based on the following relation [44,45]:
w k + 1 = w k J k T   J k + μ I 1 J k T   e k ,
where w k —the weight vector; k —the index of iteration; J —the Jacobian matrix containing the derivative of the network error; e k —the error vector (calculated as the difference between the desired output and the actual output); μ —the combination coefficient ( μ 0 ); and I —the identity matrix.
  • Note that the Hessian matrix is as follows:
H = J k T J k ,
The choice between the use of the Steepest descent algorithm and the Gauss–Newton algorithm for training depends on the parameter μ. Thus, the following applies, according to Wilamowski and Yu [37]:
  • For small μ values (nearly zero)—the Gauss–Newton second-order algorithm is used and can be approximated using the following:
w k + 1 = w k J k T   J k 1 J k T   e k ,
  • For larger μ values—the steepest descent first-order algorithm is used, as follows:
w k + 1 = w k g k / μ ,
where the gradient, g k , is the first-order derivative of total error and 1 / μ is the learning coefficient (the step size).
As initial weights are generated randomly, the training of the ANN can be repeated until the weights give acceptable results.
The proposed ANN prediction model for the Dâmbovița River temperature (Figure 8) consists of the following:
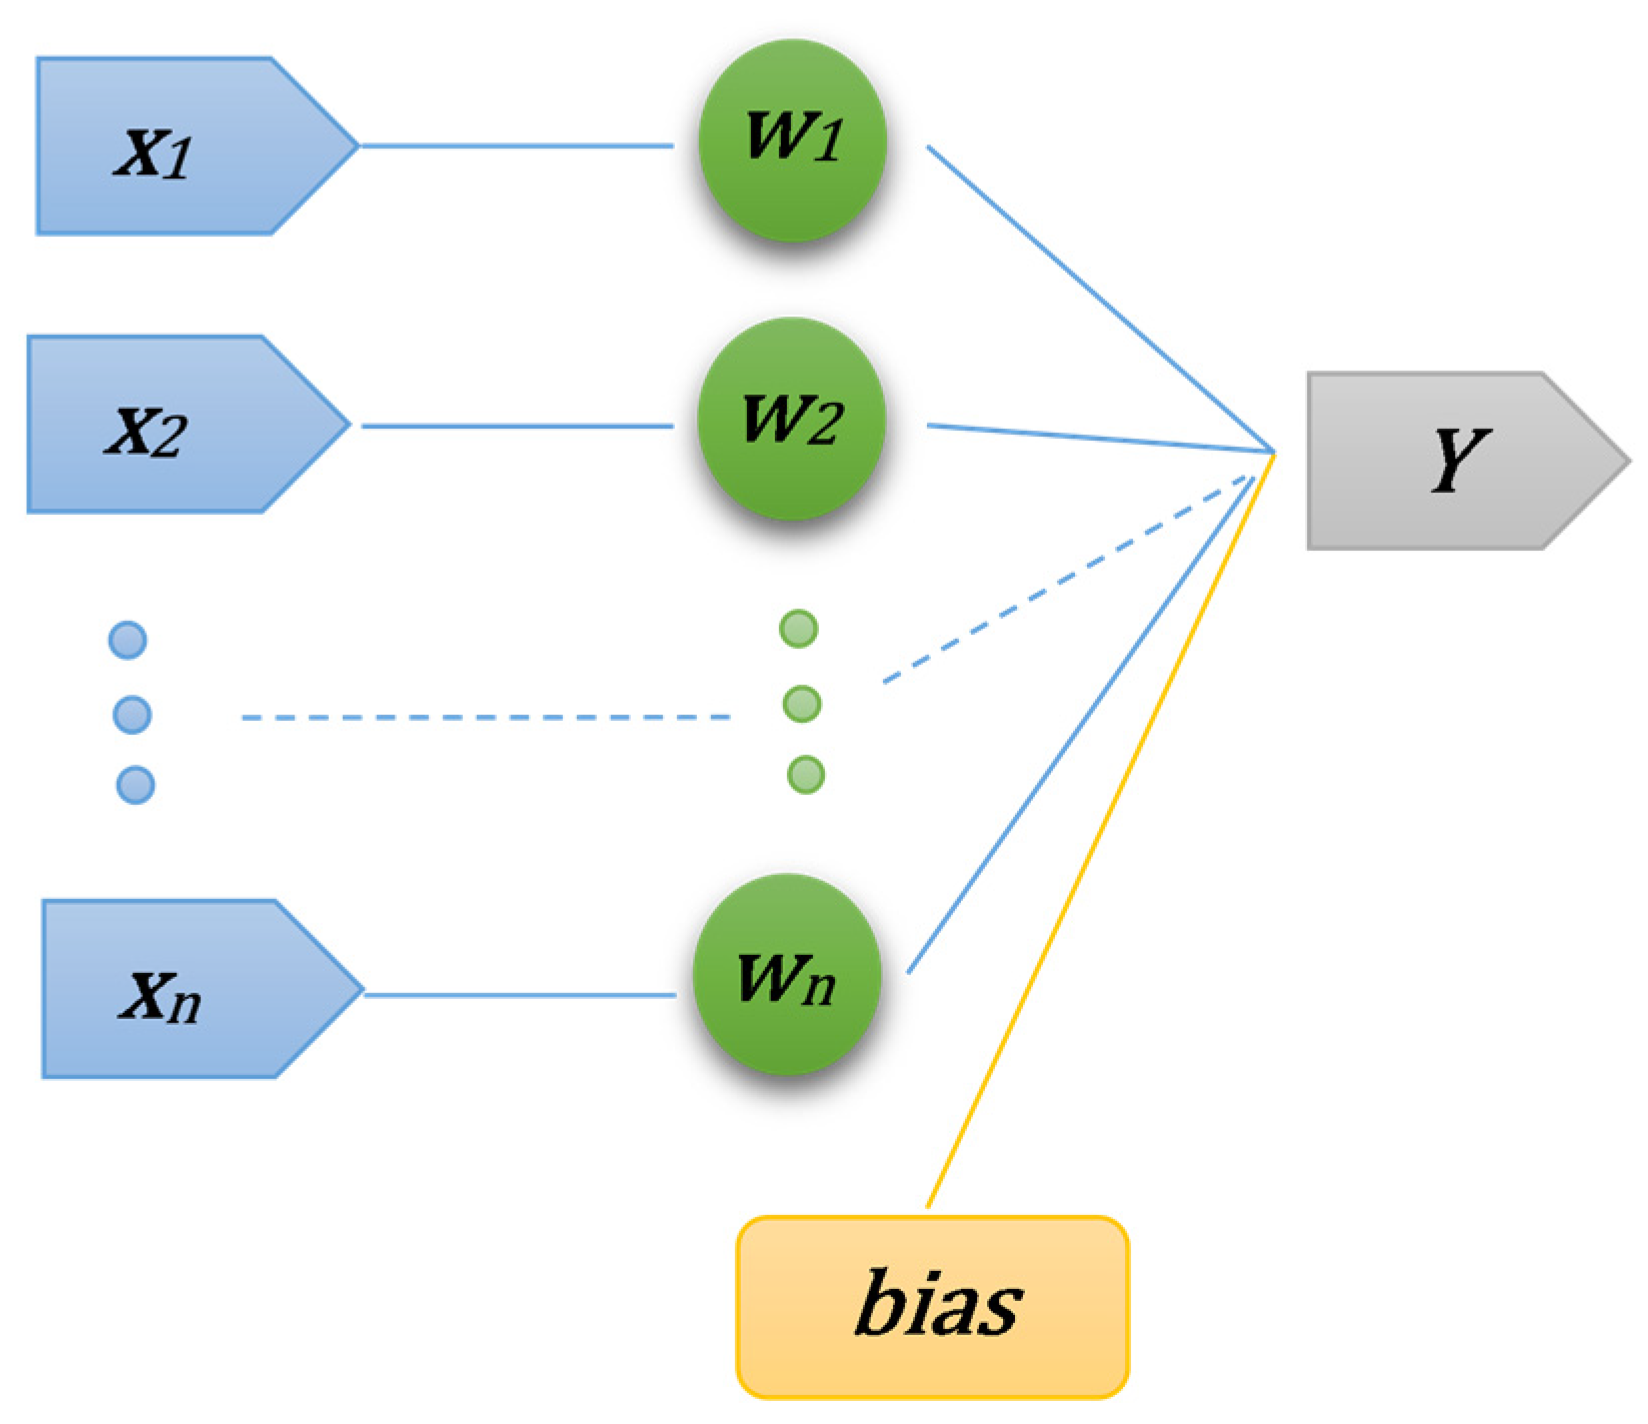
  • Five neurons in the input layer for air and water temperature values measured at the exit from the Morii Reservoir for two different time moments and the discharge (the influence of other meteorological and hydrological parameters, e.g., wind, solar radiation, cloudiness, and precipitation, was not taken into account);
  • Ten neurons in the intermediate hidden layer;
  • One neuron in the output layer, consisting of water temperature at the downstream cross-section of the Dâmbovița River, at its exit from Bucharest City.
Figure 8. ANN prediction model for the Dâmbovița River temperature.
Remotesensing 16 01513 g008
For the development of the ANN, the architecture with one hidden layer is considered to be sufficient [46].
The ANN prediction model for the Dâmbovița River temperature was developed under Scilab open software version 6.0.1. [47], using the following functions for Feedforward Backpropagation simulation:
  • for ANN training (computation weights): ann_ffbp_init(N, r);
  • for ANN run and prediction of temperatures: ann_FFBP_run(X,W).

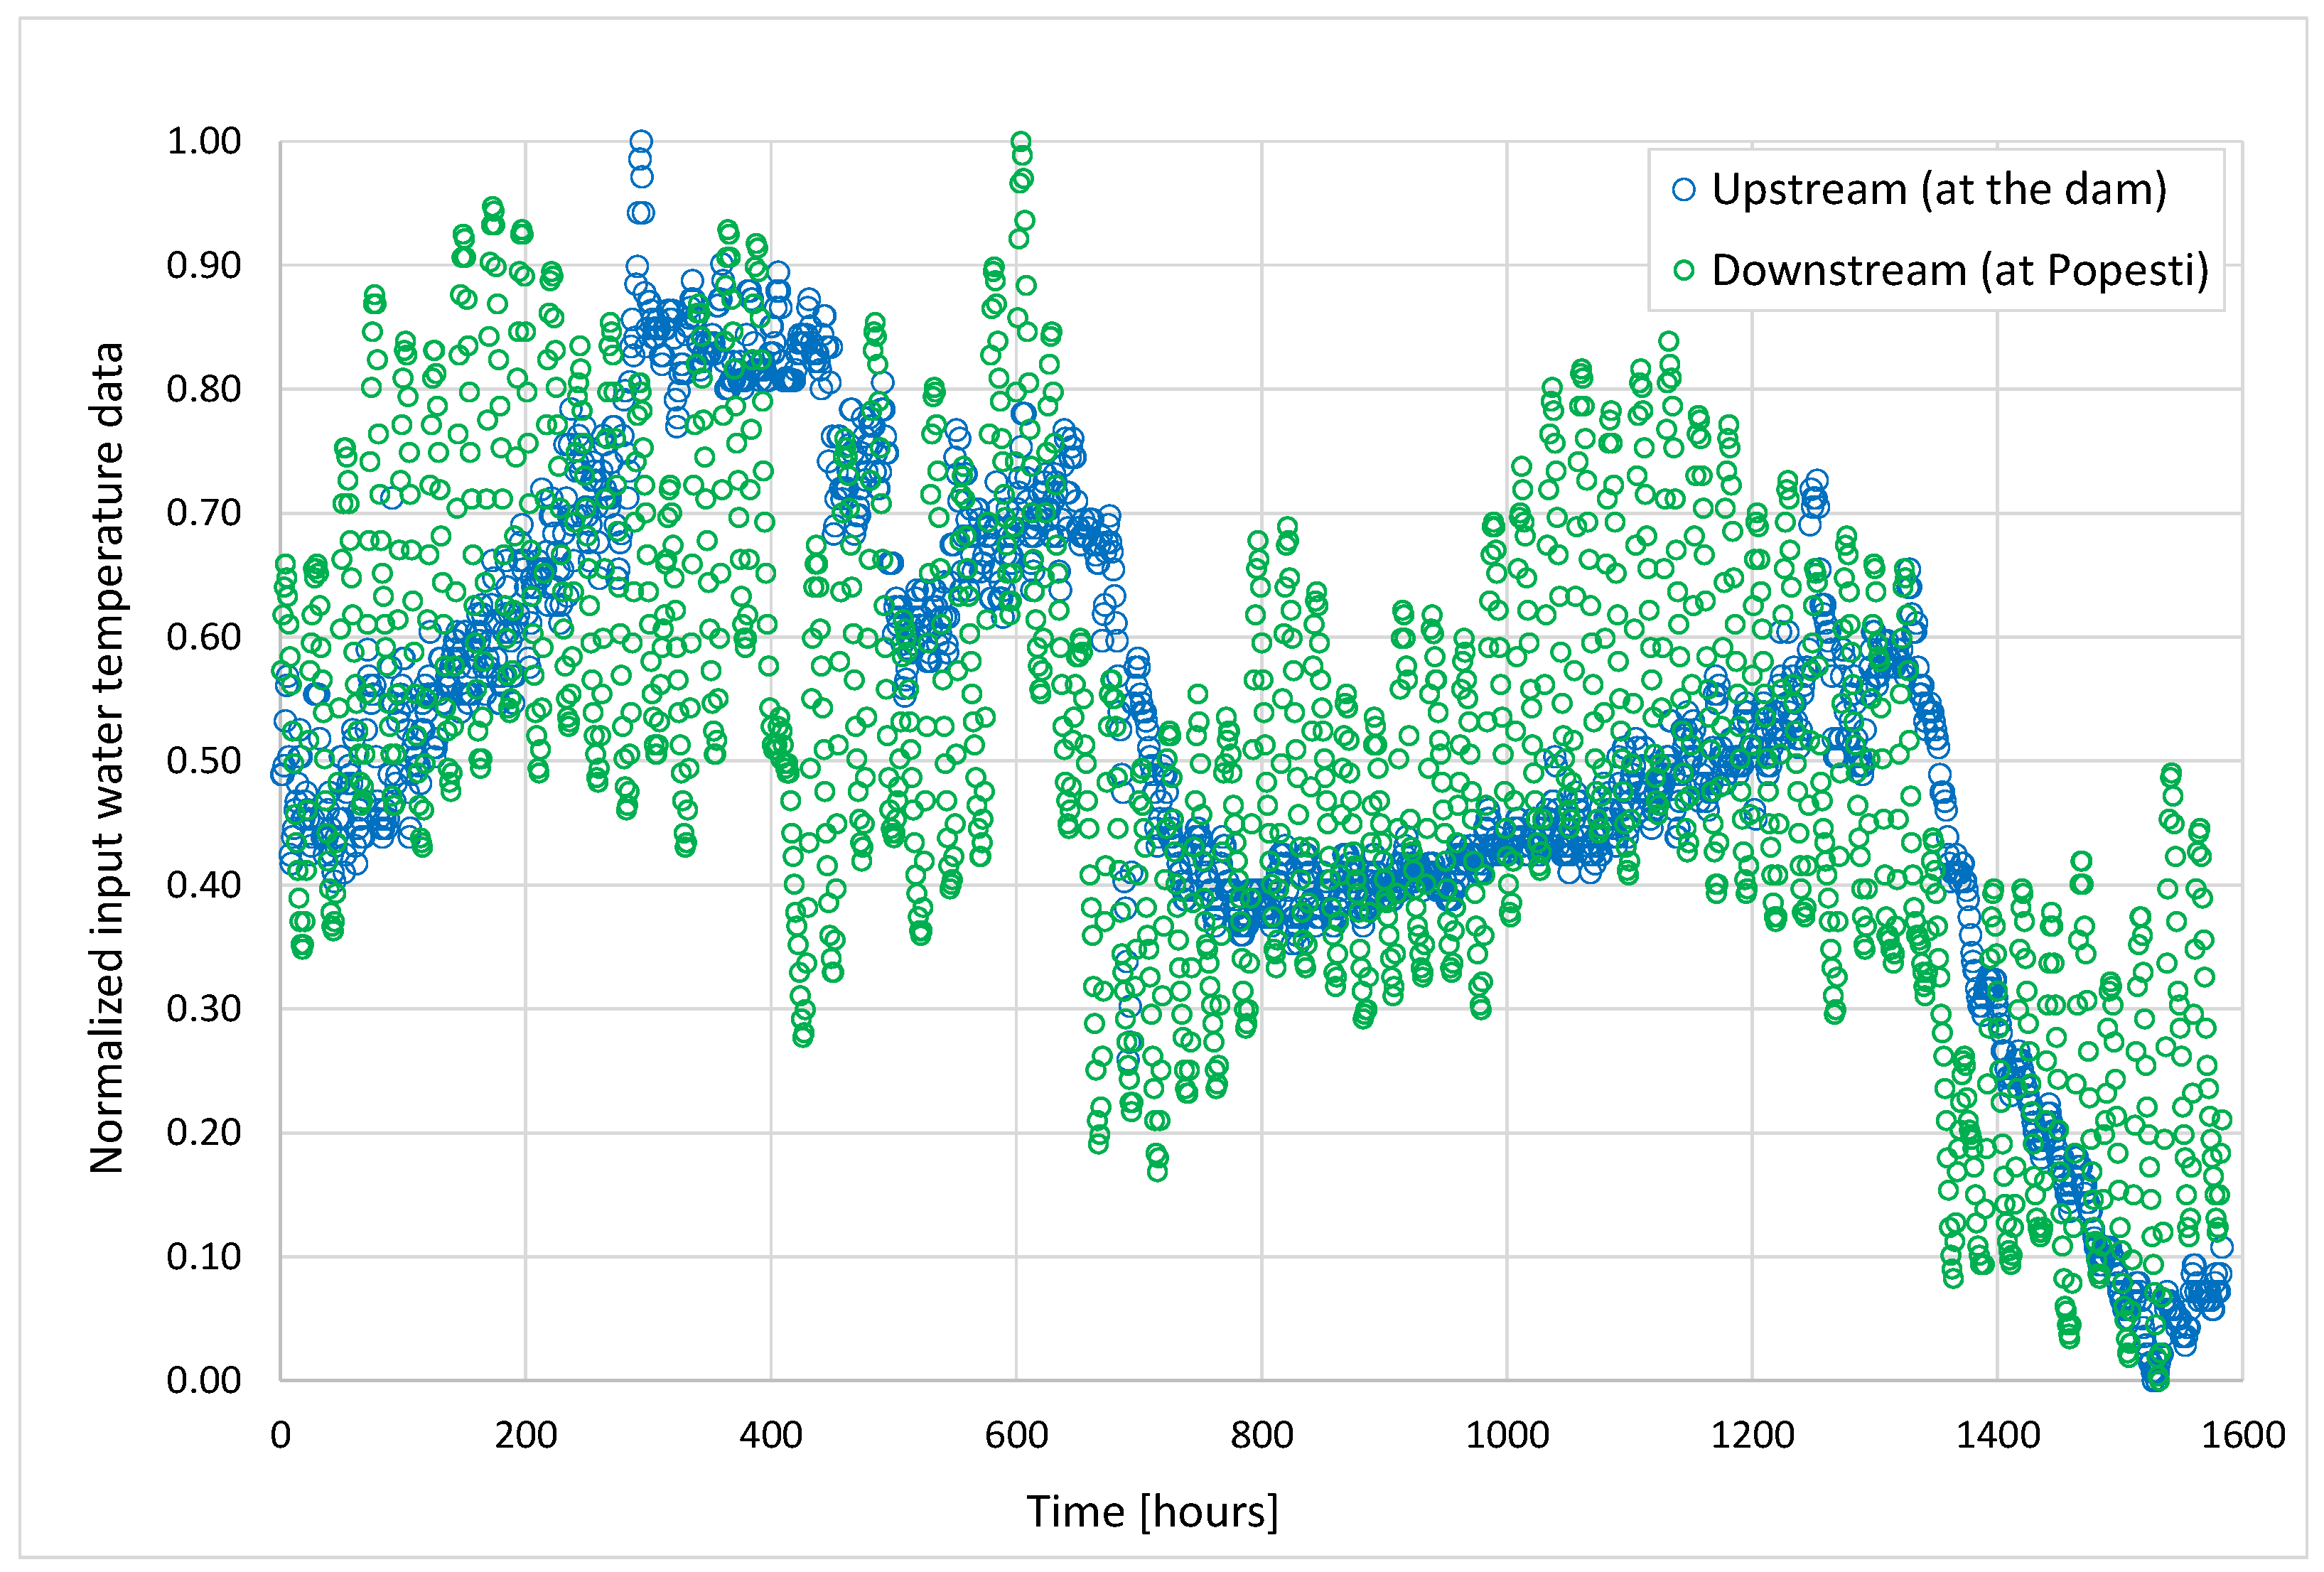
2.4. Input Data for the ANN Model
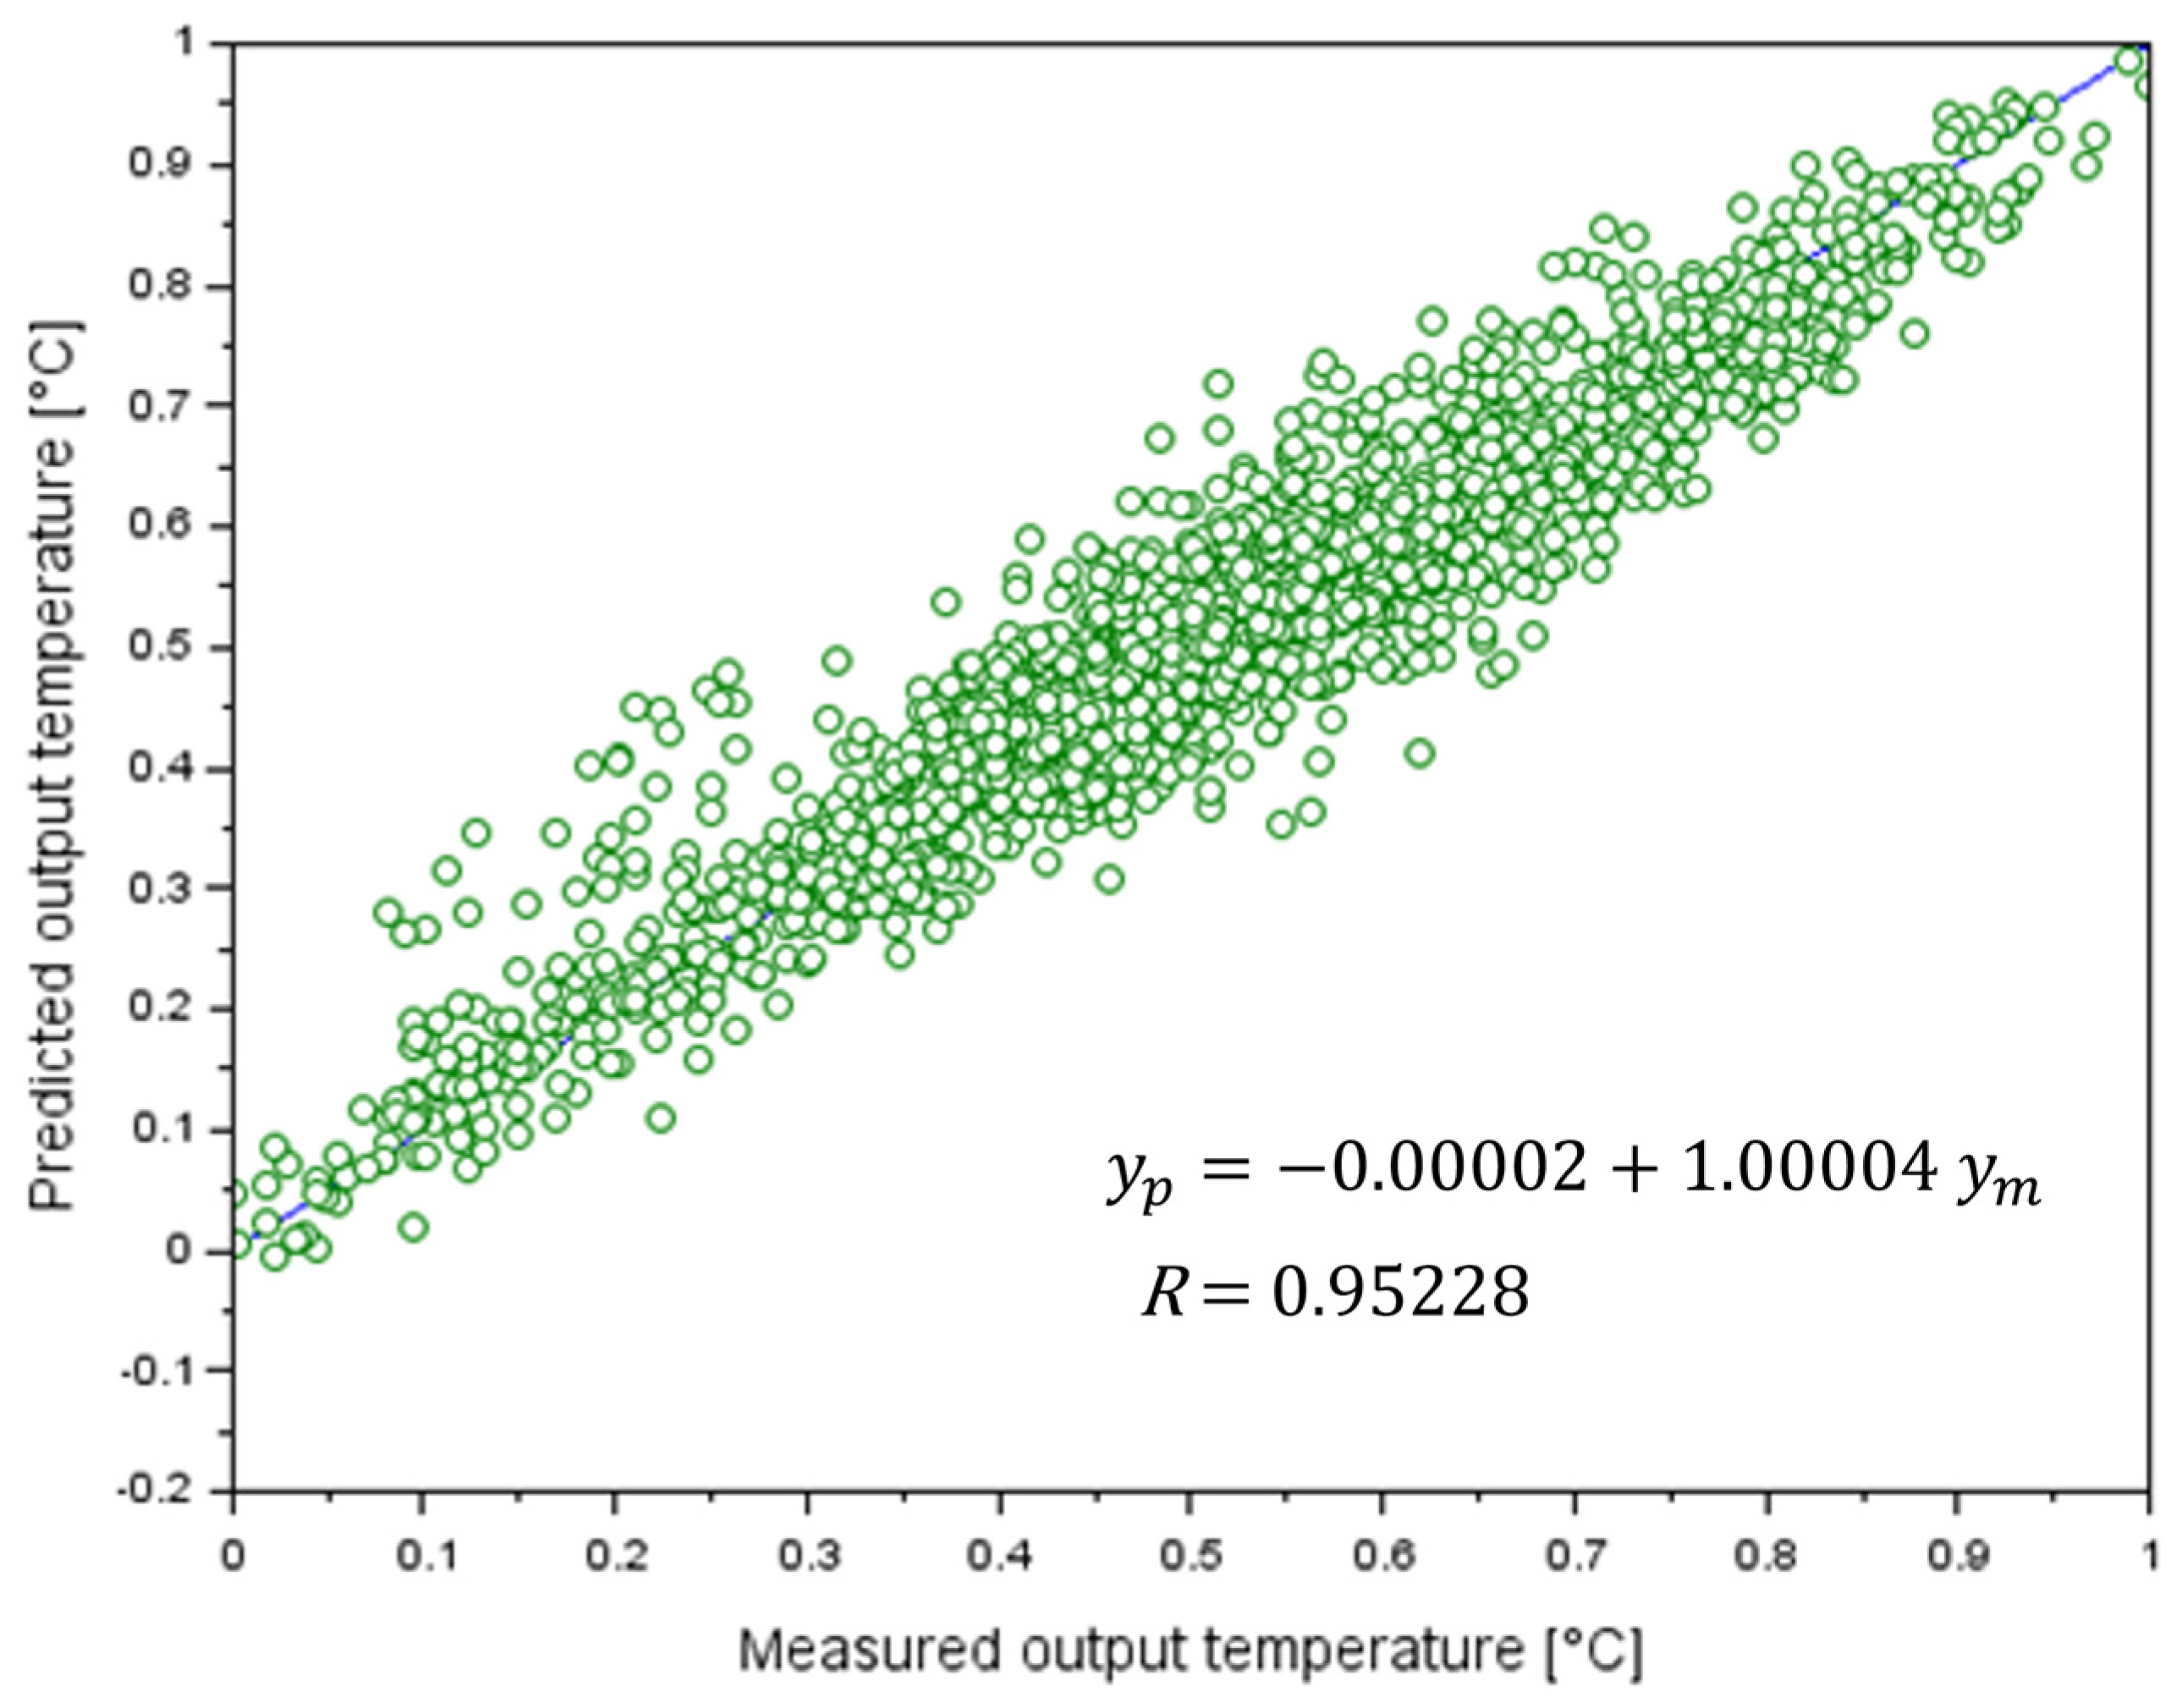
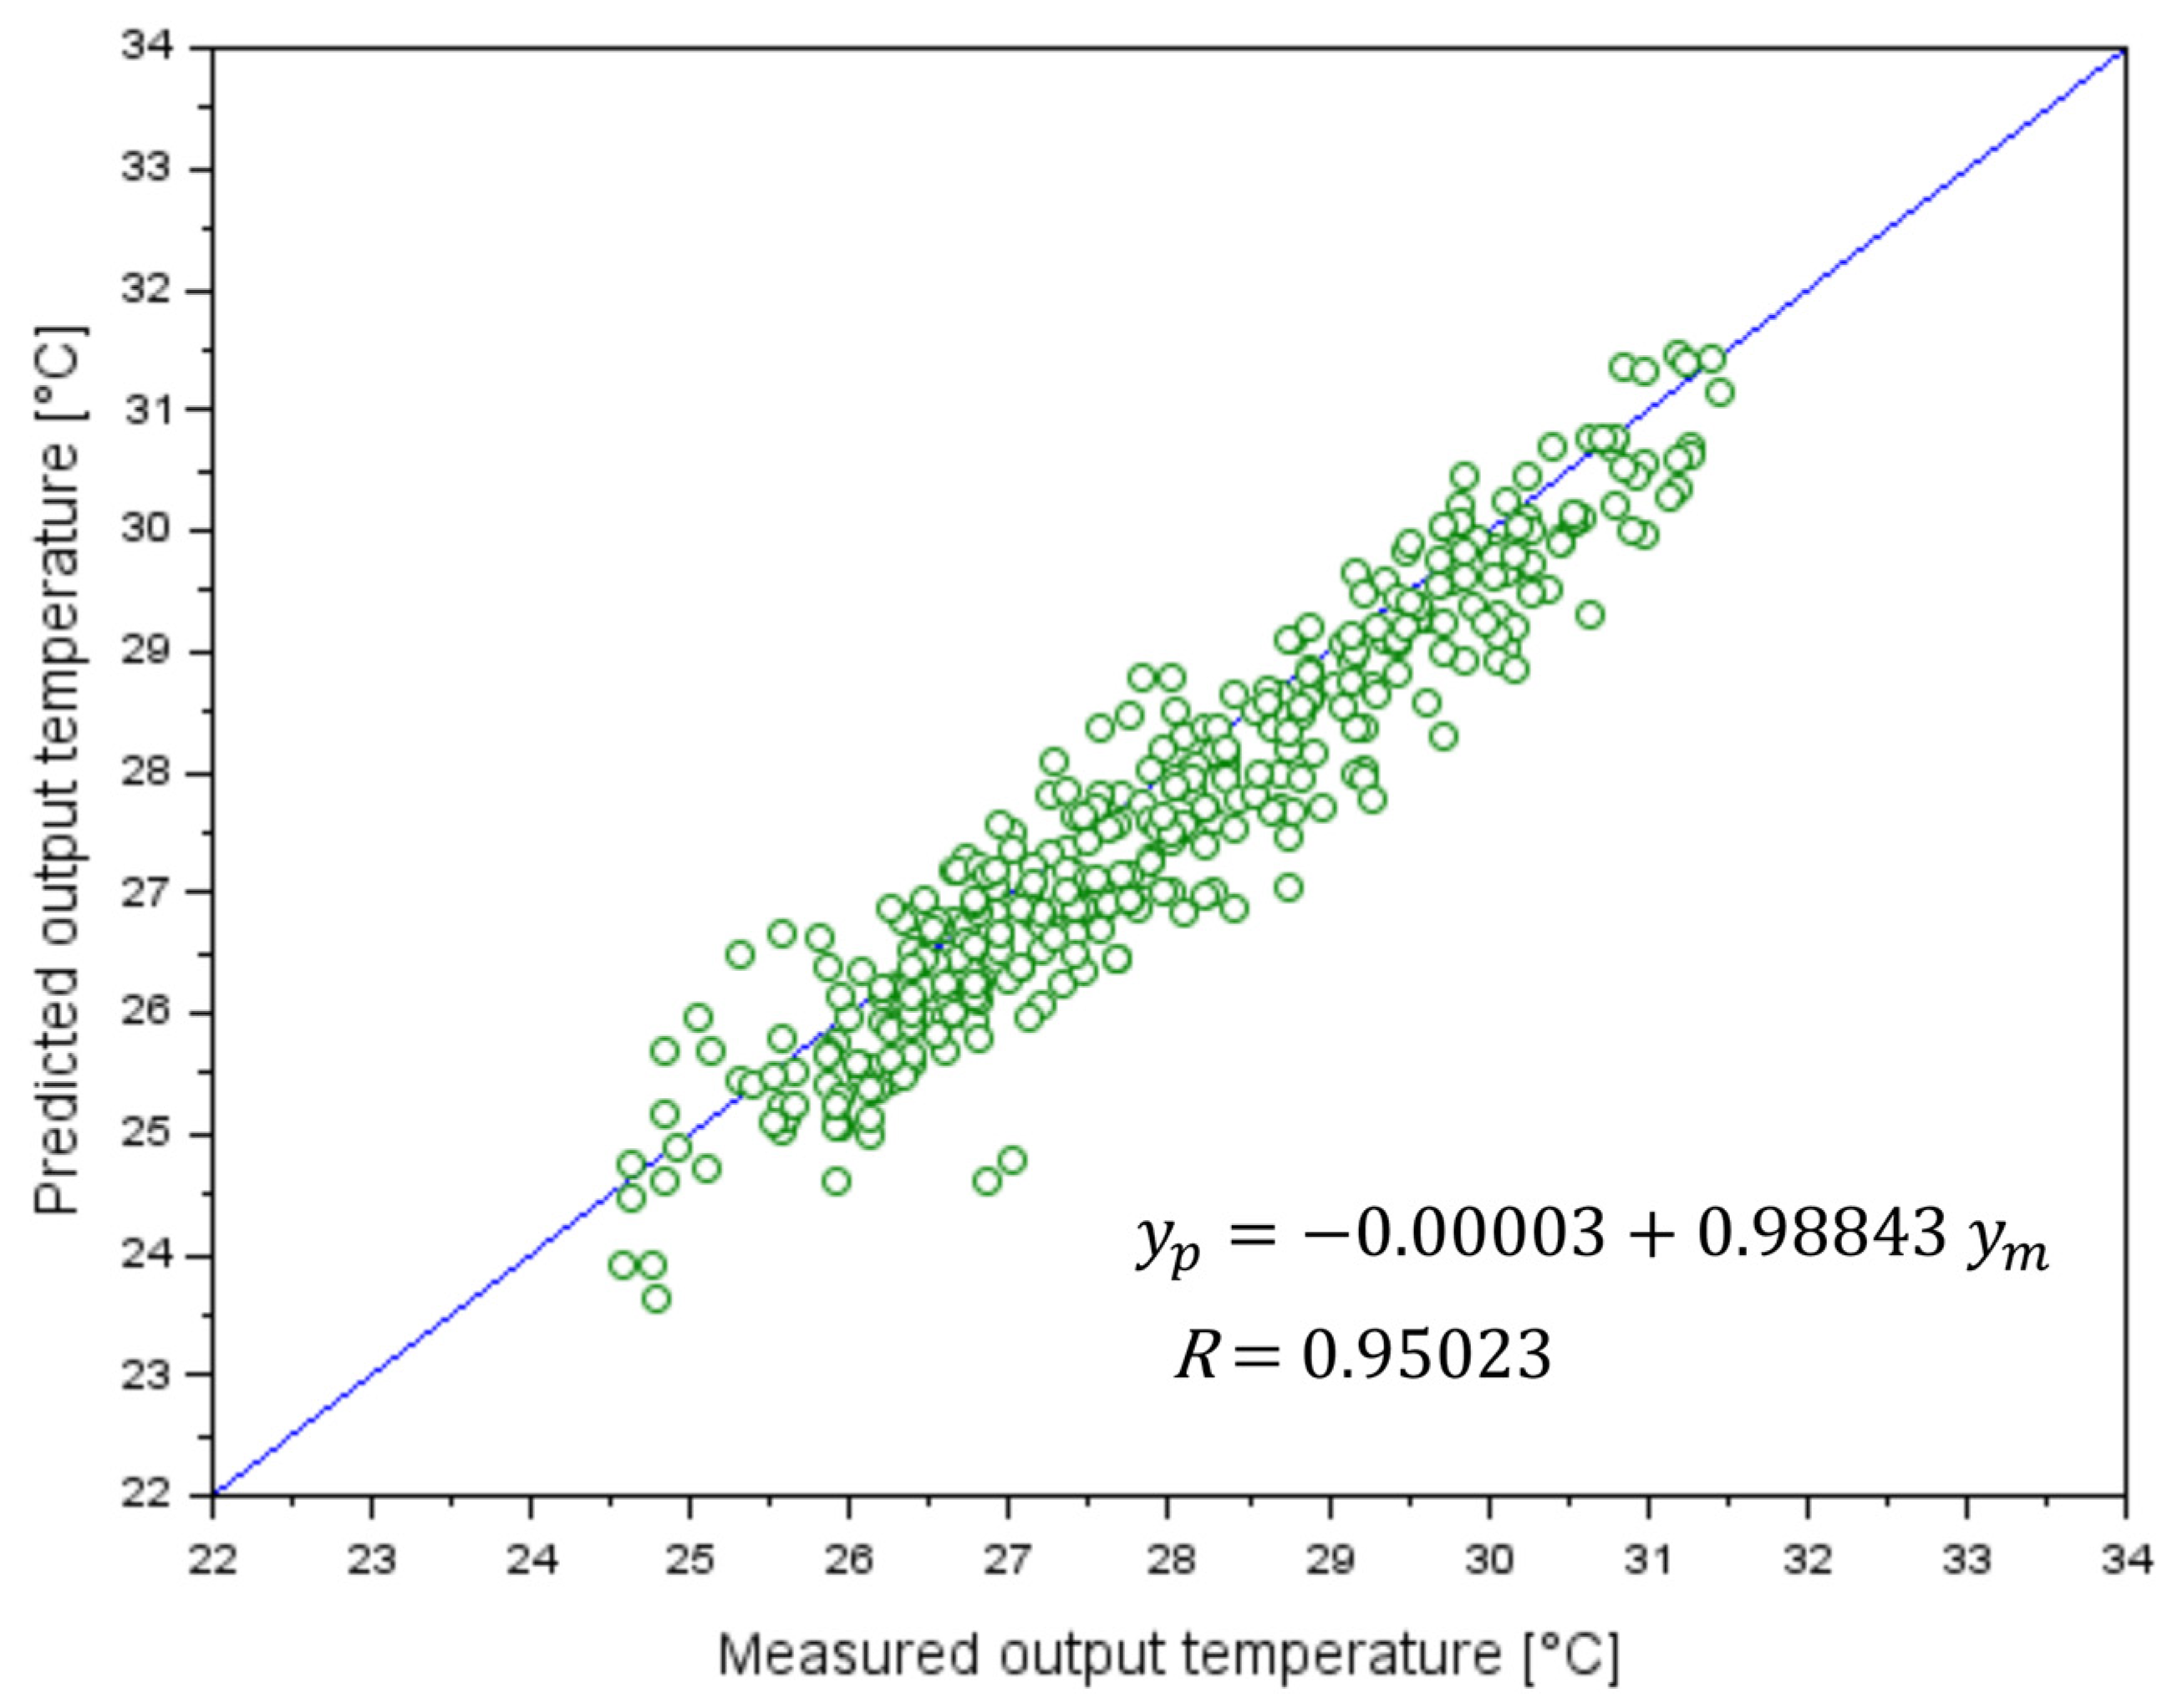
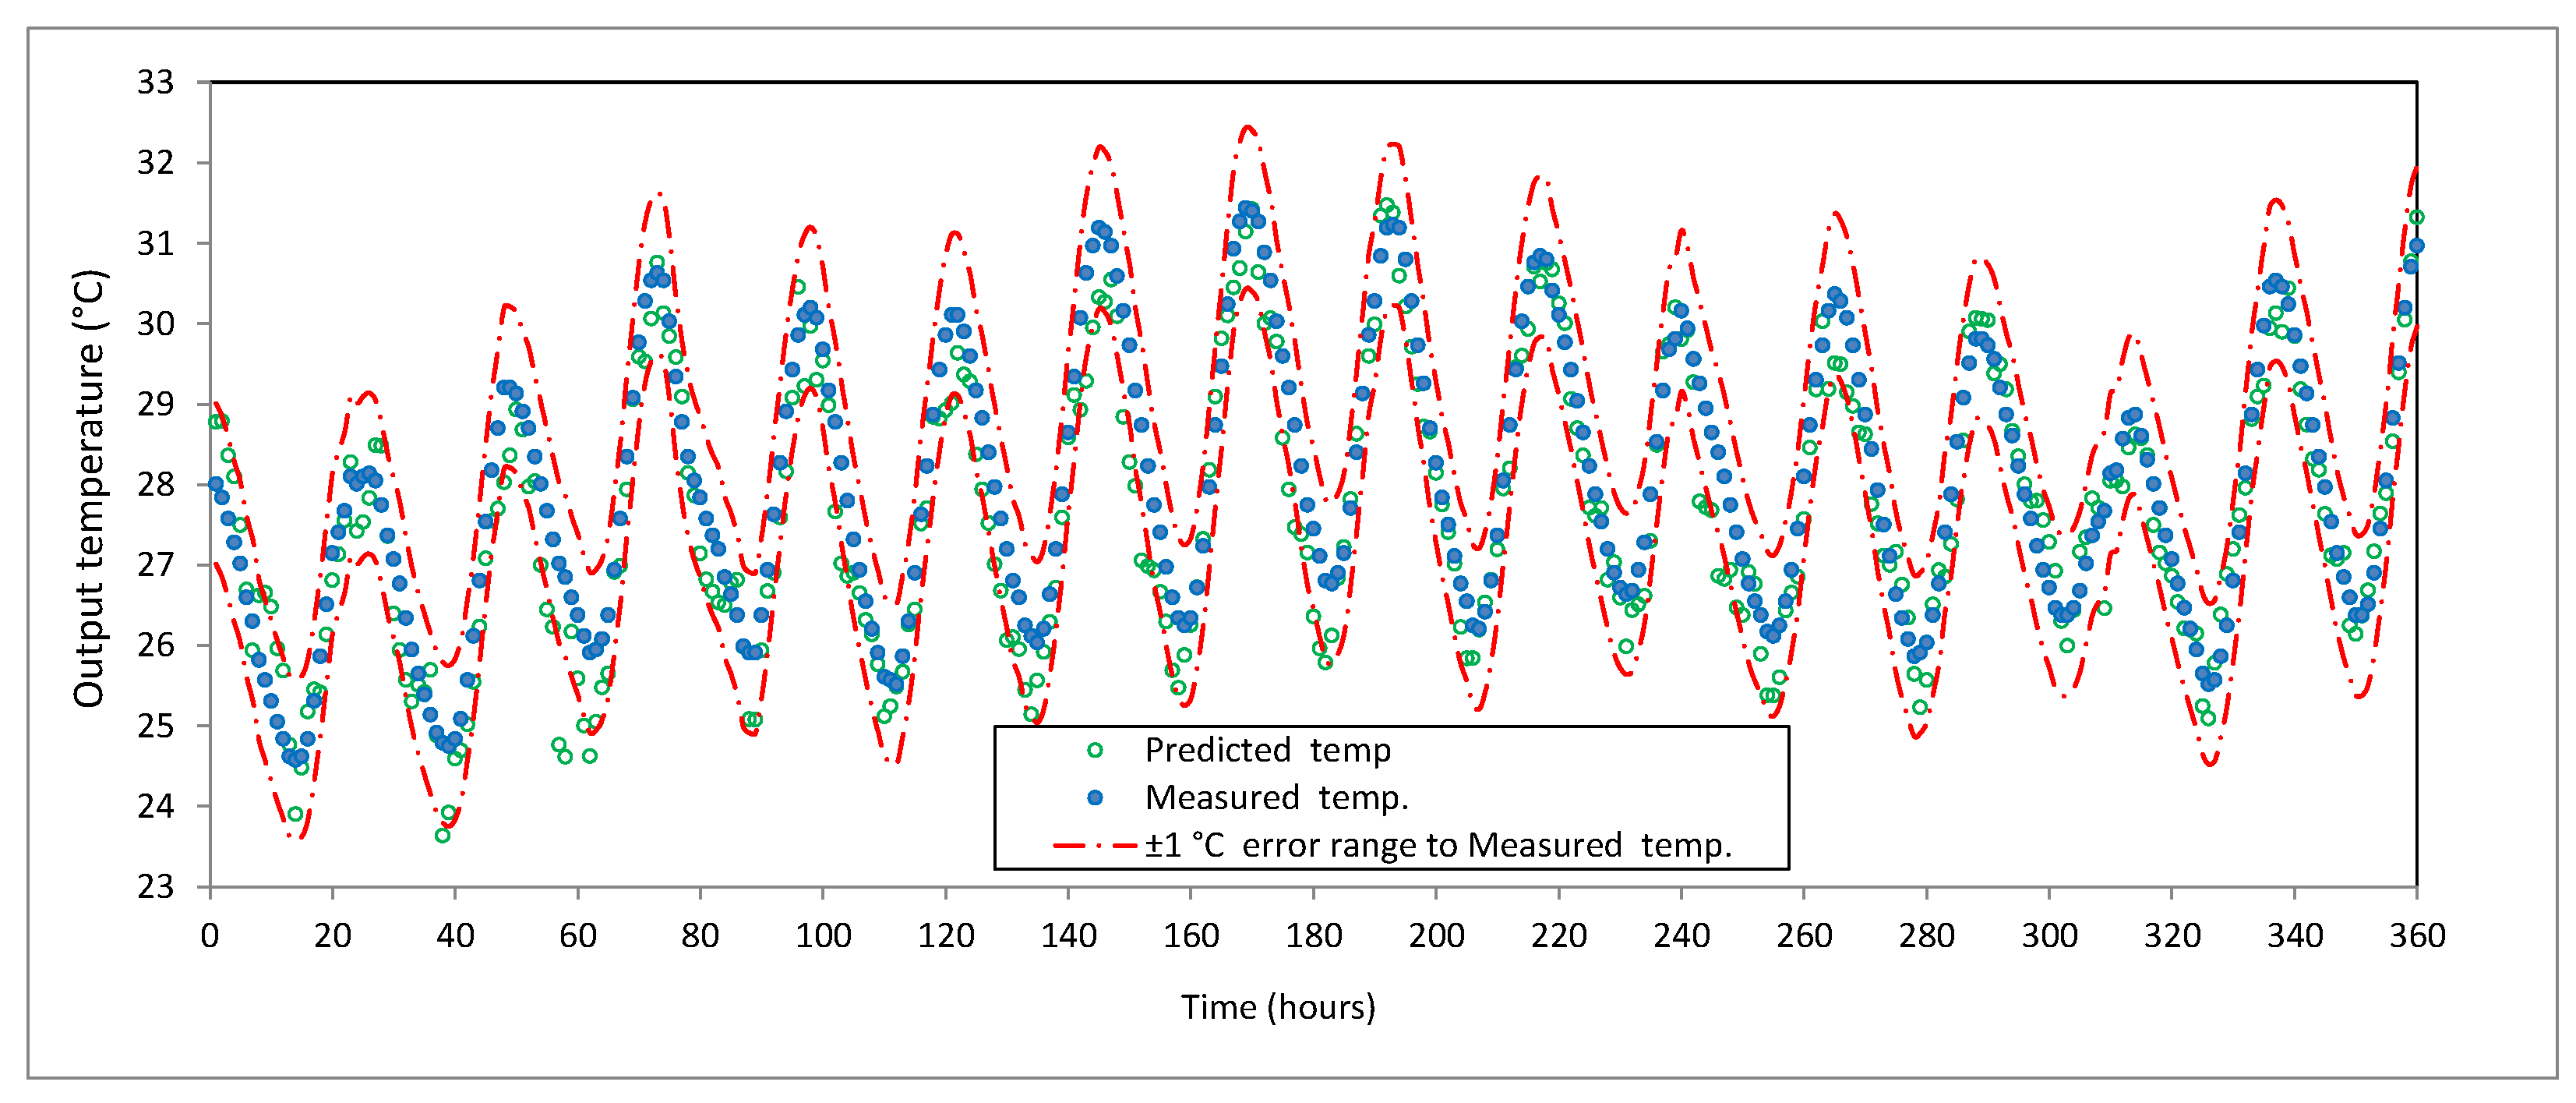
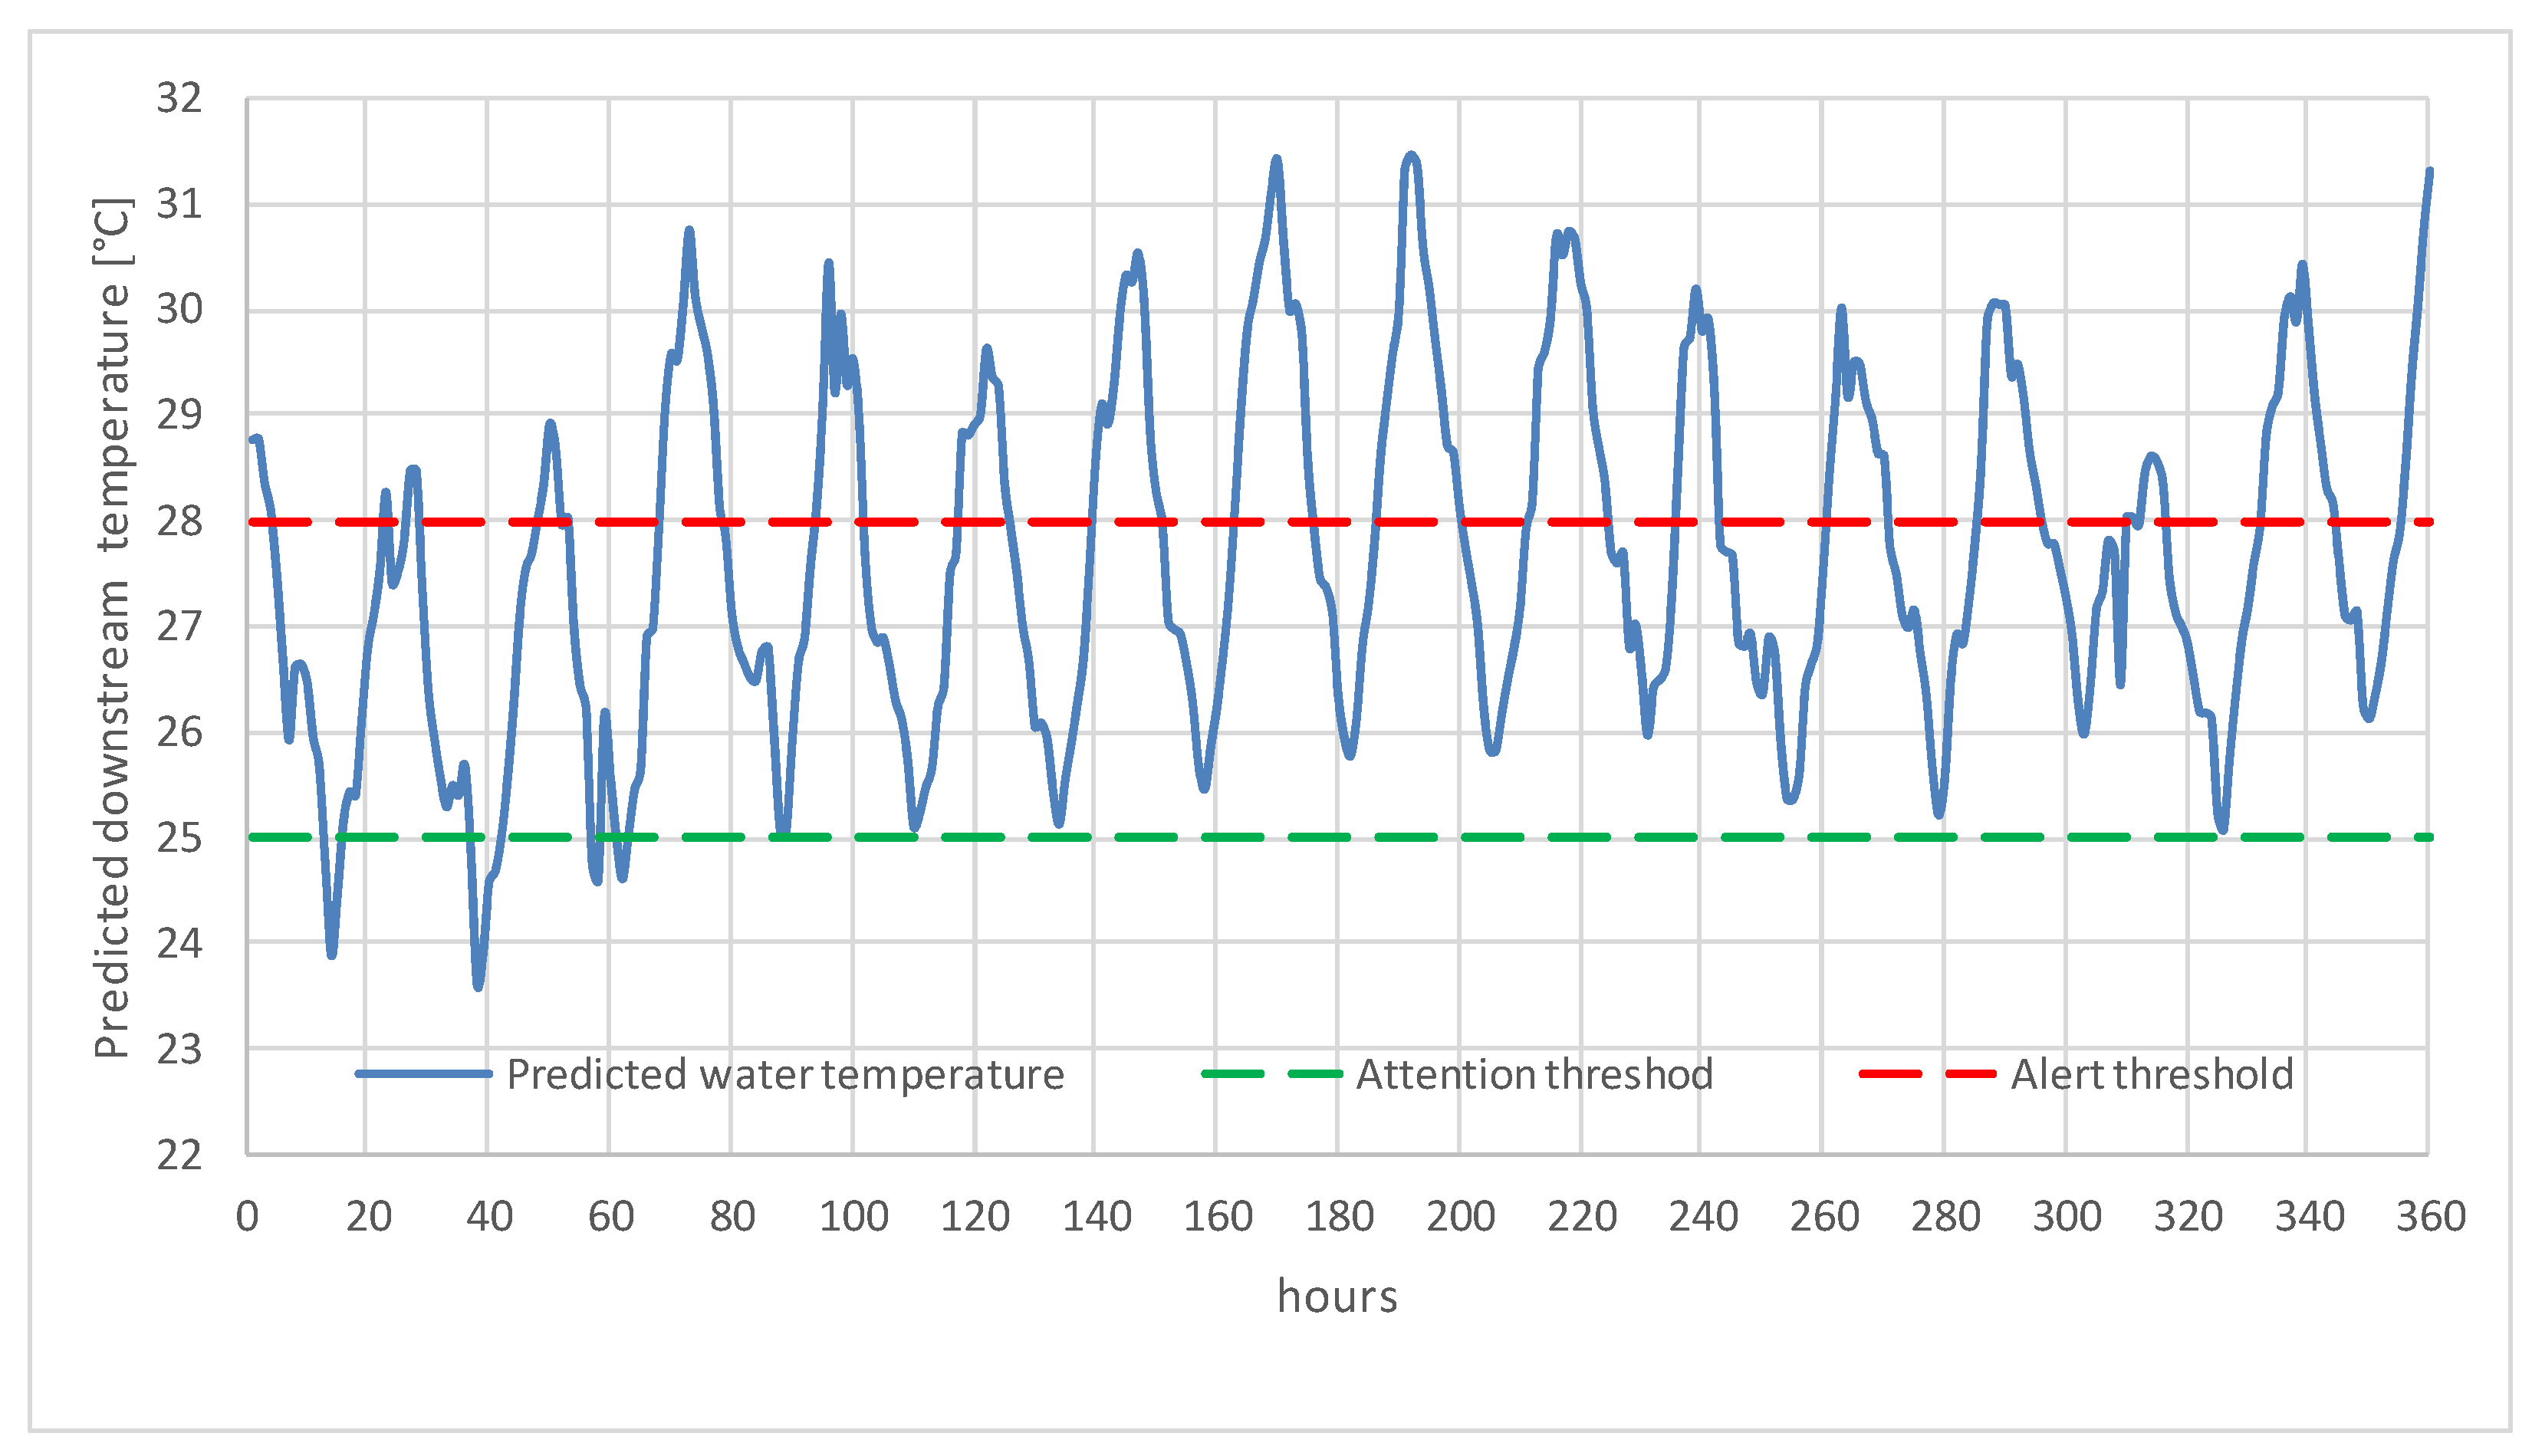
The input data used in the model consist of air temperature values for the entire summer period of the year 2023, obtained from OpenWeather [32], and water temperature values measured in the stilling basin of the Ciurel dam and at the exit from Bucharest City. The input data are depicted in Figure 4.
Most aquatic organisms live in an optimal temperature range of 5–25 °C, e.g., fish in the Cyprinidae family that are found in the Dambovita River [48]. Water temperature, river flow, exposure to sunlight, and nutrient concentration greatly influence the risk of algal bloom, which has been observed to appear in the Dambovita River in the last decade. Thermal stress can trigger lethal effects on fish, if temperature spikes occur in a short time interval of 24–48 h. Experimental data presented by Souchon and Tissot [47] indicate that a tolerance to temperatures over 28 °C for different fish species is a function of exposure time. These effects are deepened because the required dissolved oxygen concentration also decreases with increasing water temperature and algal bloom, thus producing a lethal synergic impact. Therefore, two values of 25 and 28 °C were selected as the attention and alert thresholds at the downstream cross-section. These limits can be used as useful indicators and can be monitored by water operators and environmental authorities, allowing them to apply the required practical measures to reduce the water temperature, e.g., to increase discharge on the channel.
Input data, consisting of hourly temperatures over the 2023 summer period, were split into the following two distinct sets: one for training (80%) and the other for testing (20%). The data used for testing were selected to cover the hottest consecutive days within a heatwave from the study period, which occurred in July 2023.
All input data are normalized in the model (Figure 9), using the following relationship:
x i N = x i x m i n x m a x x m i n ,
where x i N , x m i n , and x m i n are the normalized, minimum, and maximum values of x i , respectively.
For the training of the ANN, the upstream water temperatures at the dam vary between a minimum of 21.88 °C and a maximum of 27.84 °C, the downstream water temperatures at the exit of Bucharest City are in the range of 20.59–32.04 °C, and the air temperature vary between 14.54 and 41.41 °C. The discharge released from the Morii Reservoir over the entire canicular study period was 3 m3/s. This is the minimum value required by legal regulation for the ecological flow that must be provided, even during prolonged drought periods, particularly during heatwaves.
For the testing of the ANN, the input water temperature ranges at the selected boundaries of the Dâmbovița River were between 24.28 °C and 27.84 °C upstream and were between 24.58 °C and 31.44 °C downstream. The air temperature values fell within the range of 19.28–41.41 °C.

3. Results

ANN Training

Figure 10 and Figure 11 present the training and the validation results obtained with the ANN model.
Both training and validation stages were analyzed with respect to a common methodology, involving linear regression. This was used to evaluate if the input data ( x i j ) significantly predict the output values ( y j ), where i = 1 5 denotes the number of the input neuron and j = 1 n represents the number of the particular input data set, n , being the total number of input data sets.
The best fit between the predicted output and the measured output temperatures was found to be a linear regression given by the equations depicted in Figure 10 and Figure 11 for the training and validation stages, respectively. Thus, y m and   y p represent the measured and the predicted output water temperatures (values at the exit from the Morii Reservoir and at the downstream section of the Dâmbovița River at its exit from Bucharest City). Both are very close to the bisecting line, corresponding to an equal y m and   y p for the same input data, showing that the two variables are almost identical. Moreover, the overall regressions (Figure 10 and Figure 11) are statistically significant, having a sample Pearson correlation coefficient (R) of higher than 0.95.
Studies conducted on other rivers during heatwaves found similar results regarding the correlation between the predicted and measured water temperature values. Zhu et al. [49] used a new method based on integrating the wavelet transformation with artificial intelligence techniques (multilayer perceptron neural network and adaptive neural-fuzzy inference system). The findings of the study show coefficients of correlation in the range of 0.919 to 0.986 for the AI training and of 0.916 to 0.978 for the AI validation. These results are in good accordance with the values obtained with our simple ANN model (0.95228 for training and 0.95023 for validation).
To emphasize the good approximation of water temperature at the exit of the Dâmbovița River from Bucharest, given using the ANN model in Figure 12, measured and computed temperatures are depicted for the tested time interval that included a heatwave. It can be observed that differences between the two temperatures fall in the range t m ± 1 °C, as shown by the dotted envelope red curves.
For the same tested time interval, in Figure 13, the attention and alert temperature limits are shown. One can see that the temperature attention threshold, marked in a green color, was exceeded over the entire tested period. The alert temperature threshold, marked in a red color, was also exceeded in 67% of the same period. These results can be attributed to the high air temperatures registered during the 2023 summer period and to the low discharge released from the Morii Reservoir. Therefore, timely measures should be taken to counteract these effects, such as increasing the discharge on the channel. These two thresholds may help water managers to adjust the duration of the increased water discharge released from the Morii Reservoir.

4. Discussions and Conclusions

The Intergovernmental Panel on Climate Change [50] clearly highlighted in its Sixth Assessment Report (AR6) that the scale of recent changes affecting the climate system is out of the ordinary, compared with the changes that occurred over the past thousands of years and that the anthropogenic-induced impact has strengthened since its previous assessment. Also, cities and urban areas are exposed to increasing risks related to weather extremes, e.g., drought, heatwaves, and severe storms [44]. Therefore, decision makers and local authorities should seek and be equipped with various instruments, allowing them to tackle smart adaptation to climate change and to manage urban resilience.
This paper is an attempt to couple the advantages provided by weather climate data acquired through remote sensing technology with machine learning algorithms to predict changes in urban river temperatures, induced by heatwaves and heat island effects, intensified by extended urbanization and reduced vegetation cover.
An ANN model is an efficient and effective substitute for deterministic models that are heavily dependent on multiple known and unknown parameters. In the case of urban rivers, these parameters are subject to various anthropogenic influences.
The proposed ANN model was developed to quickly predict the temperature of the Dâmbovița River at its exit from Bucharest, using the Levenberg–Marquardt algorithm. The necessity of such a model is supported by the increasing air temperatures during summers and their effects on water resources, due to urbanization and climate change.
The model forecasts, with an accuracy of ±1 °C, the water temperature in an ungauged, downstream location, as a function of measured air and upstream water temperatures.
The developed ANN model provides a simple but useful tool to timely predict water temperature and allow water operators and environmental authorities enough time to apply measures that avoid or minimize the adverse impacts triggered by high water temperatures.

Author Contributions

Conceptualization, C.-S.I., I.O. and D.-E.G.N.; Methodology, C.-S.I. and D.-E.G.N.; Software, I.O.; Validation, I.O.; Formal analysis, D.-E.G.N.; Investigation, C.-S.I., I.O. and C.C.; Resources, D.-E.G.N. and C.C.; Writing—original draft, C.-S.I., I.O. and D.-E.G.N.; Writing—review & editing, C.C. All authors have read and agreed to the published version of the manuscript.

Funding

This work was supported by the National Program for Research of the National Association of Technical Universities-GNaC ARUT 2023 (no 174/4.12.2023).

Data Availability Statement

Restrictions apply to the datasets used in this article: air temperature data are available from Open Weather under commercial conditions; the water temperature data are not readily available because they are part of an ongoing study. Requests to access these datasets should be directed to [email protected].

Acknowledgments

Access to install the temperature loggers for the present study were kindly provided by the National Water Administration “Romanian Waters”.

Conflicts of Interest

The authors declare no conflict of interest.

References

  1. Yang, L.; Qian, F.; Song, D.X.; Zheng, K.J. Research on Urban Heat-Island Effect. Procedia Eng. 2016, 169, 11–18. [Google Scholar] [CrossRef]
  2. Li, Y.-y.; Zhang, H.; Kainz, W. Monitoring patterns of urban heat islands of the fast-growing Shanghai metropolis, China: Using time-series of Landsat TM/ETM+ data. Int. J. Appl. Earth Obs. Geoinf. 2012, 19, 127–138. [Google Scholar] [CrossRef]
  3. Santamouris, M.; Yun, G.Y. Recent development and research priorities on cool and super cool materials to mitigate urban heat island. Renew. Energy 2020, 161, 792–807. [Google Scholar] [CrossRef]
  4. Ulpiani, G. On the linkage between urban heat island and urban pollution island: Three-decade literature review towards a conceptual framework. Sci. Total Environ. 2021, 751, 141727. [Google Scholar] [CrossRef] [PubMed]
  5. Li, K.; Chen, Y. Characterizing the indicator-based, day-and-night, and climate-based variations in response of surface urban heat island during heat wave across global 561 cities. Sustain. Cities Soc. 2023, 99, 104877. [Google Scholar] [CrossRef]
  6. Bhatti, M.; Singh, A.; McBean, E.; Vijayakumar, S.; Fitzgerald, A.; Siwierski, J.; Murison, L. Climate Change Impacts on Water Temperatures in Urban Lakes: Implications for the Growth of Blue Green Algae in Fairy Lake. Water 2024, 16, 587. [Google Scholar] [CrossRef]
  7. Gupta, N.; Mathew, A.; Khandelwal, S. Analysis of cooling effect of water bodies on land surface temperature in nearby region: A case study of Ahmedabad and Chandigarh cities in India. Egypt. J. Remote Sens. Space Sci. 2019, 22, 81–93. [Google Scholar] [CrossRef]
  8. Wu, Z.; Zhang, Y. Water Bodies’ Cooling Effects on Urban Land Daytime Surface Temperature: Ecosystem Service Reducing Heat Island Effect. Sustainability 2019, 11, 787. [Google Scholar] [CrossRef]
  9. Saaroni, H.; Ziv, B. The impact of a small lake on heat stress in a Mediterranean urban park: The case of Tel Aviv, Israel. Int. J. Biometeorol. 2003, 47, 156–165. [Google Scholar] [CrossRef]
  10. Kim, H.; Lee, G.; Lee, C.-G.; Park, S.-J. Algae development in rivers with artificially constructed weirs: Dominant influence of discharge over temperature. J. Environ. Manag. 2024, 355, 120551. [Google Scholar] [CrossRef]
  11. Feisal, N.A.S.; Kamaludin, N.H.; Sani, M.F.A.; Ahmad, D.K.A.; Ahmad, M.A.; Razak, N.F.A.; Ibrahim, T.N.B.T. Anthropogenic disturbance of aquatic biodiversity and water quality of an urban river in Penang, Malaysia. Water Sci. Eng. 2023, 16, 234–242. [Google Scholar] [CrossRef]
  12. Graf, R.; Aghelpour, P. Daily River Water Temperature Prediction: A Comparison between Neural Network and Stochastic Techniques. Atmosphere 2021, 12, 1154. [Google Scholar] [CrossRef]
  13. Zhu, S.; Piotrowski, A.P. River/stream water temperature forecasting using artificial intelligence models: A systematic review. Acta Geophys. 2020, 68, 1433–1442. [Google Scholar] [CrossRef]
  14. Qiu, R.; Wang, Y.; Rhoads, B.; Wang, D.; Qiu, W.; Tao, Y.; Wu, J. River water temperature forecasting using a deep learning method. J. Hydrol. 2021, 595, 126016. [Google Scholar] [CrossRef]
  15. Qiu, R.; Wang, Y.; Wang, D.; Qiu, W.; Wu, J.; Tao, Y. Water temperature forecasting based on modified artificial neural network methods: Two cases of the Yangtze River. Sci. Total Environ. 2020, 737, 139729. [Google Scholar] [CrossRef] [PubMed]
  16. Graf, R.; Zhu, S.; Sivakumar, B. Forecasting river water temperature time series using a wavelet–neural network hybrid modelling approach. J. Hydrol. 2019, 578, 124115. [Google Scholar] [CrossRef]
  17. Cole, J.C.; Maloney, K.O.; Schmid, M.; McKenna, J.E., Jr. Developing and testing temperature models for regulated systems: A case study on the Upper Delaware River. J. Hydrol. 2014, 519, 588–598. [Google Scholar] [CrossRef]
  18. Letcher, B.H.; Hocking, D.J.; O’Neil, K.; Whiteley, A.R.; Nislow, K.H.; O’Donnell, M.J. A hierarchical model of daily stream temperature using air-water temperature synchronization, autocorrelation, and time lags. PeerJ 2016, 4, e1727. [Google Scholar] [CrossRef]
  19. Piotrowski, A.P.; Napiorkowski, M.J.; Napiorkowski, J.J.; Osuch, M. Comparing various artificial neural network types for water temperature prediction in rivers. J. Hydrol. 2015, 529, 302–315. [Google Scholar] [CrossRef]
  20. Mosavi, A.; Salimi, M.; Faizollahzadeh Ardabili, S.; Rabczuk, T.; Shamshirband, S.; Varkonyi-Koczy, A. State of the art of machine learning models in energy systems, a systematic review. Energies 2019, 12, 1301. [Google Scholar] [CrossRef]
  21. Zhu, S.; Nyarko, E.K.; Hadzima-Nyarko, M. Modelling daily water temperature from air temperature for the Missouri River. PeerJ 2018, 6, e4894. [Google Scholar] [CrossRef] [PubMed]
  22. Chakraborty, A.; Lahiri, S.N.; Wilson, A. A statistical analysis of noisy crowdsourced weather data. Ann. Appl. Stat. 2020, 14, 116–142. [Google Scholar] [CrossRef]
  23. Shaik, N.B.; Pedapati, S.R.; Taqvi, S.A.A.; Othman, A.R.; Dzubir, F.A.A. A feed-forward back propagation neural network approach to predict the life condition of crude oil pipeline. Processes 2020, 8, 661. [Google Scholar] [CrossRef]
  24. Gogoașe-Nistoran, D.E.; Ionescu, C.S.; Opriș, I.; Enache, I. Extreme Heatwave Scenarios with Impact on Thermal Regime of Dâmbovița River in Bucharest, Romania. IOP Conf. Ser. Earth Environ. Sci. 2021, 664, 012026. [Google Scholar] [CrossRef]
  25. Zaharia, L.; Ioana-Toroimac, G.; Cocoş, O.; Ghiţă, F.A.; Mailat, E. Urbanization effects on the river systems in the Bucharest City region (Romania). Ecosyst. Health Sustain. 2016, 2, e01247. [Google Scholar] [CrossRef]
  26. Stematiu, D.; Teodorescu, D.R. Dâmbovița in Bucharest—Flood defense system. In Proceedings of the Annual conference of the Romanian Academy of Technical Sciences. In Annual Conference of the Romanian Academy of Technical Sciences; A.G.I.R. Publishing House: Bucharest, Romania, 2012; pp. 143–150. (In Romanian) [Google Scholar]
  27. Gogoașe Nistoran, D.-E.; Dragomirescu, A.; Ionescu, C.-S.; Schiaua, M.; Vasiliu, N.; Georgescu, M. A procedure to develop elevation-area-capacity curves of reservoirs from depth sounding surveys. In Proceedings of the 2017 International Conference on ENERGY and ENVIRONMENT (CIEM), Bucharest, Romania, 19–20 October 2017; pp. 92–96. [Google Scholar] [CrossRef]
  28. Cheval, S.; Dumitrescu, A. The summer surface urban heat island of Bucharest (Romania) retrieved from MODIS images. Theor. Appl. Climatol. 2015, 121, 631–640. [Google Scholar] [CrossRef]
  29. Land Process Distributed Active Archive Center (LP DAAC). Available online: https://lpdaac.usgs.gov (accessed on 14 September 2020).
  30. Dewan, A.M.; Corner, R.J. The Impact of Land Use and Land Cover Changes on Land Surface Temperature in a Rapidly Urbanizing Megacity. In Proceedings of the 2012 IEEE International Geoscience and Remote Sensing Symposium, Munich, Germany, 22–27 July 2012; pp. 6337–6339. Available online: https://ieeexplore.ieee.org/document/6352709 (accessed on 10 February 2024).
  31. Gogoașe Nistoran, D.E.; Ionescu, C.S.; Georgescu, M.; David, D.S. Hydraulic model for water management along Dâmboviţa River through Bucharest City, Romania. E3S Web Conf. 2019, 85, 06007. [Google Scholar] [CrossRef]
  32. Singh, S.P.; Singh, P. Effect of temperature and light on the growth of algae species: A. review. Renew. Sustain. Energy Rev. 2015, 50, 431–444. [Google Scholar] [CrossRef]
  33. Available online: https://openweather.co.uk/products/historical-weather-collection (accessed on 25 January 2024).
  34. Available online: https://openweathermap.org/technology (accessed on 25 January 2024).
  35. Available online: https://openweathermap.org/accuracy-and-quality (accessed on 25 January 2024).
  36. Onset, 470 MacArthur Blvd., Bourne, MA 02532, USA. Available online: https://www.onsetcomp.com/products/data-loggers/mx2201#specifications (accessed on 15 February 2024).
  37. Briciu, A.-E.; Mihăilă, D.; Graur, A.; Oprea, D.I.; Prisăcariu, A.; Bistricean, P.I. Changes in the Water Temperature of Rivers Impacted by the Urban Heat Island: Case Study of Suceava City. Water 2020, 12, 1343. [Google Scholar] [CrossRef]
  38. Jallal, M.A.; Chabaa, S.; Chabaa, S.; Zeroual, A. Half-hour global solar radiation forecasting based on static and dynamic multivariate neural networks. J. Eng. Res. 2021, 9, 203–217. [Google Scholar] [CrossRef]
  39. Puiseux, T. Simulations Numériques Pour l’Imagerie par Résonance Magnétique à Contraste de Phase. Ph.D. Thesis, Universite de Montpellier, Montpellier, France, 2019. [Google Scholar]
  40. Meza, J.C. Steepest descent. WIREs Comput. Stat. 2010, 2, 719–722. [Google Scholar] [CrossRef]
  41. Prashanthi, A.; Reddy, R.R. A Feed-Forward and Back Propagation Neural Network Approach for Identifying Network Anomalies. In Proceedings of the 2023 International Conference for Advancement in Technology (ICONAT), Goa, India, 24–26 January 2023; pp. 1–6. [Google Scholar] [CrossRef]
  42. Bebis, G.; Georgiopoulos, M. Feed-forward neural networks. IEEE Potentials 1994, 13, 27–31. [Google Scholar] [CrossRef]
  43. Yagli, G.M.; Yang, D.; Srinivasan, D. Automatic hourly solar forecasting using machine learning models. Renew. Sustain. Energy Rev. 2019, 105, 487–498. [Google Scholar] [CrossRef]
  44. Wilamowski, B.M.; Yu, H. Improved Computation for Levenberg Marquardt Training. IEEE Trans. Neural Netw. 2010, 21, 930–937. [Google Scholar] [CrossRef] [PubMed]
  45. Sushmi, N.B.; Subbulekshmi, D. Performance Analysis of FFBP-LM-ANN Based Hourly GHI Prediction Using Environmental Variables: A Case Study in Chennai. Math. Probl. Eng. 2022, 2022, 1713657. [Google Scholar] [CrossRef]
  46. Pourpasha, H.; Farshad, P.; Zeinali, S.H. Modeling and optimization the effective parameters of nanofluid heat transfer performance using artificial neural network and genetic algorithm method. Energy Rep. 2021, 7, 8447–8464. [Google Scholar] [CrossRef]
  47. Scilab Enterprises. Scilab Version 6.0.1. Available online: https://www.scilab.org/ (accessed on 20 April 2023).
  48. Souchon, Y.; Tissot, L. Synthesis of Thermal Tolerances of the Common Freshwater Fish Species in Large Western Europe Rivers. Knowl. Manag. Aquat. Ecosyst. 2012, 405, 3. [Google Scholar] [CrossRef]
  49. Zhu, S.; Hadzima-Nyarko, M.; Gao, A.; Wang, F.; Wu, J.; Wu, S. Two hybrid data-driven models for modeling water-air temperature relationship in rivers. Environ. Sci. Pollut. Res. 2019, 26, 12622–12630. [Google Scholar] [CrossRef]
  50. Intergovernmental Panel for Climate Change (IPCC). AR6 Synthesis Report Climate Change 2023. Contribution of Working Groups I, II and III to the Sixth Assessment Report of the Intergovernmental Panel on Climate Change; Core Writing Team, Lee, H., Romero, J., Eds.; IPCC: Geneva, Switzerland, 2023; pp. 35–115. [CrossRef]
Figure 1. Plan view and typical cross-section of the Dâmbovița River canal through Bucharest City over Modis Land Surface Temperature with water loggers’ position.
Remotesensing 16 01513 g001
Figure 2. Hourly air temperature in the center of Bucharest City over a period of 45 years (1979–2023) from OpenWeather.
Remotesensing 16 01513 g002
Figure 3. Annual average and maximum air temperatures in Bucharest City over a 45-year period.
Remotesensing 16 01513 g003
Figure 4. Hourly air and water river temperatures.
Remotesensing 16 01513 g004
Figure 5. Box plot of air and river temperatures at the two logging locations, over the summer of 2023.
Remotesensing 16 01513 g005
Figure 6. Architecture of artificial neurons.
Remotesensing 16 01513 g006
Figure 9. Normalized input data into the ANN model.
Remotesensing 16 01513 g009
Figure 10. Linear regression to evaluate the ANN training.
Remotesensing 16 01513 g010
Figure 11. Linear regression to evaluate the ANN prediction.
Remotesensing 16 01513 g011
Figure 12. Measured and computed temperatures given using the ANN model, for the tested time interval.
Remotesensing 16 01513 g012
Figure 13. ANN-computed (predicted) temperatures and the two thresholds, for the tested time interval.
Remotesensing 16 01513 g013
Disclaimer/Publisher’s Note: The statements, opinions and data contained in all publications are solely those of the individual author(s) and contributor(s) and not of MDPI and/or the editor(s). MDPI and/or the editor(s) disclaim responsibility for any injury to people or property resulting from any ideas, methods, instructions or products referred to in the content.

