Abstract
As the largest developing nation, China is currently experiencing rapid urban growth. Conducting a thorough scientific assessment of this expansion and its ecological consequences is of paramount importance for advancing China’s ecological civilization and aligning with the United Nations’ Sustainable Development Goals. This study employs multi-source remote sensing data to investigate the spatiotemporal trends in Chinese urban development and explore its impact on the ecological environment. From 2013 to 2021, the findings indicate an increasing trend in China’s total nocturnal light, with the southern and central regions exhibiting higher growth rates. This suggests a decade-long expansion of Chinese cities, especially in the southern and central regions. However, the impact of urban expansion on ecological quality varies. Beijing, Shenyang, and Xi’an have witnessed improved environmental quality, while Kunming and Shenzhen have experienced minimal changes, and Hefei and Wuhan have encountered a decline. The observed spatial heterogeneity underscores the intricate relationship between urban expansion and ecological shifts. This study reveals the spatiotemporal dynamics of China’s urban expansion and its ecological impact, providing valuable insights and policy recommendations for fostering the harmonized development of urbanization and ecological preservation.
1. Introduction
Research on urban growth and ecological environment protection carries significant global implications. Urban growth exerts a profound impact on climate change and biodiversity, while ecological environment protection plays a crucial role in global ecological balance and sustainable development [1,2,3]. Rapid urban growth results in reduced habitat comfort in cities, elevated CO2 concentrations, and nitrogen deposition in urban ecosystems, leading to the deterioration of urban environments [4,5]. Urban expansion further encroaches on natural habitats, resulting in significant habitat loss for wildlife [6,7]. Studying urban growth helps in comprehending its global environmental impacts, facilitating climate change response, safeguarding wildlife habitats, effectively managing resources, and fostering international cooperation for harmonious natural, social, and economic development world-wide.
China’s urban growth, distinguished by its rapid development and vast scale, features government-led planning and includes interconnections between urban and rural areas, as well as significant land-use changes. Policies geared towards supporting urbanization and ecological environmental research in China encompass multiple areas. The “National New Urbanization Plan (2014–2020)” outlines paths and goals for urban development, emphasizing the importance of sustainable urban development and ecological environmental protection. This plan directs policies on urban spatial layout and resource and environmental protection, as well as urban ecosystem construction. Furthermore, the “Ecological Civilization Construction Assessment and Evaluation System” is dedicated to assessing local governments’ performance in ecological environment protection, underscoring China’s commitment to a development model that harmonizes urbanization with ecological environment protection.
Nighttime light remote sensing data, in contrast to traditional research methods, provide a more straightforward and intuitive approach, aptly reflecting the changes in urban and economic spatiotemporal patterns on a large scale. Consequently, these data are extensively utilized in researching urban growth and economic development. This approach offers an innovative perspective on analyzing the complex dynamics of urban growth and economic changes.
Studies such as Liu et al.’s (2012) analyzed the dynamics of urban expansion in China from 1992 to 2008, demonstrating the utility of nighttime light data in dissecting urban sprawl dynamics [8]. Similarly, Zhang et al., (2011) employed nighttime light data to map urbanization dynamics at both regional and global scales [9]. In addition, the correlation analyses conducted by Huang et al., (2016) revealed a significant relationship between urbanization levels and nighttime light intensity, bolstering the argument for luminosity data as a reliable indicator of urban expansion [10]. Furthermore, Fang et al., (2022) explored future scenarios of urban nighttime lights and linked it to urban expansion and carbon emission estimations, providing a forward-looking perspective on urban growth and its environmental implications [11].
In general, these findings underscore the indispensable role of nighttime light remote sensing data in urban studies, which highlight the potential of nighttime light data as a scalable, timely, and cost-effective tool for monitoring urbanization patterns and understanding socio–economic and environmental ramifications.
Existing research based on nighttime light remote sensing data in urban areas primarily unfolds in the following aspects: investigating the spatiotemporal changes and urban built-up area data in various urban development conditions [10,12], revealing urban expansion dynamics and spatiotemporal evolution patterns in China’s urbanization [13,14,15]; exploring urbanization and economic development, discovering varying growth trends in nighttime illumination areas in cities of different types at national and city levels [16,17,18,19]; assessing urban economic activities and environmental pollution, [20,21,22], exploring relationships between nighttime light data, urban built-up area density, human activities, and evaluating urban environmental pollution like light pollution [23,24,25]; and studying humanitarian disasters and armed conflict damages, applying nighttime light data to large-scale civil wars in countries like Russia, Ukraine, Syria, Iraq, and Yemen, obtaining spatiotemporal information about wars and disasters that is difficult to acquire through traditional means, with findings supporting international peace efforts [26,27,28].
From the analysis of existing research, it becomes clear that current studies utilizing nighttime light remote sensing data on urbanization in China rarely consider the spatiotemporal distribution and evolution trends of nighttime lights across multiple regions within China. Furthermore, the application of nighttime light data in urban ecological environmental research frequently focuses solely on the study of light pollution, neglecting the integration of other remote sensing data for comprehensive analysis.
To address the aforementioned gaps, this study employs NPP/VIIRS nighttime light data alongside analytical methods such as standard deviation ellipses to investigate the spatiotemporal trends of nighttime lights in China from 2013 to 2021. Additionally, this research integrates Landsat 8 remote sensing data to calculate remote sensing ecological index models, thereby examining the impact of urban expansion on the ecological environment. Moreover, it assesses the economic development and ecological environmental quality of various regions and major cities in China, offering a scientific basis for cities to achieve a balance between economic growth and environmental protection. This approach contributes to a more nuanced understanding of the interplay between urbanization and environmental sustainability.
2. Study Area and Data
2.1. Study Area
China, situated in the eastern part of Eurasia and bordering the Pacific Ocean, features a land border spanning approximately 22,000 km and a continental coastline of around 18,000 km. The terrain rises higher in the west and lowers in the east, with mountains, plateaus, and hills comprising about 67% of the land area, and basins and plains constituting about 33%. As of 2022, China’s population stands at approximately 1.4 billion, featuring an urbanization rate of the permanent population of 65.22%. It has 34 provincial-level administrative regions, including 23 provinces, 5 autonomous regions, 4 municipalities, and 2 special administrative regions. The study area covered in this paper includes China’s mainland, Taiwan Island, and Hainan Island, as depicted in Figure 1. In analyzing light data, China is segmented into seven regions: east, central, south, north, northeast, northwest, and southwest. For remote sensing ecological index calculations, one city from each of the seven regions is selected for study. The selected cities are Shenyang in the northeast, Beijing as the capital, Wuhan in central, Shenzhen with the highest GDP in the south, Hefei as an emerging city in the east, Xi’an in the northwest, and Kunming as an international transport hub in the southwest.
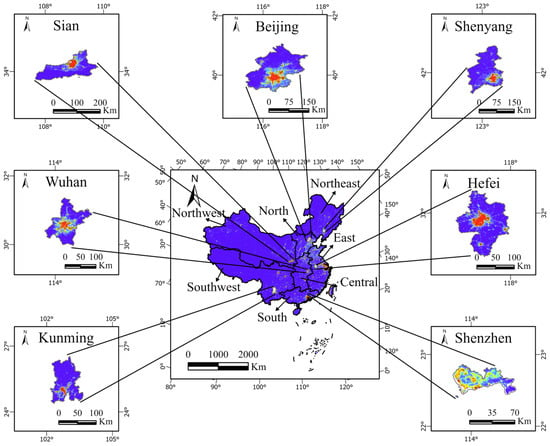
Figure 1.
The nighttime light map of the study area in 2020.
Selecting these cities as focal points for analyzing urban growth and its ecological consequences in China is justified by a multitude of considerations. Shenyang, acknowledged for its significant industrial heritage, exemplifies the ecological transformations associated with the revitalization of China’s traditional industrial bases. Beijing, the national capital, embodies the urbanization challenges faced by large cities and serves as a crucial case for exploring the dynamics between sustainable urban development and mounting ecological pressures globally. Wuhan, emerging as a vital urban center in central China, symbolizes the dynamism of the inland metropolitan’s development. Shenzhen’s evolution from a modest fishing village to a major urban area exemplifies the rapid expansion of modern urbanization. Hefei is underscored for its burgeoning role and strategic efforts in technological and educational advancement, offering insights into the ecological impacts of urban expansion in the evolving cities of China. Xi’an, situated at the crossroads of historical preservation and modern urbanization, provides a distinct case for balancing cultural heritage with contemporary development needs, especially within the context of the “Belt and Road” initiative. Lastly, Kunming’s strategic significance in cross-regional connectivity and its role as a gateway to international corridors emphasize the necessity of evaluating the ecological consequences of urbanization in critical cities.
As a whole, these cities encompass the diversity of China’s urban expansion. By incorporating these diverse urban contexts into the study, this research aims to provide a comprehensive understanding of the ecological effects of urban growth.
2.2. Data Source
The data utilized in this study comprise Landsat8 remote sensing data, NPP/VIIRS nighttime light data, and administrative division and statistical data, along with land-use data of Hefei city, China, as outlined in Table 1. Landsat8 remote sensing data were taken from the United States Geological Survey “https://earthexplorer.usgs.gov (accessed on 28 October 2023)”; NPP/VIIRS nighttime light data were obtained from the National Oceanic and Atmospheric Administration “https://www.ngdc.noaa.gov (accessed on 7 October 2023)”; statistical data include GDP data of various regions in China from 2013 to 2021 and were collected from the National Bureau of Statistics of China “https://www.stats.gov.cn (accessed on 11 October 2023)”; and administrative division and land-use data were developed by Jie Yang and Xin Huang [29]. This study also employed the administrative division vector map provided by the National Geomatics Center of China “https://ngcc.cn/ngcc/ (accessed on 7 October 2023)”.

Table 1.
Data sources.
2.3. Data Preprocessing
2.3.1. NPP/VIIRS Nighttime Light Remote Sensing Data Preprocessing
The article employed the VIIRS/DNB nighttime light data from NOAA, which were adjusted to eliminate influences from stray light, lightning, moonlight, and cloud cover, and it filtered out anomalies such as auroras and biomass burning. Utilizing these processed data, the study employed a Chinese vector map with the WGS84 geographic coordinate system for cropping, converting it into a planar projection coordinate system with a spatial resolution of 500 m, selecting a national cell radiance threshold of 472.86, and eliminating cells with negative pixel values. This process resulted in annual nighttime light data for China from 2013 to 2021, providing a refined basis for analysis.
2.3.2. Landsat Satellite Image Data Preprocessing
This study chose Landsat8 satellite imagery from 2013 to 2022 and performed image screening. The acquired images featured cloud coverage of less than 5% and were of good quality, thus meeting the requirements for calculations. Preprocessing entails atmospheric correction and radiometric calibration of the images, subsequently followed by image cropping. This methodology ensures the reliability and accuracy of the data used for the subsequent analysis.
3. Methods
Initially, a statistical analysis of the total amount and growth rate of nighttime light data across various regions of China from 2013 to 2021 was performed. Subsequently, the evolution trends of nighttime lights in these regions and across China were discussed utilizing the standard deviation ellipse method. Finally, changes in ecological environmental quality in selected representative cities were analyzed through the application of a remote sensing ecological model, offering insights into the interplay between urban development and ecological sustainability.
3.1. Statistics for Total Nighttime Light and Growth Rate
Referring to the method described by Gao et al. [30], the total nighttime light (T) and the growth rate of nighttime lights (r) were calculated according to a specific formula:
In the formula, represents the digital number of the i-th pixel. is the total brightness of lights in 2021, and represents the total brightness of lights in 2013.
3.2. Standard Deviation Ellipse Method
The standard deviation ellipse method can unveil the spatial distribution of specific geographic characteristics. The standard deviation ellipse model is composed of four key parameters: the centroid, the major axis, the orientation angle, and the area. The centroid acts as the center of the standard deviation ellipse. The major axis is used to demonstrate the trend of spatial distribution. The orientation angle reflects the dominant direction of change in the distribution of the target geographic feature within a given geographic space. The area indicates the spatial distribution scope of the geographic feature being studied. Scholars have widely employed this method to analyze geographical elements, urban patterns, and the distribution of economic development, making it a valuable tool in the fields of geography and urban studies [31,32,33].
The standard deviation ellipse model consists of four primary parameters: centroid, major axis, orientation, and area. The centroid serves as the center of the ellipse; the major axis denotes the trend of spatial distribution; orientation indicates the dominant direction of the target geographic element in a specific geographic space; and the area depicts the spatial distribution range of the studied geographic element. The centroid of the standard deviation ellipse model can be obtained through the following formula:
The calculation method for the orientation angle (α) is as follows:
The calculation methods for the standard deviations along the x-axis and y-axis ( and ) are as follows:
In the formula, represents the weight corresponding to the light data; and indicate the coordinate deviations of the ωth pixel unit from the centroids and .
3.3. Remote Sensing Ecological Index Model
Xu Hanqiu et al. employed the principal component analysis method to develop a Remote Sensing Ecological Index (RSEI) model, which effectively captures changes in the ecological environment [34]. Owing to its ease of data acquisition and capacity for spatial–temporal analysis visualization, this model has seen extensive applications in studies of ecological environments in urban areas, wetlands, nature reserves, and deserts. Its broad applicability underscores its value in environmental monitoring and management [35,36,37].
The RSEI originates from four key factors: the Normalized Difference Vegetation Index (NDVI), the Wetness Index (WET), the calculation of the Heat Index (Land Surface Temperature, LST), and the Dryness Index (Normalized Differential Build-up and Bare Soil Index, NDBSI). This model integrates these indicators through principal component analysis, thus overcoming the limitations of single indicators and enabling a more rational composite assessment. Furthermore, it facilitates the visualization of evaluation results, thereby providing a clearer observation of the spatial–temporal changes in regional ecological environments, making it a valuable tool for ecological analysis.
3.3.1. Normalized Difference Vegetation Index (NDVI)
In the Equation below as presented
In the formula, NIR represents the reflectance in the near-infrared band, and RED represents the reflectance in the red band.
3.3.2. Wetness Index (WET)
The Wetness Index (WET) is obtained through a Tasseled Cap Transformation, and its calculation method is as follows:
In the formula, represent the sensor parameters for the Landsat 8 OLI, which are 0.1511, 0.1972, 0.3283, 0.3407, 0.7117, and 0.4559. BLUE denotes the reflectance for the blue band; GREEN for the green band; RED for the red band; NIR for the near-infrared band; SWIR1 for the short-wave infrared band 1; and SWIR2 for the short-wave infrared band 2.
3.3.3. Heat Index (LST)
The Heat Index (Land Surface Temperature, LST) is derived from the thermal infrared band in the Level 2 products of the Landsat 8 satellite, and its calculation method is as follows:
In the formula, Band10 represents the pixel value of the thermal infrared band.
3.3.4. Dryness Index (NDBSI)
The Dryness Index (NDBSI) is derived from the average of the Urban Building Index (IBI) and the Bare Soil Index (SI). The range of this index is between −1 and 1, where higher values indicate greater dryness. Its calculation method is as follows:
In the formula, SWIR1 represents the reflectance in the mid-infrared band 1; RED is the reflectance in the red band; NIR denotes the reflectance in the near-infrared band; BLUE is the blue band reflectance; and GREEN is the green band reflectance.
3.3.5. The Construction of the Remote Sensing Ecological Index
The process involves conducting a principal component analysis on the four key factors extracted. The first principal component (PC1) is used, processed through a specific calculation method, to obtain the unnormalized Remote Sensing Ecological Index (RSEI0):
The calculated RSEI0 is normalized to obtain the RSEI, and the normalization method is as follows:
4. Results and Analysis
4.1. The Spatial Distribution Pattern of China’s Total Nighttime Light
4.1.1. The Ranking and Contribution of Total Nighttime Light in Various Regions of China
The annual nighttime light data of China from 2013 to 2021, as illustrated in Figure 2, exhibit distinct regional characteristics. The distribution of nighttime lights in this timeframe indicates a more pronounced concentration in the eastern regions of China relative to the sparser western regions. This trend reflects the economic pattern of China, with the eastern regions being more economically advanced than the comparatively less developed western areas. The majority of the nighttime lights are focused in the southeastern coastal regions and near rivers in the inland areas, corresponding to the geographical distribution of China’s economically developed areas and major cities along the coast and rivers. These data effectively visualize the economic disparities across different regions of China.
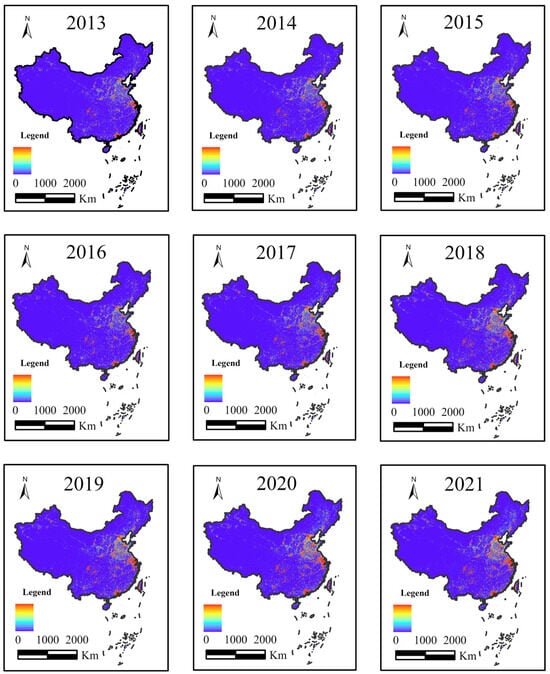
Figure 2.
The annual nighttime light maps of China from 2013 to 2021.
Utilizing nighttime light remote sensing images from 2013 to 2021, the total nighttime light brightness for China’s seven major regions was calculated. As shown in Figure 3, the total amount of nighttime light for these regions between 2013 and 2021 indicates that all seven regions have shown an upward trend, with an average growth rate of 60.89%. The eastern region maintained the highest total amount of nighttime light throughout the period from 2013 to 2021. The growth in the total nighttime light in the northeastern region was relatively weak, dropping from sixth place in 2013 to seventh place in 2021. Moreover, except for the central region, which moved up from sixth to fifth place, surpassing the northwest region, the rankings of the other regions in China remained unchanged.
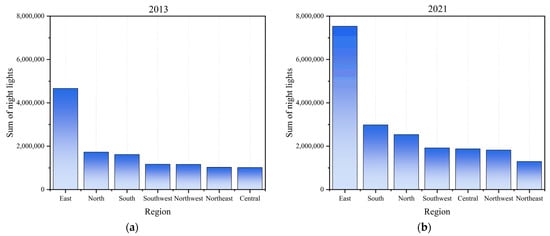
Figure 3.
Ranking of total nighttime light in China’s seven major regions in 2013 and 2021. (a) Ranking of total nighttime light in China’s seven major regions in 2013. (b) Ranking of total nighttime light in China’s seven major regions in 2021.
The study also determined that the growth in nighttime light in China from 2013 to 2021 was largely attributed to the eastern region. As indicated in Figure 4, the eastern region comprised 37.80% of China’s increase in nighttime light, with the southern and central regions contributing 18.01% and 11.33%, respectively, and the northeast region contributing a mere 3.59%. This suggests that during 2013–2021, the eastern, southern, and central regions emerged as the main contributors to the increase in nighttime light in China, emphasizing the pronounced growth of nighttime light in China’s most developed eastern region.
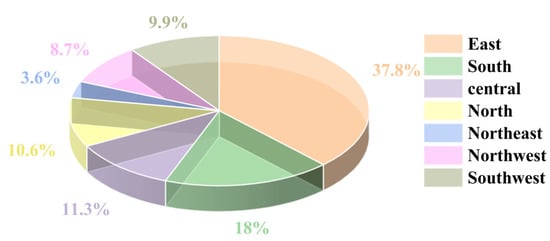
Figure 4.
Pie chart of the contribution of nighttime light increment in various regions of China from 2013 to 2021.
4.1.2. Results of the Standard Deviation Ellipse Analysis
Utilizing nighttime light data in conjunction with data from various administrative regions in China, the centroids and standard deviation ellipses of pixel light for 2013 and 2021 were calculated. The results, illustrated in Figure 5 and Table 2, indicate that the center of nighttime light in China shifted southwestward, spanning a distance of 62 km between the 2013 and 2021 centers. This suggests that from 2013 to 2021, the economic growth rate in the central and western regions of China was especially significant. Simultaneously, the sluggish economic growth in the northeast contributed to a heightened economic prominence of southern China nationally, leading to the centroid’s southward shift.
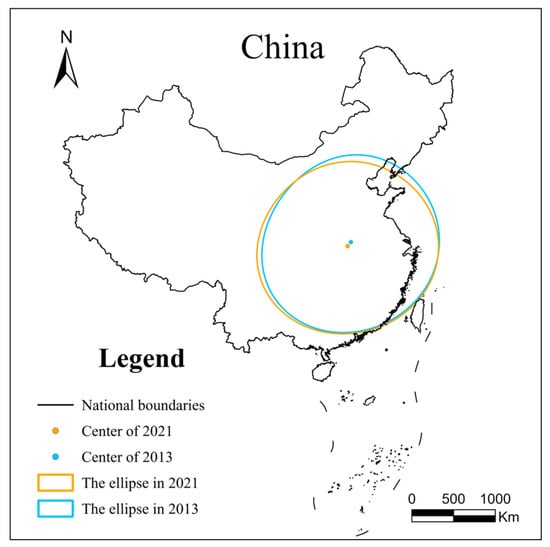
Figure 5.
Standard deviation ellipses and ellipse centers in China based on nighttime light data.

Table 2.
Changes in the standard deviation ellipses of China.
To examine the spatial distribution and changing patterns of nighttime lights across China’s various regions, a standard deviation ellipse analysis was conducted for the seven principal regions, with the results illustrated in Figure 6 and Table 3. The analysis reveals that the centroid of the ellipse in the eastern region shifted 37 km northwestward, while in the southern region, it shifted 14 km southwestward; similarly, in the northwest, it shifted 128 km northwestward, in the northeast 24 km southeastward, in the central region 12 km northwestward, in the northern region 12 km southeastward, and in the southwest 29 km northwestward. The study additionally discovered that the ellipse areas in the eastern, southern, northwest, northeast, and southwest regions exhibited expansion, whereas those in the central and northern regions demonstrated contraction.
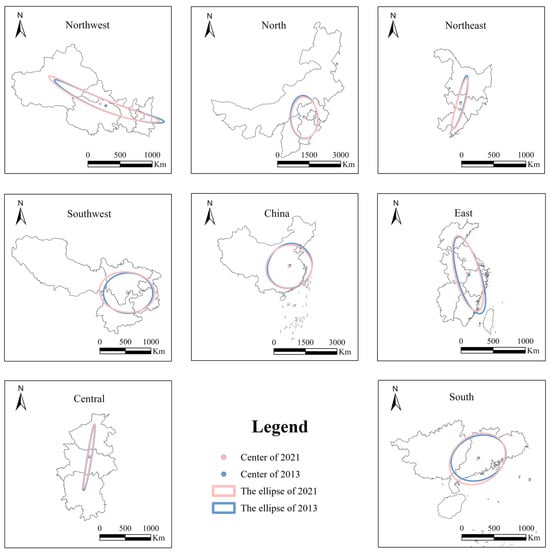
Figure 6.
The economic centers and standard deviation ellipses of China’s seven major regions based on nighttime light data.

Table 3.
The changes in the standard deviation ellipses of China’s seven major regions.
4.2. The Temporal Trend of China’s Total Nighttime Light
The analysis of the total nighttime light and growth rates from 2013 to 2021 for China’s seven major regions, as depicted in Figure 7, indicated an overall upward trend. The average growth rate was recorded at 60.81%. The central region witnessed the highest growth rate in nighttime light, at 84.68%, whereas the northeast region exhibited the lowest growth rate, at 26.53%.
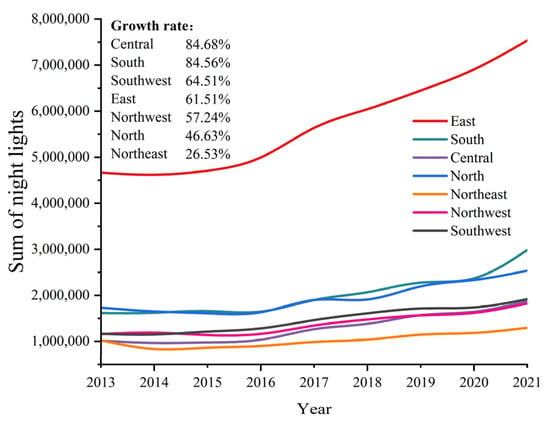
Figure 7.
The total nighttime light amount and growth rates for China’s seven major regions from 2013 to 2021.
Since the early 21st century, there has been a significant emphasis in China on the development of emerging urban clusters in the western and central regions. In order to comprehend the disparities among the eastern, central, and western regions, this study analyzes their nighttime light data and GDP from 2013 to 2021. Figure 8a,b show that the growth rate of nighttime lights for the eastern, central, and western regions stood at 61.51%, 84.68%, and 60.89%, respectively. In terms of GDP growth, the rates were 86.16% for the east, 89.89% for the central, and 100.03% for the west. These results suggest that the central region has overtaken the eastern region in terms of nighttime light growth, and the western region’s growth is nearly comparable to the east’s. Furthermore, in terms of GDP growth rates, the eastern region has been overtaken by both the central and western regions, highlighting significant advancements in the development of urban clusters in China’s central and western regions over the past decade.
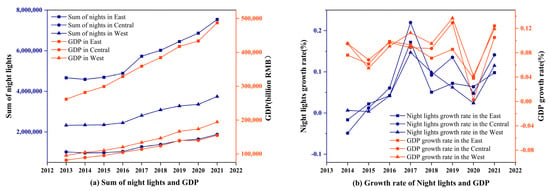
Figure 8.
Comparison of GDP and total nighttime light in the eastern, central, and western regions. (a) Sum of night lights and GDP. (b) Growth rate of night lights and GDP.
4.3. The Change in Urban Development and Ecological Environment Quality
4.3.1. The Response of the Ecological Environment to Urban Development
Landsat satellite imagery spanning 2013 to 2022 underwent processing for the execution of a principal component analysis on the four indicators of the Remote Sensing Ecological Index (RSEI): Greenness (NDVI), Wetness (WET), Dryness (NDSI), and Heat (LST). Selection of the first principal component was made for the RSEI calculation. For more intuitive analysis of changes in the urban ecological environment, this study further segmented the RSEI into five categories using the equal interval method: Fail (0–0.2), Poor (0.2–0.4), Average (0.4–0.6), Good (0.6–0.8), and Excellent (0.8–1), as indicated in Table 4. This categorization provides a clearer understanding of the varying levels of ecological quality across urban areas.

Table 4.
RSEI and ecological quality levels of Wuhan, Beijing, Shenyang, Sian, Kunming, Shenzhen, and Hefei between 2013 and 2022.
According to the data in Table 4, Wuhan’s RSEI declined from 0.643 to 0.584 between 2013 and 2022, marking a decline of 9.18%. Shenyang’s RSEI rose from 0.697 to 0.722, an increase of 3.59%; Beijing’s RSEI escalated from 0.583 to 0.697, a significant increase of 19.55%; Xi’an’s RSEI elevated from 0.583 to 0.621, an upsurge of 6.52%; Hefei’s RSEI diminished from 0.666 to 0.627, representing a decrease of 5.86%; Kunming’s RSEI advanced from 0.527 to 0.548, an increase of 3.98%; and Shenzhen’s RSEI marginally rose from 0.592 to 0.594, an increase of 0.34%. The data suggest a decline in ecological environmental quality in Wuhan and Hefei, virtually no change in Shenzhen, and noticeable improvements in Xi’an, Beijing, Shenyang, and Kunming. Beijing, with a nearly 20% increase in RSEI, showed the most significant improvement among the seven cities.
Visual analysis of the research data delineates the distribution of ecological environmental quality levels in Wuhan, Beijing, Shenyang, Xi’an, Kunming, Shenzhen, and Hefei for 2013 and 2022, as illustrated in Figure 9. The color coding symbolizes different environmental quality levels: blue for “Excellent”, green for “Good”, yellow for “Average”, orange for “Poor”, and red for “Fail”.
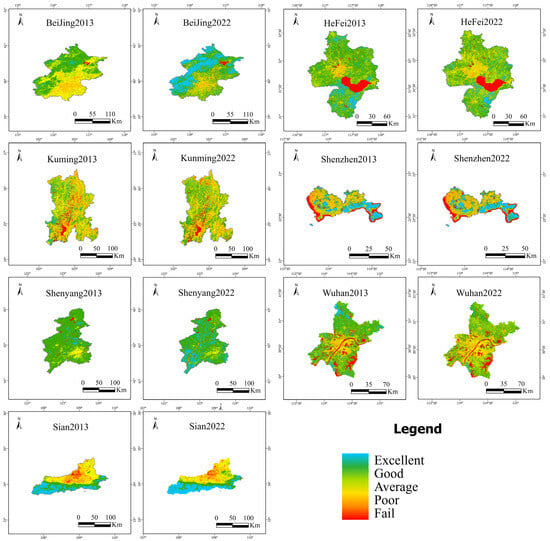
Figure 9.
Distribution map of the ecological environment quality levels of Wuhan, Beijing, Shenyang, Xi’an, Kunming, Shenzhen, and Hefei in 2013 and 2022.
The study demonstrates a marked improvement in Beijing’s ecological environment. It indicates a substantial decrease in the area classified as “Poor” in Beijing’s urban interior, with a transition to “Average” and “Good”. Similarly, in the suburban areas of Beijing, there was a significant reduction in areas rated as “Average,” complemented by an increase in areas rated as “Good”. The highest ecological environmental quality levels were observed in the northern and western administrative districts of Beijing, improving from “Good” in 2013 to superior levels in 2022. Overall, the proportion of areas in Beijing rated as “Excellent” increased significantly, from 1.95% in 2013 to 31.99% in 2022.
The ecological environment in Hefei city overall exhibited a declining trend, evidenced by a shift from “Good” to “Average” and even “Poor” in the ecological environmental quality levels around the city center. In the suburban areas of Hefei, environmental quality has deteriorated, with a significant reduction in areas rated as “Excellent” in the northern and southern parts, and the northern region witnessing the complete disappearance of such areas.
In Kunming, an overall minor improvement in ecological environmental quality was observed, with an increase in the RSEI from 0.527 to 0.548, despite a deterioration in some southwestern areas. Shenyang experienced overall enhancements across various parts of its administrative region, with the area classified as “Excellent” rising from 3.72% in 2013 to 18.60%. The case of Shenzhen is quite unique. The RSEI changed from 0.592 to 0.594, reflecting almost no discernible change in the imagery. Therefore, it is believed that the quality of the ecological environment in Shenzhen has remained nearly constant during the study period or has exhibited minor fluctuations.
The ecological environment in Wuhan has seen an overall deterioration in quality, particularly in the suburban areas surrounding the city, where the quality has significantly degraded, indicating an expansion of deterioration from the city to the suburbs. In Xi’an, the ecological environment showed overall improvement, as evidenced by a decrease in areas rated as “Fail” in the city’s interior region and an increase in areas rated as “Excellent” in the southern part of its administrative region, with the RSEI increasing from 0.583 to 0.621.
4.3.2. The Impact of Urban Development on the Ecological Environment
Urban development is not inherently associated with negative impacts on the ecological environment. The research results indicate that Beijing’s RSEI improved from 0.583 to 0.697 between 2013 and 2022, indicating an enhancement in ecological environmental quality. This improvement can likely be attributed to Beijing’s deindustrialization and ecological restoration projects implemented for the 2022 Beijing Winter Olympics and sandstorm mitigation efforts. Table 5 illustrates changes in the proportions of the primary, secondary, and tertiary industries (primary industry: involves extracting natural resources, such as agriculture and mining; secondary industry: focuses on transforming raw materials into finished goods, including manufacturing and construction; tertiary industry: provides services rather than goods, encompassing sectors like retail, healthcare, and education) in Beijing from 2013 to 2021, showcasing a continuous rise in the tertiary sector and a gradual relocation of high-energy-consumption and high-pollution industries typified by the primary and secondary sectors.

Table 5.
The proportions of the primary, secondary, and tertiary industries in Beijing’s GDP in 2013 and 2021.
Beijing actively engaged in ecological restoration projects in preparation for the Winter Olympics. In the Yanqing competition area, situated in northern Beijing and noted for its significant ecological improvement, ecological restoration commenced in 2015. By the end of 2020, venues such as the National Sliding Center and the National Alpine Skiing Center had been completed, encompassing a total of 2.14 million square meters of ecological restoration. To address sandstorms, Beijing initiated a large-scale afforestation project, with the second phase commencing in 2013. By the end of 2021, 213.9 million mu of afforestation had been achieved, significantly enhancing the greening of Beijing’s barren hills and increasing forest coverage in mountainous areas to 58.8%. These efforts underscore Beijing’s successful synergy of economic growth and ecological conservation, markedly improving its ecological environmental quality.
The pressures associated with rapid urban development on the ecological environment are significant and cannot be overlooked. From 2021 to 2022, Hefei experienced the highest GDP growth rate in China, characterized by a large-scale expansion of its urban area. This rapid development resulted in a marked deterioration in the ecological environmental quality of Hefei, as evidenced by the RSEI dropping from 0.666 to 0.627. Drawing upon the land-use data from Yang and Xin Huang, the land-use maps of Hefei for 2013 and 2022, illustrated in Figure 10, show an expansion in areas classified as artificial surfaces over this period. This increase in artificial surface areas contributes to a rise in the contribution values of NDBSI and LST in the RSEI, negatively impacting the ecological quality.
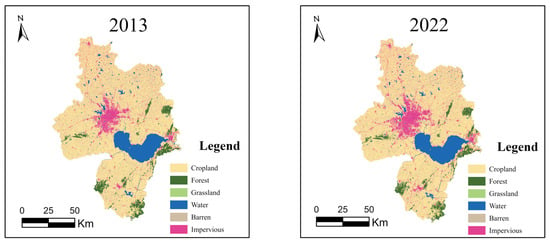
Figure 10.
The land-use types of Hefei city in 2013 and 2022.
Continuing with the analysis of Hefei’s land-use data spanning 2013 to 2022, both an overlay analysis and a transfer Sankey chart have been produced, as illustrated in Table 6 and Figure 11. The results show that in Hefei, areas classified as Barren and Impervious, known to adversely affect ecological environmental quality, experienced an increase. These areas were predominantly transformed from Cropland and Forest. In contrast, areas contributing positively to ecological quality, such as Forest and Grassland, saw reductions to varying extents, accompanied by a decrease in agricultural land. This factor is likely to have significantly contributed to the decline of Hefei’s ecological environmental quality.

Table 6.
The land-use transition matrix table for Hefei city (unit: km2).
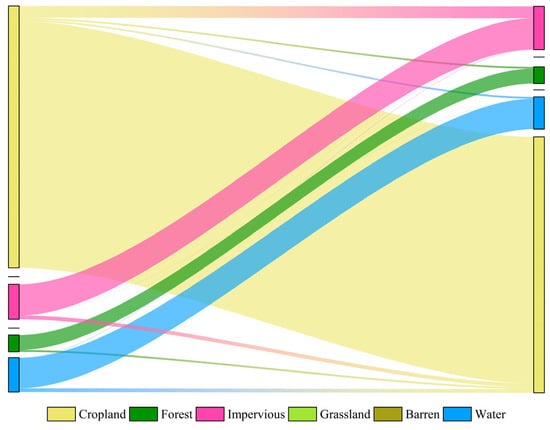
Figure 11.
The land-use type transition Sankey diagram for Hefei city from 2013 to 2022.
5. Discussion
Focusing on China, this article selects Shenyang, Beijing, Wuhan, Xi’an, Hefei, Kunming, and Shenzhen to represent seven major regions. The study explores the interplay between urban development and its environmental impacts, thereby enriching existing research on economic development and environmental protection. The key findings are as follows: (1) From 2013 to 2021, nighttime light intensity, a marker of urban development, increased across all regions, most notably in the central region, followed by the east and south. (2) Urban development is not invariably detrimental to the ecological environment. In the period from 2013 to 2022, the ecological quality improved in Beijing, Xi’an, and Shenyang, while it declined in Wuhan and Hefei and stayed constant in Kunming and Shenzhen.
5.1. The Regional Differences and Southward Shift of Nighttime Lights
The distribution and growth of nighttime light in China display clear regional differences. In the eastern region, correlating with its economic development, there is dense nighttime lighting, whereas the western region exhibits comparatively less lighting. From 2013 to 2021, the increase in nighttime lights was mainly from the eastern, southern, and central regions, with the eastern region accounting for 37.80% of the growth. The geographic center of nighttime lights moved approximately 62 km southwest in this timeframe. An analysis of the elliptical area changes across various regions indicated expansion in the east, south, northwest, northeast, and southwest, and contraction in the central and northern regions.
The observed elliptical changes in urban areas, including variations in area and shifts in the centroid position, signify key trends in urban development and expansion. The alteration in the ellipse’s size, in particular, can be interpreted as an indicator of urban sprawl or concentration, a phenomenon of significant importance to urban planning, environmental sustainability, and socio–economic dynamics.
The expansion of the ellipse indicates a widening urban footprint, suggesting a trend towards urban sprawl. This outward growth may be driven by factors such as population increase, economic development, and the pursuit of lower land costs outside urban cores. While it may foster economic opportunities and residential space, sprawl could put strain on the infrastructure, increase transportation emissions, and encroach on natural habitats. Moreover, the dispersion of urban areas might exacerbate socio–economic disparities by creating a more pronounced division between urban and suburban areas. Conversely, a contraction of the ellipse implies a more concentrated urban form, potentially indicating efforts towards densification and sustainable urban development. This trend could be driven by policies aimed at curbing sprawl, such as land-use regulations, investment in public transportation, and the development of mixed-use communities. Urban concentration can enhance resource use efficiency, reduce per capita environmental impacts, and foster vibrant, walkable communities. However, without careful management, it may also lead to challenges like housing affordability issues and congestion.
The movement of the centroid reflects the directional bias of urban expansion, providing insight into regional development priorities and the geographical redistribution of economic activities. This shift may be influenced by infrastructure projects, regional development policies, or environmental constraints, highlighting the dynamic interaction between human endeavors and the natural landscape.
Understanding these trends and the driving forces behind them is crucial for formulating wise urban policies that balance growth with sustainability. This requires a multidisciplinary approach, integrating insights from geography, urban planning, economics, and environmental science, to ensure that urban expansion aligns with broader goals of social well-being and ecological resilience.
The findings are similar to the results of the existing literature [38,39,40]. Combining previous research, it can be understood that the regional differences in nighttime light may be the result of the interplay of multiple complex factors [41]. Understanding the developmental disparities between different regions can facilitate more balanced growth. To achieve coordinated development between eastern and western regions, it may be necessary for governments to increase investments in the west to reduce regional development gaps, formulate more precise policies and strategies, and promote balanced and sustainable economic growth.
This revelation underscores the importance of comprehending developmental disparities among regions in facilitating more balanced development. To achieve coordinated development between the eastern and western regions, guiding the government to augment investments in the western areas is crucial to mitigate regional development gaps, culminate more precise policies and strategies, and foster more balanced and sustainable economic growth. Furthermore, the study’s conclusions offer insightful guidance on the direction of economic growth, assisting businesses and investors in pinpointing regions with greater potential for investment and expansion.
5.2. The Non-Synergistic Impact of China’s Urbanization on Regional Ecological Environments
From 2013 to 2022, there was considerable variation in the impact of urban development on ecological environments in China. During this period, metropolises such as Beijing, Xi’an, and Shenyang witnessed enhancements in ecological environmental quality, while Wuhan and Hefei endured declines. In contrast, the ecological environments of Kunming and Shenzhen demonstrated minimal alterations.
Specifically, Wuhan’s RSEI witnessed a decrease of 9.18%, while Hefei’s experienced a reduction of 5.86%. Shenzhen’s RSEI change was minimal, registering a slight increase of 0.34%. In contrast, Shenyang’s and Kunming’s RSEI increased by 3.59% and 3.98%, respectively, whereas Xi’an and Beijing recorded increases of 6.52% and 19.55%. According to the literature [42,43,44,45,46,47,48], some studies have noted a decline in RSEI correlating with urban development, while others reported an increasing trend. Additionally, several studies identified fluctuating RSEI patterns in line with urban growth [49,50,51]. This suggests a complex interplay between urban development and ecological environments, characterized by an asynchronous relationship.
This variability could be attributed to diverse influences of urban development strategies, adjustments in industrial structures, and variations in environmental protection policies. Some cities may place greater emphasis on environmental protection and sustainable development, adopting effective policies to enhance ecological conditions. Conversely, other cities facing pressures of rapid development and economic expansion may neglect the ecological environment, resulting in its deterioration.
These research findings underscore that the relationship between urban development and the ecological environment is not simply linear but rather a complex interplay. It highlights the necessity of balancing economic growth with environmental protection amidst urban development. This necessitates prioritizing ecological conservation and sustainable development, coupled with the implementation of effective measures to harmonize the relationship between economic growth and environmental conservation. For rapidly developing cities like Hefei and Shenzhen, it is advisable to incorporate more green infrastructure into urban planning and development, which will improve the ecological quality and the quality of life. In cities with a heavy industrial background, such as Shenyang, formulating and implementing stricter environmental emission standards to promote the optimization and upgrading of industrial structures can reduce the environmental impact of industrial activities. Each city should establish an evaluation system for balancing urban development with environmental protection, taking into consideration the rate of economic development and urban expansion and the quality of the ecological environment.
6. Conclusions
This article utilizes Landsat 8 satellite remote sensing data and NPP/VIIRS nighttime light remote sensing imagery, combined with the standard deviation ellipse method and the remote sensing ecological index model, to examine the spatiotemporal dynamics of urban development in China and its impact on the ecological environment. In summary, the eastern region exhibited dense nighttime lights, reflecting its economic development, whereas the western region showed fewer lights. Secondly, a general increase in total nighttime brightness was observed across all seven regions, with an average growth rate of 60.89%. The growth in nighttime lights primarily originated from the eastern, southern, and central regions, with the east contributing the largest portion at 37.80%. From 2013 to 2021, the centroid of nighttime lights in China shifted approximately 62 km southwest. Elliptical areas in the east, south, northwest, northeast, and southwest regions expanded, while those in the central and northern regions contracted. The nighttime light growth rate in the central region surpassed that of the east, with the west nearly equaling the east. In terms of GDP growth rate, the eastern region was outpaced by the central and western regions. Lastly, the impact of urban development on the ecological environmental quality varied across regions, indicating improvement in Beijing, Shenyang, and Xi’an; stable conditions in Kunming and Shenzhen; and reductions in Hefei and Wuhan, suggesting a complex interaction between urban development and ecological changes.
This study acknowledges the existence of certain limitations, which are mainly manifested in three aspects. Firstly, the research has, so far, only compared nighttime light data with GDP, without comparing it with population numbers or levels of development. Secondly, the RSEI used to assess the quality of the ecological environment does not fully cover all dimensions of an area’s ecological environment, lacking the capability to assess elements such as water quality and biodiversity. Lastly, the nighttime light remote sensing data and Landsat data used cover a relatively short period, which hinders the analysis of long-term evolution. Future research will require more robust data sources, including satellite or drone data with higher resolutions and more timeliness, and the development of more comprehensive models to produce more objective and reliable analysis results.
Author Contributions
Conceptualization, Y.S. and H.C.; methodology, H.C. and S.Z.; software, H.C.; validation, H.C., S.D., S.Z. and Y.S.; formal analysis, H.C. and S.D.; investigation, H.C. and S.D.; resources, S.D.; data curation, H.C. and S.D.; writing—original draft preparation, H.C. and S.D.; writing—review and editing, H.C. and Y.S.; visualization, H.C. and S.D.; supervision, Y.S. All authors have read and agreed to the published version of the manuscript.
Funding
This research was funded by the National Natural Science Foundation of China: 42361053; the Hainan Provincial Natural Science Foundation of China: 422RC598; and start-up fund of Hainan University: KYQD(ZR)22081.
Data Availability Statement
Data are contained within the article.
Acknowledgments
We would like to thank reviewers and the editor in charge for their valuable time spent on this article.
Conflicts of Interest
The authors declare no conflicts of interest.
References
- Grimm, N.B.; Faeth, S.H.; Golubiewski, N.E.; Redman, C.L.; Wu, J.; Bai, X.; Briggs, J.M. Global Change and the Ecology of Cities. Science 2008, 319, 756–760. [Google Scholar] [CrossRef] [PubMed]
- Poff, N.L. Ecological response to and management of increased flooding caused by climate change. Philosophical Transactions of the Royal Society of London. Ser. A Math. Phys. Eng. Sci. 2002, 360, 1497–1510. [Google Scholar] [CrossRef] [PubMed]
- Wernberg, T.; Russell, B.D.; Moore, P.J.; Ling, S.D.; Smale, D.A.; Campbell, A.; Connell, S.D. Impacts of climate change in a global hotspot for temperate marine biodiversity and ocean warming. J. Exp. Mar. Biol. Ecol. 2011, 400, 7–16. [Google Scholar] [CrossRef]
- Xiong, Y.; Huang, S.; Chen, F.; Ye, H.; Wang, C.; Zhu, C. The impacts of rapid urbanization on the thermal environment: A remote sensing study of Guangzhou, South China. Remote Sens. 2012, 4, 2033–2056. [Google Scholar] [CrossRef]
- Shen, W.; Wu, J.; Grimm, N.B.; Hope, D. Effects of urbanization-induced environmental changes on ecosystem functioning in the Phoenix metropolitan region, USA. Ecosystems 2008, 11, 138–155. [Google Scholar] [CrossRef]
- He, C.; Liu, Z.; Tian, J.; Ma, Q. Urban expansion dynamics and natural habitat loss in China: A multiscale landscape perspective. Glob. Change Biol. 2014, 20, 2886–2902. [Google Scholar] [CrossRef] [PubMed]
- Seto, K.C.; Güneralp, B.; Hutyra, L.R. Global forecasts of urban expansion to 2030 and direct impacts on biodiversity and carbon pools. Proc. Natl. Acad. Sci. USA 2012, 109, 16083–16088. [Google Scholar] [CrossRef] [PubMed]
- Liu, Z.; He, C.; Zhang, Q.; Huang, Q.; Yang, Y. Extracting the Dynamics of Urban Expansion in China Using DMSP-OLS Nighttime Light Data from 1992 to 2008. Landsc. Urban Plan. 2012, 106, 62–72. [Google Scholar] [CrossRef]
- Zhang, Q.; Seto, K.C. Mapping urbanization dynamics at regional and global scales using multi-temporal DMSP/OLS nighttime light data. Remote Sens. Environ. 2011, 115, 2320–2329. [Google Scholar] [CrossRef]
- Huang, X.; Schneider, A.; Friedl, M.A. Mapping sub-pixel urban expansion in China using MODIS and DMSP/OLS nighttime lights. Remote Sens. Environ. 2016, 175, 92–108. [Google Scholar] [CrossRef]
- Fang, G.; Gao, Z.; Tian, L.; Fu, M. What drives urban carbon emission efficiency? –Spatial analysis based on nighttime light data. Appl. Energy 2022, 312, 118772. [Google Scholar] [CrossRef]
- Wei, Y.; Liu, H.; Song, W.; Yu, B.; Xiu, C. Normalization of time series DMSP-OLS nighttime light images for urban growth analysis with pseudo invariant features. Landsc. Urban Plan. 2014, 128, 1–13. [Google Scholar] [CrossRef]
- Chen, Z.; Yu, B.; Zhou, Y.; Liu, H.; Yang, C.; Shi, K.; Wu, J. Mapping global urban areas from 2000 to 2012 using time-series nighttime light data and MODIS products. IEEE J. Sel. Top. Appl. Earth Obs. Remote Sens. 2019, 12, 1143–1153. [Google Scholar] [CrossRef]
- Yu, B.; Tang, M.; Wu, Q.; Yang, C.; Deng, S.; Shi, K.; Chen, Z. Urban built-up area extraction from log-transformed NPP-VIIRS nighttime light composite data. IEEE Geosci. Remote Sens. Lett. 2018, 15, 1279–1283. [Google Scholar] [CrossRef]
- Xie, Z.; Yuan, M.; Zhang, F.; Chen, M.; Shan, J.; Sun, L.; Liu, X. Using Remote Sensing Data and Graph Theory to Identify Polycentric Urban Structure. IEEE Geosci. Remote Sens. Lett. 2023, 20, 1–5. [Google Scholar] [CrossRef]
- Ma, T.; Zhou, Y.; Zhou, C.; Haynie, S.; Pei, T.; Xu, T. Night-time light derived estimation of spatio-temporal characteristics of urbanization dynamics using DMSP/OLS satellite data. Remote Sens. Environ. 2015, 158, 453–464. [Google Scholar] [CrossRef]
- Keola, S.; Andersson, M.; Hall, O. Monitoring economic development from space: Using nighttime light and land cover data to measure economic growth. World Dev. 2015, 66, 322–334. [Google Scholar] [CrossRef]
- Stokes, E.C.; Seto, K.C. Characterizing urban infrastructural transitions for the Sustainable Development Goals using multi-temporal land, population, and nighttime light data. Remote Sens. Environ. 2019, 234, 111430. [Google Scholar] [CrossRef]
- Niu, W.; Xia, H.; Wang, R.; Pan, L.; Meng, Q.; Qin, Y.; Li, R.; Zhao, X.; Bian, X.; Zhao, W. Research on Large-Scale Urban Shrinkage and Expansion in the Yellow River Affected Area Using Night Light Data. ISPRS Int. J. Geo-Inf. 2021, 10, 5. [Google Scholar] [CrossRef]
- Bagan, H.; Borjigin, H.; Yamagata, Y. Assessing nighttime lights for mapping the urban areas of 50 cities across the globe. Environ. Plan. B Urban Anal. City Sci. 2019, 46, 1097–1114. [Google Scholar] [CrossRef]
- Liu, Y.; Delahunty, T.; Zhao, N.; Cao, G. These lit areas are undeveloped: Delimiting China’s urban extents from thresholded nighttime light imagery. Int. J. Appl. Earth Obs. Geoinf. 2016, 50, 39–50. [Google Scholar] [CrossRef]
- Chalkias, C.; Petrakis, M.; Psiloglou, B.; Lianou, M. Modelling of light pollution in suburban areas using remotely sensed imagery and GIS. J. Environ. Manag. 2006, 79, 57–63. [Google Scholar] [CrossRef] [PubMed]
- Butt, M.J. Estimation of light pollution using satellite remote sensing and geographic information system techniques. GIScience Remote Sens. 2012, 49, 609–621. [Google Scholar] [CrossRef]
- Wu, J.; Tu, Y.; Chen, Z.; Yu, B. Analyzing the spatially heterogeneous relationships between nighttime light intensity and human activities across Chongqing, China. Remote Sens. 2022, 14, 5695. [Google Scholar] [CrossRef]
- Shi, K.; Shen, J.; Wu, Y.; Liu, S.; Li, L. Carbon dioxide (CO2) emissions from the service industry, traffic, and secondary industry as revealed by the remotely sensed nighttime light data. Int. J. Digit. Earth 2021, 14, 1514–1527. [Google Scholar] [CrossRef]
- Li, L.L.; Liang, P.; Jiang, S.; Chen, Z.Q. Multi-Scale Dynamic Analysis of the Russian–Ukrainian Conflict from the Perspective of Night-Time Lights. Appl. Sci. 2022, 12, 12998. [Google Scholar] [CrossRef]
- Agnew, J.; Gillespie, T.W.; Gonzalez, J.; Min, B. Baghdad nights: Evaluating the US military ‘surge’using nighttime light signatures. Environ. Plan. A 2008, 40, 2285–2295. [Google Scholar] [CrossRef]
- Li, X.; Zhang, R.; Huang, C.; Li, D. Detecting 2014 Northern Iraq Insurgency using night-time light imagery. Int. J. Remote Sens. 2015, 36, 3446–3458. [Google Scholar] [CrossRef]
- Yang, J.; Huang, X. The 30 m annual land cover dataset and its dynamics in China from 1990 to 2019. Earth Syst. Sci. Data 2021, 13, 3907–3925. [Google Scholar] [CrossRef]
- Gao, B.; Huang, Q.; He, C.; Ma, Q. Dynamics of urbanization levels in China from 1992 to 2012: Perspective from DMSP/OLS nighttime light data. Remote Sens. 2015, 7, 1721–1735. [Google Scholar] [CrossRef]
- Xu, Y.; Hao, S.; Cui, Y.; Li, P.; Sheng, L.; Liao, C. Analysis of the spatiotemporal expansion and pattern evolution of urban areas in Anhui Province, China, based on nighttime light data. Ecol. Indic. 2023, 157, 111283. [Google Scholar] [CrossRef]
- Yan, Y.; Lei, H.; Chen, Y.; Zhou, B. Analyzing the Dynamic Spatiotemporal Changes in Urban Extension across Zhejiang Province Using NPP-VIIRS Nighttime Light Data. Remote Sens. 2022, 14, 3212. [Google Scholar] [CrossRef]
- Liu, K.; Xue, Y.; Chen, Z.; Miao, Y. The spatiotemporal evolution and influencing factors of urban green innovation in China. Sci. Total Environ. 2023, 857, 159426. [Google Scholar] [CrossRef] [PubMed]
- Xu, H.Q. A remote sensing urban ecological index and its application. Acta Ecol. Sin. 2013, 33, 7853–7862. [Google Scholar]
- Zenghui, S.; Jichang, H.; Yanan, L.; Liangyan, Y.; Lei, S.; Jiakun, Y. Effects of large-scale land consolidation projects on ecological environment quality: A case study of a land creation project in Yan’an, China. Environ. Int. 2024, 183, 108392. [Google Scholar] [CrossRef] [PubMed]
- Xifeng, J.; Junling, H.; Qi, Z.; Saitiniyazi, A. Evolution pattern and driving mechanism of eco-environmental quality in arid oasis belt—A case study of oasis core area in Kashgar Delta. Ecol. Indic. 2023, 154, 110866. [Google Scholar] [CrossRef]
- Yang, X.; Meng, F.; Fu, P.; Wang, Y.; Liu, Y. Time-frequency optimization of RSEI: A case study of Yangtze River Basin. Ecol. Indic. 2022, 141, 109080. [Google Scholar] [CrossRef]
- Wang, T.; Zhang, G.; Li, P.; Li, F.; Guo, X. Analysis on the driving factors of urban expansion policy based on DMSP/OLS remote Sensing image. Acta Geod. Et Cartogr. Sin. 2018, 47, 1466. [Google Scholar]
- Zhao, M.; Cheng, W.; Zhou, C.; Li, M.; Huang, K.; Wang, N. Assessing spatiotemporal characteristics of urbanization dynamics in Southeast Asia using time series of DMSP/OLS nighttime light data. Remote Sens. 2018, 10, 47. [Google Scholar] [CrossRef]
- Li, Y.; Ye, H.; Gao, X.; Sun, D.; Li, Z.; Zhang, N.; Zheng, J. Spatiotemporal patterns of urbanization in the three most developed urban agglomerations in China based on continuous nighttime light data (2000–2018). Remote Sens. 2021, 13, 2245. [Google Scholar] [CrossRef]
- Xu, T.; Ma, T.; Zhou, C.; Zhou, Y. Characterizing spatio-temporal dynamics of urbanization in China using time series of DMSP/OLS night light data. Remote Sens. 2014, 6, 7708–7731. [Google Scholar] [CrossRef]
- Wen, X.; Ming, Y.; Gao, Y.; Hu, X. Dynamic monitoring and analysis of ecological quality of pingtan comprehensive experimental zone, a new type of sea island city, based on RSEI. Sustainability 2019, 12, 21. [Google Scholar] [CrossRef]
- Gou, R.; Zhao, J. Eco-environmental quality monitoring in Beijing, China, using an RSEI-based approach combined with random forest algorithms. IEEE Access 2020, 8, 196657–196666. [Google Scholar] [CrossRef]
- Zhang, Y.; She, J.; Long, X.; Zhang, M. Spatio-temporal evolution and driving factors of eco-environmental quality based on RSEI in Chang-Zhu-Tan metropolitan circle, central China. Ecol. Indic. 2022, 144, 109436. [Google Scholar] [CrossRef]
- Song, H.M.; Xue, L. Dynamic monitoring and analysis of ecological environment in Weinan City, Northwest China based on RSEI model. Ying Yong Sheng Tai Xue Bao J. Appl. Ecol. 2016, 27, 3913–3919. [Google Scholar]
- Geng, J.; Yu, K.; Xie, Z.; Zhao, G.; Ai, J.; Yang, L.; Yang, H.; Liu, J. Analysis of Spatiotemporal Variation and Drivers of Ecological Quality in Fuzhou Based on RSEI. Remote Sens. 2022, 14, 4900. [Google Scholar] [CrossRef]
- Yue, H.; Liu, Y.; Li, Y.; Lu, Y. Eco-environmental quality assessment in China’s 35 major cities based on remote sensing ecological index. IEEE Access 2019, 7, 51295–51311. [Google Scholar] [CrossRef]
- Firozjaei, M.K.; Kiavarz, M.; Homaee, M.; Arsanjani, J.J.; Alavipanah, S.K. A novel method to quantify urban surface ecological poorness zone: A case study of several European cities. Sci. Total Environ. 2021, 757, 143755. [Google Scholar] [CrossRef] [PubMed]
- Airiken, M.; Zhang, F.; Chan, N.W.; Kung, H.T. Assessment of spatial and temporal ecological environment quality under land use change of urban agglomeration in the North Slope of Tianshan, China. Environ. Sci. Pollut. Res. 2022, 1–18. [Google Scholar] [CrossRef] [PubMed]
- Karbalaei Saleh, S.; Amoushahi, S.; Gholipour, M. Spatiotemporal ecological quality assessment of metropolitan cities: A case study of central Iran. Environ. Monit. Assess. 2021, 193, 305. [Google Scholar] [CrossRef]
- Hu, X.; Xu, H. A new remote sensing index for assessing the spatial heterogeneity in urban ecological quality: A case from Fuzhou City, China. Ecol. Indic. 2018, 89, 11–21. [Google Scholar] [CrossRef]
Disclaimer/Publisher’s Note: The statements, opinions and data contained in all publications are solely those of the individual author(s) and contributor(s) and not of MDPI and/or the editor(s). MDPI and/or the editor(s) disclaim responsibility for any injury to people or property resulting from any ideas, methods, instructions or products referred to in the content. |
© 2024 by the authors. Licensee MDPI, Basel, Switzerland. This article is an open access article distributed under the terms and conditions of the Creative Commons Attribution (CC BY) license (https://creativecommons.org/licenses/by/4.0/).