Technical Note

Monitoring Dynamically Changing Migratory Flocks Using an Algebraic Graph Theory-Based Clustering Algorithm

1
Radar Research Lab, School of Information and Electronics, Beijing Institute of Technology, Beijing 100081, China
2
Beijing Key Laboratory of Real-Time Information Processing Technology of Embedded, Beijing 100081, China
3
The Advanced Technology Research Institute, Beijing Institute of Technology, Jinan 250300, China
*
Author to whom correspondence should be addressed.
Remote Sens. 2024, 16(7), 1215; https://doi.org/10.3390/rs16071215
Submission received: 21 February 2024 / Revised: 26 March 2024 / Accepted: 29 March 2024 / Published: 29 March 2024
(This article belongs to the Topic Radar Signal and Data Processing with Applications)

Abstract

:
Migration flocks have different forms, including single individuals, formations, and irregular clusters. The shape of a flock can change swiftly over time. The real-time clustering of multiple groups with different characteristics is crucial for the monitoring of dynamically changing migratory flocks. Traditional clustering algorithms need to set various prior parameters, including the number of groups, the number of nearest neighbors, or the minimum number of individuals. However, flocks may display complex group behaviors (splitting, combination, etc.), which complicate the choice and adjustment of the parameters. This paper uses a real-time clustering-based method that utilizes concepts from the algebraic graph theory. The connected graph is used to describe the spatial relationship between the targets. The similarity matrix is calculated, and the problem of group clustering is equivalent to the extraction of the partitioned matrices within. This method needs only one prior parameter (the similarity distance) and is adaptive to the group’s splitting and combination. Two modifications are proposed to reduce the computation burden. First, the similarity distance can be broadened to reduce the exponent of the similarity matrix. Second, the omni-directional measurements are divided into multiple sectors to reduce the dimension of the similarity matrix. Finally, the effectiveness of the proposed method is verified using the experimental results using real radar data.

1. Introduction

Avian species typically have organized collective motions. It is of great importance to effectively observe the behaviors of avian flocks. Apart from the information for scientific research, it can also reduce the risk of collisions with man-made structures [1,2,3]. Migratory birds usually travel in groups that vary greatly in size and number. They can fluctuate over time and space, with individuals coming together and separating [4]. The intrinsic mechanisms of migration patterns have been studied in several papers [4,5]. For example, ref. [4] showed that most of the individuals within a separated group can reform again after a long-distance journey. Ref. [6] found that long-distance migration was associated with larger traveling group size. Ref. [7] considered that although the flock size varies seasonally, the social environment experienced by the average individuals is stable across seasons.
Radars are one of the major devices used for observing bird flocks and can be divided into two categories. One is the radar for monitoring large-scale migration, like weather radars [8]; the other one is the radar that measures flocks in a relatively small area, like birdstrike avoidance radars near airports [9,10]. This paper studies the problem of monitoring dynamically changing migratory flocks using the latter type of radar.
Clustering is the first step of group target tracking. It is also a major distinction between group target tracking and traditional single/multiple target tracking [11]. The purpose of clustering is to divide the measurement sets into different subsets according to some specific criteria. Each subset corresponds to a group (or single) target.
Typical clustering algorithms can be categorized as follows: (1) partitioning-based approaches, like the k-means method [12]; (2) density-based approaches, like the DBSCAN method [13,14,15]; (3) hierarchical approaches, like the BIRCH algorithm and CURE algorithm [16,17]; and (4) graph-based approaches, like the similarity matrix approach [18,19].
However, the current clustering algorithms have several shortcomings that impede their applications in practical scenarios. First, they often require strong prior information. For example, the k-means approach needs to designate the number of groups, and the DBSCAN algorithms need to set the minimum number of individuals within a group. Second, some of the methods impose requirements on the group’s characteristics. For example, the similarity matrix approach demands that the distance between the farthest individuals should be smaller than the threshold. Third, current approaches may not be adaptive to the real-time evolution of groups (splitting, combination, etc.).
In order to solve the problems mentioned above, this paper summarizes and modifies a clustering algorithm based on the algebraic graph theory [20,21]. First, this method only needs to designate one prior parameter, the similarity distance threshold. Any two measurements whose distance is less than the threshold will be connected by a walk. Therefore, multiple connected graphs are built, after which the problem of clustering is equivalent to the extraction of different connected graphs. Second, the similarity matrix is calculated, and each group target is matched with one non-zero partitioned matrix within.
The method in this paper only needs to set one prior parameter of the distance threshold, and it can achieve the real-time clustering of groups, even adaptive to the group splitting or combination phenomenon. It can achieve clustering in a random dimensional space. Furthermore, two modifications are proposed to meet the requirements in practical applications. To reduce the computational burden, we first broaden the similarity threshold to reduce the exponent of the similarity matrix. Second, the omni-directional measurements are divided into multiple sectors to reduce the dimension of the similarity matrix.
The rest of this article is organized as follows. Section 2 describes the theoretical basis and a practical procedure. Section 3 proposes two practical modifications. Section 4 verifies the effectiveness of the proposed method based on the experimental data using a high-resolution phased array radar.

2. Clustering Algorithm Based on the Algebraic Graph Theory

The method in this paper is based on the conclusions of the algebraic graph theory. We assume that there are n k measurements in the k-th frame. Each measurement is denoted as one vertex, and the set of vertices is denoted as { v 1 , , v n k } . If two vertices v i and v j are “similar” according to some specific criterion, they will then be linked by one edge. After the processing above, a graph, Γ , will be built. If all the measurements belong to one group, any two vertices can be connected by a certain number of walks. This kind of graph is called a connected graph. Ref. [20] shows that the adjacency matrix of Γ is defined as:
σ i j = { 0 , i = j 1 , i j ,   v i   and   v j   are   similar 0 , i j ,   v i   and   v j   are   not   similar
In our paper, for the sake of simplicity, we re-defined a similarity matrix A ( Γ ) of graph Γ as the following:
σ i j = { 1 , i = j 1 , i j ,   v i   and   v j   are   similar 0 , i j ,   v i   and   v j   are   not   similar
All the entries within the similarity matrix, A ( Γ ) , are binary variables, and A ( Γ ) is obviously a symmetric matrix. In this paper, “similar” means that the distance between two vertices is smaller than a threshold.
For the traditional similarity matrix method, all the non-zero entries will be accumulated to the diagonal partitioned matrices after elementary transformations. An underlying requirement is that all the individuals within a group are similar. This method can achieve good performance on some kinds of group targets, such as aircraft flying in formation. The number of individuals in this type of group target is not very large, and the extension of formation is not very huge compared to the individual spacing.
However, for migratory birds, the number of individuals can be very large. Sometimes, a flock can contain 100 to 200 birds. On the other hand, migration flocks can adopt huge formations (line formation, V formation, etc.). The extension of the formation is much larger than the individual spacing. Therefore, the distance for the threshold must be very large. This may lead to errors for adjacent groups. An example is provided in Figure 1. There are two flocks in the observation area. The distance between a1 and a2 in the V formation is l1, and the distance between a1 and b1 is l2. If we want to guarantee the similarity of a1 and a2, then b1 will also be assigned to the V formation.
In fact, the behavior of a bird in a flock is related to its surrounding neighbors [22,23]. If we decrease the threshold, a connected graph can also be built with essential walks. An example is provided in Figure 2. The individuals on the left side of the figure are similar pairwise. On the right side, the connected graph has the minimum walks.
For a connected graph, a major issue is to judge its property using a simple criterion. The necessary and sufficient condition for a graph, Γ , with m vertices to be connected is that A m 1 has no zero entries [20]. This property can be derived from the algebra of polynomials of its adjacency matrix. For more details, see chapter two in ref. [20]. From this conclusion, it is easy to derive that, for an integer n m , A n 1 does not contain zero entries either. In practical applications, there may be multiple connected graphs. Assume that there are n k measurements belonging to l k groups. If we can find k type I elementary matrices M 1 , , M k , let the following be true:
A = M 1 M k A M k T M 1 T = [ A 1 o o o A 2 o o o A l k ]
where A 1 , , A l k are l k partitioned matrices corresponding to the l k groups in the observation area. Compute the n k 1 times of A , the partitioned matrices on the diagonal still do not contain zero entries. Check the relations between the partitioned matrices and the measurements, then the clustering algorithm is finished. As the elementary matrices M 1 , , M k are usually unknown, now we will prove that this process is equivalent to computing A n k 1 first and then accumulating the non-zero entries on the diagonal:
U 1 U k A n k 1 U k T U 1 T = [ A 1 n k 1 o o o A 2 n k 1 o o o A l k n k 1 ]
where U 1 , , U k are type I elementary matrices.
In fact, for type I elementary matrices U 1 , U 2 , , U k , we have: U 1 U 1 T = U 2 U 2 T = U k U k T = I , then we can obtain:
U 1 U k A n k 1 U k T U 1 T = U 1 U k A n k 2 U k T U 1 T U 1 U k A U k T U 1 T = = ( U 1 U k A U k T U 1 T ) n k 1 = [ A 1 o o o A 2 o o o A l k ] n k 1 = [ A 1 n k 1 o o o A 2 n k 1 o o o A l k n k 1 ]
The algorithm is finished by checking which matrix each point belongs to. The detailed steps are listed below.
(I) A set of measurements (denoted by Z k = { z 1 , , z n k } , with n k elements) is provided in the k-th frame. Compute the similarity between each pair of measurements within Z k . The calculation method can be defined according to the actual needs;
(II) Construct the similarity matrix A of n k measurements;
(III) Compute A n k 1 , which is denoted as:
A n k 1 = [ ρ 11 ρ 12 ρ 1 n k ρ 21 ρ 22 ρ 2 n k ρ n k 1 ρ n k 2 ρ n k n k ]
Then, construct the clustering matrix B :
B = [ 0 1 n k 1 A n k 1 n k ]
The dimension of matrix B is n k + 1 . The entry in row one and column one is a meaningless value and does not participate in the following process. The numbers in the first row (and the first column) correspond to the indices of n k measurements in Z k = { z 1 , , z n k } ;
(IV) Execute the elementary row and column operations on matrix B . Accumulate all the non-zero entries in the partitioned matrices on the diagonal. After the processing, we obtain l k partitioned matrices B 1 , , B l k .
The details are provided below:
① From ρ 12 in the second row and third column of B , if ρ 12 0 , then keep B unchanged; if ρ 12 = 0 , find the first non-zero entry (denoted as ρ 1 j ) on the right side of ρ 12 in the second row. Then, swap the third column and the j+1-th column and swap the third row and the j+1-th row;
② After the processing in ①, from ρ 13 in the second row and fourth column, repeat the value-checking and row-column swapping steps in ① until the last entry in the second row;
③ After step ① and ②, check the entries in the second row of B . If the entries from ρ 12 (in the second row and third column) to ρ 1 , i (in the second row and i + 1 column) are all non-zero, then the measurements corresponding to these i consecutive columns belong to the same group. Then, from the entry in the i + 1 row and i + 2 column, repeat the value-checking and row-column swapping steps described above until all the non-zero entries form l k partitioned matrices B 1 , , B l k on the diagonal:
[ 0 n 1 n 2 n l k n 1 T B 1 o o n 2 T o B 2 o n l k T o o B l k ] ;
(V) Extract the numbers in the vectors n 1 , , n l k , then obtain the number of the measurements within each group.
To illustrate the row-column swapping algorithm more clearly, step IV is summarized as pseudo-code in Algorithm 1.
Algorithm 1 The pseudo-code of step IV.
Inputs: the clustering matrix, B
for i = 2: n k
for j = 1: n k
  m = find( B ( i , 2 : end ) == 0); % Find all the indices of the columns that may need to be swapped.
  if ~isempty(m)
   L = length(m);
   if m(1) == n k − L + 1
   break % This row does not need to swap with other rows.
  else
   n = m (1); % Find the first zero entry.
   while  B ( i , k ) == 0
    k = k + 1; % Find the first non-zero entry to be swapped.
   end
   temp1 = B ( : , n + 1 ) ;
    B ( : , n + 1 ) = B ( : , k ) ;
    B ( : , k ) = temp1;
   temp2 = B ( n + 1 , : ) ;
    B ( n + 1 , : ) = B ( k , : ) ;
    B ( k , : ) = temp2;
  end
end
end
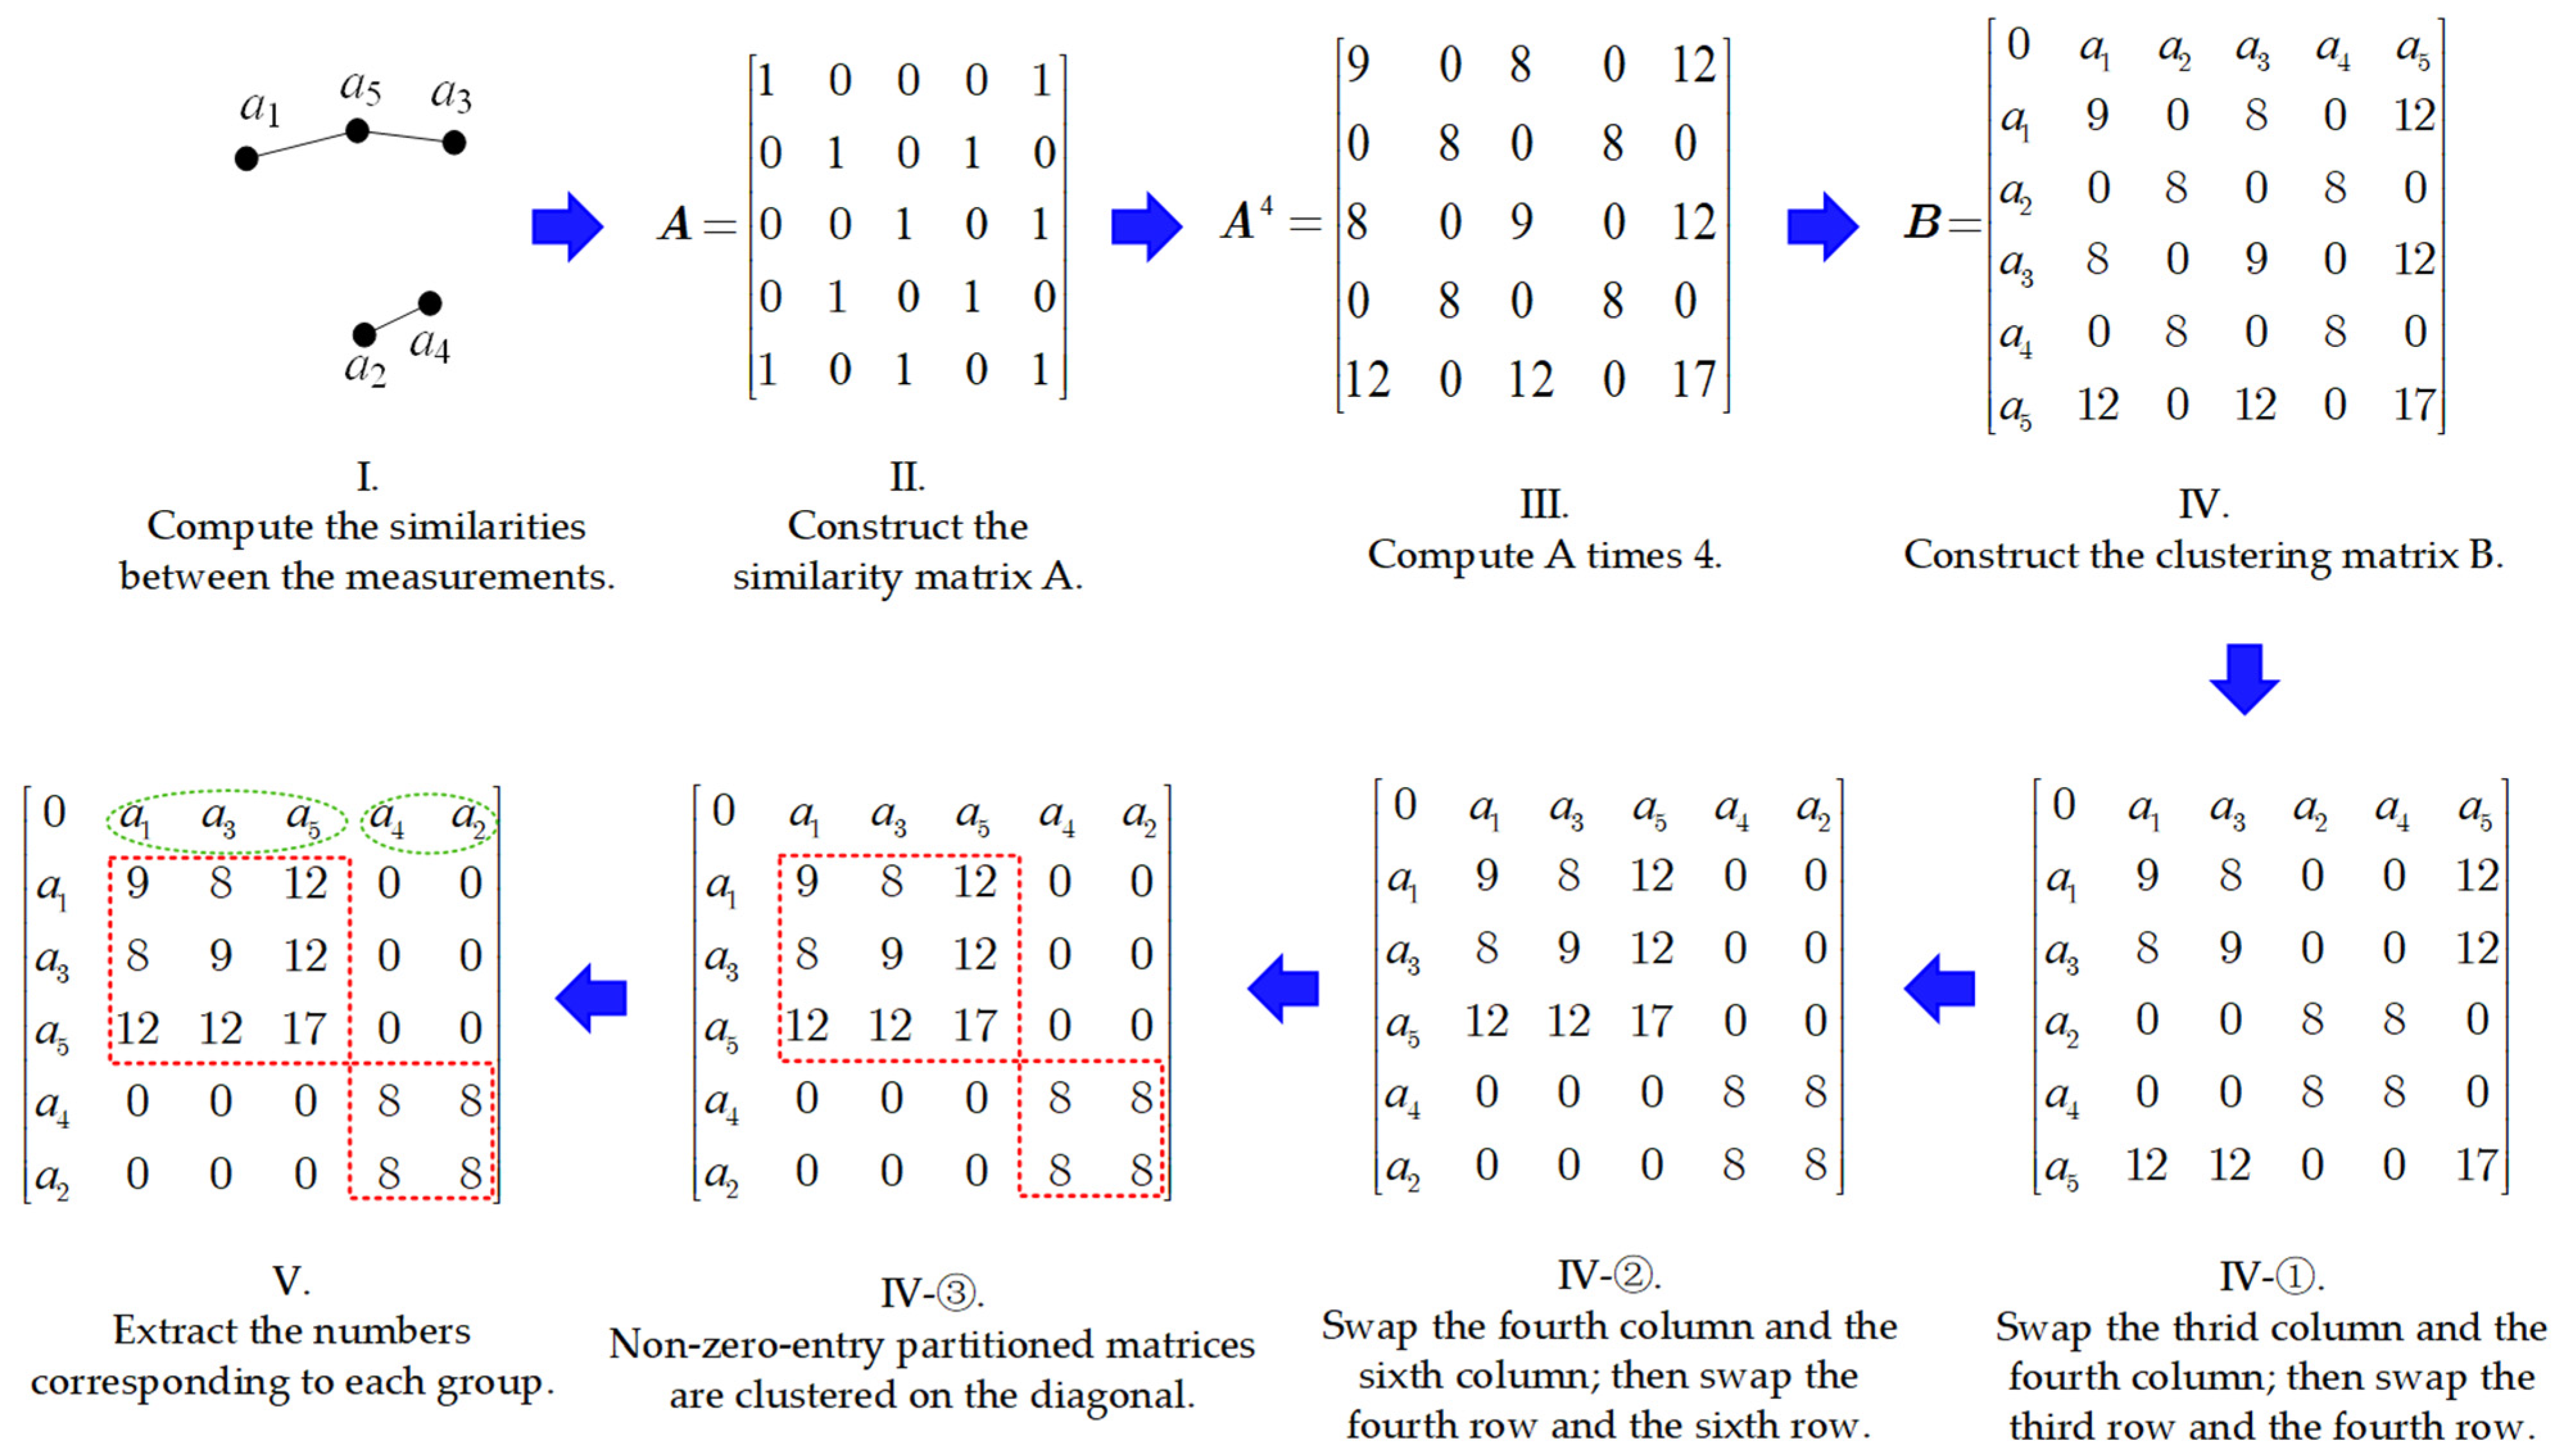
To make further clarify how the algorithm works, we also present a visualized example to illustrate the procedure of the algorithm in Figure 3. In this example, there are five targets forming two groups. After the process, the two different groups can be separated successfully.

3. The Modifications for Practical Applications Using an Omni-Directional Scanning Radar

The method proposed in this paper can achieve the classification and clustering of different single/group targets. However, it still needs to be modified to meet the requirements of practical applications. The major issue of the procedures in Section 2 is the computational burden. In migration seasons, the number of measurements at each frame may exceed dozens of hundreds. The dimension of the similarity matrix may be very high, and the result of A n k 1 involves considerable computational cost. This may lead to the failure of the radar’s processor. This paper proposes two modifications for practical applications. The first strategy is to enlarge the threshold of the similarity distance. The second is the partition of omni-directional measurements to reduce the dimension of the similarity matrix. The details are provided below.

3.1. Reduction of the Similarity Matrix’s Exponent

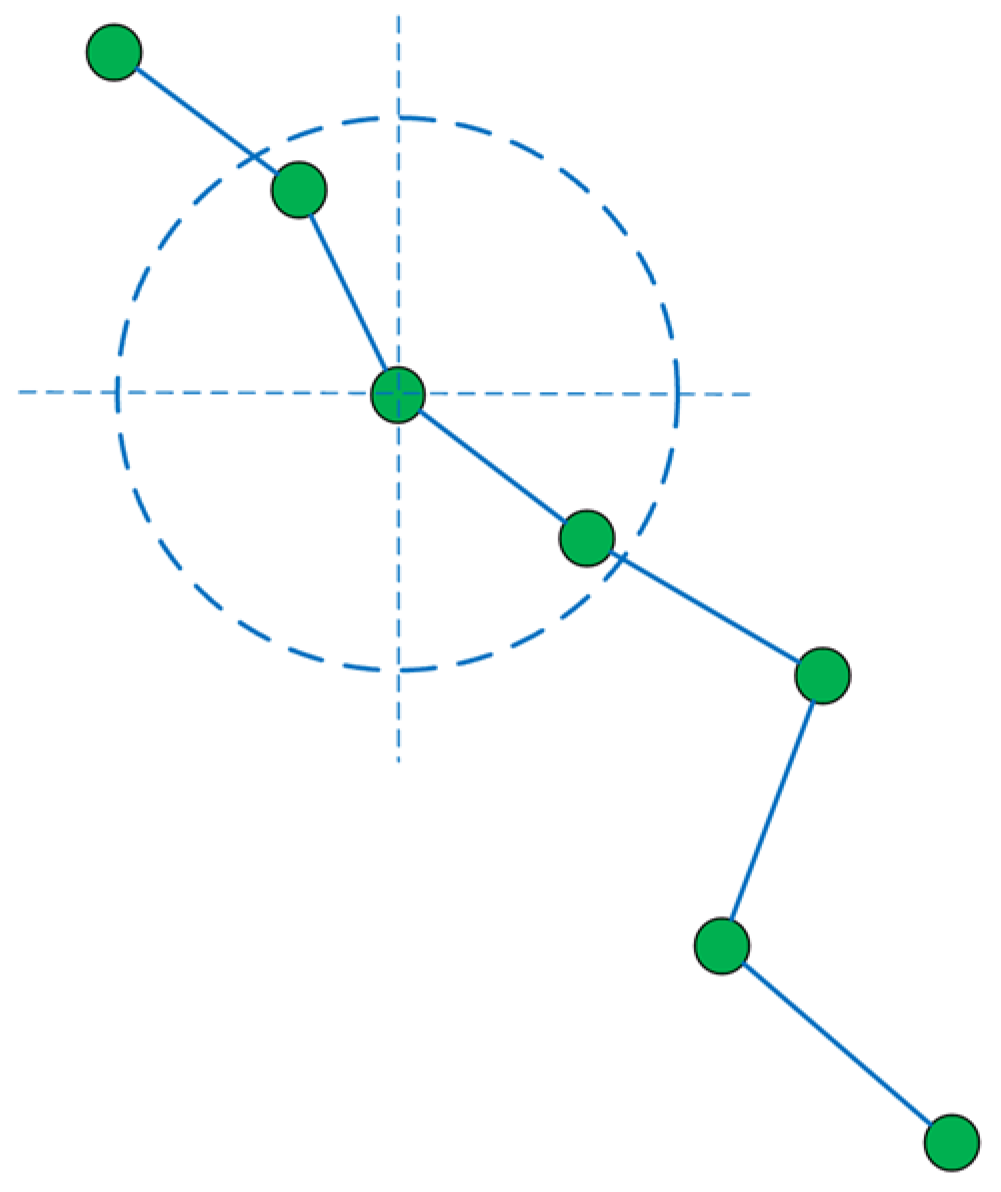
According to the conclusions of the algebraic graph theory, if n k measurements belong to one group, then the n k 1 times of the corresponding similarity matrix do not have zero entries. This can guarantee the optimum performance of clustering. Each connected graph is constructed with the fewest walks, and false clustering results can be avoided as much as possible. In the following example, seven individuals constitute one group. If we choose the optimum similarity threshold, then the similarity matrix is the following:
A = [ 1 1 0 0 0 0 0 1 1 1 0 0 0 0 0 1 1 1 0 0 0 0 0 1 1 1 0 0 0 0 0 1 1 1 0 0 0 0 0 1 1 1 0 0 0 0 0 1 1 ]
and the connected graph is shown in Figure 4:
Then, the n k 1 times of the similarity matrix has no zero entries:
A 6 = [ 51 76 69 44 20 6 1 76 120 120 89 50 21 6 69 120 140 126 90 50 20 44 89 126 141 126 89 44 20 50 90 126 140 120 69 6 21 50 89 120 120 76 1 6 20 44 69 76 51 ] .
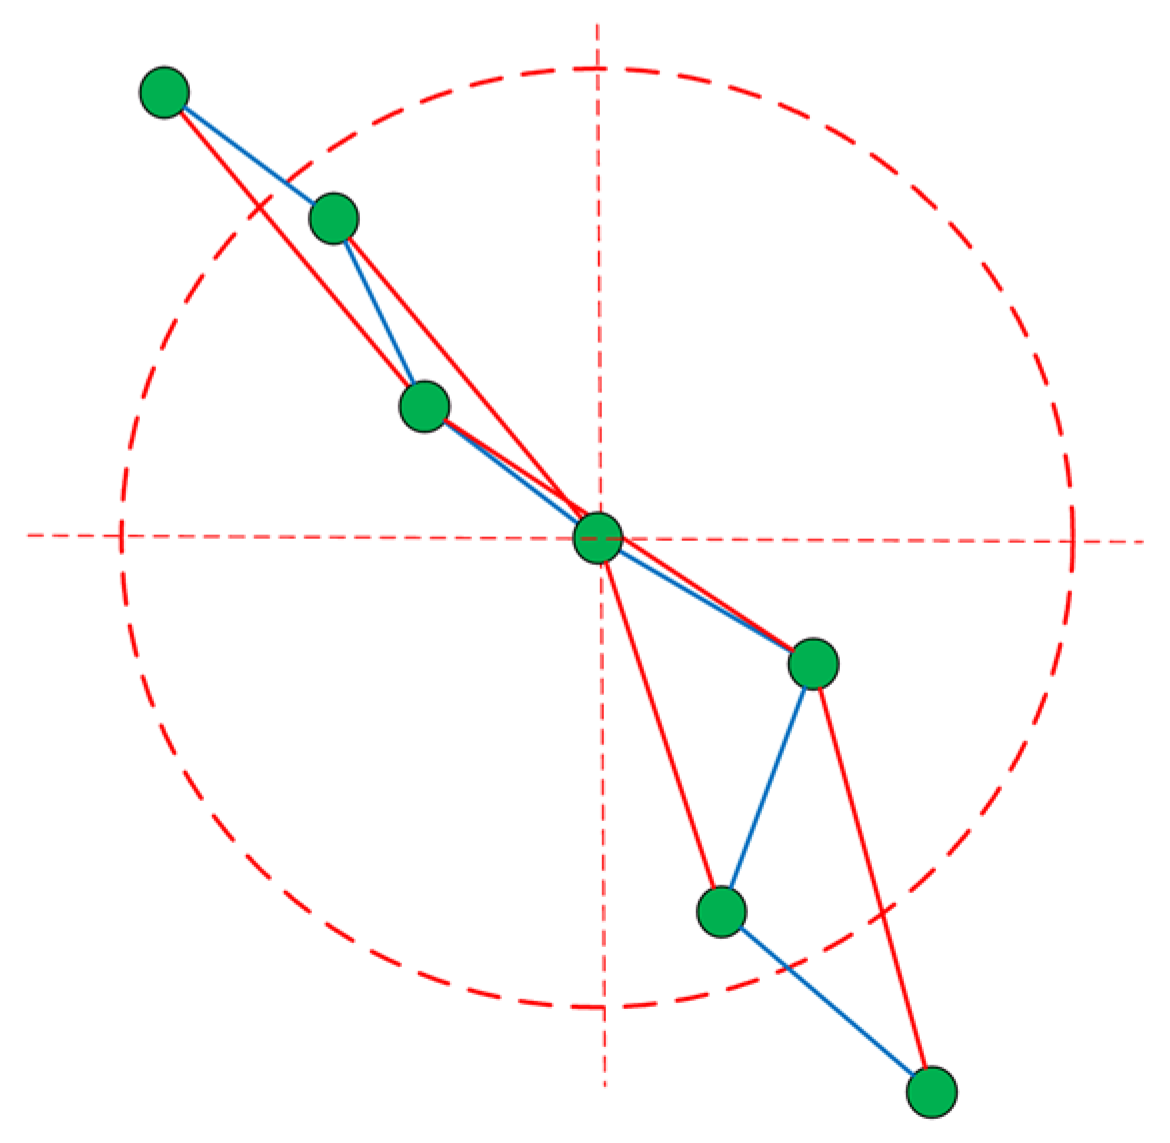
However, when the number of measurements is too large, the computational burden for A n k 1 will be cumbersome and the radar’s processor may fail to compute the result. Therefore, essential modifications are needed. According to the analysis above, the computation of the similarity matrix and the extraction of the partitioned matrices are equivalent to the detection of the connected graphs. If a complete connected graph can be constructed, then the similarity matrix does not contain zero entries. If we enlarge the similarity threshold, a connected graph will have more walks. Although this may lead to faults in extreme cases, this will significantly decrease the exponent of the similarity matrix. The parameter of enlargement is N 0 , and the exponent of similarity is the following:
N = n k / N 0 1
where is the ceiling function. For instance, in the example mentioned above, if we double the similarity threshold, we will obtain a connected graph with more walks (see Figure 5). Each individual can reach up to four other targets with just one walk.
The similarity matrix is:
A = [ 1 1 1 0 0 0 0 1 1 1 1 0 0 0 1 1 1 1 1 0 0 0 1 1 1 1 1 0 0 0 1 1 1 1 1 0 0 0 1 1 1 1 0 0 0 0 1 1 1 ]
According to the modification proposed in this subsection, the modified exponent of the similarity matrix is N = 3 . Therefore, the result of the matrix is the following:
A 3 = [ 9 11 12 9 6 3 1 11 14 16 14 10 6 3 12 16 19 18 15 10 6 9 14 18 19 18 14 9 6 10 15 18 19 16 12 3 6 10 14 16 14 11 1 3 6 9 12 11 9 ]
This matrix does not contain zero entries, with just half of the computational burden.

3.2. The Fusion of Multiple Sectors

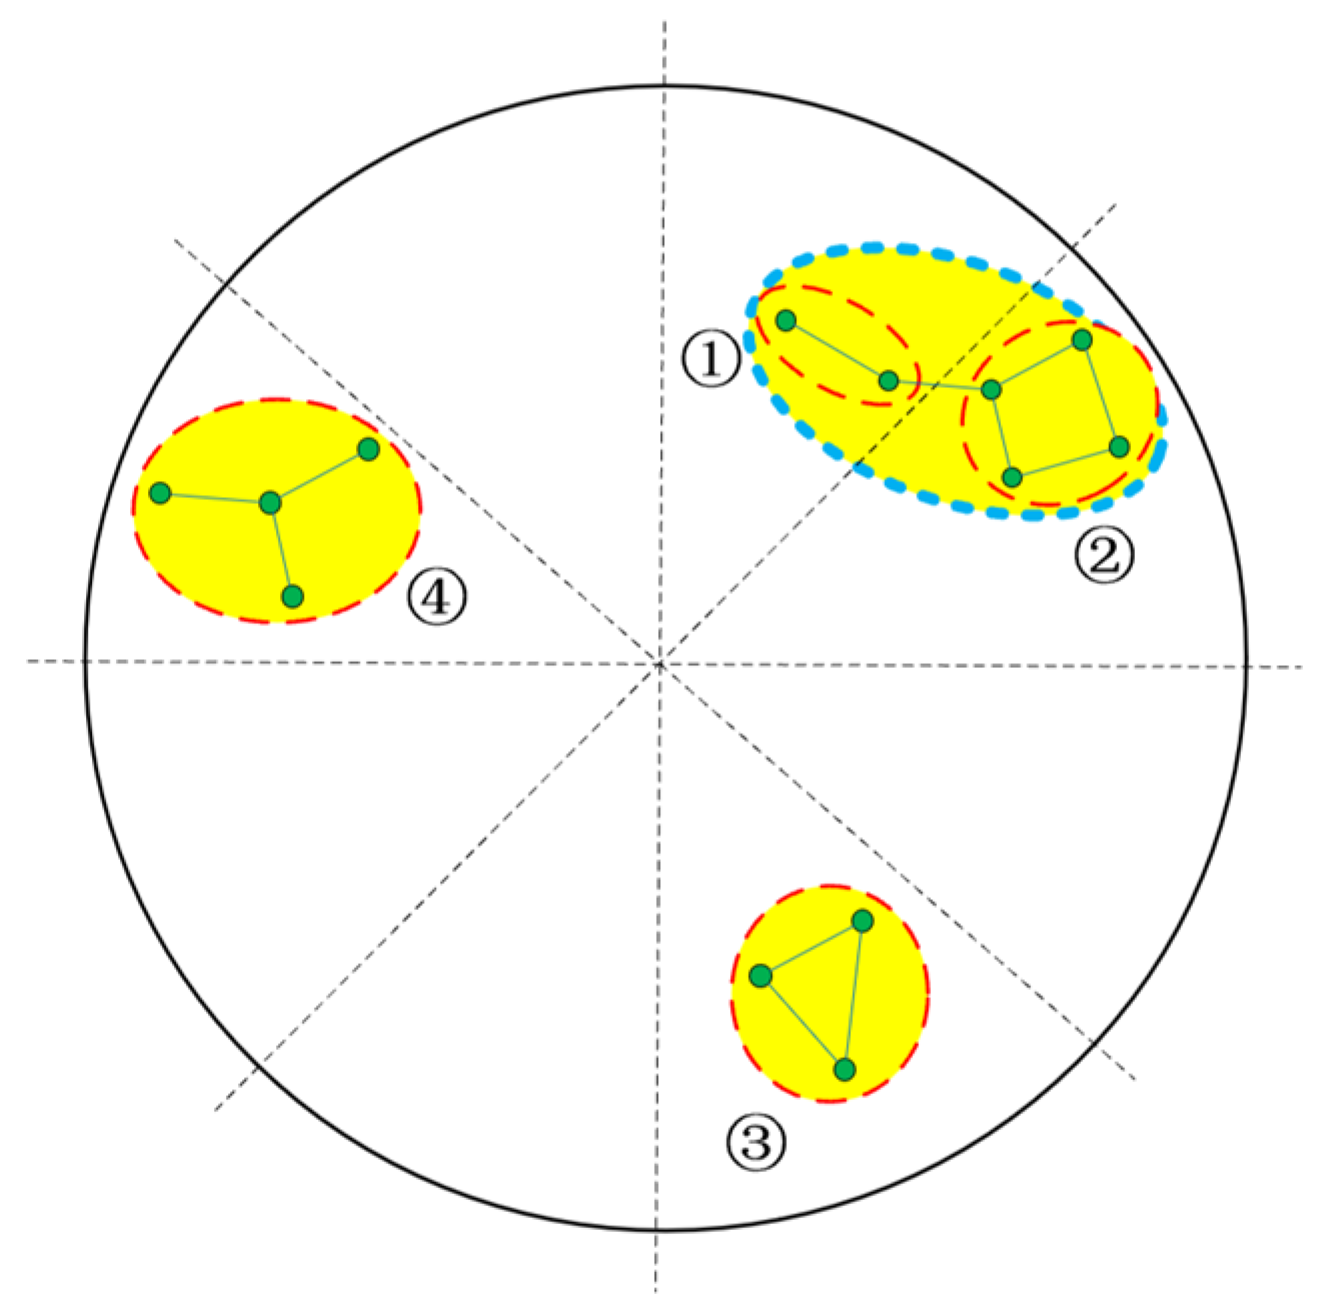
By enlarging the similarity threshold, the exponent of the similarity matrix can be reduced significantly. However, this cannot decrease the dimension of the similarity matrix. For omni-directional scanning radars, the number of measurements may reach dozens of hundreds at each frame. The dimension of the similarity matrix may be too large for the radar’s processor. To reduce the dimension, this paper resorts to a solution that divides the scanning area into different equal-angle sectors. For example, if the number of sectors is six, then the angle of each sector is 60°. The measurements in each sector will be clustered first, then the groups near the edge of each sector will be merged. The procedure is as follows:
  • The scanning area is divided into M sectors; the angle of each sector is 360°/M. Calculate the azimuth of each measurement and sort them into the corresponding sectors;
  • Group the measurements in each sector using the method proposed in Section 2. Then, obtain the L subgroups, as shown in Figure 6;
  • Check the grouping results in each sector and flag the groups near the edges. The detailed steps are as follows:
    (i)
    For a specific group in the L-th sector, compute the azimuth angle of one measurement, which is denoted as θ i . The azimuth of the left edge of the L-th sector is denoted as θ L and the right edge is denoted as θ R . Set the threshold θ t h r e s . If θ i θ L < θ t h r e s , then flag the measurement’s group as being near the left edge and if θ R θ i < θ t h r e s , then flag the group as being near the right edge. Otherwise, this group will not be involved in the rest of the process;
    (ii)
    Flag all the groups in all the sectors according to the steps in (i);
    (iii)
    Starting from the 1st sector, the groups near the right edge in the current sector are fused with the group near the left edge in the next sector in a clockwise sequence until the fusion of all the groups is completed. The fusion method is described in Section 2. The fusion results between sectors are shown in Figure 7.

4. Simulation and Experimental Results

In this section, we present the experimental results using the real data set. First, we describe the radar system used to collect the real data. Then, we present and discuss the results of the proposed method.

4.1. Phased Array Radar System and Setup

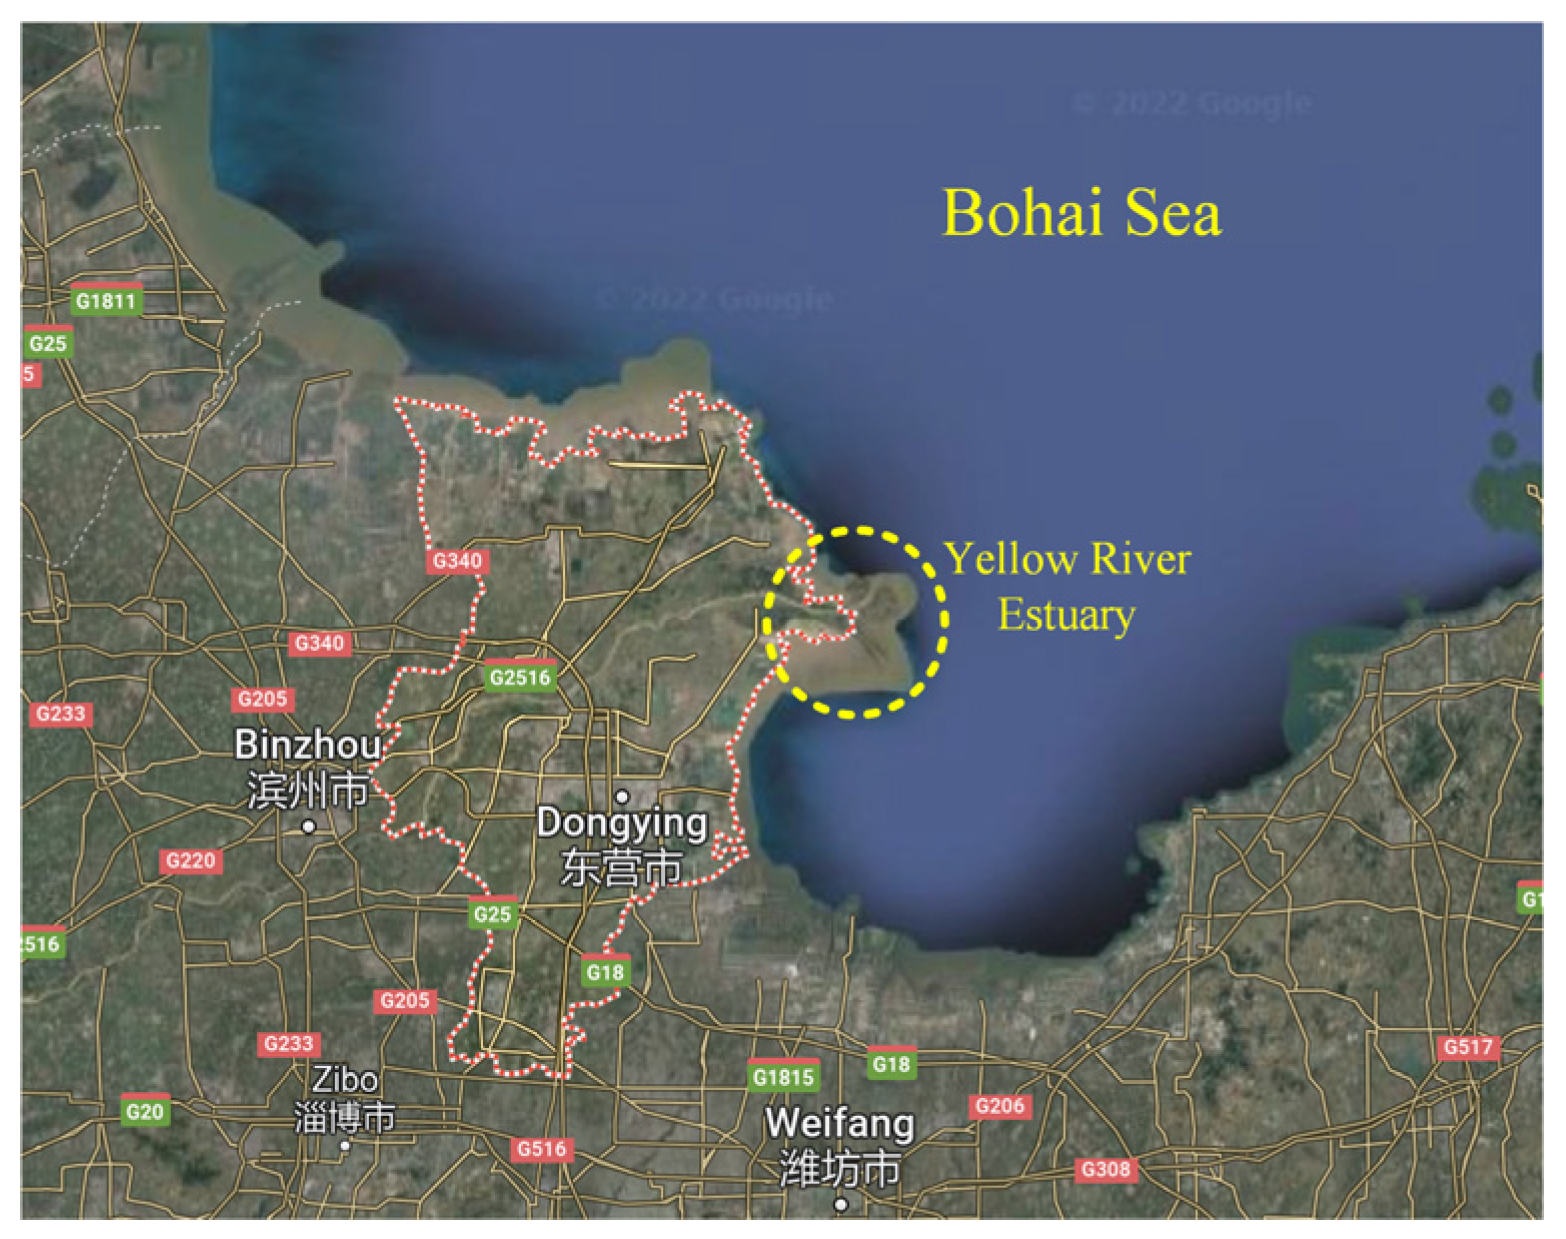
The migratory flock observation system was installed in Dongying in the Shandong province of China, near the Yellow River estuary. The location is near to one of the major migratory routes in east China. A huge number of migratory birds fly across the Bohai Sea and head south in autumn, as shown in Figure 8. A lot of avian species can be observed during the migration season, including geese, cranes, and raptors.
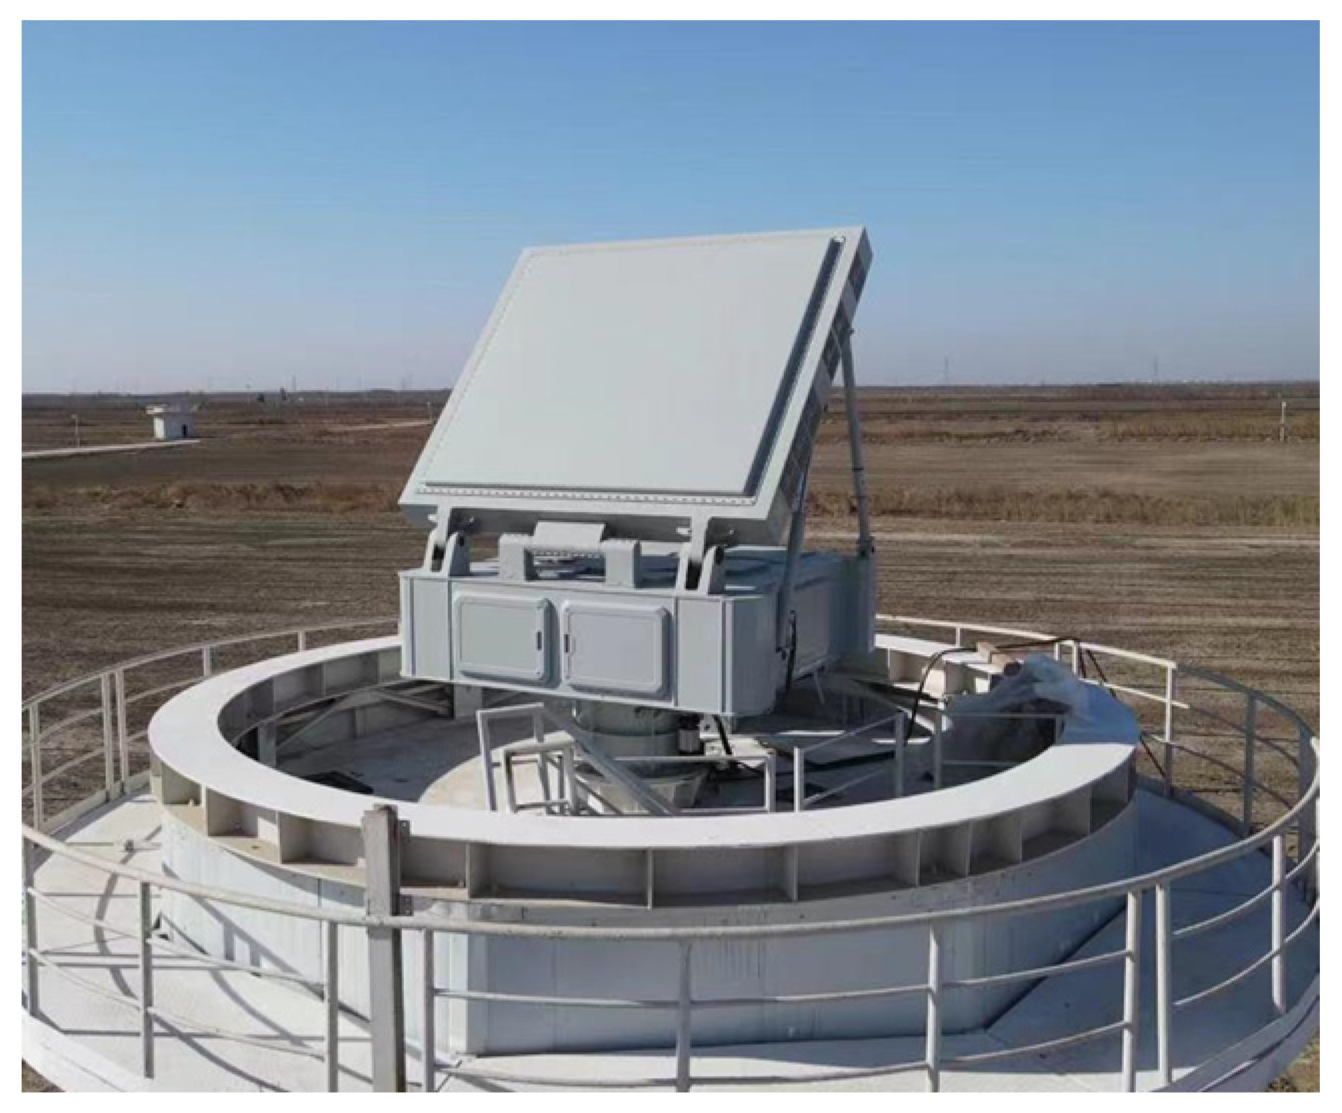
The main device of the observation system was a Ku-band phased array radar working in the track-while-scan (TWS) mode. The range resolution of the radar was high enough to resolve the individuals on the range profile. The large bandwidth was obtained by synthesizing ten stepped chirp pulses. The bandwidth of each chirp pulse was 125 MHz and the synthesized bandwidth was 1 GHz. The aperture of the antenna was 2.4 m and the synthesized beamwidth was 0.6° in elevation and 0.5° in azimuth. Consequently, this radar had the capability to resolve the individuals within a bird flock. When working in the TWS mode, the scanning area was 4.5° (eight beam positions) in elevation and 360° in azimuth. The sampling range was 300–2500 m and the rotating period of each frame was 3.2 s. The illustration of the phased array radar on the platform is shown in Figure 9.
After the synthesizing of the 10 stepped chirp pulses, a high-resolution range profile could be obtained. The radar obtained two range profiles at one beam and static clutter was suppressed using a two-pulse canceller. The targets were detected and measured directly on the range profile after two-pulse cancellation. To ensure good detection performance for the dense targets, the NVI-CFAR algorithm was implemented into the radar signal processor [24,25]. Multiple migratory flock observation experiments verified the effectiveness of the algorithm. To record the scenario of the experiment, a photoelectric pod was installed on the top of the control room (see Figure 10). This pod first received the detection results from the phased array radar, then adjusted its direction and focus on the bird flock. The photoelectric pod also had a night vision camera, which was crucial for the observation experiments at night. For more details about the radar system, see ref. [26].
The procedure of the experiment is described as follows. When a bird flock fell into the observation space of the phased array radar, the detection results would be displayed on the plan position indicator (PPI) installed in the control room. A radar operator would judge from the indicator whether the data were worth recording. For typical migratory flocks, the operator would record the radar data and issue the detection results to the photoelectric pod. Then, the photoelectric pod would automatically focus on the flock and capture a series of photos. The performance of the proposed algorithm was testified using the collected data.
In this section, we present two experimental results. The radar data were collected during September 2022.

4.2. Experimental Results: Migration Bird Flock at Dawn, 23 September 2022

In this subsection, we present and analyze the results of flock clustering using real data. In September 2022, the research team carried out several avian flock observation experiments. On 23 September, a large number of cranes, geese, and storks were observed using the phased array radar. The raw data were collected and then processed using the method proposed in this paper. To increase the visualization of the results, the measurements were processed using the single and group-tracking algorithms after the clustering process. For a single target, the state at each frame was estimated using the traditional Kalman filter. For a group target, the centroid and extension were estimated using the random matrix approach, and the extension was approximated via an ellipsoid [27,28].

4.2.1. Huge Stork Flock

A migratory flock was observed using the radar at 18:14 p.m. (see Figure 11). It consisted of 80–90 storks, and the minimum distance between the individuals was less than 2.5 m. At first, this flock roughly arranged into an “L” formation. Then, the formation changed slowly, and there was group splitting and combinations during the observation.
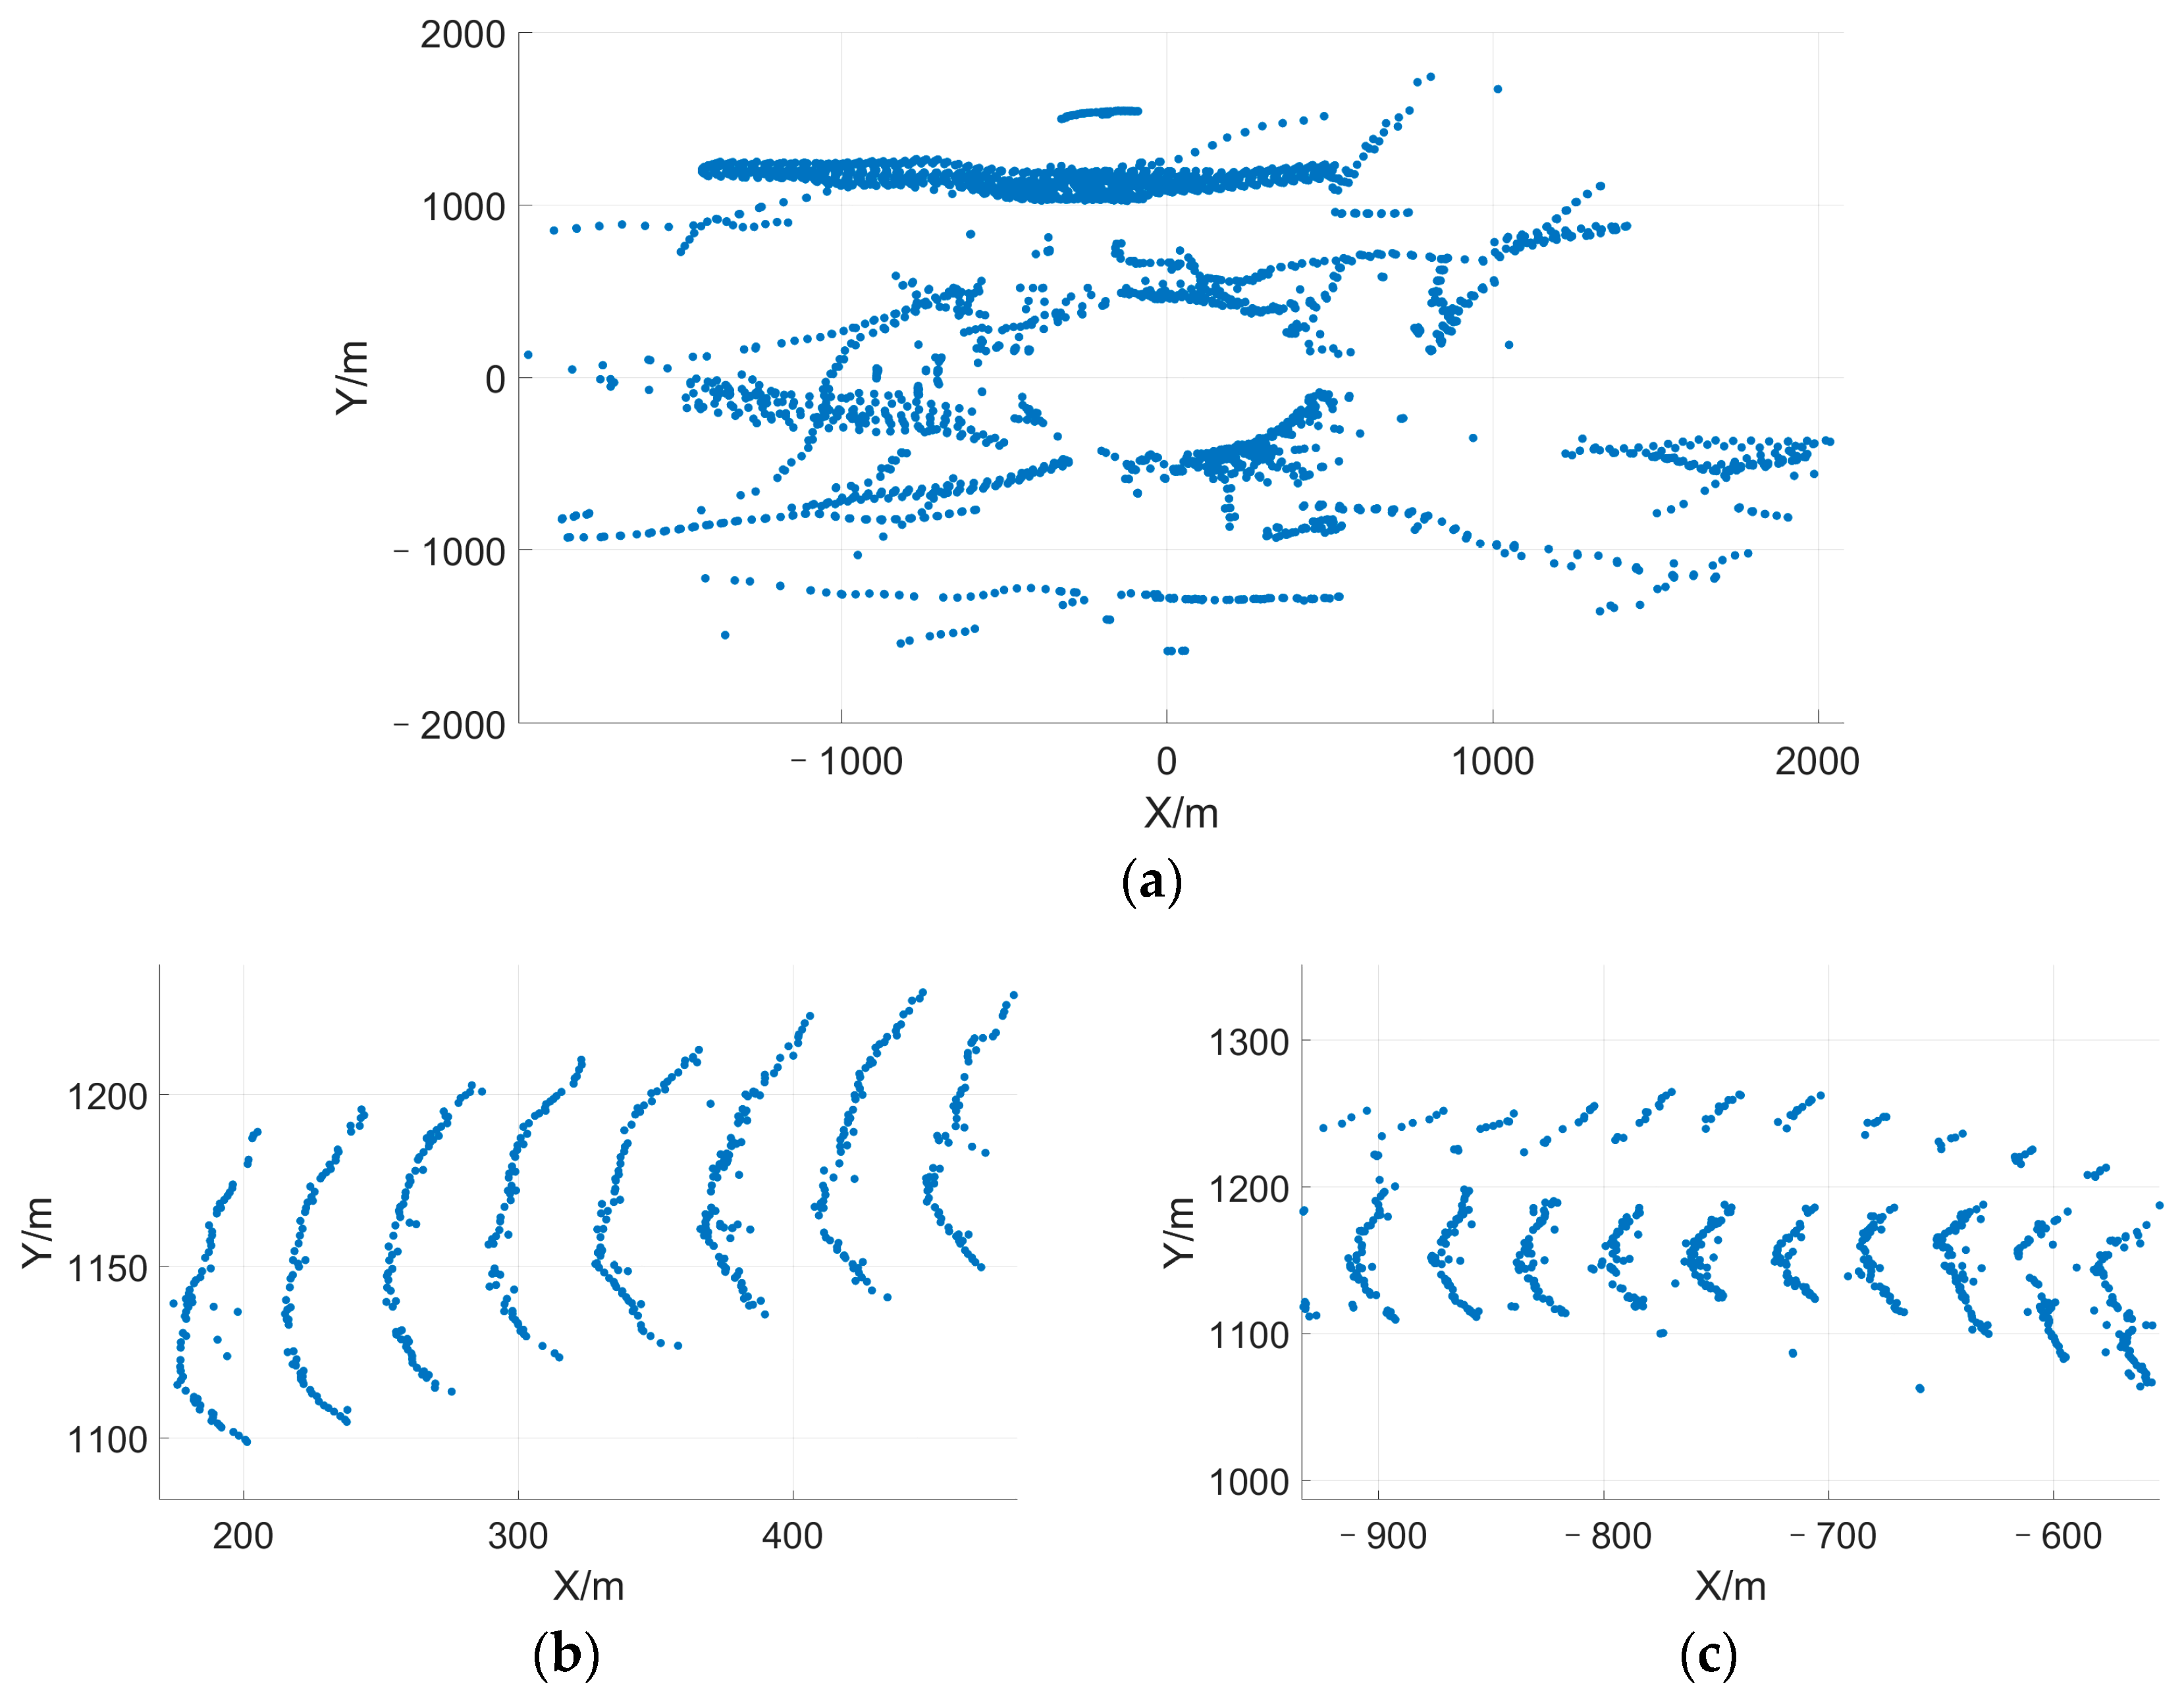
The detection results are shown in Figure 12. All the measurements (approximately 3 min) were processed in three-dimensional space and are plotted in Figure 12a. The phased array radar was located at the origin. The direction of the X-axis was defined as northing and the Y-axis was defined as easting. Apart from the stork flock, there were also many other small flocks and single birds observed using the radar. Therefore, the clustering method should discriminate different single/group targets correctly.
The results are shown in Figure 13. For a dense flock, the distance between the neighbors could reach 2–3 m. This was dense enough for most of the radar devices. Some of the individuals may be missing, even when the processor implemented dense target-detection algorithms (NVI-CFAR, etc.). Therefore, the threshold should be enlarged to a certain extent. For example, in our experiments, we set the threshold to 8–10 m. For a dense flock, the individuals within may be missed. On the other hand, to reduce the computational burden, the threshold distance should not be too small. In this experiment, the threshold was set to 40 m. The clustering and tracking result of the 10th frame is shown in Figure 13a. In addition to the large flock, there were multiple small groups and single targets at the same time. There was also a small flock of two individuals to the east of the large flock, and the method proposed in this paper was able to correctly separate the two differently sized flocks. Figure 13b illustrates the tracking results for the 17th frame.
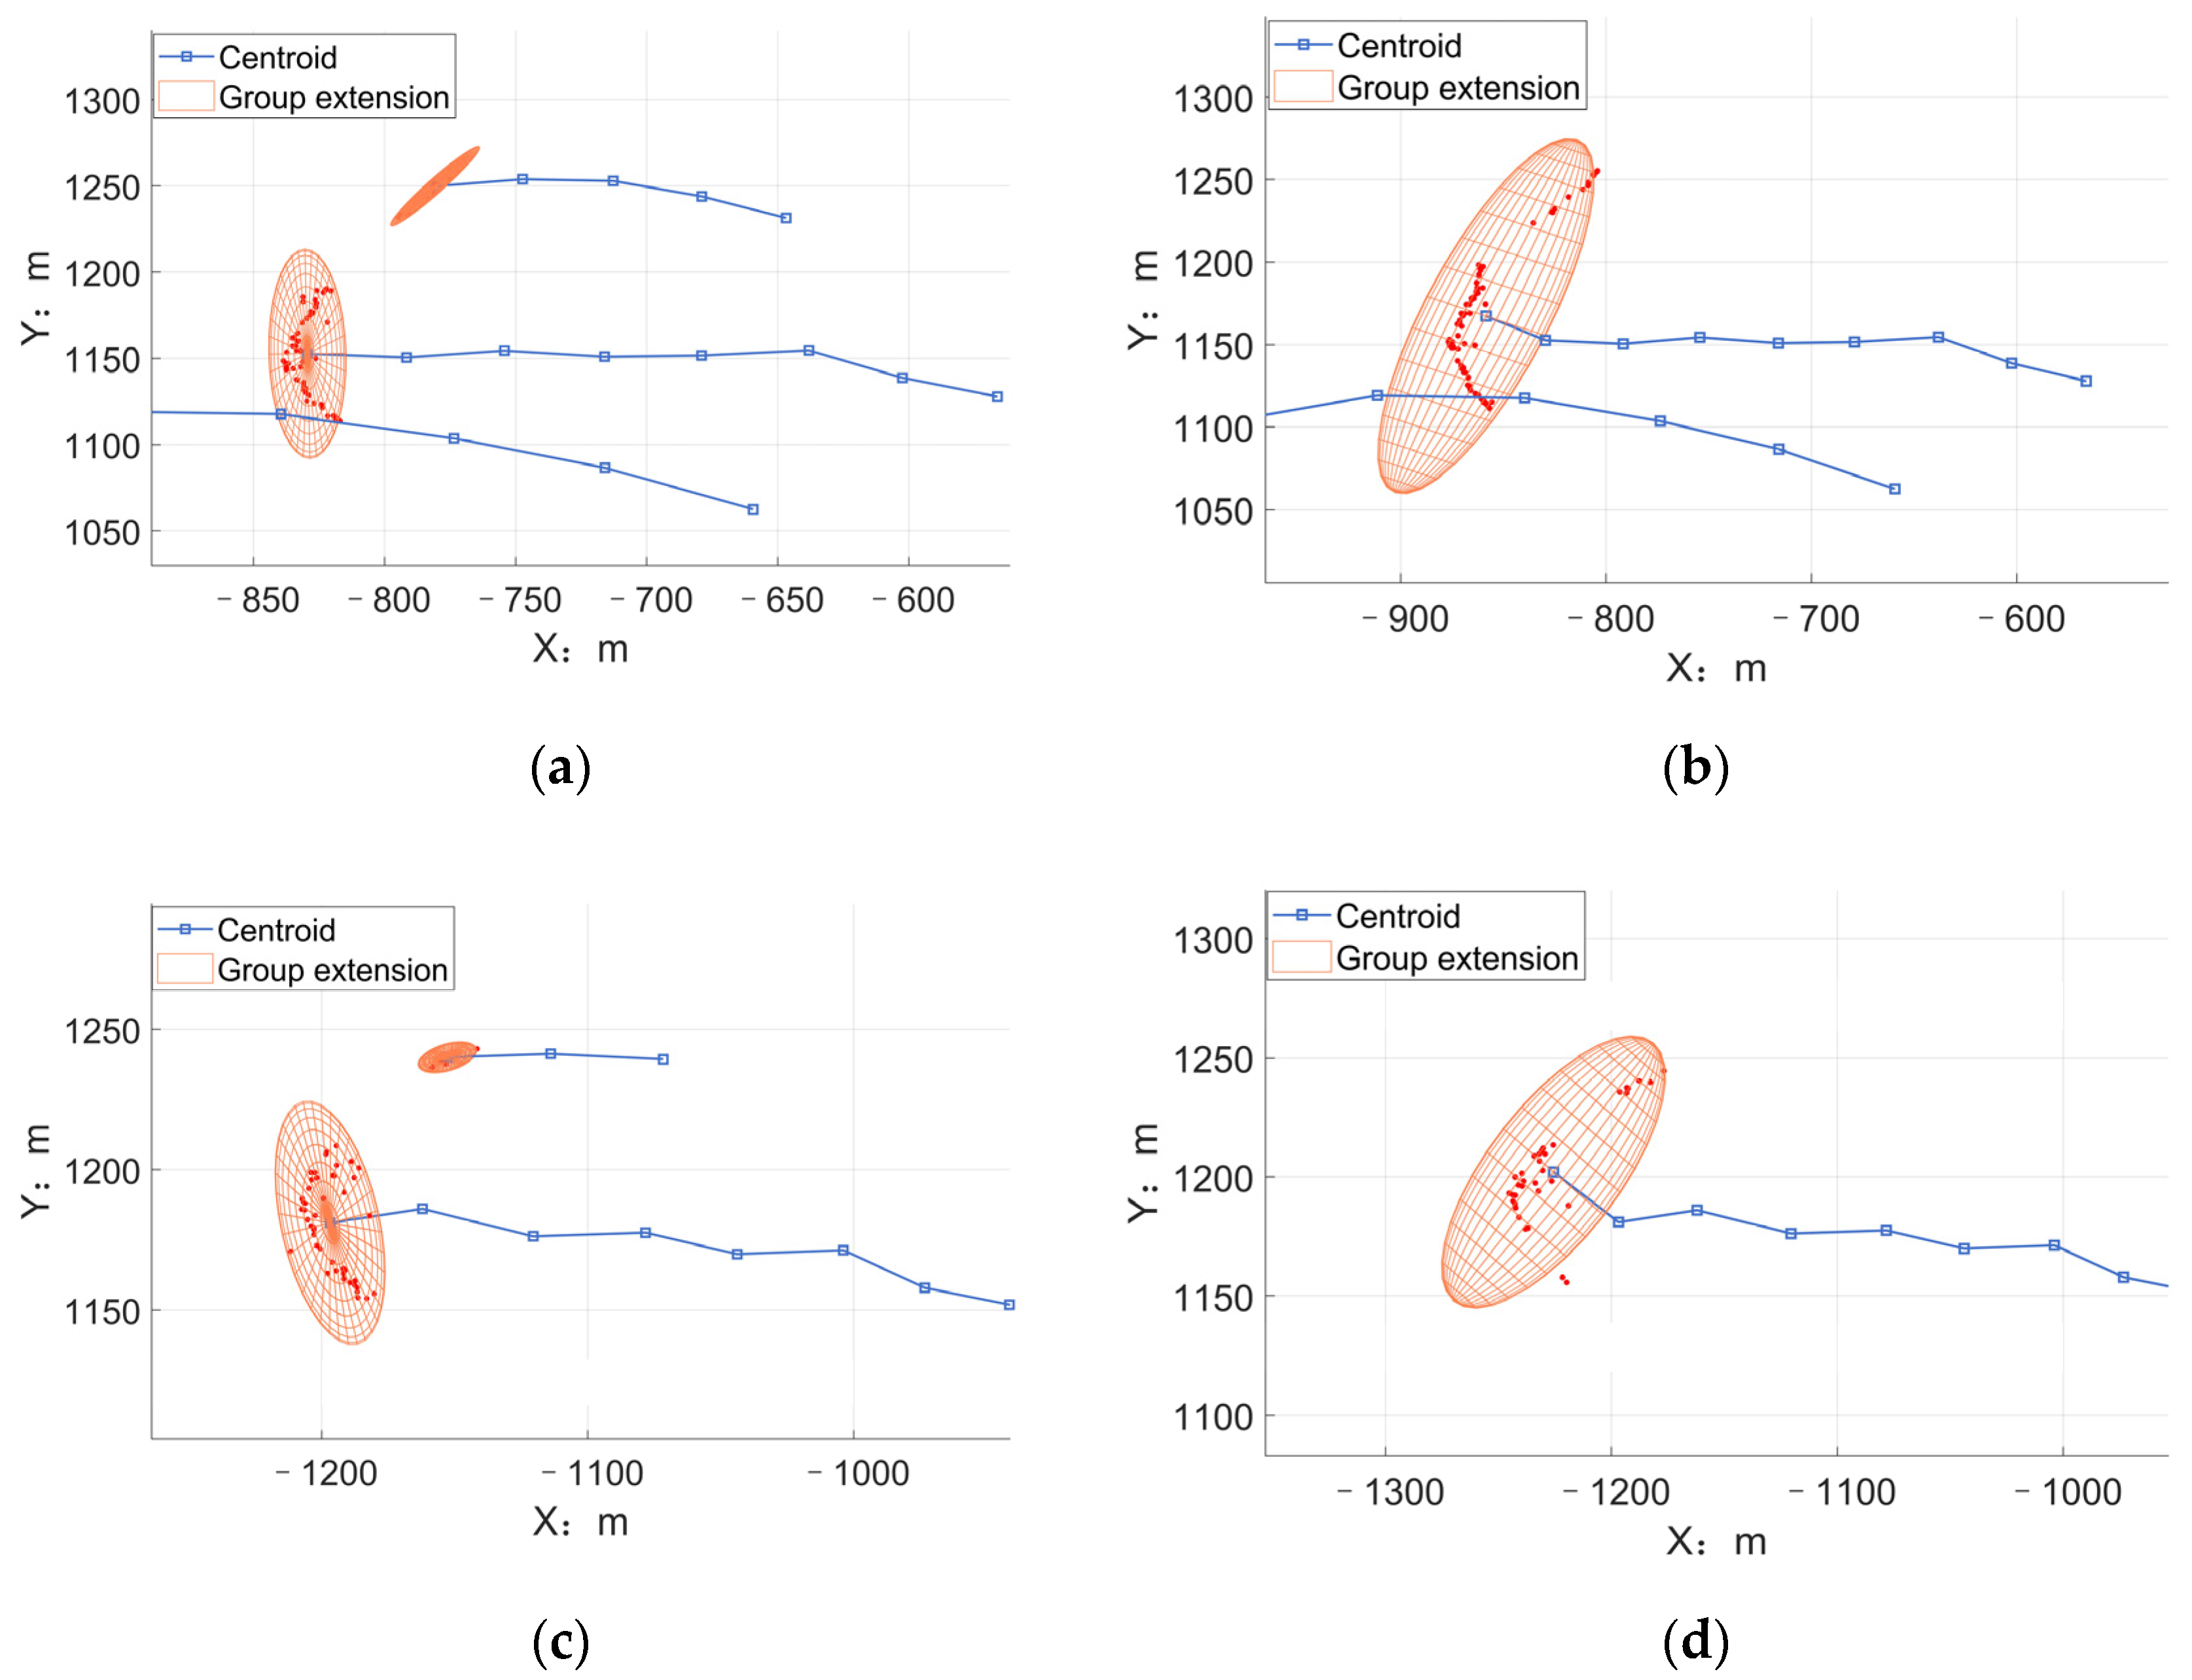
From the 30th frame, the large flock underwent a series of splitting and combination processes. The method proposed in this paper successfully adapted to the changes. The results are shown in Figure 14. From the 32nd frame, the group split into two subgroups, then the smaller group approached the bigger subgroup briefly, but finally the subgroups merged into one.
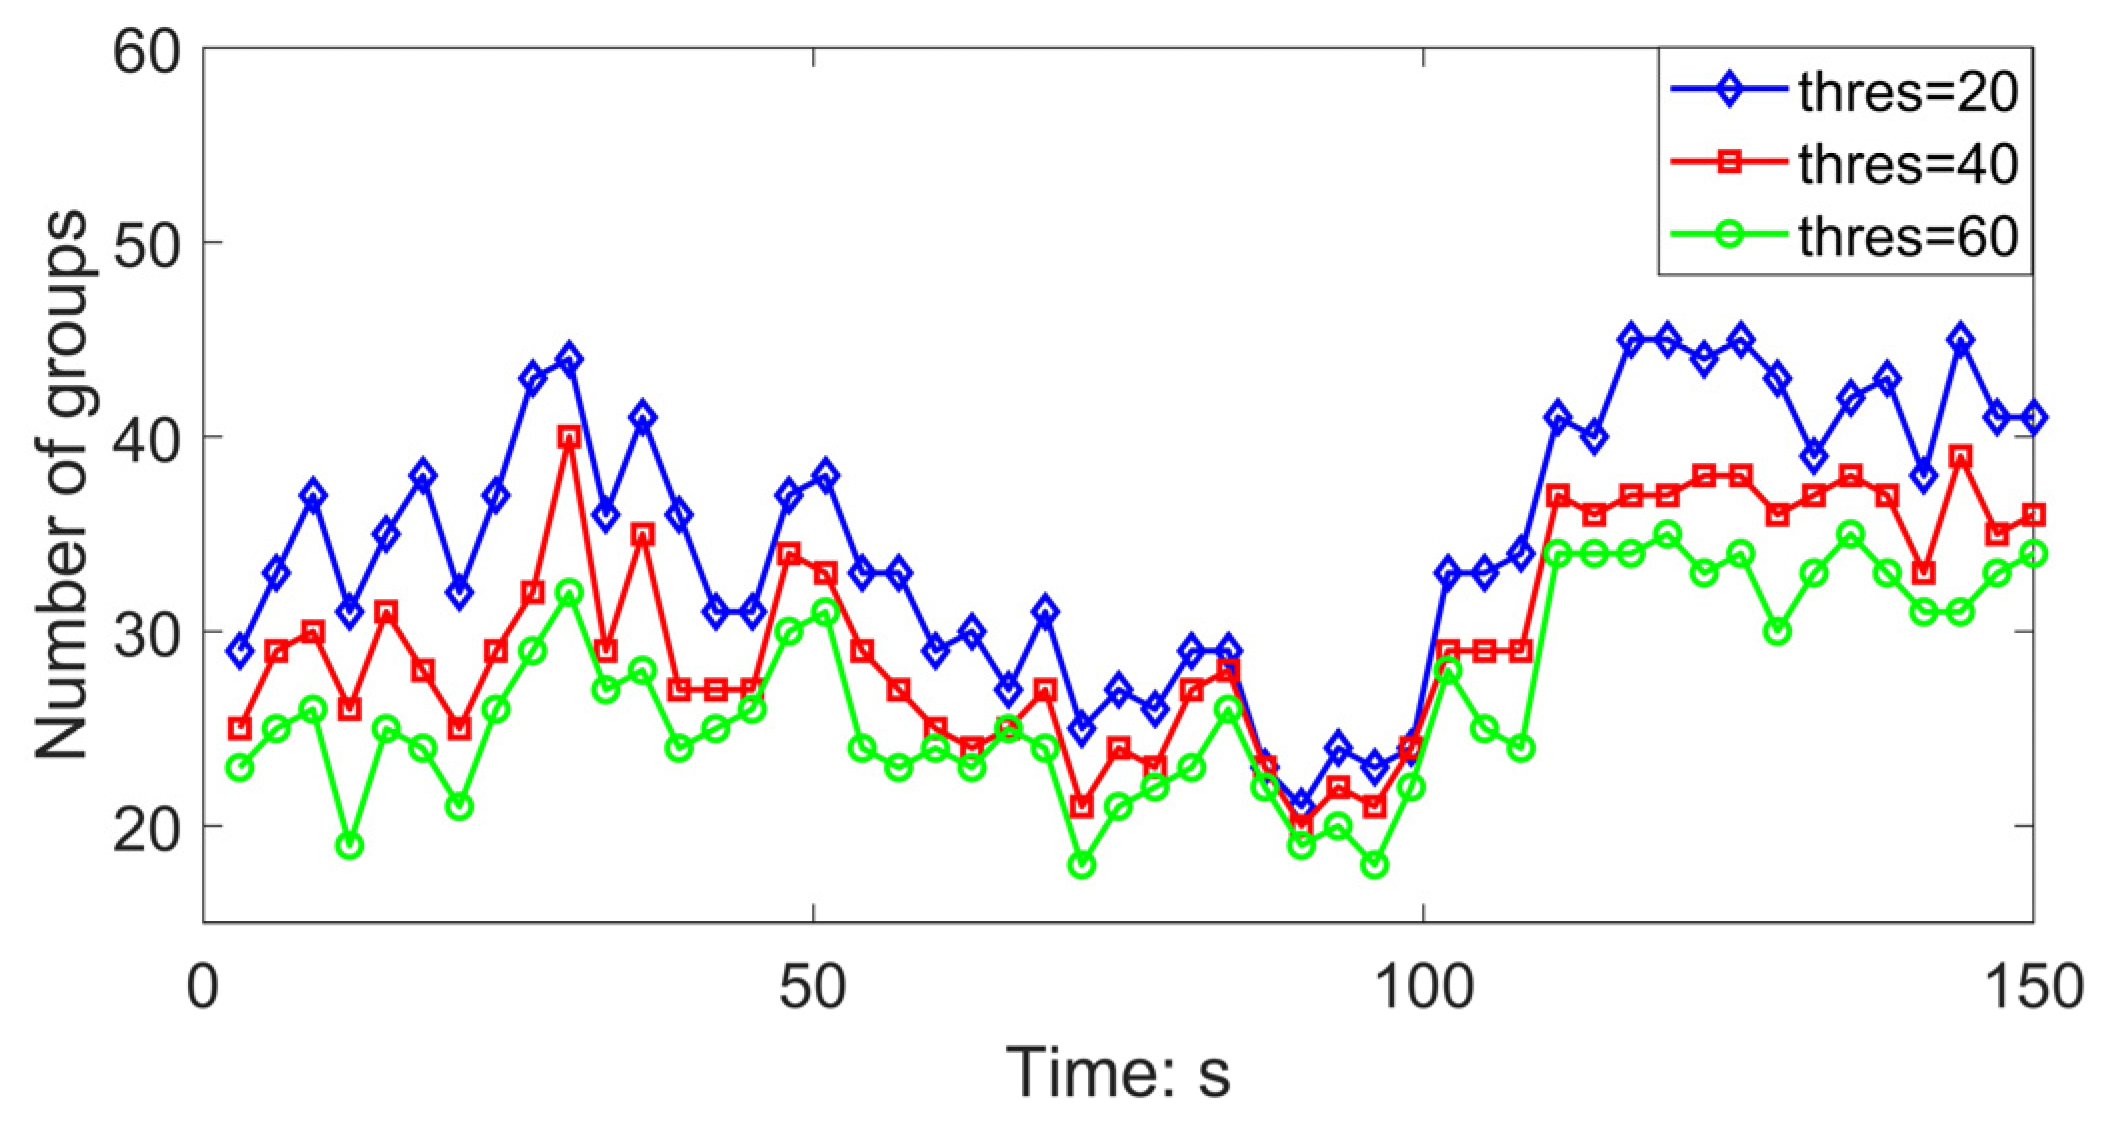
To illustrate the performance of the value of the similarity threshold, we compared the results of the clustering during tracking using three different thresholds (20 m, 40 m, and 60 m). Figure 15 shows the number of group tracks during tracking. It indicates that, although the overall trends of different curves were similar, there would be more groups when using a smaller threshold. Figure 16 exhibits one case. In the 21st frame, the stork flock is divided into three subgroups with a 20 m threshold. However, for the 40 m threshold, the group would not be divided. For multi-group tracking, too many subgroups may lead to frequent track initialization/termination and miscorrelation, causing the degradation of performance. In this experiment, we considered that a 40 m threshold was suitable.
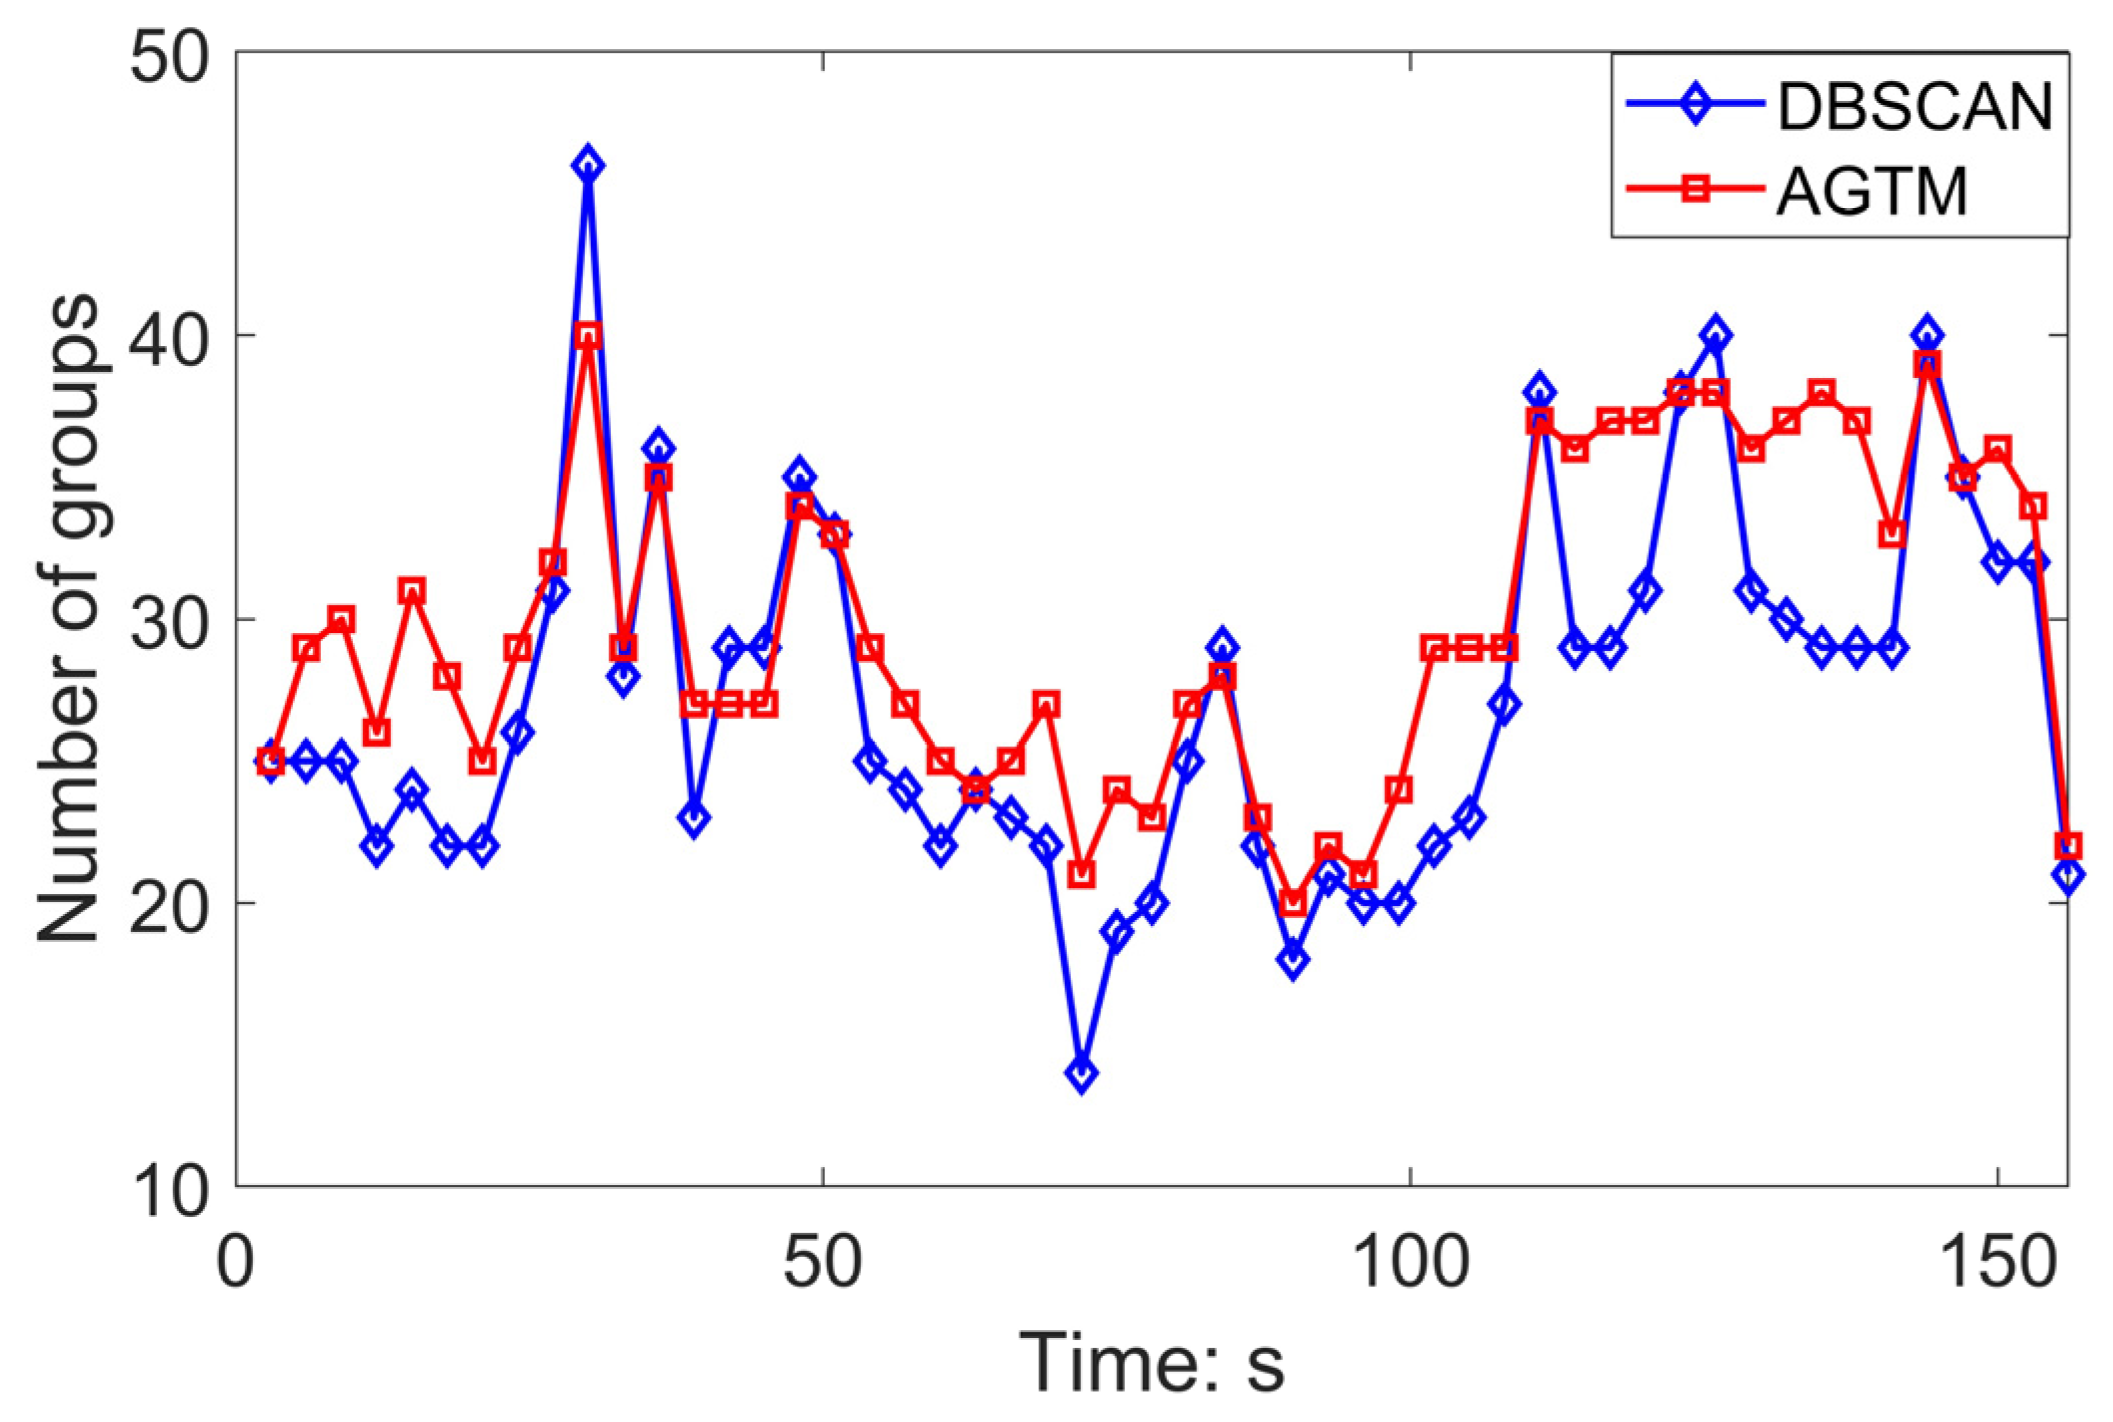
In Figure 17, we compared the performance of our algebraic graph theory method (AGTM) with the traditional DBSCAN method. The epsilon of the DBSCAN method is 20 m and the minimum sample parameter is 3. It was shown that the method of this paper has a more stable performance, in the sense that the variation of the number of clusters through time was smaller in AGTM compared to DBSCAN. This is beneficial to the tracking filter’s performance.

4.2.2. Medium Flock

At 18:29 p.m., another medium flock (probably some kind of wading bird) consisting of approximately 35 birds were observed using the radar. This flock was also a dense group and arranged into a rough “V” formation. The distance between most of the neighbors was less than 2 m. The photos of the flock are shown in Figure 18.
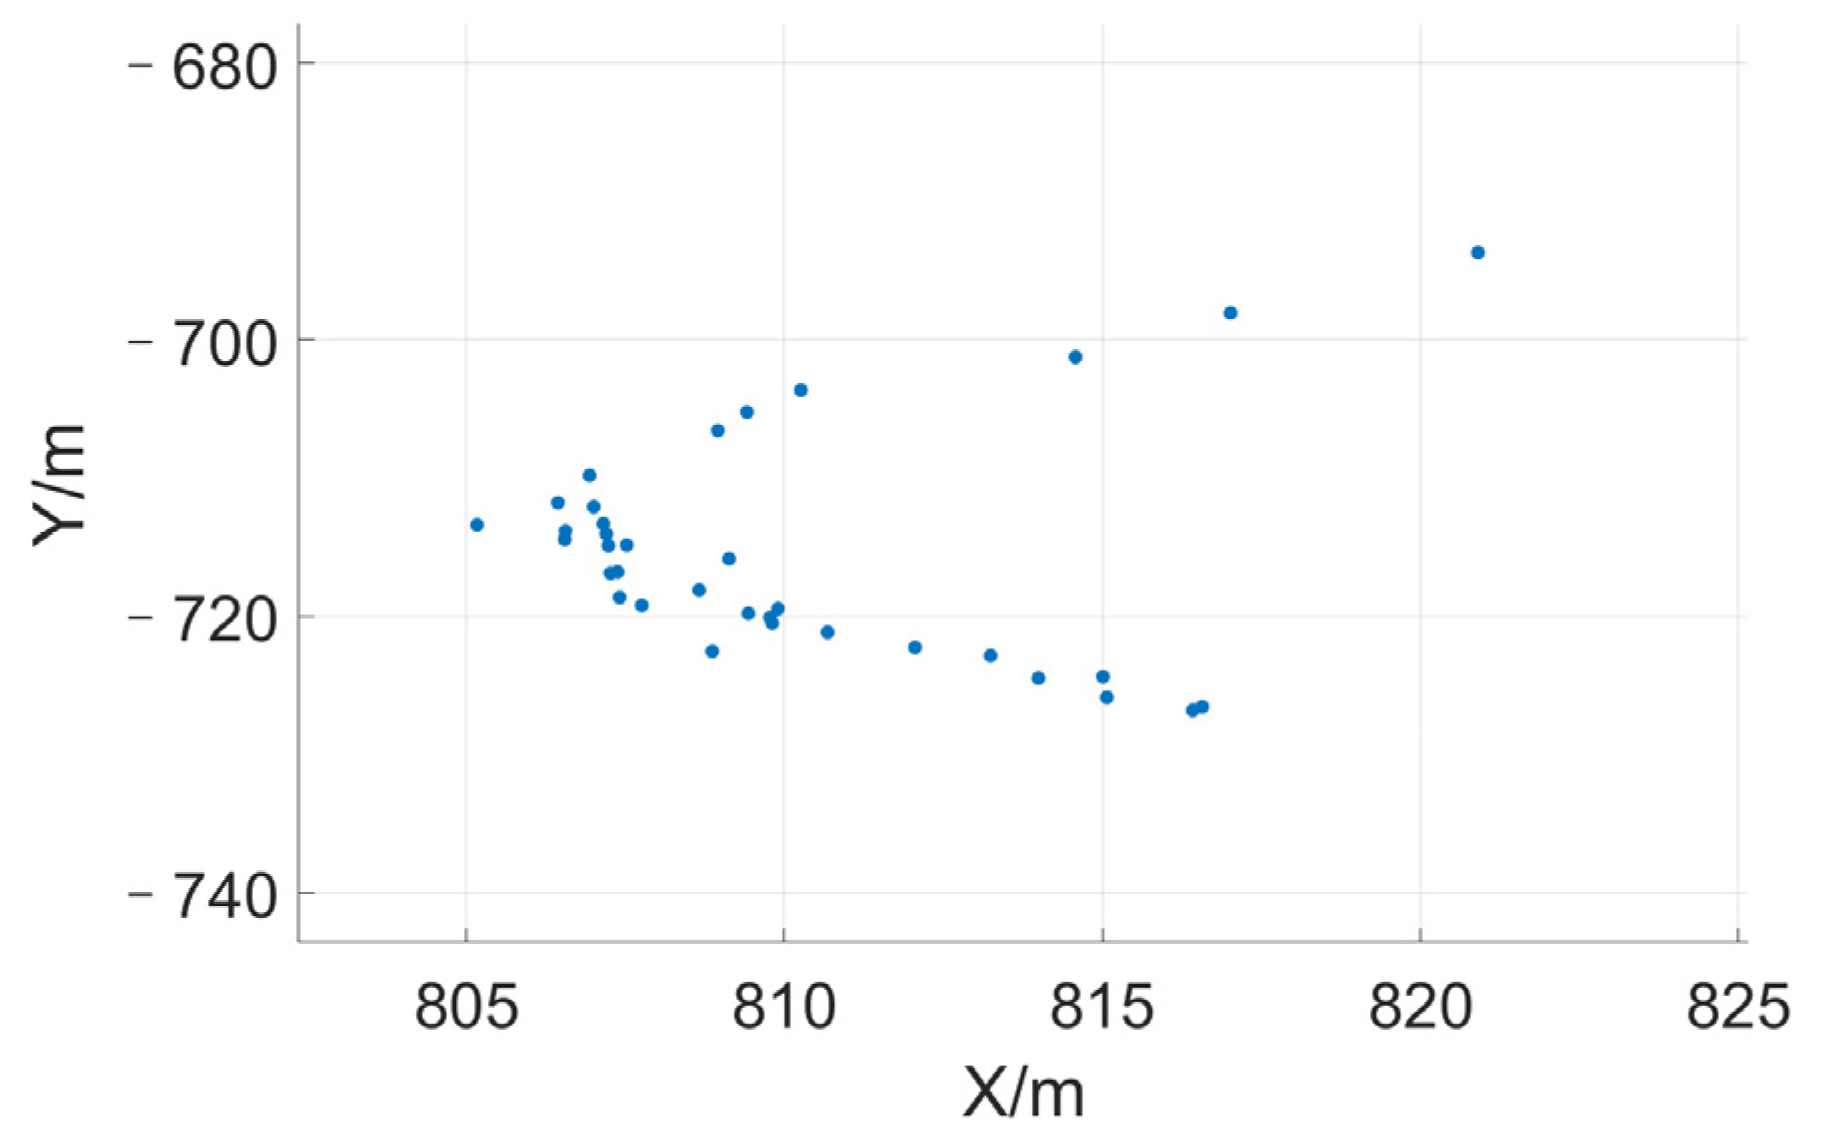
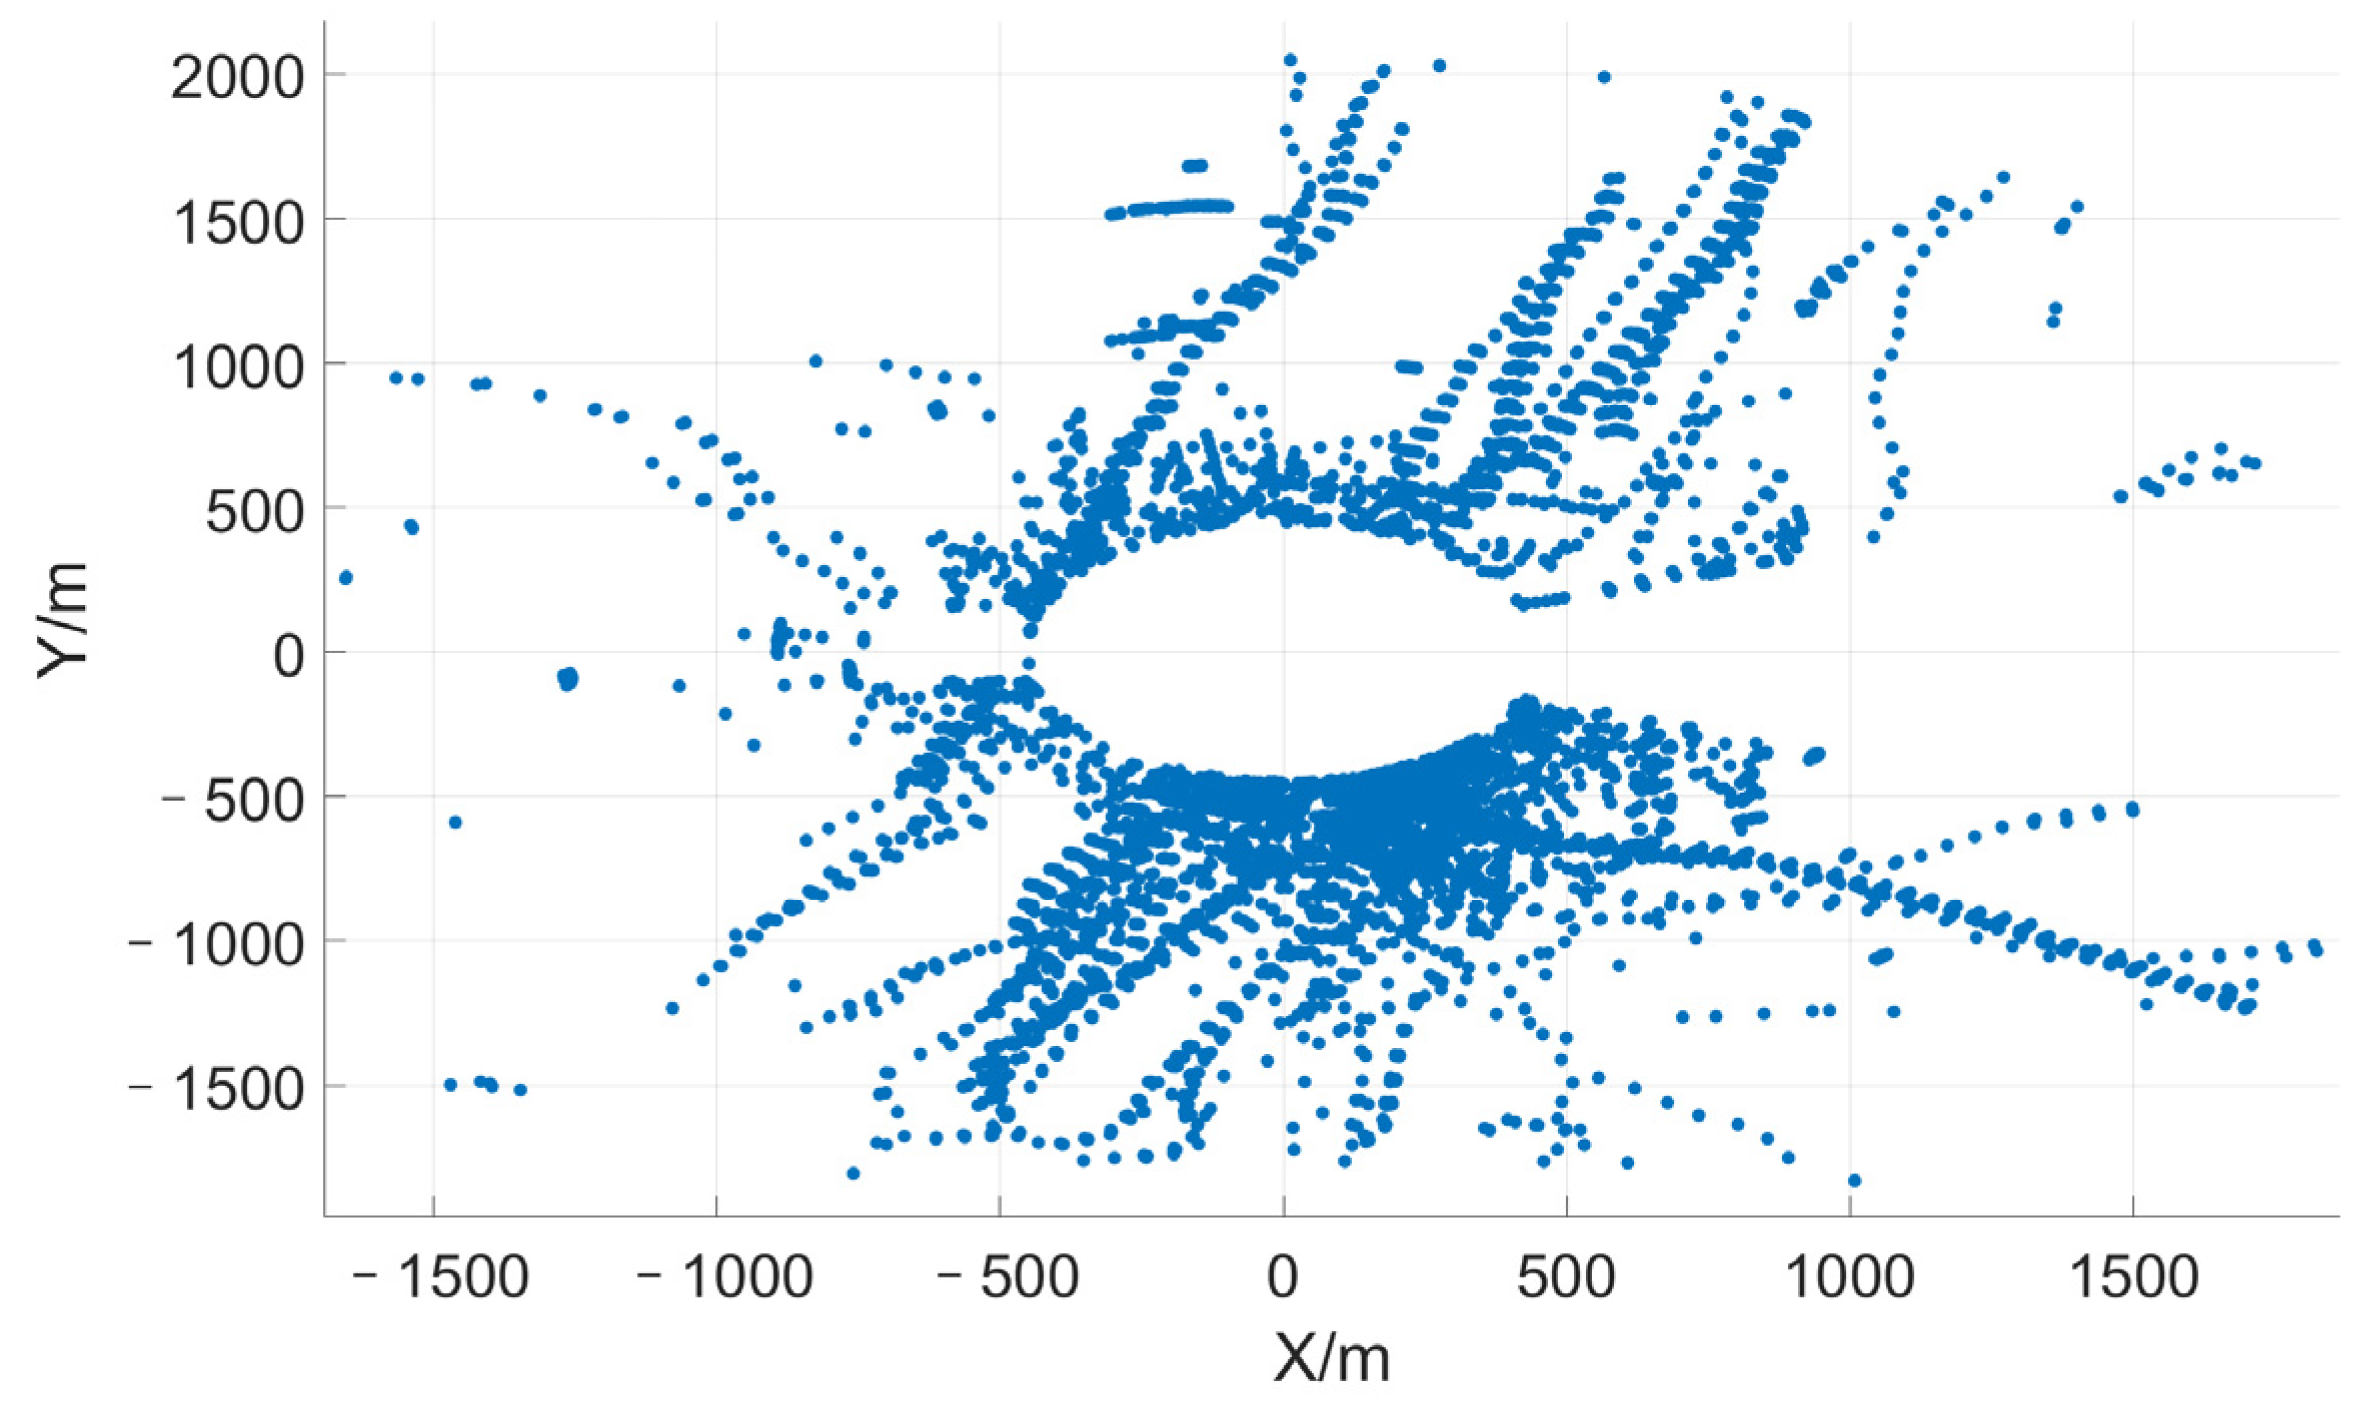
The flock’s measurements of one radar frame are shown in Figure 19. The “V” formation can be recognized from the spatial distribution of the measurements. As the time was close to the sunset, there were multiple bird flocks foraging and homing near the experimental field. All the measurements recorded using the phased array radar during the experiment (approximately 2.5 min) are plotted in Figure 20.
The group tracking filter could maintain stable tracking during the experiment. The result of the 33rd frame is shown in Figure 21. The V-formation flock can be recognized from the figure. At the same time, another smaller flock flew to the east of the V-shaped flock. The proposed algorithm successfully separated the two group targets.
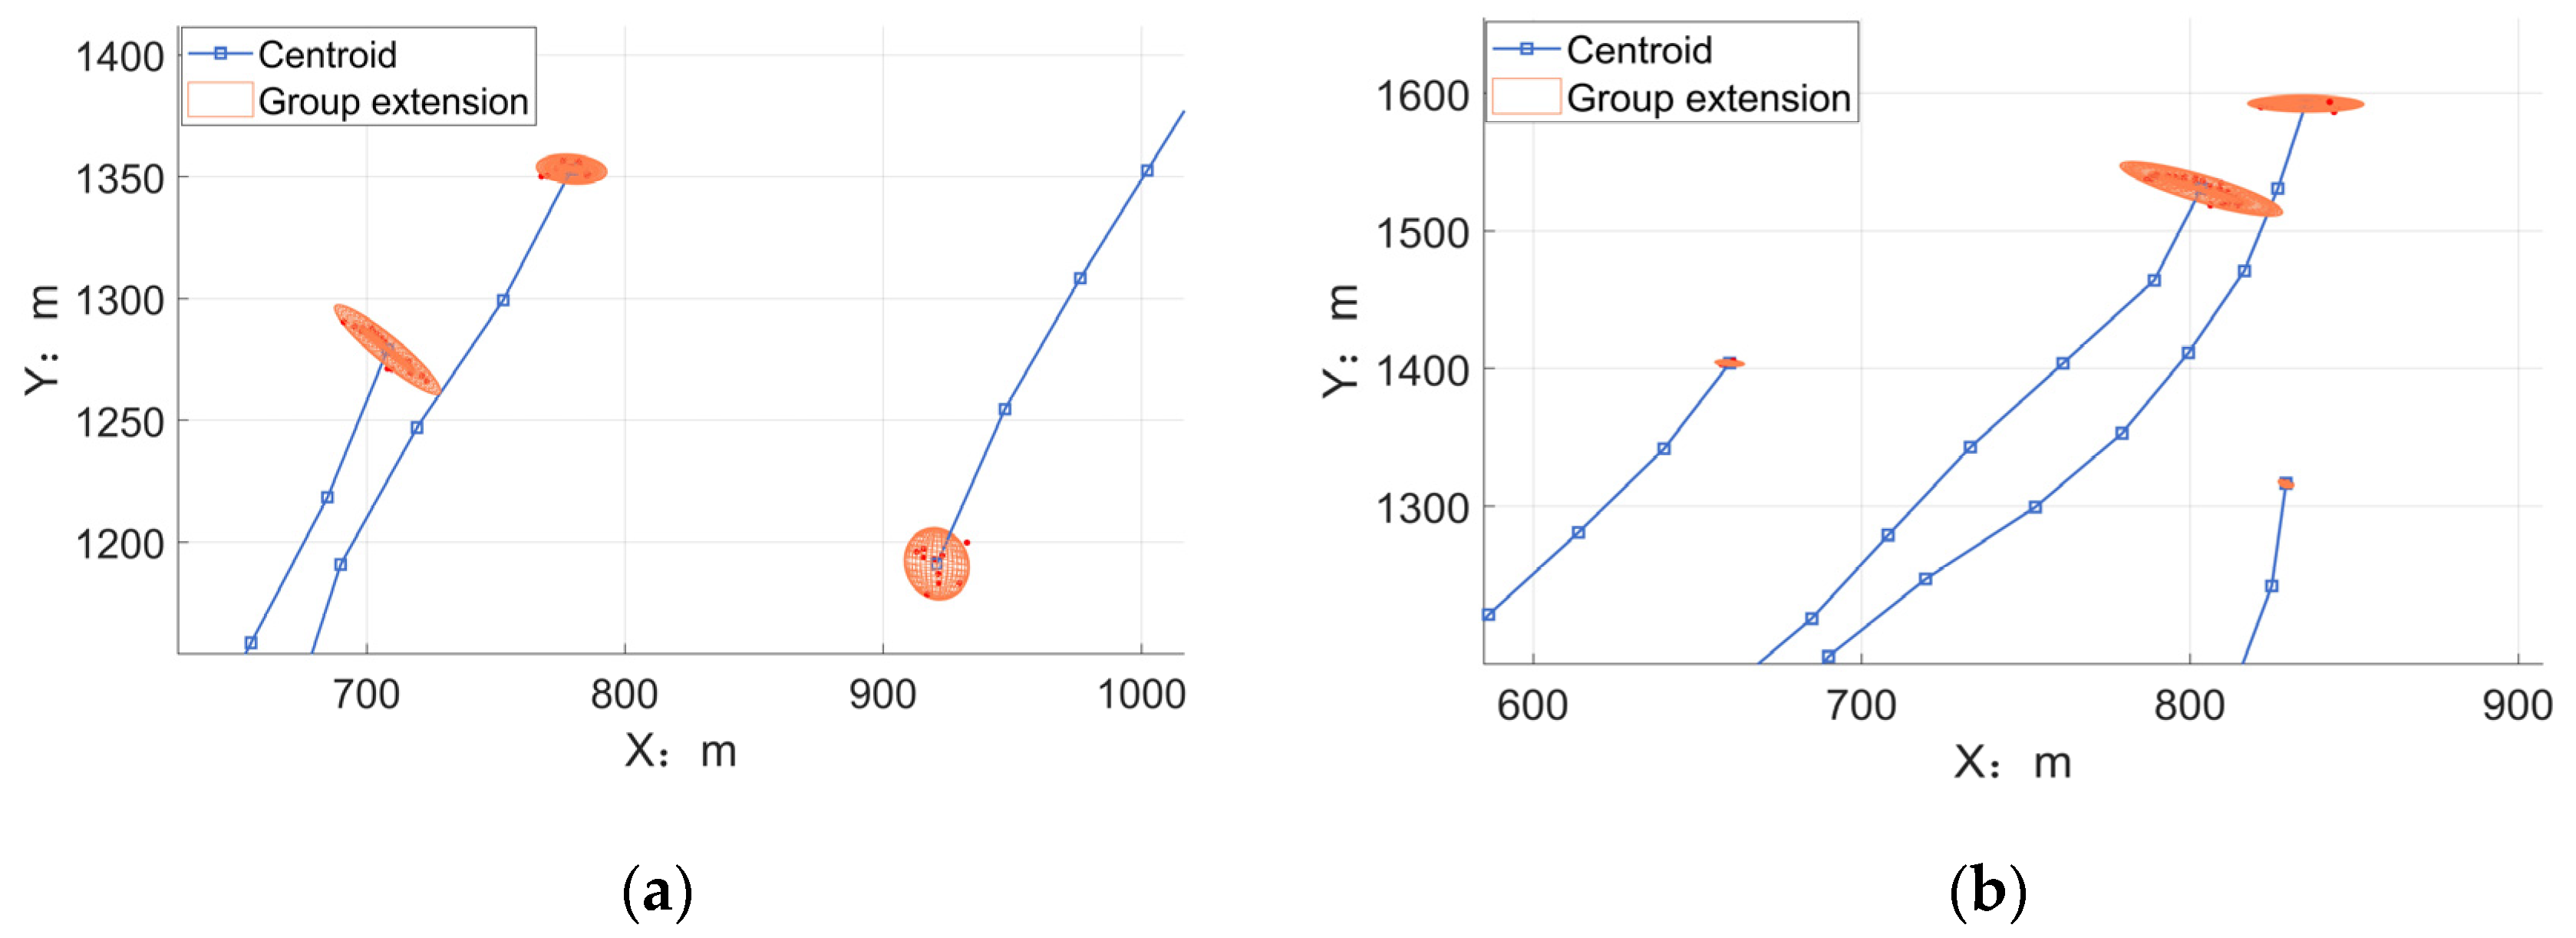
In addition to the photographed flocks, other bird flocks at different direction can also be correctly clustered and tracked. The zoomed-in result of the 12th and 16th frames are provided in Figure 22. In Figure 22a, two large flocks were heading north-east. In Figure 22b, the two flocks on the left flew in the opposite direction to the flock on the right. Figure 23 illustrates the numbers of group tracks using different similarity thresholds. The overall trends of different curves were still similar, and more group tracks would be initiated when using a smaller threshold.

5. Conclusions

This paper proposed a clustering method based on the algebraic graph theory to monitor dynamically changing migratory flocks. A connected graph was constructed according to the spatial distribution of the flock, and the similarity matrix was calculated accordingly. The clustering problem was equivalent to the extraction of the partitioned matrices on the diagonal. The method only needs one prior parameter and is adaptive to complex group behaviors (splitting, combination, etc.). Two modifications were proposed to reduce the computational burden, and the effectiveness of the method was verified using real radar data. The experimental results showed that the proposed method could separate different single/group targets successfully. Future work will focus on dividing the interior parts with different densities within a group.

Author Contributions

Conceptualization, Q.J., C.H. and R.W.; methodology, Q.J. and R.W.; software, Q.J., W.Z. and L.J.; validation, Q.J., L.J. and C.W.; experiment, Q.J., W.Z. and L.J.; writing—original draft preparation, Q.J. and L.J.; writing—review and editing, R.W., C.H., W.L. and Q.J.; funding acquisition, R.W., C.H. and W.L. All authors have read and agreed to the published version of the manuscript.

Funding

This work was funded in part by the National Natural Science Foundation of China under Grant U2133217, 62225104, and in part by the Special Fund for Research on National Major Research Instruments under Grant 31727901, and in part by the National Key R&D Program of China under Grant 2023YFC3341100.

Data Availability Statement

The data supporting the conclusions of this article are not readily available because the data are part of the ongoing studies funded by the projects mentioned above.

Conflicts of Interest

The authors declare no conflicts of interest.

References

  1. Van Doren, B.M.; Horton, K.G. A continental system for forecasting bird migration. Science 2018, 361, 1115–1118. [Google Scholar] [CrossRef]
  2. Long, T.; Hu, C.; Wang, R.; Zhang, T.; Kong, S.; Li, W.; Cai, J.; Tian, W.; Zeng, T. Entomological Radar Overview: System and Signal Processing. IEEE Aerosp. Electron. Syst. Mag. 2020, 35, 20–32. [Google Scholar] [CrossRef]
  3. Metz, I.C.; Ellerbroek, J.; Mühlhausen, T.; Kügler, D.; Hoekstra, J.M. The bird strike challenge. Aerospace 2020, 7, 26. [Google Scholar] [CrossRef]
  4. Dhanjal-Adams, K.L.; Bauer, S.; Emmenegger, T.; Hahn, S.; Lisovski, S.; Liechti, F. Spatiotemporal Group Dynamics in a Long-Distance Migratory Bird. Curr. Biol. 2018, 28, 2824–2830. [Google Scholar] [CrossRef]
  5. Teitelbaum, C.S.; Converse, S.J.; Fagan, W.F.; Böhning-Gaese, K.; O’Hara, R.B.; Lacy, A.E.; Mueller, T. Experience drives innovation of new migration patterns of whooping cranes in response to global change. Nat. Commun. 2016, 7, 12793. [Google Scholar] [CrossRef]
  6. Beauchamp, G. Long-distance migrating species of birds travel in larger groups. Biol. Lett. 2011, 7, 692–694. [Google Scholar] [CrossRef]
  7. Lengyel, S.; Tar, J.; Rózsa, L. Flock size measures of migrating lesser white-fronted geese Anser erythropus. Acta Zool. Acad. Sci. Hung. 2012, 58, 297–303. [Google Scholar]
  8. Cui, K.; Hu, C.; Wang, R.; Sui, Y.; Mao, H.; Li, H. Deep-learning-based extraction of the animal migration patterns from weather radar images. Sci. China Inf. Sci. 2020, 63, 140304. [Google Scholar] [CrossRef]
  9. Phillips, A.C.; Majumdar, S.; Washburn, B.E.; Mayer, D.; Swearingin, R.M.; Herricks, E.E.; Guerrant, T.L.; Beckerman, S.F.; Pullins, C.K. Efficacy of avian radar systems for tracking birds on the airfield of a large international airport. Wildl. Soc. Bull. 2018, 42, 467–477. [Google Scholar] [CrossRef]
  10. Plonczkier, P.; Simms, I.C. Radar monitoring of migrating pink-footed geese: Behavioural responses to offshore wind farm development. J. Appl. Ecol. 2012, 49, 1187–1194. [Google Scholar] [CrossRef]
  11. Geng, W. Study of group-initialization method based on group-target center of geometry. Syst. Eng. Electron. 2008, 30, 269–272. [Google Scholar]
  12. MacQueen, J. Some methods for classification and analysis of multivariate observations. In Proceedings of the Fifth Berkeley Symposium on Mathematical Statistics and Probability, Berkeley, CA, USA, 1 January 1967; pp. 281–297. [Google Scholar]
  13. Sander, J.; Ester, M.; Kriegel, H.-P.; Xu, X. Density-Based Clustering in Spatial Databases: The Algorithm GDBSCAN and Its Applications. Data Min. Knowl. Discov. 1998, 2, 169–194. [Google Scholar] [CrossRef]
  14. Li, T.; Corchado, J.M.; Chen, H. Distributed Flooding-then-Clustering: A Lazy Networking Approach for Distributed Multiple Target Tracking. In Proceedings of the 2018 21st International Conference on Information Fusion (FUSION), Cambridge, UK, 10–13 July 2018; pp. 2415–2422. [Google Scholar]
  15. Li, T.; Corchado, J.M.; Sun, S.; Bajo, J. Clustering for filtering: Multi-object detection and estimation using multiple/massive sensors. Inf. Sci. 2017, 388–389, 172–190. [Google Scholar] [CrossRef]
  16. Zhang, T.; Ramakrishnan, R.; Livny, M. BIRCH: An efficient data clustering method for very large databases. ACM Sigmod Rec. 1996, 25, 103–114. [Google Scholar] [CrossRef]
  17. Guha, S.; Rastogi, R.; Shim, K. CURE: An efficient clustering algorithm for large databases. ACM Sigmod Rec. 1998, 27, 73–84. [Google Scholar] [CrossRef]
  18. Tao, Y.; Jiang, X. Radar Detection Target Clustering Algorithm Based on Similarity Matrix. Fire Control Radar Technol. 2018, 47, 40–44. [Google Scholar]
  19. Ai, W.; Zhang, D. A Dynamic Target Grouping Approach Based on Grouping Matrix. Radio Eng. 2015, 45, 64–68. [Google Scholar]
  20. Biggs, N. Algebraic Graph Theory; Cambridge University Press: London, UK, 1974; pp. 9–13. [Google Scholar]
  21. Jiang, Q.; Wang, R.; Zhou, C.; Zhang, T.; Hu, C. Modified Bayesian Group Target Track Initiation Algorithm Based on Algebraic Graph Theory. J. Electron. Inf. Technol. 2021, 43, 531–538. [Google Scholar]
  22. Ballerini, M.; Calbibbo, N.; Candeleir, R.; Cavagna, A.; Cisbani, E.; Giardina, I.; Lecomte, V.; Orlandi, A.; Parisi, G.; Procaccini, A.; et al. Interaction ruling animal collective behavior depends on topological rather than metric distance: Evidence from a field study. Proc. Natl. Acad. Sci. USA 2008, 105, 1232–1237. [Google Scholar] [CrossRef] [PubMed]
  23. Lukeman, R.; Li, Y.X.; Edelstein-Keshet, L. Inferring individual rules from collective behavior. Proc. Natl. Acad. Sci. USA 2010, 107, 12576–12580. [Google Scholar] [CrossRef]
  24. Smith, M.E.; Varshney, P.K. Intelligent CFAR processor based on data variability. IEEE Trans. Aerosp. Electron. Syst. 2000, 36, 837–847. [Google Scholar] [CrossRef]
  25. Cai, J.; Wang, R.; Hu, C.; Luo, W.; Liu, H.; Zhang, N. Target Detection and Density Inversion of Migrating Insects Based on a Novel Scanning Insect Radar. J. Signal Process. 2022, 38, 1333–1352. [Google Scholar]
  26. Hu, C.; Yan, Y.; Wang, R.; Jiang, Q.; Cai, J.; Li, W. High-resolution, multi-frequency and full-polarization radar database of small and group targets in clutter environment. Sci. China Inf. Sci. 2023, 66, 227301. [Google Scholar] [CrossRef]
  27. Koch, W.; Saul, R. A Bayesian Approach to Extended Object Tracking and Tracking of Loosely Structured Target Groups. In Proceedings of the 2005 7th International Conference on Information Fusion, Philadelphia, PA, USA, 25–28 July 2005; pp. 827–834. [Google Scholar]
  28. Koch, J.W. Bayesian approach to extended object and cluster tracking using random matrices. IEEE Trans. Aerosp. Electron. Syst. 2008, 44, 1042–1059. [Google Scholar] [CrossRef]
Figure 1. An illustration of the setback in the traditional similarity matrix approach.
Remotesensing 16 01215 g001
Figure 2. The simplified connected relations between the vertices.
Remotesensing 16 01215 g002
Figure 3. A visualized flowsheet of the clustering algorithm based on the algebraic graph theory.
Remotesensing 16 01215 g003
Figure 4. The optimum connected graph. There is only one edge between the neighbors.
Remotesensing 16 01215 g004
Figure 5. The connected graph using a broadened threshold.
Remotesensing 16 01215 g005
Figure 6. The clustering results of each sector.
Remotesensing 16 01215 g006
Figure 7. The fusion results between the sectors.
Remotesensing 16 01215 g007
Figure 8. Map of the coastal areas near Dongying.
Remotesensing 16 01215 g008
Figure 9. Illustration of the high-resolution phased array radar.
Remotesensing 16 01215 g009
Figure 10. Illustration of the phased array radar with the radome, photoelectric pod, and control room.
Remotesensing 16 01215 g010
Figure 11. (a) Stork flock captured using the photoelectric pod at 18:14:31 p.m. (b) Stork flock captured using the photoelectric pod at 18:14:50 p.m.
Remotesensing 16 01215 g011
Figure 12. (a) All the detected measurements during the observation. (b) Zoomed-in area of the measurements. (c) Another zoomed-in area of the measurements.
Remotesensing 16 01215 g012
Figure 13. (a) Overall clustering and tracking results of the 10th frame. (b) Zoomed-in area of the 17th frame. (c) Three-dimensional result of the 17th frame.
Remotesensing 16 01215 g013
Figure 14. (a) Zoomed-in area of the 36th frame. (b) Zoomed-in area of the 37th frame. (c) Zoomed-in area of the 46th frame. (d) Zoomed-in area of the 47th frame.
Remotesensing 16 01215 g014
Figure 15. The number of group tracks using different similarity thresholds in the first experiment.
Remotesensing 16 01215 g015
Figure 16. (a) Clustering result of the 21st frame using a 20 m threshold. (b) Clustering result of the 21st frame using a 40 m threshold.
Remotesensing 16 01215 g016
Figure 17. The clustering results of the DBSCAN method and the paper’s method.
Remotesensing 16 01215 g017
Figure 18. (a) The medium flock captured using the photoelectric pod at 18:29:44 p.m. (b) The medium flock captured using the photoelectric pod at 18:29:51 p.m.
Remotesensing 16 01215 g018
Figure 19. Detection results of the flock. A V-shaped formation can be recognized.
Remotesensing 16 01215 g019
Figure 20. All the detected measurements during the observation.
Remotesensing 16 01215 g020
Figure 21. (a) Zoomed-in area of the tracking results of the V formation with a nearby flock. (b) The three-dimensional results of the V formation with a nearby flock.
Remotesensing 16 01215 g021
Figure 22. (a) One zoomed-in area of the 12th frame. (b) Another zoomed-in area of the 16th frame.
Remotesensing 16 01215 g022
Figure 23. The number of group tracks using different similarity thresholds in the second experiment.
Remotesensing 16 01215 g023
Disclaimer/Publisher’s Note: The statements, opinions and data contained in all publications are solely those of the individual author(s) and contributor(s) and not of MDPI and/or the editor(s). MDPI and/or the editor(s) disclaim responsibility for any injury to people or property resulting from any ideas, methods, instructions or products referred to in the content.