1. Introduction
As urbanization continues to progress in various regions and urban populations steadily increase, the automated detection of buildings becomes increasingly important. For instance, the coverage area of buildings can be utilized in various application areas such as urban development planning [
1], disaster assessment [
2], emergency management [
3], and tourism development [
4]. Furthermore, urban building detection contributes to the digital reconstruction of cities, which will play a crucial role in the development of city virtual reality augmentation technologies [
5].
Tomographic SAR (TomoSAR) is an important remote sensing technology with characteristics such as all-day, all-weather operation, and penetration capabilities [
6]. It enables the monitoring and reconstruction of targets in urban areas, especially artificial targets [
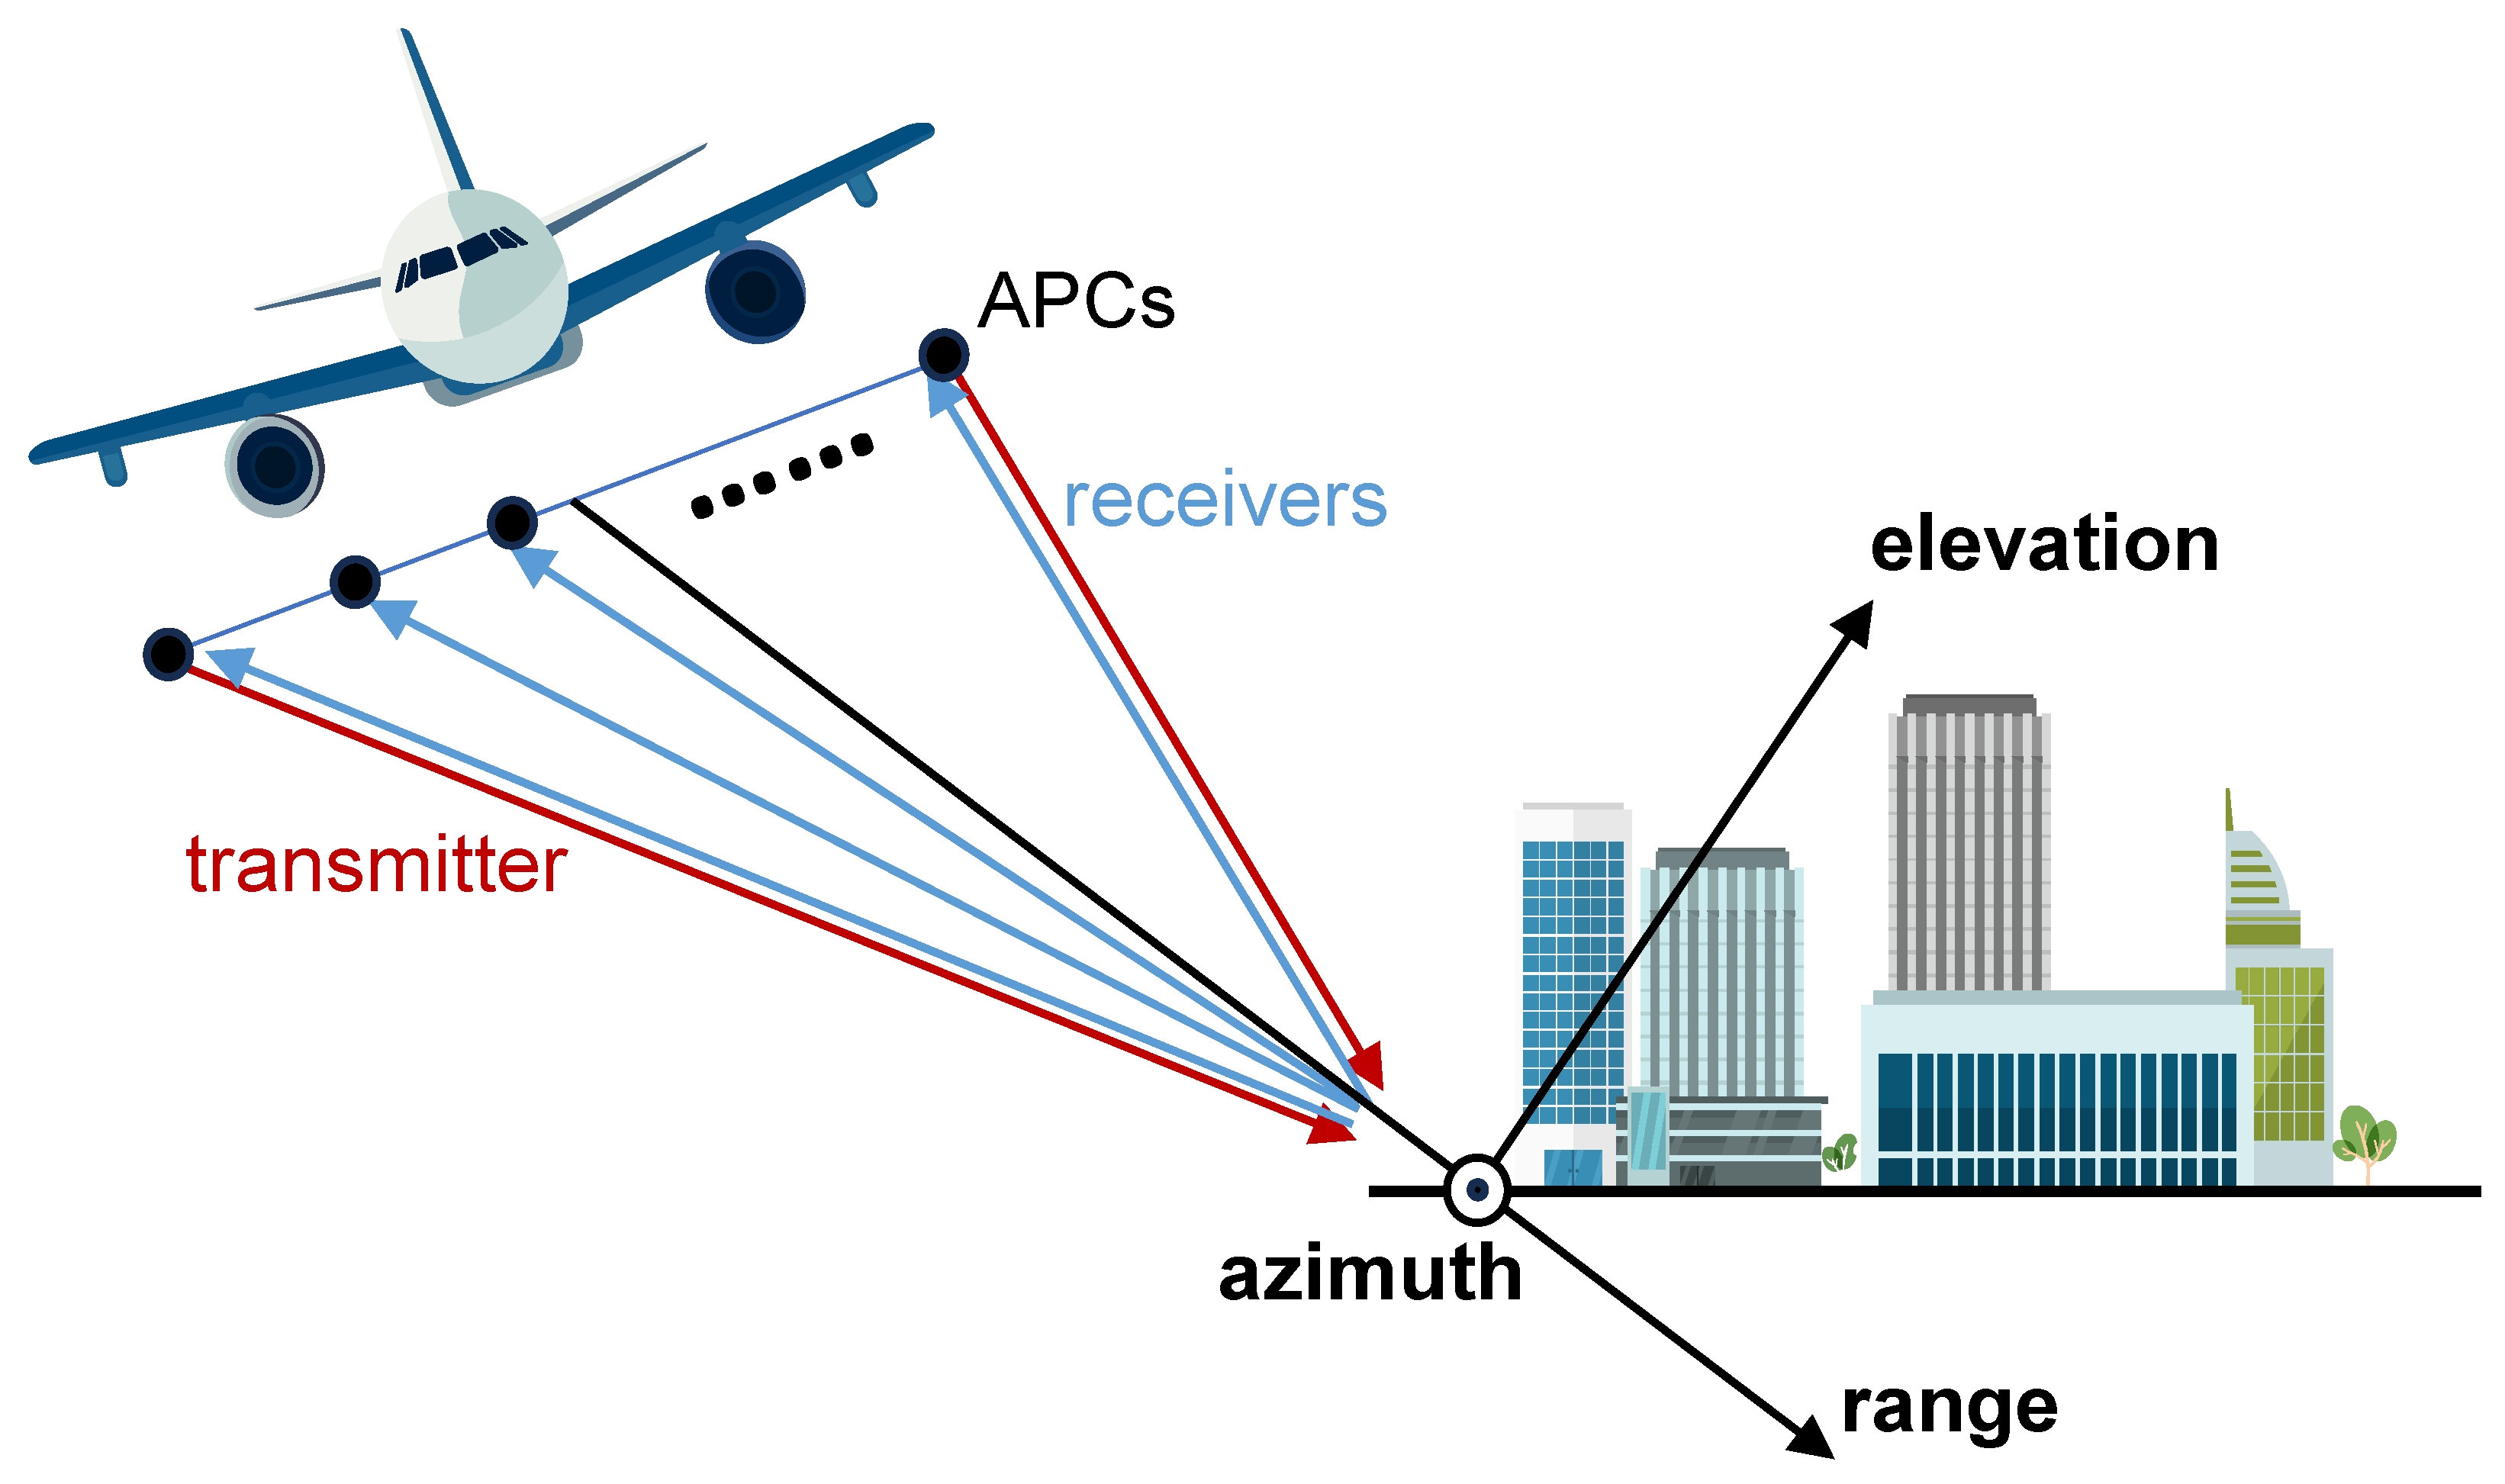
7]. Airborne array-InSAR is one implementation of TomoSAR. By deploying multiple antennas in the cross-track direction and utilizing Multi-Input Multi-Output (MIMO) technology to create virtual Antenna Phase Centers (APCs), it achieves multiple-angle observations in the elevation direction [
6]. The conceptual illustration of its observation is shown in
Figure 1. Airborne array-InSAR can achieve 3D imaging in a single pass with high coherence and strong timeliness. Therefore, airborne array-InSAR is one of the crucial means for acquiring digital models of large-scale urban structures.
In SAR point cloud building detection, researchers have conducted some related work. In traditional methods, detection is primarily based on the building structure and data distribution features of SAR point clouds. Building structure-based methods often involve detection and reconstruction based on information such as the three-dimensional structure of buildings [
8,
9], building footprints [
10], and rooftops [
11,
12]. Some methods integrate point cloud distribution features. X.X. Zhu’s team at the German Aerospace Center, for example, projected point clouds onto the ground and extracted building facades using density and surface normal vector estimation [
13]. Subsequently, they extracted roof points using density clustering [
14] and region growing [
15], followed by reconstruction using regularization methods. Additionally, there are often some “ghost” scatterers around building targets due to the presence of multiple scattering in TomoSAR imaging [
16], which introduce uncertainty into building detection. Density threshold-based methods do not consider this issue. Ruichang Cheng et al. utilized the positions of these ghost scatterers to detect building facades [
17]. Traditional methods generally extract building point clouds from the projection density of point clouds projected onto the ground plane, which is challenging to implement in scenarios with low-rise buildings or low signal-to-noise ratios, as the point density changes slowly in these areas. On the other hand, traditional methods often require a significant amount of manual configuration (thresholds, grid sizes, etc.) and evaluation work, making the overall processing relatively complex.
Machine learning is also a research direction for building point cloud detection. Qin Fei et al. used K-means clustering analysis for building reconstruction [
18]. Inspired by density clustering, Ziye Guo and others proposed using the Density-Based Spatial Clustering of Applications with Noise (DBSCAN) algorithm to extract various shapes of buildings, preserving the architectural structure more completely [
19]. Afterwards, A. Mele et al. integrated satellite DInSAR measurements with the DBSCAN algorithm to cluster building areas [
20]. Ziye Guo et al. introduced Euclidean clustering with KD-Tree for extracting and segmenting individual building facades [
21]. Machine learning methods perform well in terms of efficiency and accuracy, but they often exhibit lower levels of detail in extracting building targets and achieve lower reconstruction quality compared to traditional methods. Therefore, it is evident that there is considerable potential for the development of automation, robustness, efficiency, and high-resolution fine reconstruction in SAR building point cloud extraction.
The progress of deep learning in the semantic segmentation of 3D point clouds has provided new insights for research. In fact, deep learning has been applied in SAR for some time now. This includes applications such as building detection in SAR 2D images [
22,
23], layover detection [
24], model reconstruction from 2D to 3D [
25], regularization of SAR 3D point clouds [
26], and so on. In SAR 3D point cloud processing, Mou Wang et al. utilized a point cloud extraction model to suppress echo side lobes in SAR point clouds, which were then inputted into PointNet for training, achieving the recognition of three aircraft targets [
27]. Zerui Yu et al. combined PointNet with graph convolutional networks, initially using voxel grid filtering to suppress side lobes, followed by semantic segmentation using an improved PointNet graphics method, resulting in higher segmentation accuracy [
28]. These methods all preprocess SAR point clouds by filtering, removing points with small scattering coefficients, thus improving method feasibility but sacrificing some detailed information. Moreover, these methods were evaluated on simulated data, thus their generalizability and practicality are limited.
Currently, there have been few studies on deep learning semantic segmentation of SAR 3D point clouds [
29]. Applying deep learning methods to the task of building target segmentation in SAR point clouds holds significant potential and practical value. This paper summarizes the data characteristics of SAR point clouds based on SAR point cloud data acquired from the airborne array-InSAR system developed by the Aerospace Information Research Institute, Chinese Academy of Sciences. Inspired by the PointNet++ network and Transformer, a novel deep learning model called the Position-Feature Attention Network (PFA-Net) is proposed to directly consume SAR point cloud data and achieve point cloud segmentation of building facades and roofs.
In summary, the key contributions of our work are as follows:
We propose PFA-Net to achieve the end-to-end point cloud segmentation of SAR data, enabling the accurate extraction of building point clouds without the need for filtering preprocessing;
We theoretically analyze the characteristics of SAR data, conduct experimental research on the role of multi-dimensional features, and discuss the performance metrics in SAR point cloud segmentation tasks. This work lays the groundwork for future applications of deep learning to SAR point clouds.
We apply deep learning methods to the task of SAR point cloud building target segmentation and conduct experiments on real-world data, demonstrating the practicality and superiority of the proposed approach.
The remaining sections of this paper are organized as follows:
Section 2 provides a theoretical analysis of the characteristics of SAR point clouds and introduces the recent advancements in the application of deep learning in point cloud segmentation. In
Section 3, we present the framework and specific details of the PFA-Net.
Section 4 introduces the dataset, experimental settings, and showcases the experimental results along with analysis.
Section 5 discusses the experimental results, while
Section 6 presents the conclusions of this paper.
3. Methods
3.1. Position-Feature Attention Network
Considering the characteristics of SAR point clouds, and inspired by Point Transformer (PT) [
44] and the attention mechanism [
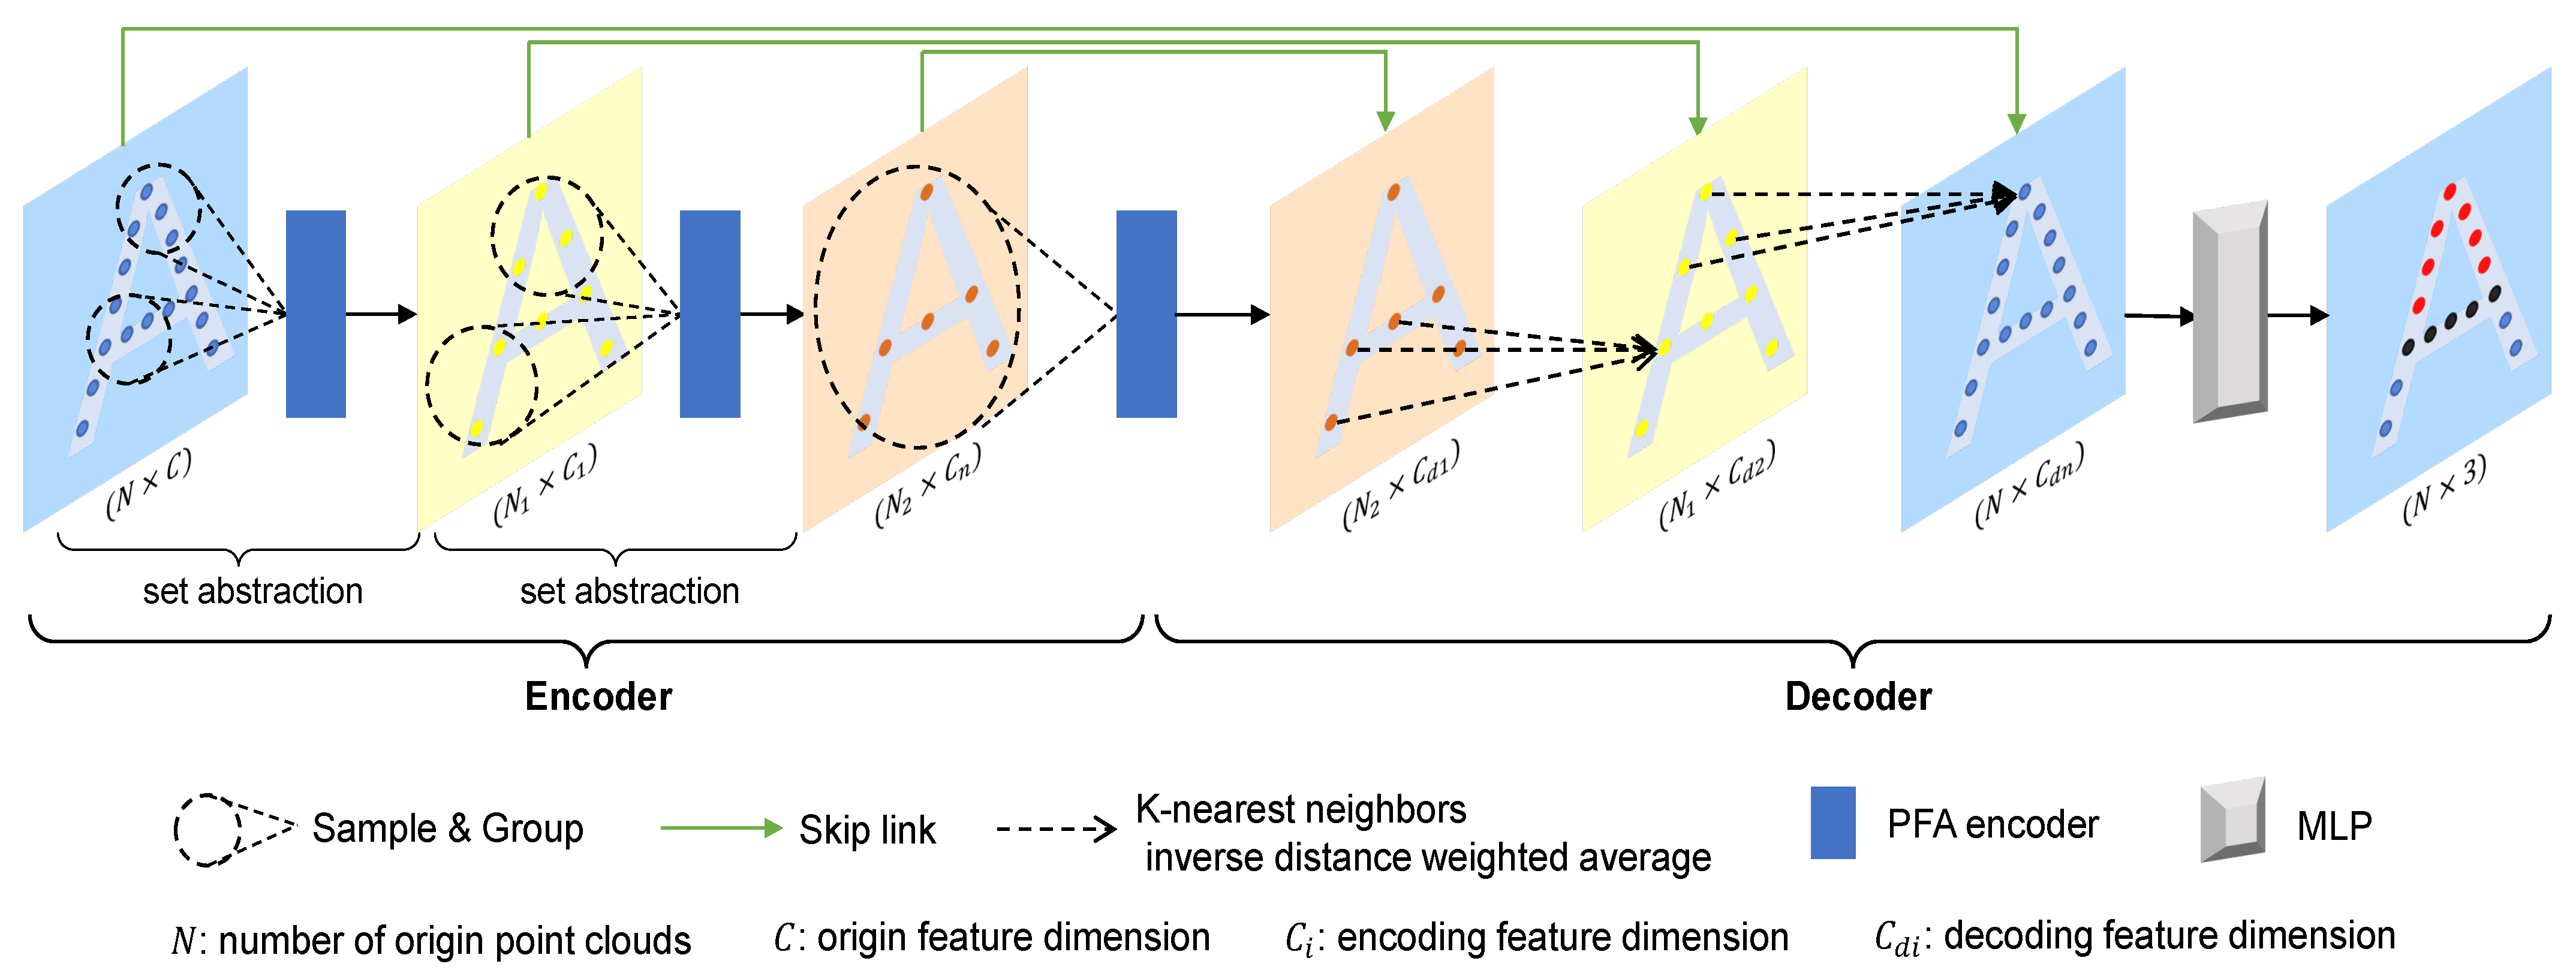
45], we have introduced the PFA-Net as an extension of the PointNet++ architecture. The overall network framework is illustrated in
Figure 5. Similar to PointNet++, PFA-Net consists of several set abstraction layers, which include three parts: sampling, grouping, and the PFA encoder. In PFA-Net, we gradually expand the feature receptive field through multiscale sampling and local neighborhood grouping methods, eventually extracting global features at the bottleneck. Then, based on the extracted global and local features, combined with point features from the downsampling, we perform upsampling to obtain the segmentation results for all point clouds.
3.1.1. Sampling and Grouping
To extract features from point clouds across multiple scales, it is necessary to perform feature abstraction on point sets, which involves processing a point set to obtain a new point set with fewer elements while retaining local feature information. We achieve this through multiple sets of sampling, grouping, and feature aggregation, starting with the sampling and grouping of the input point set. In this paper, we use the iterative Farthest Point Sampling (FPS) method to sample the input point set. The FPS method selects a new set
consisting of
points from the origin point set
with
N points:
. Each point
in
is chosen to be the farthest point from the previously sampled points
. Although its algorithmic complexity is
, the FPS method is widely used in semantic segmentation of small-scale point sets due to its ability to better cover the entire point set compared to Random Sampling (RS) when the number of centroids is the same [
40,
44]. Subsequently, we search for the k-Nearest Neighbors (kNN) of points in
within the original point set
, where the value of
k is determined based on the number of points in the scene and the chosen number of sampled points. After applying the kNN, we obtain a point set of size
, where each point has a dimensionality of
. This represents the
d-dimensional coordinates and
C-dimensional point features. The
C-dimensional point features include scattering coefficients and normal vectors, and additional features like polarization and multi-frequency scattering intensity can also be incorporated.
3.1.2. PFA Encoder
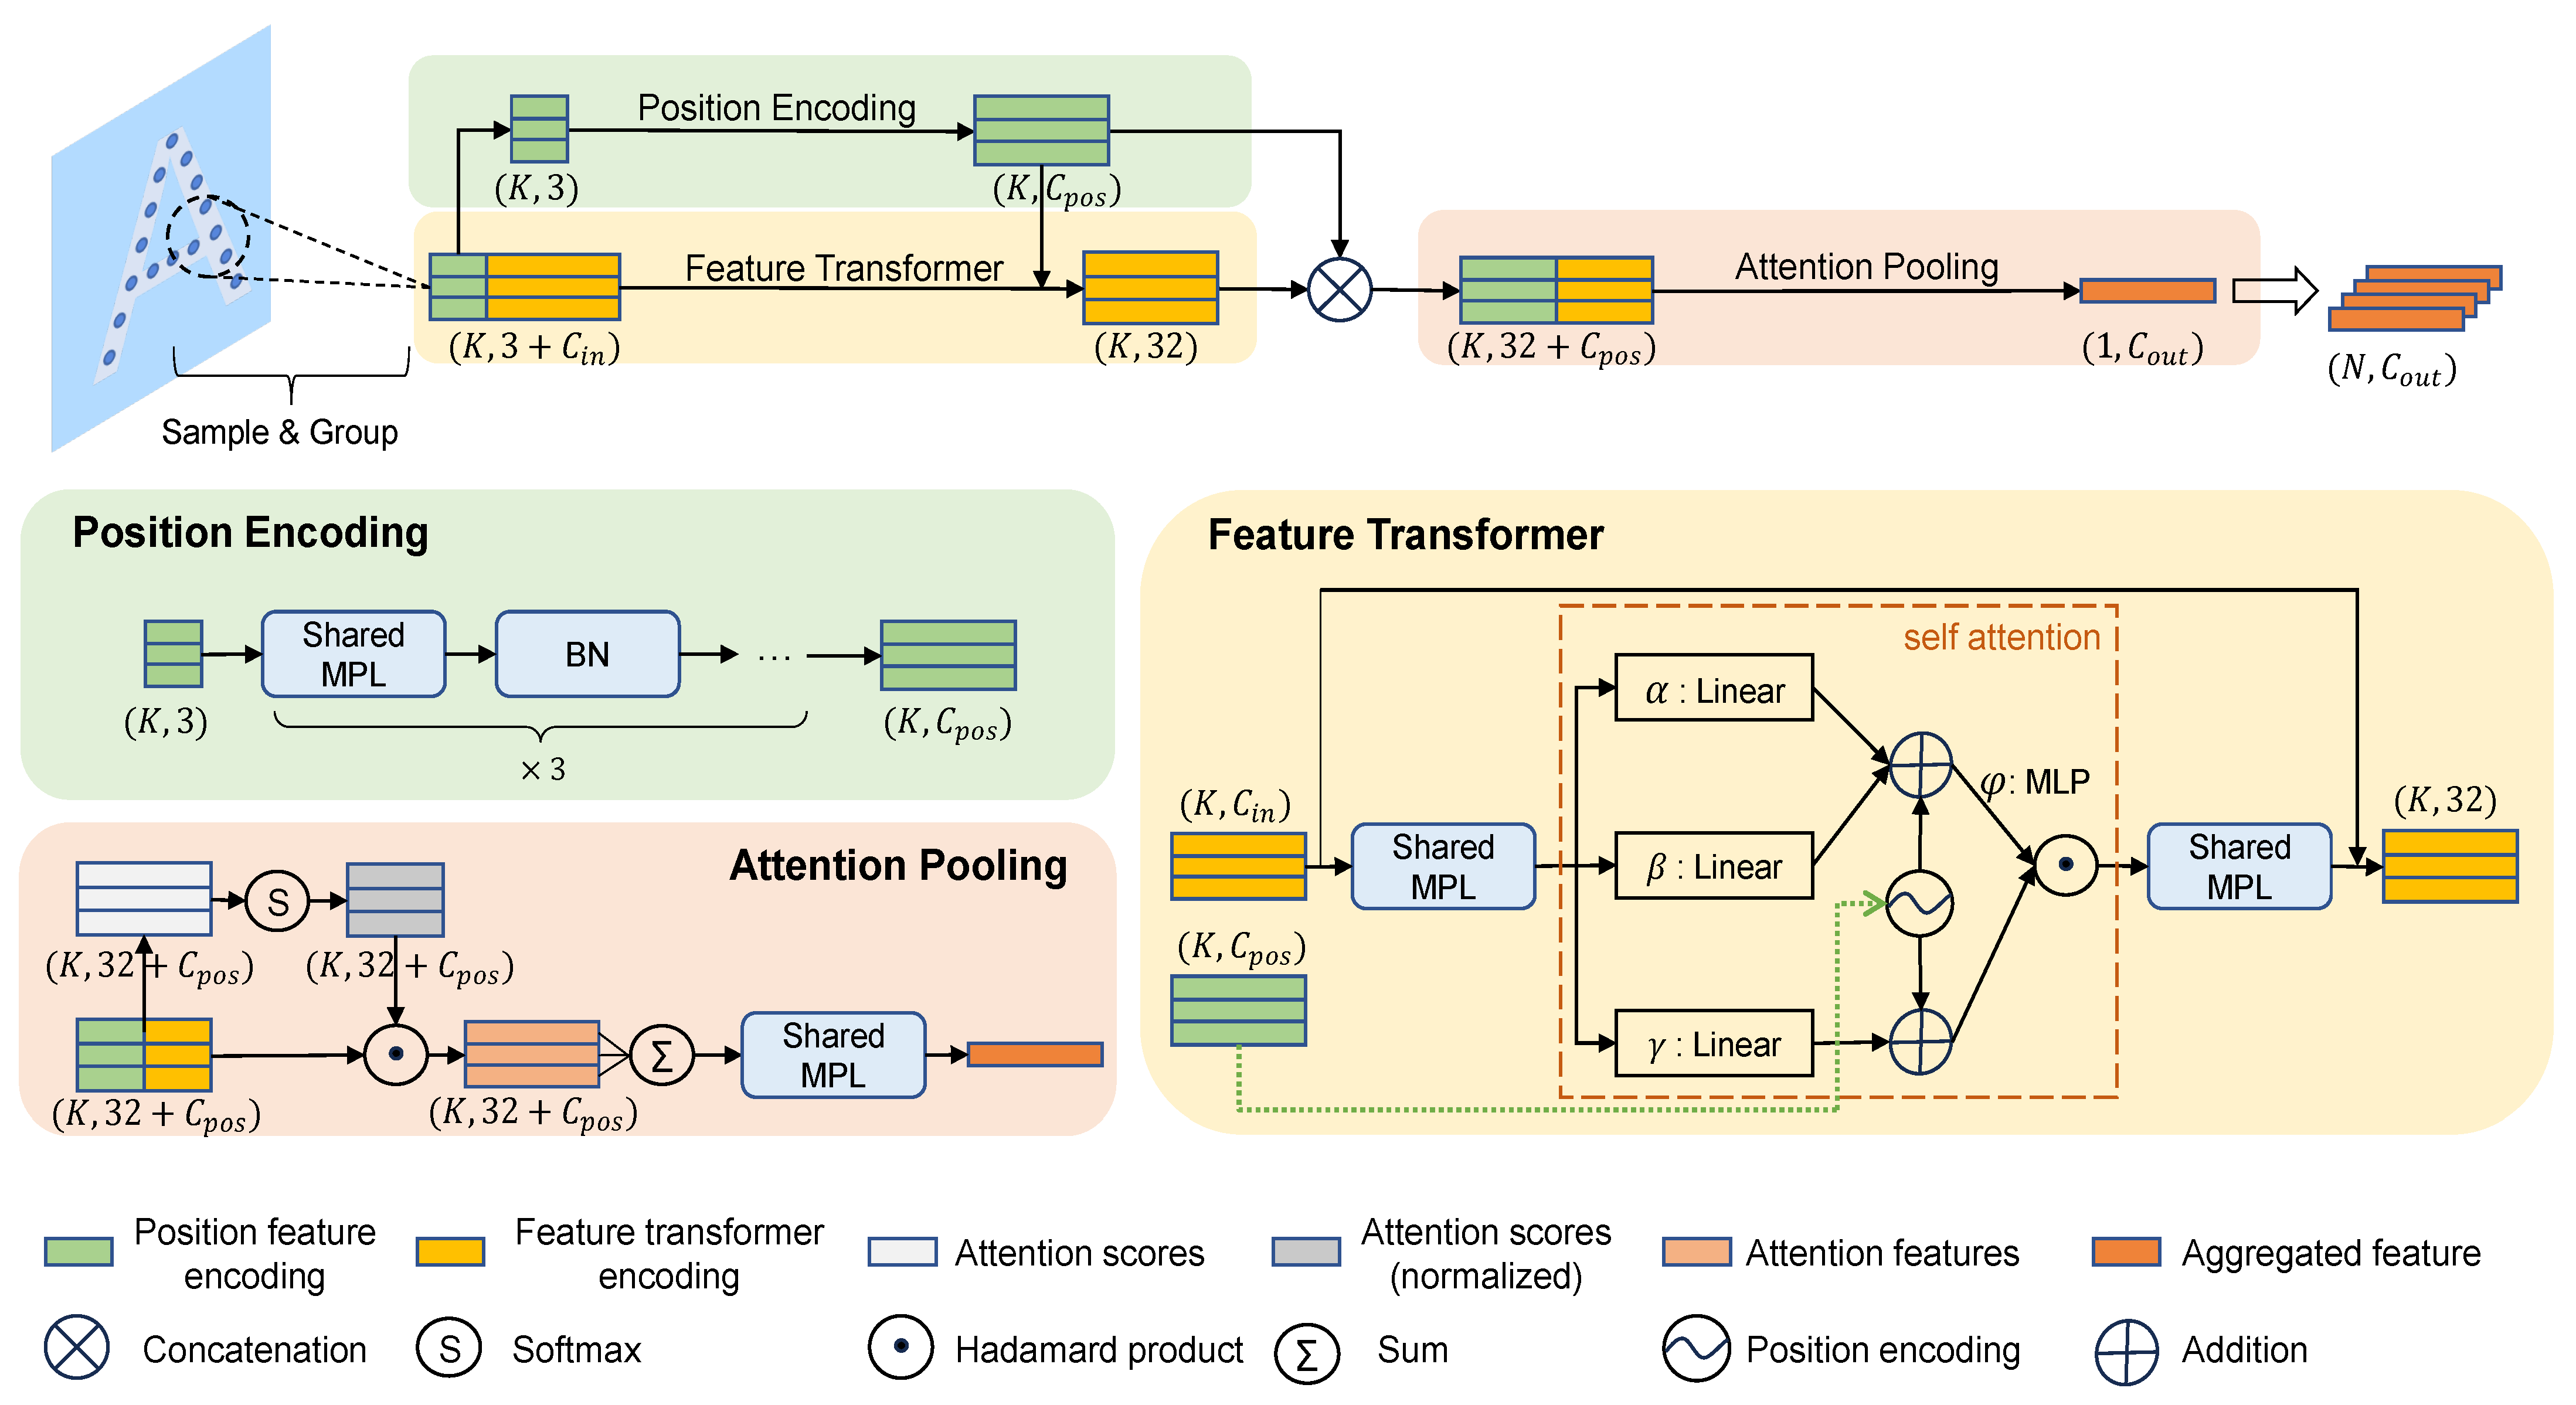
The core of PFA-Net lies in the PFA encoder, which consists of a position encoding block, a feature transformer module, and an attention pooling layer. The structure of the PFA encoder and its components are illustrated in
Figure 6.
Position Encoding Block: In PointNet and PointNet++, global or local features within the point cloud are extracted using Multilayer Perceptron (MLP) and max pooling, which demonstrates the effectiveness of MLP in extracting point cloud features. As mentioned earlier, SAR building point cloud segmentation task is relatively simple. Therefore, we use multi-scale MLP groups to encode the positional information of the point cloud, which also helps reduce the model’s complexity. It is important to note that after sampling and grouping, the points within each group form relative local neighborhood relationships. When extracting local features, it is necessary to transform them into a relative coordinate system, which enhances the model’s capability to handle large-scale scenes and improves its generalization ability. In addition, the position encoding in the feature transformer module is also obtained from this block. as the 3D coordinates of point clouds inherently contain positional information, and feature encoding helps in better extracting positional features. The position encoding function for the
group of local neighborhoods is as follows:
where
represents the coordinates of the sampling center point for the
i-th group,
denotes the coordinates of the
j-th neighborhood point within the
i-th group, and
f corresponds to the three sets of multi-scale MLPs.
Feature Transformer Module: Transformers have demonstrated significant value in natural language processing and computer vision and are also highly popular in point cloud networks. The feature transformer module is illustrated in
Figure 6 and is represented using the vector self-attention operator [
46] as follows:
the superscript
i denotes the
i-th group of local neighborhood sets.
,
,
are linear layers used in self-attention encoding to calculate the Q, K, V vectors of local neighborhood points.
,
is the local neighborhood collection of the sampling center point cloud
, and
represents a local neighborhood point of
.
represents positional features obtained from the position encoding block. And following the reference [
44], it is applied in both attention generation and feature transformation.
represents the attention weight computation layer, consisting of two linear layers and a ReLU activation layer;
denotes the relationship function between Q and K vectors, where we employ a subtraction relationship; ⊙ signifies the Hadamard product of matrices.
In the PFA encoder, the feature transformer module utilizes a self-attention operator to encode features of scattering intensity, normal vectors, and positional information within the local neighborhood. This process enables deep extraction of multi-dimensional feature information from SAR point clouds. Before and after the self-attention computation, there is a linear layer for feature mapping, which transforms data features between input dimensions and transformer feature dimensions. Additionally, a residual layer is employed within the module to mitigate model degradation issues and enhance learning capabilities.
Attention Pooling: Because of the unordered and invariance under transformation characteristics of point clouds, it is necessary to apply symmetric functions during processing to consistently map input point clouds with different permutations. This process can be represented by the following equation:
where
represents the different permutations of the point set, and
is a symmetric function. Common symmetric functions include sum, maximum, mean, etc. The input points
, and the function
g aggregates all point features within the neighborhood set to obtain the representation of local neighborhood features
.
In this paper, we use an attention operator as the symmetric function. Through the attention mechanism, we learn attention scores for each feature within the neighborhood point set. These scores indicate the importance of each feature in influencing the local neighborhood features. The following equation represents the calculation method for attention scores:
where
is the encoded feature of the
k-th point in the
i-th group’s local neighborhood set,
represents the shared MLP, and
W is the learnable weight of it.
is the attention score for the
k-th point.
After obtaining the attention scores, they are used as a mask to select important features and perform aggregation:
where
is the feature vector of
, the aggregated feature of the
i-th group’s local neighborhood set is obtained by summing the features of each point in the neighborhood weighted by its corresponding attention score.
As described in
Section 2.2, the attention computation method aligns better with the characteristics of 3D point clouds. In contrast to other symmetric functions, attention pooling focuses more on the relative relationships within a concentrated set of points. This approach preserves more valuable information during the aggregation of multi-dimensional features, resulting in aggregated features that better represent the local characteristics of the neighborhood point set.
3.1.3. Feature Encoding and Decoding
During the feature encoding phase, features are extracted from the local neighborhood point set through sampling and grouping. Subsequently, attention pooling is applied to get aggregated features at the current set abstraction layer. This process reduces the size of the point set while expanding the range of the receptive field.
This process is repeated four times, with a downsampling rate of 4 each time. At the bottleneck, global features of the input point set are extracted.
Similar to PointNet++, PFA-Net adopts a U-Net architecture design. During feature decoding, we obtain point cloud features in the dilation mapping layer by processing two inputs. One part originates from local neighborhood features within the deep modules which is computed using a weighted inverse distance mean based on kNN. The calculation is as follows:
where
represents the point features of the
K nearest neighbors to
within decoder layer
m,
is the point feature in decoder layer
, and
is the inverse distance weight factor, computed as follows:
where
represents the
k-nearest neighbors of
x, and
denotes the computation of the Euclidean distance between the coordinates of two points in three-dimensional space.
The other part of the input is the point cloud feature information, which is connected through skip links from he corresponding scale set abstraction layer of the encoding process. After concatenating these two sets of features, they are integrated through a set of MLPs to obtain the point cloud features in the decoding layer. Similarly, this process is repeated four times, progressively expanding until reaching the size of the original input point set, resulting in a feature vector for each point. Finally, an MLP is used to map each point feature to its semantic class.
3.2. Loss Function
Positional inaccuracies, high noise levels, and multiple scattering artifacts can lead to errors in manual annotation, particularly in areas such as building facade corners and the regions where building facades meet the ground. The same issue also exists in our experimental dataset: although the SAR point cloud data has been manually annotated to identify building facades and roof areas, there are still discrepancies when compared to ground truth, and these discrepancies vary depending on the experience and habits of the annotators.
The accuracy of labels is crucial for model training. During training, learning a non-target class as a target class can impact posterior probability estimation and result in overfitting. To address this issue, we introduce Label Smoothing Regularization (LSR) [
47] into the cross-entropy loss. This conversion transforms the originally manually assigned hard labels into soft labels. LSR allows the model to approach the real scenario more closely while enhancing its generalization capabilities. The cross-entropy loss for an individual sample is defined as follows:
where
C represents the number of classes,
represents the target distribution, and
is the predicted distribution generated by the model.
Without introducing LSR,
takes only binary values of 0 and 1, distinguishing between target and non-target categories. With the LSR, the calculation of
is as follows:
where
is a small positive value, set to 0.1 in this paper.
k represents the true corresponding category. When
,
represents the label value corresponding to the target category.
3.3. Evaluation Metrics
In traditional methods, due to the unavailability of accurate reference building data in experiments, it is typically assumed that points within 2 pixels of the center of the reconstructed building outline are considered as building scatter points, while all other points are considered as non-building scatter points [
13]. To evaluate the performance of different algorithms, metrics such as completeness, correctness, and quality are used. It is important to note that in our work, both building and non-building points are manually annotated and serve as ground truth for evaluating point cloud segmentation results. The metrics of completeness, correctness, and quality are equivalent to the concepts of recall, precision, and intersection over union (
) commonly used in deep learning. Therefore, in this paper, the same metric names used in deep learning are employed for clarification.
For a specific target class, within the points predicted as true by the model, those corresponding to the ground truth as the target class are considered as True Positives (), and those corresponding to the ground truth as a non-target class are considered as False Positives (). Similarly, for points predicted by the model as non-target class, those corresponding to the ground truth as a non-target class are considered as True Negatives (), and those corresponding to the ground truth as the target class are considered as False Negatives (). Afterward, the following evaluation metrics are computed:
Accuracy represents the correctness of prediction results; Precision signifies the proportion of true positive predictions among all positive predictions; Recall indicates how many of the actual positive points were correctly predicted as positive. Typically, in a task, Precision and Recall are a trade-off. FalseAlarm measures how many of the actual negative class points were mistakenly identified as positive; IoU gauges the degree of agreement between predicted results and actual ground truth; The F1Score is the harmonic mean of Recall and Precision.
As described in
Section 3.2, it is recognized that errors may exist in manually annotated ground truth. These errors in ground truth can affect the objective evaluation of IoU. In such cases, it becomes more important to focus on the overall predictive performance of the model rather than the spatial accuracy of prediction locations. Therefore, a more appropriate metric is needed to assess the performance of different algorithms. We aim to ensure that in the prediction results, as many true building points as possible are correctly predicted while minimizing the misclassification of non-building points as building points. This requires the simultaneous improvement of both Recall and Precision. Therefore, in this paper, we introduce the F1 Score as a metric for selecting the optimal model hyperparameters. A higher F1 Score indicates that both Recall and Precision are high, resulting in better overall model performance.
3.4. Method Summary
PointNet++, as an enhanced version of PointNet in terms of multi-scale feature extraction, is a foundational architecture in methods that directly consume point cloud data. Compared to popular point cloud segmentation SOTA models based on transformers and Dynamic Graph CNN (DGCNN), the architecture of PointNet++ is relatively simple. It applies MLPs to extract features from input data, demonstrating good performance and transferability.
PointNet++ was designed for LiDAR/RGB-D point clouds and does not consider the unique characteristics of SAR point clouds. Therefore, we have introduced transformer module and attention mechanism to enhance the model’s ability to extract features such as scattering coefficients and normal vectors from SAR point clouds. Considering that transformer modules require a large amount of training data to ensure convergence, which contradicts the current situation faced by SAR point clouds, we use the transformer module as a supplement to MLPs, applying it only within local neighborhoods. MLPs ensure the extraction of basic structural features from SAR point clouds and maintain good model convergence. The transformer module, acting as a supplement for feature extraction, enhances its capability for feature representation. This combination is uncommon in LiDAR point clouds, where MLPs are often directly replaced by transformer. However, it is more suitable for SAR point clouds, which typically involve smaller datasets, higher noise levels, and unique characteristics.
The introduction of LSR and F1 Score aims to better standardize the errors in manual annotations. LSR converts one-hot hard labels into soft labels, reducing the confidence in manually labeled results, which can better handle noise and improve the model’s generalization performance. The F1 Score, used as a hyperparameter for choosing the optimal model, balances recall and precision, ensuring that points truly belonging to buildings are predicted as much as possible while minimizing the misidentification of non-building points. During training, this continually enhances the model’s capability in feature extraction and integration, thus improving the overall performance.
4. Experiment and Result
4.1. Dataset
The experimental data were obtained in 2021 in Weinan City, Shaanxi Province, China, using the airborne array-InSAR system developed by the Aerospace Information Research Institute, Chinese Academy of Sciences. The system consists of two transmitters and eight receivers, with 16 phase centers in the cross-track direction. The remaining system parameters are as shown in
Table 1. Partial optical images and their corresponding SAR 2D images are shown in
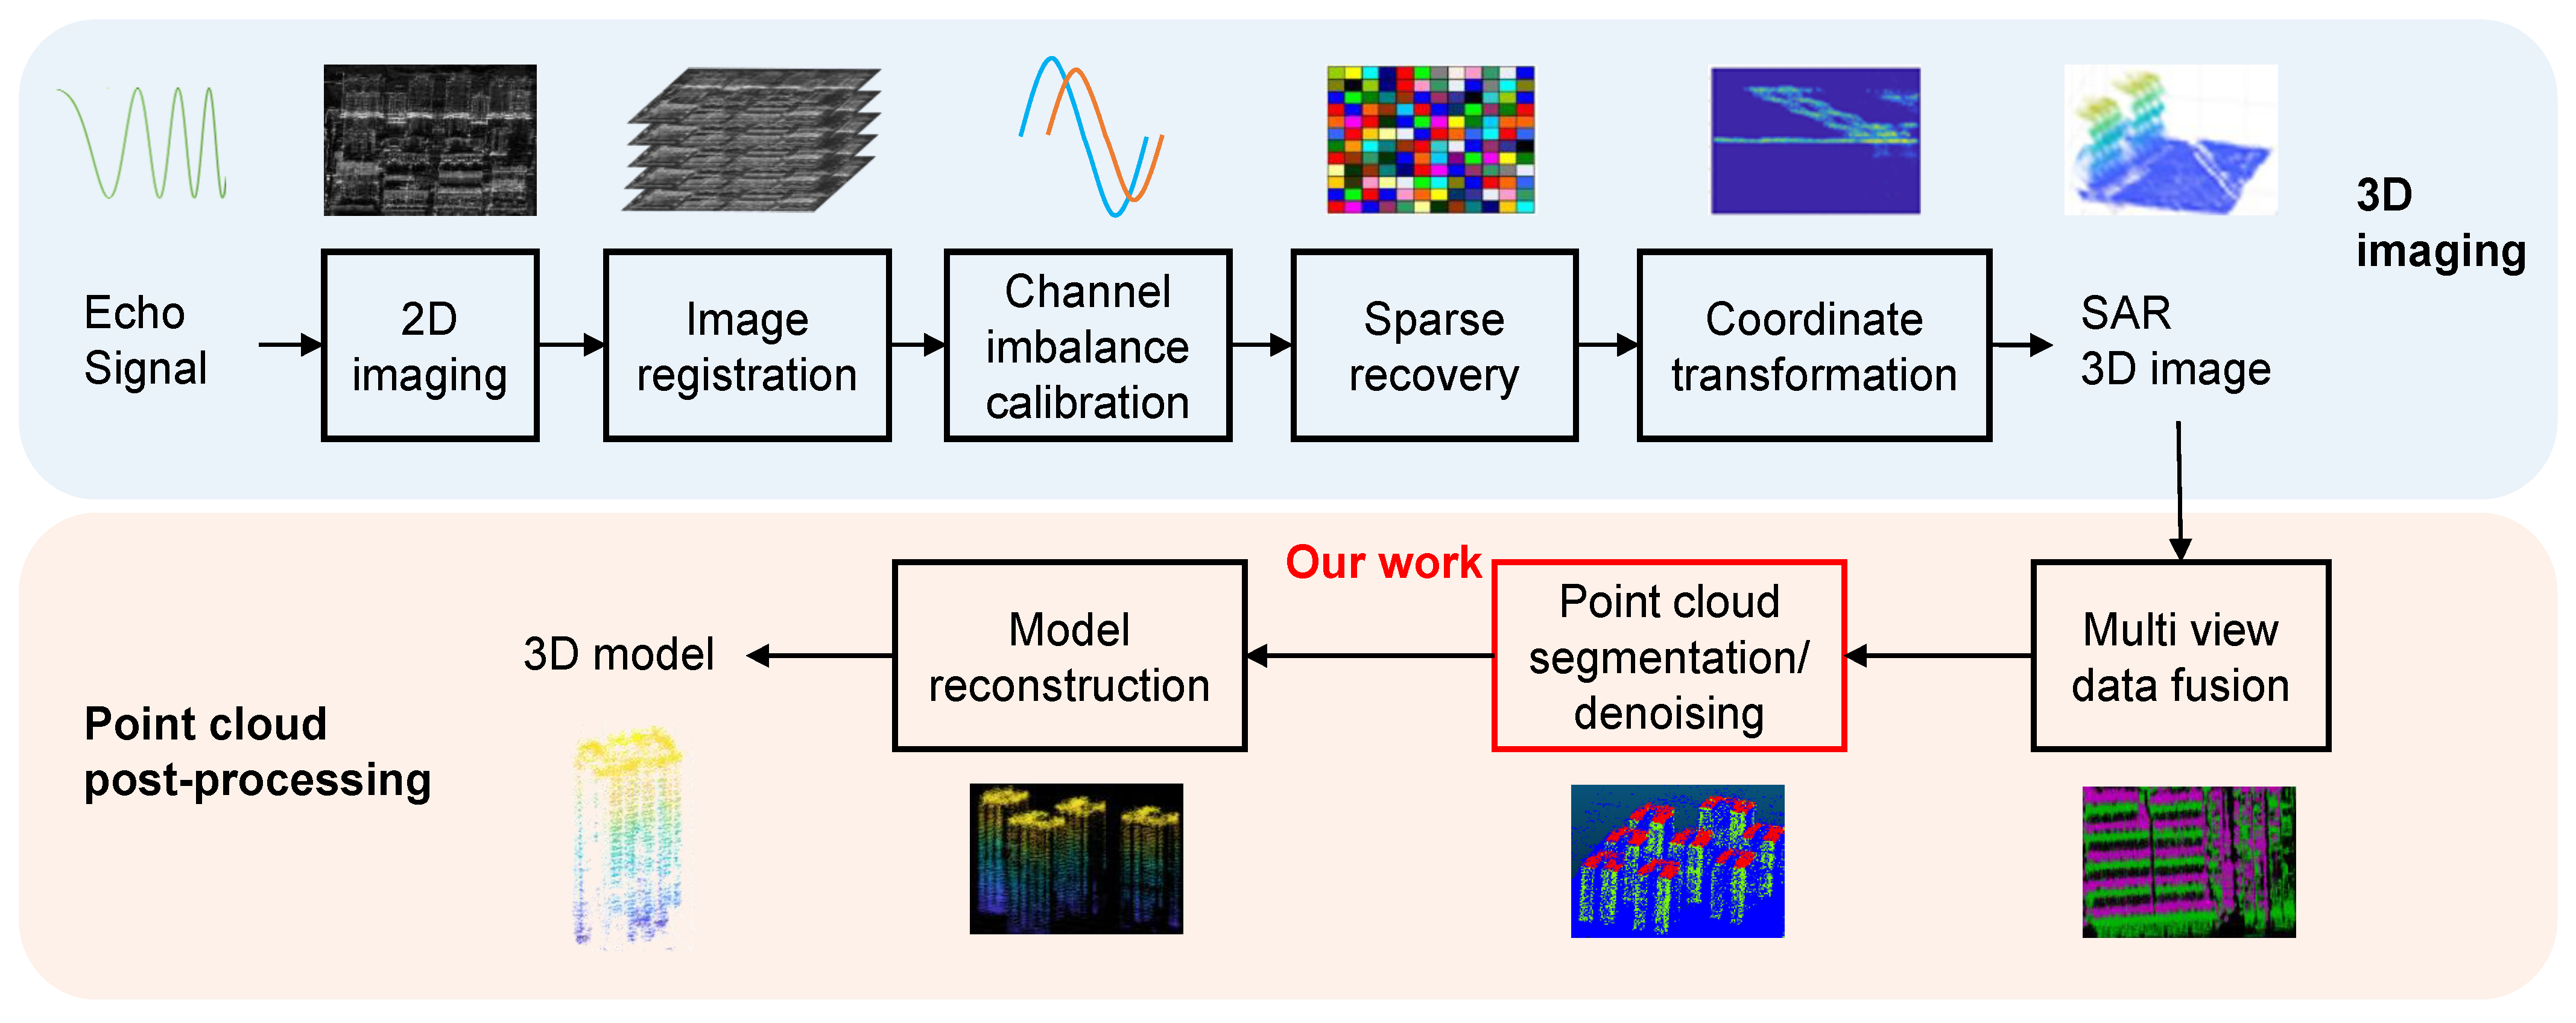
Figure 7. Following the operational workflow depicted in
Figure 2, the obtained 3D point cloud, shown in
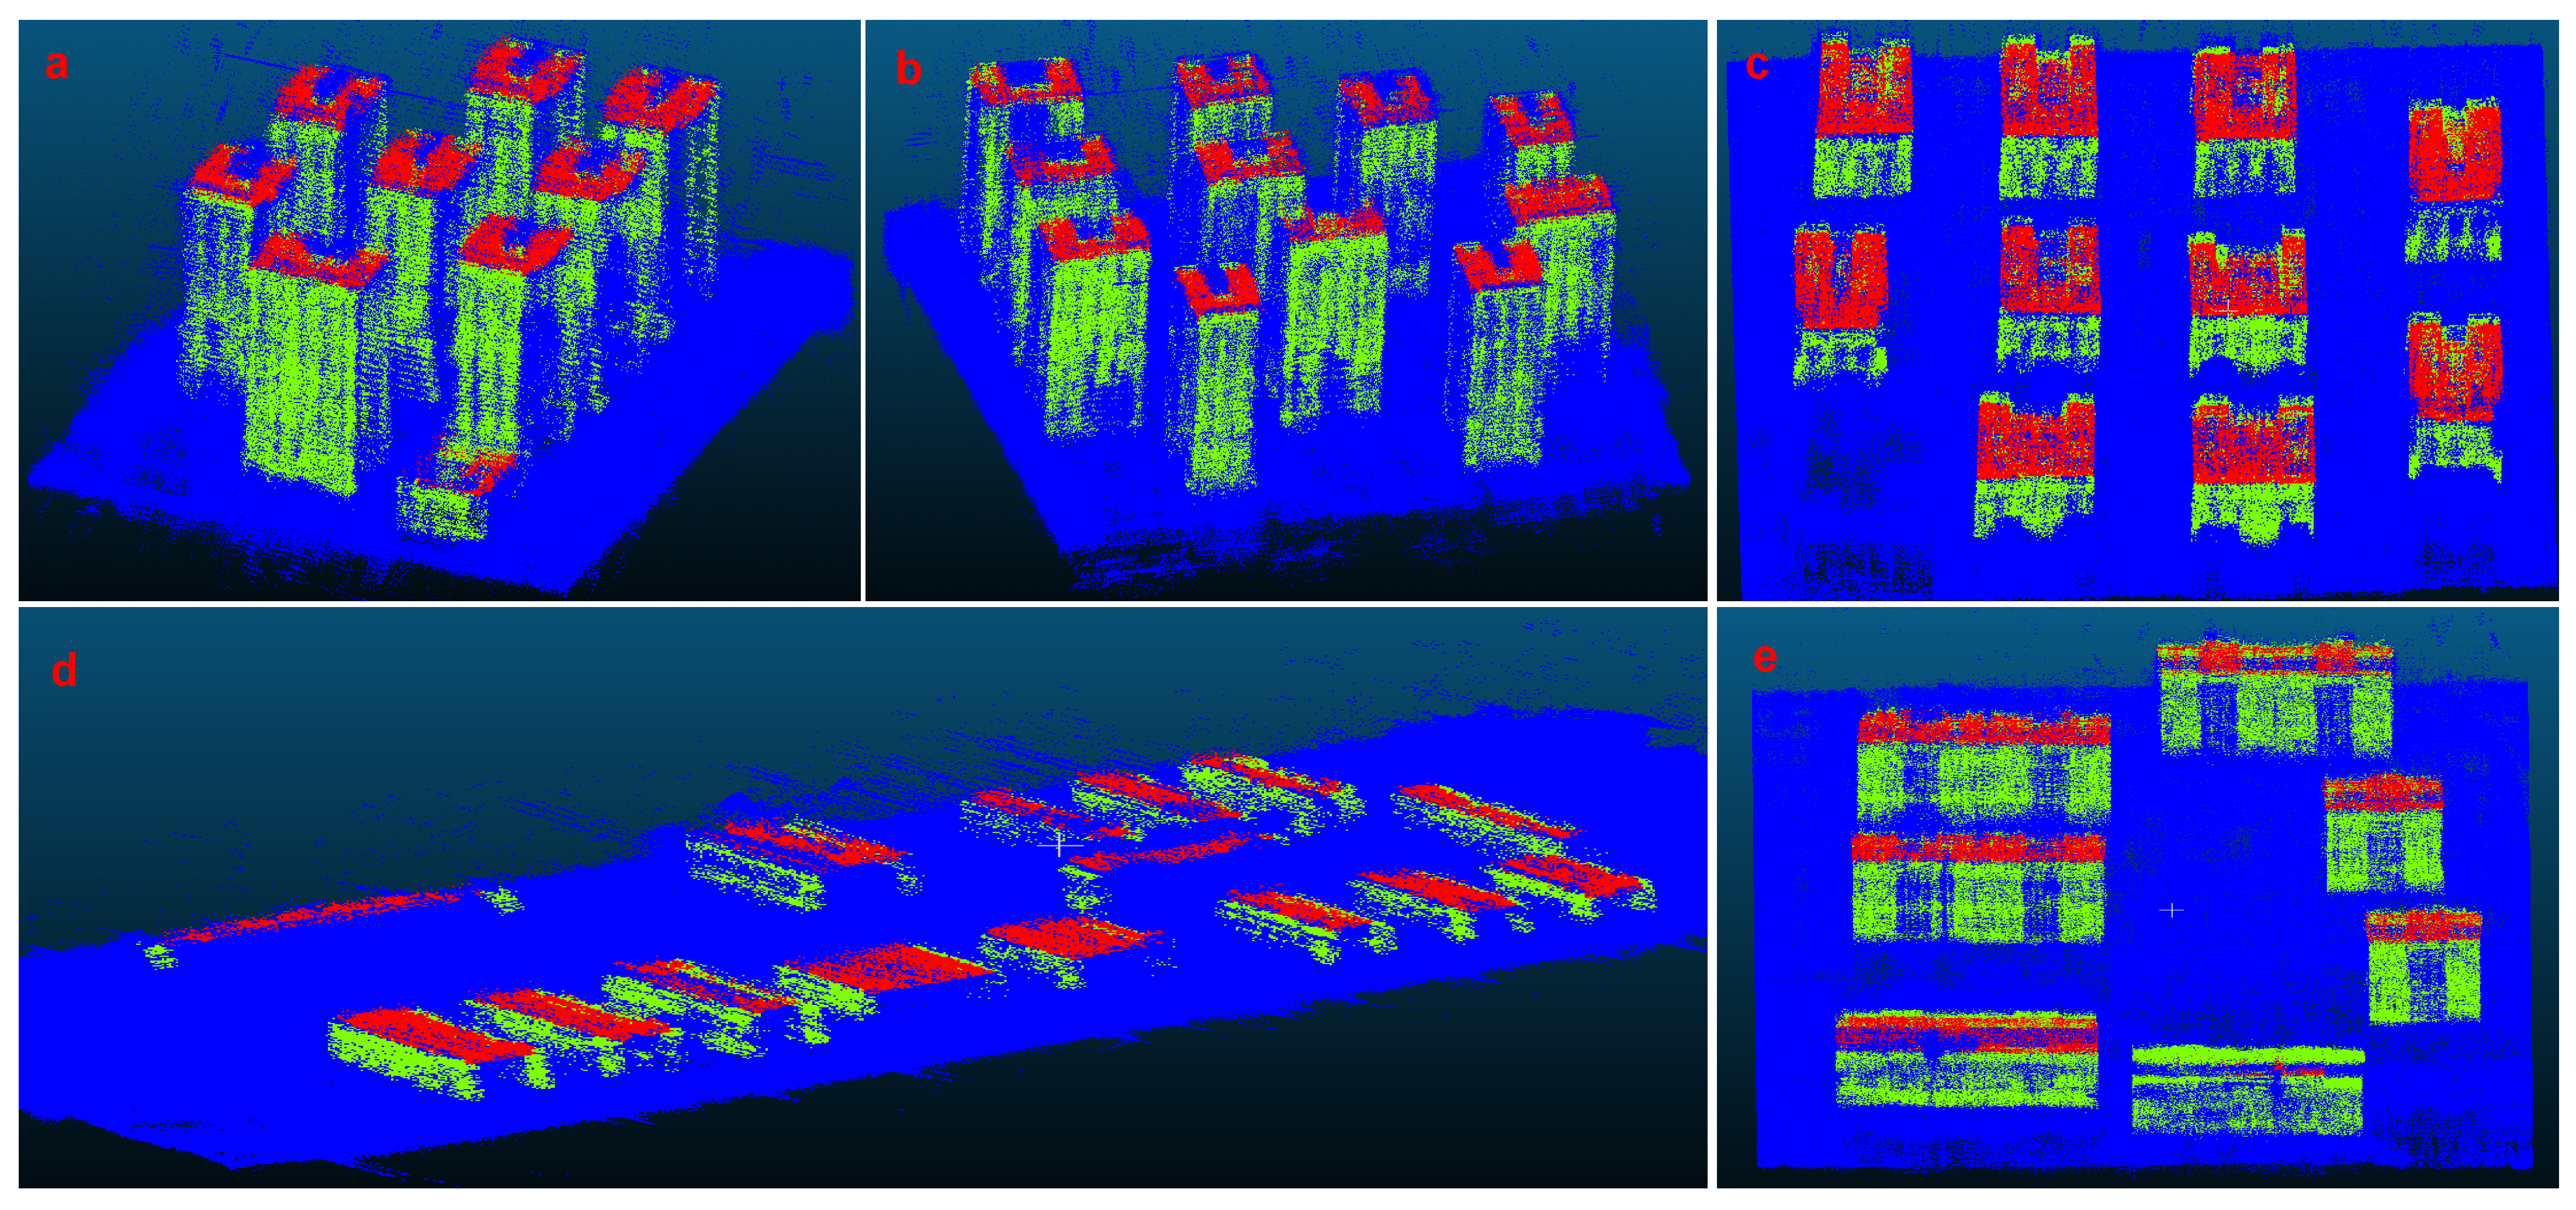
Figure 8, has a resolution of 0.3 m × 0.3 m × 3 m. The dataset includes various types of buildings, such as regular architectural clusters, low-rise buildings, and taller structures.
To manually annotate building targets in the SAR 3D point cloud, we set three target categories: building facades, roofs, and non-building. A total of 69 building targets were obtained, and the dataset contains a total point cloud count of 10.35 million, with over 3.45 million points in the building category. The dataset was divided into a training set and a test set with an 80–20% split. Due to the large scale and size of 3D point cloud data, random segmentation and sampling are necessary when inputting the model. A 10 m × 10 m area on the ground is selected as a segmentation block, and each block contains at least 2000 point clouds. Within each segmentation block, data dimensions are normalized, and then random sampling is performed to obtain 4096 points (blocks with fewer than 4096 points are oversampled) as an input sample. Using this method, a total of 2525 training samples and 1501 test samples were obtained.
4.2. Experimental Setup
In the experiment, the proposed network was trained using cross-entropy loss with LSR and the Adam optimizer. The initial learning rate was set to , and it was reduced by half every 20 epochs, with a minimum learning rate of . The initial momentum was set to 0.9, and it was adjusted periodically along with the learning rate, with a minimum value of 0.001. To address the issue of sample imbalance in the point cloud, loss weight values were set based on the point cloud count ratio of the three target classes: non-building points, building facade points, and building roof points, with a weight ratio of 1:2:10. The batch size for each epoch was set to 16. The experiments were conducted using an Nvidia RTX 4000 GPU with 24 GB of memory and the deep learning framework PyTorch 1.8.0 with CUDA 10.2 support.
In our model, the number of sampling centers for the four set abstraction layers was set to 1024, 256, 64, and 16, and the number of neighboring points (k) for each sampling center was set to 32. As the network’s depth increased, the feature receptive field continuously expanded, with respective normalized sizes of 0.1, 0.2, 0.4, and 0.8 relative to the input scale. By reducing the number of sampling centers and continuously increasing the feature receptive field, the model captures multi-scale local neighborhood features and global features.
4.3. Comparison with Other Methods
In this section, we compare the proposed method with traditional approach, classic point cloud networks in deep learning like PointNet and PointNet++, as well as the latest Point Transformer method that combines the transformer with point cloud networks. The traditional approach, as referenced in [
13,
14,
15], initially involves filtering the SAR point cloud, where points with lower scattering coefficients are labeled as noise and subsequently removed. Then, the point cloud is projected onto the two-dimensional ground plane, and a density threshold method is employed to extract building facades. Subsequently, seed points are determined from higher elevation points in the building facades, and 3D region growing procedure is performed based on height-constrained surface normal similarity to obtain roof point clouds. It is important to note that traditional methods rely on manually set thresholds (such as density threshold, height constraint threshold, normal vector deviation angle threshold) and the grid size used during the projection onto the two-dimensional ground plane. The extraction results and efficiency are closely tied to the experience and processing techniques of the operator and require adjustments according to different scenarios.
4.3.1. Qualitative Evaluation
Figure 9 displays the manually annotated ground truth for three groups of data along with the point cloud segmentation results obtained using different methods. In the ground truth shown in
Figure 9, there is some annotation error, particularly at building corners and edges (as evident in groups a and c). Given the characteristics of SAR point clouds, such errors are inevitable within the overall dataset. Therefore, it is crucial to consider the impact of these errors within the methods, as demonstrated by the LSR and F1 Score in the proposed method.
In
Figure 9, the top view of the traditional method reflects the approximate outline of the buildings. However, it exhibits several gaps and poor continuity in the extracted facades, which are associated with the selected grid size. Smaller grid size result in gaps, while larger grid size introduce errors. The extracted roof points are influenced by height constraints, and these constraints need to be adjusted based on different scenarios. Furthermore, the traditional method is susceptible to misidentifications caused by multiple scatterings and height ambiguity. Eliminating these influences requires further manual determination of building bottom and roof heights. In the case of low-rise buildings, the traditional method’s segmentation performance is suboptimal.
In deep learning methods, PointNet can extract building facade and roof information, but it still has issues with boundary omissions and subpar segmentation of low-rise buildings. PointNet++ somewhat mitigates these problems and achieves recognition performance comparable to PFA-Net.
Section 4.3.2 will present a detailed comparison between the two, including quantitative evaluations and additional result details. Its performance in terms of overall building recognition integrity is not satisfactory. As for Point Transformer, it delivers better segmentation results on certain buildings (like group c), but its robustness is lower. This is because transformers typically require a substantial amount of training data to achieve a high-performance level and generalization capability, which is a challenge in SAR point cloud tasks. PFA-Net combines the capabilities of PointNet++ and transformers, maintaining the completeness of building structures while reducing noise. The segmented facades and roof structures are more compact with PFA-Net. What is remarkable is that PFA-Net’s segmentation results effectively mitigate manual annotation errors, reflecting the true structures of buildings.
4.3.2. Quantitative Evaluation
The experiment includes two classes of targets: building facades and roofs.
Table 2 presents the performance metrics of different methods. To facilitate a more effective comparison,
Figure 10 reflects the overall performance of different methods in the task.
In the performance comparison, traditional methods lag behind deep learning methods across various metrics. One reason for this is the introduction of some noise errors when manually annotating the ground truth, and traditional methods have a low tolerance for noise. This leads to differences between the results of traditional methods and the ground truth. However, existing research on whether scatter points around buildings are noise points is still unclear. Therefore, for some scatter points with small scattering coefficients distributed around buildings, they cannot be simply regarded as noise points. In this work, we chose to retain this part of the information, and further research can focus on recognizing and handling these points.
Among the deep learning methods, PointNet exhibits poor performance due to the limitations of its single-scale features, and its performance will continue to decrease as the scale of the point cloud expands. PointNet++ performs the best in terms of Precision for facades. Point Transformer has strong feature extraction capabilities, but due to the limited size of the dataset, the overall performance of Point Transformer is lower than that of PointNet++. PFA-Net consistently performs at a higher level across all metrics, with F1 Score being the best among all methods. Combining the qualitative evaluation results, it is evident that PFA-Net retains the powerful multi-scale feature extraction capability of PointNet++, while also incorporating the local feature extraction and aggregation capabilities of the transformer into the model, achieving more effective integration and extraction of both local and global features.
In the quantitative evaluation, PointNet++ performs the best in terms of Precision for facades, with its F1 Score also close to that of PFA-Net. A more detailed comparison between PointNet++ and PFA-Net is presented in
Figure 11. PointNet++ performs well in identifying the overall areas of buildings, which leads to its metrics being close to those of PFA-Net. However, it demonstrates less robustness at building boundaries, bottoms, and in high noise environments, leading to missed alarms (omissions) and false alarms (introducing additional noise). This indicates that PointNet++ performs less stably with poor-quality SAR point cloud data compared to PFA-Net, which accurately recognizes both the entirety and details of buildings. This is further illustrated in
Figure 10, where PointNet++ shows more dispersed metric distributions, highlighting its lower robustness and less effective extraction of structural and electromagnetic scattering features from SAR architectural point clouds.
In the comprehensive performance comparison on the test set, PFA-Net demonstrates a more concentrated distribution of various data metrics, and they are generally at a higher level. Solely relying on Acc and IoU metrics, PointNet++, Point Transformer, and PFA appear to have similar performance. However, in the qualitative comparison, PFA outperforms the others. This suggests that using only Acc or IoU metrics may not fully capture the performance differences between different algorithms. In contrast, the F1 Score used in this study aligns better with the qualitative evaluation results. As discussed in
Section 3.3, the F1 Score reflects the model’s overall performance in terms of both Recall and Precision, emphasizing its classification capabilities. Therefore, it is more suitable for SAR point cloud segmentation tasks.
4.4. Ablation Study
In the ablation experiments, we aim to explain the impact of different feature dimensions on point cloud segmentation while also highlighting the roles and values of various components in the proposed model.
4.4.1. Ablation Analysis of Multidimensional Features in SAR Point Clouds
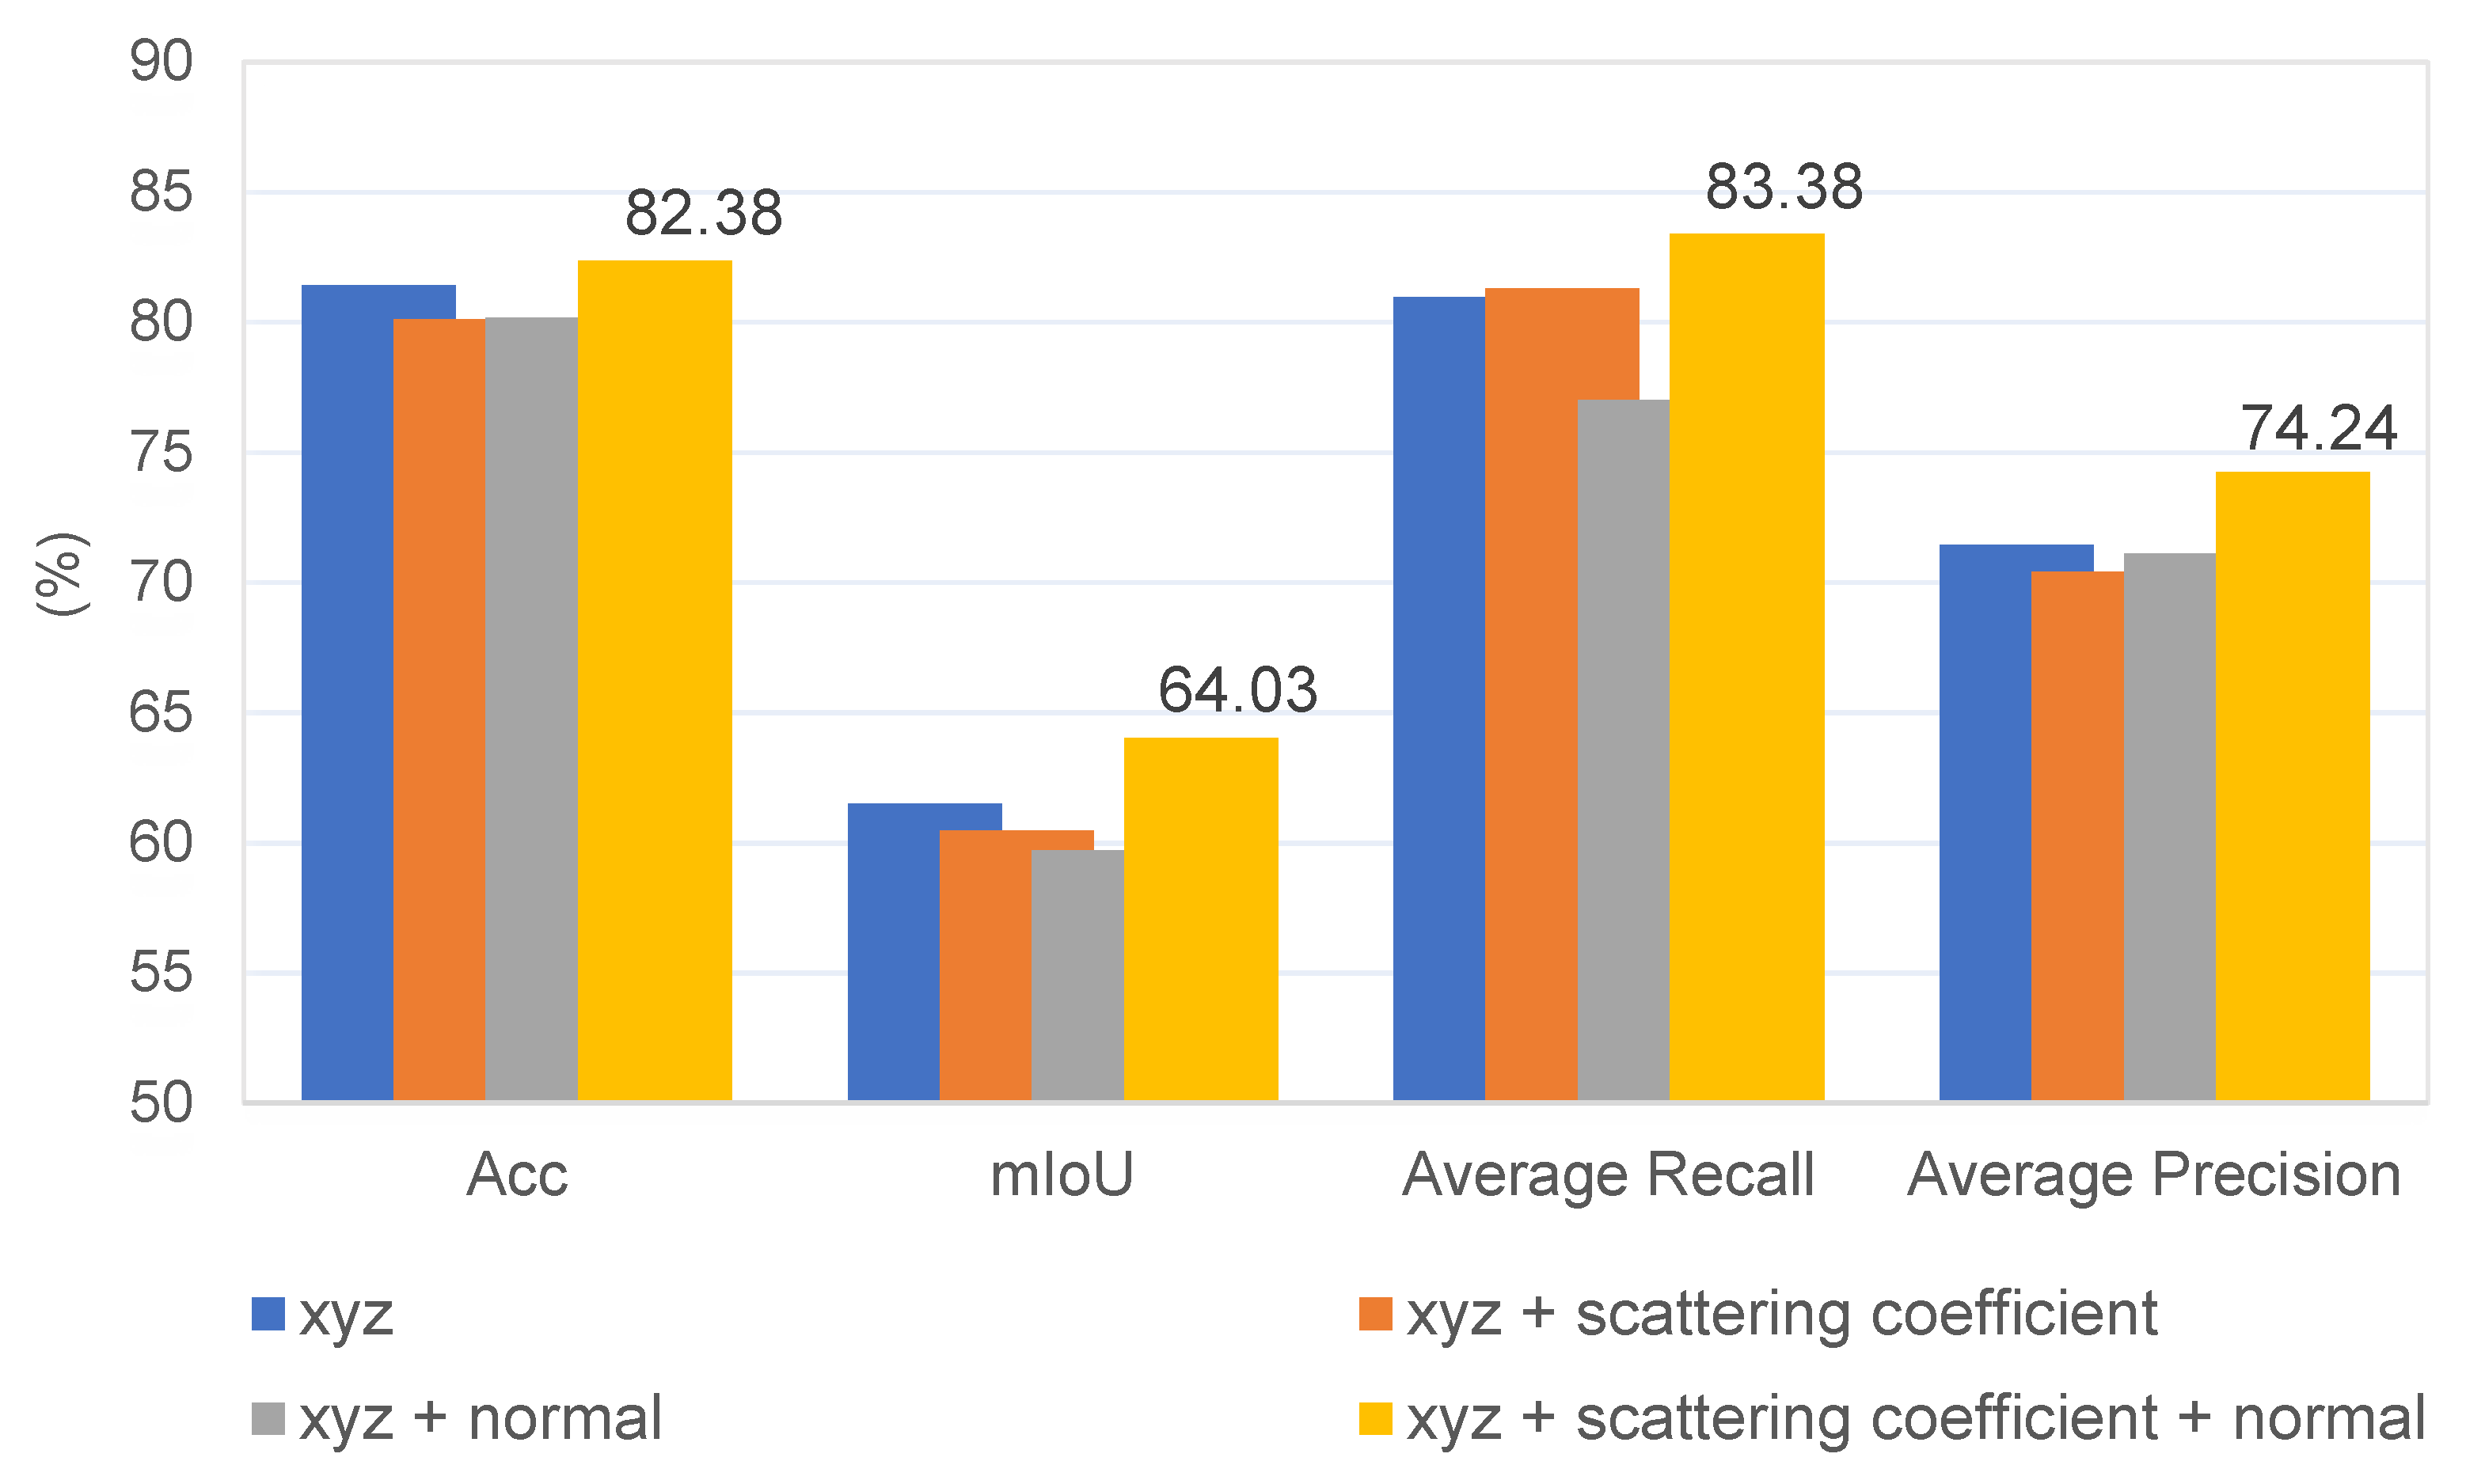
In the experiment, the input data consist of seven dimensions, including three-dimensional coordinates, scattering coefficients, and three-dimensional normal vectors. In order to analyze the impact of scattering coefficients and SAR point cloud normal vector features on model performance, this section conducts an ablation analysis on multi-dimensional features. Since the feature transformer module in PFA-Net is designed for features beyond the three-dimensional coordinates of SAR point clouds, studying the impact of multi-dimensional features using PFA-Net would be unfair. Therefore, we use PointNet++ as the baseline, and changes are made only to the input data dimensions. The comparative results of the experimental metrics are shown in
Figure 12. The PointNet++ network that uses only three-dimensional coordinate information performs well. Adding either the scattering coefficient or normal vector features alone causes a decrease in model performance, especially when adding the normal vector feature, which has a significant impact on mIoU and Recall. However, when both features are added, the model’s performance is improved, achieving the best results.
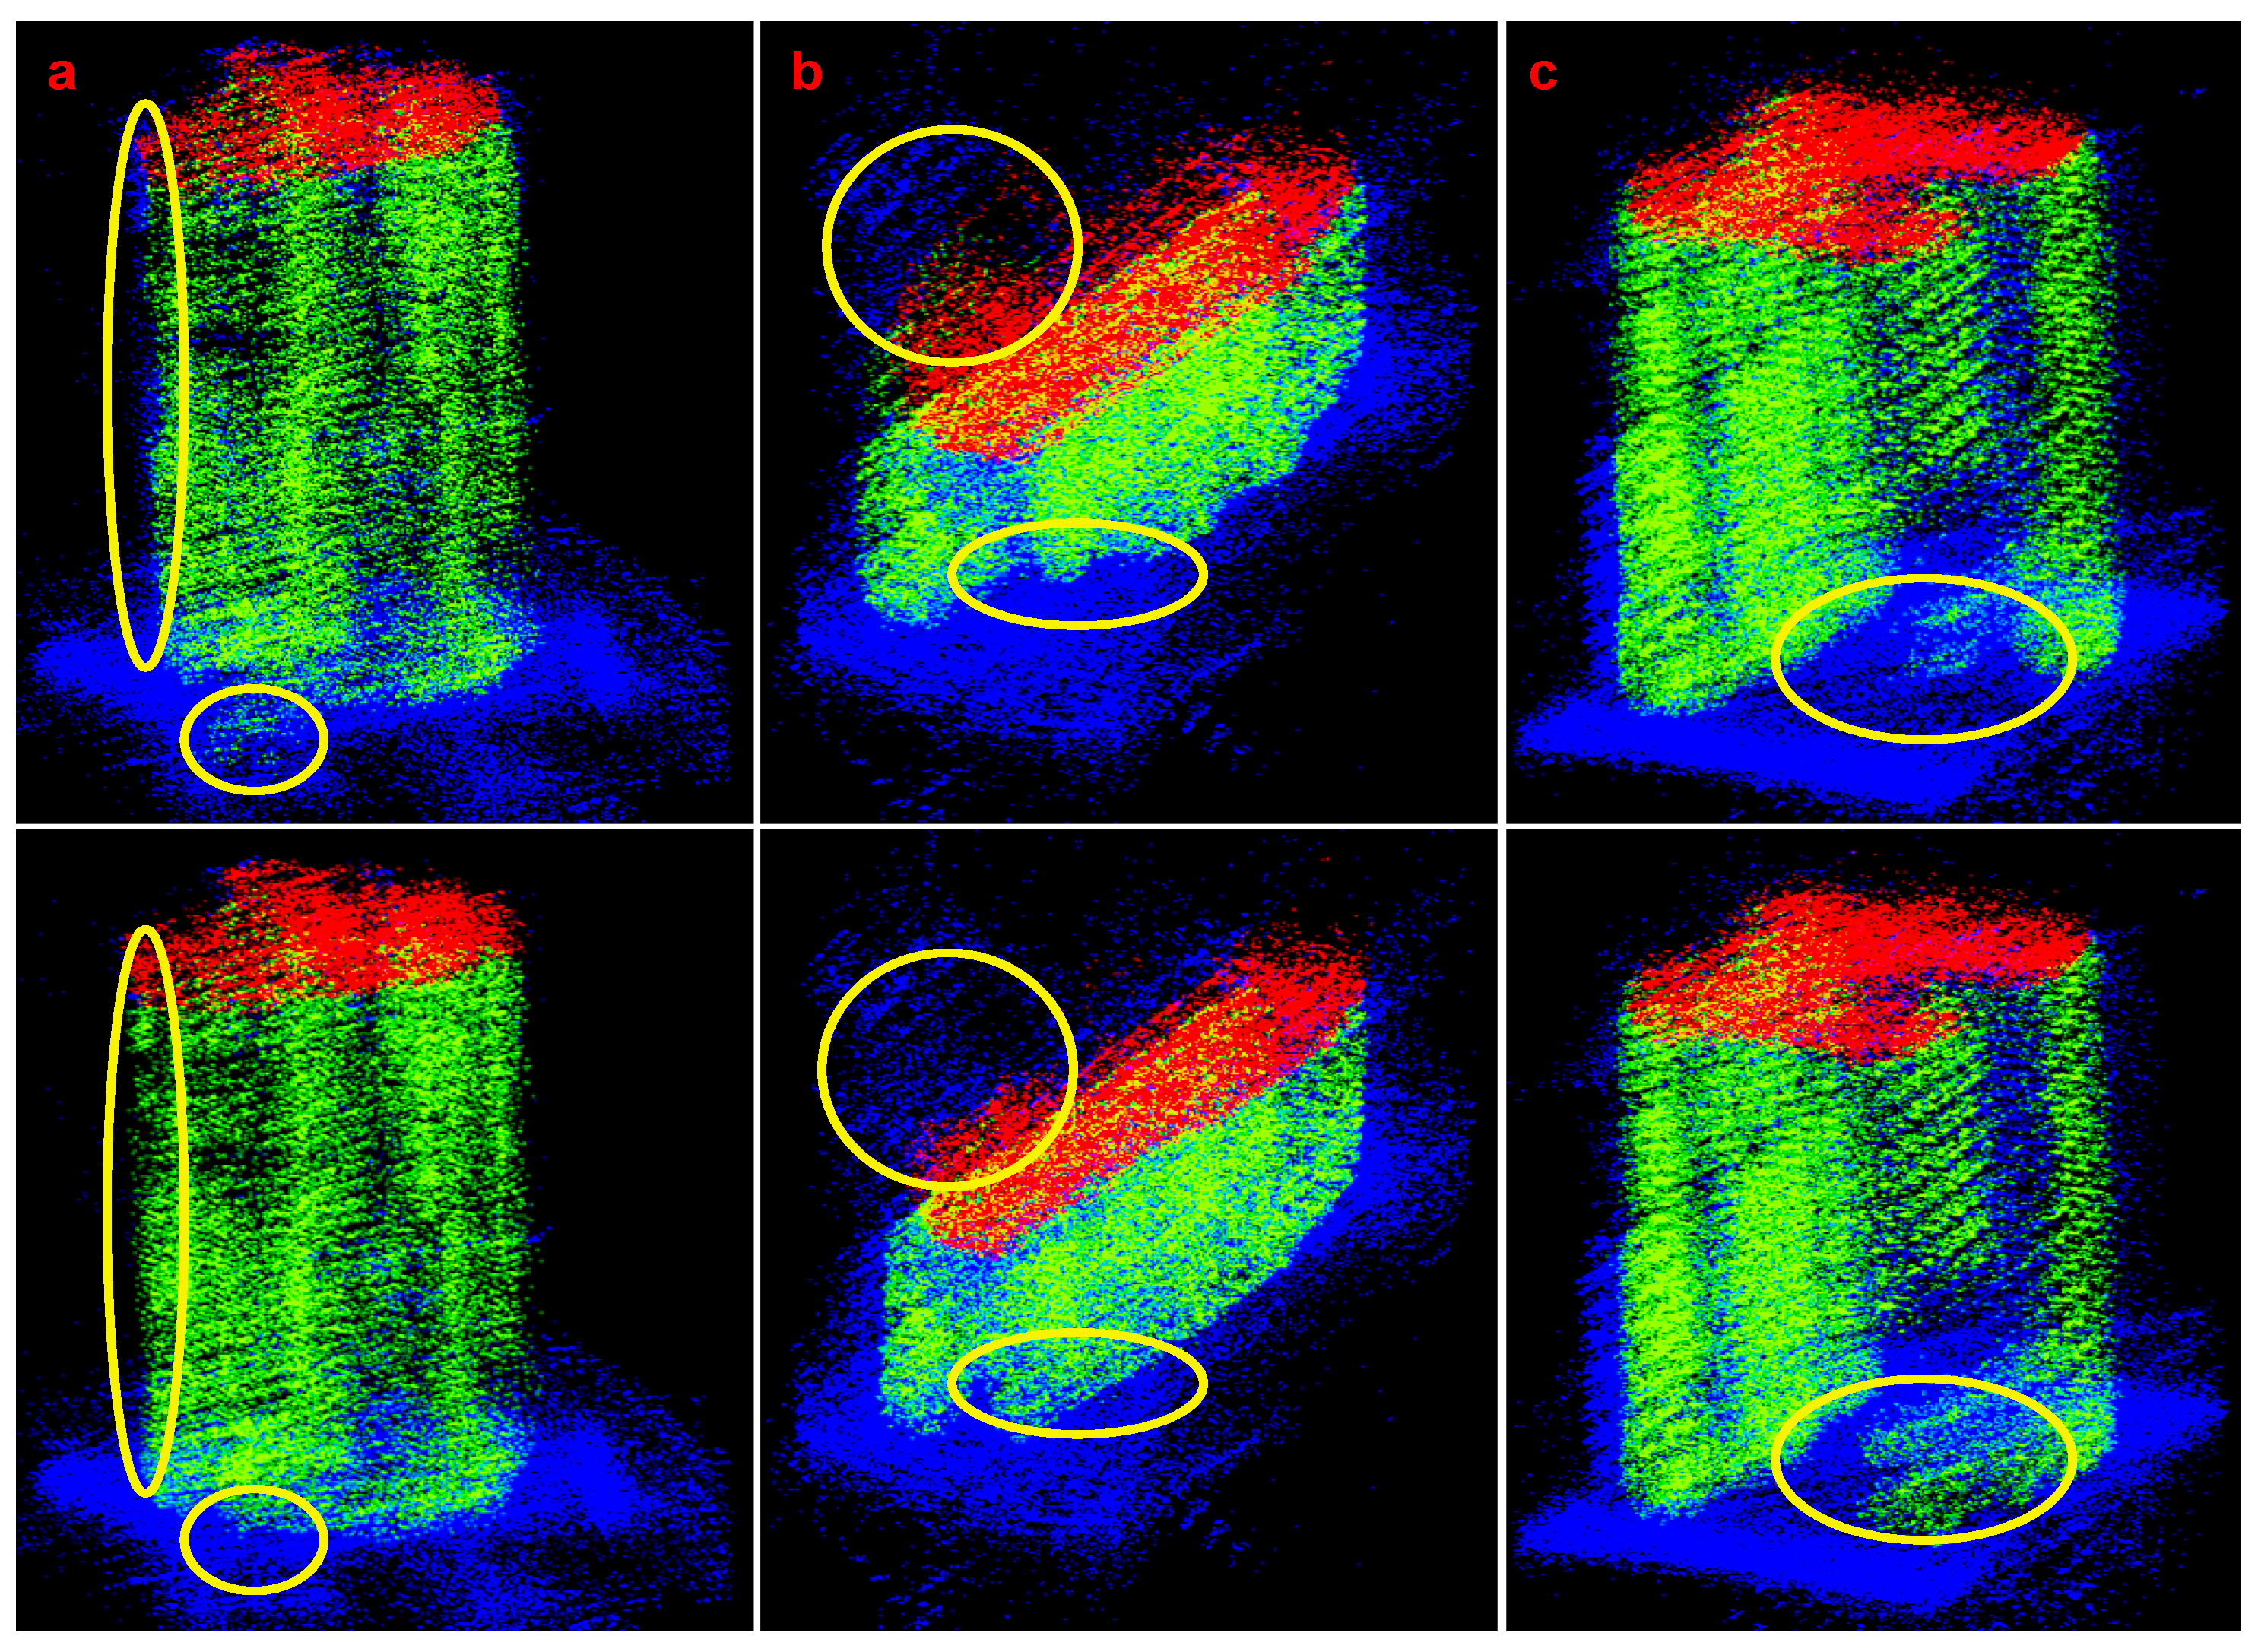
To further analyze,
Figure 13 shows the segmentation errors for different-dimensional input data. When using only the three-dimensional coordinate information, the recognition performance in boundary areas is poor, and there are more misclassifications on the roofs. Adding the scattering coefficient feature identifies some points around the buildings, but it misses some regular structures within the high-rise building facades. This is because some of the points on the outer sides of the buildings are manual annotation errors, and the scattering coefficient inside the facades is small. Adding the scattering coefficient feature helps identify this part of the structure, but it also introduces additional misclassified points, particularly in areas with slow variations in the scattering coefficient. When adding the scattering coefficient feature, it recognizes some points around the buildings. Some of these points are due to errors in manual labeling. The inclusion of the scattering coefficient feature is helpful in recognizing these structures. However, it misses some regular structures within the high-rise building facades because the scattering coefficient within the facades is generally small. Additionally, the slow variation of the scattering coefficient in the vicinity of lower buildings introduces additional misclassified points. When adding the normal vector feature, it disrupts the recognition of the original structure, especially in the case of low and complex buildings. This is because the normal vectors of SAR point clouds are influenced by height resolution and tend to point upwards or downwards in regular structures. When regular structures are affected by noise or are partially missing in certain areas, it can interfere with the normal vectors, thereby affecting the Recall of the model.
Adding both scattering coefficient and normal vector features simultaneously complements their effects, resulting in the optimal recognition of the model and, to some extent, the correction of manual annotation errors.
4.4.2. Model Components Analysis
PFA-Net consists of three main components: positional encoding block, feature transformer module, and attention pooling. In this section, we conducted an ablation analysis on these three components, and the experimental results are shown in
Table 3. When only the positional encoder is used in PFA, it degenerates into PointNet++. At this point, the input data include SAR point cloud scattering coefficients and normal vector features, leading to relatively good performance.
When only the feature transformer module is used, the model’s performance significantly deteriorates. The feature transformer in PFA-Net is different from the Point Transformer. In the Point Transformer, self-attention calculations are performed for all points in a set abstraction layer, followed by sampling and grouping. In contrast, PFA-Net first performs sampling and grouping, then calculates self-attention only for points within the local neighborhood set. It reduces the computational load, but due to the limitation of the training data scale, using only feature transformer module cannot adequately extract relevant features from the local neighborhood point set. The feature transformer module in PFA-Net integrates features from the position encoding block, allowing it to more effectively extract local neighborhood features under the constraints of the position encoding block.
Attention pooling focuses on more relevant features and results in a weighted sum of the original feature set, making it more suitable for aggregating features compared to max pooling. In
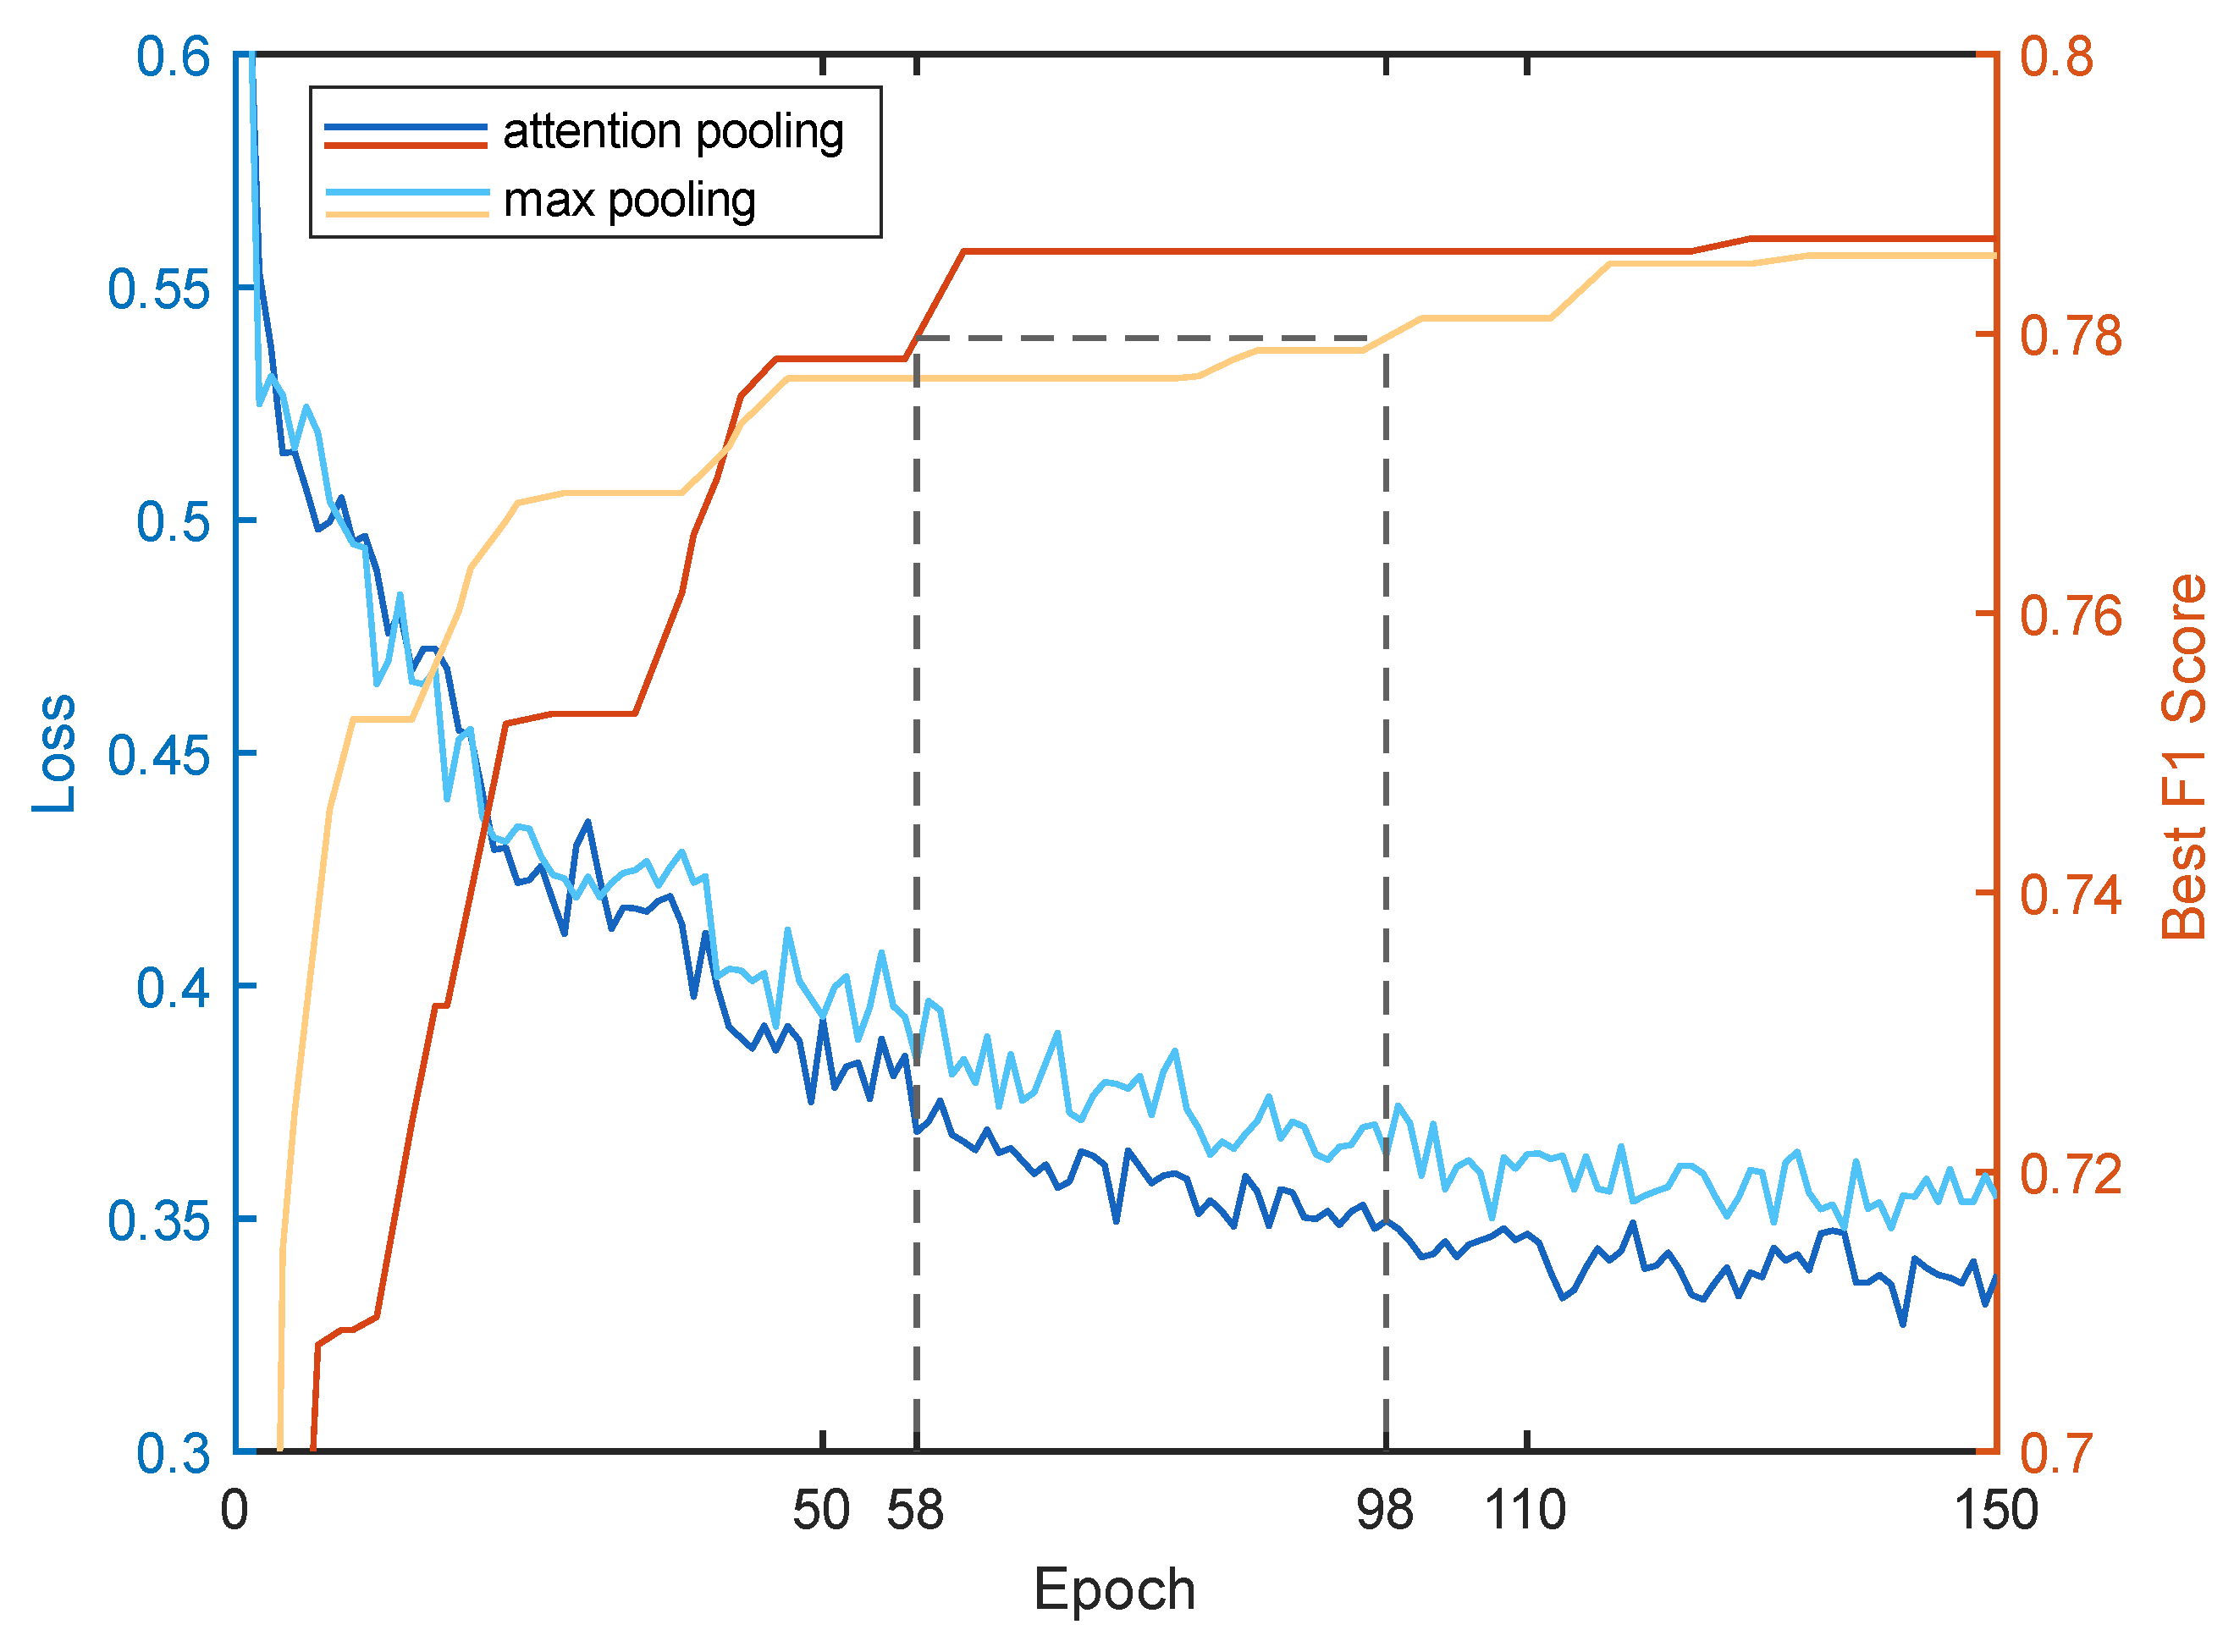
Table 3, the performance difference between using attention pooling and max pooling is minimal. Further analysis of the model’s training process before and after using attention pooling, including loss and the best F1 score of the test dataset, is shown in
Figure 14. It can be observed that, with the use of attention pooling, the model converges to a lower loss value and a higher best F1 score. Although the final best F1 Score level is not significantly different, attention pooling’s superior feature aggregation capability results in faster convergence. It achieves the same best F1 Score level around 30 epochs faster and reduces training time by approximately
.
4.5. Time and Space Complexity Analysis
This section analyzes the time and space efficiency of the proposed method to elucidate the sacrifices made to enhance performance. The model sizes and training time costs for each network are shown in
Table 4. Due to the inclusion of the feature transformer module in PFA-Net, there is a slight increase in complexity compared to PointNet++. Sacrifices are made in terms of both model space and time complexity, but the performance improvement obtained is detailed in
Section 4.3.
It is worth noting that PFA-Net has significantly reduced model size and training time compared to Point Transformer. Point Transformer requires attention calculations for all points within a set abstraction layer, resulting in a large number of points in one token, which consumes substantial space and computational time. In contrast, PFA-Net uses a token size equal to the local neighborhood point set size (set as 32 in this paper), and the input feature size corresponds to the sampling of central points in the feature layer. This input size is only 1/4 of the total number of points in that layer (the down-sampling rate between two set abstraction layers is set to 1/4), leading to significant savings in space and time costs.
5. Discussion
PFA-Net is built based on the PointNet++ framework, which is relatively simple and performs well in this task, but it does not consider the characteristics of SAR point clouds, limiting its performance. The Transformer and attention mechanism possess strong feature extraction capabilities, surpassing MLPs in extracting SAR point cloud features like normal vectors and scattering coefficients. However, Transformer-based networks often require large amounts of training data to converge. Hence, we retained the MLP from PointNet++ as the feature extraction foundation, integrating transformer structure only for local feature extraction to enhance performance. PFA-Net is simple and considers the unique properties of SAR point clouds, saving computational resources while extracting target features efficiently, making our model more suitable for SAR point cloud processing.
The F1 Score, though common in deep learning, has seldom been applied to SAR point cloud segmentation. This paper demonstrates through analysis and experimentation that the F1 Score is more suitable as an evaluation metric for this task. This is because we aim to predict the target points belonging to buildings as accurately as possible while minimizing the misidentification of non-building points as building points. This characteristic aligns well with the F1 Score. In the quantitative evaluation of results from different algorithms, there is little difference in the F1 Score for building facades between PointNet++ and PFA-Net (PFA-Net outperforms PointNet++ by 0.2). However, in qualitative evaluation, the differences between algorithms can be more intuitively observed. Therefore, further research in SAR point cloud processing could explore and identify more appropriate evaluation metrics.
According to the analysis of feature ablation experiments, adding one-dimensional feature information introduces a constraint to the model. The scattering coefficient feature and the normal vector feature introduce constraints related to electromagnetic scattering characteristics and geometric features of buildings. Under these constraints, the model removes points that do not meet the feature constraints and adds points that conform to the constraints to enhance its performance. However, the impact of adding feature constraints to the model’s performance is a double-edged sword, and introducing a single constraint may lead to a decline in performance, as shown in the experiments.
Our work also has some limitations. Because of the side-view imaging of airborne array-InSAR, complete SAR point clouds require the fusion of data from multiple viewing angles. In our experiments, we used data from two viewing angles (north and south), which led to the absence of east-west building facades. One way to address this issue is to use SAR point clouds that are fused from multiple perspectives, and our method is also applicable to this extended scenario. Furthermore, due to the limited quantity of SAR point cloud data, there is still significant potential for the development of deep learning models. With the increasing availability of SAR 3D point cloud data, the multi-scale feature extraction capabilities and robustness of PFA-Net can be further enhanced.
6. Conclusions
This paper summarizes the data characteristics of SAR point cloud data and proposes a point cloud segmentation network called PFA-Net that combines positional feature encoding with a lightweight feature transformer module. PFA-Net enhances feature extraction capabilities and improves feature aggregation efficiency through attention pooling. In ablation experiments, the roles of the various components of the model are validated. PFA-Net not only surpasses traditional algorithms and some deep learning methods but also, to some extent, corrects manual annotation errors. We have explored the impact of multidimensional features in SAR point clouds on point cloud segmentation tasks. The experiments indicate that adding an additional feature dimension is equivalent to introducing a constraint on the model. Due to the characteristics of SAR point clouds, the introduction of a single-dimensional feature can have both positive and negative effects on improving specific aspects of model performance. However, combining different features allows the model to harness the advantages of each feature, leading to optimal performance.
We also explore the impact of multidimensional features in SAR point clouds, which is one of the significant advantages and potentials of SAR point clouds. In addition to the scattering coefficient and normal vector features used in this paper, SAR point clouds also possess polarization, multi-angle, and multi-frequency features, among others. Leveraging features from different dimensions to constrain the model can enhance its robustness and overall performance. In the future, this research can expand from the segmentation and recognition of buildings to other targets such as vehicles, roads, and beyond. The study of deep learning in SAR point cloud post-processing will gradually reveal substantial application value.
