Automated Crop Residue Estimation via Unsupervised Techniques Using High-Resolution UAS RGB Imagery
Abstract
1. Introduction
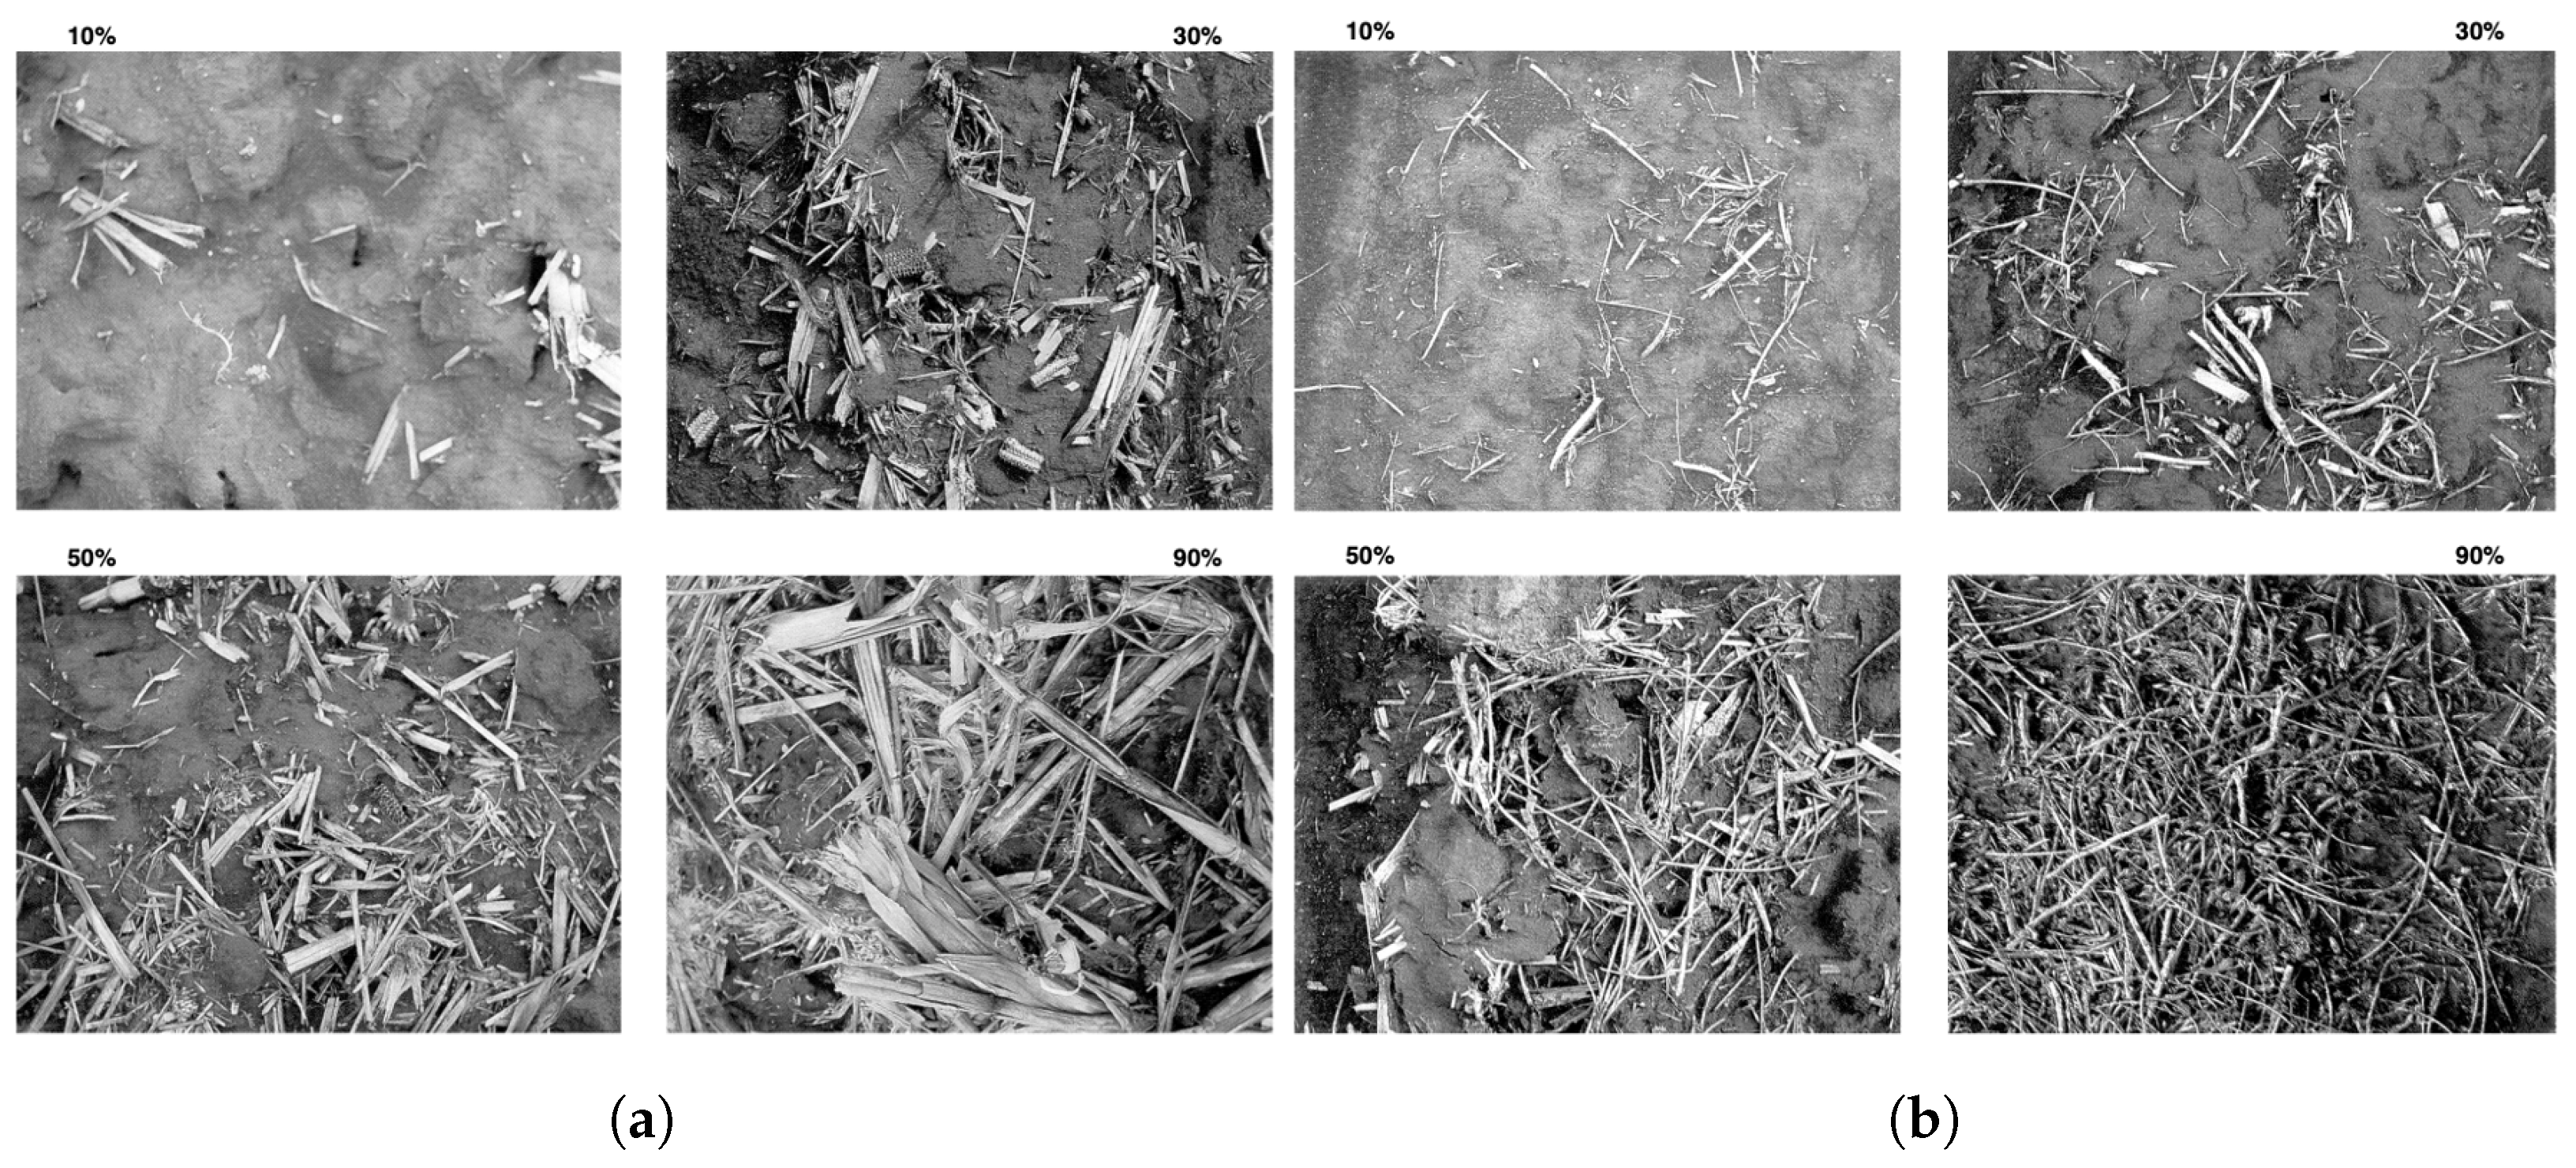
- Intensive or conventional tillage leaves less than 15% CRC or fewer than 500 pounds per acre (560 kg/ha) of crop residue. Intensive tillage disturbs all the soil by involving multiple operations with implements such as a moldboard, disk, or chisel plow.
- Strip-tillage merges the benefits of conventional tillage with the soil-protecting advantages of no-till by mixing up only the portion of the soil that contains the seed row (about one-third of the row width).
- No-till aims to achieve a 100% CRC, leaving most of the soil undisturbed. In this practice, the only disturbance between harvest and planting is nutrient injection (https://www.extension.purdue.edu/extmedia/ct/ct-1.html, accessed on 21 March 2024).
2. Study Region and Data
2.1. Study Region
2.2. Data
2.2.1. Field Measurements/Line-Point Transect Method
2.2.2. Global Positioning System (GPS) Survey Data
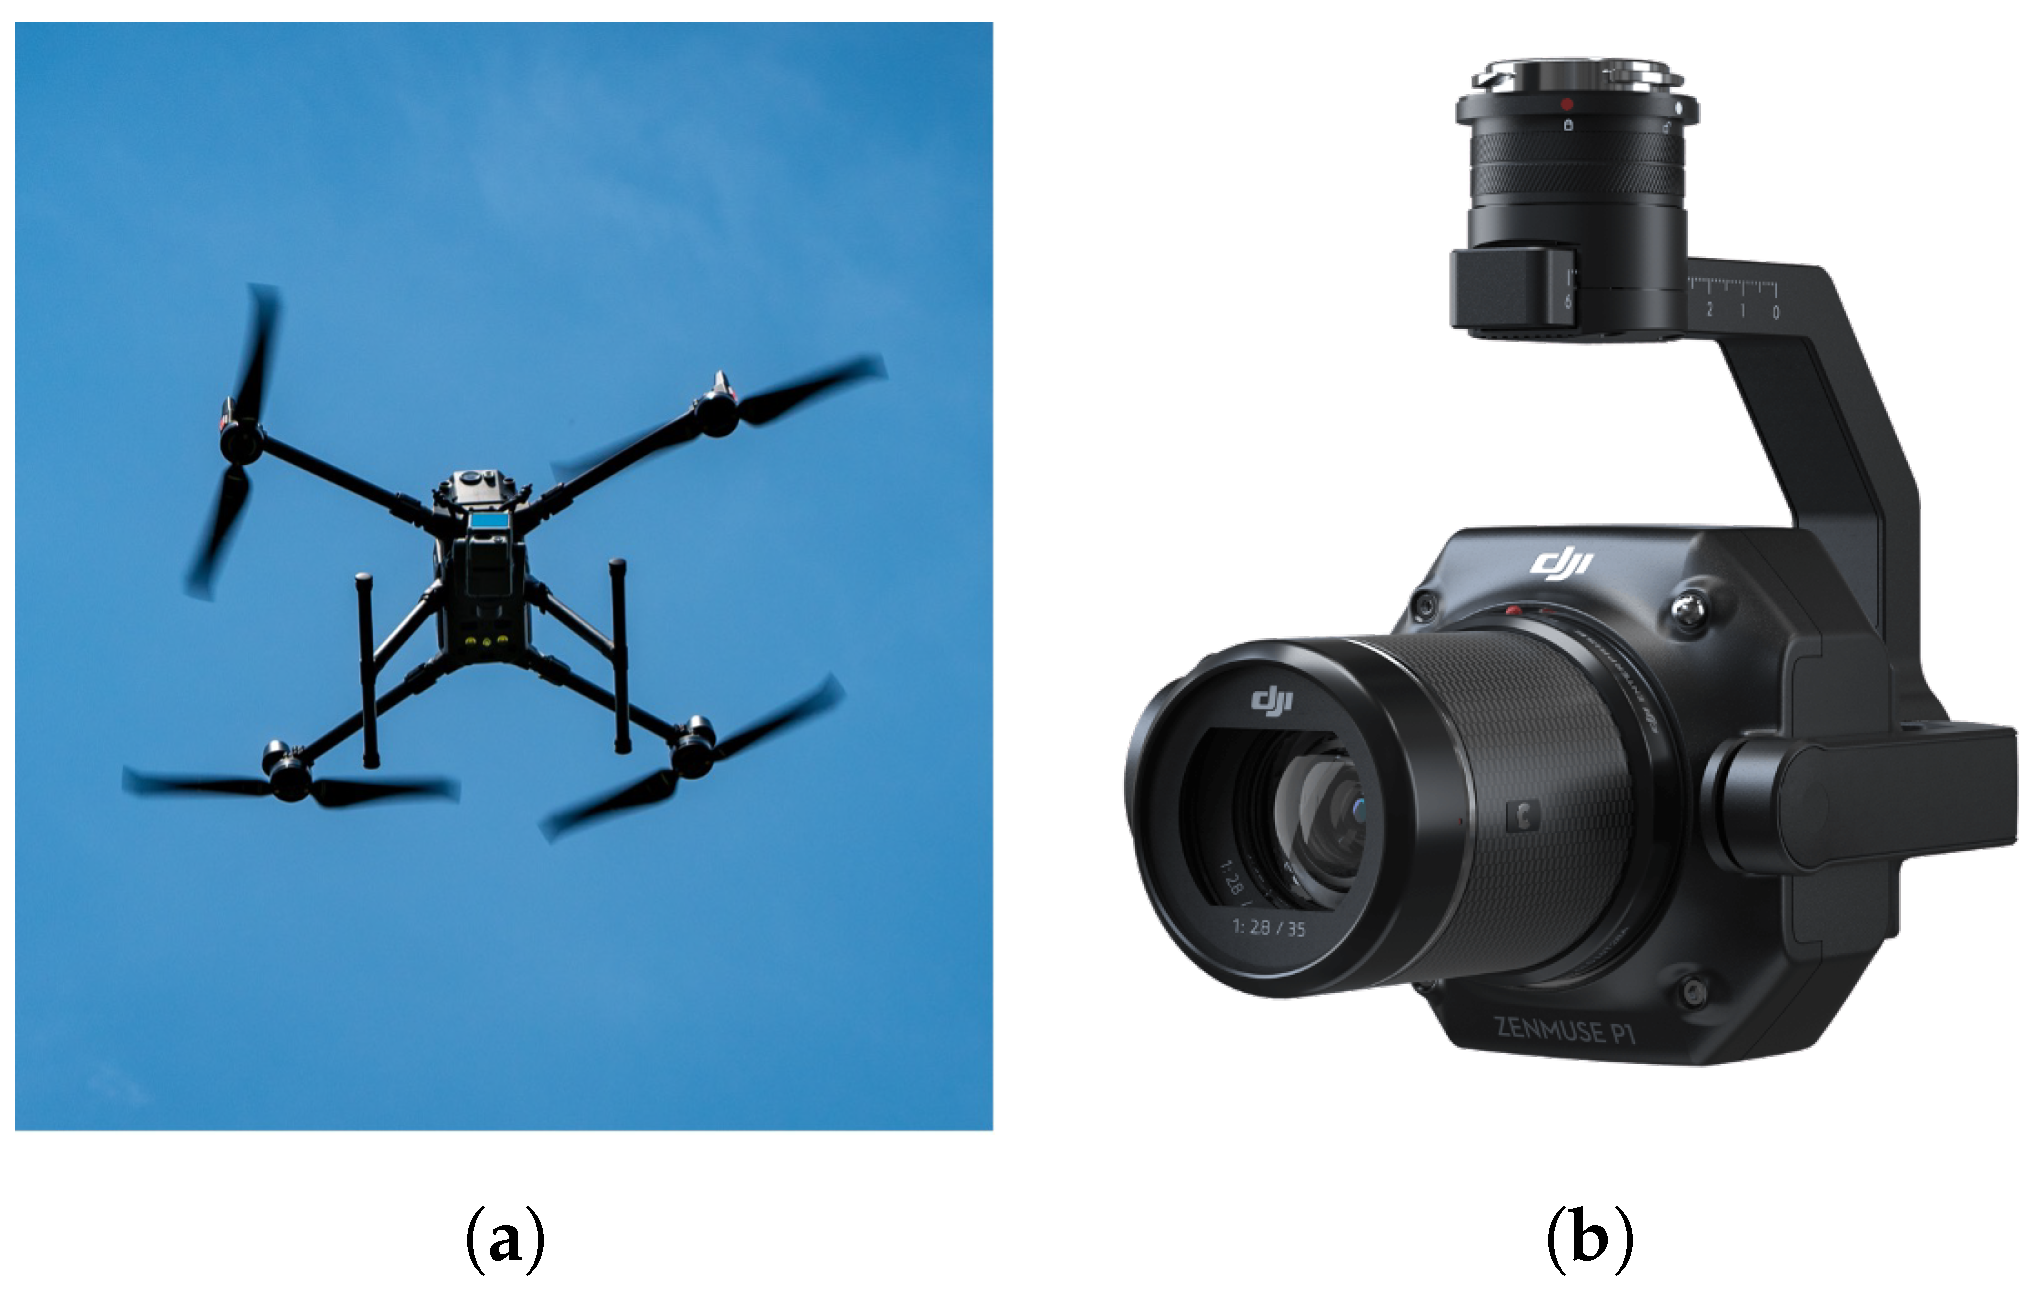
2.2.3. Unmanned Aircraft Systems (UAS) Imagery
3. Methods
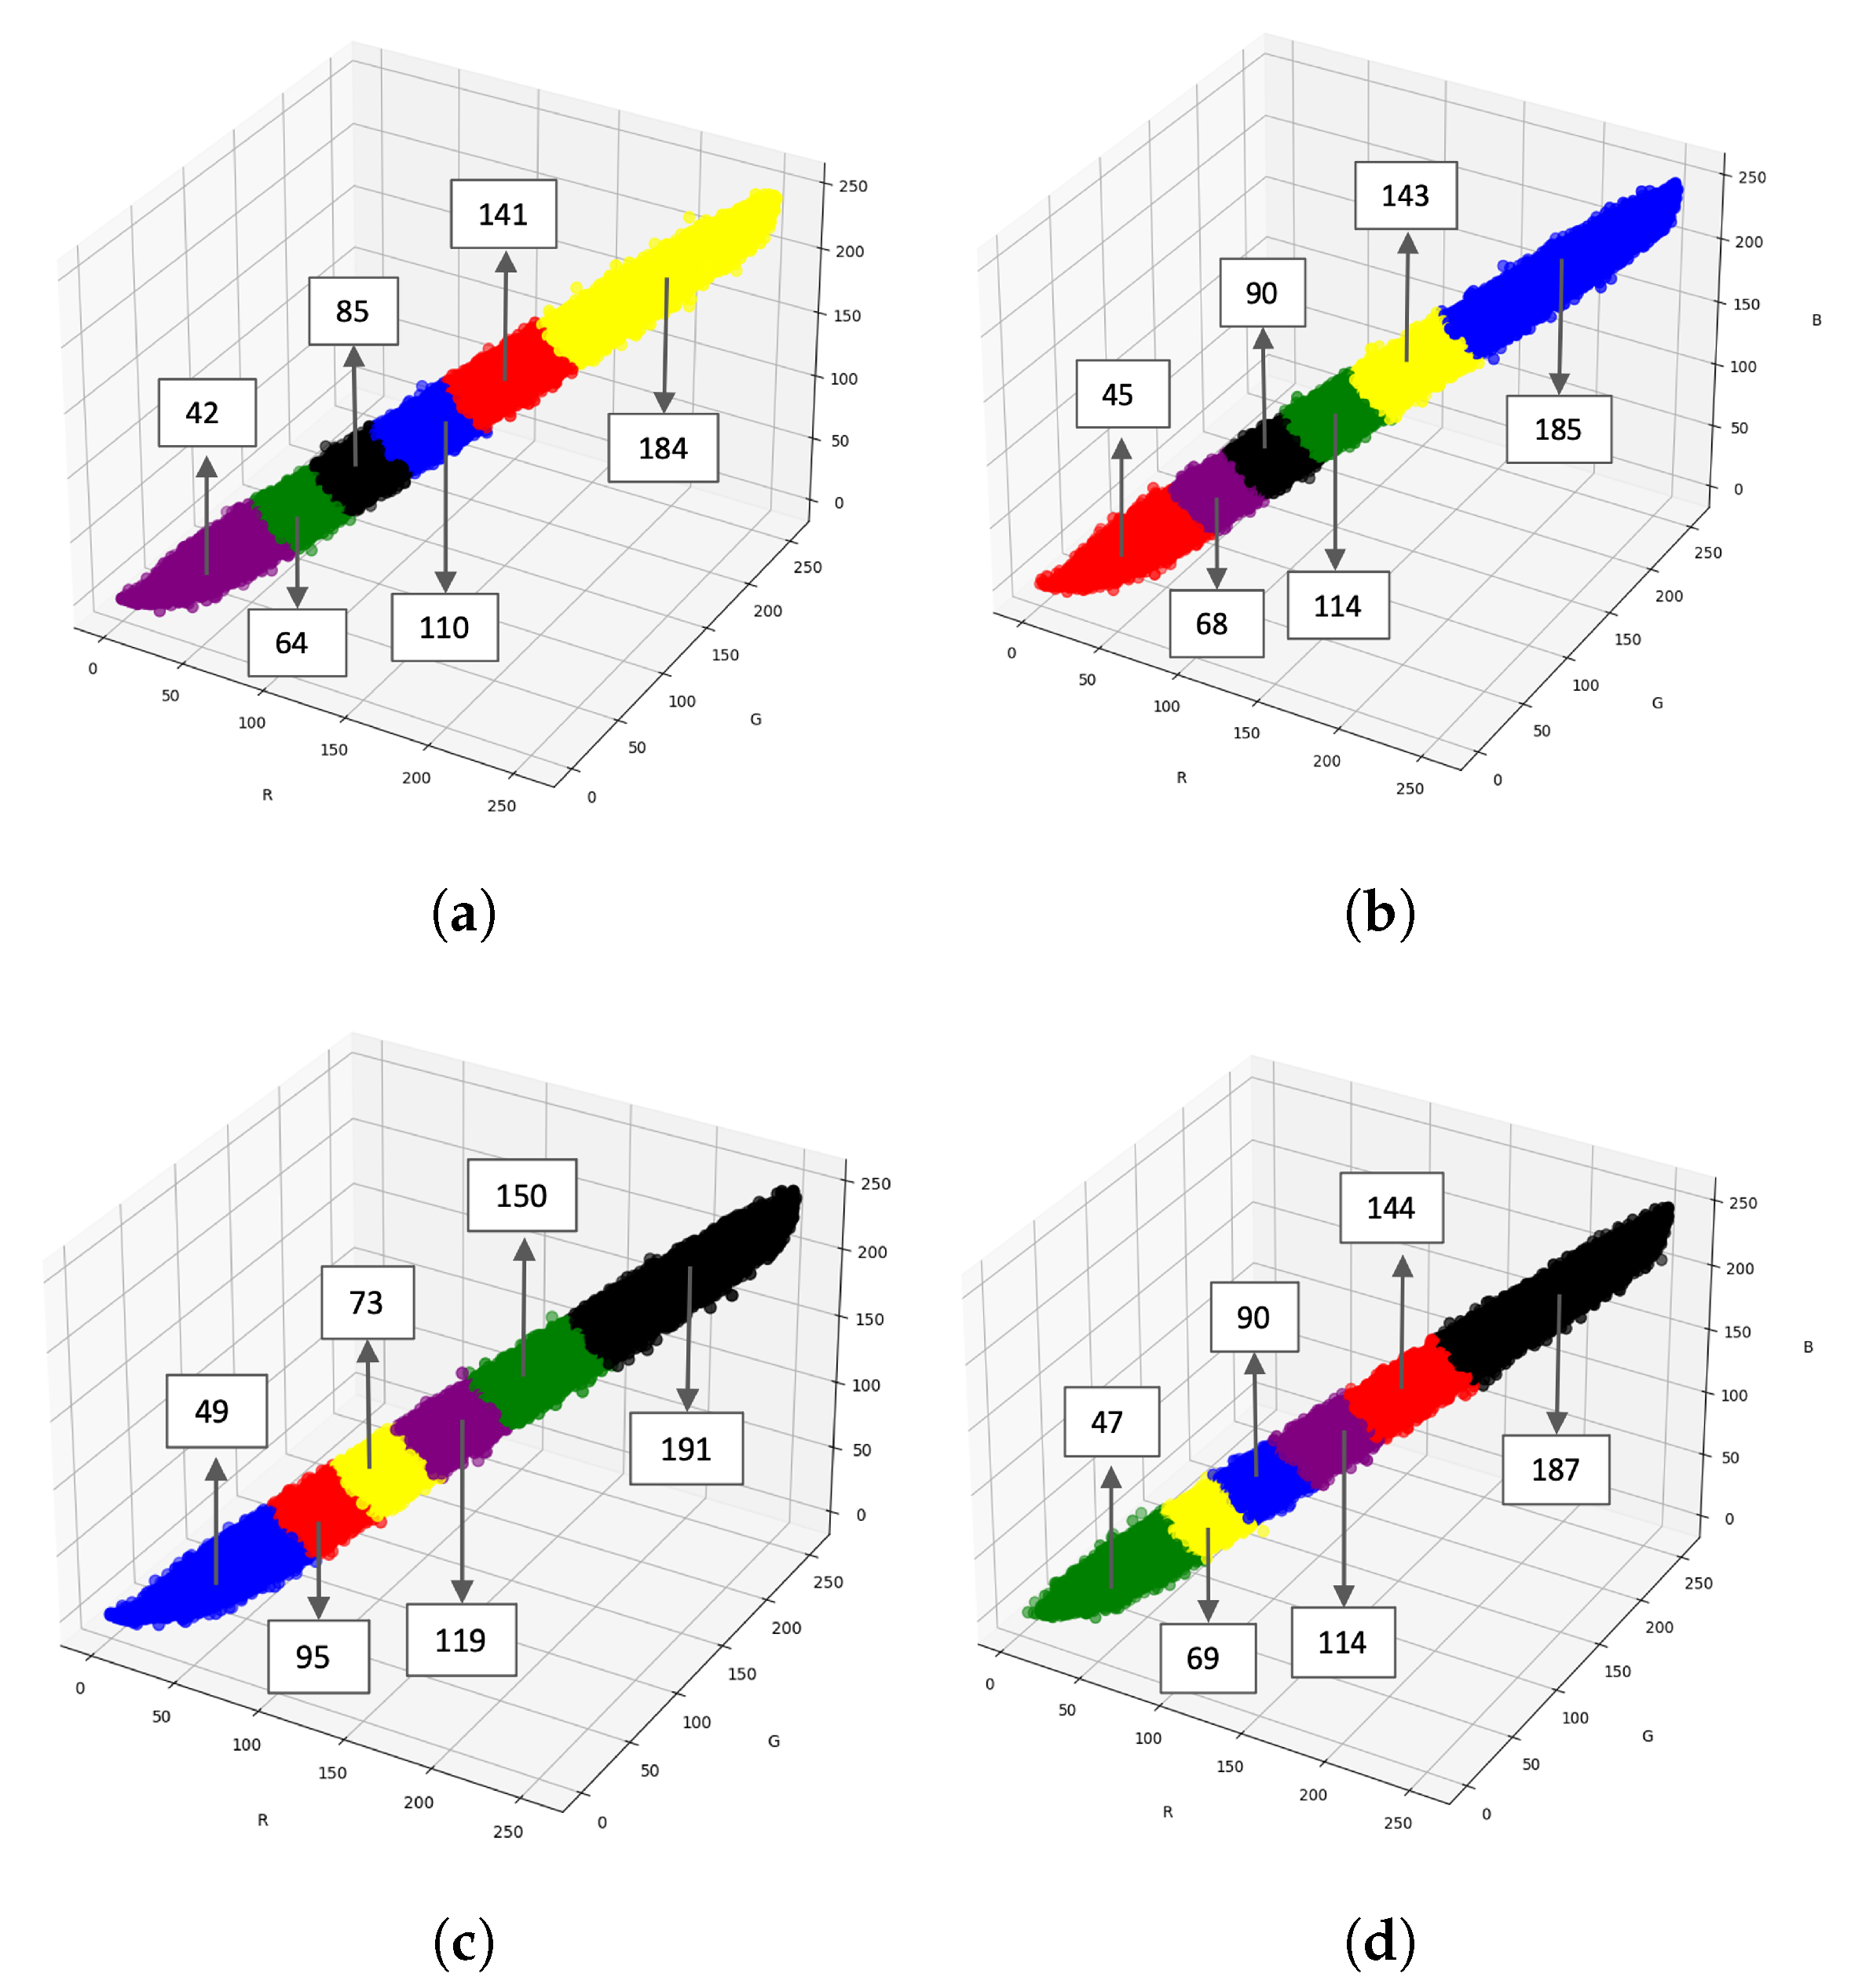
3.1. K-Means Clustering Algorithm
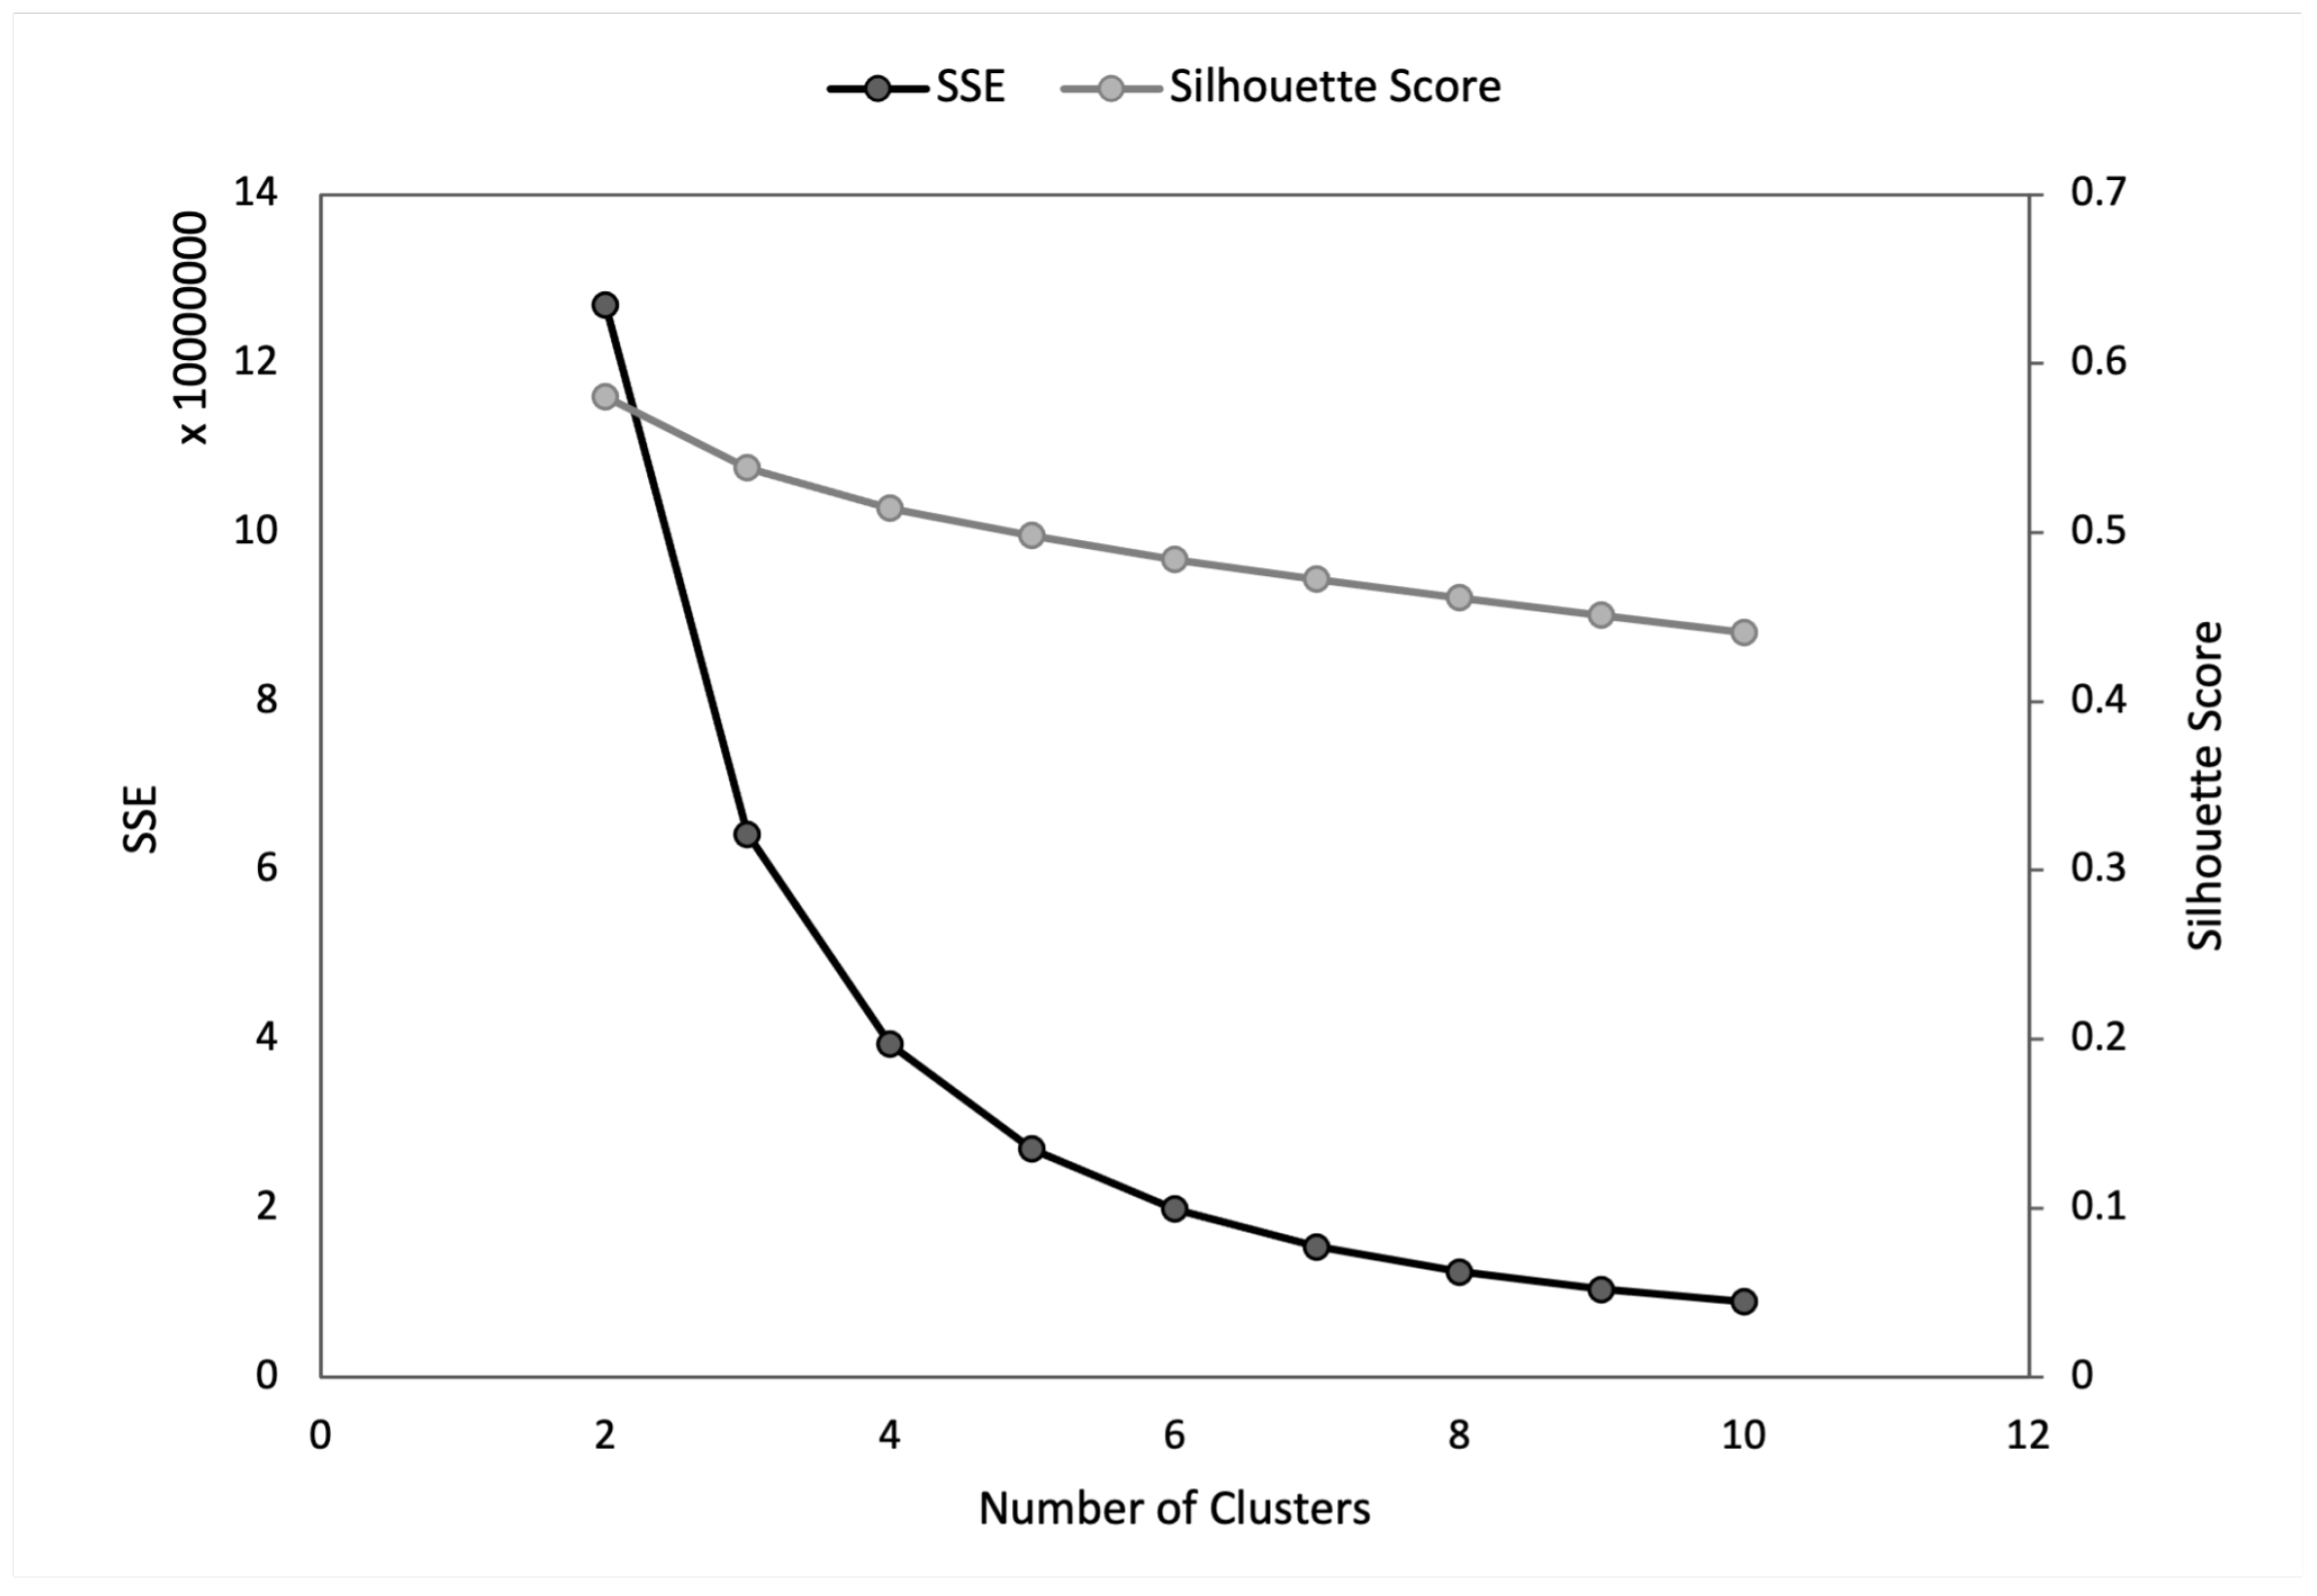
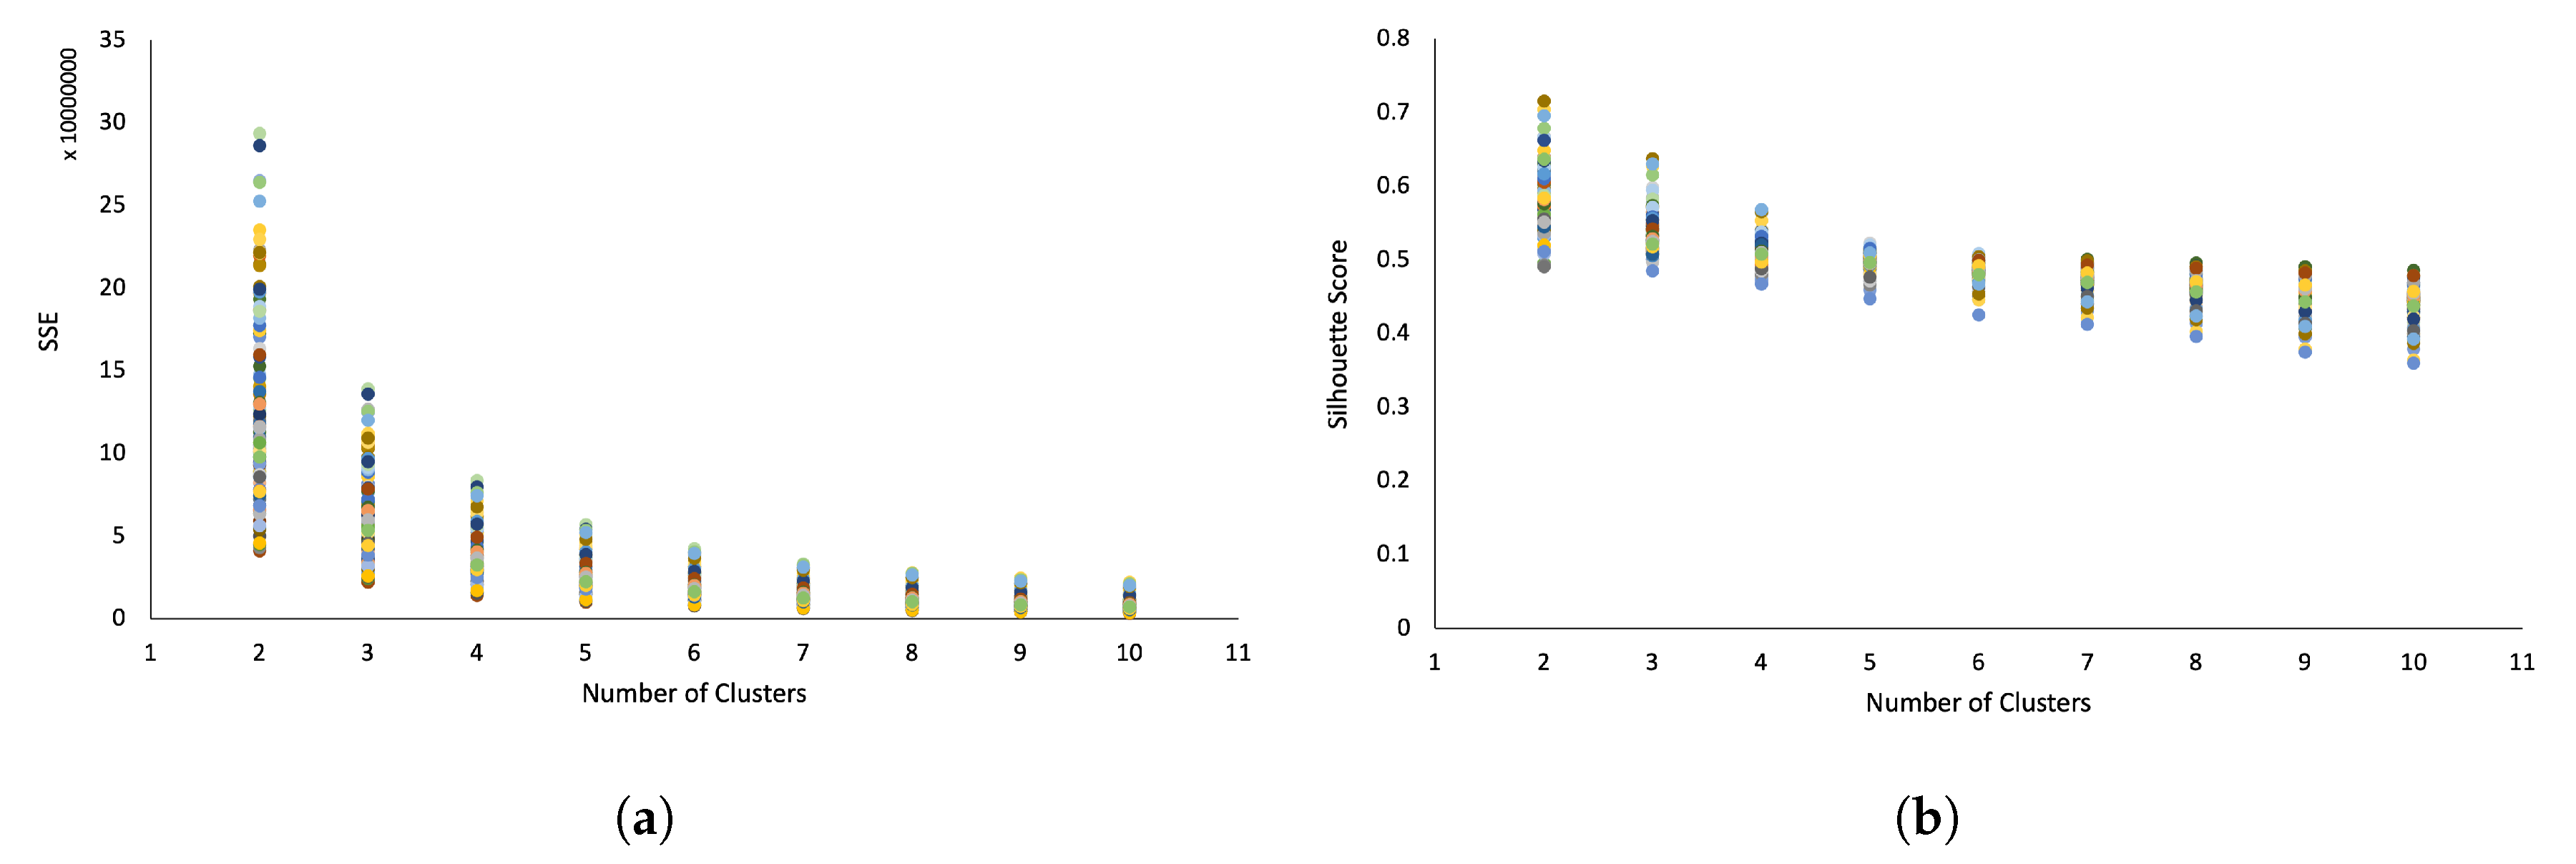
- Elbow method: The elbow method assists in identifying the most appropriate number of clusters by analyzing the SSE graph. A sharp “elbow” or a significant drop in SSE values with a changing number of clusters suggests the optimal number of clusters [34]. This method systematically evaluates changes in SSE to pinpoint the best number of clusters in K-means clustering.
- Sum of squared error (SSE): In K-means clustering, each data point is assigned to a cluster based on its Euclidean distance from the cluster’s centroid . The SSE, a metric for clustering effectiveness [37], quantifies the variance within a cluster as the total squared difference between each data point and its cluster mean. An SSE of zero indicates perfect homogeneity within the cluster. Mathematically, SSE is defined aswhere K is the number of clusters, is the data assigned to cluster , is the centroid of cluster , and is Euclidean distance from to .
- Silhouette score: The silhouette score measures how well a data point fits within its assigned cluster. It is calculated by comparing the mean intracluster distance (cohesion) to the mean nearest-cluster distance (separation) [38]. Scores range from −1 to 1, with values close to 1 indicating strong cluster fit, values near 0 suggesting overlapping clusters, and values around −1 highlighting misclassified data points. A high silhouette score denotes clear differentiation between clusters and tight grouping within them, whereas a low score may indicate clustering inaccuracies. The silhouette score is calculated asHere, is the silhouette score, represents cohesion, and indicates separation. The average silhouette score across all data points is then calculated for each K.
3.2. PCA-Otsu Method
3.2.1. Principal Component Analysis
3.2.2. Otsu Threshold
3.3. Validation
4. Results
4.1. Result of CRC Estimation Using K-Means Unsupervised Method
4.2. Result of CRC Estimation Using PCA-Otsu Method
5. Discussion
6. Conclusions
Author Contributions
Funding
Data Availability Statement
Acknowledgments
Conflicts of Interest
Abbreviations
| UAS | Unmanned Aerial Systems |
| CRC | Crop Residue Cover |
| PCA | Principal Component Analysis |
References
- Mc Nairn, H.; Brisco, B. The Application of C-Band Polarimetric SAR for Agriculture: A Review. Can. J. Remote Sens. 2004, 30, 525–542. [Google Scholar] [CrossRef]
- Wang, S.; Guan, K.; Zhang, C.; Zhou, Q.; Wang, S.; Wu, X.; Jiang, C.; Peng, B.; Mei, W.; Li, K.; et al. Cross-Scale Sensing of Field-Level Crop Residue Cover: Integrating Field Photos, Airborne Hyperspectral Imaging, and Satellite Data. Remote Sens Environ 2023, 285, 113366. [Google Scholar] [CrossRef]
- Daughtry, C.S.T.; Hunt, E.R.; Doraiswamy, P.C.; McMurtrey, J.E. Remote Sensing the Spatial Distribution of Crop Residues. Agro. J. 2005, 97, 864–871. [Google Scholar] [CrossRef]
- Singh, R.B.; Ray, S.S.; Bal, S.K.; Sekhon, B.S.; Gill, G.S.; Panigrahy, S. Crop Residue Discrimination Using Ground-Based Hyperspectral Data. J. Indian Soc. Remote Sens. 2013, 41, 301–308. [Google Scholar] [CrossRef]
- Derpsch, R.; Friedrich, T.; Kassam, A.; Hongwen, L. Current Status of Adoption of No-till Farming in the World and Some of Its Main Benefits. Int. J. Agric. Biol. Eng. 2010, 3, 1–25. [Google Scholar] [CrossRef]
- Yue, J.; Tian, Q.; Dong, X.; Xu, K.; Zhou, C. Using Hyperspectral Crop Residue Angle Index to Estimate Maize and Winter-Wheat Residue Cover: A Laboratory Study. Remote Sens. 2019, 11, 807. [Google Scholar] [CrossRef]
- Kosmowski, F.; Stevenson, J.; Campbell, J.; Ambel, A.; Haile Tsegay, A. On the Ground or in the Air? A Methodological Experiment on Crop Residue Cover Measurement in Ethiopia. Environ. Manag. 2017, 60, 705–716. [Google Scholar] [CrossRef]
- Zheng, B.; Campbell, J.B.; Serbin, G.; Galbraith, J.M. Remote Sensing of Crop Residue and Tillage Practices: Present Capabilities and Future Prospects. Soil Tillage Res. 2014, 138, 26–34. [Google Scholar] [CrossRef]
- Hively, W.D.; Lamb, B.T.; Daughtry, C.S.T.; Shermeyer, J.; McCarty, G.W.; Quemada, M. Mapping Crop Residue and Tillage Intensity Using WorldView-3 Satellite Shortwave Infrared Residue Indices. Remote Sens. 2018, 10, 1657. [Google Scholar] [CrossRef]
- Stern, A.J.; Daughtry, C.S.T.; Hunt, E.R.; Gao, F. Comparison of Five Spectral Indices and Six Imagery Classification Techniques for Assessment of Crop Residue Cover Using Four Years of Landsat Imagery. Remote Sens. 2023, 15, 4596. [Google Scholar] [CrossRef]
- Beeson, P.C.; Daughtry, C.S.T.; Hunt, E.R.; Akhmedov, B.; Sadeghi, A.M.; Karlen, D.L.; Tomer, M.D. Multispectral Satellite Mapping of Crop Residue Cover and Tillage Intensity in Iowa. J. Soil Water Conserv. 2016, 71, 385–395. [Google Scholar] [CrossRef]
- Karan, S.K.; Hamelin, L. Crop Residues May Be a Key Feedstock to Bioeconomy but How Reliable Are Current Estimation Methods? Resour. Conserv. Recycl. 2021, 164, 105211. [Google Scholar] [CrossRef]
- de Paul Obade, V.; Gaya, C.O.; Obade, P.T. Statistical Diagnostics for Sensing Spatial Residue Cover. Precis. Agric. 2023, 24, 1932–1964. [Google Scholar] [CrossRef]
- Quemada, M.; Hively, W.D.; Daughtry, C.S.T.; Lamb, B.T.; Shermeyer, J. Improved Crop Residue Cover Estimates Obtained by Coupling Spectral Indices for Residue and Moisture. Remote Sens. Environ. 2018, 206, 33–44. [Google Scholar] [CrossRef]
- Sullivan, D.G.; Fulmer, J.L.; Strickland, T.C.; Masters, M.; Yao, H. Field Scale Evaluation of Crop Residue Cover Distribution Using Airborne and Satellite Remote Sensing. In Proceedings of the 2007 Georgia Water Resources Conference, Athens, GA, USA, 27–29 March 2007. [Google Scholar]
- Quemada, M.; Daughtry, C.S.T. Spectral Indices to Improve Crop Residue Cover Estimation under Varying Moisture Conditions. Remote Sens. 2016, 8, 660. [Google Scholar] [CrossRef]
- Yue, J.; Tian, Q. Estimating Fractional Cover of Crop, Crop Residue, and Soil in Cropland Using Broadband Remote Sensing Data and Machine Learning. Int. J. Appl. Earth Obs. Geoinf. 2020, 89, 102089. [Google Scholar] [CrossRef]
- Serbin, G.; Daughtry, C.S.T.; Hunt, E.R.; Brown, D.J.; McCarty, G.W. Effect of Soil Spectral Properties on Remote Sensing of Crop Residue Cover. Soil Sci. Soc. Am. J. 2009, 73, 1545–1558. [Google Scholar] [CrossRef]
- Bannari, A.; Pacheco, A.; Staenz, K.; McNairn, H.; Omari, K. Estimating and Mapping Crop Residues Cover on Agricultural Lands Using Hyperspectral and IKONOS Data. Remote Sens. Environ. 2006, 104, 447–459. [Google Scholar] [CrossRef]
- Quemada, M.; Hively, W.D.; Daughtry, C.S.T.; Lamb, B.T.; Shermeyer, J. Improved Crop Residue Cover Estimates from Satellite Images by Coupling Residue and Water Spectral Indices. In Proceedings of the IGARSS 2018—2018 IEEE International Geoscience and Remote Sensing Symposium, Valencia, Spain, 22–27 July 2018; pp. 5425–5428. [Google Scholar] [CrossRef]
- Cai, W.; Zhao, S.; Zhang, Z.; Peng, F.; Xu, J. Comparison of Different Crop Residue Indices for Estimating Crop Residue Cover Using Field Observation Data. In Proceedings of the 2018 7th International Conference on Agro-Geoinformatics, Hangzhou, China, 6–9 August 2018. [Google Scholar]
- Sonmez, N.K.; Slater, B. Measuring Intensity of Tillage and Plant Residue Cover Using Remote Sensing. Eur. J. Remote Sens. 2016, 49, 121–135. [Google Scholar] [CrossRef]
- Chi, J.; Crawford, M.M. Spectral Unmixing-Based Crop Residue Estimation Using Hyperspectral Remote Sensing Data: A Case Study at Purdue University. IEEE J. Sel. Top. Appl. Earth Obs. Remote Sens. 2014, 7, 2531–2539. [Google Scholar] [CrossRef]
- Ruwaimana, M.; Satyanarayana, B.; Otero, V.; Muslim, A.M.; Syafiq, A.M.; Ibrahim, S.; Raymaekers, D.; Koedam, N.; Dahdouh-Guebas, F. The advantages of using drones over space-borne imagery in the mapping of mangrove forests. PLoS ONE 2018, 13, e0200288. [Google Scholar] [CrossRef]
- Barnes, M.L.; Yoder, L.; Khodaee, M. Detecting Winter Cover Crops and Crop Residues in the Midwest US Using Machine Learning Classification of Thermal and Optical Imagery. Remote Sens. 2021, 13, 1998. [Google Scholar] [CrossRef]
- Ding, Y.; Zhang, H.; Wang, Z.; Xie, Q.; Wang, Y.; Liu, L.; Hall, C.C. A Comparison of Estimating Crop Residue Cover from Sentinel-2 Data Using Empirical Regressions and Machine Learning Methods. Remote Sens. 2020, 12, 1470. [Google Scholar] [CrossRef]
- Bannari, A.; Chevrier, M.; Staenz, K.; McNairn, H. Senescent Vegetation and Crop Residue Mapping in Agricultural Lands Using Artificial Neural Networks and Hyperspectral Remote Sensing. In Proceedings of the IGARSS 2003—2003 IEEE International Geoscience and Remote Sensing Symposium, Toulouse, France, 21–25 July 2003; Proceedings (IEEE Cat. No.03CH37477). Volume 7, pp. 4292–4294. [Google Scholar]
- Bocco, M.; Sayago, S.; Willington, E. Neural network and crop residue index multiband models for estimating crop residue cover from Landsat TM and ETM+ images. Int. J. Remote Sens. 2014, 35, 3651–3663. [Google Scholar] [CrossRef]
- Tao, W.; Xie, Z.; Zhang, Y.; Li, J.; Xuan, F.; Huang, J.; Li, X.; Su, W.; Yin, D. Corn Residue Covered Area Mapping with a Deep Learning Method Using Chinese GF-1 B/D High Resolution Remote Sensing Images. Remote Sens. 2021, 13, 2903. [Google Scholar] [CrossRef]
- Ribeiro, A.; Ranz, J.; Burgos-Artizzu, X.P.; Pajares, G.; del Arco, M.J.S.; Navarrete, L. An Image Segmentation Based on a Genetic Algorithm for Determining Soil Coverage by Crop Residues. Sensors 2011, 11, 6480–6492. [Google Scholar] [CrossRef]
- Upadhyay, P.C.; Lory, J.A.; DeSouza, G.N.; Lagaunne, T.A.P.; Spinka, C.M. Classification of Crop Residue Cover in High-Resolution RGB Images Using Machine Learning. J. ASABE 2022, 65, 75–86. [Google Scholar] [CrossRef]
- Yue, J.; Fu, Y.; Guo, W.; Feng, H.; Qiao, H. Estimating fractional coverage of crop, crop residue, and bare soil using shortwave infrared angle index and Sentinel-2 MSI. Int. J. Remote Sens. 2022, 43, 1253–1273. [Google Scholar] [CrossRef]
- Jain, A.K.; Murty, M.N.; Flynn, P.J. Data Clustering: A Review. ACM Comput. Surv. 1999, 31, 264–323. [Google Scholar] [CrossRef]
- Nainggolan, R.; Perangin-angin, R.; Simarmata, E.; Tarigan, A.F. Improved the Performance of the K-Means Cluster Using the Sum of Squared Error (SSE) Optimized by Using the Elbow Method. J. Phys. Conf. Ser. 2019, 1361, 12015. [Google Scholar] [CrossRef]
- Muningsih, E.; Kiswati, S. Sistem Aplikasi Berbasis Optimasi Metode Elbow Untuk Penentuan Clustering Pelanggan. Joutica 2018, 3, 117. [Google Scholar] [CrossRef]
- Ahmed, M.; Seraj, R.; Islam, S.M.S. The K-Means Algorithm: A Comprehensive Survey and Performance Evaluation. Electronics 2020, 9, 1295. [Google Scholar] [CrossRef]
- Thinsungnoen, T.; Kaoungku, N.; Durongdumronchai, P.; Kerdprasop, K.; Kerdprasop, N. The Clustering Validity with Silhouette and Sum of Squared Errors. In Proceedings of the ICIAE 2015: The 3rd International Conference on Industrial Application Engineering, Kitakyushu, Japan, 28–31 March 2015; pp. 44–51. [Google Scholar]
- Shahapure, K.R.; Nicholas, C. Cluster Quality Analysis Using Silhouette Score. In Proceedings of the 2020 IEEE 7th International Conference on Data Science and Advanced Analytics (DSAA), Sydney, NSW, Australia, 6–9 October 2020; pp. 747–748. [Google Scholar]
- Kherif, F.; Latypova, A. Principal Component Analysis. In Machine Learning: Methods and Applications to Brain Disorders; Academic Press: Cambridge, MA, USA, 2020; pp. 209–225. [Google Scholar] [CrossRef]
- Melgani, F. Robust Image Binarization with Ensembles of Thresholding Algorithms. J. Electron. Imaging 2006, 15, 23010. [Google Scholar] [CrossRef]
- Yousefi, J. Image Binarization Using Otsu Thresholding Algorithm; University of Guelph: Guelph, ON, Canada, 2015. [Google Scholar]
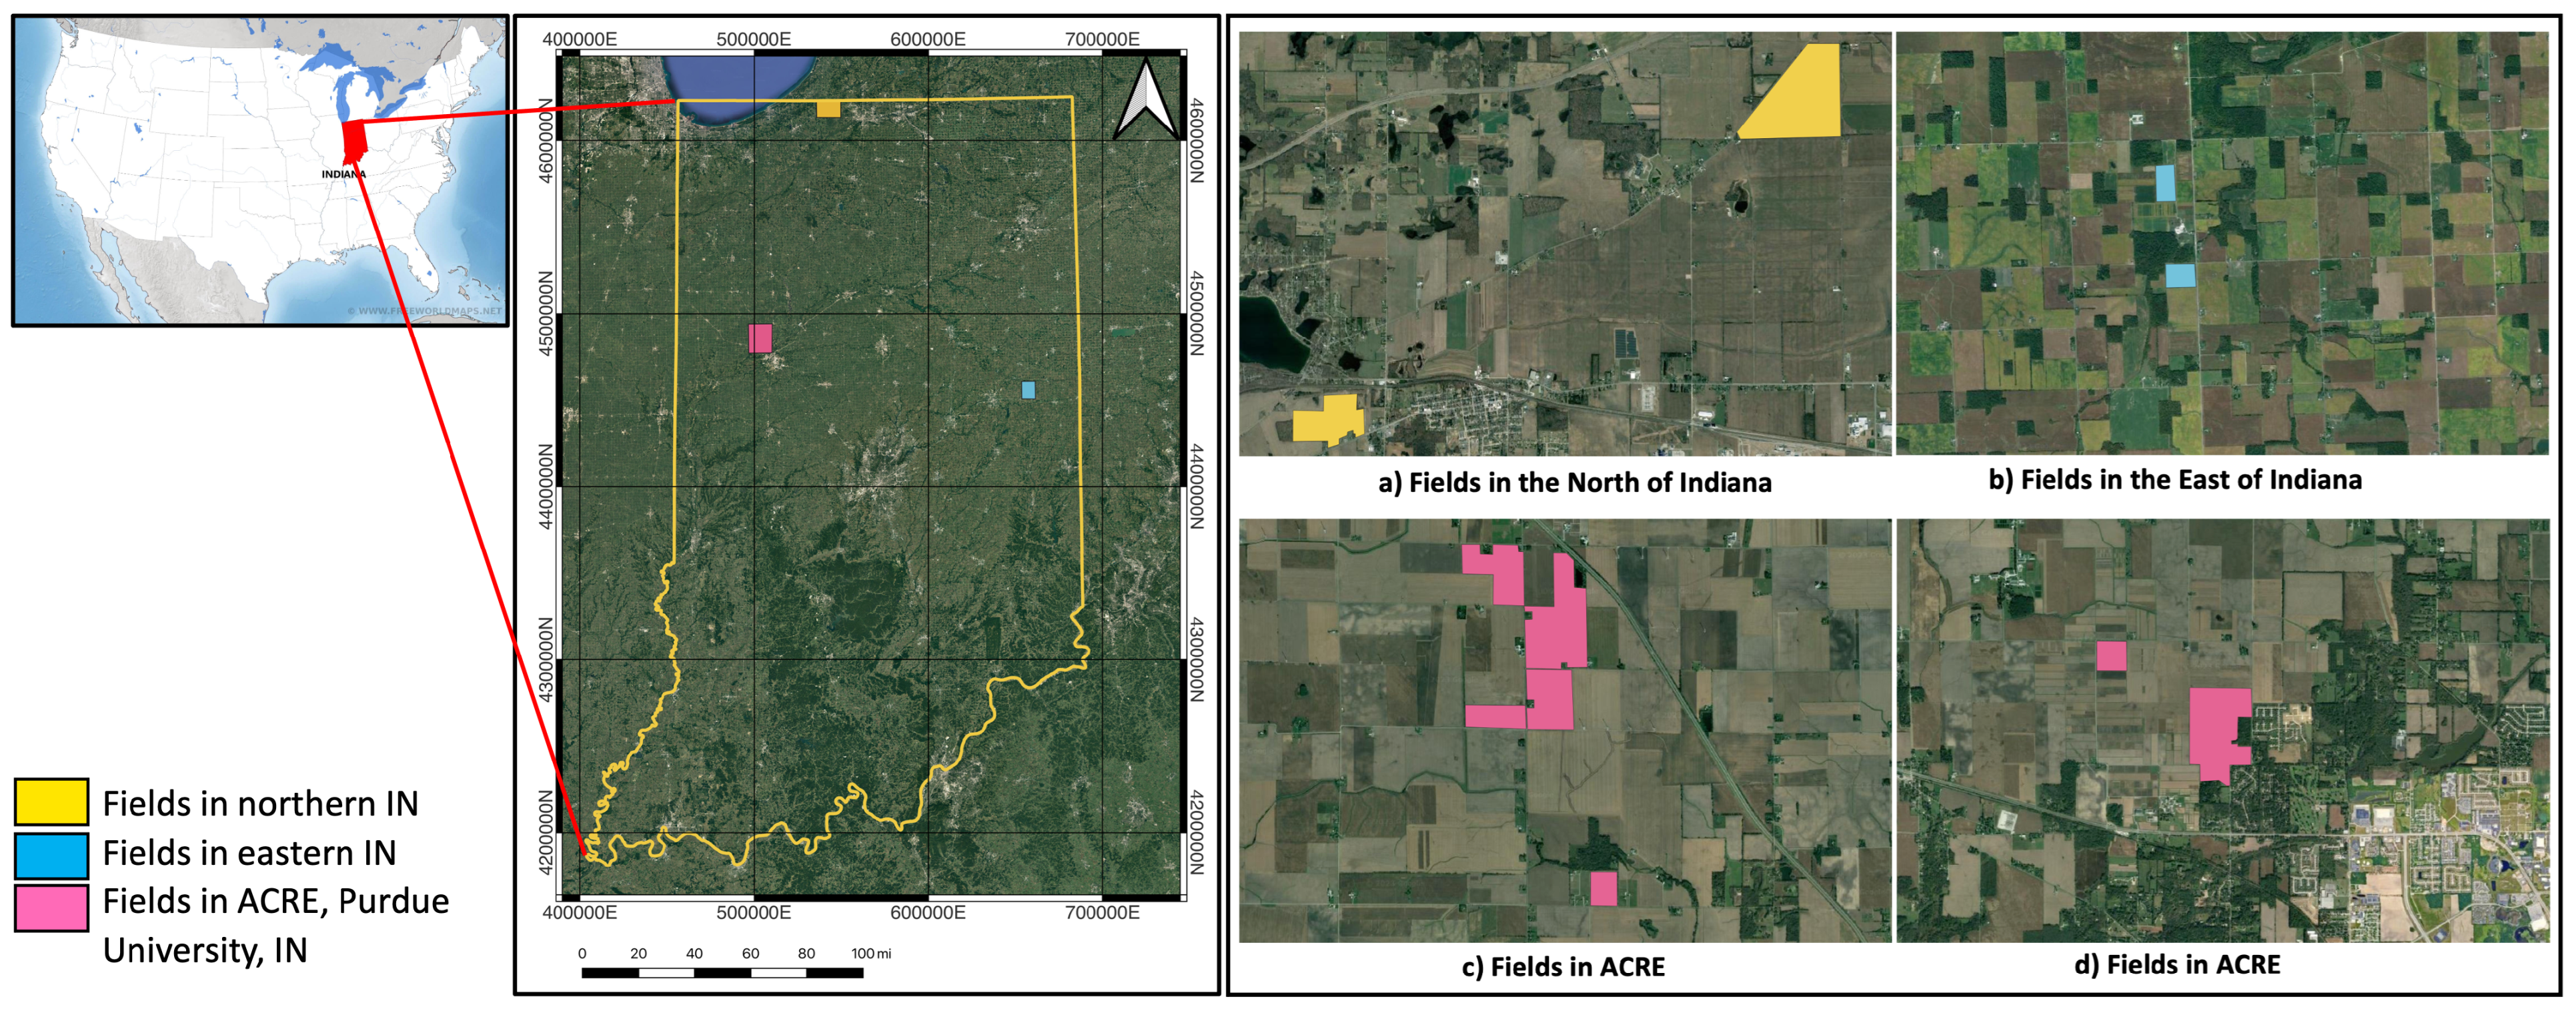

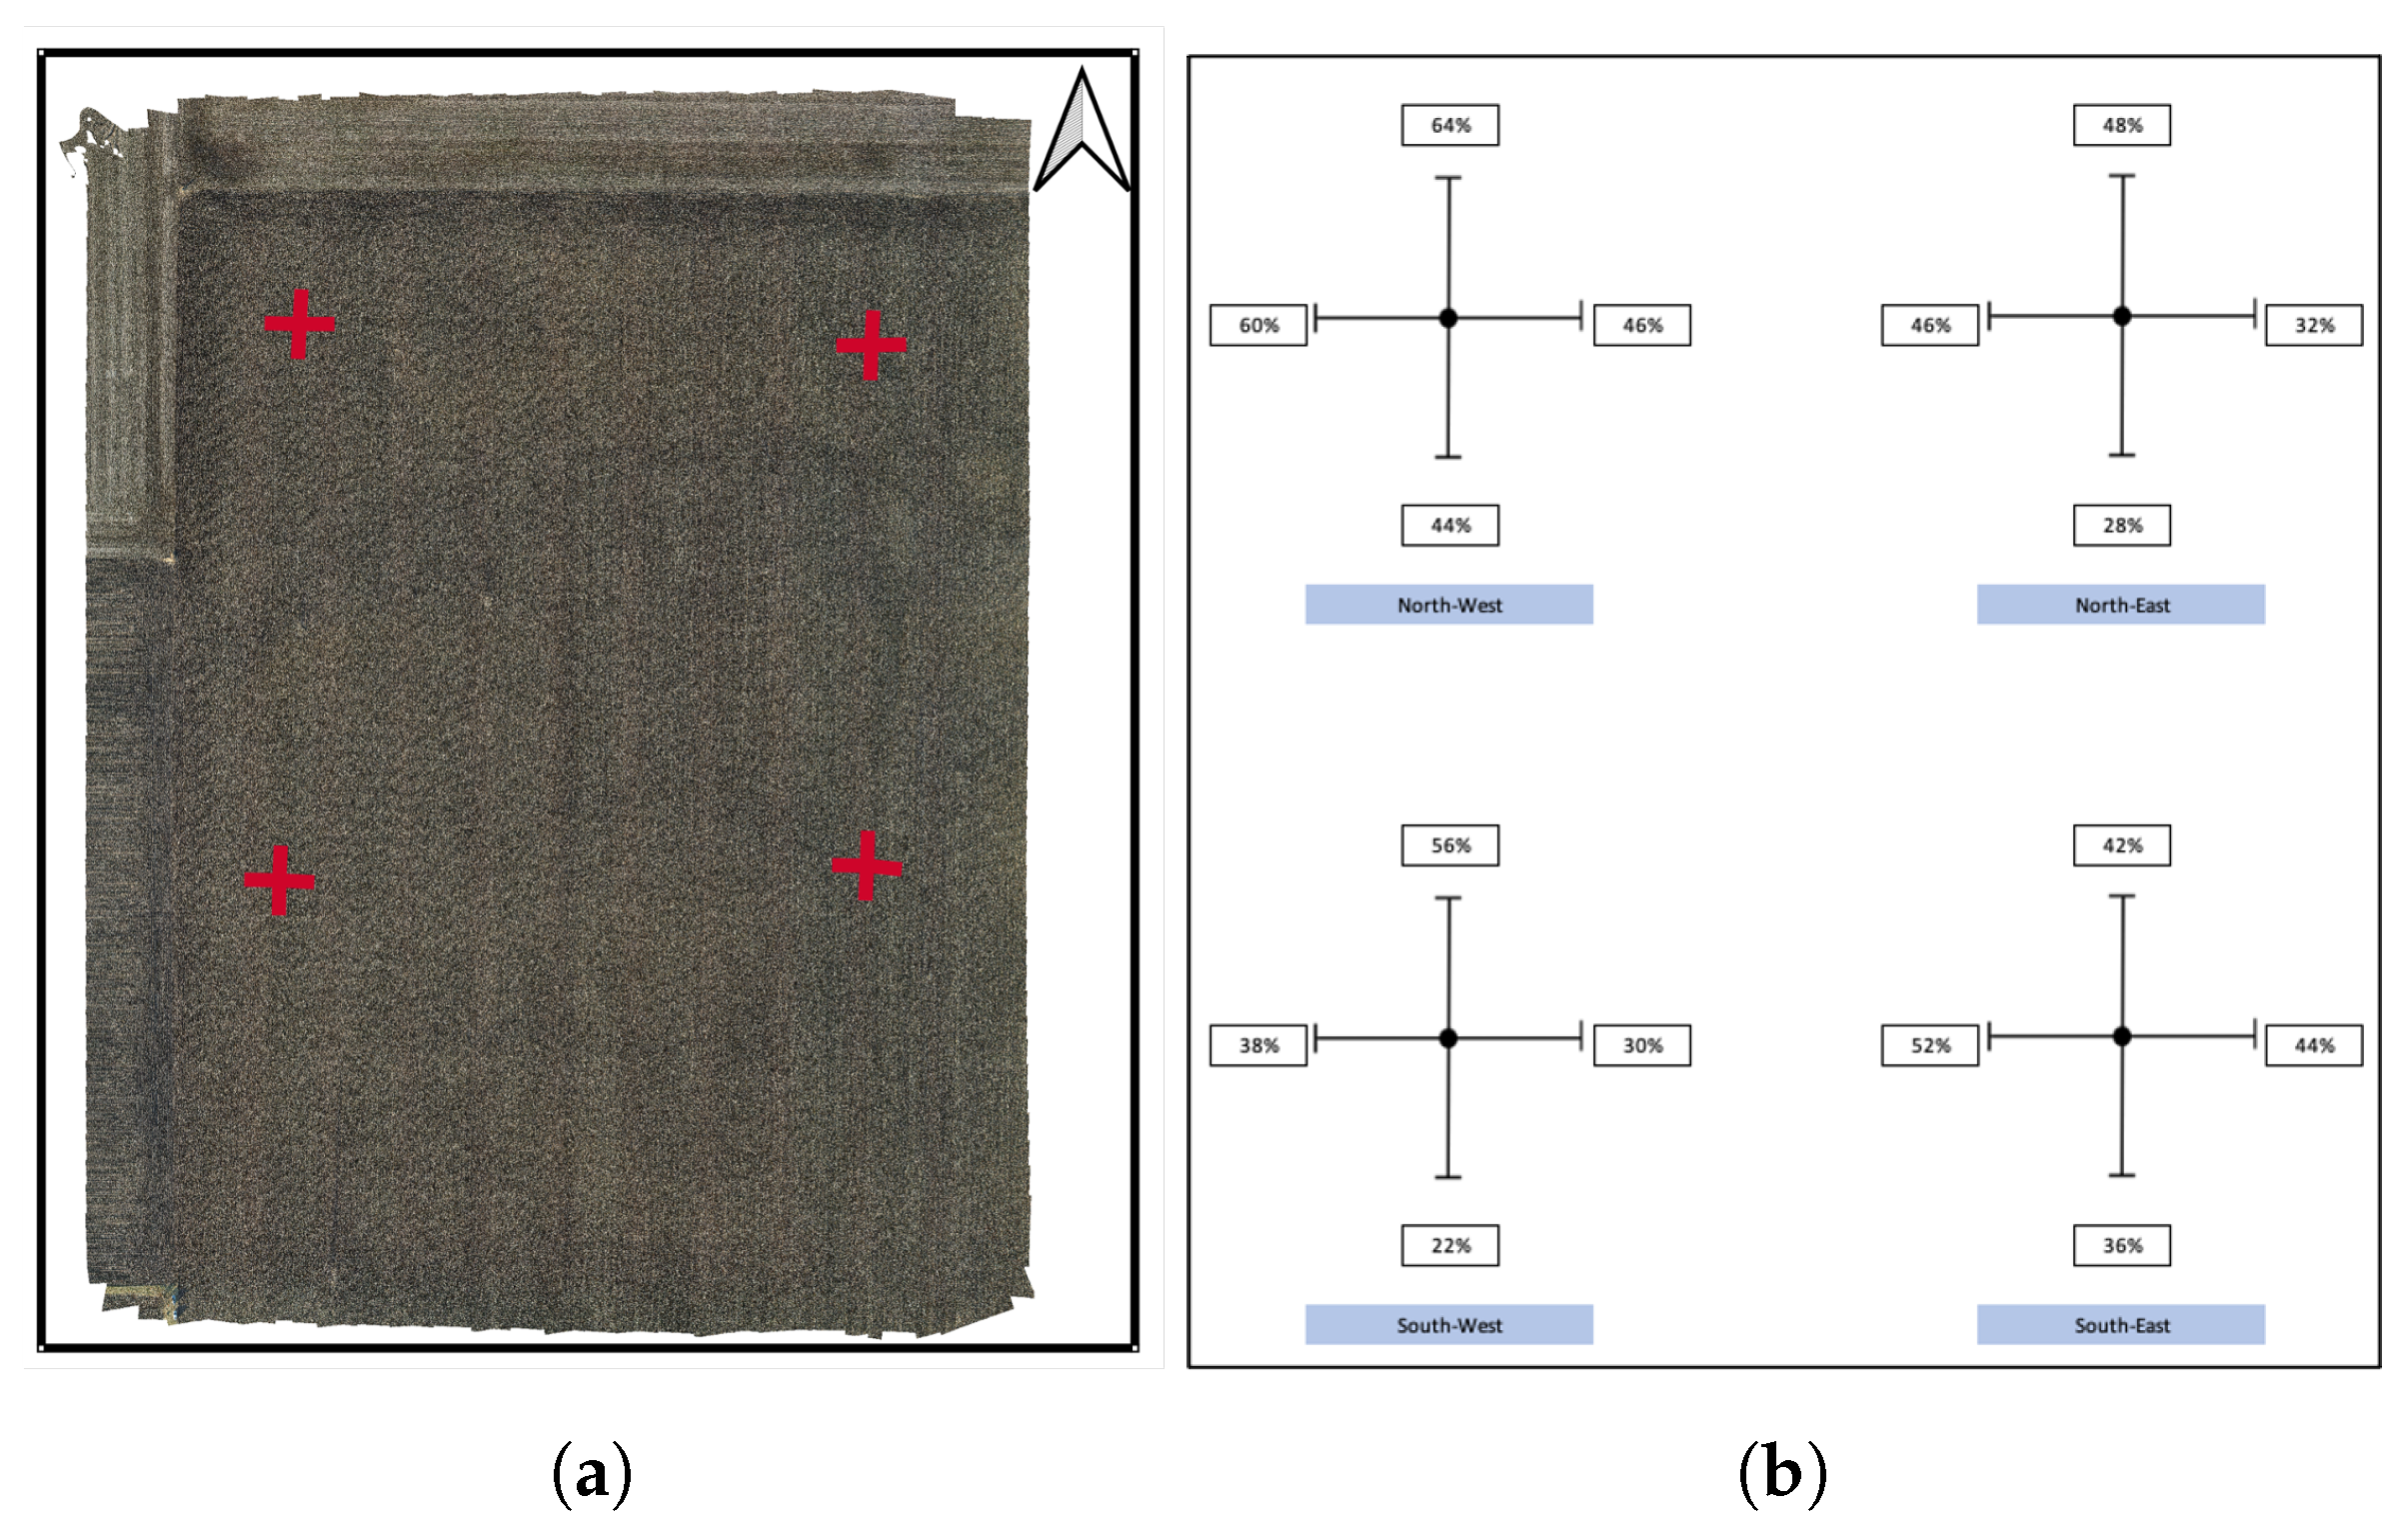
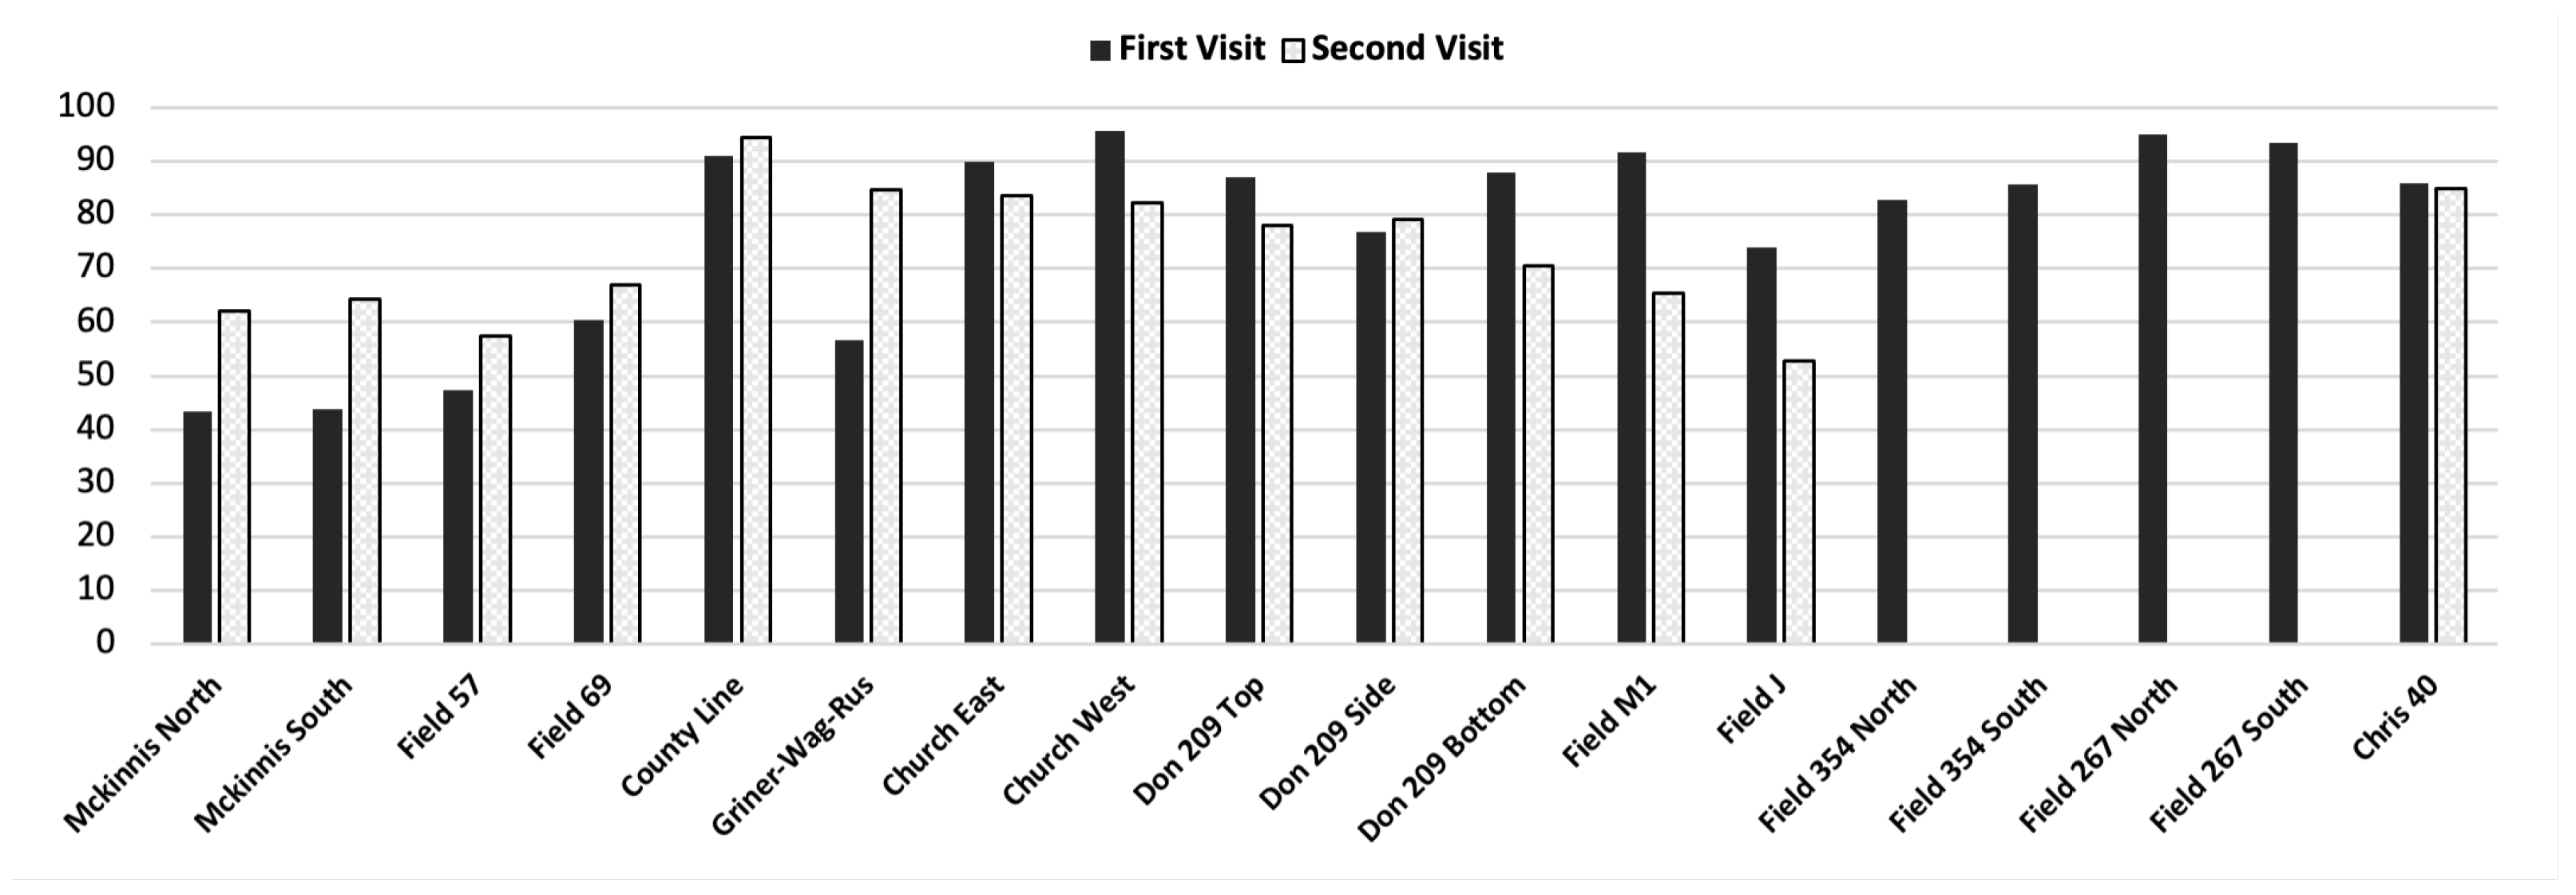
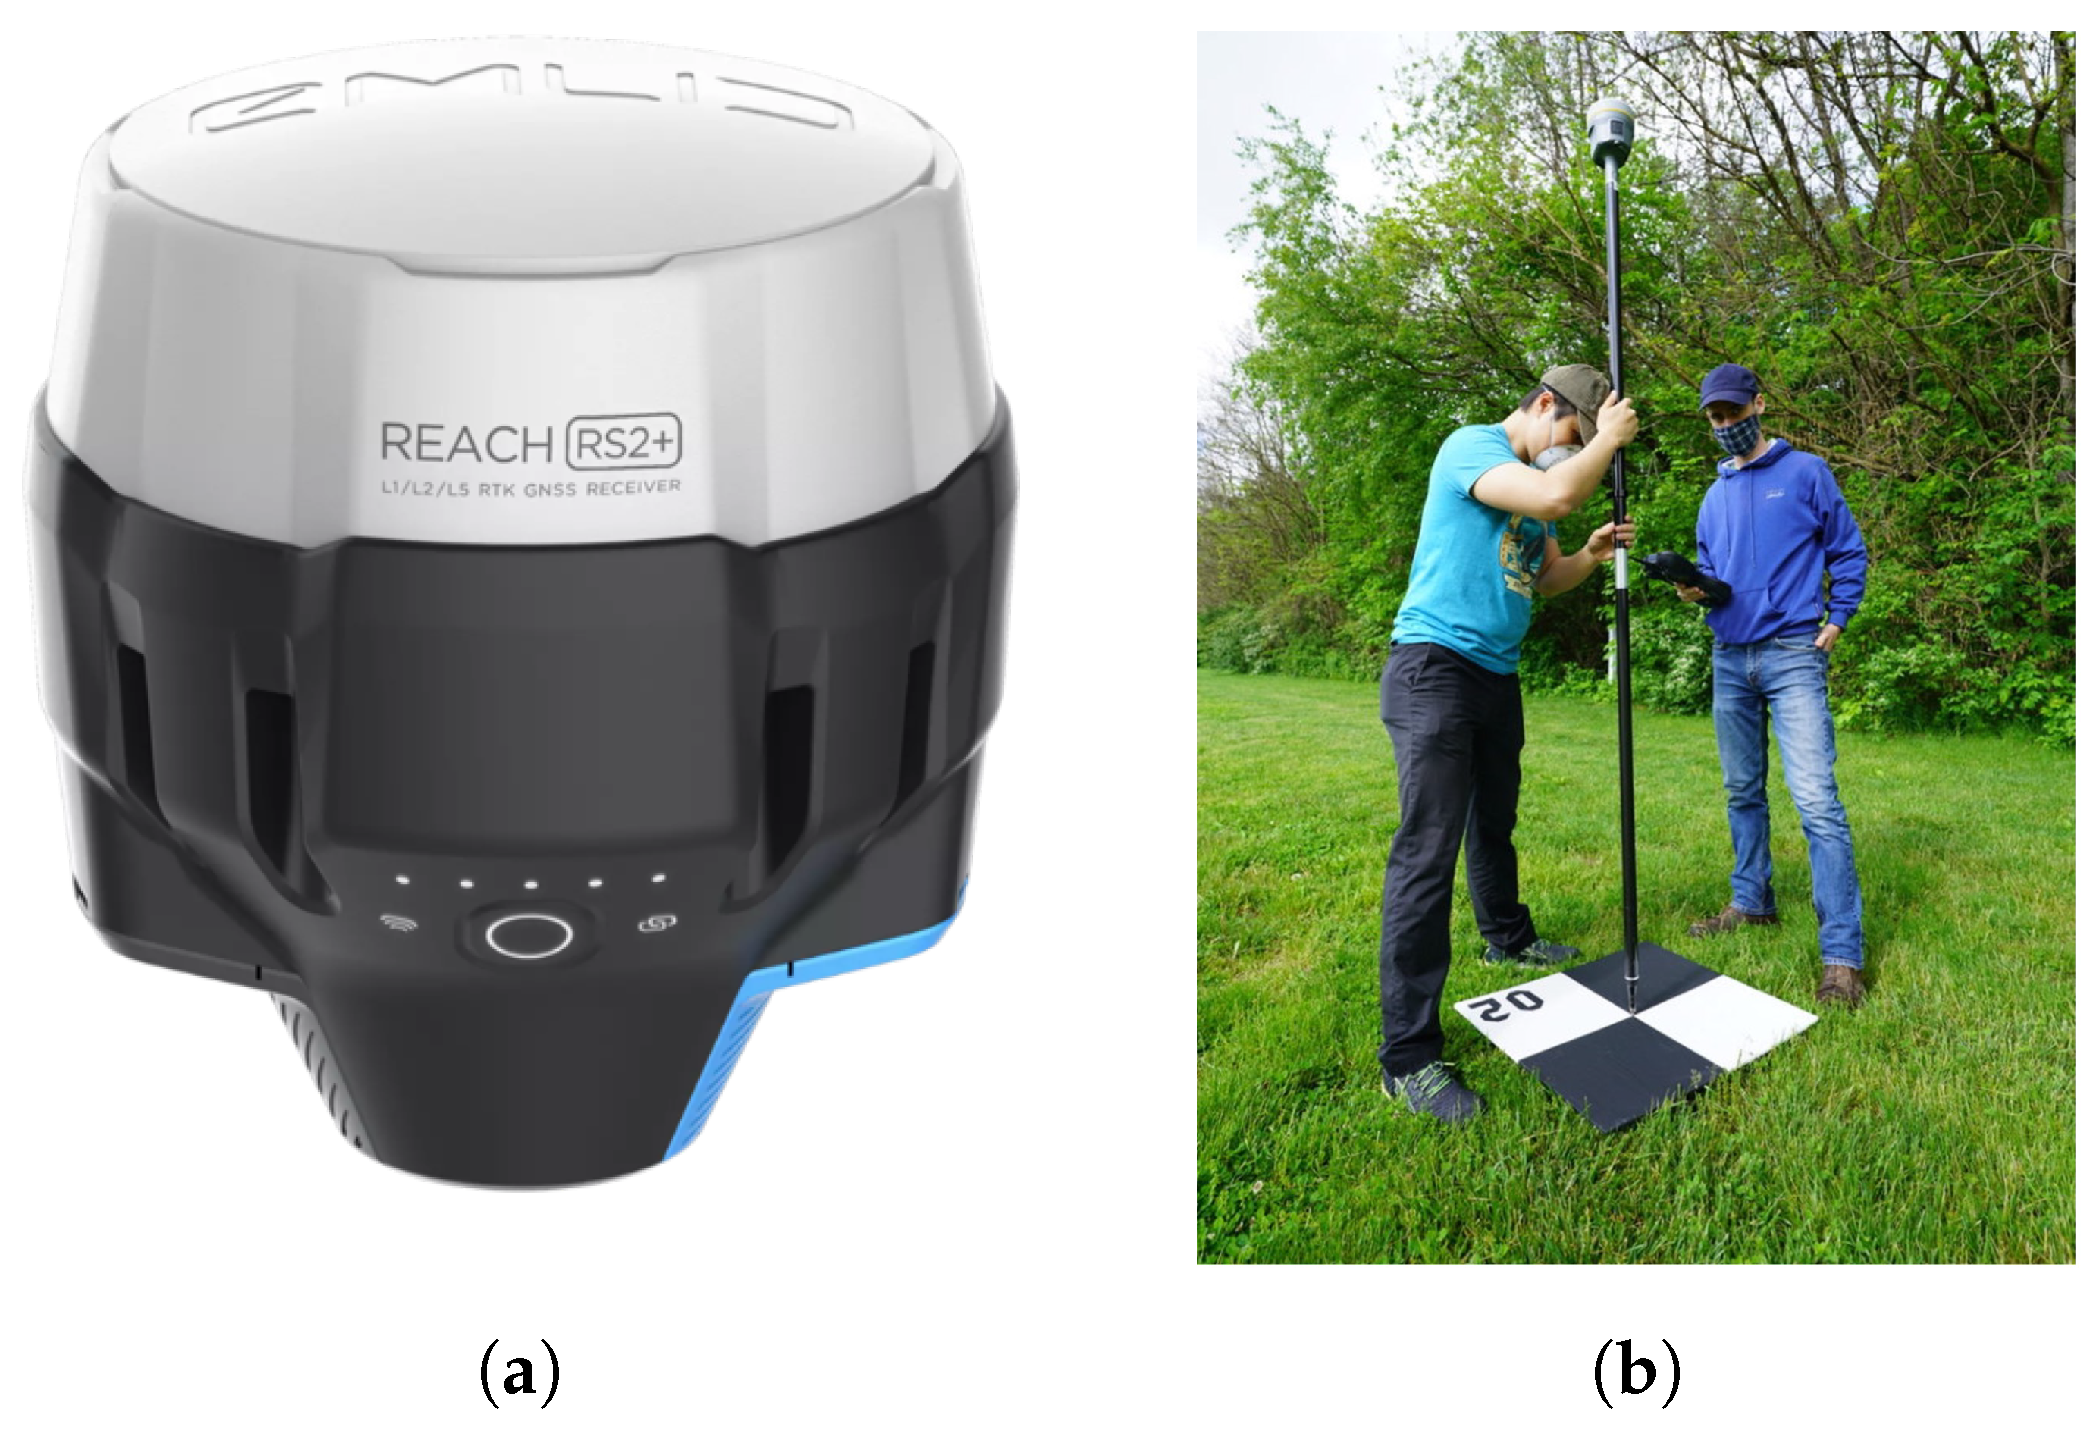




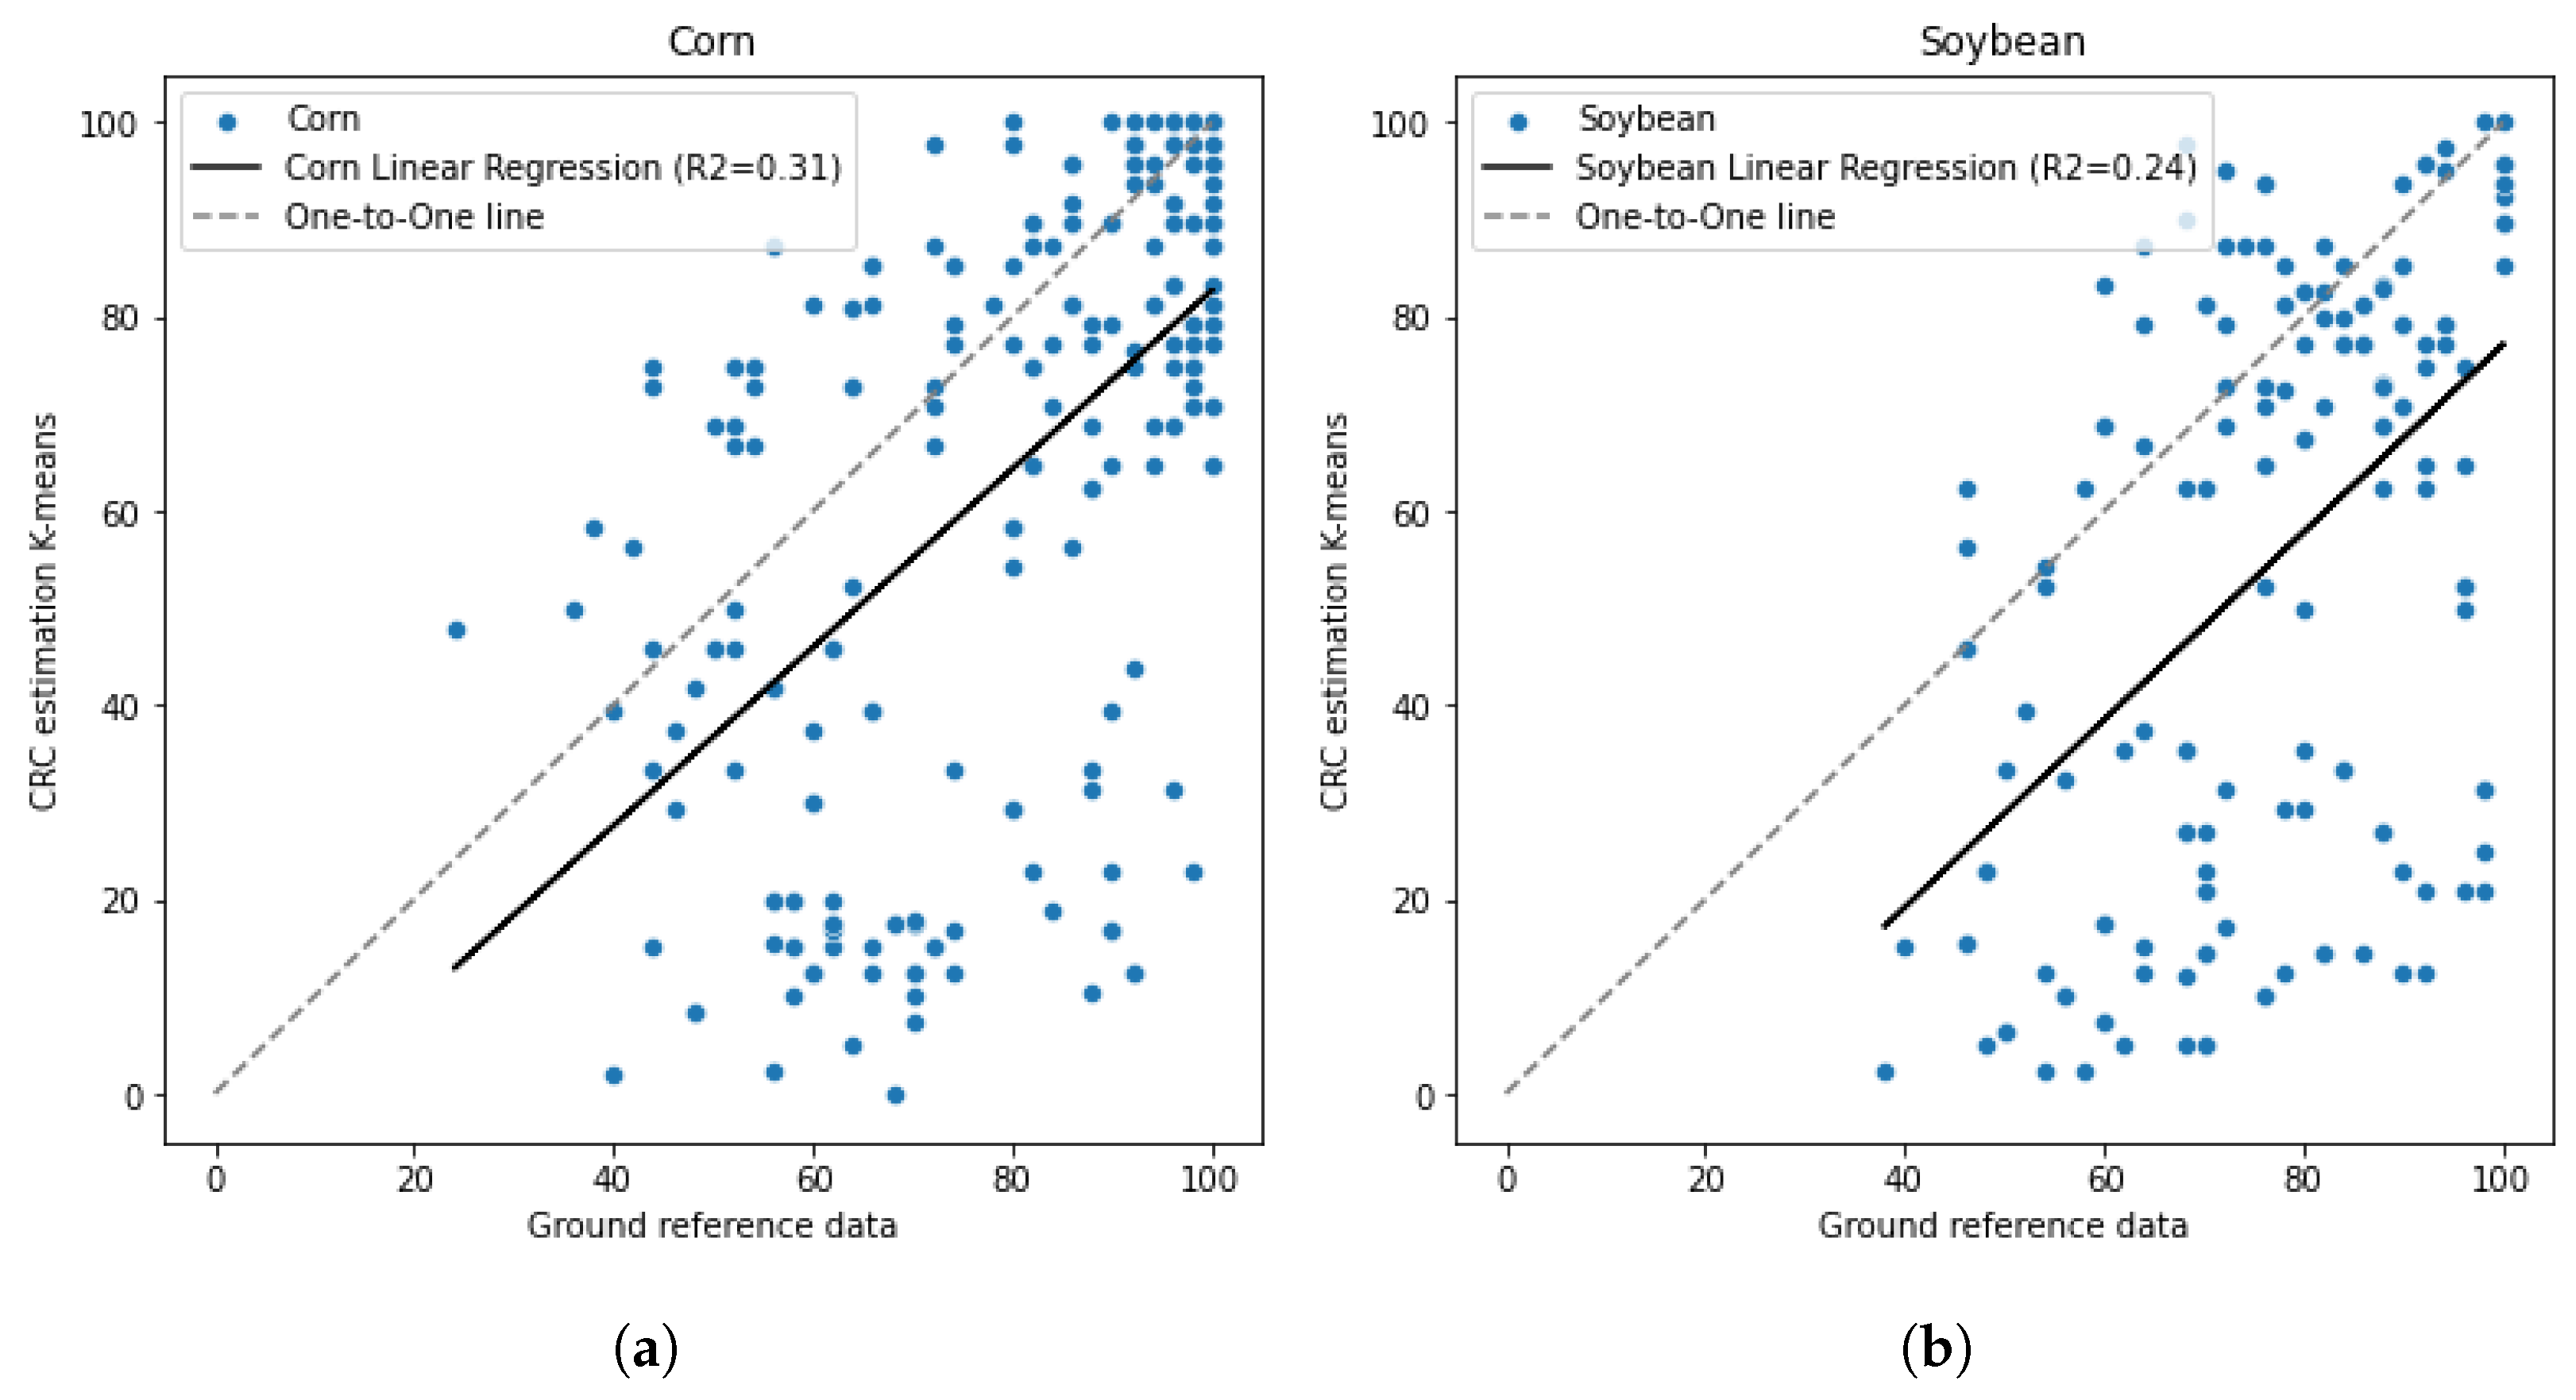
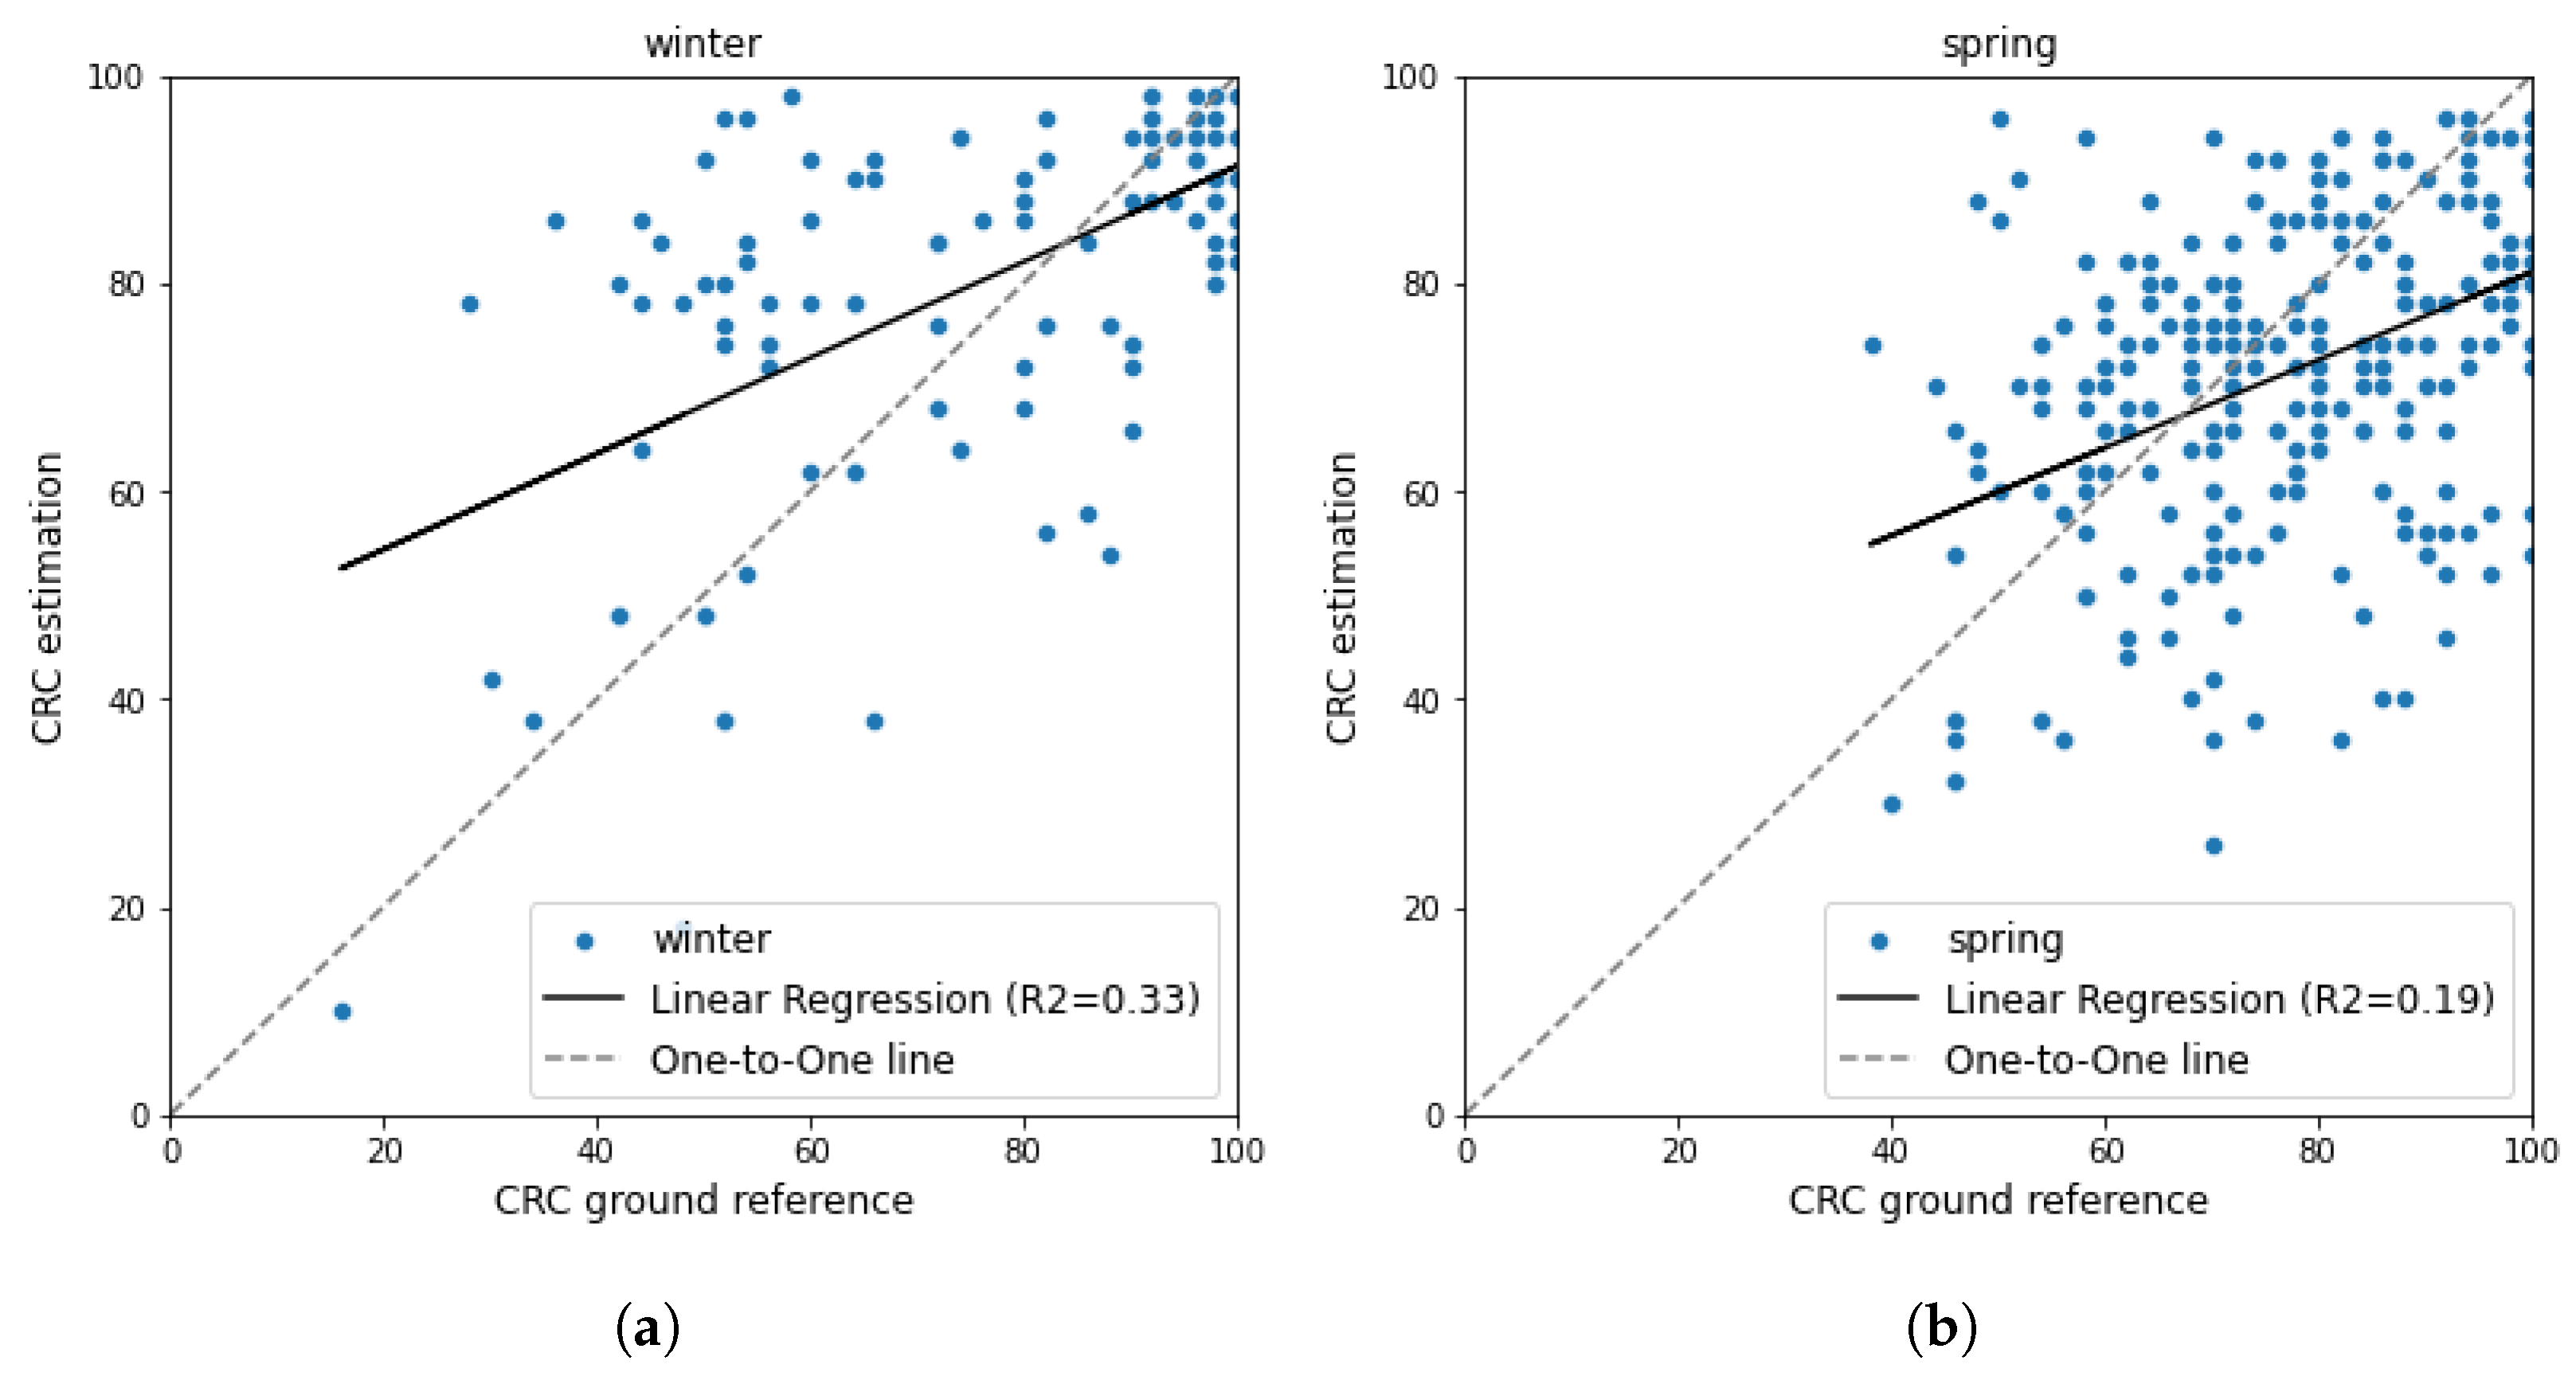
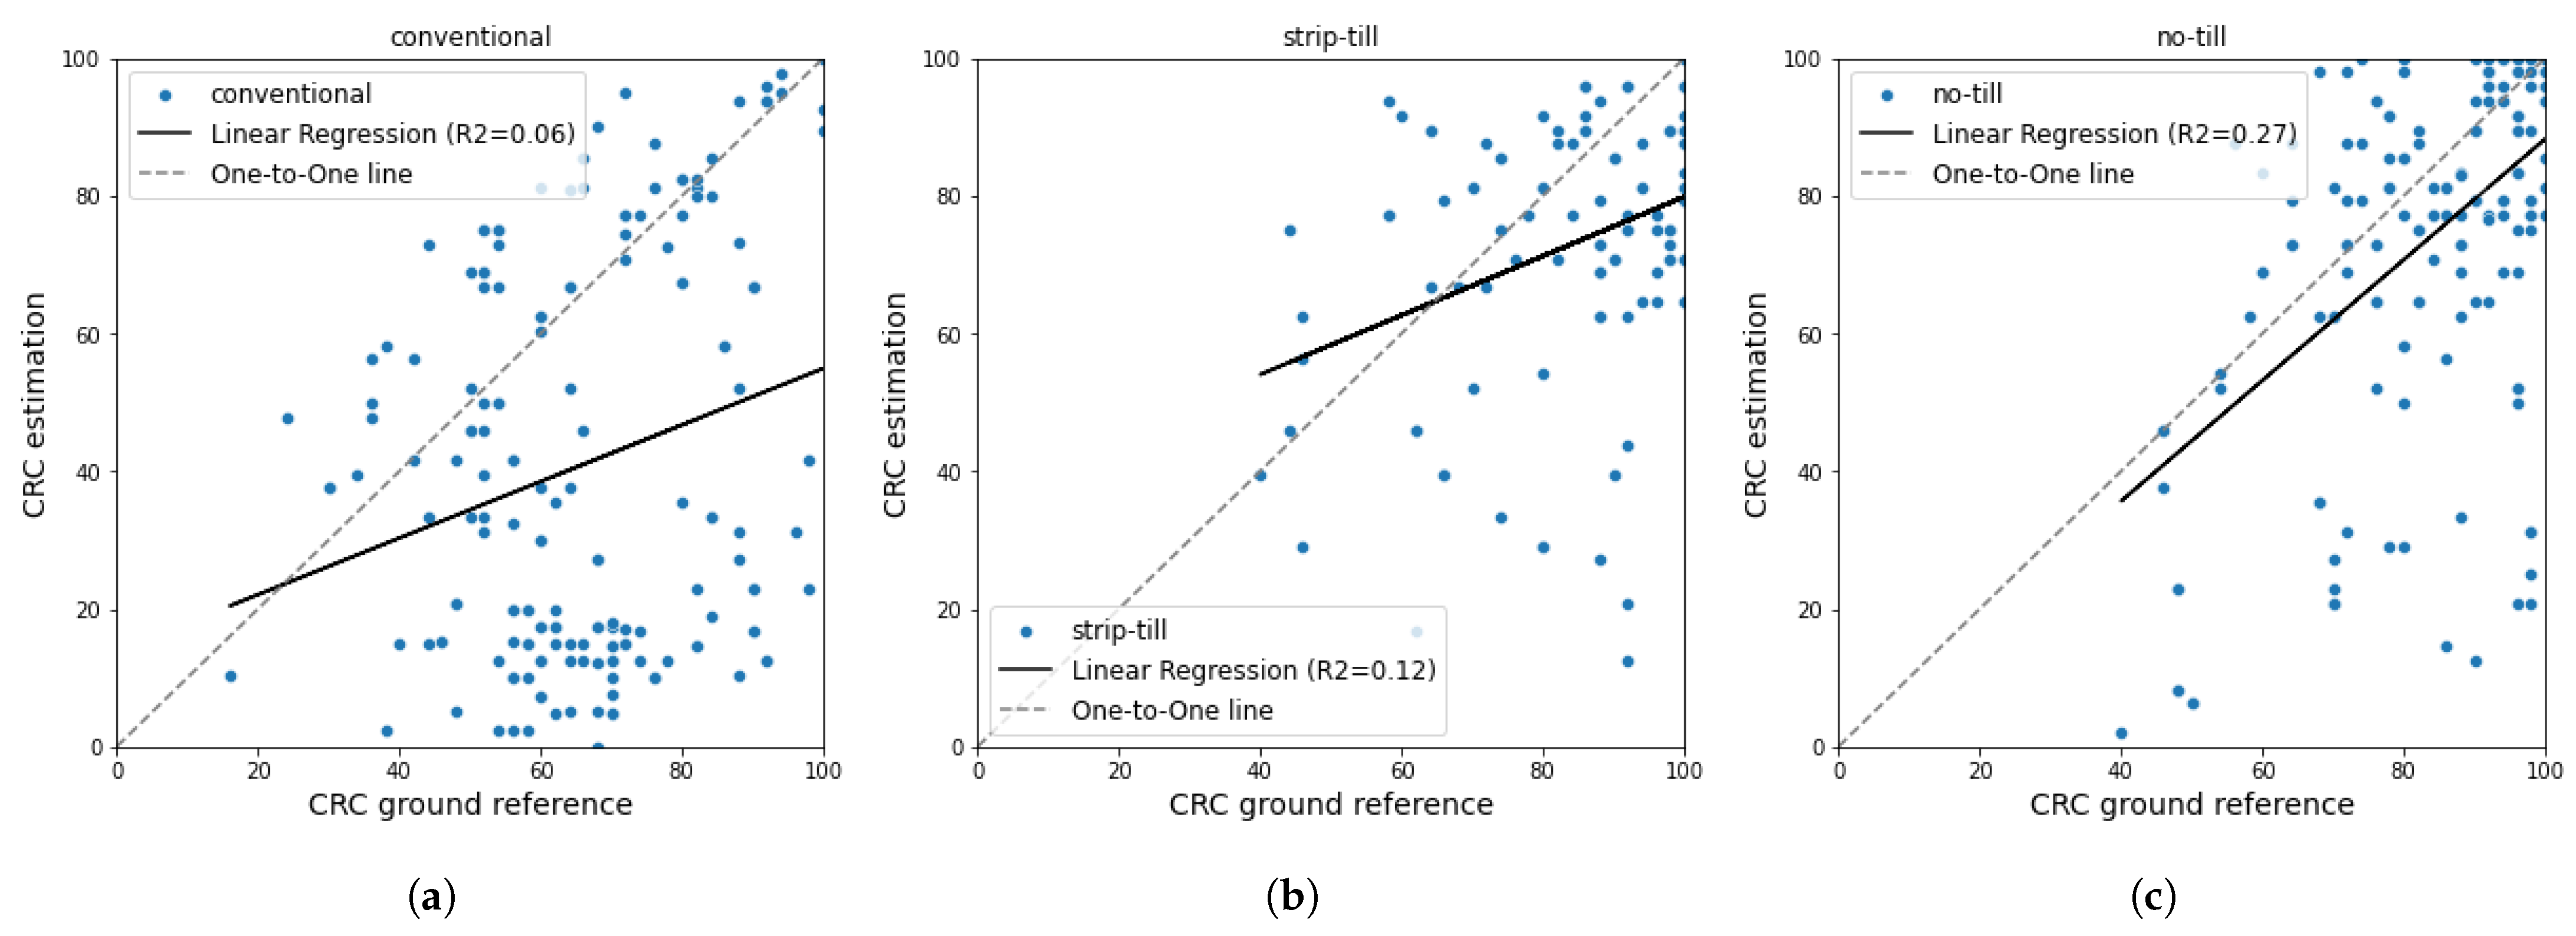
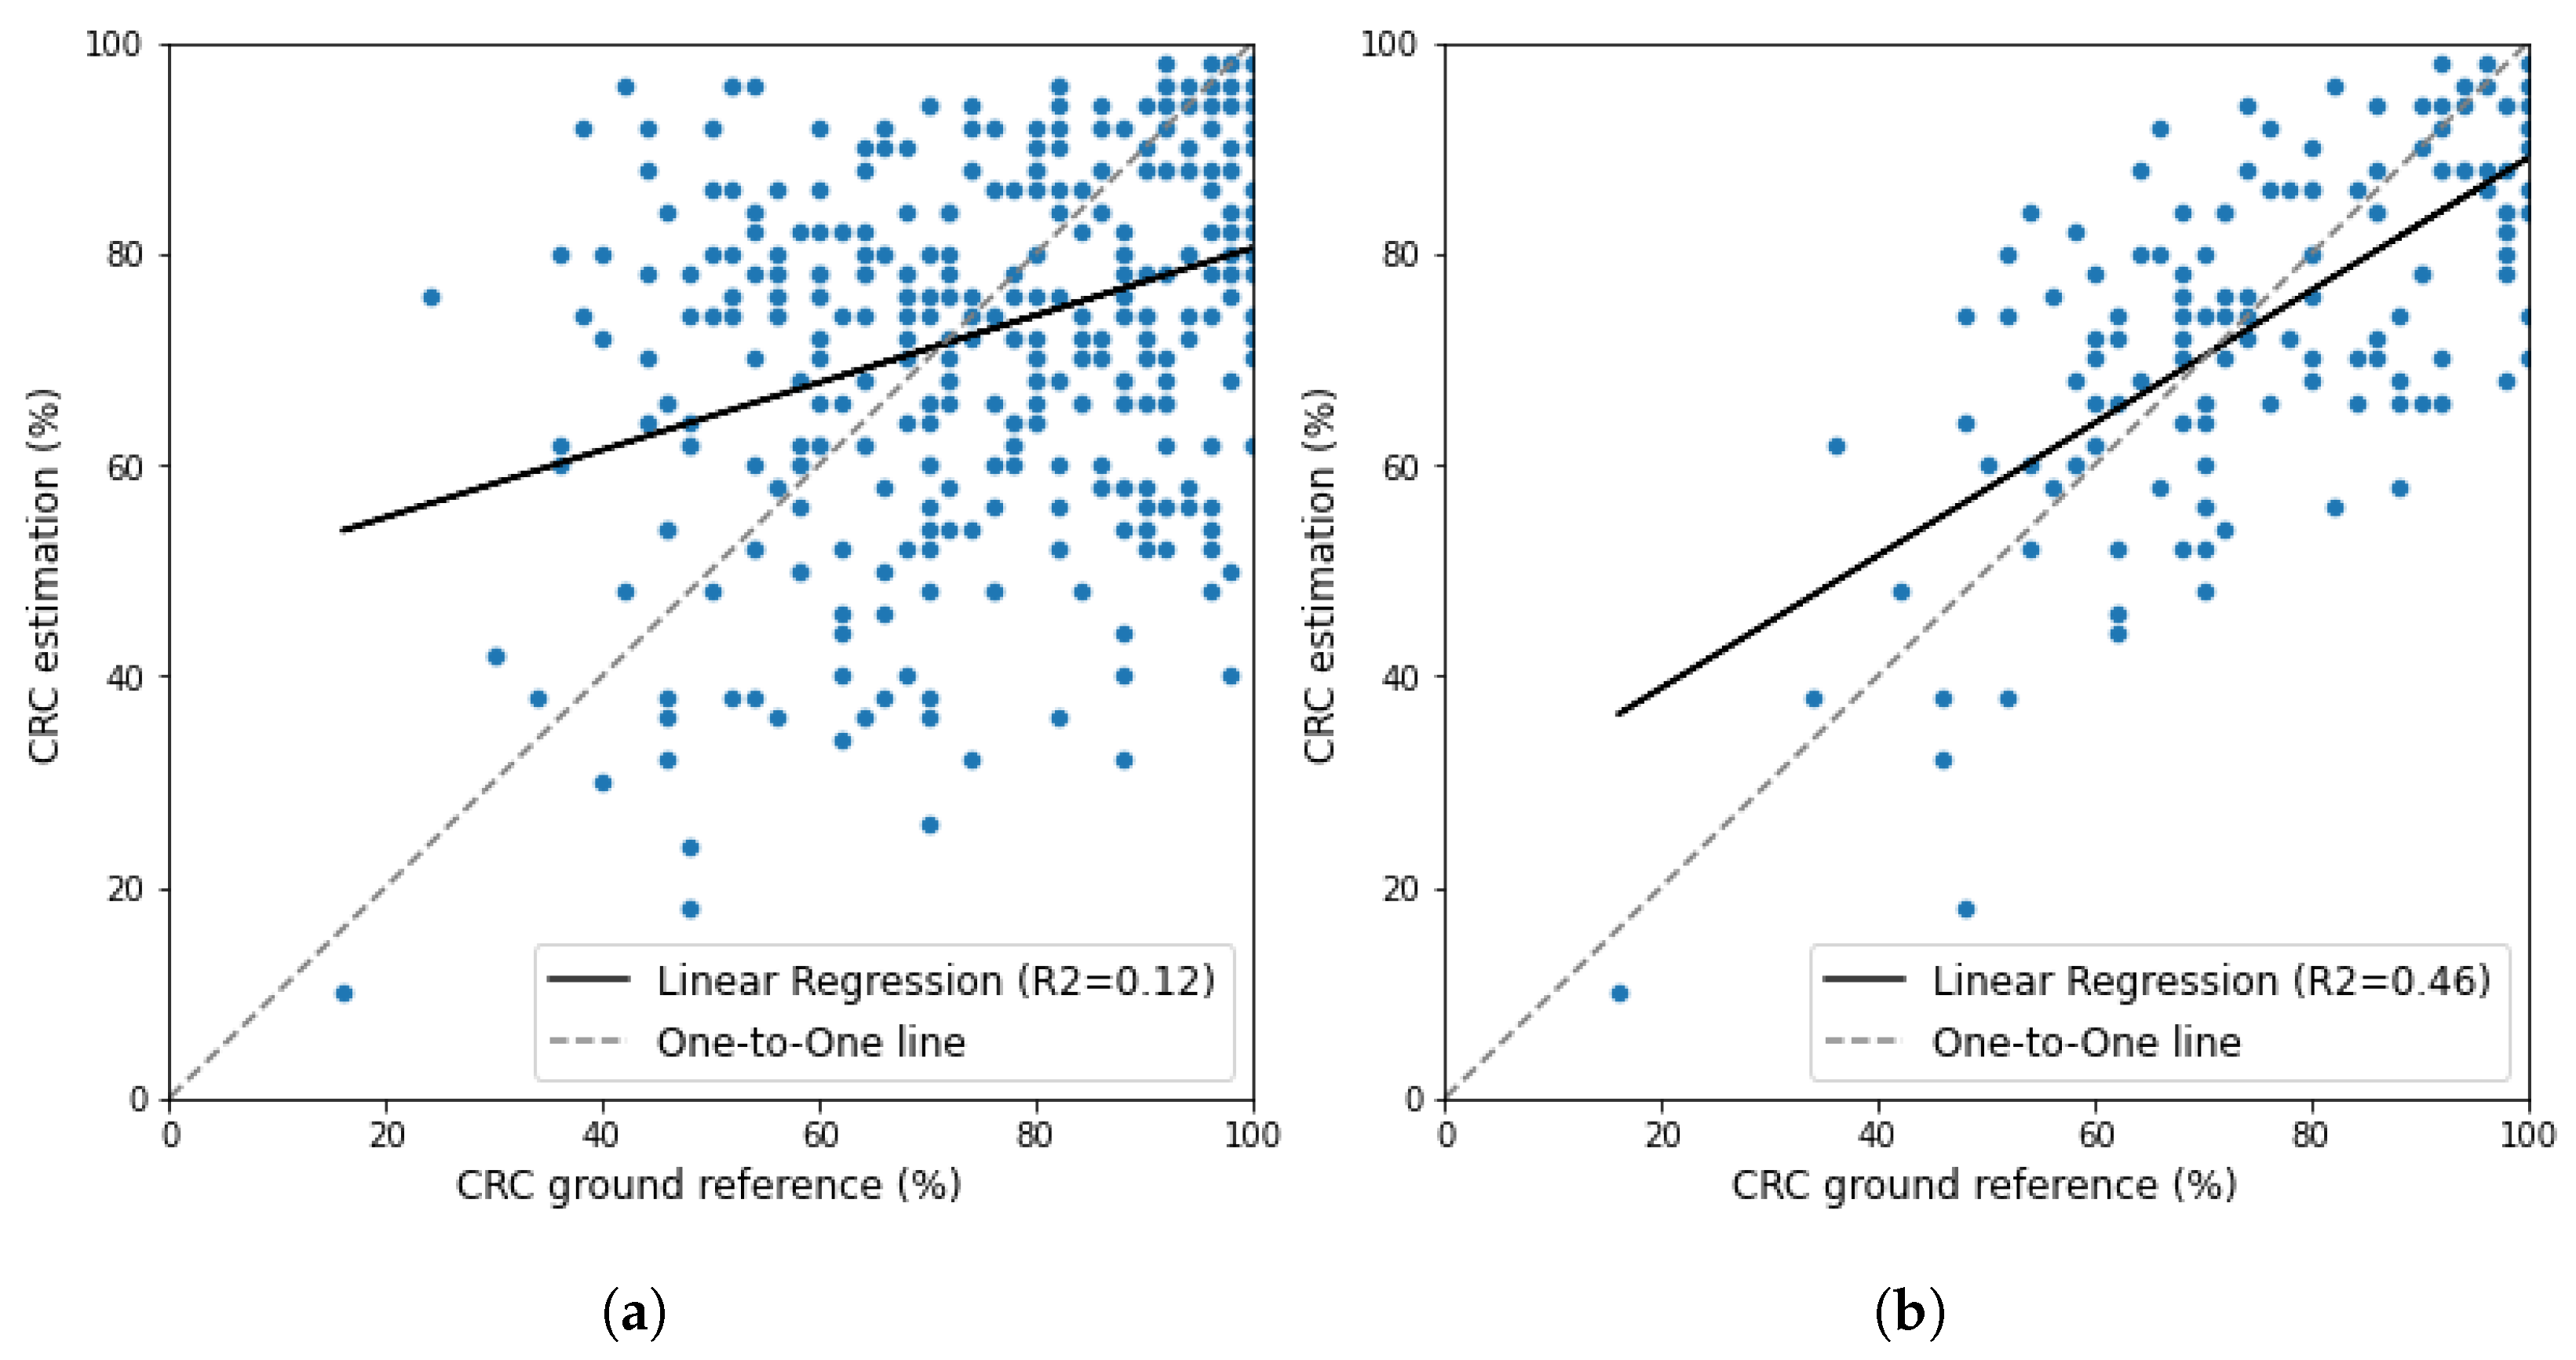
| Field | Crop | Tillage Practice | Longitude | Latitude |
|---|---|---|---|---|
| Mckinnis North | Corn | Conventional | −86.985901 | 40.4813251 |
| Mckinnis South | Corn | Conventional | −86.983845 | 40.4742143 |
| Griner–Wag–Rus | Corn | Conventional | −86.961483 | 40.5629297 |
| Field 57 | soybeans | Conventional | −86.999923 | 40.4892381 |
| Field 69 | soybeans | Conventional | −87.000129 | 40.4895974 |
| Chris 40 | soybeans | Conventional | −86.952211 | 40.541898 |
| Field 267 East | Corn | Strip-till | −86.534623 | 41.7025976 |
| Field 267 West | Corn | Strip-till | −86.533099 | 41.7030615 |
| Field M1 | Corn | Strip-till | −85.15134 | 40.2488210 |
| Field J | soybeans | Strip-till | −85.152896 | 40.2582106 |
| Field 354 North | soybeans | Strip-till | −86.464354 | 41.7420796 |
| Field 354 South | soybeans | Strip-till | −86.465298 | 41.7411566 |
| County Line | Corn | No-till | −86.965141 | 40.5627906 |
| Church East | Corn | No-till | −86.967117 | 40.5822479 |
| Church West | Corn | No-till | −86.969163 | 40.5807252 |
| Don 209 Top | soybeans | No-till | −86.961481 | 40.5751723 |
| Don 209 Side | soybeans | No-till | −86.956971 | 40.5750181 |
| Don 209 Bottom | soybeans | No-till | −86.962394 | 40.5700434 |
| Field | First Visit (Date) | First Visit CRC | Second Visit (Date) | Second Visit CRC |
|---|---|---|---|---|
| Mckinnis North | 20 December 2021 | 43.25 | 27 April 2022 | 62.12 |
| Mckinnis South | 20 December 2021 | 43.86 | 27 April 2022 | 64.37 |
| Griner–Wag–Rus | 4 January 2022 | 56.75 | 12 May 2022 | 84.75 |
| County Line | 4 January 2022 | 91.00 | 29 April 2022 | 94.37 |
| Church East | 4 January 2022 | 89.87 | 12 May 2022 | 83.62 |
| Church West | 4 January 2022 | 95.75 | 12 May 2022 | 82.37 |
| Field 57 | 4 March 2022 | 47.25 | 27 April 2022 | 57.5 |
| Chris 40 | 4 March 2022 | 86.00 | 29 April 2022 | 85.00 |
| Field M1 | 3 April 2022 | 91.75 | 11 May 2022 | 65.5 |
| Field J | 3 April 2022 | 73.87 | 11 May 2022 | 52.75 |
| Field 69 | 10 April 2022 | 60.37 | 29 April 2022 | 67.00 |
| Don 209 Top | 10 April 2022 | 87.12 | 19 May 2022 | 78 |
| Don 209 Side | 10 April 2022 | 76.87 | 19 May 2022 | 79.25 |
| Don 209 Bottom | 2 April 2022 | 88.00 | 19 May 2022 | 70.5 |
| Field 354 North | 10 May 2022 | 82.75 | - | - |
| Field 354 South | 10 May 2022 | 85.75 | - | - |
| Field 267 North | 10 May 2022 | 95.12 | - | - |
| Field 267 South | 10 May 2022 | 93.37 | - | - |
| Number of Clusters | SSE | Variance in SSE () | Average Silhouette | Variance in Silhouette () |
|---|---|---|---|---|
| 2 | 126,905,848 | 348 | 0.58 | 1.8 |
| 3 | 64,285,609 | 73 | 0.53 | 0.76 |
| 4 | 39,426,688 | 25 | 0.51 | 0.31 |
| 5 | 26,977,695 | 11 | 0.498 | 0.15 |
| 6 | 19,876,733 | 6.4 | 0.483 | 0.17 |
| 7 | 15,421,452 | 4 | 0.472 | 0.24 |
| 8 | 12,471,223 | 2.7 | 0.461 | 0.33 |
| 9 | 10,397,093 | 2 | 0.451 | 0.44 |
| 10 | 8,891,208 | 1.5 | 0.44 | 0.52 |
| Eigen Value () | Eigen Vector | ||
|---|---|---|---|
| First Component | Second Component | Third Component | |
| 7.05 | 0.57 | 0.42 | −0.15 |
| 0.03 | 0.57 | 0.09 | 0.28 |
| 0.01 | 0.56 | −0.50 | −0.11 |
Disclaimer/Publisher’s Note: The statements, opinions and data contained in all publications are solely those of the individual author(s) and contributor(s) and not of MDPI and/or the editor(s). MDPI and/or the editor(s) disclaim responsibility for any injury to people or property resulting from any ideas, methods, instructions or products referred to in the content. |
© 2024 by the authors. Licensee MDPI, Basel, Switzerland. This article is an open access article distributed under the terms and conditions of the Creative Commons Attribution (CC BY) license (https://creativecommons.org/licenses/by/4.0/).
Share and Cite
Azimi, F.; Jung, J. Automated Crop Residue Estimation via Unsupervised Techniques Using High-Resolution UAS RGB Imagery. Remote Sens. 2024, 16, 1135. https://doi.org/10.3390/rs16071135
Azimi F, Jung J. Automated Crop Residue Estimation via Unsupervised Techniques Using High-Resolution UAS RGB Imagery. Remote Sensing. 2024; 16(7):1135. https://doi.org/10.3390/rs16071135
Chicago/Turabian StyleAzimi, Fatemeh, and Jinha Jung. 2024. "Automated Crop Residue Estimation via Unsupervised Techniques Using High-Resolution UAS RGB Imagery" Remote Sensing 16, no. 7: 1135. https://doi.org/10.3390/rs16071135
APA StyleAzimi, F., & Jung, J. (2024). Automated Crop Residue Estimation via Unsupervised Techniques Using High-Resolution UAS RGB Imagery. Remote Sensing, 16(7), 1135. https://doi.org/10.3390/rs16071135


