

Satellite-Derived Indicators of Drought Severity and Water Storage in Estuarine Reservoirs: A Case Study of Qingcaosha Reservoir, China

Abstract

1. Introduction
2. Materials and Methods
Study Area
3. Data and Methods
3.1. Satellite Imagery and Waterline Extraction
3.2. Data Validation
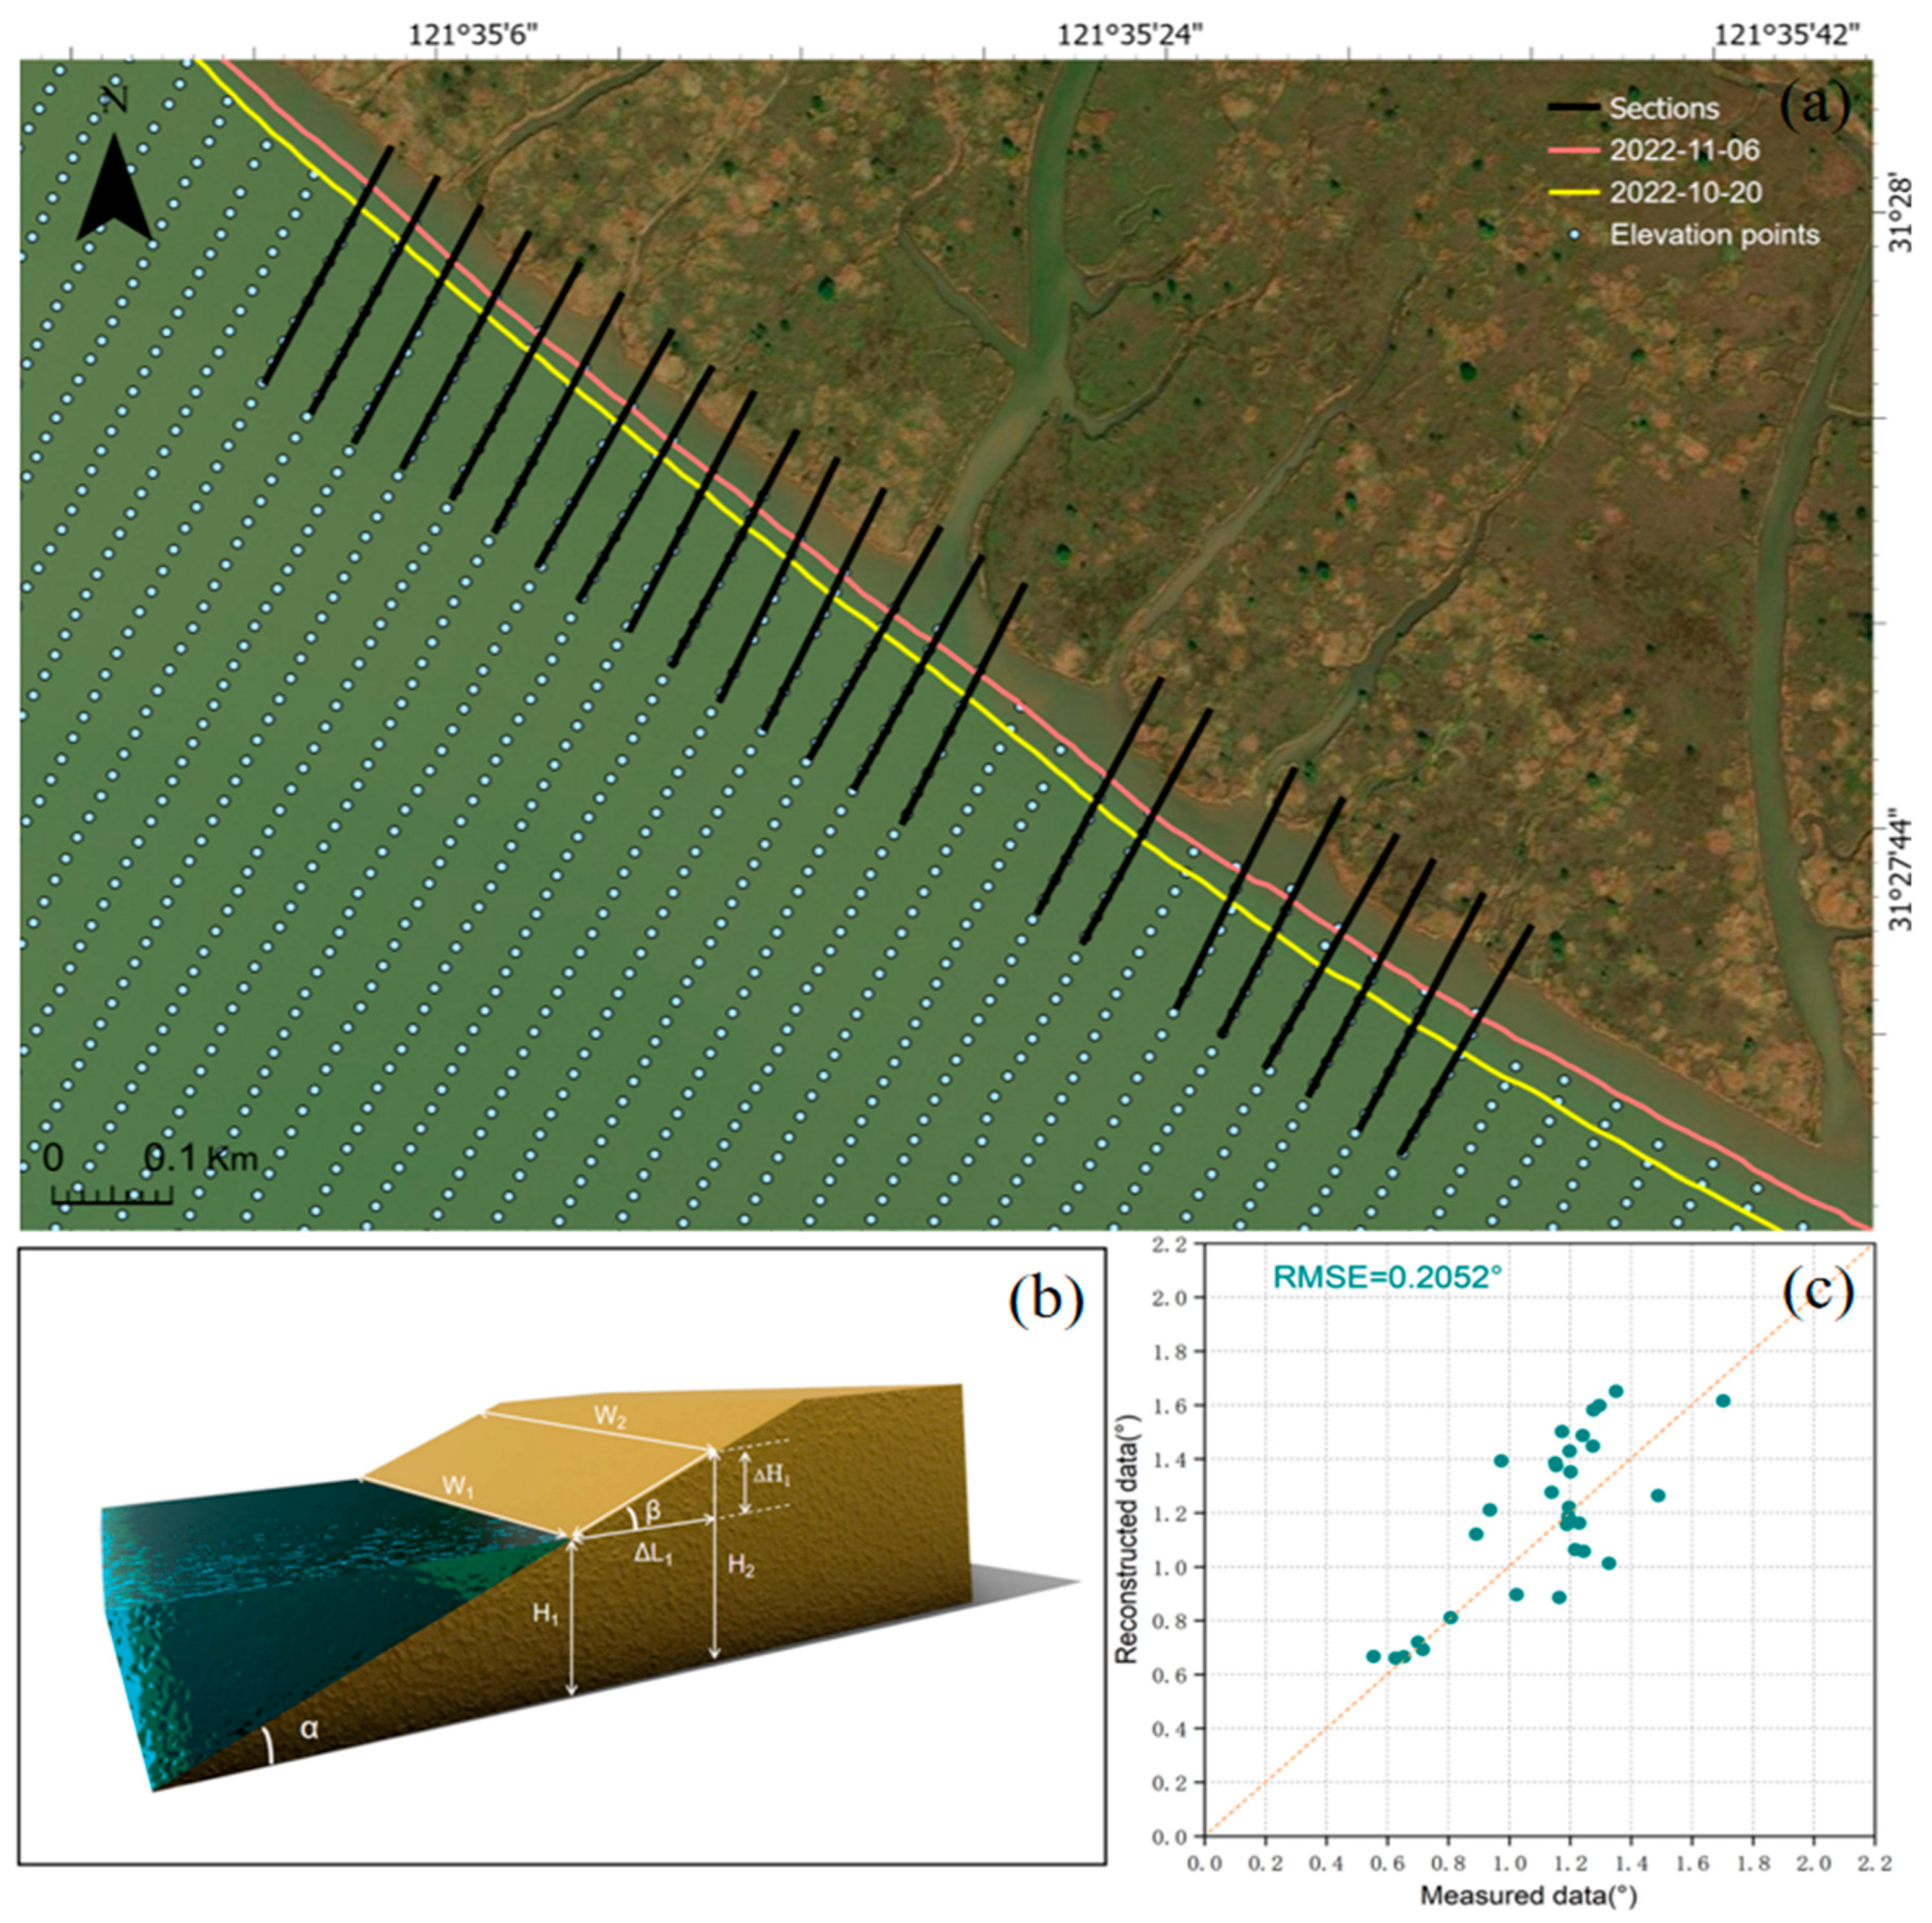
3.2.1. Slope
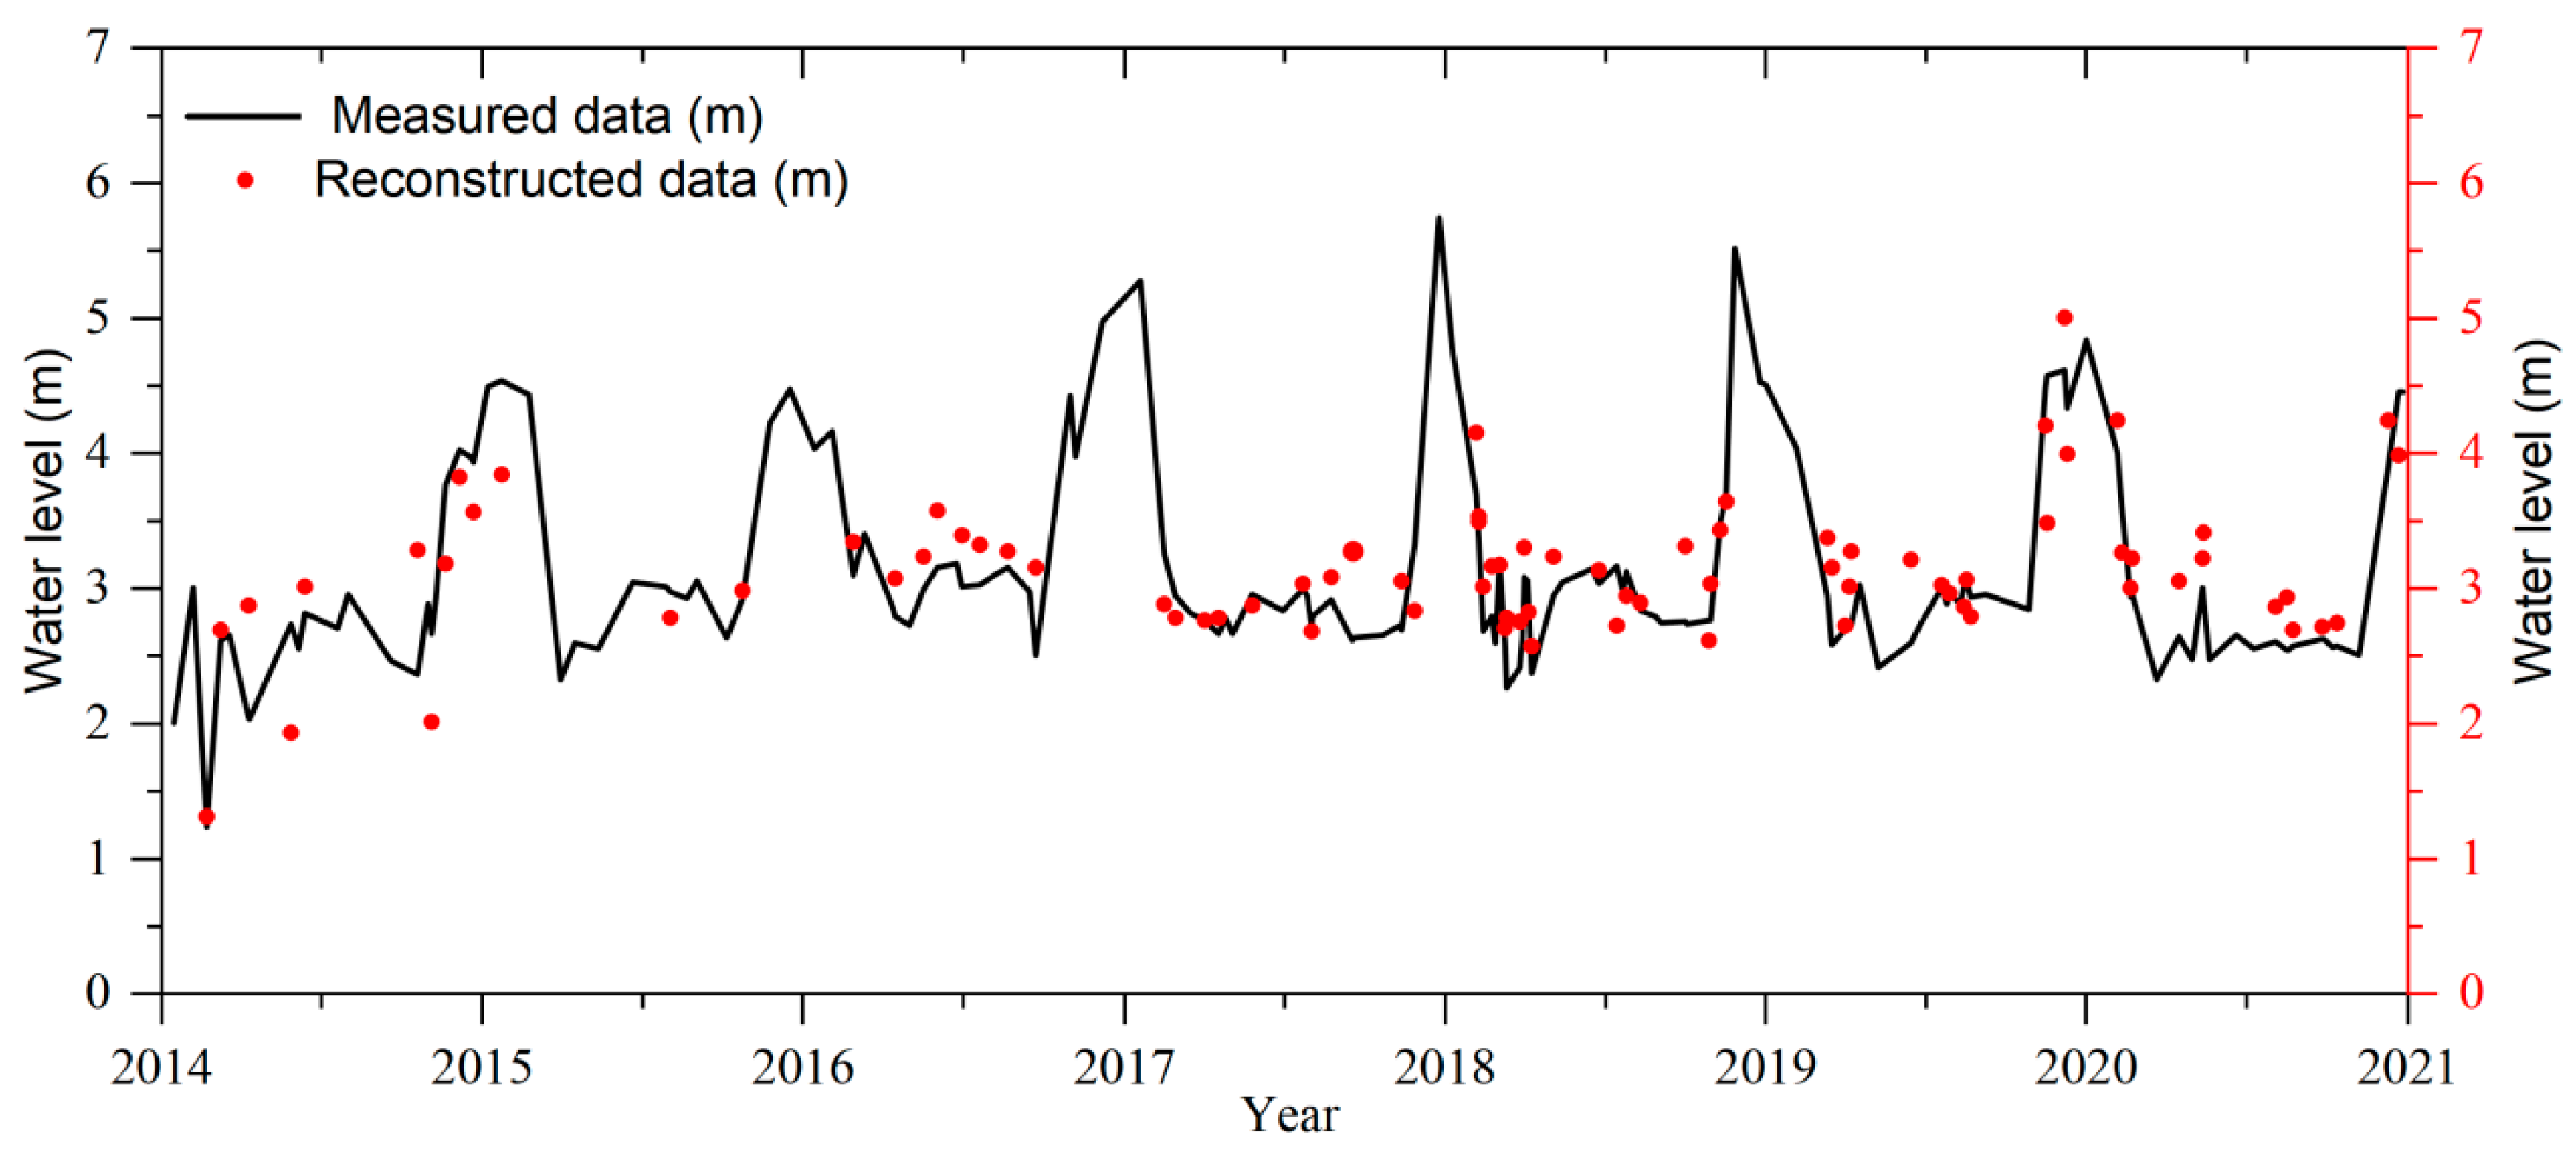
3.2.2. Water Level
3.2.3. The Reliability of Evaluating the Reservoir Water Level
4. Results
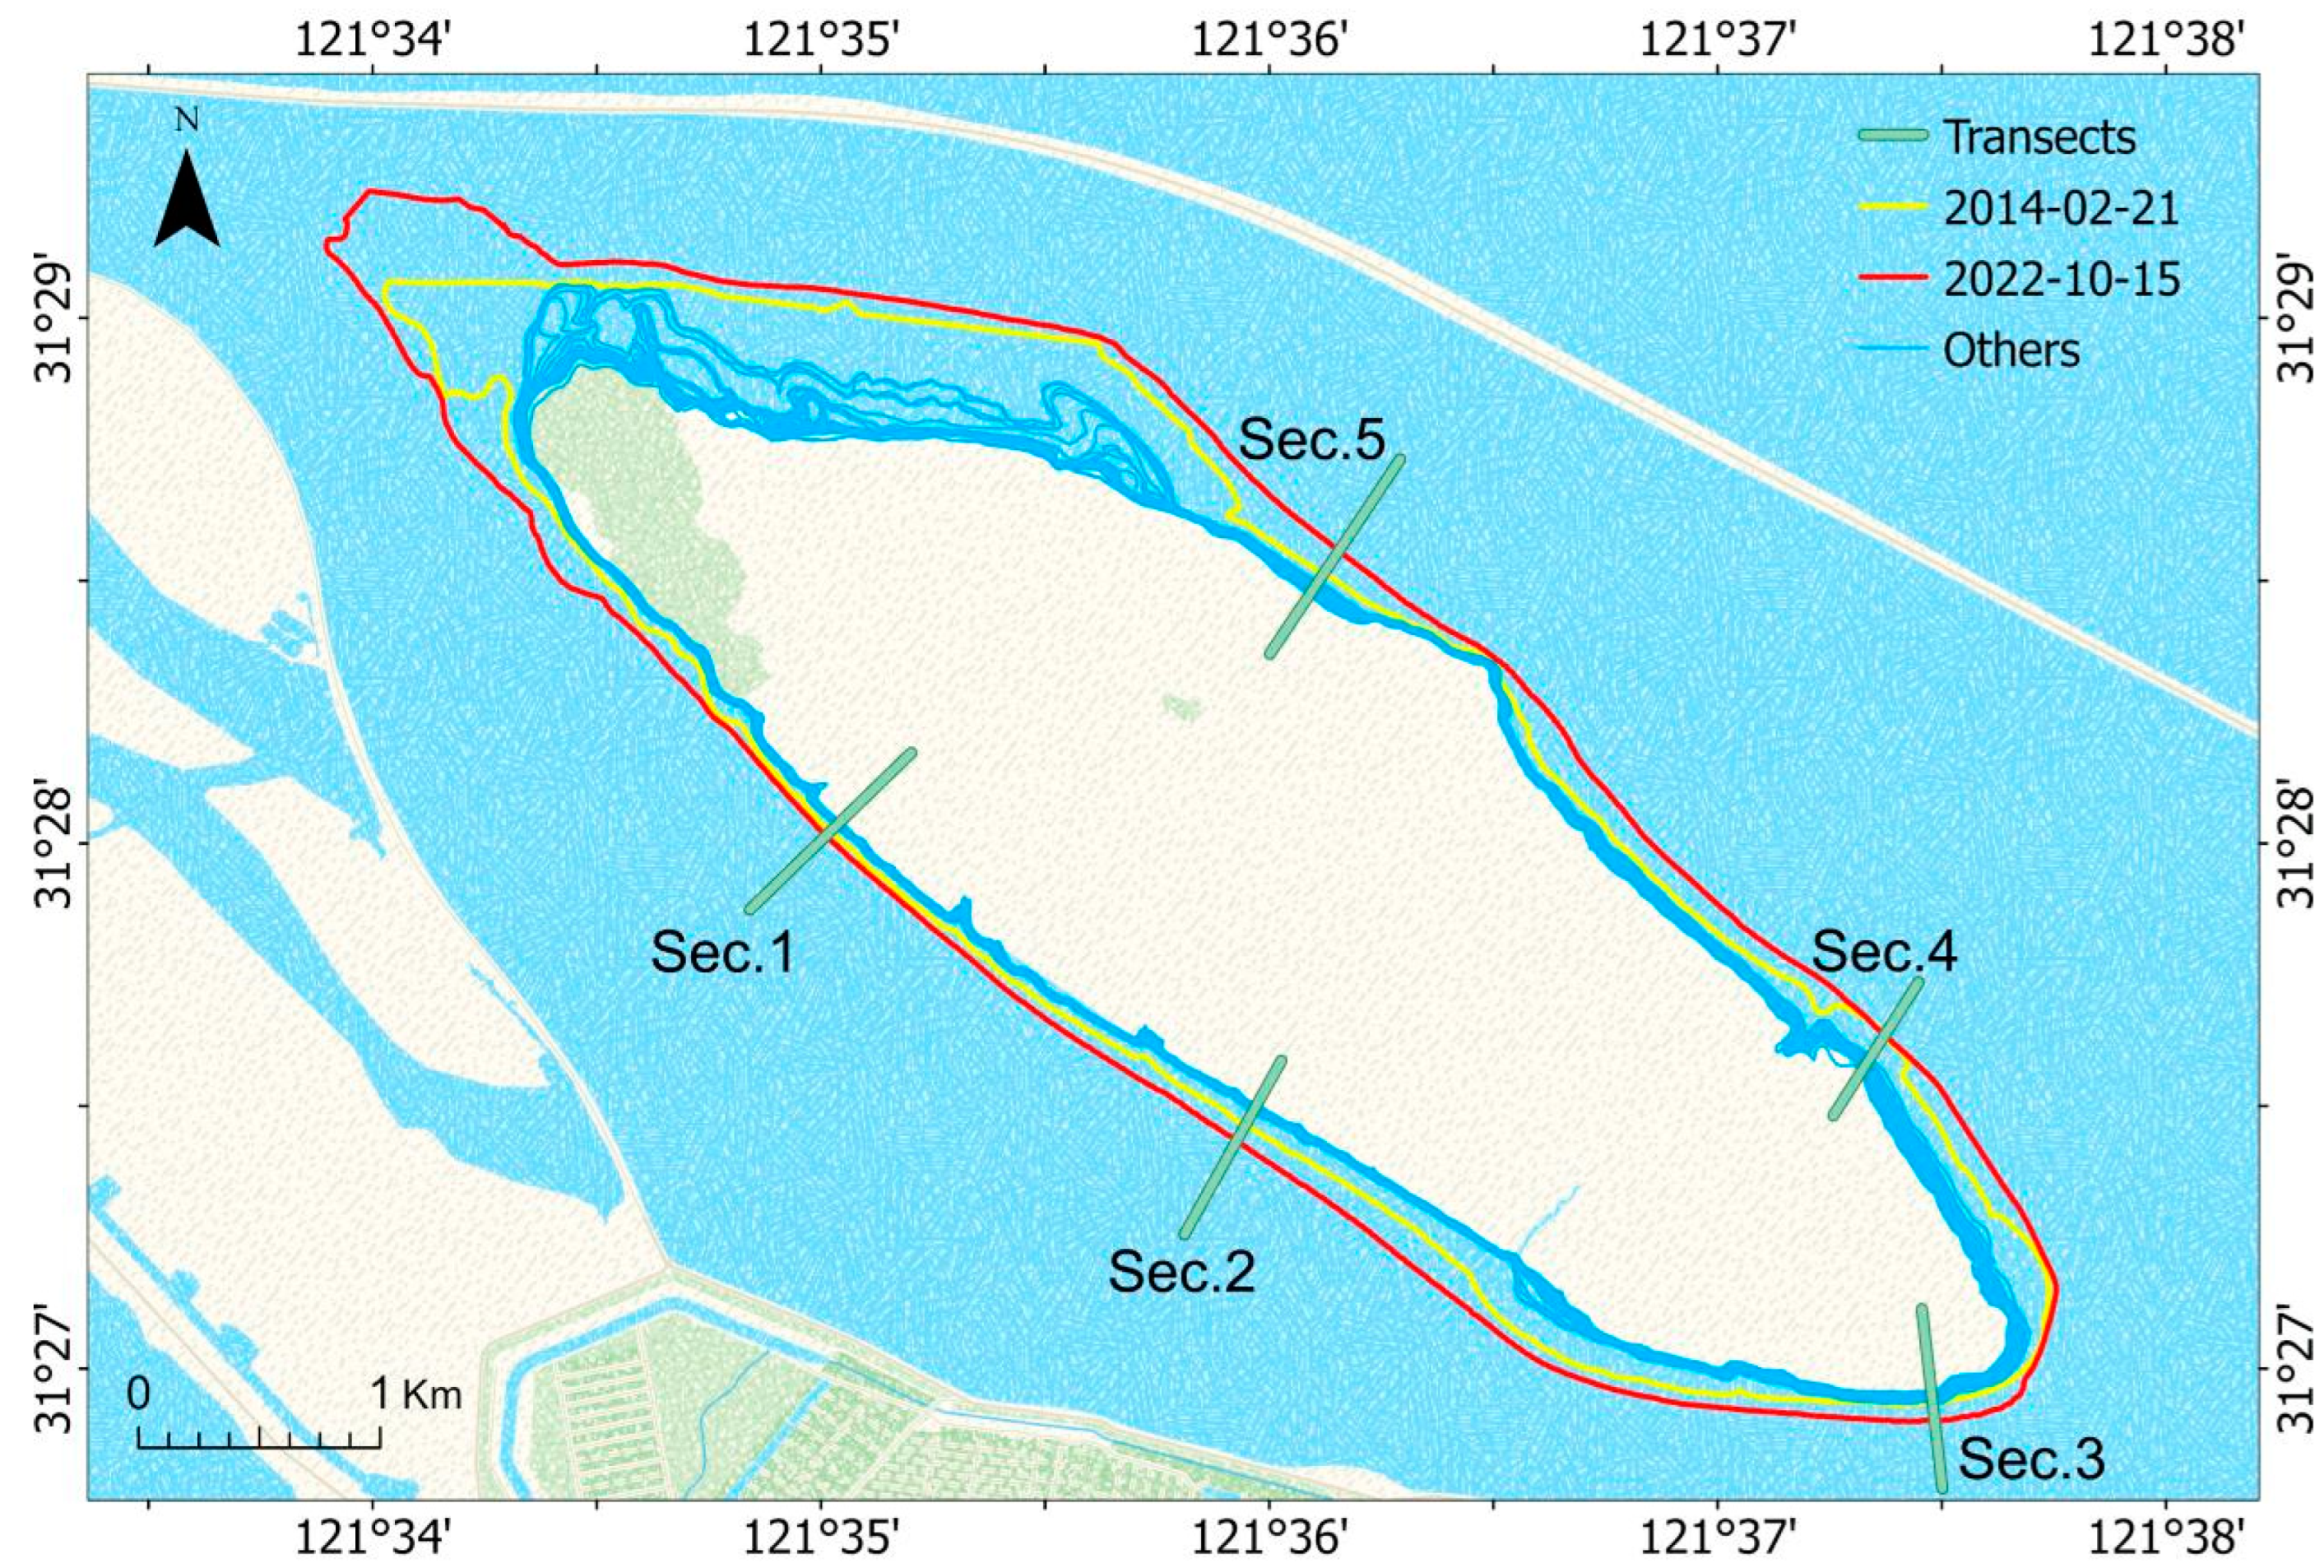
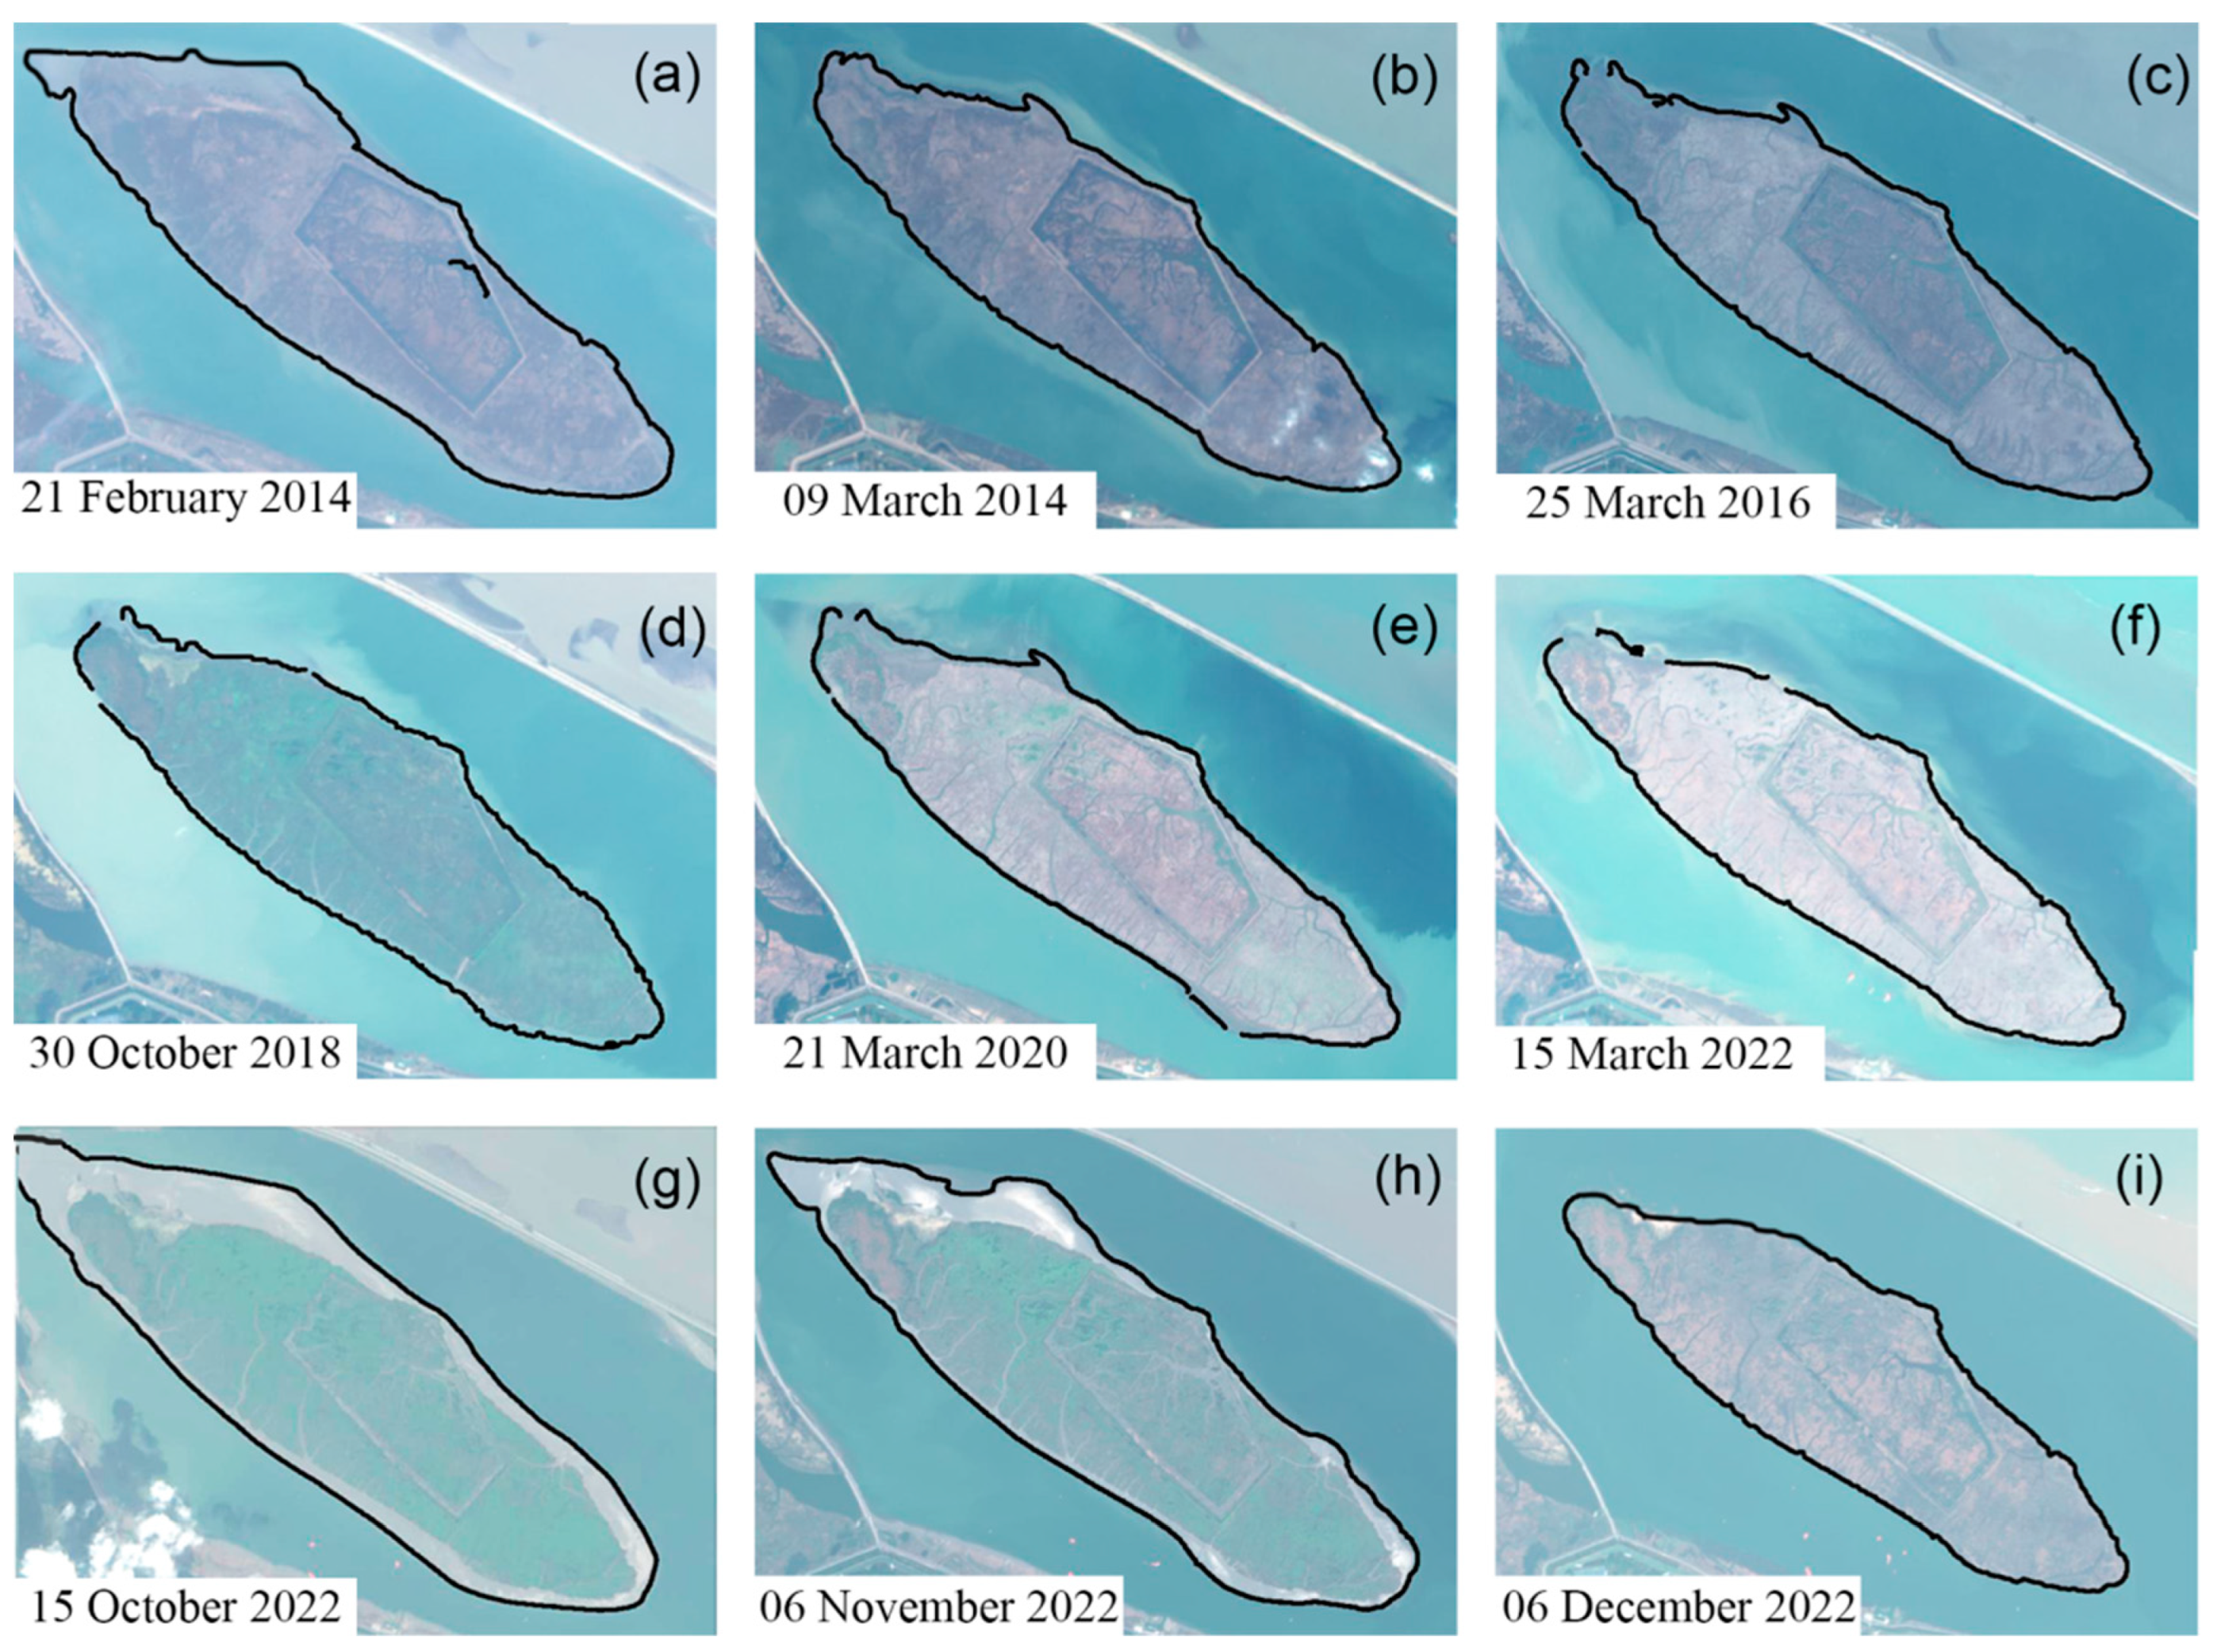
4.1. Extraction of the Waterlines around the Shallow Shoal in the Qingcaosha Reservoir
4.2. Assessment of the Reservoir Drought Severity
4.3. Storage Capacity Evaluation of the Qingcaosha Reservoir
5. Discussion
6. Conclusions
Author Contributions
Funding
Data Availability Statement
Acknowledgments
Conflicts of Interest
References
- Leuven, J.R.; Pierik, H.J.; Vegt, M.V.D.; Bouma, T.J.; Kleinhans, M.G. Sea-level-rise-induced threats depend on the size of tide-influenced estuaries worldwide. Nat. Clim. Chang. 2019, 9, 986–992. [Google Scholar] [CrossRef]
- Zhu, J.; Wu, H.; Li, L.; Qiu, C. Saltwater intrusion in the Changjiang Estuary. Coastal Environment, Disaster, and Infrastructure-A Case Study of China’s Coastline; IntechOpen: Rijeka, Croatia, 2018; pp. 49–73. [Google Scholar]
- Harrison, L.M.; Coulthard, T.J.; Robins, P.E.; Lewis, M.J. Sensitivity of estuaries to compound flooding. Estuar. Coasts 2022, 45, 1250–1269. [Google Scholar] [CrossRef]
- Olisah, C.; Adams, J.B. Analysing 70 years of research output on South African estuaries using bibliometric indicators. Estuar. Coast. Shelf Sci. 2021, 252, 107285. [Google Scholar] [CrossRef]
- McLusky, D.S.; Elliott, M. The Estuarine Ecosystem: Ecology, Threats, and Management, 3rd ed.; Oxford University Press: Oxford, UK; New York, NY, USA, 2004; ISBN 978-0-19-853091-6. [Google Scholar]
- Jeong, Y.H.; Yang, J.S.; Park, K. Changes in Water Quality After the Construction of an Estuary Dam in the Geum River Estuary Dam System, Korea. J. Coast. Res. 2014, 298, 1278–1286. [Google Scholar] [CrossRef]
- Te, S.H.; Gin, K.Y.-H. The dynamics of cyanobacteria and microcystin production in a tropical reservoir of Singapore. Harmful Algae 2011, 10, 319–329. [Google Scholar] [CrossRef]
- Mishra, A.K.; Singh, V.P. A review of drought concepts. J. Hydrol. 2010, 391, 202–216. [Google Scholar] [CrossRef]
- Shah, D.; Zhao, G.; Li, Y.; Singh, V.P.; Gao, H. Assessing Global Reservoir-Based Hydrological Droughts by Fusing Storage and Evaporation. Geophys. Res. Lett. 2024, 51, e2023GL106159. [Google Scholar] [CrossRef]
- Gibson, R.N.; Barnes, M.; Atkinson, R.J.A. Impact of changes in flow of freshwater on estuarine and open coastal habitats and the associated organisms. Oceanogr. Mar. Biol. Annu. Rev. 2002, 40, 233. [Google Scholar]
- Oliveira, V.H.; Sousa, M.C.; Morgado, F.; Dias, J.M. Modeling the Impact of Extreme River Discharge on the Nutrient Dynamics and Dissolved Oxygen in Two Adjacent Estuaries (Portugal). JMSE 2019, 7, 412. [Google Scholar] [CrossRef]
- Zhu, J.; Cheng, X.; Li, L.; Wu, H.; Gu, J.; Lyu, H. Dynamic Mechanism of an Extremely Severe Saltwater Intrusion in the Changjiang Estuary in February 2014. Hydrol. Earth Syst. Sci. 2020, 24, 5043–5056. [Google Scholar] [CrossRef]
- Bellafiore, D.; Ferrarin, C.; Maicu, F.; Manfè, G.; Lorenzetti, G.; Umgiesser, G.; Zaggia, L.; Levinson, A.V. Saltwater Intrusion in a Mediterranean Delta Under a Changing Climate. J. Geophys. Res. Oceans 2021, 126, e2020JC016437. [Google Scholar] [CrossRef]
- Brunner, M.I.; Slater, L.; Tallaksen, L.M.; Clark, M. Challenges in modeling and predicting floods and droughts: A review. Wiley Interdiscip. Rev. 2021, 8, e1520. [Google Scholar] [CrossRef]
- Liu, X.; Hou, K.; Jia, H.; Zhao, J.; Mili, L.; Jin, X.; Wang, D. A Planning-Oriented Resilience Assessment Framework for Transmission Systems Under Typhoon Disasters. IEEE Trans. Smart Grid 2020, 11, 5431–5441. [Google Scholar] [CrossRef]
- Li, L.; Wang, C.; Pareja-Roman, L.F.; Zhu, J.; Chant, R.J.; Wang, G. Effects of Typhoon on Saltwater Intrusion in a High Discharge Estuary. J. Geophys. Res. Oceans 2022, 127, e2021JC018206. [Google Scholar] [CrossRef]
- Chow, D. 2022 Was the Year of Drought. Available online: https://www.nbcnews.com/science/environment/2022-was-year-drought-rcna62410 (accessed on 31 December 2023).
- Mikhailov, V.N.; Korotaev, V.N.; Mikhailova, M.V.; Congxian, L.; Shuguang, L. Hydrological Regime and Morphodynamics of the Changjiang River Mouth Area. Water Resour. 2001, 28, 351–363. [Google Scholar] [CrossRef]
- Sigurdsson, J.; Armannsson, S.E.; Ulfarsson, M.O.; Sveinsson, J.R. Fusing Sentinel-2 and Landsat 8 Satellite Images Using a Model-Based Method. Remote Sens. 2022, 14, 3224. [Google Scholar] [CrossRef]
- Qiu, C.; Zhu, J.-R. Influence of Seasonal Runoff Regulation by the Three Gorges Reservoir on Saltwater Intrusion in the Changjiang River Estuary. Cont. Shelf Res. 2013, 71, 16–26. [Google Scholar] [CrossRef]
- Duan, Z.; Bastiaanssen, W.G.M. Estimating Water Volume Variations in Lakes and Reservoirs from Four Operational Satellite Altimetry Databases and Satellite Imagery Data. Remote Sens. Environ. 2013, 134, 403–416. [Google Scholar] [CrossRef]
- Sheffield, J.; Wood, E.F.; Pan, M.; Beck, H.; Coccia, G.; Serrat-Capdevila, A.; Verbist, K. Satellite Remote Sensing for Water Resources Management: Potential for Supporting Sustainable Development in Data-Poor Regions. Water Resour. Res. 2018, 54, 9724–9758. [Google Scholar] [CrossRef]
- Zhao, J.; Zhang, F.; Chen, S.; Wang, C.; Chen, J.; Zhou, H.; Xue, Y. Remote Sensing Evaluation of Total Suspended Solids Dynamic with Markov Model: A Case Study of Inland Reservoir across Administrative Boundary in South China. Sensors 2020, 20, 6911. [Google Scholar] [CrossRef]
- Wu, Q.; Ke, L.; Wang, J.; Pavelsky, T.M.; Allen, G.H.; Sheng, Y.; Duan, X.; Zhu, Y.; Wu, J.; Wang, L.; et al. Satellites Reveal Hotspots of Global River Extent Change. Nat. Commun. 2023, 14, 1587. [Google Scholar] [CrossRef]
- Yao, F.; Livneh, B.; Rajagopalan, B.; Wang, J.; Crétaux, J.-F.; Wada, Y.; Berge-Nguyen, M. Satellites Reveal Widespread Decline in Global Lake Water Storage. Science 2023, 380, 743–749. [Google Scholar] [CrossRef]
- Li, X.; Tao, R.; Zhang, K. Drought Monitoring Based on Remote Sensing. In Remote Sensing of Water-Related Hazards; Wiley: Hoboken, NJ, USA, 2022; pp. 149–168. [Google Scholar]
- Yang, X.; Zhao, S.; Qin, X.; Zhao, N.; Liang, L. Mapping of Urban Surface Water Bodies from Sentinel-2 MSI Imagery at 10 m Resolution via NDWI-Based Image Sharpening. Remote Sens. 2017, 9, 596. [Google Scholar] [CrossRef]
- Ali, M.I.; Dirawan, G.D.; Hasim, A.H.; Abidin, M.R. Detection of Changes in Surface Water Bodies Urban Area with NDWI and MNDWI Methods. International Journal on Advanced Science. Eng. Inf. Technol. 2019, 9, 946. [Google Scholar]
- Gao, H.; Birkett, C.; Lettenmaier, D.P. Global Monitoring of Large Reservoir Storage from Satellite Remote Sensing. Water Resour. Res. 2012, 48, 2012WR012063. [Google Scholar] [CrossRef]
- Zhang, S.; Gao, H.; Naz, B.S. Monitoring reservoir storage in South Asia from multisatellite remote sensing. Water Resour. Res. 2014, 50, 8927–8943. [Google Scholar] [CrossRef]
- Calmant, S.; Seyler, F.; Cretaux, J.F. Monitoring Continental Surface Waters by Satellite Altimetry. Surv. Geophys. 2008, 29, 247–269. [Google Scholar] [CrossRef]
- Birkett, C.M.; Beckley, B. Investigating the Performance of the Jason-2/OSTM Radar Altimeter over Lakes and Reservoirs. Mar. Geod. 2010, 33, 204–238. [Google Scholar] [CrossRef]
- Frappart, F.; Seyler, F.; Martinez, J.-M.; León, J.G.; Cazenave, A. Floodplain Water Storage in the Negro River Basin Estimated from Microwave Remote Sensing of Inundation Area and Water Levels. Remote Sens. Environ. 2005, 99, 387–399. [Google Scholar] [CrossRef]
- Ričko, M.; Birkett, C.M.; Carton, J.A.; Crétaux, J.-F. Intercomparison and Validation of Continental Water Level Products Derived from Satellite Radar Altimetry. J. Appl. Remote Sens. 2012, 6, 061710. [Google Scholar] [CrossRef]
- Zou, Y.; Greenberg, J.A. A Spatialized Classification Approach for Land Cover Mapping Using Hyperspatial Imagery. Remote Sens. Environ. 2019, 232, 111248. [Google Scholar] [CrossRef]
- Wang, Y.; Long, D.; Li, X. High-temporal-resolution monitoring of reservoir water storage of the Lancang-Mekong River. Remote Sens. Environ. 2023, 292, 113575. [Google Scholar] [CrossRef]
- Maswanganye, S.E.; Dube, T.; Mazvimavi, D.; Jovanovic, N. Remotely Sensed Applications in Monitoring the Spatio-Temporal Dynamics of Pools and Flows along Non-Perennial Rivers: A Review. South Afr. Geogr. J. 2022, 104, 427–445. [Google Scholar] [CrossRef]
- Gorelick, N.; Hancher, M.; Dixon, M.; Ilyushchenko, S.; Thau, D.; Moore, R. Google Earth Engine: Planetary-Scale Geospatial Analysis for Everyone. Remote Sens. Environ. 2017, 202, 18–27. [Google Scholar] [CrossRef]
- Li, H.; Luo, Z.; Xu, Y.; Zhu, S.; Chen, X.; Geng, X.; Xiao, L.; Wan, W.; Cui, Y. A remote sensing-based area dataset for approximately 40 years that reveals the hydrological asynchrony of Lake Chad based on Google Earth Engine. J. Hydrol. 2021, 603, 126934. [Google Scholar] [CrossRef]
- Condeça, J.; Nascimento, J.; Barreiras, N. Monitoring the Storage Volume of Water Reservoirs Using Google Earth Engine. Water Resour. Res. 2022, 58, e2021WR030026. [Google Scholar] [CrossRef]
- Zhao, G.; Gao, H. Towards Global Hydrological Drought Monitoring Using Remotely Sensed Reservoir Surface Area. Geophys. Res. Lett. 2019, 46, 13027–13035. [Google Scholar] [CrossRef]
- Xu, N.; Ma, Y.; Wei, Z.; Huang, C.; Li, G.; Zheng, H.; Wang, X.H. Satellite Observed Recent Rising Water Levels of Global Lakes and Reservoirs. Environ. Res. Lett. 2022, 17, 074013. [Google Scholar] [CrossRef]
- Zhu, J.R.; Gu, Y.L.; Wu, H. Determination of the period not suitable for taking domestic water supply to the Qingcaosha Reservoir near Changjiang River Estuary. Oceanol. Limnol. Sin. 2013, 44, 1138–1145. [Google Scholar]
- Yuan, J.Z.; Wu, C.E. Shanghai Coastal Reservoirs: Their Development and Experience from Their Design. HydrolinkIahrCoast. Res. 2018, 10–13. Available online: https://iahr.oss-accelerate.aliyuncs.com/library/HydroLink/HydroLink2018_01_Coastal_Reservoirs.pdf (accessed on 10 June 2023).
- Guo, L.; Zhu, C.; Xie, W.; Xu, F.; Wu, H.; Wan, Y.; Wang, Z.; Zhang, W.; Shen, J.; Wang, Z.B.; et al. Changjiang Delta in the Anthropocene: Multi-scale hydro-morphodynamics and management challenges. Earth Sci. Rev. 2021, 223, 103850. [Google Scholar] [CrossRef]
- Vos, K.; Splinter, K.D.; Harley, M.D.; Simmons, J.A.; Turner, I.L. CoastSat: A Google Earth Engine-Enabled Python Toolkit to Extract Shorelines from Publicly Available Satellite Imagery. Environ. Model. Softw. 2019, 122, 104528. [Google Scholar] [CrossRef]
- Sentinel-2 User Handbook. Available online: https://sentinel.esa.int/documents/247904/685211/Sentinel-2_User_Handbook (accessed on 31 December 2023).
- Landsat 8 Data Users Handbook. Available online: https://www.usgs.gov/media/files/landsat-8-data-users-handbook (accessed on 31 December 2023).
- Claverie, M.; Ju, J.; Masek, J.G.; Dungan, J.L.; Vermote, E.F.; Roger, J.-C.; Skakun, S.V.; Justice, C. The Harmonized Landsat and Sentinel-2 Surface Reflectance Data Set. Remote Sens. Environ. 2018, 219, 145–161. [Google Scholar] [CrossRef]
- Vos, K.; Harley, M.D.; Splinter, K.D.; Simmons, J.A.; Turner, I.L. Sub-Annual to Multi-Decadal Shoreline Variability from Publicly Available Satellite Imagery. Coast. Eng. 2019, 150, 160–174. [Google Scholar] [CrossRef]
- Nanson, R.; Bishop-Taylor, R.; Sagar, S.; Lymburner, L. Geomorphic Insights into Australia’s Coastal Change Using a National Dataset Derived from the Multi-Decadal Landsat Archive. Estuar. Coast. Shelf Sci. 2022, 265, 107712. [Google Scholar] [CrossRef]
- Cipolletti, M.P.; Delrieux, C.A.; Perillo, G.M.E.; Cintia Piccolo, M. Superresolution Border Segmentation and Measurement in Remote Sensing Images. Comput. Geosci. 2012, 40, 87–96. [Google Scholar] [CrossRef]
- Vos, K.; Harley, M.D.; Splinter, K.D.; Walker, A.; Turner, I.L. Beach Slopes From Satellite-Derived Shorelines. Geophys. Res. Lett. 2020, 47, e2020GL088365. [Google Scholar] [CrossRef]
- Yuan, R.; Zhang, H.; Qiu, C.; Wang, Y.; Guo, X.; Wang, Y.; Chen, S. Mapping Morphodynamic Variabilities of a Meso-Tidal Flat in Shanghai Based on Satellite-Derived Data. Remote Sens. 2022, 14, 4123. [Google Scholar] [CrossRef]
- Groeneveld, D.P.; Barz, D.D. Dixie Valley, Nevada Playa Bathymetry Constructed from Landsat TM Data. J. Hydrol. 2014, 512, 435–441. [Google Scholar] [CrossRef]
- Pulwarty, R.; Sivakumar, M.V.K. Information systems in a changing climate: Early warnings and drought risk management. Weather. Clim. Extremes 2014, 3, 14–21. [Google Scholar] [CrossRef]
- Zhu, J.R.; Wu, H.; Li, L.; Wang, B. Saltwater intrusion in the Changjiang Estuary in the extremely drought hydrological year. J. East China Norm. Univ. 2010, 4, 1–6. [Google Scholar]
- Record Drought Gripped Much of the U.S. in 2022. Available online: https://www.noaa.gov/news/record-drought-gripped-much-of-us-in-2022 (accessed on 31 December 2023).
- Bonaldo, D.; Bellafiore, D.; Ferrarin, C.; Ferretti, R.; Ricchi, A.; Sangelantoni, L.; Vitelletti, M.L. The summer 2022 drought: A taste of future climate for the Po valley (Italy)? Reg. Environ. Chang. 2023, 23, 1. [Google Scholar] [CrossRef]
- Liu, S.; Wu, Y.; Xu, G.; Cheng, S.; Zhong, Y.; Zhang, Y. Characterizing the 2022 Extreme Drought Event over the Poyang Lake Basin Using Multiple Satellite Remote Sensing Observations and In Situ Data. Remote Sens. 2023, 15, 5125. [Google Scholar] [CrossRef]
- Duan, A.; Zhong, Y.; Xu, G.; Yang, K.; Tian, B.; Wu, Y.; Hu, E. Quantifying the 2022 extreme drought in the Yangtze River Basin using GRACE-FO. J. Hydrol. 2024, 630, 130680. [Google Scholar] [CrossRef]
- Xu, G.; Wu, Y.; Liu, S.; Cheng, S.; Zhang, Y.; Pan, Y.; Wang, L.; Dokuchits, E.; Nkwazema, O.C. How 2022 extreme drought influences the spatiotemporal variations of terrestrial water storage in the Yangtze River Catchment: Insights from GRACE-based drought severity index and in-situ measurements. J. Hydrol. 2023, 626, 130245. [Google Scholar] [CrossRef]


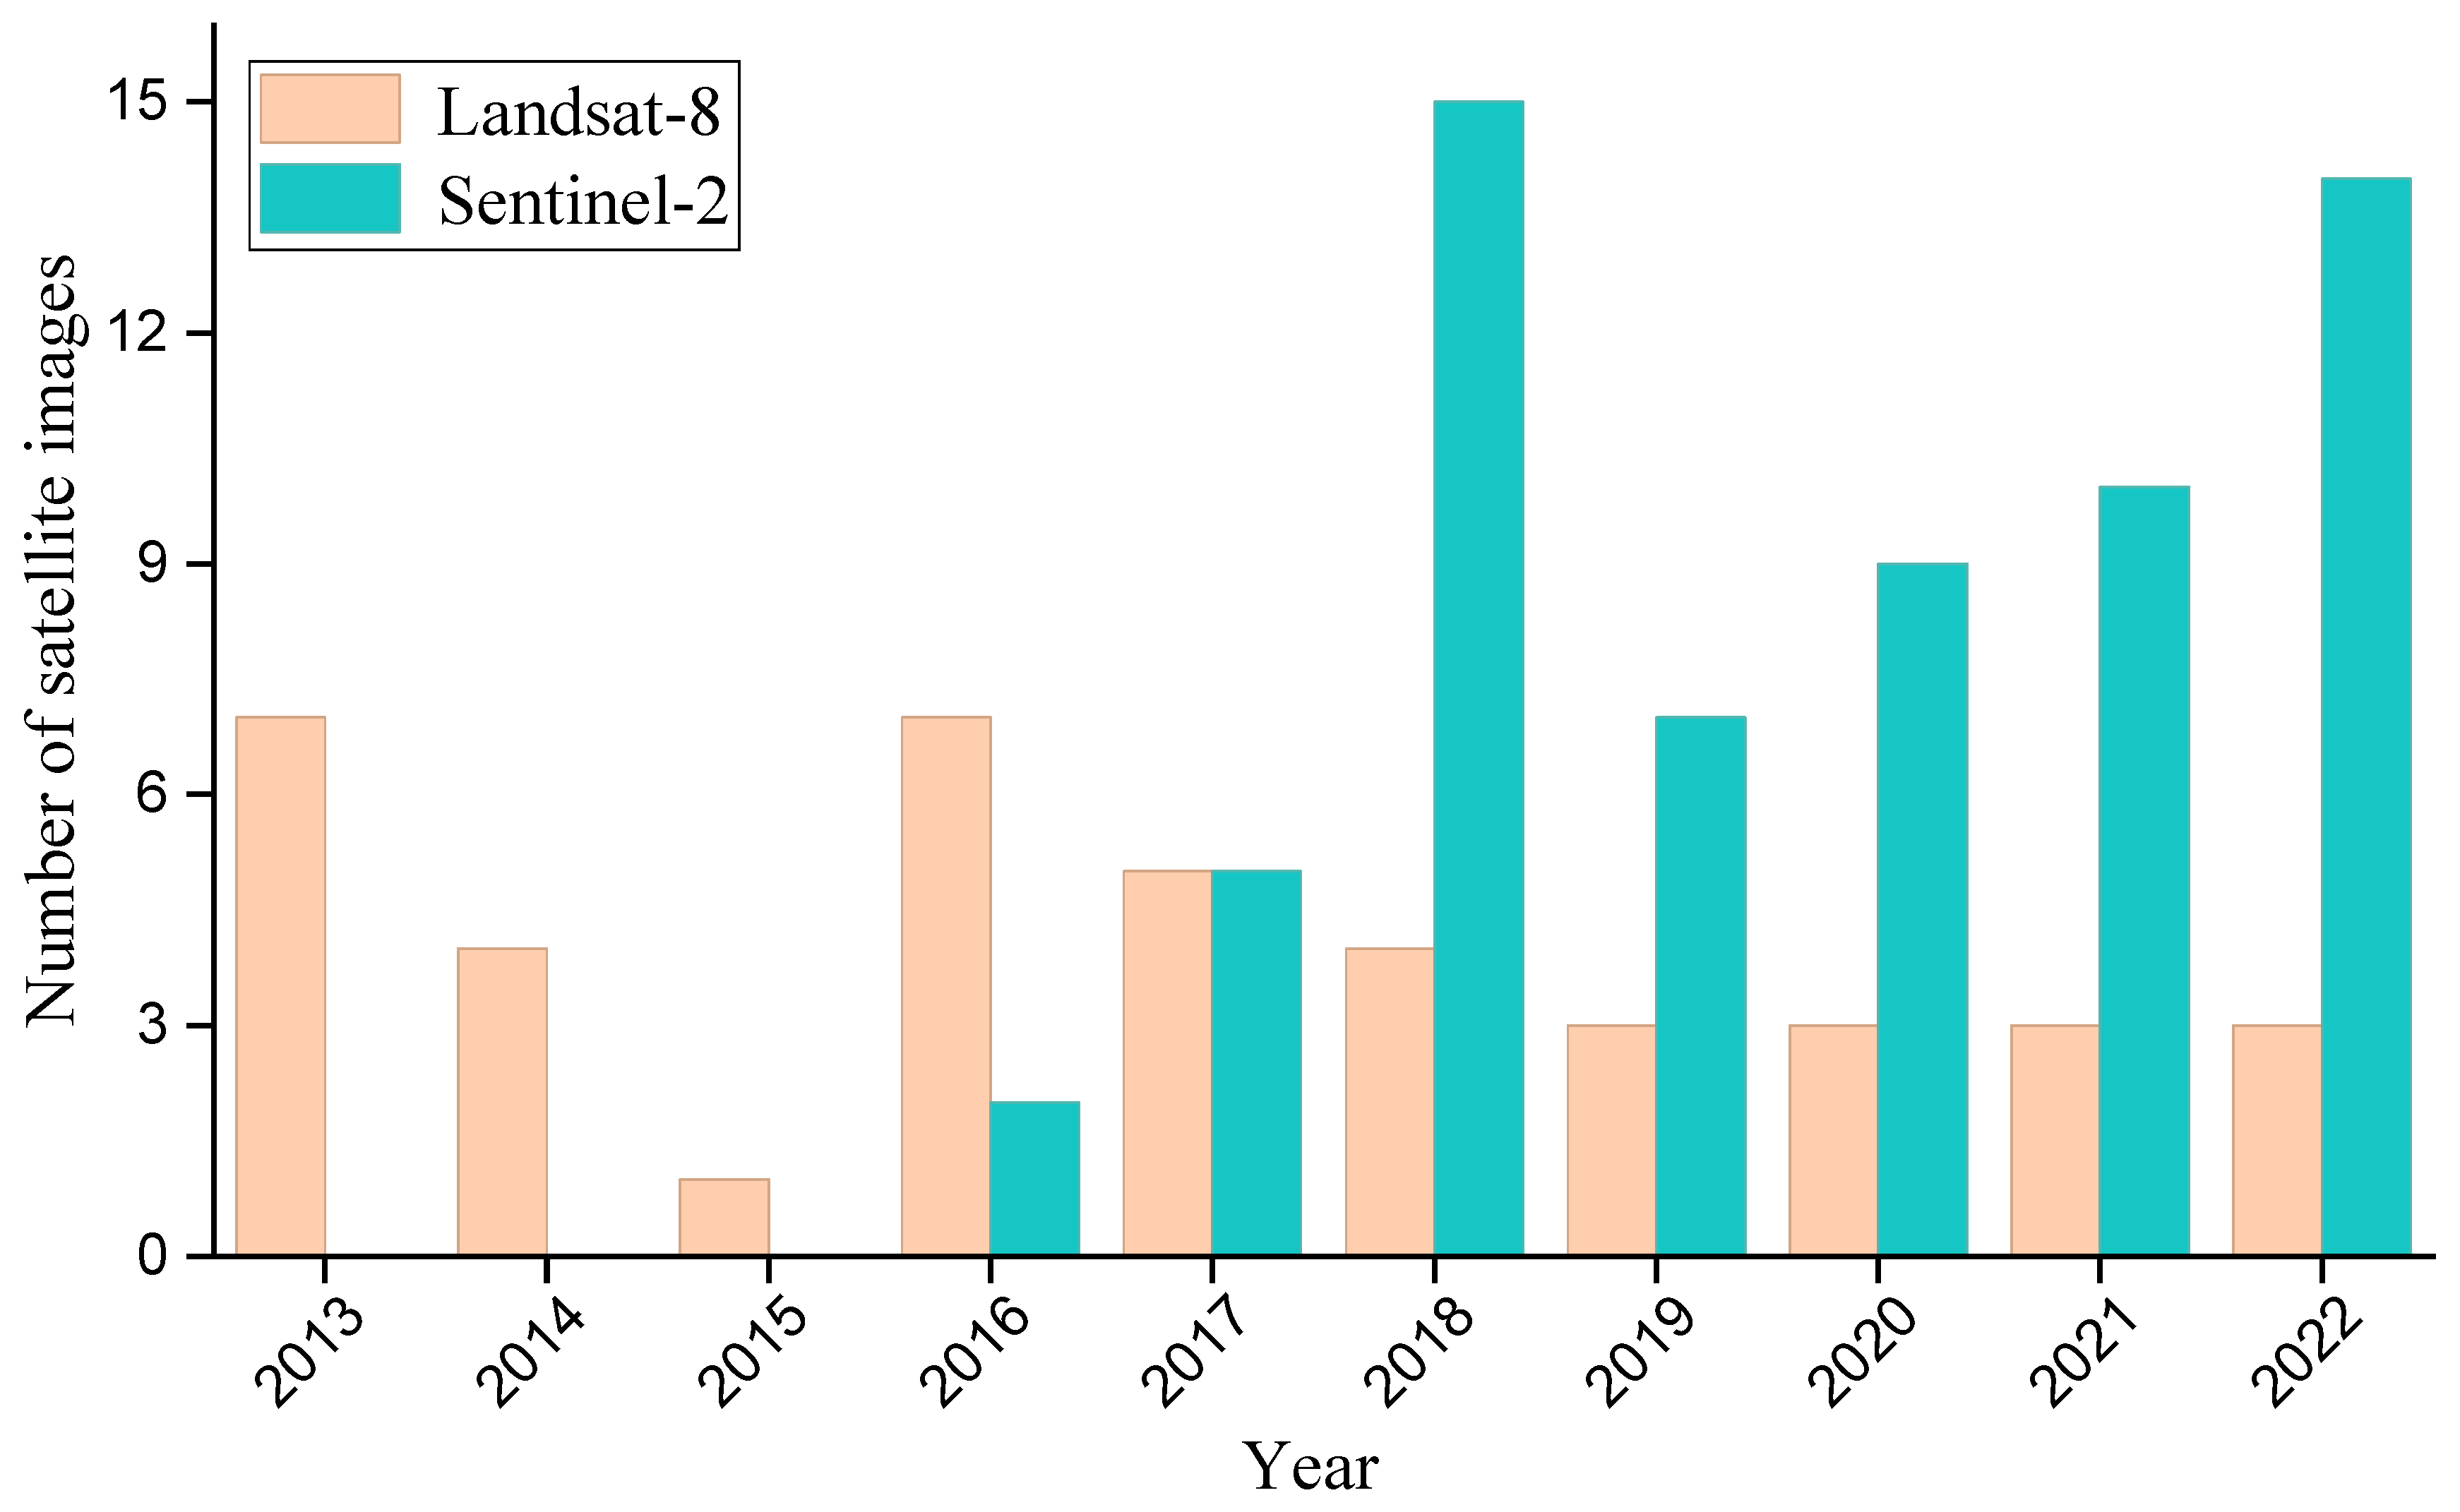
| Satellite Name | Launch Date | Revisit Period (d) | Sensor Parameters | Spectral Range (μm) | Spatial Resolution (m) |
|---|---|---|---|---|---|
| Sentinel-2 (MSI) | 23 June 2015 | 5 | Multispectral Imager | 0.4–2.4 | 10 |
| Landsat-8 (OLI) | 11 Feb 2013 | 16 | Thermal Infrared Sensor | 0.433–12.5 | 30 |
Disclaimer/Publisher’s Note: The statements, opinions and data contained in all publications are solely those of the individual author(s) and contributor(s) and not of MDPI and/or the editor(s). MDPI and/or the editor(s) disclaim responsibility for any injury to people or property resulting from any ideas, methods, instructions or products referred to in the content. |
© 2024 by the authors. Licensee MDPI, Basel, Switzerland. This article is an open access article distributed under the terms and conditions of the Creative Commons Attribution (CC BY) license (https://creativecommons.org/licenses/by/4.0/).
Share and Cite
Yuan, R.; Xu, R.; Zhang, H.; Qiu, C.; Zhu, J. Satellite-Derived Indicators of Drought Severity and Water Storage in Estuarine Reservoirs: A Case Study of Qingcaosha Reservoir, China. Remote Sens. 2024, 16, 980. https://doi.org/10.3390/rs16060980
Yuan R, Xu R, Zhang H, Qiu C, Zhu J. Satellite-Derived Indicators of Drought Severity and Water Storage in Estuarine Reservoirs: A Case Study of Qingcaosha Reservoir, China. Remote Sensing. 2024; 16(6):980. https://doi.org/10.3390/rs16060980
Chicago/Turabian StyleYuan, Rui, Ruiyang Xu, Hezhenjia Zhang, Cheng Qiu, and Jianrong Zhu. 2024. "Satellite-Derived Indicators of Drought Severity and Water Storage in Estuarine Reservoirs: A Case Study of Qingcaosha Reservoir, China" Remote Sensing 16, no. 6: 980. https://doi.org/10.3390/rs16060980
APA StyleYuan, R., Xu, R., Zhang, H., Qiu, C., & Zhu, J. (2024). Satellite-Derived Indicators of Drought Severity and Water Storage in Estuarine Reservoirs: A Case Study of Qingcaosha Reservoir, China. Remote Sensing, 16(6), 980. https://doi.org/10.3390/rs16060980