Abstract
Gaining a comprehensive understanding of the characteristics and propagation of precipitation-based meteorological drought to terrestrial water storage (TWS)-derived hydrological drought is of the utmost importance. This study aims to disentangle the frequency–time relationship between precipitation-derived meteorological and TWS-based hydrological drought from June 2002 to June 2017 based on the Standardized Precipitation Index (SPI) and Standardized Terrestrial Water Storage Index (STI) by employing wavelet coherence rather than a traditional correlation coefficient. The possible influencing factors on drought propagation in 28 regions across the world are examined. The results show that the number of drought months detected by the STI is higher than that detected by the SPI worldwide, especially for slight and moderate drought. Generally, TWS-derived hydrological drought is triggered by and occurs later than precipitation-based meteorological drought. The propagation characteristics between meteorological and hydrological droughts vary by region across the globe. Apparent intra-annual and interannual scales are detected by wavelet analysis in most regions, but not in the polar climate region. Drought propagation differs in phase lags in different regions. The phase lag between hydrological and meteorological drought ranges from 0.5 to 4 months on the intra-annual scale and from 1 to 16 months on the interannual scale. Drought propagation is influenced by multiple factors, among which the El Niño–Southern Oscillation, North Atlantic Oscillation, and potential evapotranspiration are the most influential when considering one, two, or three factors, respectively. The findings of this study improve scientific understanding of drought propagation mechanisms over a global scale and provide support for water management in different subregions.
1. Introduction
Drought is a complex, extreme, and prolonged natural disaster resulting in costly and destructive impacts on society and ecosystems [1,2]. By convention, drought is divided into four types, i.e., meteorological, agricultural, hydrological, and socioeconomic drought [3,4]. Meteorological drought is associated with rainfall shortfall over an extended period [5]. Agricultural drought refers to soil moisture shortage which contributes to crop reduction. Hydrological drought is defined as the deficit of a surface or subsurface water component, such as runoff, soil moisture, groundwater [6,7,8,9]. These three types of droughts can cause socioeconomic drought which may consequently threaten water and food security for human beings [4,10].
The transformation between drought types derived by different hydroclimatic variables is called drought propagation [11,12,13]. Understanding the propagation system and the mechanism of the transition from meteorological drought to hydrological drought is essential for drought warning and forecasting [14,15]. There are three main propagated modes between meteorological and hydrological droughts—(1) a meteorological drought leads to a hydrological drought; (2) a meteorological drought happens while no hydrological drought occurs; and (3) a hydrological drought takes place without a meteorological drought [16,17]. Several previous studies have focused on the spatio-temporal variability for propagation and the lag time between meteorological and hydrological droughts derived by runoff, streamflow, soil moisture, or groundwater [1,14,18,19,20,21,22,23]. The transition of hydrological to meteorological drought varies by regions and climates [24], and it is highly sensitive to the severity of antecedent meteorological drought [23,25]. For example, the runoff-derived hydrological drought in the Yellow River Basin is 1–2 months lagged behind the meteorological drought [26]. The time lag is about 6~10 months in most regions of the Wei River Basin, and hydrological drought lasts longer in response to meteorological drought in areas with sufficient vegetation cover and loess deposits [27]. The time lag between runoff-derived hydrological drought and meteorological drought is within one month in most areas of the Yangtze River Basin [28]. To date, many previous studies have only focused on the mechanism between meteorological and hydrological drought derived by a single surface water component. Since its launch on 17 March 2002, the Gravity Recovery and Climate Experiment (GRACE) mission, a joint geodetic satellite mission of NASA and the German Aerospace Center, has revolutionized our understanding of the Earth’s water reserves. The twin GRACE satellites have been uninterruptedly tracking the changes in Earth’s gravity field, which are influenced by terrestrial water storage (TWS). By measuring the deficit in the TWS—the summation of all surface and subsurface water components—GRACE provides a more holistic assessment of hydrological water shortage [29]. Only a few studies have focused on the relationship between TWS and meteorological variations. For instance, the study in [30] qualifies the response of TWS anomalies and related components to precipitation over 168 global basins. However, these types of studies often rely excessively on correlation analyses, which only show similarities between variables and possibly offset positive and negative correlations [31,32,33], and ignore localized frequency relationships between variables. In recent years, wavelet coherence (WTC) has obtained enormous popularity for its ability to analyze relationships between nonstationary signals. Its application has expanded across multiple fields, including geophysics and economics, largely due to its effectiveness in providing a nuanced understanding of signal interactions in time–frequency space that may be misrepresented by standard correlation coefficients [34,35,36,37]. Thus, this study examines the characteristics of the propagation from meteorological drought to TWS-based hydrological drought by employing the WTC method across the globe to fill this gap.
Drought propagation can be affected by local factors such as water, energy, topography, watershed discharge, and storage state at the local scale [22,38]. Previous studies have paid attention to the contribution of local climate characteristics to drought conditions, and the findings of these studies have strongly enriched the knowledge of the origin of drought. For instance, the increasing evapotranspiration rate and heat wave expedited the propagation from meteorological to groundwater drought in the Pearl River Basin [22]. In the Wei River Basin, rising temperature and decreasing soil moisture and precipitation rather than irrigation water consumption dominate propagation dynamics from meteorological to agricultural drought [39]. Precipitation and soil moisture strongly influence propagation from meteorological to streamflow-driven hydrological drought in the Wei River Basin [40]. Overall, the main focus of previous studies has mainly been on direct climate factors including precipitation (PRE), evapotranspiration (ET), and temperature (TMP) on drought propagation [5,11,41,42]. However, less focus has been paid to the influence of indirect factors (e.g., teleconnections) on drought propagation via hydrologic/meteorological processes, which is also essential for understanding the propagation mechanism. Hence, more efforts should be made to explore the effect of oceanic teleconnections on drought propagation.
Teleconnections, such as the El Niño–Southern Oscillation (ENSO), the Arctic Oscillation (AO), the North Atlantic Oscillation (NAO), the Pacific Decadal Oscillation (PDO), the Pacific/North American Teleconnection Pattern (PNA), and the Indian Ocean Dipole (IOD), have important effects on hydrological cycles, mainly through affecting local PRE and TMP [43]. The ENSO consists of El Niño and alternating La Niña phases, leading to the sea surface temperature in the tropical Pacific being warmer and colder than normal conditions, respectively [44,45,46]. Through modulating meteorological processes associated with convection due to coastal warming, the Walker circulation, or atmospheric circulation anomalies, the ENSO affects the precipitation and temperature beyond the coastal regions of the Pacific Ocean even globally [46,47,48,49]. The NAO was originally discovered in the late 19th century [50]. It is the most significant mode of the atmospheric phenomenon at mid-latitudes in the North Atlantic and can reflect the fluctuations in the sea level by atmospheric variability between the Azores High and the Icelandic Low. A significant correlation exists between NAO and hydroclimatic variables or dry/wet conditions in many regions, because precipitation and temperature on the land surface are associated with sea level pressure and sea temperature variability [51,52]. The IOD is an irregular oscillation in the Indian Ocean, whose positive phase causes higher temperatures in the Western Indian Ocean and more precipitation and the negative phase has the opposite characteristics [53,54]. Although previous studies have demonstrated the impacts of teleconnections on regional hydrological cycles, the understanding of the influences of teleconnections on drought propagation from meteorological to TWS-based hydrological drought is still limited.
In this study, the standardized precipitation index (SPI) is employed to characterize meteorological drought, and TWS-based hydrological drought is represented by a standardized terrestrial water storage index (STI). The primary aims of this study are to examine the response of TWS-based hydrological drought to meteorological drought at a global scale, and to identify the key influencing factor(s) on drought propagation. The analysis in this study helps improve the scientific understanding of the forcing mechanisms and processes of TWS-based drought propagation at the global scale, which provides a scientific basis for decision making in drought prevention and water resource management to achieve long-term sustainability under the changing environment.
2. Materials and Methods
2.1. Data
By monitoring gravity anomalies caused by mass redistribution on the earth, the GRACE satellites can provide regional or global monthly records of TWS, including ice sheets, aquifers, lakes, rivers, etc. [55]. GRACE measurements have been widely used in hydrological drought characterization and recovery time detection [56,57,58]. Here, GRACE Release-06 (RL06) mascon data with a high spatial resolution of 0.25° × 0.25° pretreated by the Center for Space Research (CSR) are employed to describe the characteristics of hydrological drought from 2002 to 2017 at the global scale (http://www2.csr.utexas.edu/grace/RL06_mascons.html, accessed on 3 October 2021) [59]. The mean value of the two adjacent preceding and following months are utilized to fill in the missing value of GRACE at a certain month. Climatic Research Unit (CRU) TS 4.03 monthly temperature, potential ET (PET), and precipitation datasets at the 0.5° × 0.5° spatial resolution (http://data.ceda.ac.uk/badc/cru/data/cru_ts/cru_ts_4.03, accessed on 1 April 2023) from April 2002 to June 2017 were collected from the UK National Centre due to their advantages of higher spatial-temporal resolution and good consistency with in situ observations [60,61]. All datasets are interpolated into the same 0.25° × 0.25° spatial resolution as GRACE data by the bilinear interpolation method [62].
To evaluate the teleconnection effect on drought propagation, monthly ENSO, NAO, AO, PDO, PNA, and Dipole Mode Index (DMI) data from 2002 to 2017 are applied in this study. The intensity of IOD can be characterized by the DMI, which is the anomalous sea surface temperature gradient between the west tropical Indian Ocean (50° E to 70° E and 10° S to 10° N) and the east tropical Indian Ocean (90° E to 110° E and 10° S to 0° S). The Niño 3.4 index is used to represent ENSO. Niño 3.4 and DMI data are obtained from the Earth System Research Laboratories of National Oceanic and Atmospheric Administration via https://climatedataguide.ucar.edu/climate-data (accessed on 25 October 2022) [63,64,65]. Monthly AO, NAO, and PNA are acquired from the Working Group of the Global Climate Observing System at https://www.cpc.ncep.noaa.gov/data/teledoc/telecontents.shtml (accessed on 25 October 2022) [66,67]. Monthly PDO data derived from the Extended Reconstructed Sea Surface Temperature (version 5) are accessible at https://www.ncei.noaa.gov/pub/data/cmb/ersst/v5/index/ (accessed on 25 October 2022) [68]. Table 1 summarizes the abbreviations and sources of the oceanic and climate indices used in this study. To investigate the regional drought propagation across the globe, we delineate the global terrestrial areas where both PRE and GRACE data are available into 28 regions based on the classification in the 5th Intergovernmental Panel on Climate Change reports (Table 2 and Figure 1).

Table 1.
Abbreviations and sources of the oceanic and climate indices used in this study.

Table 2.
The 28 regions used in this study.
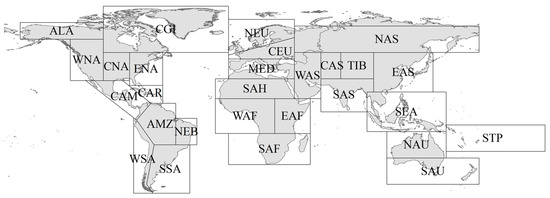
Figure 1.
Locations of the 28 regions in the study.
2.2. Standardized Precipitation Index (SPI)
The SPI is a multi-scalar index based solely on the accumulative precipitation for a given time scale (e.g., 1, 3, 6, 9, … months). It has been widely used in previous studies for drought characterization (e.g., severity, frequency, and duration time) since proposed by [69]. SPI in short time scales is usually utilized for meteorological drought detection [70,71], and SPI in longer time scales is commonly employed for the identification of agricultural and hydrological drought [72,73].
In this study, the precipitation data described in Section 2.1 are utilized to compute SPI. The SPI at the 3-month time scale is employed in this study to represent the meteorological drought condition. SPI-3 can be computed by Equation (1):
where is a month in one year (e.g., February). is the sum of the precipitation in the adjacent 3 months, and is the cumulative distribution of the Gamma distribution, which is utilized to define the relationship between probability and accumulative precipitation , is the inverse of the standard normal cumulative distribution function, and the precipitation deviation is . For details of the method, the reader can refer to [69]. The values are classified into nine categories [69]: slight (−1.0 to −0.5), moderate (−1.5 to −1.0), severe (−2.0 to −1.5), and extreme () drought, normal (−0.5 to 0.5), as well as slight (0.5 to 1.0), moderate (1.0 to 1.5), severe (1.5 to 2.0), and extreme () wet circumstances (Table 3).

Table 3.
Classification of dry/wet conditions of SPI and STI [29,69].
2.3. Standardized Terrestrial Water Storage Index (STI)
STI is a multi-scalar probabilistic index that characterizes TWS deficiency at multiple time scales and the statistical definition of STI is comparable to SPI [29]. Different from other GRACE TWS-based hydrological indices (e.g., the drought severity index [74], the total storage deficit index [75], and the GRACE groundwater drought index [56]), STI accounts for the antecedent cumulative TWS surplus/deficit of past months on the current wet/dry condition. In this study, the time scale for STI is the same as SPI, i.e., 3 months. The formula for STI-3 is
where is the time series of the accumulative sum of TWS in the antecedent 3 months, denotes data for month of the new dataset, means the best-fitting cumulative distribution functions for . Here, is fitted by the normal distribution to define the relationship of probability to accumulative TWS because more than 90% of the global gridded points pass the Lilliefors test for normality at the 5% significant level [29,76]. Once the relationship between probability and TWS is created in accordance with historical records, the probability of TWS is computed, and the TWS deviation for a standard normal distribution with a mean of zero and a standard deviation of one can be estimated by employing the inverse normal distribution, and means the inverse of the standard normal cumulative distribution. This deviation is the STI value for the particular TWS data point. The detailed computation process is described in [29]. The same as SPI, STI is divided into nine categories, as shown in Table 3 [29].
2.4. Mann–Kendall Test and Sen’s Slope
The non-parametric Mann–Kendall test [77,78] has been widely used in analyzing trends of meteorological and hydrological variables. Statistic S is computed by Equation (3).
where n is the length of the data, and and are the data values for time and , respectively. The can be obtained from Equation (4):
The variance is calculated as
where is the number of tied groups which represents a dataset having the same value, and is the total number for each tied data ().
Then, the test statistic Z can be acquired by Equation (6).
There is an increasing trend if , and vice versa. The null hypothesis should be rejected when and the trend is significant in the time series. can be accessed from the standard normal distribution. And is employed in this study.
The magnitude of trend is computed by Sen’s slope estimator [79]. And it is defined as
where and are the data values (i.e., SPI or STI values) corresponding to the time and . A positive slope value represents an upward trend, while a negative value indicates a downward trend.
2.5. Wavelet Coherence Method
The WTC is proposed to measure the linkage between two time series by decomposing each variable into a time–frequency space [80]. According to [34], the square WTC between two signals and at scale is defined as
where is the cross-wavelet transform of two time series which represents the cross-covariance:
where represents complex conjugation, and are the corresponding wavelet transforms of and at wavelet scale . denotes a smoothing operator in time–frequency space, and it is calculated as
where and denote smoothing in the wavelet scale and time, respectively. And the suitable two operators are given by [80].
The phase difference is expressed as
where and are the imaginary and real parts of the smoothing operator H, respectively. When the phase difference is 0 degrees, and are coincident in the time domain (i.e., in phase), whereas they are in anti-phase when the phase difference is around 180 degrees. For the WTC figure, the phase difference is when the arrow points down and is parallel to the -axis (scale axis). And the phase angle reveals the temporal delay or phase shift between two signals, which is given as
where is the periodicity along the time domain, corresponding to the y-coordinate of a point on the WTC figure.
The Partial WTC (PWC) is employed to measure the time–frequency scale between two variations by eliminating the influence of other factors. It was introduced by [81] and then improved by [33,82]. Here, we only consider the situation of excluding one, two, and three variables based on the method developed by [33], and the equation can be expressed as follows:
where represents the annotation for excluding variation Z (Z={}), and , , and are computed as
And is squared WTC between and , which can be calculated from Equation (8), , , , , and can be computed by Equation (9).
To quantitatively explain the main factor affecting drought propagation, the percent area of significant coherence (PASC) of the whole wavelet time–frequency domain is computed [33]. PASC is the percentage of areas with a 5% significance level out of all areas outside the core of influence (COI). The difference in the PASC of PWC from WTC is then computed. The factor(s) is(are) considered to significantly affect drought propagation when the absolute value of the difference in PASC is greater than 5% [83].
3. Results
The SPI mainly characterizes meteorological dryness/wetness in terms of precipitation deficit/surplus. The STI describes hydrological drought conditions based on TWS (a unity of groundwater, surface water, snow, etc.). The statistical relationship between the SPI and STI at 3 months is analyzed in the first part of the results. Second, the trends of the two drought types are estimated. After that, the propagation time and time lag between meteorological and hydrological droughts are evaluated in detail across the globe by employing the WTC method. Then, the factors that significantly affect drought propagation are identified.
3.1. Relationship between Meteorological and Hydrological Droughts
We use the SPI and STI at the 3-month time scale to explore the characteristics of meteorological drought and hydrological drought. The spatial distributions of the number of drought months (i.e., SPI or STI < −0.5) from June 2002 to June 2017 are compared in Figure 2. In general, the number of drought months detected by the STI shows a more spatially coherent pattern than the SPI. The total drought months detected by the STI in most of the world is more than that detected by the SPI. The number of drought months monitored by the SPI is larger than that by the STI in Central Russia and Western Australia. Both indices capture a similar drought frequency in Europe, 40 degrees north latitude in Asia, and the coastal area of Australia.
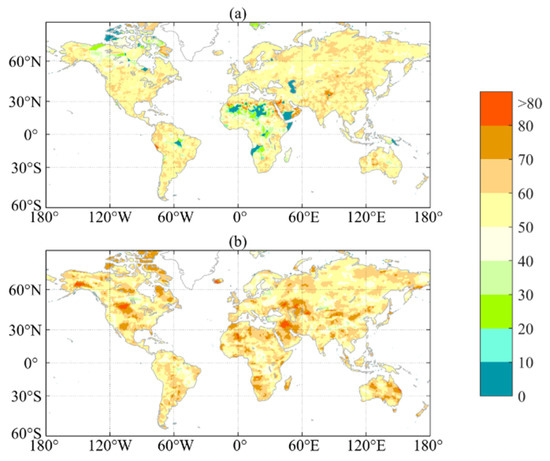
Figure 2.
Spatial distribution of number of drought months (<−0.5) detected by 3-month SPI (a) and 3-month STI (b) from June 2002 to June 2017.
Figure 3 and Figure 4 show the occurrence of slight, moderate, severe, and extreme droughts detected by the SPI and STI based on the classification of Table 3. The drought events occurred less and less as the severity of the SPI and STI changes from slight, moderate, severe, to extreme in most extensive coverage. The globe experiences slightly and moderately dry situations, as shown by the STI, more often than by the SPI, especially in the south of North America, North Africa, East Australia, Western Asia, and eastern Russia. The SPI detects a higher number of severe drought events compared to the STI in the south of North America, Southern Europe, and eastern Asia. The numbers of extreme droughts detected by the SPI and STI are comparable across the globe except in Australia, east Europe and most of Africa.
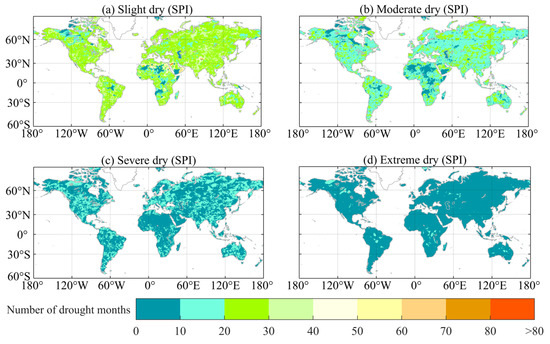
Figure 3.
Spatial distribution of number of slight (a), moderate (b), severe (c), and extreme (d) droughts detected by 3-month SPI from June 2002 to July 2017.
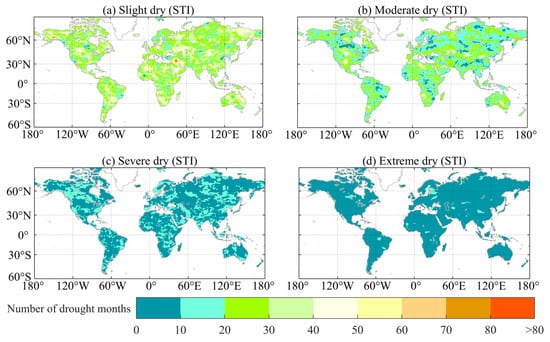
Figure 4.
Spatial distribution of number of slight (a), moderate (b), severe (c), and extreme (d) droughts detected by 3-month STI from June 2002 to July 2017.
3.2. Trends of Meteorological and Hydrological Droughts
The Mann–Kendall test and Sen’s slope are utilized to analyze the tendency of meteorological (3-month SPI) and hydrological (3-month STI) droughts. Figure 5 shows the temporal trends of the monthly SPI and STI from June 2002 to June 2017 at the 5% significance level. Although the SPI and STI measure the deficits of two different hydrological components (i.e., precipitation and TWS, respectively), they display consistent trend directions (drier/wetter). The trend magnitudes of the two indices show differences regionally. In general, the STI shows more significant trends than the SPI and the trends are stronger. For example, both the SPI and STI have significantly increasing (wet) trends over the center of the continental United States, eastern Australia, eastern Asia, the east of Africa, most of Europe, and Central Asia, where the STI shows a tendency to be relatively more humid than the SPI. Both show downward (dry) trends in the east of South America, North Africa, and Central Russia, where the STI shows relatively drier trends than the SPI during this period. In addition, in some regions, the STI also shows different changes from the SPI, such as in the north of South Asia, the north of North America, Southern Africa, and northern China, where the STI implies increasing trends while the SPI denotes decreasing trends.
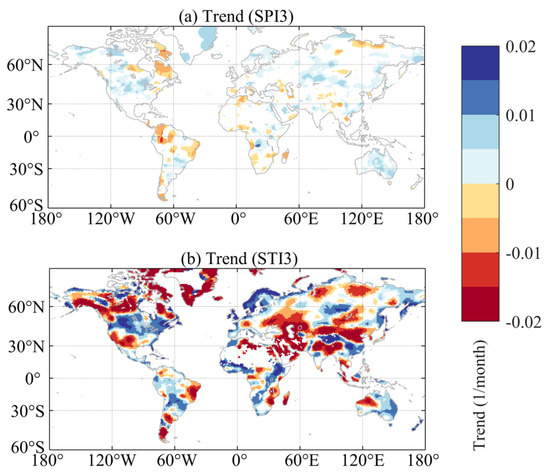
Figure 5.
Trends (per month) of 3-month SPI (a) and 3-month STI (b) from June 2002 to June 2017. Only trends at the 5% significance level are shown.
3.3. Drought Propagation Based on WTC Analysis
Figure 6 shows the WTC relationship and the phase difference between the SPI and STI at the time–frequency domains in the 28 regions. Time is the horizontal axis, while the vertical axis refers to the frequency. The WTC enables us to find the areas in time–frequency space where the SPI and STI covary. The warmer the color is, the greater the correlation between the two metrics, and vice versa. The colder region outside the significant region represents the absence of dependence on time and frequency between the two indices. Thus, we can see the frequency and time scales at which the SPI and STI move together. When the arrow points right (the angle is or ), the SPI synchronize with STI, SPI and STI are in phase when the angle is 0 degrees, and the SPI precedes the STI when the arrow points down (the angle is ).
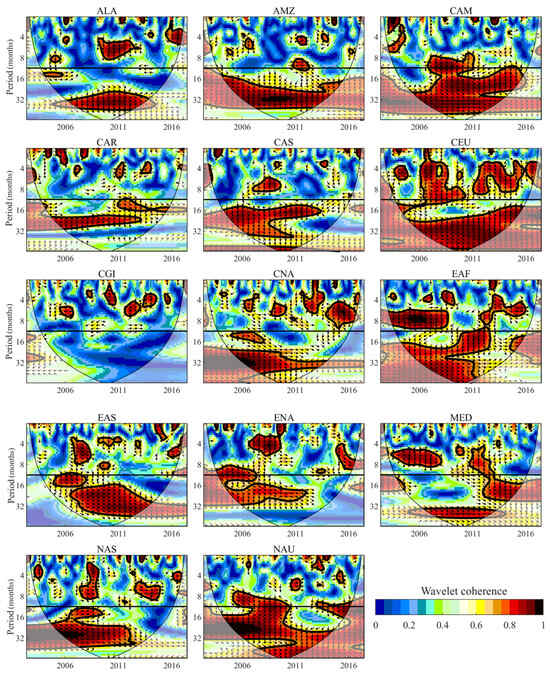
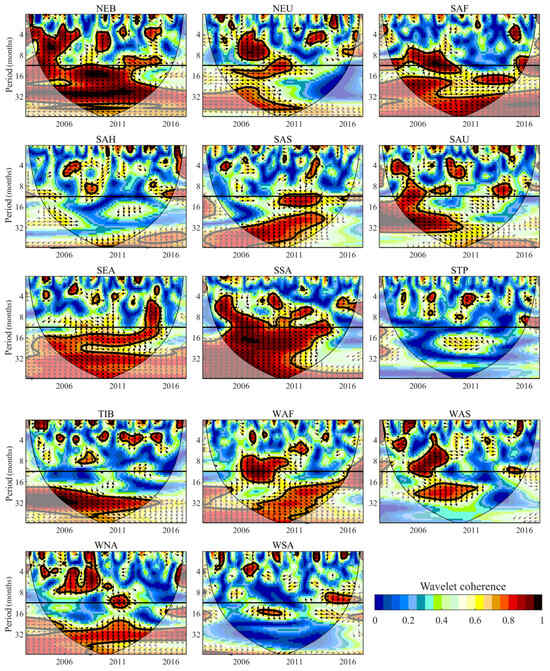
Figure 6.
The WTC analysis of SPI and STI in the 28 selected regions. The -axis is time, and the -axis is the period in months. The area surrounded by the ‘V’-type black line shows the effective spectra. The thin black solid lines mark the cone of influence (COI), and the thick black line indicates that points pass the 95% confidence level against the red noise. The horizontal line in each subgraph marks the period of 12 months. When the arrow points to the right (left), two variables have positive (negative) correlation. Arrow directions represent the phase lag between SPI and STI. Rightward (leftward) arrows mean 0 (180)-degree phase lag, and downward (upward) arrows mean 90 (270)-degree phase lag. The right-down and left-down arrows mean SPI causes STI, while the right-up and left-up arrows mean STI happens earlier than SPI.
Discrete and discontinuous intra-annual periodicities are found for all regions during the study period. The co-movement time lasts relatively longer in CAM, CEU, EAF, MED, NAU, NEB, SAF, SSA, WAF, and WNA, while the covary time in other regions is short. Almost all the arrows are pointed down in these discontinuous periodicities, indicating the SPI occurs earlier than the STI; however, the phase lags are diverse in different regions.
The significant interannual oscillations (2–5 years) between the SPI and STI prevail in most of the regions except ALA, CAS, CGI, NAS, SAH, WNA, and WSA (Figure 6), implying meteorological and hydrological droughts happen simultaneously or are delayed in these regions. The SPI and STI show an in-phase (0 degree) relationship in CAM and MED and SAU (28–50 months), indicating hydrological and meteorological droughts occur simultaneously. The right-down arrows with an angle range of 30 to 90 degrees in other regions indicate the SPI triggers and affects the STI and different phase lags exist between the two indices. This means in interannual scales, STI-based hydrological drought evolves from meteorological drought represented by the SPI in most regions, especially in the region with significant coherence at long frequency scales.
The intra- and/or interannual periodicities between the SPI and STI detected by WTC in the 28 regions are summarized in Figure 7. It should be noted the overlap data of precipitation and TWS in SAH is limited, which may not effectively reflect the relationship of meteorological and hydrological drought. The SPI and STI have long significant interannual periodicity in regions located in almost all latitudes, such as AMZ and CAR. These areas are affected by precipitation variations associated with significant interannual oscillations such as ENSO, PDO, AO, NAO, DMI, and PNA [47,53,84,85,86,87]. Both intra- and interannual periodicities exist in Europe, mid-Africa, the south of South America, and the north of North America. No obvious propagation progresses are detected in the coastal regions in low- and mid- latitudes such as STP and WSA, where the water cycle is complicated by the effects of many factors like the South Pacific Gyre and topography [88,89].
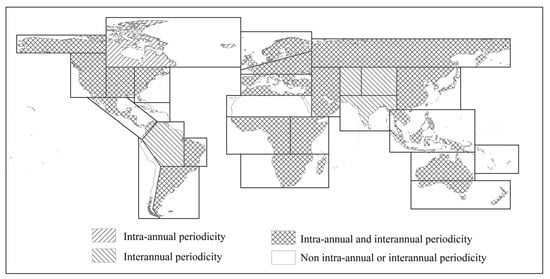
Figure 7.
Periodicity between SPI and STI in the 28 regions across the globe.
3.4. Factors Affecting Drought Propagation
The above WTC results show intra- and interannual periodicities in drought propagation. Therefore, in this part, we employ PWC to disentangle the influence of oceanic oscillations (ENSO, NAO, PDO, AO, PNA, DMI) and two meteorological factors (i.e., PET and TMP) on the propagation from meteorological to hydrological droughts. The PWC method is used to examine the periodicity of the SPI and STI after removing specific ocean signals and/or meteorological factors. The PWC results are then compared with the WTC results to evaluate the roles of the factors removed in drought propagation [33]. The impacts on the wavelet coherence variation after eliminating the selected factors are characterized by the change in the PASC between the PWC and WTC (i.e., the PASC of PWC minus the PASC of WTC).
Table 4 summarizes the largest change in the PASC and the corresponding factor(s) removed in the PWC and the PASC change after excluding all factors. If only one factor is excluded in the PWC, the ENSO is the most frequently detected factor that exerts the largest impact on drought propagation among the 28 regions (i.e., the largest changes in the PASC resulted from the ENSO removed in seven regions), followed by the NAO and PDO, which account for five regions. Also, almost all the regions display a change in the PASC with its absolute value larger than 5%, except in CGI, SAH, STP, and WSA, where the PASC value of the WTC is small, suggesting these factors sufficiently affect the propagation between meteorological and hydrological droughts. Figure 8 is the PWC analysis with the most significant factor removed based on Table 4, showing the impacts of the most important factor on drought propagation from meteorological to hydrological droughts. The ENSO (NAO, PDO) mainly affects the periodicity of larger than 12 months (i.e., interannual periodicity) between the SPI and STI in most of the regions. Figure 9 shows the impacts of removing the combinations of two factors in Table 4 on drought propagation. Among all the combinations with two factors removed, the NAO and DMI occur the most frequently and considerably explain the changes in drought propagation in nine regions. Among all the combinations removing the three factors, the PET and ENSO appeared most frequently, explaining 16 and 15 regions of variation in drought propagation, respectively. Compared to the PASC changes in the PWC with one factor removed, the mean coherences of the SPI and STI are altered more when more factors are excluded, demonstrating that the combinations of multiple factors can better explain the main characteristics of drought propagation.

Table 4.
The (largest) change in PASC and the corresponding factor(s) after excluding a certain number (or all) oceanic/meteorological factors. In each column, the factor(s) in bold is the one(s) detected the most frequently among the regions.
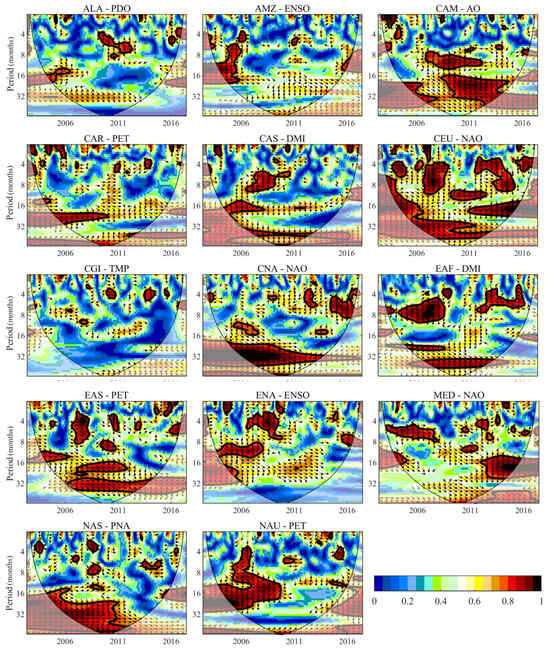
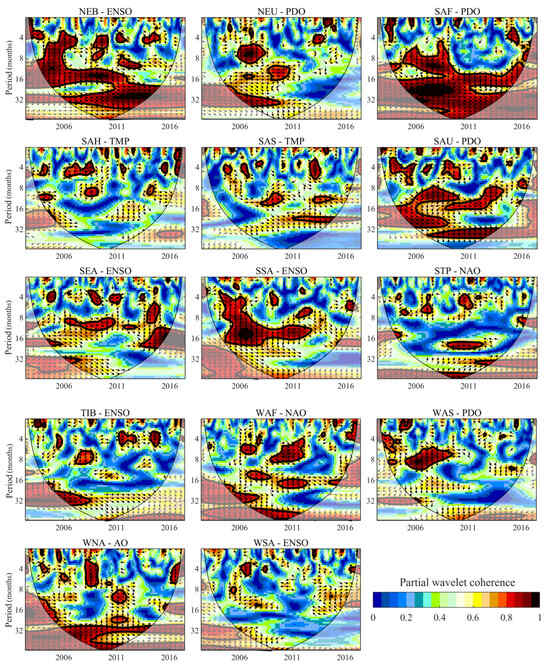
Figure 8.
The PWC analysis of the SPI and STI after eliminating one factor in the respective region according to Table 4. Each PWC subplot shows the PWC between drought propagation and the most influential factor in selected regions. The -axis is the time duration from 2004 to 2017 and the -axis is the period in month units. The area surrounded by the ‘V’-type black line shows the effective spectra. The thin black solid lines mark the cone of influence (COI), and the thick black line indicates that points pass the 95% confidence level against the red noise. Arrow directions represent the phase lag between SPI and STI; the rightward (leftward) means 0 (180)-degree phase lag, downward (upward) means 90 (270)-degree phase lag.
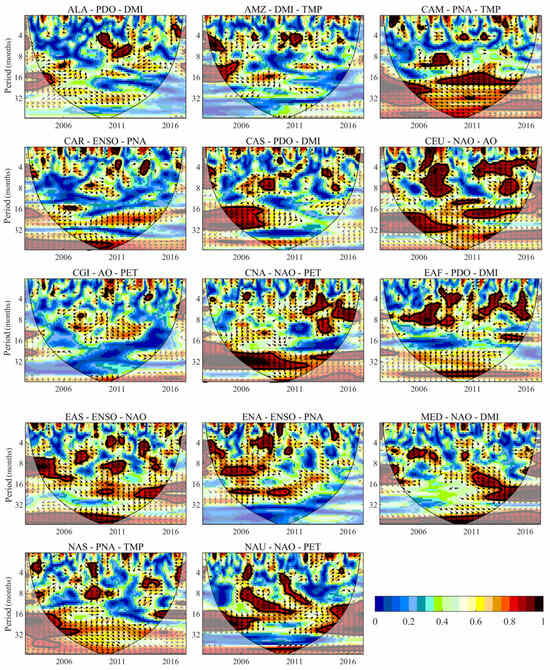
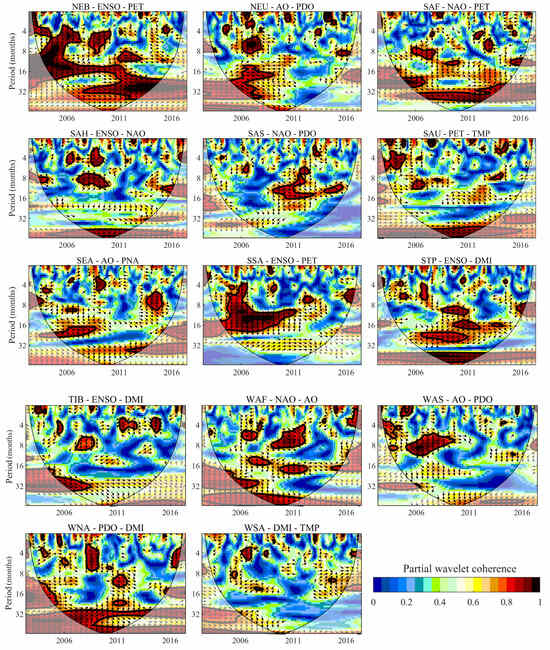
Figure 9.
The PWC analysis of the SPI and STI after eliminating the two factors in the respective region according to Table 4. Each PWC subplot shows the PWC between drought propagation and the best combination of two factors in selected regions. The -axis is the time duration from 2004 to 2017 and the -axis is the period in month units. The area surrounded by the ‘V’-type black line shows the effective spectra. The thin black solid lines mark the cone of influence (COI), and the thick black line indicates that points pass the 95% confidence level against the red noise. Arrow directions represent the phase lag between SPI and STI; the rightward (leftward) means 0 (180)-degree phase lag, downward (upward) means 90 (270)-degree phase lag.
4. Discussion
4.1. Characteristics of Meteorological Drought and Hydrological Drought
In this study, we explore the similarity/difference between precipitation-based meteorological drought (SPI) and TWS-derived hydrological drought (STI) in terms of drought severity, frequency, and trends from 2002 to 2017 at the global scale. The SPI is used to characterize the meteorological drought caused by precipitation change. The STI proposed by [29] is employed to describe hydrological drought caused by the deficit of the whole surface and subsurface water. The multi-scalar STI can express the complex phenomenon efficiently, and it can be directly compared with other standardized indices with the same statistical definitions. In northern South America, southern North America, Australia, Europe, and northern Asia, the SPI and STI have similar dry/wet trends and the drought months detected by the two indices are mostly greater than 50 (Figure 2, Figure 3 and Figure 4), but their drought frequencies of each drought category are different (Figure 3 and Figure 4). For instance, the slight and moderate drought occurrence detected by the STI is more frequent than that indicated by the SPI over most of the globe, especially in the arid regions, where the STI shows a dry trend, which is drier than that shown by the SPI (Figure 5). The drought frequency differences also show that meteorological drought does not always trigger hydrological drought derived by TWS deficit, and water deficiency is not only generated from less precipitation over a long time duration but is also affected by other factors such as human intervention [14].
4.2. Propagation from Meteorological Drought to Hydrological Drought: Similarities and Differences over Different Regions
To better understand the drought propagation mechanism across the globe, it is necessary to analyze the response of TWS-derived hydrological drought to meteorological drought across different regions, which has seldom been investigated in previous studies. Earlier studies have shown that the WTC can better represent the relationship between two time series in time–frequency space than the traditional correlation coefficient (e.g., Pearson’s correlation) [33,83]. Using the traditional correlation coefficient, positive and negative correlations may cancel out over the whole time series. Moreover, WTC analysis can show the propagation time and phase shift when two indicators covary and correlate significantly. The WTC analysis reveals observable intra-annual or interannual patterns in most regions. However, only discrete intra-annual periodicity between the SPI and STI exists in the polar region (CGI) with low temperature [90]. Only interannual periodicity exists in northern South America and in Central and South Asia. In Southern Africa, Western and eastern Asia, Europe, east of South America, and Australia, drought propagation shows both intra-annual and interannual variations. However, there is no obvious drought propagation in the coastal regions where most regions are located near the Pacific Ocean, such as the west of South America and the east of Oceania. Drought propagation may be influenced by complicated atmospheric circulations and anomalous sea surface temperatures [91,92]. In high-latitude regions located in polar climates, climate-warming-induced snowmelt disrupts drought propagation [1,90,93], making no apparent transmission between the two drought types. There is a strong propagation relationship between the SPI and STI at the interannual scale in almost all regions, including the arid and humid areas. This may be attributed to the stronger influence of moisture transport from the atmosphere to the land surface on drought propagation in these areas compared to polar areas, especially at an interannual scale [94]. Apart from the climate-related factors shown in Table 1, other factors such as topography, landform, and human activities may also affect the propagation from precipitation-derived meteorological drought to TWS-derived hydrological drought, which should be further studied [23,38,95,96].
For most regions, SPI leads to STI (right-down arrow), suggesting meteorological drought is the main driver triggering water deficit and the time lags are diverse in different regions. For the regions with intra-annual cyclicality over a longer period, hydrological droughts occur 0.5 to 4 months later than meteorological droughts, while the time delay between the meteorological and hydrological drought ranges from 1 to 16 months for regions with interannual cycles. However, the SPI and STI show significant positive coherence in the long period cycle with almost no time lags in CAM, MED, and SAU [21,97].
The periodicity of the wavelet coherence between the SPI and STI in most regions is significantly affected after eliminating one or two or three factors across all periods of intra-annual and interannual scales (Figure 6, Figure 8 and Figure 9), suggesting drought propagation is influenced by meteorological factors and teleconnections across all time and frequency scales. The ENSO is the key driving factor for drought propagation in most regions around the Pacific Ocean by influencing precipitation and actual evaporation [98,99,100]. The NAO is another important driver with profound impacts on drought propagation by explaining the enhanced or reduced precipitation across Europe, Africa, Australia, and Southern Asia in different seasons [99,101,102,103,104,105]. The DMI also strongly influences global drought propagation because it affects hydrologic variables around the Indian Ocean and then influences other regions through complex interactions with regional climate systems [106,107]. The PET is the direct meteorological variable that affects the drought propagation across the globe by reducing (increasing) soil moisture and weakening (strengthening) water availability in the hydrological system [41]. Limited studies have their focus to the combined effects of meteorological or (and) oceanic factors on drought propagation across the globe. Our results provide a new basis for future analysis on other influencing factors of drought propagation.
5. Conclusions
We examine the propagation mechanism from meteorological drought to TWS-driven hydrological drought. Meteorological drought caused by a precipitation deficit over a long period of time can lead to considerable inadequate water resources on and beneath the surface, which may contribute to water scarcity. Understanding propagation from meteorological drought to TWS-derived hydrological drought is of fundamental importance for better understanding the water cycle mechanism and improving drought early warning and forecasting. Although drivers of hydroclimatic variables to droughts have been widely explored and analyzed in previous studies, factors affecting the propagation from meteorological to TWS-based hydrological drought have not been comprehensively investigated. Here, we use the multi-scalar precipitation-based SPI and TWS-based STI to characterize meteorological and hydrological droughts, respectively. We also estimate the characteristics of meteorological drought and TWS-driven hydrological drought, and explore the relationship between two different drought types. Lastly, we use the WTC analysis to detect the influence of six main teleconnections (i.e., ENSO, NAO, AO, PDO, PNA, and IOD) and two direct climatic factors (i.e., PET and TMP) on the relationship between the SPI and STI to analyze the main driver of drought propagation across the globe. The following conclusions can be drawn from our results.
- During 2002–2017, hydrological drought occurred more often than meteorological droughts, especially slight and moderate drought in arid regions, due to regional differences in precipitation and TWS. Precipitation-based meteorological drought is the trigger of and happens earlier than TWS-derived hydrological drought in most regions.
- The propagation system from meteorological drought to hydrological drought varies from region to region. The propagation is evident at the interannual scale in most regions located in all latitudes, implying climate is a major factor affecting regional drought propagation. No propagation is detected in the polar climatic region. Drought propagation also varies with different phase lags. Hydrological drought happens later than meteorological drought, with phase lags ranging from 0.5 to 4 months on the intra-annual scale and from 1 to 16 months on the interannual scale. Both intra-annual- and interannual-scale propagations can be found in most regions across the globe.
- Combinations of multiple factors determine drought propagation between meteorological to hydrological droughts. The ENSO is the main factor when only one factor is considered in drought propagation; among different combinations, the unity with NAO or PET contributes more to drought propagation.
Our study can improve the scientific understanding of the evolution from meteorological to hydrological drought in a changing environment. The results are expected to provide a scientific basis for decision making in drought prevention and water resource management to achieve long-term sustainability.
Author Contributions
A.C.: Data curation, methodology, formal analysis, investigation, visualization, writing—original draft. J.L.: Writing—review and editing. Q.Z.: Conceptualization, project administration, supervision, funding acquisition. H.Z., H.L. and C.Y.: Writing—review and editing. G.W. and Q.L.: Resources, funding acquisition. All authors have read and agreed to the published version of the manuscript.
Funding
This research was funded by the Natural Science Foundation of China (NSFC) General Program (41971386 and 42271416 of Qiming Zhou), the Hong Kong Research Grant Council (RGC) General Research Fund (HKBU12301820 of Qiming Zhou), and NSFC General Program (42201319 of Yang Chao).
Data Availability Statement
The ENSO data that support the findings of this study are available in the National Center for Atmospheric Research (https://climatedataguide.ucar.edu/climate-data, accessed on 25 October 2022). Pacific Decadal Oscillation data are available from National Centers for Environmental Information (https://www.ncei.noaa.gov/pub/data/cmb/ersst/v5/index/, accessed on 25 October 2022). Dipole Mode Index data can be accessed via https://climatedataguide.ucar.edu/climate-data (accessed on 25 October 2022). Other teleconnection patterns are openly available to download from the following website (https://www.cpc.ncep.noaa.gov/data/teledoc/telecontents.shtml, accessed on 25 October 2022). The precipitation, temperature, and potential evapotranspiration data that support the findings are available at http://data.ceda.ac.uk/badc/cru/data/cru_ts/cru_ts_4.03 (accessed on 1 April 2023).
Conflicts of Interest
The authors declare no conflicts of interest.
References
- Ding, Y.; Xu, J.; Wang, X.; Cai, H.; Zhou, Z.; Sun, Y.; Shi, H. Propagation of meteorological to hydrological drought for different climate regions in China. J. Environ. Manag. 2021, 283, 111980. [Google Scholar] [CrossRef]
- Mishra, A.K.; Singh, V.P. A review of drought concepts. J. Hydrol. 2010, 391, 202–216. [Google Scholar] [CrossRef]
- Spinoni, J.; Naumann, G.; Carrao, H.; Barbosa, P.; Vogt, J. World drought frequency, duration, and severity for 1951–2010. Int. J. Climatol. 2014, 34, 2792–2804. [Google Scholar] [CrossRef]
- Wilhite, D.A.; Glantz, M.H. Understanding: The Drought Phenomenon: The Role of Definitions. Water Int. 1985, 10, 111–120. [Google Scholar] [CrossRef]
- Bae, H.; Ji, H.; Lim, Y.-J.; Ryu, Y.; Kim, M.-H.; Kim, B.-J. Characteristics of drought propagation in South Korea: Relationship between meteorological, agricultural, and hydrological droughts. Nat. Hazards 2019, 99, 1–16. [Google Scholar] [CrossRef]
- Agutu, N.O.; Awange, J.L.; Ndehedehe, C.; Mwaniki, M. Consistency of agricultural drought characterization over Upper Greater Horn of Africa (1982–2013): Topographical, gauge density, and model forcing influence. Sci. Total Environ. 2020, 709, 135149. [Google Scholar] [CrossRef] [PubMed]
- Liu, X.; Zhu, X.; Pan, Y.; Li, S.; Liu, Y.; Ma, Y. Agricultural drought monitoring: Progress, challenges, and prospects. J. Geogr. Sci. 2016, 26, 750–767. [Google Scholar] [CrossRef]
- Van Loon, A.F. Hydrological drought explained. WIREs Water 2015, 2, 359–392. [Google Scholar] [CrossRef]
- Nalbantis, I.; Tsakiris, G. Assessment of Hydrological Drought Revisited. Water Resour. Manag. 2009, 23, 881–897. [Google Scholar] [CrossRef]
- Mehran, A.; Mazdiyasni, O.; AghaKouchak, A. A hybrid framework for assessing socioeconomic drought: Linking climate variability, local resilience, and demand. J. Geophys. Res. Atmos. 2015, 120, 7520–7533. [Google Scholar] [CrossRef]
- Apurv, T.; Sivapalan, M.; Cai, X. Understanding the Role of Climate Characteristics in Drought Propagation. Water Resour. Res. 2017, 53, 9304–9329. [Google Scholar] [CrossRef]
- Eltahir, E.A.B.; Yeh, P.J.F. On the asymmetric response of aquifer water level to floods and droughts in Illinois. Water Resour. Res. 1999, 35, 1199–1217. [Google Scholar] [CrossRef]
- Changon, S.A. Detecting Drought Conditions; Department of Energy and Natural Resources: Champaign, IL, USA, 1987.
- Guo, Y.; Huang, S.; Huang, Q.; Leng, G.; Fang, W.; Wang, L.; Wang, H. Propagation thresholds of meteorological drought for triggering hydrological drought at various levels. Sci. Total Environ. 2020, 712, 136502. [Google Scholar] [CrossRef] [PubMed]
- Wang, W.; Ertsen, M.W.; Svoboda, M.D.; Hafeez, M. Propagation of drought: From meteorological drought to agricultural and hydrological drought. Adv. Meteorol. 2016, 2016, 6547209. [Google Scholar] [CrossRef]
- Jehanzaib, M.; Kim, T.W. Exploring the influence of climate change-induced drought propagation on wetlands. Ecol. Eng. 2020, 149, 105799. [Google Scholar] [CrossRef]
- Wang, J.; Wang, W.; Cheng, H.; Wang, H.; Zhu, Y. Propagation from Meteorological to Hydrological Drought and Its Influencing Factors in the Huaihe River Basin. Water 2021, 13, 1985. [Google Scholar] [CrossRef]
- Soleimani Motlagh, M.; Ghasemieh, H.; Talebi, A.; Abdollahi, K. Identification and Analysis of Drought Propagation of Groundwater During Past and Future Periods. Water Resour. Manag. 2017, 31, 109–125. [Google Scholar] [CrossRef]
- Jehanzaib, M.; Sattar, M.N.; Lee, J.H.; Kim, T.W. Investigating effect of climate change on drought propagation from meteorological to hydrological drought using multi-model ensemble projections. Stoch. Environ. Res. Risk Assess. 2020, 34, 7–21. [Google Scholar] [CrossRef]
- Li, Q.; He, P.; He, Y.; Han, X.; Zeng, T.; Lu, G.; Wang, H. Investigation to the relation between meteorological drought and hydrological drought in the upper Shaying River Basin using wavelet analysis. Atmos. Res. 2020, 234, 104743. [Google Scholar] [CrossRef]
- Lorenzo-Lacruz, J.; Vicente-Serrano, S.M.; González-Hidalgo, J.C.; López-Moreno, J.I.; Cortesi, N. Hydrological drought response to meteorological drought in the Iberian Peninsula. Clim. Res. 2013, 58, 117–131. [Google Scholar] [CrossRef]
- Han, Z.; Huang, S.; Huang, Q.; Leng, G.; Wang, H.; Bai, Q.; Zhao, J.; Ma, L.; Wang, L.; Du, M. Propagation dynamics from meteorological to groundwater drought and their possible influence factors. J. Hydrol. 2019, 578, 124102. [Google Scholar] [CrossRef]
- Zhu, Y.; Liu, Y.; Wang, W.; Singh, V.P.; Ren, L. A global perspective on the probability of propagation of drought: From meteorological to soil moisture. J. Hydrol. 2021, 603, 126907. [Google Scholar] [CrossRef]
- Gevaert, A.I.; Veldkamp, T.I.E.; Ward, P.J. The effect of climate type on timescales of drought propagation in an ensemble of global hydrological models. Hydrol. Earth Syst. Sci. 2018, 22, 4649–4665. [Google Scholar] [CrossRef]
- Sattar, M.N.; Lee, J.Y.; Shin, J.Y.; Kim, T.W. Probabilistic Characteristics of Drought Propagation from Meteorological to Hydrological Drought in South Korea. Water Resour. Manag. 2019, 33, 2439–2452. [Google Scholar] [CrossRef]
- Li, Y.; Wen, Y.; Lai, H.; Zhao, Q. Drought response analysis based on cross wavelet transform and mutual entropy. Alexandria Eng. J. 2020, 59, 1223–1231. [Google Scholar] [CrossRef]
- Fang, W.; Huang, S.; Huang, Q.; Huang, G.; Wang, H.; Leng, G.; Wang, L. Identifying drought propagation by simultaneously considering linear and nonlinear dependence in the Wei River basin of the Loess Plateau, China. J. Hydrol. 2020, 591, 125287. [Google Scholar] [CrossRef]
- Li, R.; Chen, N.; Zhang, X.; Zeng, L.; Wang, X.; Tang, S.; Li, D.; Niyogi, D. Quantitative analysis of agricultural drought propagation process in the Yangtze River Basin by using cross wavelet analysis and spatial autocorrelation. Agric. For. Meteorol. 2020, 280, 107809. [Google Scholar] [CrossRef]
- Cui, A.; Li, J.; Zhou, Q.; Zhu, R.; Liu, H.; Wu, G.; Li, Q. Use of a multiscalar GRACE-based standardized terrestrial water storage index for assessing global hydrological droughts. J. Hydrol. 2021, 603, 126871. [Google Scholar] [CrossRef]
- Zhang, Y.; He, B.; Guo, L.; Liu, D. Differences in Response of Terrestrial Water Storage Components to Precipitation over 168 Global River Basins. J. Hydrometeorol. 2019, 20, 1981–1999. [Google Scholar] [CrossRef]
- Sugihara, G.; May, R.; Ye, H.; Hsieh, C.; Deyle, E.; Fogarty, M.; Munch, S. Detecting Causality in Complex Ecosystems. Science 2012, 338, 496–500. [Google Scholar] [CrossRef]
- Shi, H.; Zhao, Y.; Liu, S.; Cai, H.; Zhou, Z. A New Perspective on Drought Propagation: Causality. Geophys. Res. Lett. 2022, 49, e2021GL096758. [Google Scholar] [CrossRef]
- Hu, W.; Si, B. Technical Note: Improved partial wavelet coherency for understanding scale-specific and localized bivariate relationships in geosciences. Hydrol. Earth Syst. Sci. 2021, 25, 321–331. [Google Scholar] [CrossRef]
- Grinsted, A.; Moore, J.C.; Jevrejeva, S. Application of the cross wavelet transform and wavelet coherence to geophysical time series. Nonlinear Process. Geophys. 2004, 11, 561–566. [Google Scholar] [CrossRef]
- He, Q.; Chun, K.P.; Sum Fok, H.; Chen, Q.; Dieppois, B.; Massei, N. Water storage redistribution over East China, between 2003 and 2015, driven by intra- and inter-annual climate variability. J. Hydrol. 2020, 583, 124475. [Google Scholar] [CrossRef]
- Lachaux, J.P.; Lutz, A.; Rudrauf, D.; Cosmelli, D.; Le Van Quyen, M.; Martinerie, J.; Varela, F. Estimating the time-course of coherence between single-trial brain signals: An introduction to wavelet coherence. Neurophysiol. Clin. 2002, 32, 157–174. [Google Scholar] [CrossRef]
- Wijesekara, C.; Tittagalla, C.; Jayathilaka, A.; Ilukpotha, U.; Jayathilaka, R.; Jayasinghe, P. Tourism and economic growth: A global study on Granger causality and wavelet coherence. PLoS ONE 2022, 17, e0274386. [Google Scholar] [CrossRef]
- Apurv, T.; Cai, X. Drought Propagation in Contiguous U.S. Watersheds: A Process-Based Understanding of the Role of Climate and Watershed Properties. Water Resour. Res. 2020, 56, e2020WR027755. [Google Scholar] [CrossRef]
- Dai, M.; Huang, S.; Huang, Q.; Zheng, X.; Su, X.; Leng, G.; Li, Z.; Guo, Y.; Fang, W.; Liu, Y. Propagation characteristics and mechanism from meteorological to agricultural drought in various seasons. J. Hydrol. 2022, 610, 127897. [Google Scholar] [CrossRef]
- Ma, L.; Huang, Q.; Huang, S.; Liu, D.; Leng, G.; Wang, L.; Li, P. Propagation dynamics and causes of hydrological drought in response to meteorological drought at seasonal timescales. Hydrol. Res. 2022, 53, 193–205. [Google Scholar] [CrossRef]
- Ho, S.; Tian, L.; Disse, M.; Tuo, Y. A new approach to quantify propagation time from meteorological to hydrological drought. J. Hydrol. 2021, 603, 127056. [Google Scholar] [CrossRef]
- Zhang, Q.; Miao, C.; Gou, J.; Wu, J.; Jiao, W.; Song, Y.; Xu, D. Spatiotemporal characteristics of meteorological to hydrological drought propagation under natural conditions in China. Weather. Clim. Extrem. 2022, 38, 100505. [Google Scholar] [CrossRef]
- Zhang, X.; Hao, Z.; Singh, V.P.; Zhang, Y.; Feng, S.; Xu, Y.; Hao, F. Drought propagation under global warming: Characteristics, approaches, processes, and controlling factors. Sci. Total Environ. 2022, 838, 156021. [Google Scholar] [CrossRef]
- McPhaden, M.J.; Zebiak, S.E.; Glantz, M.H. ENSO as an Integrating Concept in Earth Science. Science 2006, 314, 1740–1745. [Google Scholar] [CrossRef] [PubMed]
- Ndehedehe, C.E.; Ferreira, V.G. Identifying the footprints of global climate modes in time-variable gravity hydrological signals. Clim. Chang. 2020, 159, 481–502. [Google Scholar] [CrossRef]
- Cai, W.; McPhaden, M.J.; Grimm, A.M.; Rodrigues, R.R.; Taschetto, A.S.; Garreaud, R.D.; Dewitte, B.; Poveda, G.; Ham, Y.G.; Santoso, A.; et al. Climate impacts of the El Niño–Southern Oscillation on South America. Nat. Rev. Earth Environ. 2020, 1, 215–231. [Google Scholar] [CrossRef]
- Sun, X.; Renard, B.; Thyer, M.; Westra, S.; Lang, M. A global analysis of the asymmetric effect of ENSO on extreme precipitation. J. Hydrol. 2015, 530, 51–65. [Google Scholar] [CrossRef]
- Steiger, N.J.; Smerdon, J.E.; Seager, R.; Williams, A.P.; Varuolo-Clarke, A.M. ENSO-driven coupled megadroughts in North and South America over the last millennium. Nat. Geosci. 2021, 14, 739–744. [Google Scholar] [CrossRef]
- Deser, C.; Simpson, I.R.; McKinnon, K.A.; Phillips, A.S. The Northern Hemisphere Extratropical Atmospheric Circulation Response to ENSO: How Well Do We Know It and How Do We Evaluate Models Accordingly? J. Clim. 2017, 30, 5059–5082. [Google Scholar] [CrossRef]
- Stephenson, D.B.; Pavan, V.; Boer, G.J.; Boville, B.A.; Cubasch, U.; Fairhead, L.; Gordon, H.; Johns, T.; Kimoto, M.; Meehl, J.; et al. The North Atlantic Oscillation in coupled climate models: A CMIP1 evaluation. Clim. Dyn. 2003, 20, 381–399. [Google Scholar] [CrossRef]
- Bhattacharya, I.; Jezek, K.C.; Wang, L.; Liu, H. Surface melt area variability of the Greenland ice sheet: 1979–2008. Geophys. Res. Lett. 2009, 36, 20502. [Google Scholar] [CrossRef]
- Tsanis, I.; Tapoglou, E. Winter North Atlantic Oscillation impact on European precipitation and drought under climate change. Theor. Appl. Climatol. 2019, 135, 323–330. [Google Scholar] [CrossRef]
- Saji, N.H.; Goswami, B.N.; Vinayachandran, P.N.; Yamagata, T. A dipole mode in the tropical Indian ocean. Nature 1999, 401, 360–363. [Google Scholar] [CrossRef] [PubMed]
- Abram, N.J.; Gagan, M.K.; Liu, Z.; Hantoro, W.S.; McCulloch, M.T.; Suwargadi, B.W. Seasonal characteristics of the Indian Ocean Dipole during the Holocene epoch. Nature 2007, 445, 299–302. [Google Scholar] [CrossRef] [PubMed]
- Tapley, B.D.; Watkins, M.M.; Flechtner, F.; Reigber, C.; Bettadpur, S.; Rodell, M.; Sasgen, I.; Famiglietti, J.S.; Landerer, F.W.; Chambers, D.P.; et al. Contributions of GRACE to understanding climate change. Nat. Clim. Chang. 2019, 9, 358–369. [Google Scholar] [CrossRef] [PubMed]
- Thomas, B.F.; Famiglietti, J.S.; Landerer, F.W.; Wiese, D.N.; Molotch, N.P.; Argus, D.F. GRACE Groundwater Drought Index: Evaluation of California Central Valley groundwater drought. Remote Sens. Environ. 2017, 198, 384–392. [Google Scholar] [CrossRef]
- Zhang, D.; Liu, X.; Bai, P. Assessment of hydrological drought and its recovery time for eight tributaries of the Yangtze River (China) based on downscaled GRACE data. J. Hydrol. 2019, 568, 592–603. [Google Scholar] [CrossRef]
- Pokhrel, Y.; Felfelani, F.; Satoh, Y.; Boulange, J.; Burek, P.; Gädeke, A.; Gerten, D.; Gosling, S.N.; Grillakis, M.; Gudmundsson, L.; et al. Global terrestrial water storage and drought severity under climate change. Nat. Clim. Chang. 2021, 11, 226–233. [Google Scholar] [CrossRef]
- Save, H.; Bettadpur, S.; Tapley, B.D. High-resolution CSR GRACE RL05 mascons. J. Geophys. Res. Solid. Earth 2016, 121, 7547–7569. [Google Scholar] [CrossRef]
- Harris, I.; Jones, P.D.; Osborn, T.J.; Lister, D.H. Updated high-resolution grids of monthly climatic observations—The CRU TS3.10 Dataset. Int. J. Climatol. 2014, 34, 623–642. [Google Scholar] [CrossRef]
- Jones, P.D.; Lister, D.H.; Osborn, T.J.; Harpham, C.; Salmon, M.; Morice, C.P. Hemispheric and large-scale land-surface air temperature variations: An extensive revision and an update to 2010. J. Geophys. Res. Atmos. 2012, 117, D05127. [Google Scholar] [CrossRef]
- Smith, P.R. Bilinear interpolation of digital images. Ultramicroscopy 1981, 6, 201–204. [Google Scholar] [CrossRef]
- Rasmusson, E.M.; Carpenter, T.H. Variations in tropical sea surface temperature and surface wind fields associated with the Southern Oscillation/El Nino. Mon. Weather Rev. 1982, 110, 354–384. [Google Scholar] [CrossRef]
- Trenberth, K.E.; Stepaniak, D.P. Indices of El Niño evolution. J. Clim. 2001, 14, 1697–1701. [Google Scholar] [CrossRef]
- Trenberth, K.E. The Definition of El Niño. Bull. Am. Meteorol. Soc. 1997, 78, 2771–2777. [Google Scholar] [CrossRef]
- Mantua, N.J.; Hare, S.R.; Zhang, Y.; Wallace, J.M.; Francis, R.C. A Pacific Interdecadal Climate Oscillation with Impacts on Salmon Production. Bull. Am. Meteorol. Soc. 1997, 78, 1069–1080. [Google Scholar] [CrossRef]
- Zhang, Y.; Wallace, J.M.; Battisti, D.S. ENSO-like Interdecadal Variability: 1900–93. J. Clim. 1997, 10, 1004–1020. [Google Scholar] [CrossRef]
- Smith, T.M.; Reynolds, R.W. Improved extended reconstruction of SST (1854–1997). J. Clim. 2004, 17, 2466–2477. [Google Scholar] [CrossRef]
- Mckee, T.B.; Doesken, N.J.; Kleist, J. The relationship of drought frequency and duration to time scales. In Proceedings of the Eighth Conference on Applied Climatology, Anaheim, CA, USA, 17–22 January 1993. [Google Scholar]
- Labudová, L.; Labuda, M.; Takáč, J. Comparison of SPI and SPEI applicability for drought impact assessment on crop production in the Danubian Lowland and the East Slovakian Lowland. Theor. Appl. Climatol. 2017, 128, 491–506. [Google Scholar] [CrossRef]
- Zhong, F.; Cheng, Q.; Cheng, Q.; Wang, P. Meteorological Drought, Hydrological Drought, and NDVI in the Heihe River Basin, Northwest China: Evolution and Propagation. Adv. Meteorol. 2020, 2020, 2409068. [Google Scholar] [CrossRef]
- Zakhem, B.A.; Kattaa, B. Investigation of hydrological drought using cumulative standardized precipitation index (SPI 30) in the eastern Mediterranean region (Damascus, Syria). J. Earth Syst. Sci. 2016, 125, 969–984. [Google Scholar] [CrossRef]
- Fiorillo, F.; Guadagno, F.M. Karst spring discharges analysis in relation to drought periods, using the SPI. Water Resour. Manag. 2010, 24, 1867–1884. [Google Scholar] [CrossRef]
- Zhao, M.; Geruo, A.; Velicogna, I.; Kimball, J.S. A Global Gridded Dataset of GRACE Drought Severity Index for 2002–14: Comparison with PDSI and SPEI and a Case Study of the Australia Millennium Drought. J. Hydrometeorol. 2017, 18, 2117–2129. [Google Scholar] [CrossRef]
- Nie, N.; Zhang, W.; Chen, H.; Guo, H. A Global Hydrological Drought Index Dataset Based on Gravity Recovery and Climate Experiment (GRACE) Data. Water Resour. Manag. 2018, 32, 1275–1290. [Google Scholar] [CrossRef]
- Lilliefors, H.W. On the Kolmogorov-Smirnov Test for Normality with Mean and Variance Unknown. J. Am. Stat. Assoc. 1967, 62, 399–402. [Google Scholar] [CrossRef]
- Mann, H.B. Nonparametric Tests Against Trend. Econometrica 1945, 13, 245–259. [Google Scholar] [CrossRef]
- Kendall, M. Rank Correlation Measures; Charles Griffin: San Francisco, CA, USA, 1975. [Google Scholar]
- Sen, P.K. Estimates of the Regression Coefficient Based on Kendall’s Tau. J. Am. Stat. Assoc. 1968, 63, 1379–1389. [Google Scholar] [CrossRef]
- Torrence, C.; Compo, G.P. A Practical Guide to Wavelet Analysis. Bull. Am. Meteorol. Soc. 1998, 79, 61–78. [Google Scholar] [CrossRef]
- Mihanović, H.; Orlić, M.; Pasarić, Z. Diurnal thermocline oscillations driven by tidal flow around an island in the Middle Adriatic. J. Mar. Syst. 2009, 78, 157–168. [Google Scholar] [CrossRef]
- Ng, E.K.W.; Chan, J.C.L. Geophysical applications of partial wavelet coherence and multiple wavelet coherence. J. Atmos. Ocean. Technol. 2012, 29, 1845–1853. [Google Scholar] [CrossRef]
- Hu, W.; Si, B.C.; Biswas, A.; Chau, H.W. Temporally stable patterns but seasonal dependent controls of soil water content: Evidence from wavelet analyses. Hydrol. Process. 2017, 31, 3697–3707. [Google Scholar] [CrossRef]
- Ouyang, R.; Liu, W.; Fu, G.; Liu, C.; Hu, L.; Wang, H. Linkages between ENSO/PDO signals and precipitation, streamflow in China during the last 100 years. Hydrol. Earth Syst. Sci. 2014, 18, 3651–3661. [Google Scholar] [CrossRef]
- Donat, M.G.; Peterson, T.C.; Brunet, M.; King, A.D.; Almazroui, M.; Kolli, R.K.; Boucherf, D.; Al-Mulla, A.Y.; Nour, A.Y.; Aly, A.A.; et al. Changes in extreme temperature and precipitation in the Arab region: Long-term trends and variability related to ENSO and NAO. Int. J. Climatol. 2014, 34, 581–592. [Google Scholar] [CrossRef]
- Overland, J.E.; Wang, M. The Arctic climate paradox: The recent decrease of the Arctic Oscillation. Geophys. Res. Lett. 2005, 32, 1–5. [Google Scholar] [CrossRef]
- Leathers, D.J.; Yarnal, B.; Palecki, M.A. The Pacific/North American Teleconnection Pattern and United States Climate. Part I: Regional Temperature and Precipitation Associations. J. Clim. 1991, 4, 517–528. [Google Scholar] [CrossRef]
- Fernandez, D.; Bowen, M.; Sutton, P. South Pacific Ocean Dynamics Redistribute Ocean Heat Content and Modulate Heat Exchange with the Atmosphere. Geophys. Res. Lett. 2022, 49, e2022GL100965. [Google Scholar] [CrossRef]
- Tolorza, V.; Mohr, C.H.; Carretier, S.; Serey, A.; Sepúlveda, S.A.; Tapia, J.; Pinto, L. Suspended Sediments in Chilean Rivers Reveal Low Postseismic Erosion After the Maule Earthquake (Mw 8.8) During a Severe Drought. J. Geophys. Res. Earth Surf. 2019, 124, 1378–1397. [Google Scholar] [CrossRef]
- Peel, M.C.; Finlayson, B.L.; McMahon, T.A. Updated world map of the Köppen-Geiger climate classification. Hydrol. Earth Syst. Sci. 2007, 11, 1633–1644. [Google Scholar] [CrossRef]
- Vecchi, G.A.; Soden, B.J.; Wittenberg, A.T.; Held, I.M.; Leetmaa, A.; Harrison, M.J. Weakening of tropical Pacific atmospheric circulation due to anthropogenic forcing. Nature 2006, 441, 73–76. [Google Scholar] [CrossRef]
- Lee, J.E.; Lintner, B.R.; Boyce, C.K.; Lawrence, P.J. Land use change exacerbates tropical South American drought by sea surface temperature variability. Geophys. Res. Lett. 2011, 38. [Google Scholar] [CrossRef]
- Zhang, N.; Yasunari, T.; Ohta, T. Dynamics of the larch taiga-permafrost coupled system in Siberia under climate change. Environ. Res. Lett. 2011, 6, 024003. [Google Scholar] [CrossRef]
- Wang, T.; Chen, J.; Zhang, C.; Zhan, L.; Guyot, A.; Li, L. An entropy-based analysis method of precipitation isotopes revealing main moisture transport corridors globally. Glob. Planet. Chang. 2020, 187, 103134. [Google Scholar] [CrossRef]
- Lv, W.; Wu, C.; Yeh, P.J.-F.; Hu, B.X. Spatio-temporal variability of dryness and wetness based on standardized precipitation evapotranspiration index and standardized wetness index and its relation to the normalized difference vegetation index. Int. J. Climatol. 2021, 42, 671–690. [Google Scholar] [CrossRef]
- Su, L.; Miao, C.; Duan, Q.; Lei, X.; Li, H. Multiple-Wavelet Coherence of World’s Large Rivers With Meteorological Factors and Ocean Signals. J. Geophys. Res. Atmos. 2019, 124, 4932–4954. [Google Scholar] [CrossRef]
- Zhang, L.; Jiao, W.; Zhang, H.; Huang, C.; Tong, Q. Studying drought phenomena in the Continental United States in 2011 and 2012 using various drought indices. Remote Sens. Environ. 2017, 190, 96–106. [Google Scholar] [CrossRef]
- Liu, Y.; Liu, Y.; Wang, W.; Zhou, H. Propagation of soil moisture droughts in a hotspot region: Spatial pattern and temporal trajectory. J. Hydrol. 2021, 593, 125906. [Google Scholar] [CrossRef]
- Huang, S.; Li, P.; Huang, Q.; Leng, G.; Hou, B.; Ma, L. The propagation from meteorological to hydrological drought and its potential influence factors. J. Hydrol. 2017, 547, 184–195. [Google Scholar] [CrossRef]
- Schumacher, D.L.; Keune, J.; Dirmeyer, P.; Miralles, D.G. Drought self-propagation in drylands due to land–atmosphere feedbacks. Nat. Geosci. 2022, 15, 262–268. [Google Scholar] [CrossRef] [PubMed]
- Marchane, A.; Jarlan, L.; Boudhar, A.; Tramblay, Y.; Hanich, L. Linkages between snow cover, temperature and rainfall and the North Atlantic Oscillation over Morocco. Clim. Res. 2016, 69, 229–238. [Google Scholar] [CrossRef]
- Hunt, K.M.R.; Zaz, S.N. Linking the North Atlantic Oscillation to winter precipitation over the Western Himalaya through disturbances of the subtropical jet. Clim. Dyn. 2022, 60, 2389–2403. [Google Scholar] [CrossRef]
- Sun, C.; Li, J.; Feng, J.; Xie, F. A decadal-scale teleconnection between the North Atlantic Oscillation and subtropical eastern Australian rainfall. J. Clim. 2015, 28, 1074–1092. [Google Scholar] [CrossRef]
- Zheng, Z.; Ban, J.; Li, Y. The Effect of the Arctic Oscillation on the Predictability of Mid-High Latitude Circulation in December. Front. Phys. 2021, 9, 736085. [Google Scholar] [CrossRef]
- Kim, S.H.; Kryjov, V.N.; Ahn, J.B. The roles of global warming and Arctic Oscillation in the winter 2020 extremes in East Asia. Environ. Res. Lett. 2022, 17, 065010. [Google Scholar] [CrossRef]
- Saji, N.H.; Yamagata, T. Possible impacts of Indian Ocean Dipole mode events on global climate. Clim. Res. 2003, 25, 151–169. [Google Scholar] [CrossRef]
- Yang, Y.; Xie, S.P.; Wu, L.; Kosaka, Y.; Lau, N.C.; Vecchi, G.A. Seasonality and predictability of the Indian Ocean dipole mode: ENSO forcing and internal variability. J. Clim. 2015, 28, 8021–8036. [Google Scholar] [CrossRef]
Disclaimer/Publisher’s Note: The statements, opinions and data contained in all publications are solely those of the individual author(s) and contributor(s) and not of MDPI and/or the editor(s). MDPI and/or the editor(s) disclaim responsibility for any injury to people or property resulting from any ideas, methods, instructions or products referred to in the content. |
© 2024 by the authors. Licensee MDPI, Basel, Switzerland. This article is an open access article distributed under the terms and conditions of the Creative Commons Attribution (CC BY) license (https://creativecommons.org/licenses/by/4.0/).