Article

Ground Subsidence, Driving Factors, and Risk Assessment of the Photovoltaic Power Generation and Greenhouse Planting (PPG&GP) Projects in Coal-Mining Areas of Xintai City Observed from a Multi-Temporal InSAR Perspective

1
School of Civil Engineering and Geomatics, Shandong University of Technology, Zibo 255049, China
2
State Key Laboratory of Information Engineering in Surveying, Mapping and Remote Sensing, Wuhan University, Wuhan 430079, China
3
State Key Laboratory of Geodesy and Earth’s Dynamics, Innovation Academy for Precision Measurement Science and Technology, Chinese Academy of Sciences, Wuhan 430077, China
4
School of Geosciences and Info-Physics, Central South University, Changsha 410083, China
*
Author to whom correspondence should be addressed.
Remote Sens. 2024, 16(6), 1109; https://doi.org/10.3390/rs16061109
Submission received: 25 February 2024 / Revised: 19 March 2024 / Accepted: 20 March 2024 / Published: 21 March 2024

Abstract

:
In recent years, photovoltaic power generation and greenhouse planting (PPG&GP) have become effective approaches for reconstructing and restoring the ecological environment of old coal-mining industry bases, such as Xintai City. However, the ecological impacts or improvements of the PPG&GP projects and their daily operations on the local environment are still unclear. To solve these problems, this study retrieved the ground deformation velocities and time series of the study region by performing the Small-Baseline Subset (SBAS)-Interferometric Synthetic Aperture Radar (InSAR) technique on the Advanced Land Observing Satellite (ALOS) PALSAR and Sentinel-1 SAR datasets. With these deformation results, the spatial analysis indicated that the area of the subsidence region within the PPG&GP projects reached 10.70 km2, with a magnitude of approximately −21.61 ± 12.10 mm/yr. Also, even though the ground deformations and their temporal changes were both visible in the construction and operation stages of the PPG&GP projects, the temporal analysis demonstrated that most observation points finally entered into the stationary phases in the late stage of the observation period. This phenomenon validated the effectiveness of the PPG&GP projects in enhancing the ground surface stability in coal-mining areas. Additionally, the precipitation, geological structure, increased coal-mining depths, and emergent agricultural modes were assumed to be the major impact factors controlling the ground deformation within the local PPG&GP projects. Finally, a novel risk assessment method with a designed index of IRA was utilized to classify the ground subsidence risks of the PPG&GP projects into three levels: Low (69.7%), Medium (16.9%), and High (9.4%). This study sheds a bright light on the ecological monitoring and risk management of the burgeoning industrial and agricultural infrastructures, such as the PPG&GP projects, constructed upon the traditional coal-mining areas in China from a multi-temporal InSAR perspective.

1. Introduction

Fully operating for more than 70 years, the Chinese coal industry has provided important energy security for social and economic development. Nevertheless, coal mining also has left a large percentage of goaf and ground subsidence areas, leading to a series of problems in the economy, society, and especially ecological environments. Statistics indicated that the coal mining subsidence areas are distributed in 27 provinces in China and will reach an area of around 60,000 km2 in the future [1]. The comprehensive management of coal mining subsidence areas has become an urgent problem for local governments to solve. Since 2015, China has achieved outstanding work in the safety management of coal mining subsidence areas by carrying out a 6 million kilowatt photovoltaic power generation (PPG) plan. With the rapid development of the PPG industry, its land use is becoming increasingly scarce. Utilizing the damaged land in coal mining subsidence areas to develop photovoltaic technology not only solves the problem of ecological environment governance but also turns idle land resources into one element of local economic growth to drive local employment. The local leveling of this site during the development and construction of the photovoltaic power stations is equivalent to land remediation for the management of the coal mining environment. The installation of the photovoltaic-generating module is equivalent to indirect vegetation greening, which not only reduces evaporation but also increases the moisture content of shallow soil through the regular cleaning of photovoltaic-generating modules.
In recent years, the green industrial belt of PPG and greenhouse planting (PPG&GP) was performed in the traditional coal-mining regions with the implementation of the government strategy of “conversion from the old kinetic energy to the new ones” (https://www.gov.cn/zhengce/content/2022-09/02/content_5708004.htm, accessed on 2 November 2023) in Xintai City of Shandong Province, China. Many studies have shown that the suitable installation of PPG equipment on the GP within the PPG&GP projects not only enhances power generation capacity but also increases soil moisture content and water usage efficiency [2,3]. To some extent, the installation of PPG modules directly increases the partial vegetation of plants and decreases the pest rate [4]. However, the continuous ground subsidence of coal-mining regions may threaten the safety management of these infrastructures on the ground surface.
In recent decades, most of the underground coal mining activities in Xinwen Coalfield have gradually been operated at the deeper mining depths of thick coal seams, resulting in the large ground subsidence deformation of the overlying rock strata. This has also given rise to some severe natural hazards and environmental problems. For example, the ground subsidence deformation that occurred upon the overlying rock strata has damaged the underground water aquifers, causing considerable water loss and ecological aggravation. Moreover, ground subsidence and deformation have damaged surface infrastructures and even triggered collapse events in this region, leading to enormous losses in economics and the lives of local residents. Thus, it is crucial to retrieve mining-related ground deformation and time-series history for accurately assessing and effectively controlling the mining-related environmental problems and the potential hazards in this coalfield.
The traditional measuring techniques of ground deformation, such as tape, leveling, theodolite, total station, and Global Navigation Satellite System (GNSS), can acquire precise point-wise ground deformation signals. However, these techniques were generally characterized by long revisit cycles, low spatial resolution, and high measuring costs. Comparatively, in recent years, the Interferometric Synthetic Aperture Radar (InSAR) technique has become a significant approach for retrieving ground deformation due to its advantages of day–night imaging, higher image resolution, free from clouds, and lower measuring costs. The Small-Baseline Subset (SBAS)-InSAR [5] and the Permanent Scatterer (PS)-InSAR [6] were the most commonly used multi-temporal InSAR methods for achieving the ground deformation history. However, compared to those point-wise measurements of PS-InSAR, SBAS-InSAR can retrieve ground deformation signals in higher spatial density and is more suitable for identifying the linear and non-linear ground deformation signals [5,7]. Hence, monitoring the ground subsidence using the SBAS-InSAR technique has thus become a general situation for evaluating the operating safety of human infrastructures on the ground surface in recent years [8]. To better evaluate the stability and the possible catastrophic risks of the PPG&GP projects constructed in the coal-mining areas in Xintai City, the SBAS-InSAR technique was used to retrieve the continuous ground subsidence deformation time series and velocities.
In this study, combining with the environmental controlling factors and the mining-triggered ground subsidence deformation revealed by the SBAS-InSAR method, a workflow of evaluating the operating security and the collapse risks of the PPG&GP projects constructed over the traditional coal-mining areas was designed here. To better understand this study, the introduction of the study site and SAR datasets (Section 2), the illumination of methodology incorporating SBAS-InSAR and a novel assessment strategy of collapse risk (Section 3), the deformation results (Section 4), and the discussions on the spatio-temporal deformation patterns of the PPG&GP projects (Section 5) are subsequently presented in following contents of this paper.

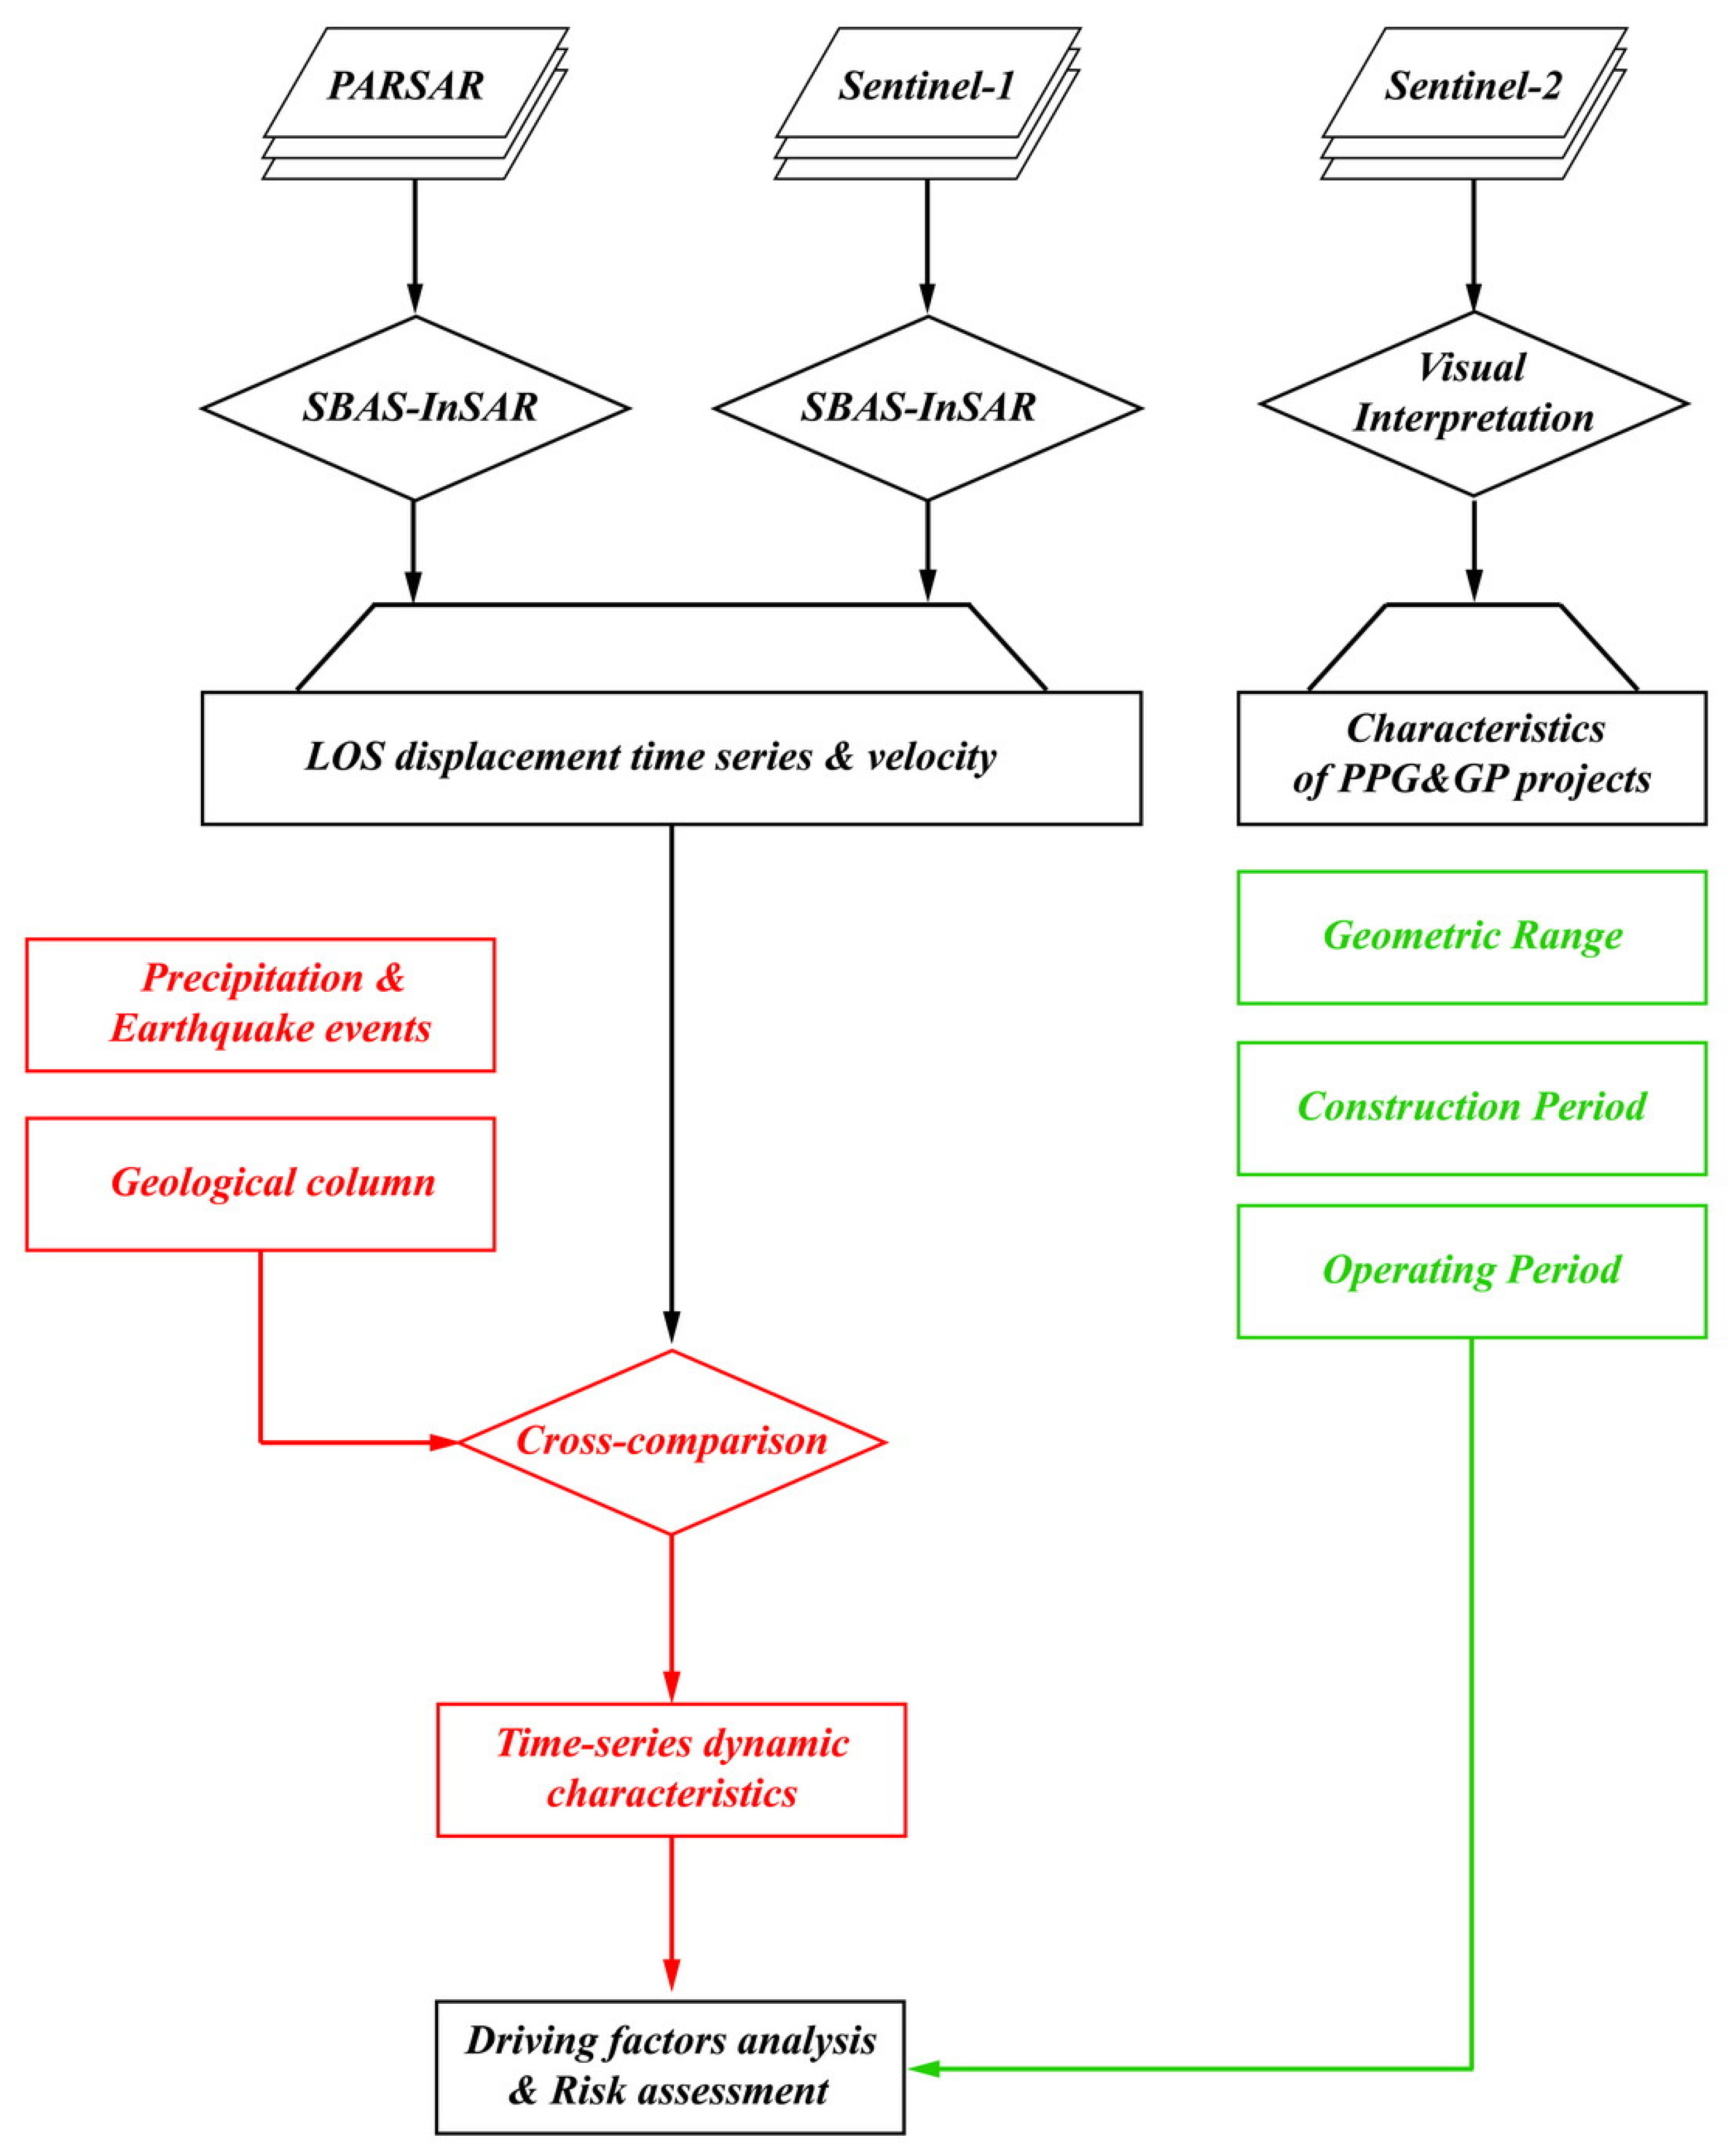
2. Materials and Methods

2.1. Study Site and Datasets
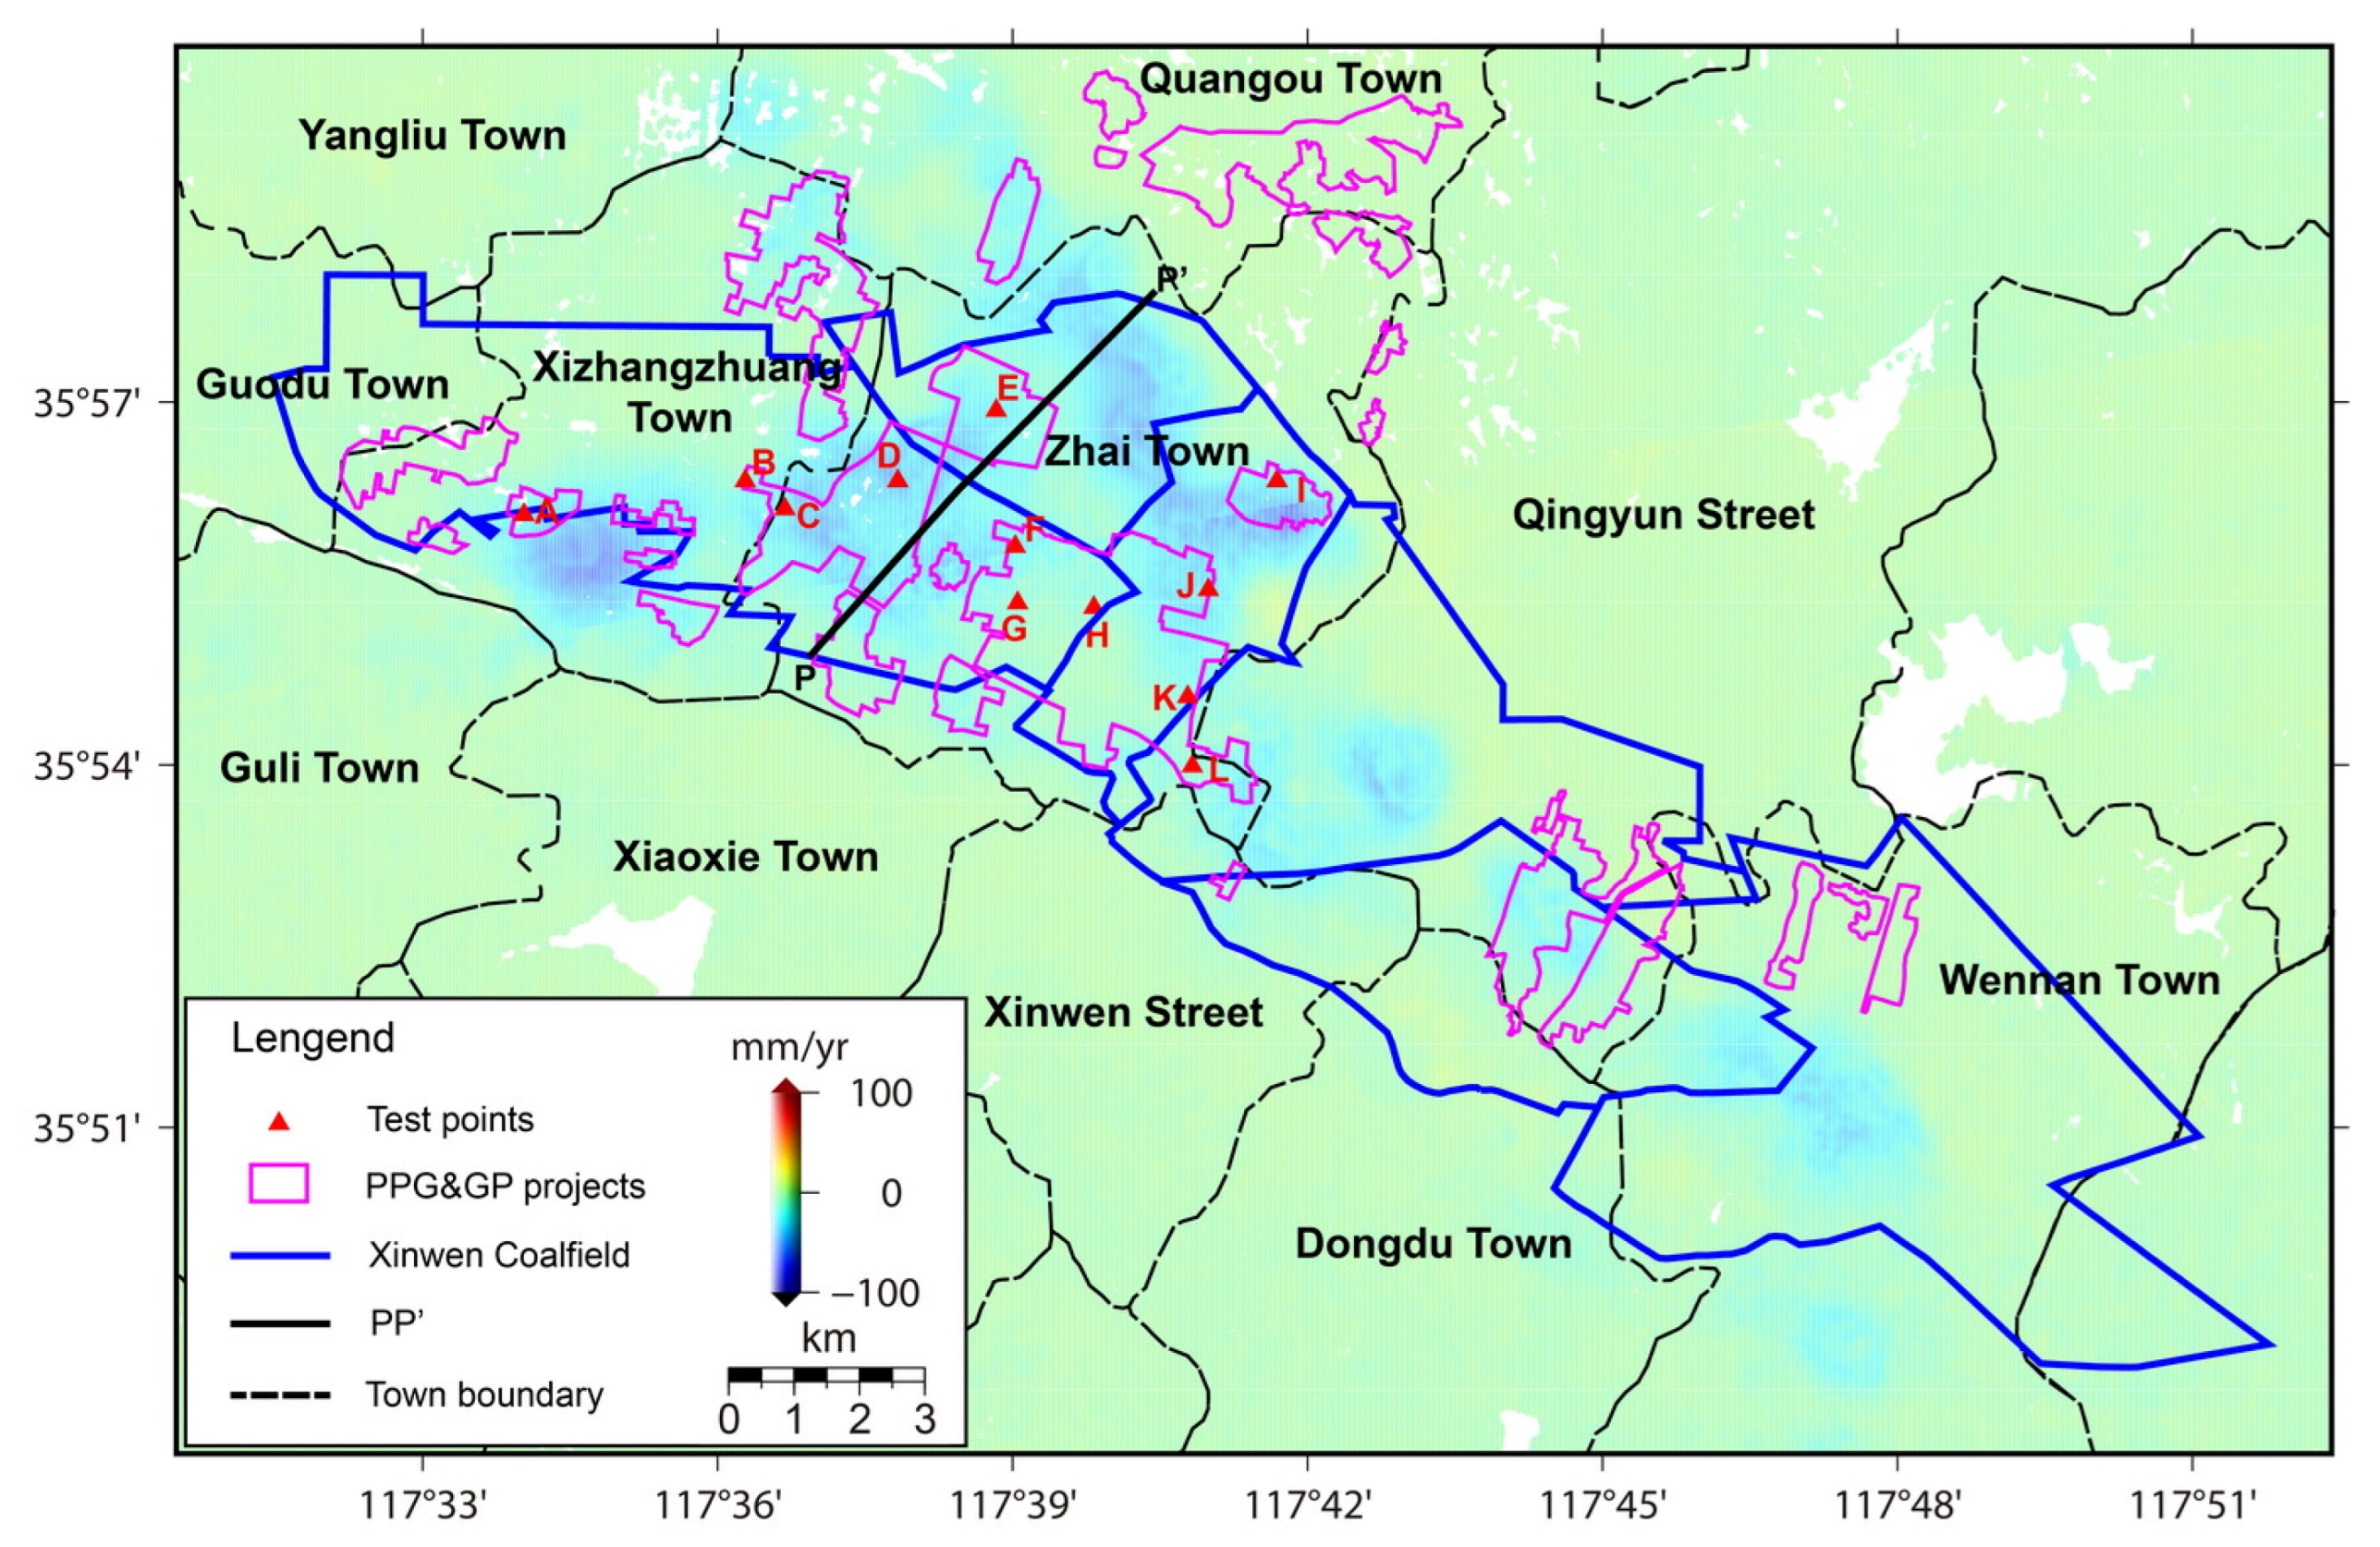
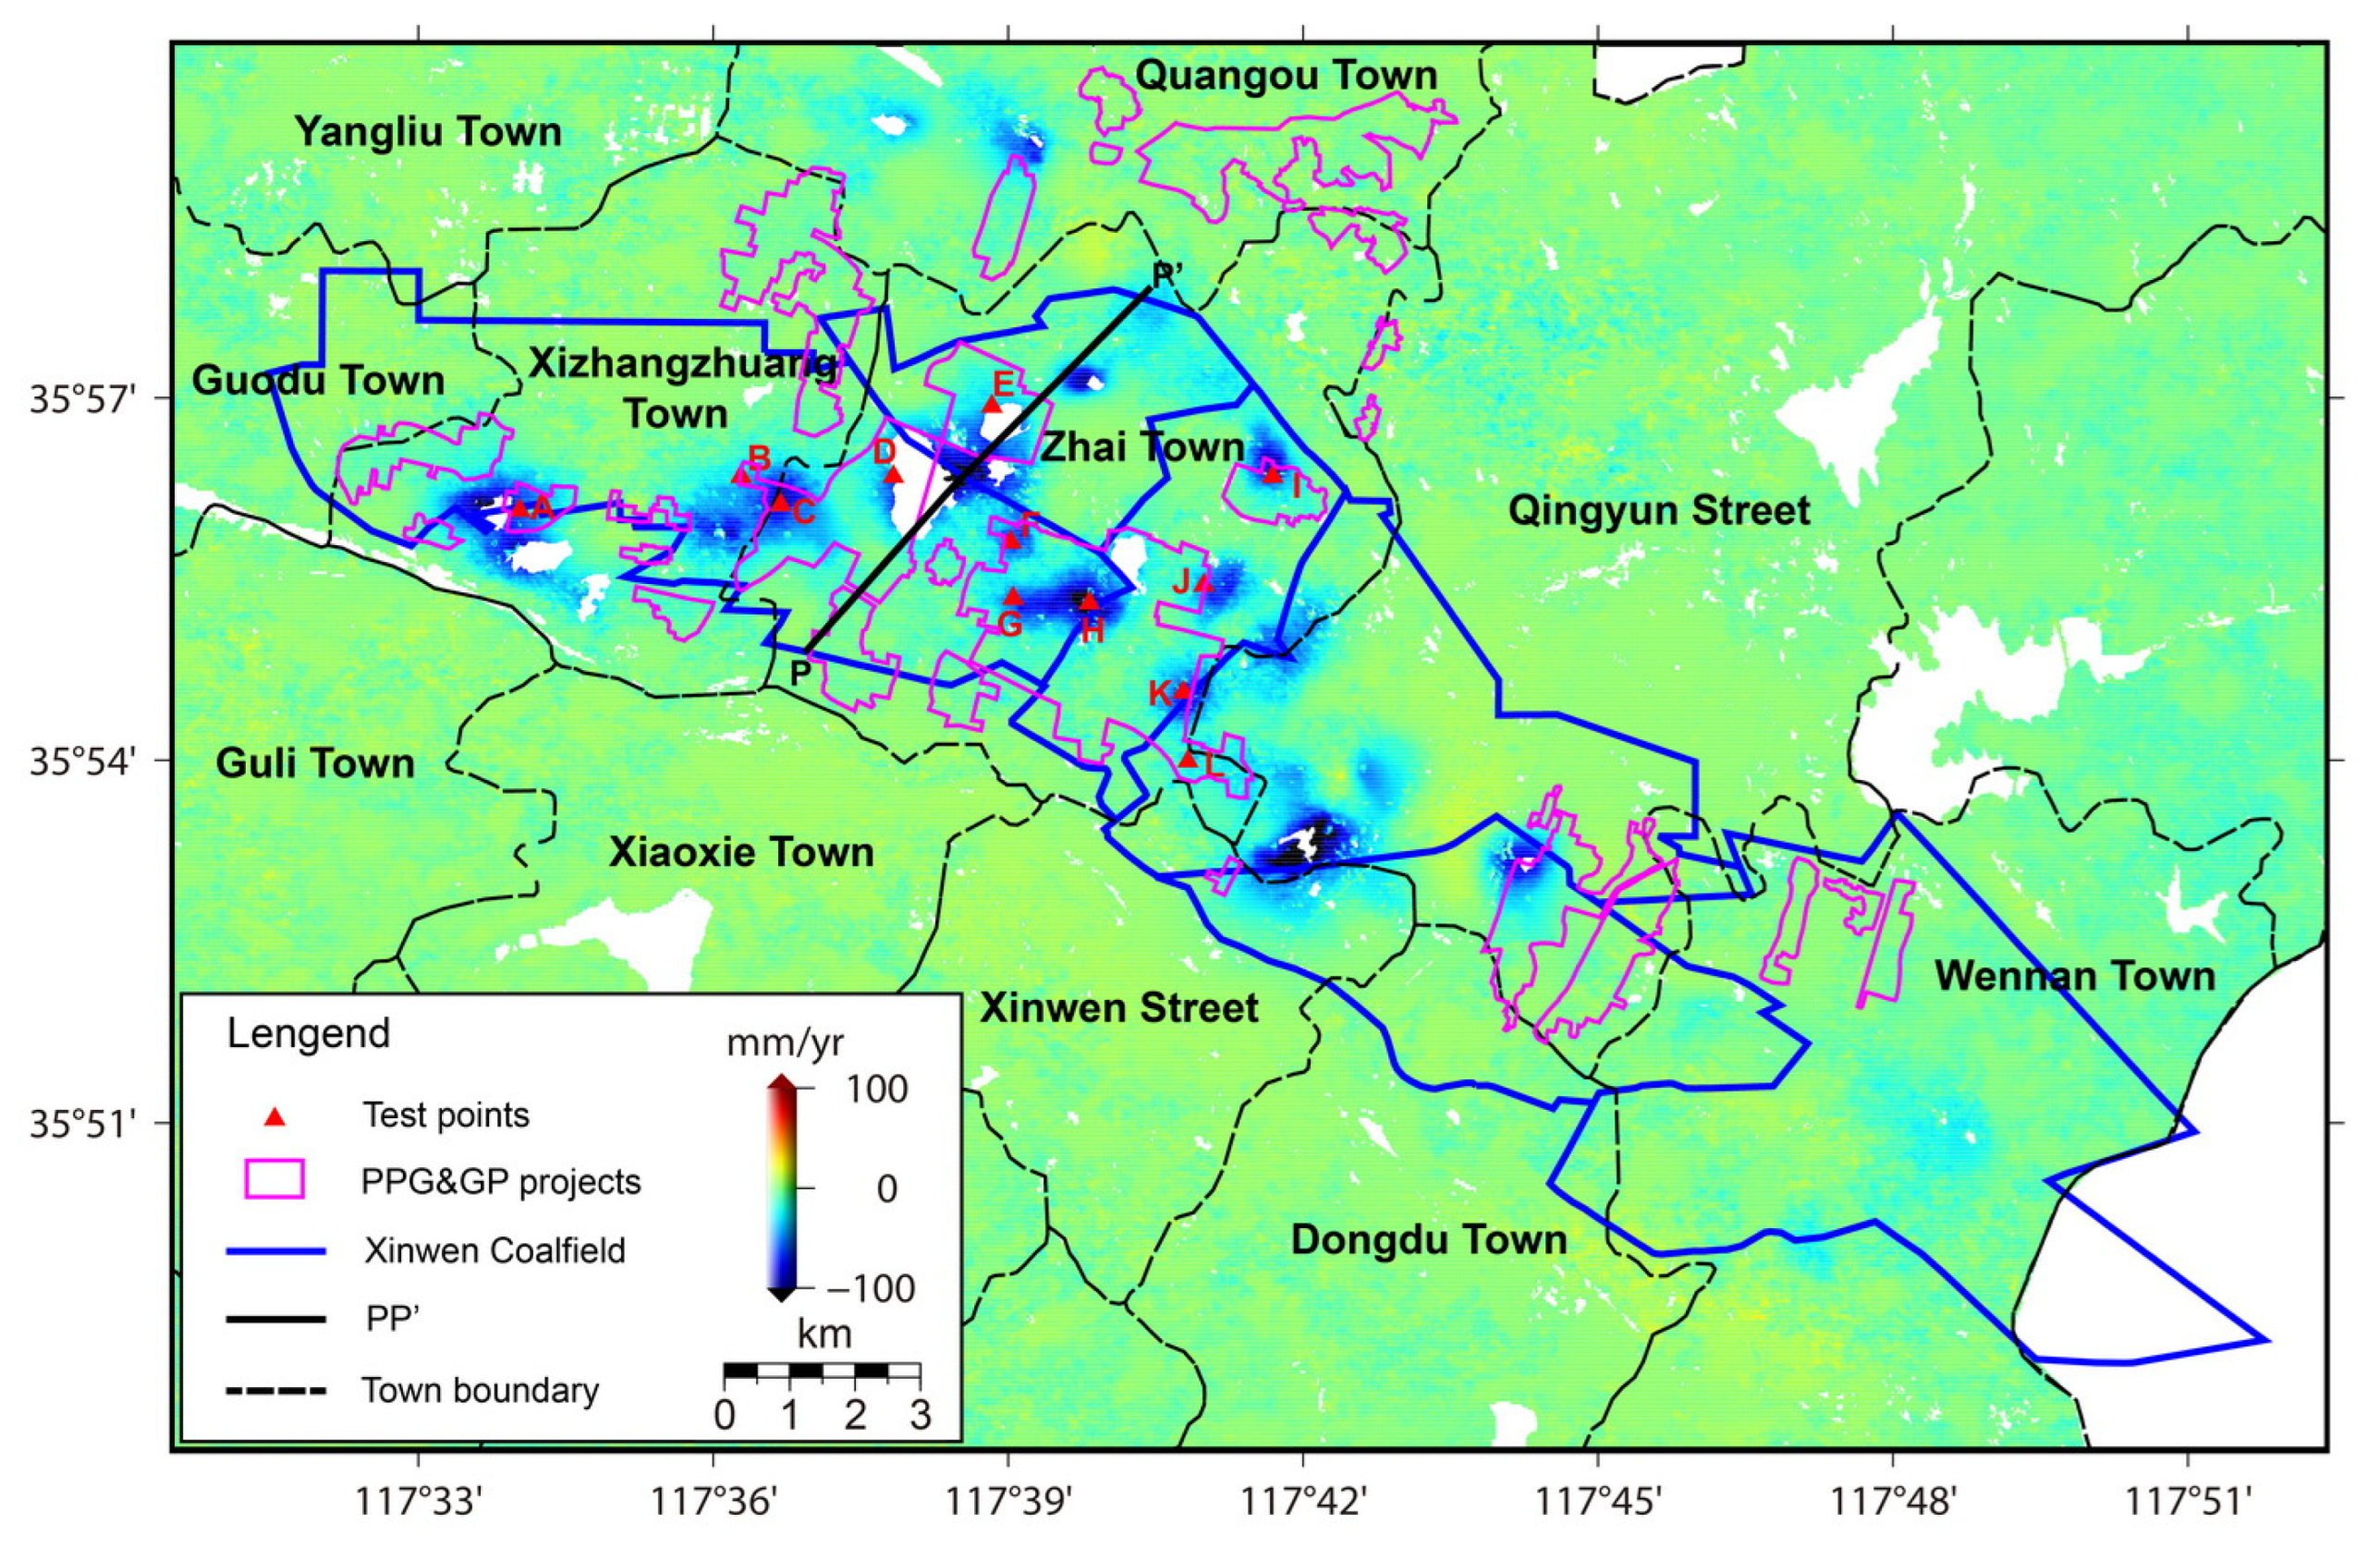
2.1.1. Study Area

As one of the prefecture-level cities of Shandong Province in China, Tai’an City was famous for its abundant coal resources. After nearly 60 years of mining, 44 coal regions in Tai’an City were mainly distributed in three county-level cities, including 25 coal mines in Xintai City, 10 in Feicheng City, and 9 in Ningyang County. As displayed in Figure 1, this study area is located in the Xinwen Coalfield and belongs to the climate zone of the sub-humid warm temperate continental monsoon climate, characterized by four distinct seasons for a whole year. The annual average air temperature is around 12.6 °C, with the highest annual value of around 26 °C in July and the lowest annual value of around 3.3 °C in January [9]. According to the daily precipitation dataset from the Global Precipitation Measurements (https://gpm.nasa.gov/data, accessed on 15 November 2023), more than the historical precipitation of around 730.2 mm/yr fell from 17 January 2007 to 28 October 2010. The average annual precipitation over the study period of 30 July 2015~22 August 2022 was around 968.22 mm/yr, with the seasonal precipitation dominantly concentrated in the summer months. Also, the difference in precipitation between years is great, with alternant occurrences of abundance and drought.
As for the geographical and geomorphological units, Xintai City is completely located in Xinwen Basin, a narrow northwestern basin with a length of around 30 km and a maximal width of approximately 17.5 km, reaching an area of approximately 400 km2 [9,10]. This basin is spatially constricted by the boundary of the southern Mengshan Bulge, the northern Xinfushan Bulge, the western Wanyaotou Village, and the eastern Donglaifo. Located in the middle of the Tai-Yi Mountains, the terrain of Xintai City is mainly constructed by the mountains on three sides of the north, south and east, and the plains on the central and western sides, shaped like a dustpan sitting east to west. The geomorphology of Xintai County was dominantly divided into four categories: intermountain plain, hill, low mountain, and middle mountain [11]. This study region is attributed to Xintai Coalfield and mainly belongs to the geomorphology of intermountain plain.
Figure 1. The geographical and geological background of the study area in Xintai City, with the image coverages of ALOS PALSAR and Sentinel-1 SAR ascending observations. The coalfield boundary, faults, fault branches, and geological structure were revised from [12].
Remotesensing 16 01109 g001
From the perspective of geological tectonic faults, as shown in Figure 1, limited by the orogeny of Mountain Tai, Himalaya Mountain, and Yanshan Mountain [13], Lianhuashan Fault, Yangliu Fault, F10 Fault, and their branches, were the main tectonic fault system of the besom-shaped major dislocation in the Xinwen Coalfield [14]. The geological structure of Xintai City incorporates miscellaneous geological systems and groups. The mountainous area was mainly constructed by the Archaean Group, the Cambrian System, the Ordovician System, the Diorite, the Jurassic System, and the Quaternary System. Comparatively, within the Xinwen Coalfield, the geological structures cropped out the ground surface were mainly constructed by the Quaternary System, the Paleogene System, the Jurassic System, the Permian System, the Carboniferous System, and the Archaean Group. Distributed in the underground depth of around 40~230 m, the coal-bearing geological layer was mainly distributed in the Permian System and the Carboniferous System, mainly constructed by the lithology of grey sandstone, fuscous siltstone, mudstone, packsand, and limestone [10].

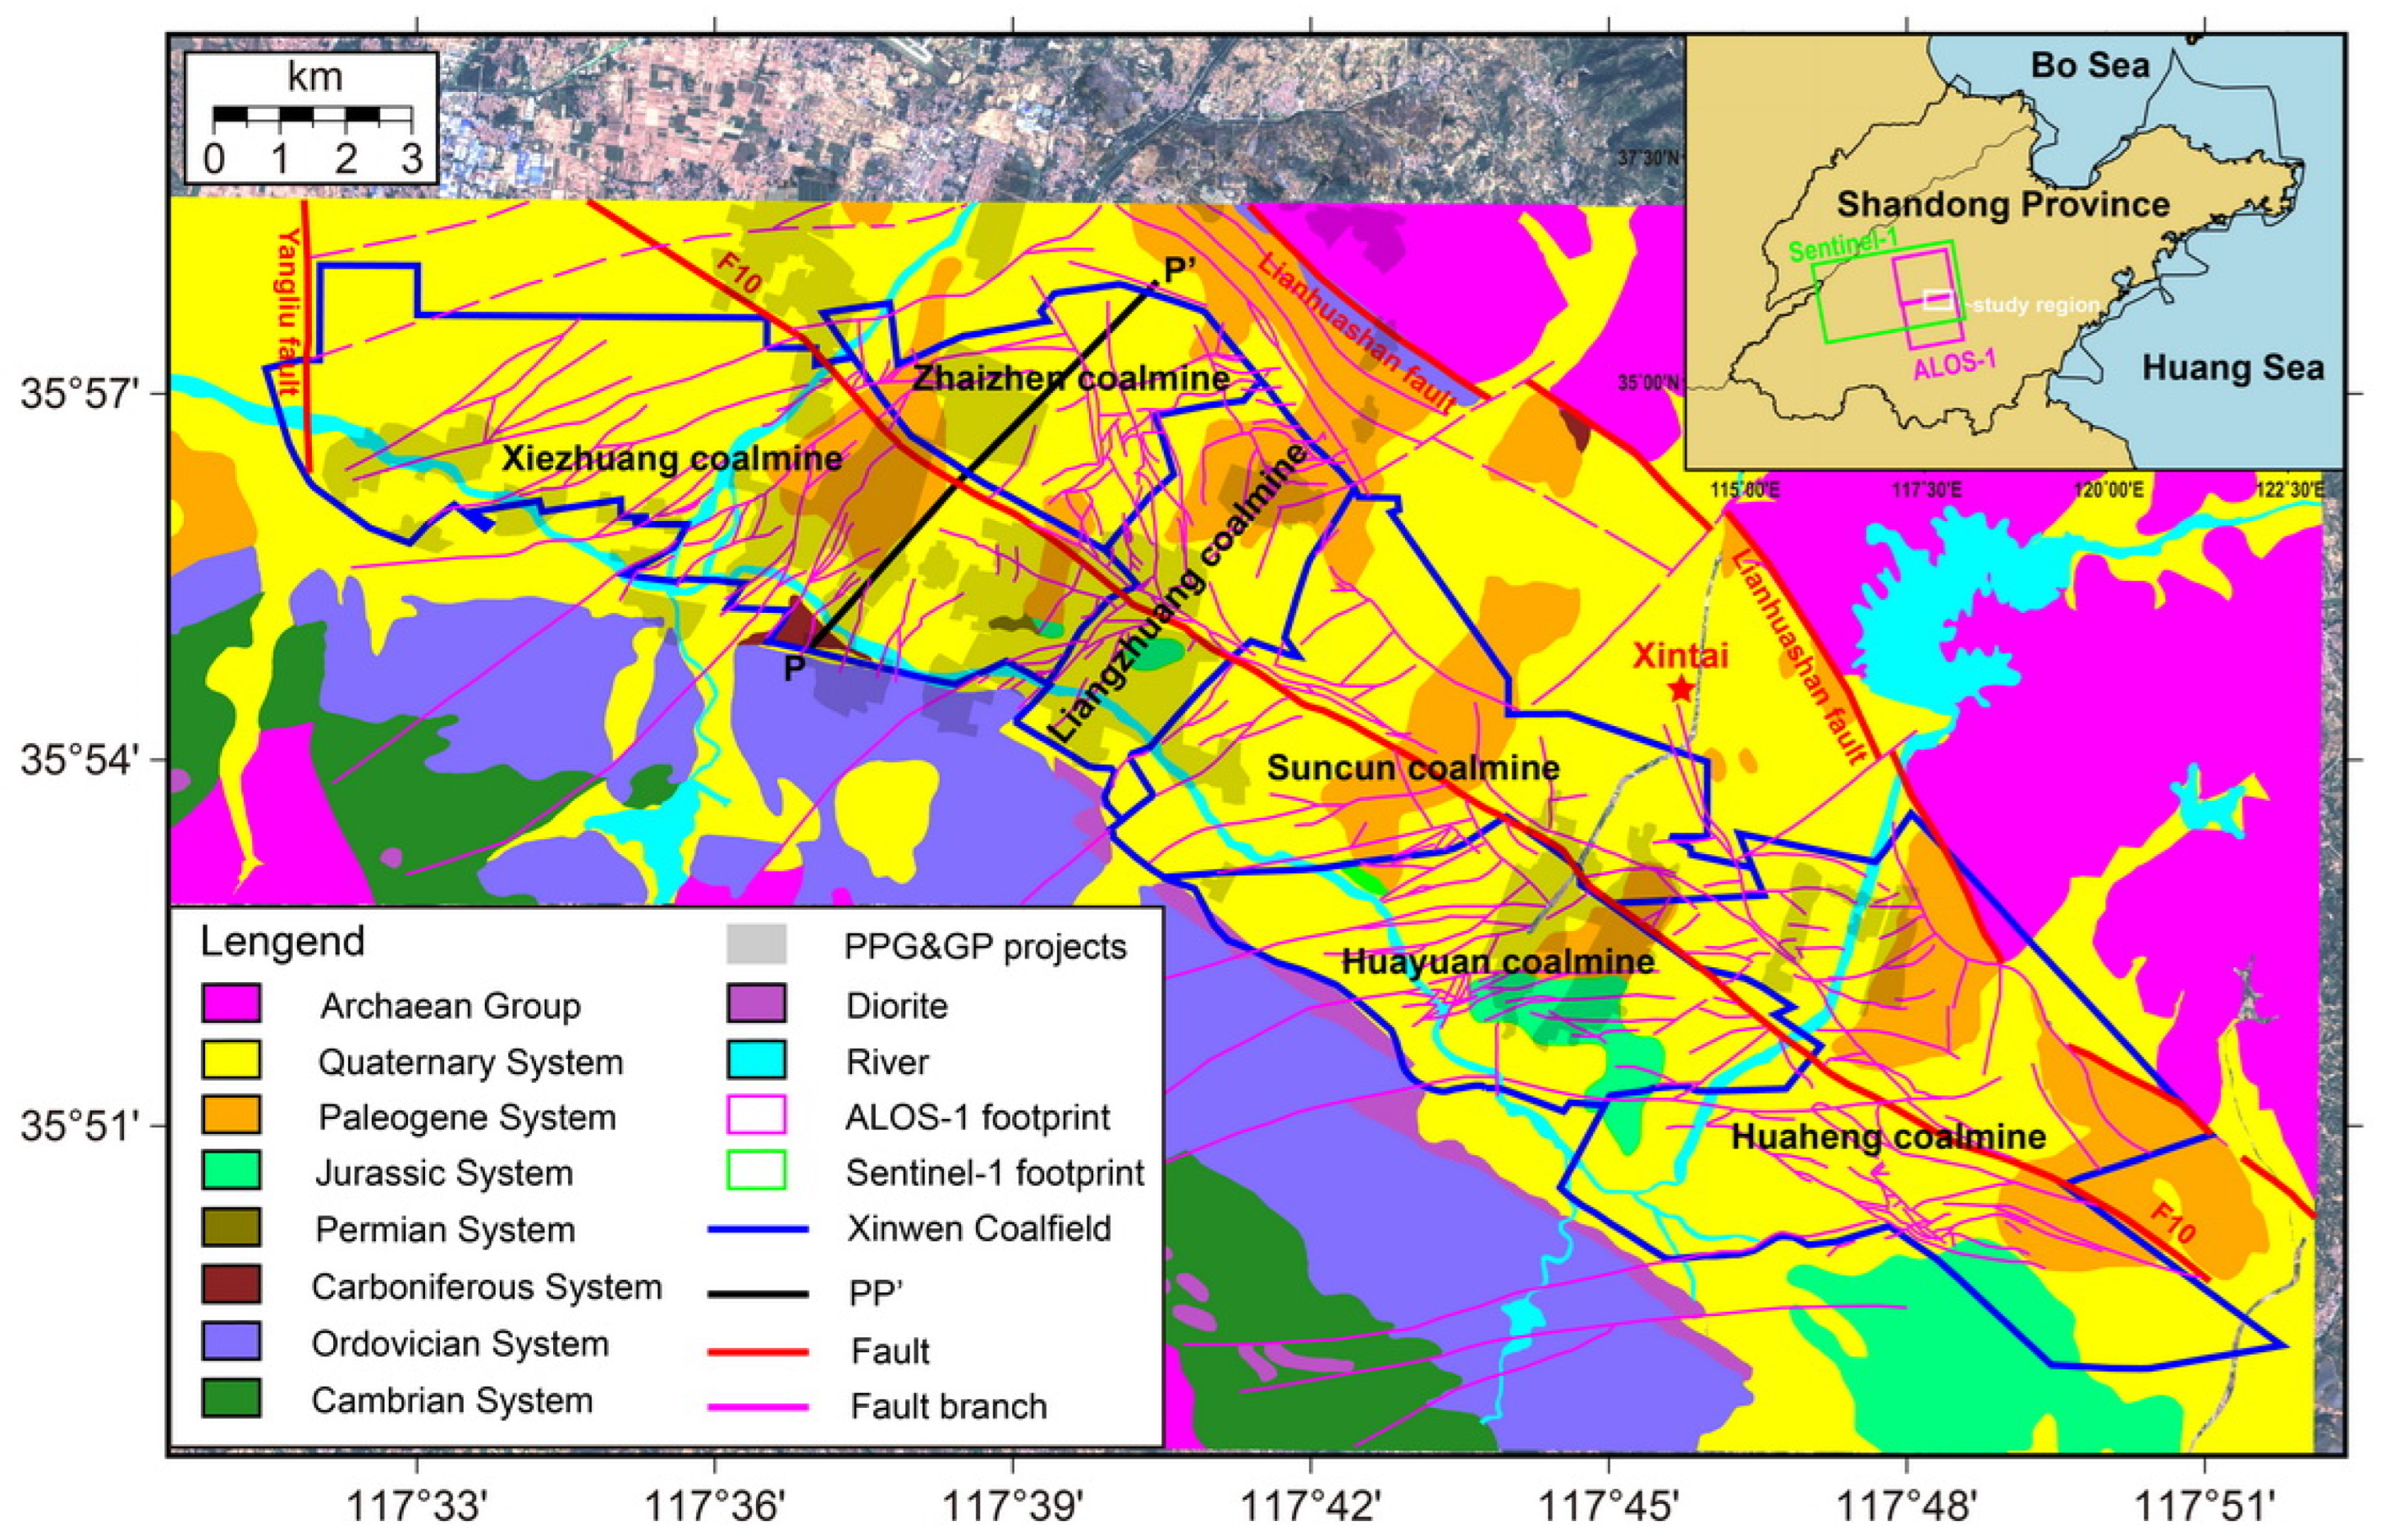
2.1.2. The Photovoltaic Power Generation and Greenhouse Planting (PPG&GP) Projects in Xintai City

As a classic coal-resource county occupying more than half of the coal mines in Tai’an, Xintai City has been plagued by some problems in recent decades, such as the exhaustion of coal resources and a poor ecological environment. Since 2011, Xintai City has been listed as a resource-exhausted city by the Chinese National Development and Reform Commission (https://www.ndrc.gov.cn/fzggw/jgsj/zxs/sjdt/201411/t20141106_1078955.html, accessed on 2 November 2023). The main constraints were generally divided into insufficient resource reserves, multiple mining levels, various upgrading and transportation links, long mine ventilation paths, increased maintenance workload of shafts and lanes, and increasingly complex mining conditions, seriously affecting the efficiency and long-term development of local enterprises. Thus, the emergent industrial structures, such as the PPG&GP projects, have gradually become one of the new economic development modes of Xintai City. The planning of the photovoltaic power generation demonstration base in the coal mining subsidence area of Xintai City was implemented in four phases from 2016 to 2020.
The PPG&GP projects in Xintai City were the first demonstration base of PPG in the agricultural and photovoltaic complementary modes for the coal mining subsidence region of China. Occupying a total area of 80 km2, the study region in Xintai City at present has constructed 30 agricultural and solar complementary photovoltaic base power stations in concentrated contiguous coal mining subsidence areas, with a total installation capacity of approximately 2000 MW (https://solar.in-en.com/html/solar-2271926.shtml, accessed on 1 December 2023). As displayed in Figure 1, the study region occupies a partial of PPG&GP projects with a distribution area of around 40.6 km2. By supplying clean energy and green agricultural products, the PPG&GP projects constructed in Xintai City will make a significant contribution to the local economic development and ecological protection after completion. From the perspective of environmental protection, the agricultural greenhouses of the PPG&GP projects adopt a novel irrigation technology integrating water and fertilizer. According to the requirements of local crops in different growing periods, this technology can provide water and nutrients in a timely, quantitative, and regular manner. To a certain extent, the PPG&GP projects provide a harmonious and sustainable economic development mode of simultaneously providing clean energy, increasing local farmers’ income, and protecting or even restoring the ecological environment of the traditional coal goaf. Before constructing the PPG&GP projects, extensive-type ecological farming (including economic plants, fishponds, etc.) and even simple land wastage were the main land-use patterns in these regions of the traditional coal goaf.

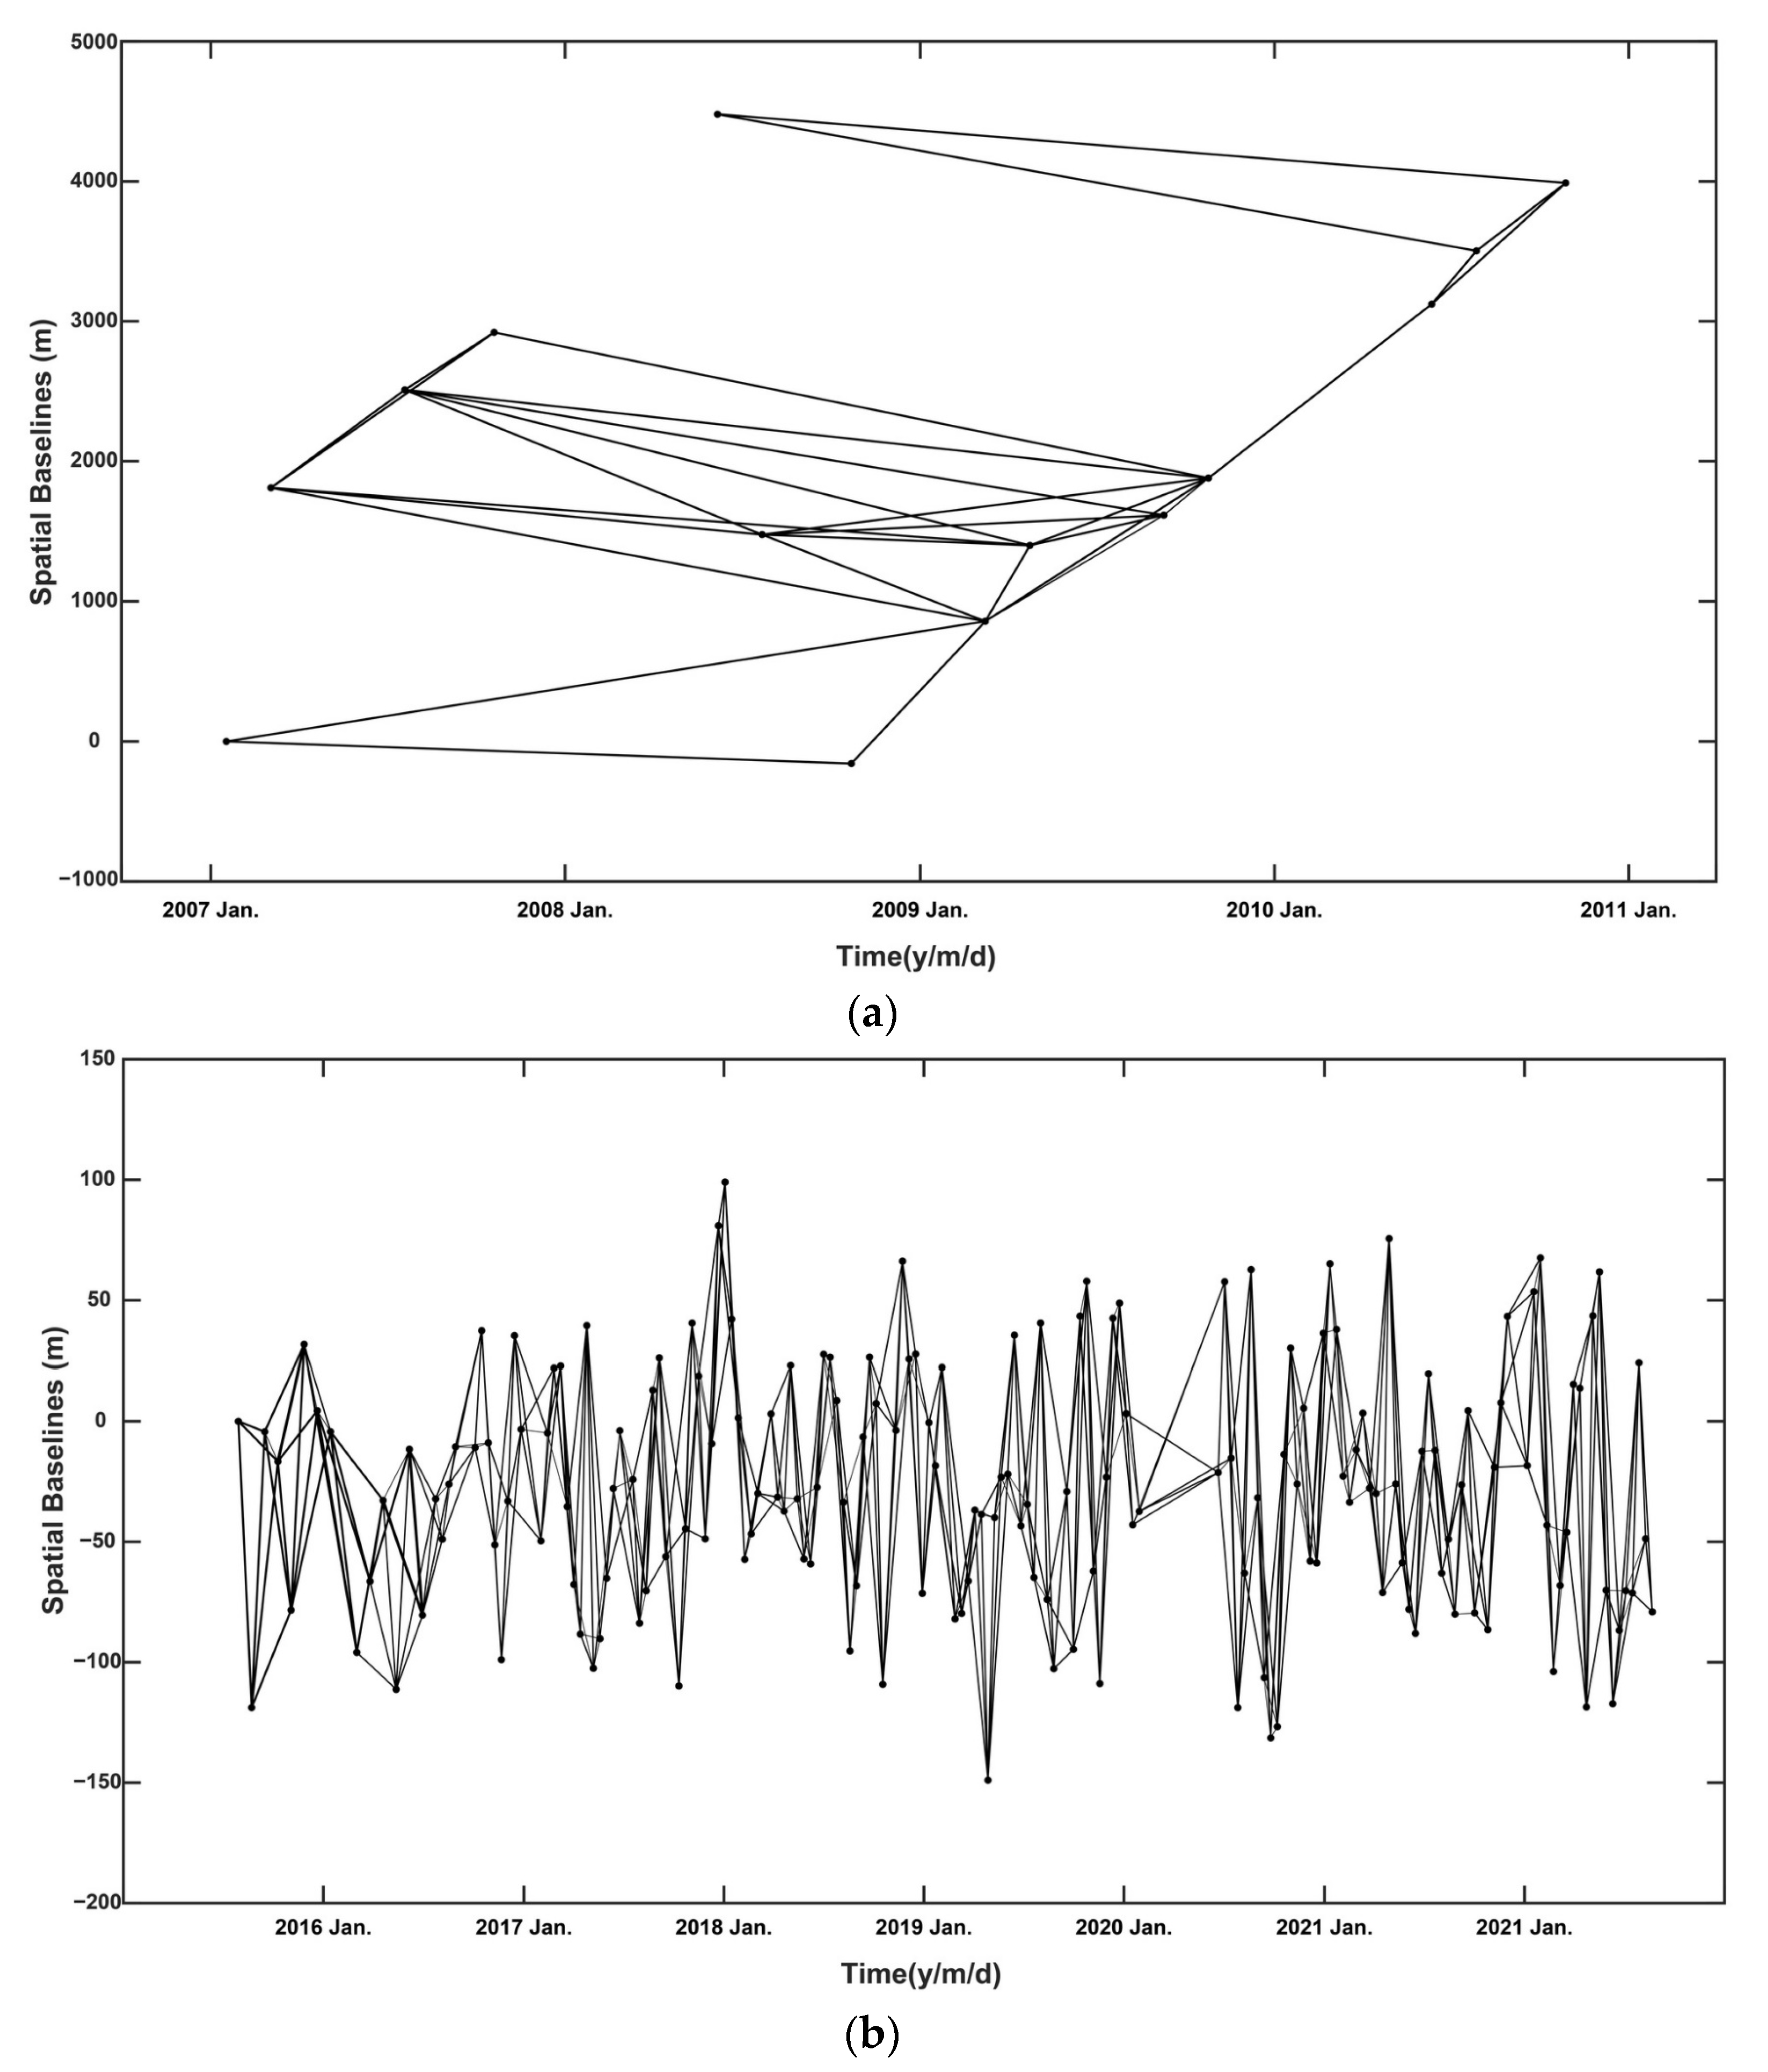
2.1.3. Remote Sensing Datasets

Two remote sensing datasets were utilized to detect ground deformation and evaluate the safety of the aforementioned PPG&GP projects in the coal-mining areas. Here, the Advanced Land Observing Satellite (ALOS) PALSAR dataset (Path: 447, Frame: 710 & 700) with 22 images in the L-band acquisition mode was utilized to retrieve the ground deformation history over an observation period from 17 January 2007 to 28 October 2010. Also, the Sentinel-1 C-band SAR datasets (Path: 142, Frame: 111, Ascending), including 352 images with a temporal coverage of around 8 years from 30 July 2015 to 22 August 2022, were collected here. The ALOS PALSAR/Sentinel-1 sensor information is listed in Table 1. To better visually identify the construction periods of the PPG&GP projects in Xintai City, the Sentinel-2 optical remote sensing datasets over the identical observation period from 30 July 2015 to 22 August 2022 were also collected in this study.

2.2. Methods

In this study, with the ALOS PALSAR and Sentinel-1 SAR observation datasets, SBAS-InSAR technique was utilized to invert the ground subsidence deformation velocity and time-series history of the whole study area over the period of 17 January 2007~28 October 2010 (ALOS PALSAR) and 30 July 2015~22 August 2022 (Sentinel-1). The specific processing sequence of SBAS-InSAR can be divided into the following two subsections: (1) derive the InSAR observations characterized by small spatio-temporal baseline (Section 2.2.1); (2) retrieve the least-squared solutions of interval deformation velocities by resolving these InSAR observations (Section 2.2.2). Combined with the ground deformation results derived from SBAS-InSAR and corresponding environmental factors (such as geological structure, precipitation, seismicity, etc.), the risk assessment on the PPG&GP projects in their construction and operation periods was finally performed (Section 2.2.3). These concepts and workflow of the methodology are depicted in the flow chart in Figure 2.

2.2.1. InSAR Observations

For a differential InSAR image pair generated by two SAR images acquired on t A and t B , the LOS change d o b s triggered by the ground deformation can be retrieved with the unwrapped phase δ φ o b s [15] as in Equation (1).
d o b s = δ φ o b s × λ 4 π = d L O S t B d L O S t A + B h r s i n θ + δ φ r e s i d u a l · λ 4 π
In which, d L O S t A and d L O S t B are the time-series deformation along the radial line-of-sight (LOS) direction at acquisition times t A and t B with respect to the starting time t 0 ( d L O S t 0 0 ), respectively. λ , r , θ , and B denote the radar wavelength, distance of sensor to target, radar incidence angle, and perpendicular baseline of two SAR acquisitions, respectively. h denotes the topographic error of the external DEM. δ φ r e s i d u a l is the residual phase caused by the orbital errors, the noise, and the atmospheric artifacts. Generally, coal-mining-triggered ground deformation is assumed to be characterized by a large magnitude and usually dominates the InSAR-derived LOS change. Thus, the last term of δ φ r e s i d u a l can be safely ignored in this study.

2.2.2. SBAS-InSAR Technique

If there are N + 1 SAR images of ALOS PALSAR or Sentinel-1 acquired at the time of t0, t1, t2, …, tN, respectively, as displayed in Figure 3, there will be M interferograms in the condition of small-baseline constraints, in which (N + 1)/2 ≤ M ≤ (N + 1)N/2.
Suppose each group of InSAR deformation measurements was δ d j ( j = 1 , , M ) , which can be calculated with Equation (1), then δ d j can be assumed to be the observation vector derived by multiplying the ground deformation velocities and corresponding temporal intervals, as displayed in Equation (2).
i = s j + 1 m j ( t i t i 1 ) v i = δ d j δ j   ( j = 1 ,   2 , , M )
where, for each pixel, t m j and t s j denote the acquisition time of the master (pre-event) ALOS PARSAR/Sentinel-1 SAR image and the slave (post-event) ALOS PALSAR/Sentinel-1 SAR image, respectively. Additionally, v i ( i = 1 , 2 , , N ) are the mean deformation velocity between adjacent ALOS PALSAR/Sentinel-1 images. The noise in the calculated InSAR observation can be denoted by δ j and corrected. Equation (2) can be simplified as follows:
B M × M V M × 1 = d M × 1 M × 1
The element located at j , i ( s j + 1 i m j , j = 1,2 , , M ) of matrix B is ( t i t i 1 ) and the other elements are zero. Suppose the number of independent SBASs is L , then the rank of B is ( M L + 1 ) . If L = 1 , the best-fit solutions for the rate vector V can be acquired through the least-square inversion, as displayed in Equation (4). However, when B is a rank-deficient matrix in the condition of L > 1 , a Singular Value Decomposition (SVD) method can be used to obtain the least-squared solutions [5]. As shown in Equation (5), U is an orthogonal matrix consisting of the eigenvector of B B T ; Q is an orthogonal matrix consisting of the eigenvector of B T B ; and S + is an diagonal matrix with the diagonal entries as 1 σ 1 , 1 σ N L + 1 , 0 , , 0 .
V M × 1 = [ B M × M T B M × M ] 1 · B M × M T · ( d M × 1 M × 1 )
B M × M = U M × N S N × N + Q N × M T
D t i = 0 ,       ( i = 0 ) k = 1 i ( t k t k 1 ) v k     ( i = 1 ,   2 , , N )  
After retrieving the deformation velocity vector, the cumulative deformation time series D at the epoch of t i can finally be acquired through Equation (6).

2.2.3. Deformation Triggering Factors and Risk Assessment

In this study, using the SBAS-InSAR time-series deformation measurements, the analysis of the causes of the ground deformation in the coal-mining areas was finally performed by combining the potential triggering factors, such as the precipitation, the geological structures or the lithologic strength, the nearby seismic activities, the coal-mining activities, and the construction of ground PPG&GP projects. Additionally, an index of risk assessment (IRA) for each pixel on these PPG&GP projects constructed upon the coal-mining region was proposed by combining the average displacement velocity v ¯ , the cumulative deformation magnitude D, the mask file of ground deformation region M d e f , and the mask file of the PPG&GP projects M P P G & G P , as displayed in Equations (7)–(9). As for the construction basis, Equations (7) and (8) play a role in constricting the risk assessment only performed on the areas in the PPG&GP regions. In Equation (9), the cumulative deformation D demonstrates the spatiotemporal characteristics of the ground deformation, and the average deformation velocity v ¯ denotes the future deformation tendency. By multiplying the cumulative deformation and the average deformation velocity, Equations (7)–(9) can better reflect the risks of the PPG&GP projects.
M d e f = 0 ,       ( s t a b l e   r e g i o n ) 1 ,       ( d e f o r m a t i o n   r e g i o n )
M P P G & G P = 0 ,       ( o t h e r   r e g i o n ) 1 ,       ( P P G & G P   r e g i o n )
I R A = D v ¯ M d e f M P P G & G P
Firstly, the mask file M d e f of the dominant ground deformation regions in this study area was identified and extracted following a conventional 3-sigma filtering strategy [16], with the mathematical formula shown in Equation (7). Then, the boundary of the PPG&GP projects in Xintai City was derived, as shown in Figure 1, and formulated into Equation (8). Subsequently, the average displacement velocity v ¯ and the cumulative deformation magnitude D were calculated following the SBAS-InSAR processing sequence, as shown in Equations (4)–(6). Afterwards, the index of IRA can be derived through Equation (9). To better identify the ground subsidence risks of different PPG&GP regions, the Jenks Natural Break classification method [17] was finally utilized to divide the IRA values into three risk levels: Low, Medium, and High. Finally, the risk assessment map derived from the IRA values can be used to singularly evaluate the perniciousness of the PPG&GP projects in Xintai City.

3. Results

The ground subsidence regions of Tai’an Prefecture-level City were mainly distributed in Xintai City, Feicheng City, and Ningyang County, which are all traditional coal-mining regions. The economic development structure of Feicheng City and Ningyang County was mainly constructed by the traditional industry and agricultural cultivation. Also, most ground subsidence regions in Feicheng City and Ningyang County were generally covered by the traditional industrial forms without enough reformation on economic structure. Comparatively, Xintai City has been listed as the reform pilot zone of those coal-mining cities for a long time. As the most serious ground subsidence regions of Tai’an Prefecture-level City, the ground deformation velocities and time series of the study area in Xintai City were derived from two SAR datasets. Specifically, the ALOS PALSAR and the Sentinel-1 derived ground deformation velocity of the study region were demonstrated in Figure 4 and Figure 5, respectively. Based on these derived deformation results, the spatio-temporal deformation patterns were further analyzed here in order to assist in the risk management of the PPG&GP projects in Xintai City.
As displayed in Figure 4 and Figure 5, the PPG&GP region, with an area of around 40.70 km2, was mainly distributed in Zhaizhen Town, Xizhangzhuang Town, Quangou Town, Qingyun Street, Xinwen Street, Dongdu Town, and Guodu Town. It is worth noting that the ground of the PPG&GP projects constructed in Dongdu Town, Quangou Town, and Wennan Town maintain a subtle magnitude of ground deformation, in other words, a relatively stable geological structure for these regions. This region belongs to the traditional coal mining subsidence area. This study intends to investigate the impacts of the transformation of local industrial structures on the geological deformation in the coal-mining region. As shown in Figure 4 and Figure 5, the maximum ground subsidence deformation reached more than 100 mm/yr.

4. Discussion

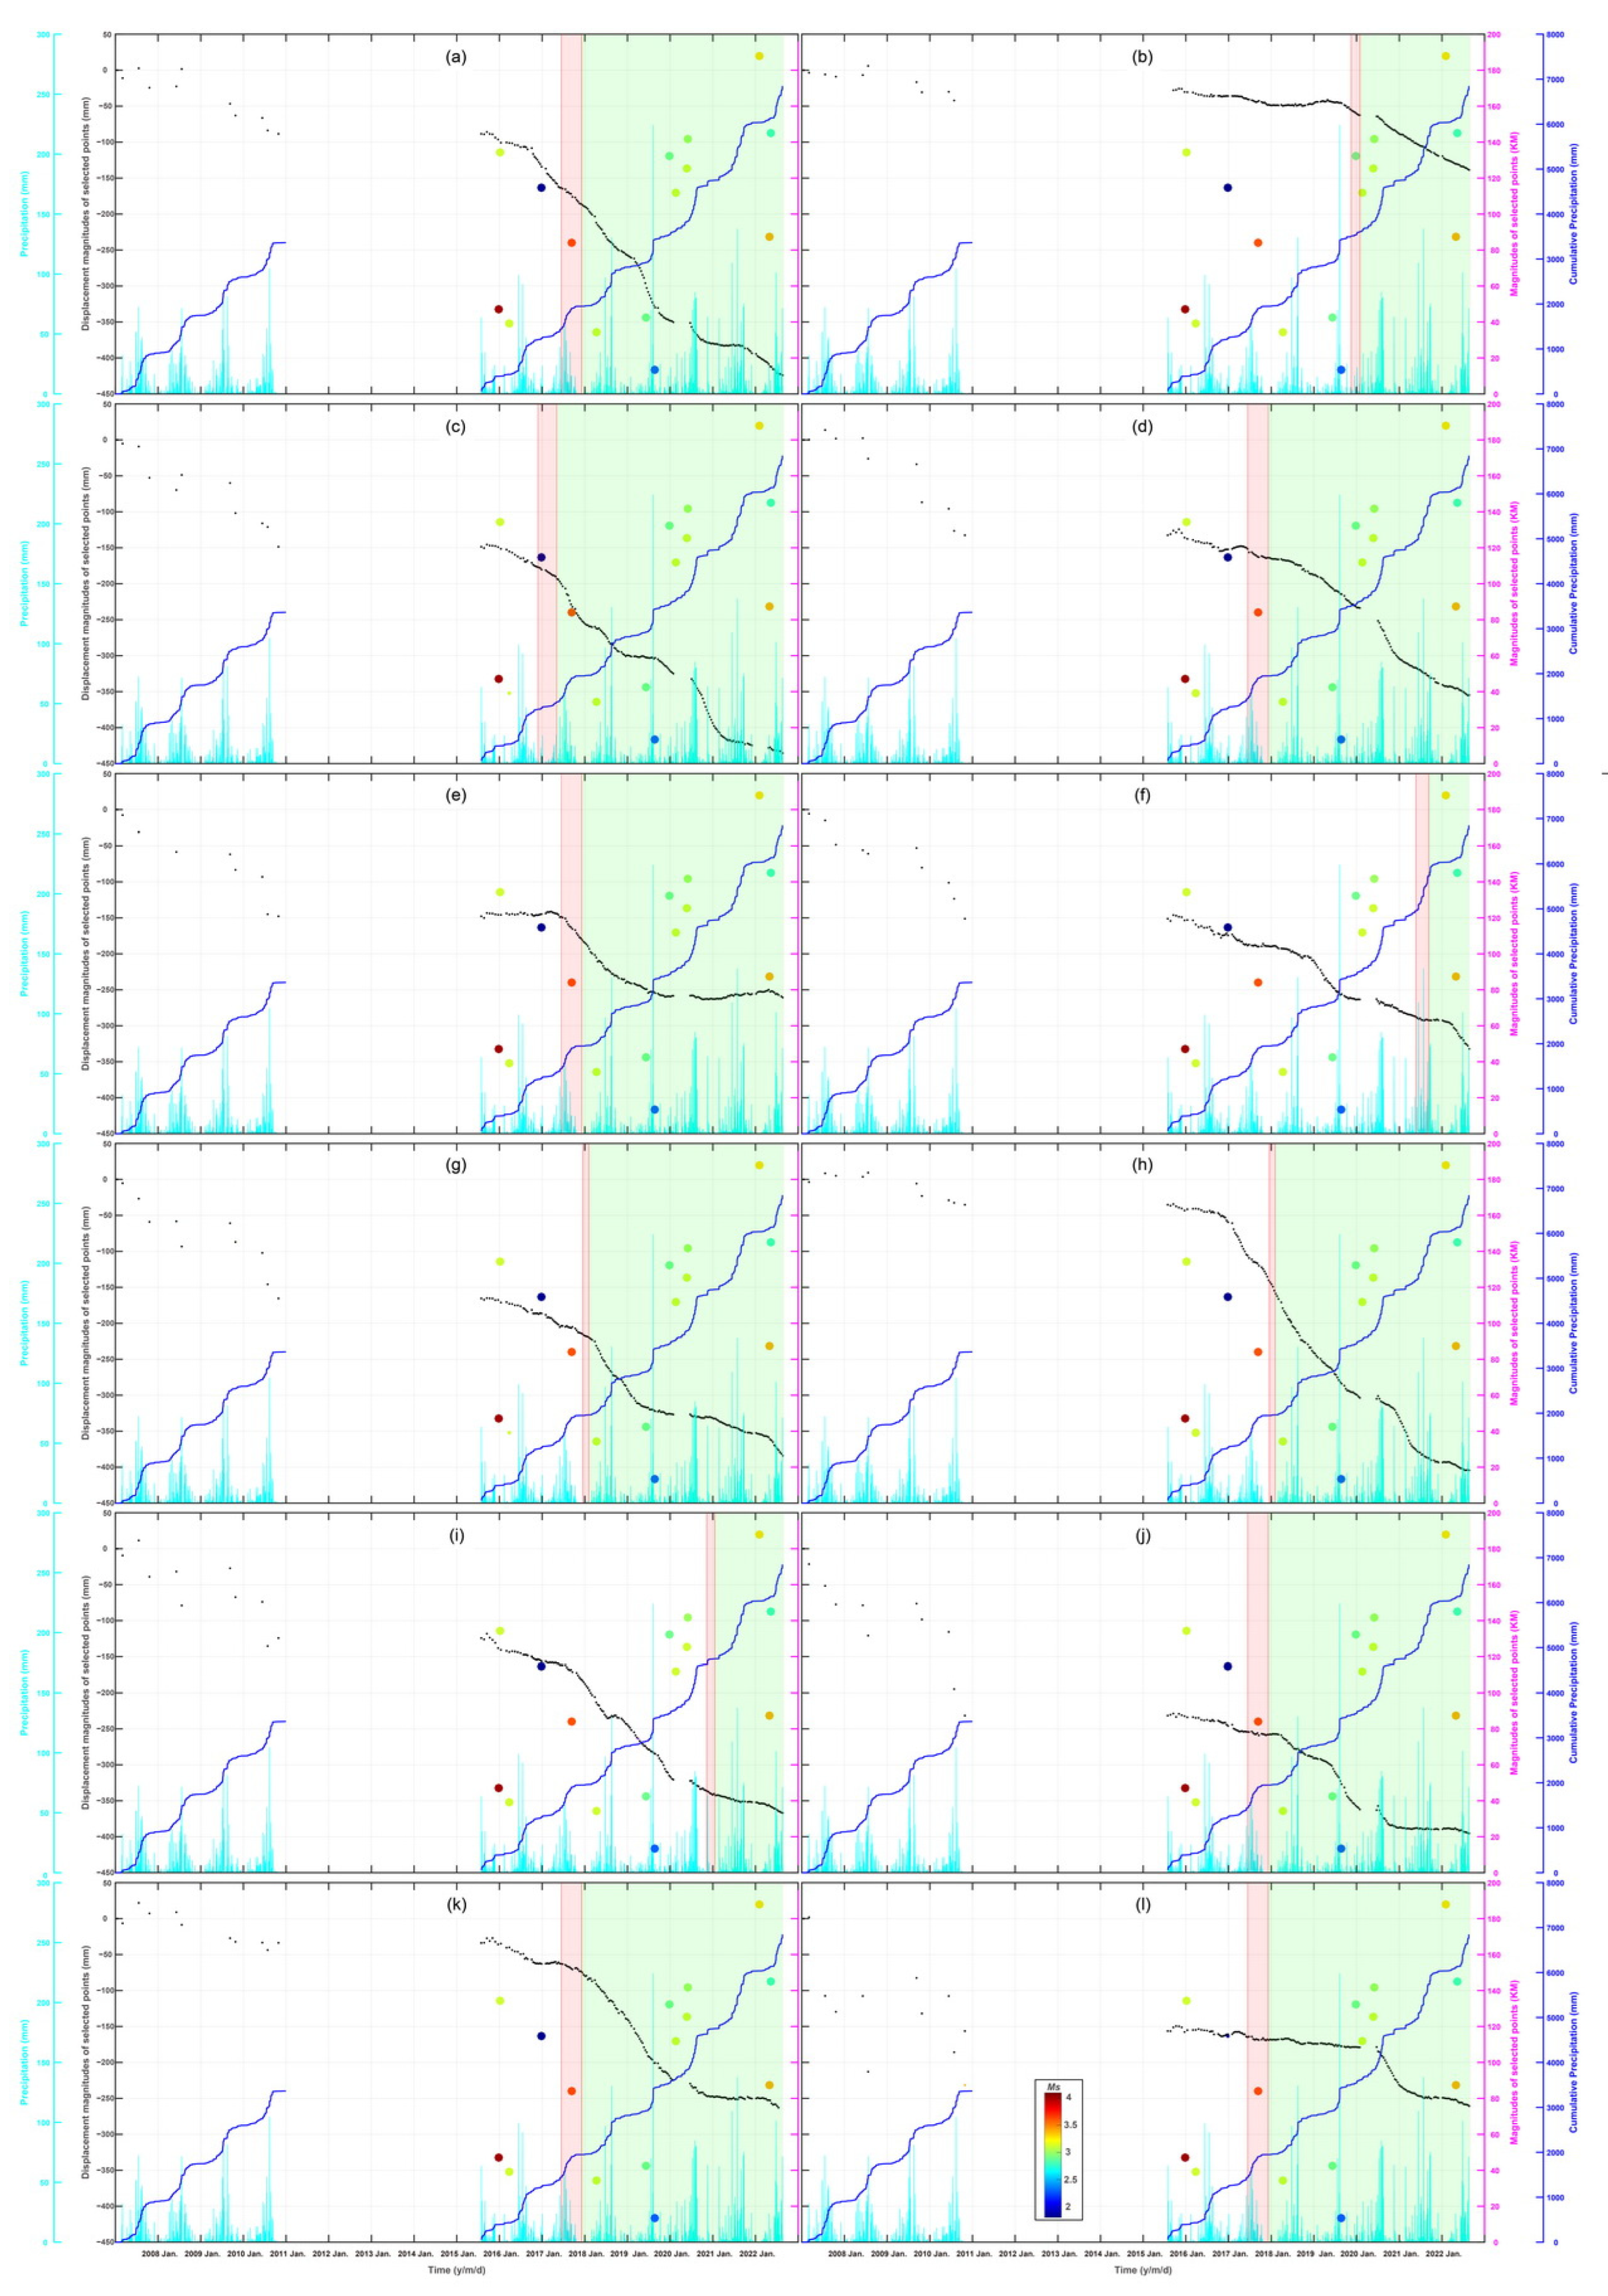
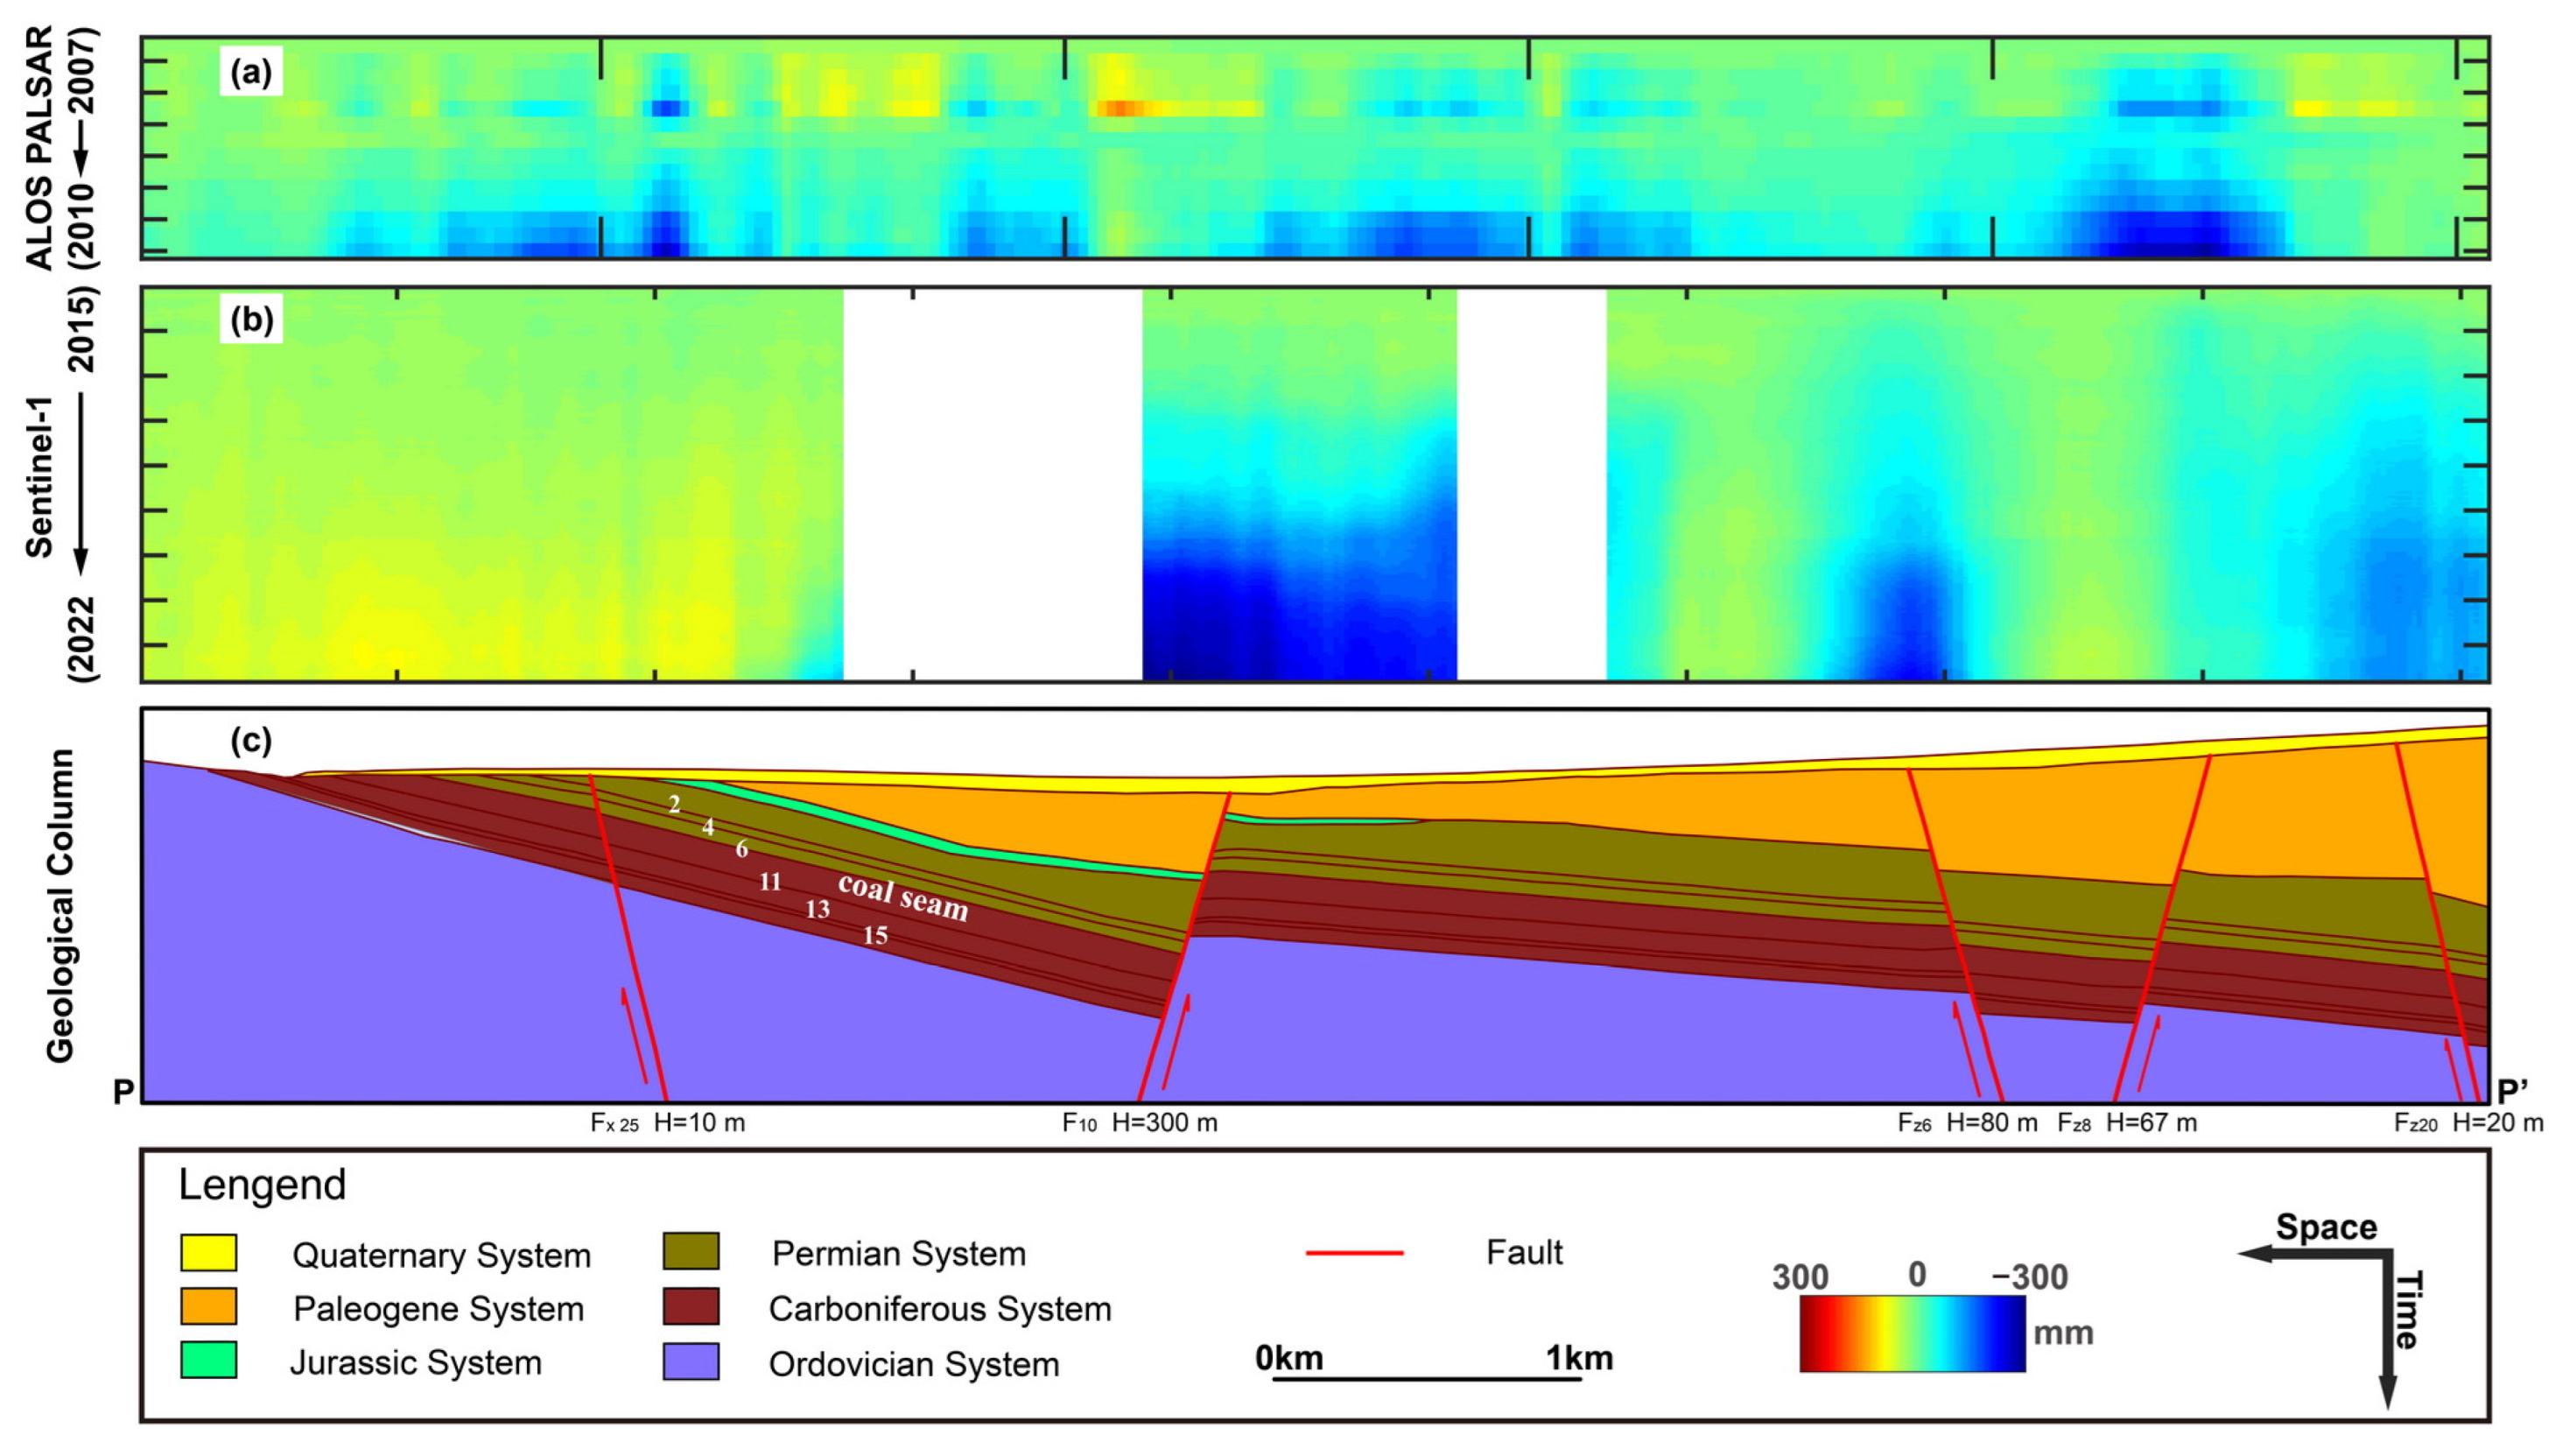
4.1. Spatially Dynamic Characteristics of Ground Deformation

As displayed in Figure 4 and Figure 5, the deformation regions were constructed by lots of contiguous ground subsidence funnels, characterized by maximal deformation magnitudes generally located in the center of each ground subsidence funnel. As presented in Figure 6, to further compare the differences in the deformation velocities of two different sensors, the active ground deformation regions detected by the ALOS PALSAR and Sentinel-1 SAR observations were extracted with a 3-sigma filter [17], respectively. With a distribution area of approximately 114.86 km2, the ground deformation regions detected over the ALOS PALSAR observation period of 17 January 2007~28 October 2010 were larger than the ones of approximately 40.326 km2 over the Sentinel-1 observation period of 30 July 2015~22 August 2022. The area of ground deformation region decreased by approximately 64.89%. However, considering these deformation regions over the observation periods of different sensors, the average magnitudes of around −18.05 ± 10.95 mm/yr for ALOS PALSAR were slightly smaller than that of around −19.47 ± 11.53 mm/yr for Sentinel-1.
As displayed in Figure 6a, for the deformation region detected by ALOS PALSAR over the period of 17 January 2007~28 October 2010, the ground deformation regions in Xintai City were mainly distributed in Zhaizhen Town (40.2%, −22.02 ± 11.65 mm/yr, 46.13 km2), Xizhangzhuang Town (17.4%, −19.33 ± 12.70 mm/yr, 19.94 km2), Qingyun Street (12.0%, −15.86 ± 8.24 mm/yr, 13.81 km2), Wennan Town (16.2%, −14.07 ± 7.45 mm/yr, 18.65 km2), Quangou Town (8.1%, −13.69 ± 5.97 mm/yr, 9.29 km2), Xinwen Street (3.0%, −10.25 ± 3.81 mm/yr, 3.40 km2), Dongdu Town (1.5%, −6.17 ± 4.23 mm/yr, 1.77 km2), Guli Town (1.1%, −8.87 ± 3.53 mm/yr, 1.25 km2), and Yangliu Town (0.5%, −10.77 ± 4.65 mm/yr, 0.59 km2). As displayed in Figure 6b, for the deformation region detected by Sentinel-1 over the recent period of 30 July 2015~22 August 2022, the ground deformation regions in Xintai were mainly distributed in Zhaizhen Town (39.8%, −20.58 ± 11.39 mm/yr, 16.06 km2), Xizhangzhuang Town (16.6%, −22.24 ± 12.38 mm/yr, 6.67 km2), Qingyun Street (16.0%, −21.06 ± 14.35 mm/yr, 6.46 km2), Wennan Town (10.0%, −12.55 ± 3.95 mm/yr, 4.02 km2), Quangou Town (8.9%, −16.82 ± 8.67 mm/yr, 3.60 km2), Xinwen Street (6.9%, −18.76 ± 8.62 mm/yr, 2.78 km2), and Yangliu Town (1.5%, −9.63 ± 1.21 mm/yr, 0.61 km2).
A total of 26.3% (−21.61 ± 12.10 mm/yr, 10.70 km2) of the area of these PPG&GP projects (40.70 km2) was constructed in ground subsidence regions. Specifically, the ground deformation regions detected within the PPG&GP projects were mainly distributed in Zhaizhen Town (75.8%, −21.81 ± 11.62 mm/yr, 8.11 km2), Xizhangzhuang Town (13.1%, −23.18 ± 14.25 mm/yr, 1.40 km2), Qingyun Street (8.5%, −19.13 ± 13.09 mm/yr, 0.91 km2), Quangou Town (1.6%, −18.04 ± 8.82 mm/yr, 0.17 km2), and Xinwen Street (1.0%, −14.93 ± 3.45 mm/yr, 0.11 km2). These identified ground deformation regions within the PPG&GP will be used to retrieve the IRA and then perform the risk assessment for the PPG&GP projects in Section 4.4.

4.2. Temporally Dynamic Characteristics of Ground Deformation

To better analyze the ground subsidence risks of the PPG&GP projects, as displayed in Figure 7, 12 observation points of A~L within the PPG&GP projects were conjointly selected to further demonstrate the temporal evolution characteristics of ground deformation. By analyzing the middle-resolution Sentinel-2 images, we found that the land coverage changes frequently over the observation period from 30 July 2015 to 22 August 2022, partly triggered by the construction of local PPG&GP projects. Specifically, during the period from 2015 to 2017, the land coverage was mainly constructed in large-area arable land with combinable crops (such as wheat and corn) and small-area residential quarters with low-tiled houses, meaning a negligible gravity load upon the ground surface. However, after 2017, the corresponding ground regions were covered by block-shaped PPG modules in the optical images. Thus, through visually interpreting these disparities in the time-series Sentinel-2 optical Red/Green/Blue composite images, the engineering details of corresponding PPG&GP projects for these observation points were also derived in Table 2, including the construction period and the specific geographical range. These engineering details can be used to divide the ground deformation of each observation point into three different periods (see Figure 7): (1) the insusceptible deformation period without PPG&GP (void color regions); (2) the susceptible deformation period with the constructing PPG&GP (light red color regions); (3) the susceptible deformation period with the daily operating PPG&GP (light green color regions).
In Figure 7, the deformation time series for 12 observation points (A~L) were plotted for three different periods. Overall, according to these ALOS PALSAR observations from 17 January 2007 to 28 October 2010 and the Sentinel-1 observations from 30 July 2015 to 22 August 2022, the cumulative ground deformation time series of the observation points demonstrates a dominant subsidence tendency with subtle seasonal fluctuations. Also, the ground deformation time series of most observation points showed different temporal evolution patterns with alternant occurrences of the stationary stage and the deformation stage.
Specifically, in the first insusceptible deformation period without PPG&GP, most observation points presented as linear deformation patterns with less seasonal fluctuations, such as the observation points of B–D, G, J, and K. The points of E, F, and L gradually entered into a relatively stable stage with the deformation gradients at nearly zero. However, points A and H entered into the acceleration stage with increased deformation gradients in the late stage of this period. Moreover, the deformation pattern of another point, I, was more complex than the others, combined with a prior linear stage, an intermediate acceleration stage, and a later decelerating phase.
Comparatively, in the second susceptible deformation period with the constructing PPG&GP, most observation points maintained the deformation patterns of the first insusceptible deformation period, such as the points of A, C, D, G, H, I, and L. In which, the points of A, C, G, H, and I still maintained the linear deformation patterns, the points of D and L still maintained the stable deformation patterns with negligible changes in deformation gradients, and several observation points, B, E, and K, abruptly entered into the accelerated deformation stages from the prior stationary stage in the first insusceptible deformation period. Furthermore, the gradual increase in the deformation gradient of K can be easily identified from the stable deformation pattern. Notably, different from the deformation patterns of most points, F and J, on the contrary, directly entered into the stable stage with a negligible deformation gradient from the prior linear deformation patterns.
As for the third susceptible deformation period with the operating PPG&GP, the ground deformation magnitude of more than half of the observation points, such as A, C, D, F, G, H, J, and K, displayed a dominant pattern of abrupt acceleration after the installation of these new agricultural development forms. In detail, the observation points of D and K both possess similar deformation patterns with the prior acceleration phase, the later deceleration phase, and the final stability phase. Moreover, the observation points of A, C, F, G, H, and J were all characterized by the deformation patterns combined with the alternation of several acceleration–deceleration phases. In the late stage of the third deformation period with the operating PPG&GP, observation points C, H, and J gradually entered into the stable stages with negligible deformation gradients, with respect to observation points A, F, and G entering into the linear deformation stages. Comparatively, observation points E, I, and L all enter a stable phase with negligible deformation gradients in the late stage of the third susceptible deformation period with the operating PPG&GP. Before reaching the stabilization phase, points E and I both went through a deceleration process, and L went through an alternation of acceleration and deceleration processes. Different from any other points, B maintained a linear deformation pattern throughout the susceptible deformation period with the operating PPG&GP. Also, by comparing two different observation datasets, A, H, and K showed a clear change in the slope of the curves before the construction of PPG&GP (2007–2010) and the period of their construction and operation (2015–2022).
As mentioned above, during the construction and operation of the ground PPG&GP projects, all the observation points show a tendency for deformation. However, the dominant impact of the PPG&GP projects on the ground deformation may be validated by the deformation patterns of points B, E, and K. Even though the ground deformation patterns of different observation points were different, most points finally entered into the stable phase with negligible deformation gradients, such as C, D, E, K, H, I, J, and L. Comparatively, the four observation points, A, B, F, and G, maintained linear deformation in the late stage of the observation period. These analyses and discussions can be helpful for evaluating the environmental influences and the operating risks of the PPG&GP projects in Xintai City.

4.3. Implicit Triggering Factors and Internal Mechanism of Ground Deformation

As displayed in Figure 8a–c, the ground deformation measured by both ALOS PALSAR and Sentinel-1 SAR observations was mainly concentrated in the nearby local geological tectonic faults. The geological column below the ground deformation regions along the Profile of PP’ were mainly constructed by the Quaternary System, the Paleogene System, the Jurassic System, the Permian System, and the Ordovician System. In Xinwen Coalfield, as shown in Figure 8c, the coal-mining processes were mainly performed in the coal seams of the Permian System and the Carboniferous System.
The coal seams mainly occurred along the tectonic faults that affect the regional mineralization and the development of mineral resources [10,18]. Due to the hydrogeological effects of the fault geometry [19], the local tectonic faults may pose a limitation on the groundwater inflow. Along with the deepening of the coal-mining depth, the underground water seepage along the tectonic faults in the Ordovician System [20,21,22] was assumed to be a dominant triggering factor posing serious threats to the coal-mining activities. In other words, corresponding ground deformation may also be impacted by the variations of the karst water runoff in underground Ordovician limestone aquifers, which is mainly supplied by ground precipitation recharge. Notably, the deep coal mining in the Ordovician System is easily destroyed by pore karst water [22,23], which may be a key trigger of the larger ground deformation. Furthermore, there are no dominant deformation patterns related to the movements of local tectonic faults. The reason for the large ground subsidence in these areas is mainly considered to be the dominant stratigraphic lithology of Quaternary loose sediment-loess, characterized by loose geological structure and well-developed soil pores. When a wet load (such as rainfall and underground water) is applied, the loess is deformed by wetting collapse due to the decrease in hydraulic consolidation volume, which leads to excessive ground deformation and instability of the ground foundation [24,25].
As the deformation time series curves show in Figure 7, the construction process of the PPG&GP projects may pose negligible threats to the ground subsidence, such as the points D, F, G, I, J, and L. Comparatively, the construction process of observation points A, B, C, E, H, K were located within the ground subsidence period. Especially for point E, the construction process of the PPG&GP projects conjointly triggered drastic ground subsidence deformation. Moreover, stronger ground deformation occurred in the operating period, such as the observation points A, C, G, and J. During the operating period of the PPG&GP projects, strong precipitation may trigger instantaneous ground deformation, such as at A, C, J, and L. The average annual rainfall over the Sentinel-1 observation period of 30 July 2015~22 August 2022 (968.22 mm/yr) was larger than that over the ALOS PALSAR observation period of 17 January 2007~28 October 2010 (840.93 mm/yr). Furthermore, as mentioned in Section 4.1, the magnitudes of deformation velocity detected by Sentinel-1 were larger than that detected by ALOS PALSAR. However, compared to the ground deformation time series of Sentinel-1, the ALOS PALSAR-derived ground deformation time series over the period of 17 January 2007~28 October 2010 had a weak correlation with daily precipitation. These disparities can be illuminated as the ground rock stratum over the period of 30 July 2015~22 August 2022 was more easily affected by the pore karstic water with rainfall recharge of the Ordovician System located at a deeper coal-mining depth, with respect to that over the period of 17 January 2007~28 October 2010.
Also, local seismicity events may trigger instantaneous ground deformation. According to the records of historical seismicity events near the study area (within 200 km) of the China Earthquake Networks Center (CENC), as displayed in Table 3, there are lots of seismicity events with minor magnitudes occurring near the study area. As shown in Figure 7, the deformation time series of point I over the period of 26 August 2019~29 January 2020 was dominantly impacted by the local ground collapse event with the magnitude of Ms 2.3 in a ground depth of around 8 km on 23 August 2019 within the Xinwen Coalfield. Furthermore, the historical mining-induced seismicity activities commonly occurred in the study area of Xinwen Coalfield [26], which may be another triggering factor accelerating the ground subsidence deformation. Also, as displayed in Table 3, it is worth noting that the coal-mining collapse events commonly occurred near the study region.
As discussed in Section 4.2, most observation points within the PPG&GP projects enter into a stationary phase in the late stage of the observation periods. Compared to the traditional agricultural mode, the emergent PPG&GP projects are thus assumed to play a positive role in improving the local ecological environments of the traditional coal-mining areas. Compared to the traditional broad agricultural irrigation mode, the novel drip irrigation technology embedded in PPG&GP projects may be an impact factor; however, this requires further validation in future works.

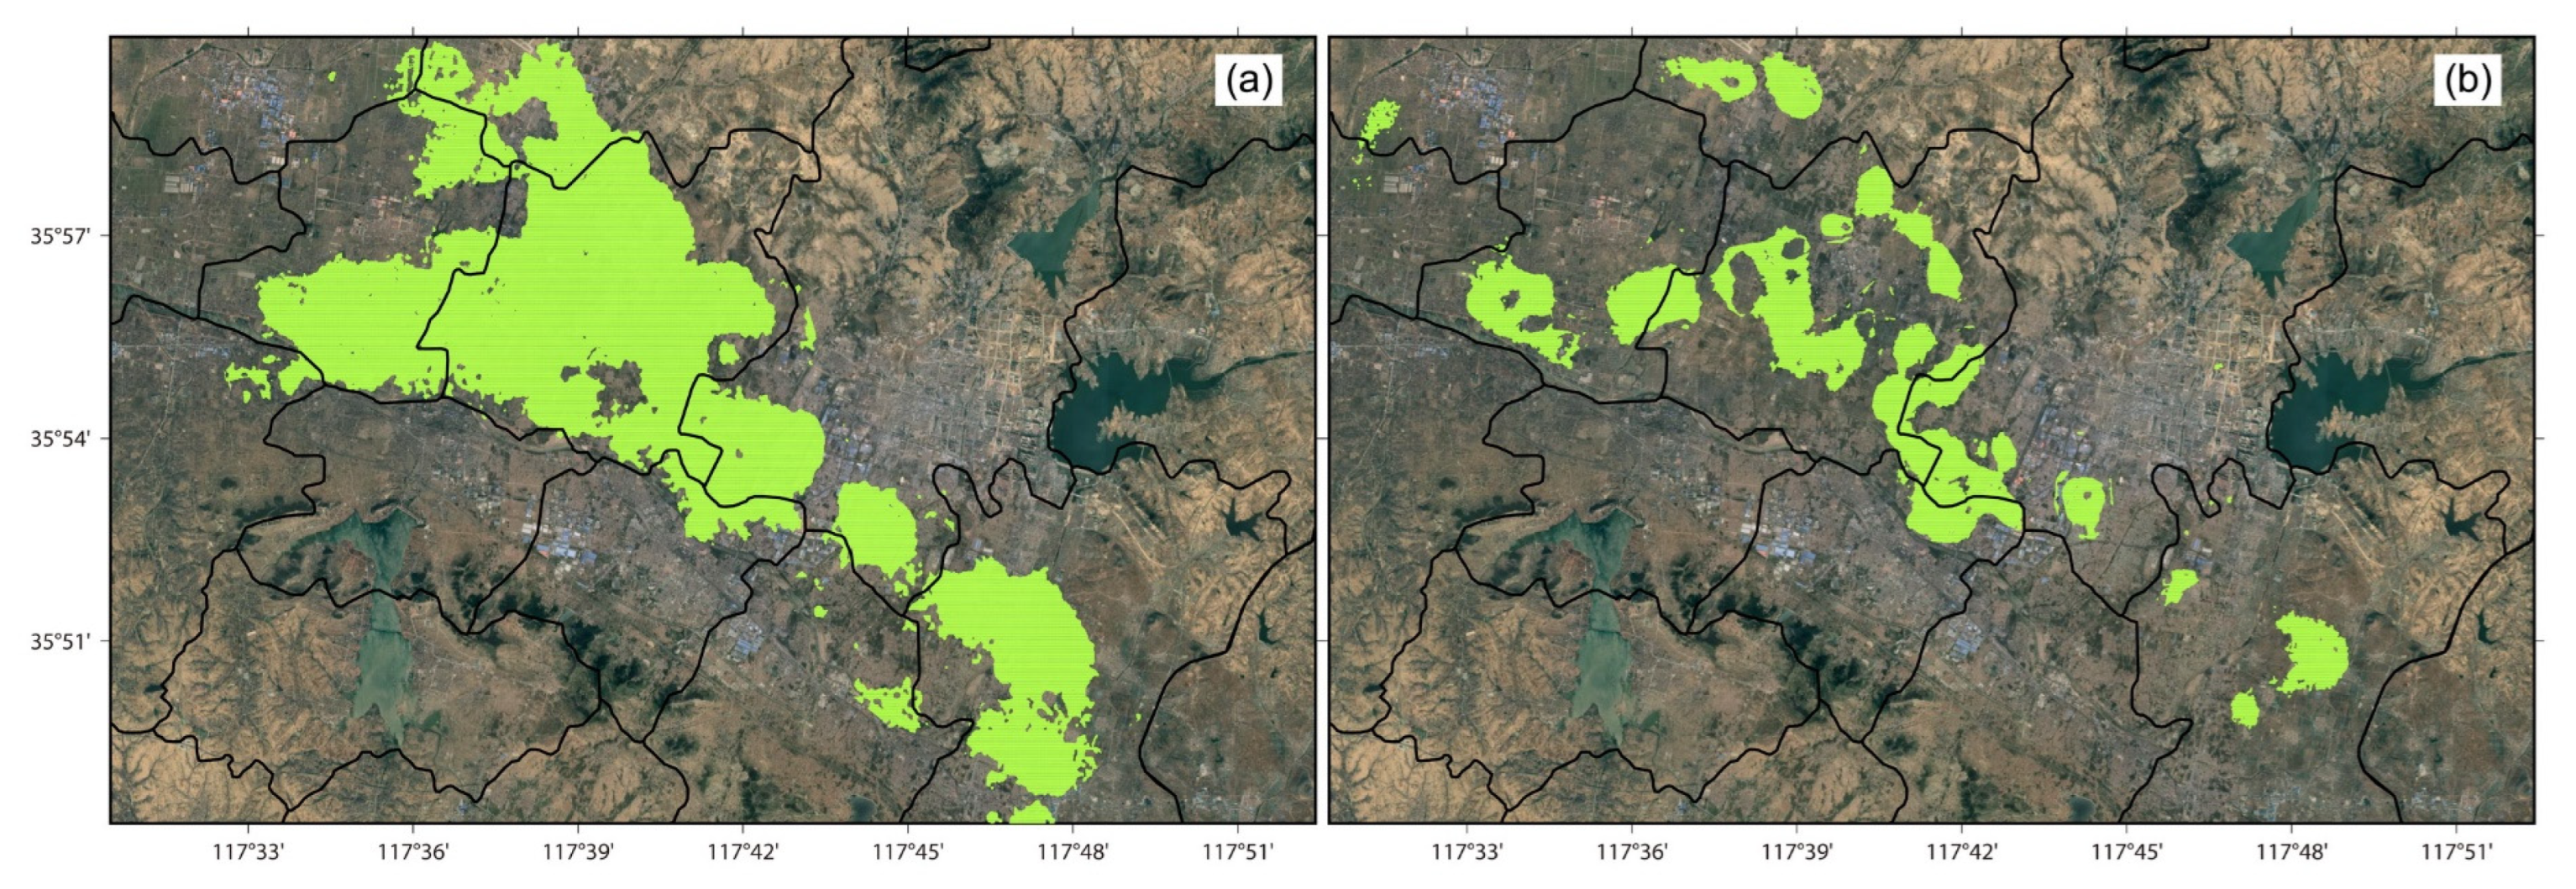
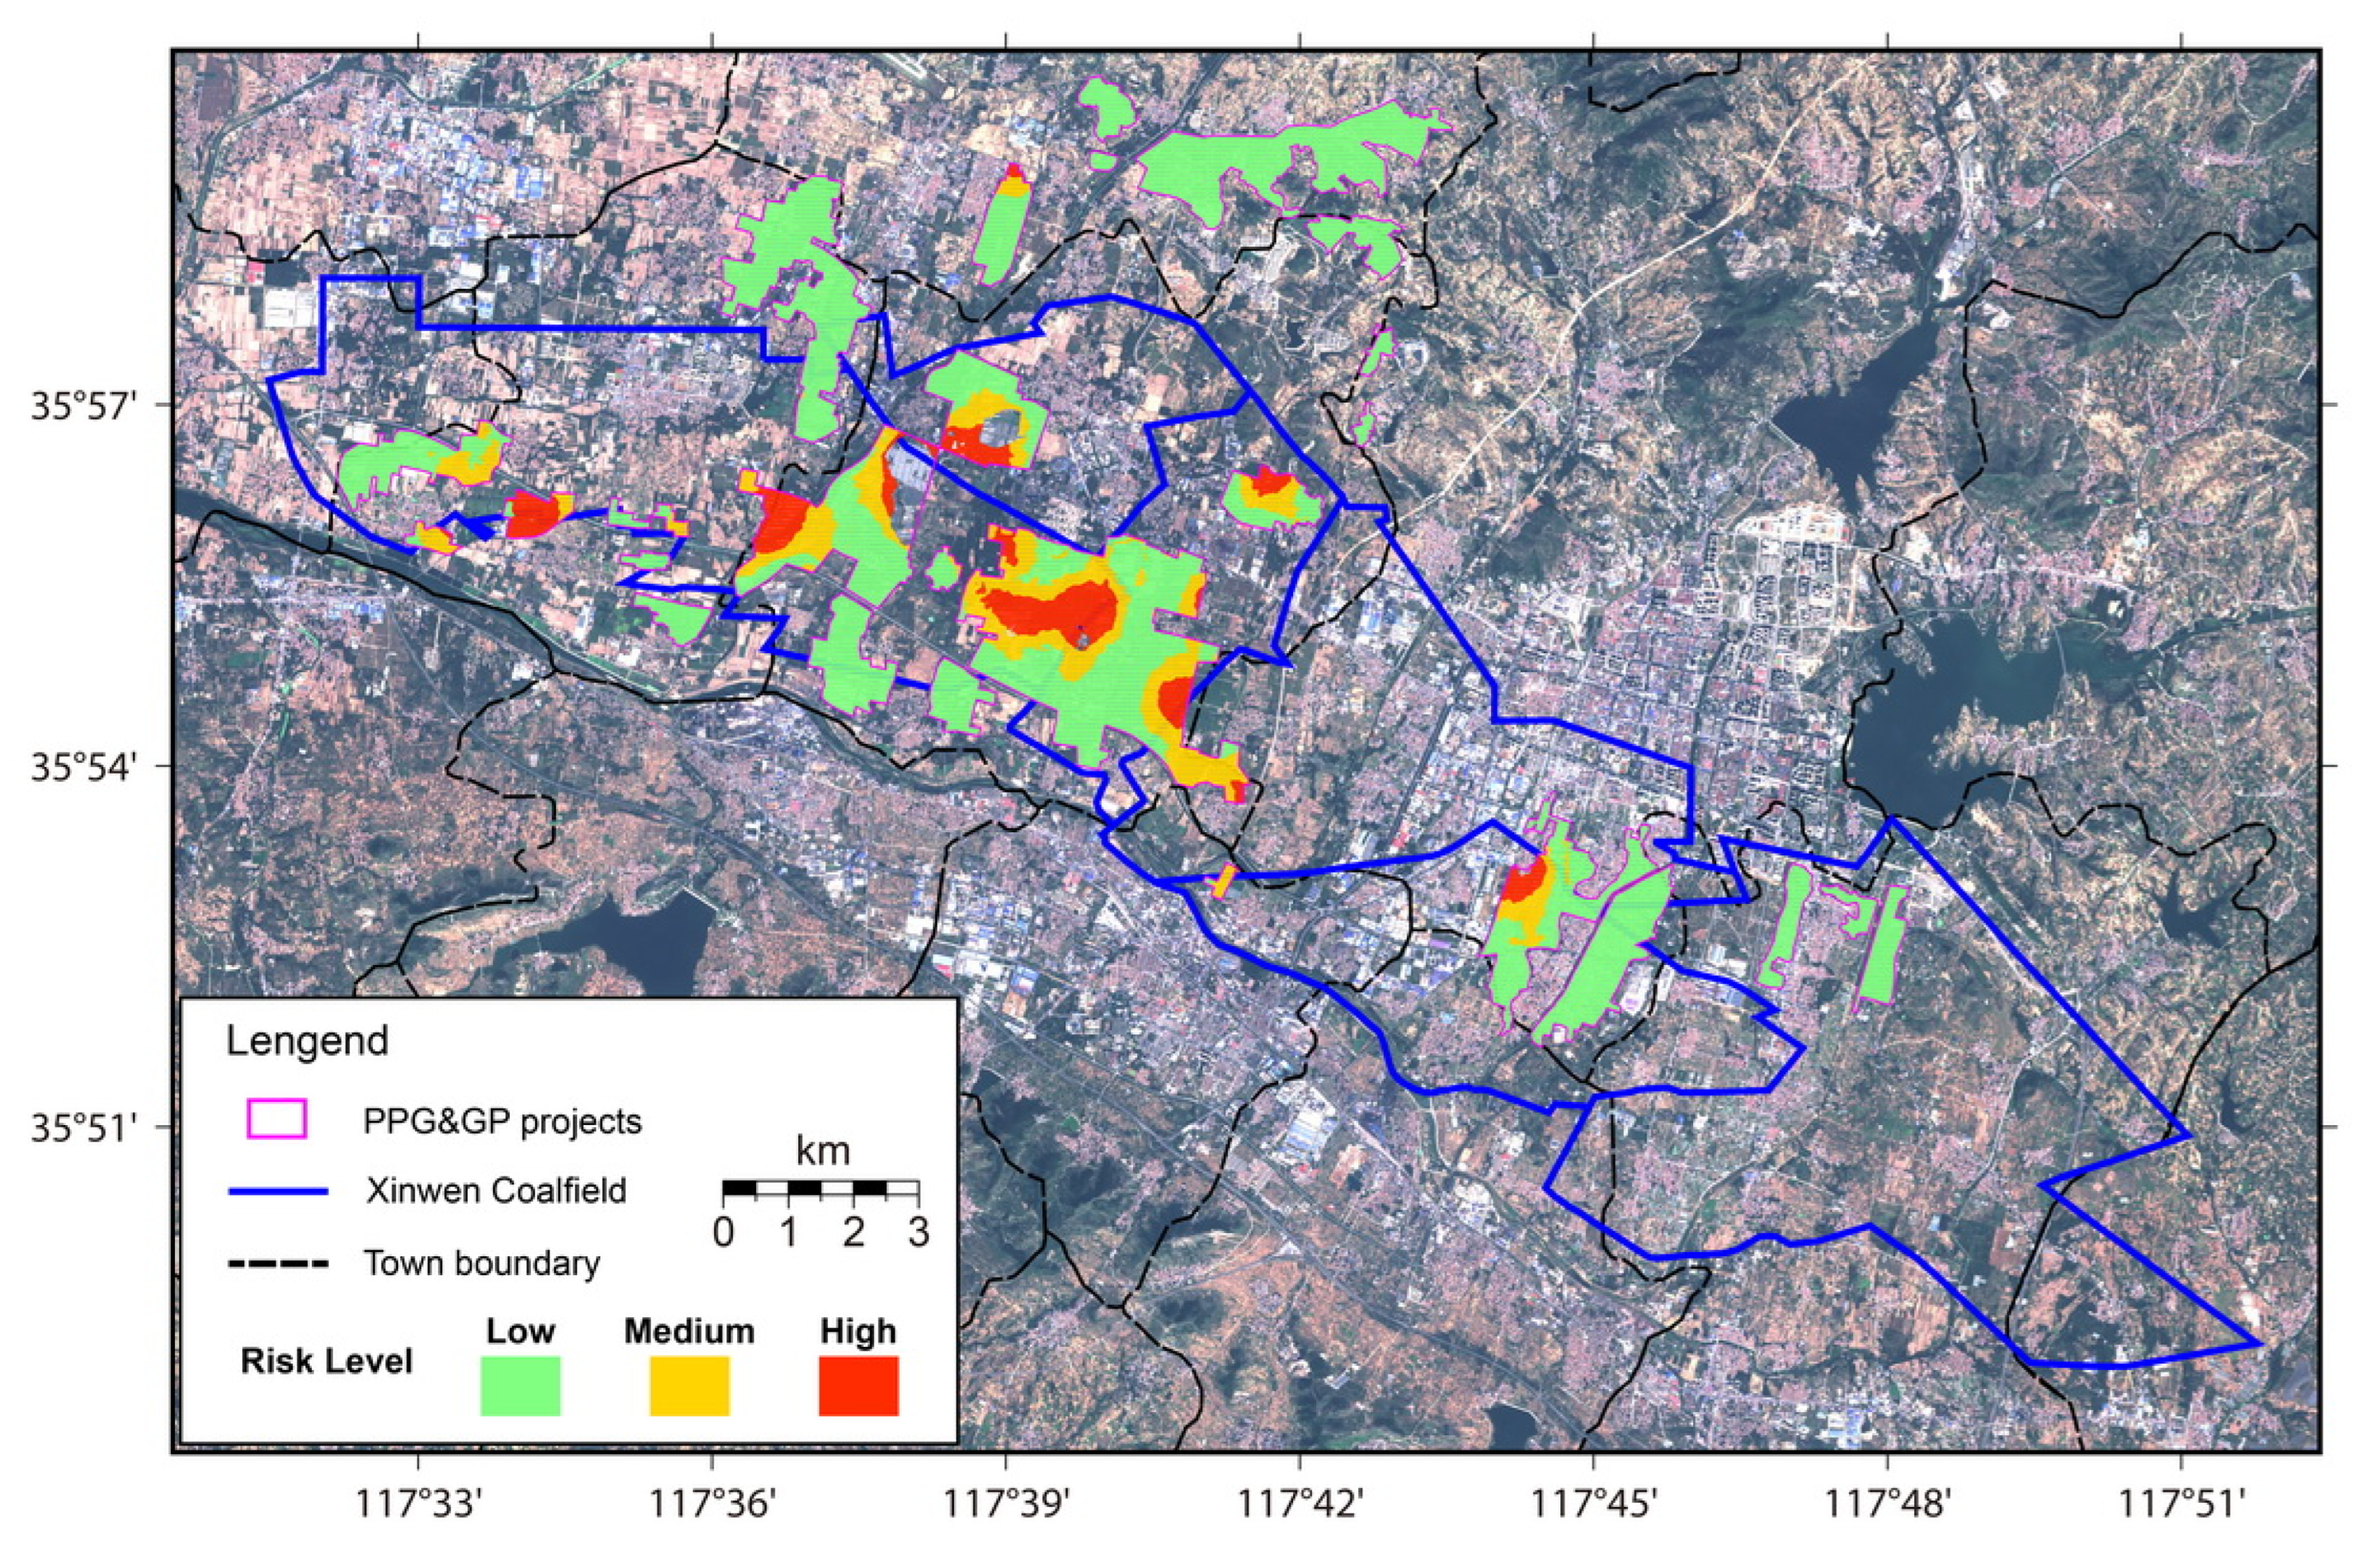
4.4. Risk Assessment on Ground Subsidence for the PPG&GP Projects

According to the risk assessment methodology, considering the many internal and external triggering factors introduced in Section 2.2.3, the risk assessment on the PPG&GP projects can be performed following the derived risk assessment map, as shown in Figure 9. The risk levels were divided into three categories: Low, Medium, and High. In general, the PPG&GP projects with high and medium risk levels of ground subsidence were mainly distributed in Zhaizhen Town, Xizhangzhuang Town, Qingyun Street, Quangou Town, and Xinwen Street due to the large deformation magnitudes and the fragile geological structure. Comparatively, the PPG&GP projects constructed in Wennan Town, Dongdu Town, and Guodu Town all have a low ground subsidence risk. Additionally, from the statistical perspective, the three risk level category areas were 28.35 km2 (Low level), 6.88 km2 (Medium level), and 3.84 km2 (High level), occupying 69.7%, 16.9%, and 9.4% regions of the PPG&GP projects, respectively. Also, the risk level of the residual 4% area of around 1.63 km2 in the PPG&GP projects was not identified due to the data void of Sentinel-1 SBAS-InSAR results possibly triggered by the phase incoherence. However, from the perspective of the geographically spatial correlation, these regions have a large potential for ground subsidence risk in the High and Medium levels. All the PPG&GP projects with potential collapse risks (medium or high levels) were mainly constructed and concentrated in the traditional coal-mining regions. The collapse risks of the PPG&GP projects maintain a high correlation with the local coal-mining activities, the geological structure, and the local social-economic factors. The risk assessment results provide a feasible pathway for guaranteeing the operating safety of local PPG&GP projects, which may play a significant role in accelerating the adjustment of industrial structure for the traditional coal-mining Provinces of China, such as the Shandong Province.

5. Conclusions

In this study, the SBAS-InSAR technique with the multi-temporal SAR images over the period of 17 January 2007~28 October 2010 (ALOS PALSAR) and the period of 30 July 2015~22 August 2022 (Sentinel-1) were utilized to retrieve the ground subsidence deformation for the coal-mining region with the PPG&GP projects constructed in Xintai City. With the ground deformation and their temporal changes, the spatio-temporal dynamic characteristics of the underground goaf were further analyzed here, combining the potential climatic, geological, and human factors. Generally speaking, the precipitation, the geological structure, the increased coal-mining depths, and the novel agricultural modes were the major impact factors controlling the ground deformation within the local PPG&GP projects. Except for the self-gravity of these PPG&GP projects, the construction and daily operation of these projects may impose negligible impacts on the local fragile geological and hydrological structures. Meanwhile, the spatio-temporal analysis validated that the operation of the PPG&GP projects can be helpful for enhancing the ground surface stability of the coal-mining areas. Also, a novel assessment method with the designed index of IRA was performed to classify the ground subsidence risks of the PPG&GP projects into three levels: Low (69.7%), Medium (16.9%), and High (9.4%). This assessment map can be further utilized to guide the safety operation of the PPG&GP projects in Xintai City.
Recently, Shandong Province issued the plan for “Planning and Construction of the ‘Photovoltaic &’ base in the coal mining subsidence zone of southwestern Shandong Province (2023–2030)” (Energy Administration of Shandong Province, http://nyj.shandong.gov.cn/art/2023/2/24/art_253733_10296236.html, accessed on 20 December 2023). In the coming years, this plan will focus on accelerating the construction of a new energy supply system coordinating the photovoltaic development and the land treatment of coal mining subsidence. With the guidance of this government plan, the “PPG &” industry certainly will accelerate the transformation and upgrading of energy in resource-based areas and significantly assist those coal-mining cities in Shandong Province in constructing the environment-friendly, low-carbon, and high-quality development pilot region. Thus, this study may provide an innovative remote sensing monitoring mode in the risk assessment and guarantee the operating safety of the burgeoning “PPG &” industry. In future works, increasing SAR observations with different heading directions and radar pulses may further provide a multi-dimensional (multi-angle, multi-temporal, multi-resolution, etc.) perspective of investigating the impacts of those new-style industrial development modes on the local ecological environment.

Author Contributions

Conceptualization, G.F. and C.D.; methodology, C.D.; software, C.D., G.F. and Z.X.; validation, C.D., G.F. and L.Z.; formal analysis, C.D. and G.F.; investigation, C.D.; writing—original draft preparation, C.D.; writing—review and editing, G.F. and C.D.; visualization, C.D.; supervision, G.F. and L.Z.; project administration, L.Z.; funding acquisition, C.D. All authors have read and agreed to the published version of the manuscript.

Funding

This work was funded by the project ZR2021QD075 supported by Shandong Provincial Natural Science Foundation, the National Natural Science Foundation of China (Grant No. 42304039), the Open Research Fund Program of LIESMARS (Grant No. 22R03), the open foundation of the State Key Laboratory of Geodesy and Earth’s Dynamics (Grant No. SKLGED2022-2-3), and the Doctoral Research Funding of the Shandong University of Technology.

Data Availability Statement

Data are contained within the article.

Acknowledgments

The GAMMA Version Linux64 16.04 software was used to acquire the SBAS-InSAR deformation results. Some figures in this paper were plotted with the GMT (Generic Mapping Tools) Version 6.0 software. The authors also thank Zhigao Feng (CSU) and Guipeng Wu (SDUT) for their help in data collection and validation.

Conflicts of Interest

The authors declare no conflict of interest.

References

  1. Li, J.; Yu, J.; Zhang, W. Spatial distribution and governance of coal-mine subsidence in China. J. Nat. Resour. 2019, 34, 867–880. [Google Scholar] [CrossRef]
  2. Hassanpour, A.E.; Selker, J.S.; Higgins, C.W. Remarkable agrivoltaic influence on soil moisture, micrometeorology and water-use efficiency. PLoS ONE 2018, 13, e0203256. [Google Scholar] [CrossRef] [PubMed]
  3. Marrou, H.; Dufour, L.; Wery, J. How does a shelter of solar panels influence water flows in a soil-crop system? Eur. J. Agron. 2013, 50, 38–51. [Google Scholar] [CrossRef]
  4. Ezzaeri, K.; Fatnassi, H.; Bouharroud, R.; Gourdo, L.; Bazgaou, A.; Wifaya, A.; Demrati, H.; Bekkaoui, A.; Aharoune, A.; Poncet, C.; et al. The effect of photovoltaic panels on the microclimate and on the tomato production under photovoltaic canarian greenhouses. Sol. Energy 2018, 173, 1126–1134. [Google Scholar] [CrossRef]
  5. Berardino, P.; Fornaro, G.; Lanari, R.; Sansosti, E. A new algorithm for surface deformation monitoring based on small baseline differential SAR interferograms. IEEE Trans. Geosci. Remote Sens. 2003, 40, 2375–2383. [Google Scholar] [CrossRef]
  6. Ferretti, A.; Prati, C.; Rocca, F. Permanent scatterers in SAR interferometry. IEEE Trans. Geosci. Remote Sens. 2001, 39, 8–20. [Google Scholar] [CrossRef]
  7. Yang, Z.; Li, Z.; Zhu, J.; Wang, Y.; Wu, L. Use of SAR/InSAR in mining deformation monitoring, parameter inversion, and forward predictions: A review. IEEE Geosci. Remote Sens. Mag. 2020, 8, 71–90. [Google Scholar] [CrossRef]
  8. Qin, X.; Zhang, L.; Yang, M.; Luo, H.; Liao, M.; Ding, X. Mapping surface deformation and thermal dilation of arch bridges by structure-driven multi-temporal DInSAR analysis. Remote Sens. Environ. 2018, 216, 71–90. [Google Scholar] [CrossRef]
  9. Li, S. Study on the Surface Subsidence Law and of Xinwen Mining Based on GIS. Master’s Dissertation, Shandong University of Technology and Science, Qingdao, China, 2008. (In Chinese). [Google Scholar]
  10. Guo, X.; Shi, L. Research on quantitative analysis of water inrush through risk based on fault impact factor and fault fractal dimension characteristics. J. Shandong Univ. (Eng. Sci.) 2014, 44, 58–64. [Google Scholar]
  11. Chen, S.; Chen, B.; Yin, D.; Guo, W. Characteristics of Discontinuous Surface Deformation Due to Mining in Hard, Thick Bedrock: A Case Study. Geotech. Geol. Eng. 2019, 37, 2639–2645. [Google Scholar] [CrossRef]
  12. Qiu, M.; Huang, F.; Wang, Y.; Guan, T.; Shi, L.; Han, J. Prediction model of water yield property based on GRA, FAHP and TOPSIS methods for Ordovician top aquifer in the Xinwen coalfield of China. Environ. Earth Sci. 2020, 79, 214. [Google Scholar] [CrossRef]
  13. Zheng, B. A Discussion on “Red Beds” Hosting Features in Xinwen Coalfield and Its Significance on Fault Activity Patterns and Coal Measures Preservation. Coal Geol. China 2008, 20, 3–5. [Google Scholar]
  14. Qu, X.; Qiu, M.; Liu, J.; Niu, Z.; Wu, X. Prediction of maximal water bursting discharge from coal seam floor based on multiple nonlinear regression analysis. Arab. J. Geosci. 2019, 12, 567. [Google Scholar] [CrossRef]
  15. Liao, M.; Zhang, L.; Shi, X.; Jiang, Y.; Dong, J.; Liu, Y. Method and Practice of Radar Remote Sensing Monitoring of Landslide Deformation; Science Press: Beijing, China, 2017. (In Chinese) [Google Scholar]
  16. Ding, C.; Feng, G.; Zhang, L.; Shen, Q.; Xiong, Z.; Liao, M. The Precursory 3D Displacement Patterns and Their Implicit Collapse Mechanism of the Ice-Rock Avalanche Events Occurred in Sedongpu Basin Revealed by Optical and SAR Observations. Remote Sens. 2023, 15, 2818. [Google Scholar] [CrossRef]
  17. Jenks, G.F.; Caspall, F.C. Error on choroplethic maps: Definition, measurement, reduction. Ann. Assoc. Am. Geogr. 1971, 61, 217–244. [Google Scholar] [CrossRef]
  18. Gao, C.; Huang, D.; Chang, X.; Xi, H. Meso-Damage Mechanism of Strength and Deformation Characteristics of Typical Sandstone in Xinwen Coalfield. Symmetry 2020, 12, 1815. [Google Scholar] [CrossRef]
  19. Wang, D.; Sui, W. Hydrogeological Effects of Fault Geometry for Analysing Groundwater Inflow in a Coal Mine. Mine Water Environ. 2022, 41, 93–102. [Google Scholar] [CrossRef]
  20. Shi, L.; Qu, X.; Han, J.; Qiu, M.; Gao, W.; Qin, D.; Liu, H. Multi-model fusion for assessing the risk of inrush of limestone karst water through mine floor. J. China Coal Soc. 2019, 44, 2484–2493. (In Chinese) [Google Scholar]
  21. Shi, L.; Qiu, M.; Teng, C.; Wang, Y.; Liu, T.; Qu, X. Risk assessment of water inrush to coal seams from underlying aquifer by an innovative combination of the TFN-AHP and TOPSIS techniques. Arab. J. Geosci. 2020, 13, 600. [Google Scholar] [CrossRef]
  22. Xing, T.; Dong, J.; Qiu, M.; Shi, L. Transverse development characteristics of Ordovician limestone karst water and runoff network prediction of Xinwen Coalfield. Saf. Coal Mines 2023, 54, 212–220. (In Chinese) [Google Scholar]
  23. Qu, X.; Shi, L.; Gao, W.; Qiu, M. Characteristics of faults in the Liangzhuang mining area and their control on karst development in Ordovician limestones. Carbonates Evaporites 2020, 35, 118. [Google Scholar] [CrossRef]
  24. Tan, T.K. Fundamental properties of loess from Northwestern China. Eng. Geol. 1988, 25, 103–122. [Google Scholar]
  25. RenéJacques, B. Some specific problems of wetted loessial soils in civil engineering. Eng. Geol. 1988, 25, 303–324. [Google Scholar] [CrossRef]
  26. Li, T.; Cai, M.F.; Cai, M. A review of mining-induced seismicity in China. Int. J. Rock Mech. Min. Sci. 2007, 44, 1149–1171. [Google Scholar] [CrossRef]
Figure 2. The flow chart of the methodology was used to evaluate the risks of construction and operation of the photovoltaic power generation and greenhouse planting (PPG&GP) projects in the coal-mining areas of Xintai City.
Remotesensing 16 01109 g002
Figure 3. The spatial and temporal baseline network of (a) Advanced Land Observing Satellite (ALOS) PALSAR images (spatial baseline threshold: 75~1200 m, temporal baseline threshold: 45–900 days) and (b) Sentinel-1 images (spatial baseline threshold: 0~200 m, temporal baseline threshold: 12~180 days) using SBAS-InSAR processing.
Remotesensing 16 01109 g003
Figure 4. The ALOS PALSAR-derived ground line-of-sight (LOS) deformation velocity (mm/yr) over the observation period of 17 January 2007~28 October 2010 in the coal-mining region of Xintai City.
Remotesensing 16 01109 g004
Figure 5. The Sentinel-1 derived ground line-of-sight (LOS) deformation velocity (mm/yr) over the observation period of 30 July 2015~22 August 2022 in the region of local photovoltaic power generation and greenhouse planting (PPG&GP) projects in Xintai City.
Remotesensing 16 01109 g005
Figure 6. The ground deformation region (green areas) detected by (a) ALOS PALSAR over the observation period of 17 January 2007~28 October 2010 and (b) Sentinel-1 over the observation period of 30 July 2015~22 August 2022.
Remotesensing 16 01109 g006
Figure 7. The cumulative ALOS PALSAR (17 January 2007~28 October 2010) and Sentinel-1 (30 July 2015~22 August 2022) deformation time series (al) for 12 observation points of A~L located within the photovoltaic power generation and greenhouse planting (PPG&GP) projects of Xintai City. The geological locations of these points were consistent with the ones in Figure 4 and Figure 5. The ground deformation time series of A~L were also cross-compared with the local precipitation and nearby tectonic seismicity within 200 km. In each subgraph, the construction temporal period and the operating temporal period of the PPG&GP projects are marked by the light red block and the light green block, respectively. The specific start and end times for the construction and operation of the PPG&GP projects can be found in Table 2.
Remotesensing 16 01109 g007
Figure 8. The ALOS PALSAR (a) and Sentinel-1 (b) derived ground deformation time series along the Profile of PP’, compared with corresponding geological column map (c) revised from [12]. The vertical axis of (a,b) from top to bottom denote the time sequence from 17 January 2007 to 28 October 2010 for ALOS PALSAR (a) and the time sequence from 30 July 2015 to 22 August 2022 for Sentinel-1 (b), respectively.
Remotesensing 16 01109 g008
Figure 9. The risk assessment map of the photovoltaic power generation and greenhouse planting (PPG&GP) projects constructed in the coal-mining areas of Xintai City, which mainly evaluated the deformation velocities and deformation time series derived from the recent Sentinel-1 observations from 30 July 2015 to 22 August 2022.
Remotesensing 16 01109 g009
Table 1. Parameter configuration for Advanced Land Observing Satellite (ALOS) PALSAR and Sentinel-1 sensors.
SensorsALOS PALSARSentinel-1
Path447142
Frame710/700111
Heading directionAscendingAscending
LevelsLevel 1.0~1.1Level 1
BandsHHVV
Spatial resolution (rg × az m)10 × 1010 × 10
Number of looks (rg × az m)3 × 85 × 1
Image time coverage17 January 2007~28 October 201030 July 2015~22 August 2022
Number of images22176
Table 2. Engineering details of observation points within local PPG&GP projects.
Observation PointsConstruction PeriodOperating Period
A14 June 2017~6 December 20176 December 2017~22 August 2022
B16 November 2019~30 January 202030 January 2020~22 August 2022
C26 November 2016~5 May 20175 May 2017~22 August 2022
D14 June 2017~6 December 20176 December 2017~22 August 2022
E14 June 2017~6 December 20176 December 2017~22 August 2022
F24 May 2021~11 September 202111 September 2021~22 August 2022
G16 December 2017~4 February 20184 February 2018~22 August 2022
H16 December 2017~4 February 20184 February 2018~22 August 2022
I10 November 2020~19 January 202119 January 2021~22 August 2022
J14 June 2017~6 December 20176 December 2017~22 August 2022
K14 June 2017~6 December 20176 December 2017~22 August 2022
L14 June 2017~6 December 20176 December 2017~22 August 2022
Table 3. The historical seismicity events that happened near the study region recorded by the China Earthquake Networks Center (CENC). Notably, ‘Distance (km)’ denotes the distance between the epicenter and the study area.
CodesTime (y/m/d)Magnitudes (Ms)Depth (km)Distance (km)Events (E.)
125 December 20154047.0076Collapse E.
28 January 20163.19134.2704Natural E.
327 March 20163.1039.2071Collapse E.
426 December 20161.87114.7525Natural E.
510 September 20173.61883.9385Natural E.
611 April 20183.11034.3172Natural E.
711 June 20192.9742.4348Natural E.
823 August 20192.3813.3919Natural E.
928 December 20192.90132.2493Collapse E.
1018 February 20204.110111.8012Natural E.
1120 February 20203.18111.9626Natural E.
1224 May 20203.112125.4544Natural E.
1331 May 202030141.6185Collapse E.
145 February 20223.310187.8929Natural E.
152 May 20223.4887.2894Natural E.
1614 May 20222.810145.0987Natural E.
Disclaimer/Publisher’s Note: The statements, opinions and data contained in all publications are solely those of the individual author(s) and contributor(s) and not of MDPI and/or the editor(s). MDPI and/or the editor(s) disclaim responsibility for any injury to people or property resulting from any ideas, methods, instructions or products referred to in the content.

