Article

Active Deformation Areas of Potential Landslide Mapping with a Generalized Convolutional Neural Network

1
China Aero Geophysical Survey and Remote Sensing Center for Natural Resources, Beijing 100083, China
2
Technology Innovation Center for Geohazards Identification and Monitoring with Earth Observation System, Ministry of Nature and Resources, Beijing 100083, China
3
Key Laboratory of Airborne Geophysics and Remote Sensing Geology, Ministry of Nature and Resources, Beijing 100083, China
*
Author to whom correspondence should be addressed.
Remote Sens. 2024, 16(6), 1090; https://doi.org/10.3390/rs16061090
Submission received: 28 January 2024 / Revised: 15 March 2024 / Accepted: 16 March 2024 / Published: 20 March 2024
(This article belongs to the Topic Landslides and Natural Resources)

Abstract

:
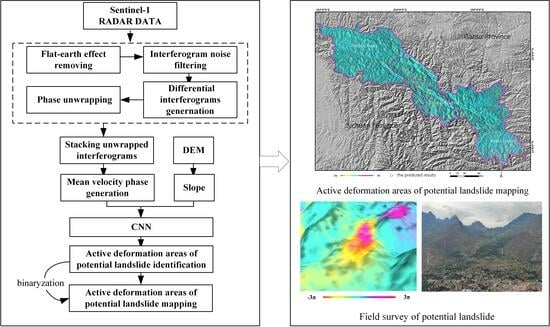
Early discovery and monitoring of the active deformation areas of potential landslides are important for geohazard risk prevention. The objective of the study is to propose a one-step strategy for automatically mapping the active deformation areas of potential landslides from a Sentinel-1 SAR dataset. First, we built a generalized convolutional neural network (CNN) based on activity and topographic characteristics. Second, we conducted a comparative analysis of the performance of various multi-channel combiners for detecting the active deformation areas of the potential landslides. Third, we verified the transferability of the pretrained CNN model for an unknown region. We found that by incorporating topographic characteristics into a generalized convolutional neural network, we were able to enhance the accuracy of identifying the active deformation areas of potential landslides, rapidly mapping these areas. The methodology is robust and efficient, and it has the capability to automatically detect the active deformation areas of potential landslides, even in unknown or unfamiliar regions. This product can facilitate automated pipelines, updating and mapping active deformation areas for final users who are not InSAR experts. This implementation can be used for providing support to risk management activities.

Graphical Abstract

1. Introduction

Landslides are one of the major natural hazards that can take lives and cause economic losses and environmental impacts due to their wide distribution and strong destructiveness every year [1]. The monitoring and risk prevention of landslides have attracted much attention. The occurrence of deformation in mountain slopes is regarded as a precursor to slope failure [2]. The onset of a landslide event typically involves slow prefailure deformation along with cracks of surficial soil and rock. It may cause a large active area of the slope, followed by the development of sliding slope failure [3,4,5]. Therefore, detecting the active deformation areas of potential landslides as early as possible is critical to prevent and decrease disaster events [6,7,8].
It is very challenging to monitor and map the active deformation areas of potential landslides. At present, deformation monitoring mainly includes in situ observations and remote sensing technology. For example, in situ observations are used to monitor the displacement and deformation of the slope surface, combined with other triggering factors (i.e., reservoir water level factors, rainfall factors) and mode decomposition theory, with which experts calculate the cumulative displacement of the landslide. But the method is constrained by terrain conditions, labor costs, and the number of monitoring points [6,9,10]. This method can effectively monitor at a local scale, but can sometimes be less effective or practical in large-scale areas. Therefore, remote sensing technology, with its macroscopical and rapid advantages, compensates for the shortcomings of the aforementioned method and has been extensively utilized in the survey and monitoring of geological hazards [1,11]. Interferometric synthetic aperture radar (InSAR), in particular, has been widely applied in monitoring Earth’s surface deformation resulting from diverse geological processes [8,12,13,14]. It has been demonstrated as a potent methodology for long-term monitoring of the deformation of geological activities [15].
In the past decade or so, the identification of active deformation areas has primarily relied on differential interferometric synthetic aperture radar (DInSAR), multi-temporal interferometric synthetic aperture radar (MT InSAR) techniques, such as persistent scatterer interferometric synthetic aperture radar (PS-InSAR), distributed scatterer interferometric synthetic aperture radar (DS-InSAR), and small baseline subset (SBAS InSAR) analysis methods, which can be employed to acquire active deformation information. Subsequently, professional radar experts visually interpret the spatial distribution and temporal evolution of slope deformation, enabling the identification of significant landslide deformation areas [16,17,18,19,20,21]. Some scholars employ a semi-automatic approach to identify clusters of active persistent scatterers. This is achieved by setting a threshold for the deformation rate. However, it is important to note that this method can be influenced by variations in threshold settings across different regions as well as the presence of data noise, lacking universality [6,22,23,24]. Some experts focus on the automatic detection of volcano, ground-subsidence, slow-moving landslide deformation using a variety of machine learning and deep learning methods [25,26,27,28,29].
Landslide is a geological phenomenon characterized by the downward movement of soil or rock mass on a slope. This movement occurs due to various factors, including rainfall, river erosion, groundwater activity, earthquakes, and human-induced slope cutting [20,30,31,32]. At present, researchers comprehensively detect landslides using the associated characteristics describing landslides, such as the spectral features, other morphological and appearance characteristics from remote sensing images, and lithological, hydrological, and geological factors. Du et al. [33] used the InSAR+ stacking method to obtain the LOS deformation velocity map and detect wide-area active landslides. Zhang et al. [34] acquired Sentinel-1 data to identify potential landslides and indicated stacking technology is an effective method to detect potential landslides in mountainous areas at a large scale, with low computational labor advantages. Many traditional machine learning algorithms have been widely used for landslide identification, but recently, advanced deep learning has been employed for monitoring landslides. These models incorporate adjustments to the layer numbers, loss function, attention mechanism, and training sample size to enhance their effectiveness in landslide detection [35,36,37,38,39,40,41]. Some business software containing a deep learning module is also utilized for the identification of landslides [42].
Yu et al. [40] designed a seven-layer network structure and improved region growth algorithm for landslide detection based on RGB optical images. Qin et al. [38] proposed a CNN induced attention mechanism and distant domain transfer learning to detect landslide and classification, achieving higher accuracy compared the normal CNNs—VGG16, VGG19, and ResNet-50. Yu et al. [40] developed a hierarchical-attention multi-scale deconvolution network and yielded 21% higher F1 scores for landslide identification compared with six networks (Unet, SegNet, DeepLabv3, PSPNet, BiSeNet). Wu et al. [43] employed the mask R-CNN model and combined spectral, textural, morphological, and physical characteristics to extract rainfall-induced landslides in Beijiang River Basin with a precision rate of 81.91%, a recall rate of 84.07%, and an overall accuracy of 87.28%. Fu et al. [44] proposed the YOLOv3 network and InSAR phase-gradient stacking maps to extract 3366 slow-moving landslides in southwestern China. Optimizing network structures of these models and integrating landslide-influencing factors can to some extent enhance the accuracy of landslide detection.
Based on the integration of InSAR technology and deep learning, automatic detection of active deformation areas of potential landslides has not been fully explored yet. The impact analysis of the activity and topographic structure characteristics is lacking. Inspired by the detection of landslide events, the primary objective of this article is to focus on detecting active deformation areas of potential landslides by the implementation of a proposed one-step strategy, building a generalized CNN model based on activity characteristics and topographic characteristics, and comparing the performance and efficiency of different multi-channel combiners in the same training and validating dataset. Finally, the transferability of the pretrained CNN model is evaluated on an unknown region. The active deformation areas of potential landslide mapping products can be utilized for updating inventories of geohazards. This update is essential for effective geohazard prevention, warning, and risk reduction in the field of risk management.

2. Materials and Methods

2.1. Study Area

The study area is situated in the transition zone between the Qinghai-Tibet Plateau and the Loess Plateau, spanning an area of approximately 600 km by 450 km. It covers regions within Qinghai, Gansu, and Ningxia provinces in China. The study area exhibits diverse landforms, complex terrain, and geological conditions, breeding conditions for the occurrence of slope failures. The significant variation in topographic elevation within mountainous regions results in the accumulation of loose detrital material at higher altitudes, which possesses substantial potential energy. When the rock or soil moves downhill, this potential energy is released from a higher position, causing this potential energy to decrease while the energy of motion increases, which contributes to driving the formation of landslide, debris flow, and other geohazards.
The selected test area serves as the transfer learning domain to provide additional confirmation of the proposed CNN model’s feasibility. The test area is Zhouqu County and surrounding Wudu and Diebu counties, Gansu Province, China. The location of the area is in the upper reaches of the Bai-lung River, and it is distinguished by its rugged topography and alpine valleys, where the geological structure is complex, the terrain is cut strongly, the valley is deep, the loess-covered surface, thick layers of loose sediment, fragmented rocks, and soft rock formations are widely distributed. Based on the impact of earthquakes, rainfall, and human engineering activities, landslides in the study area are widely distributed, exhibiting a high density and frequent occurrences. There have been numerous geological disaster events in history.
The geological structure in both of these regions is intricate and dynamic, making them typical and representative examples. These regions offer ample evidence to showcase the generalization capability of the proposed methodology. Figure 1 shows the location of the study and test area, data coverage.

2.2. Data

For the study, we utilized Sentinel-1 SAR data, specifically in the C-band with a radar wavelength of 5.6 cm. The data were acquired by the European Space Agency as part of the European Commission Copernicus program. The Sentinel-1 constellation comprises two complementary satellites. The first satellite was launched in March 2014, followed by the second in April 2016. Each satellite has a repeat cycle of 12 days. By utilizing data from both satellites, a minimum repeat acquisition interval of 6 days can be achieved. The primary acquisition mode over land is the interferometric wide (IW) swath mode, which fulfills the majority of service requirements. In this mode, data are collected with a 250 km swath width at a spatial resolution of 5 m by 20 m (single look). The IW mode employs the terrain observation with progressive scans SAR (TOPSAR) technique to capture three sub-swaths [45]. We selected SLC data of Sentinel-1A-IW mode from ascending path 128 and descending paths 135, 33, and 62 acquired from February 2017 to January 2023 (Table 1). The polarization mode was VV + VH. A total of 1379 images were collected to calculate the average phase rate data and the line-of-sight (LOS) rate of surface deformation based on stacking InSAR technology.
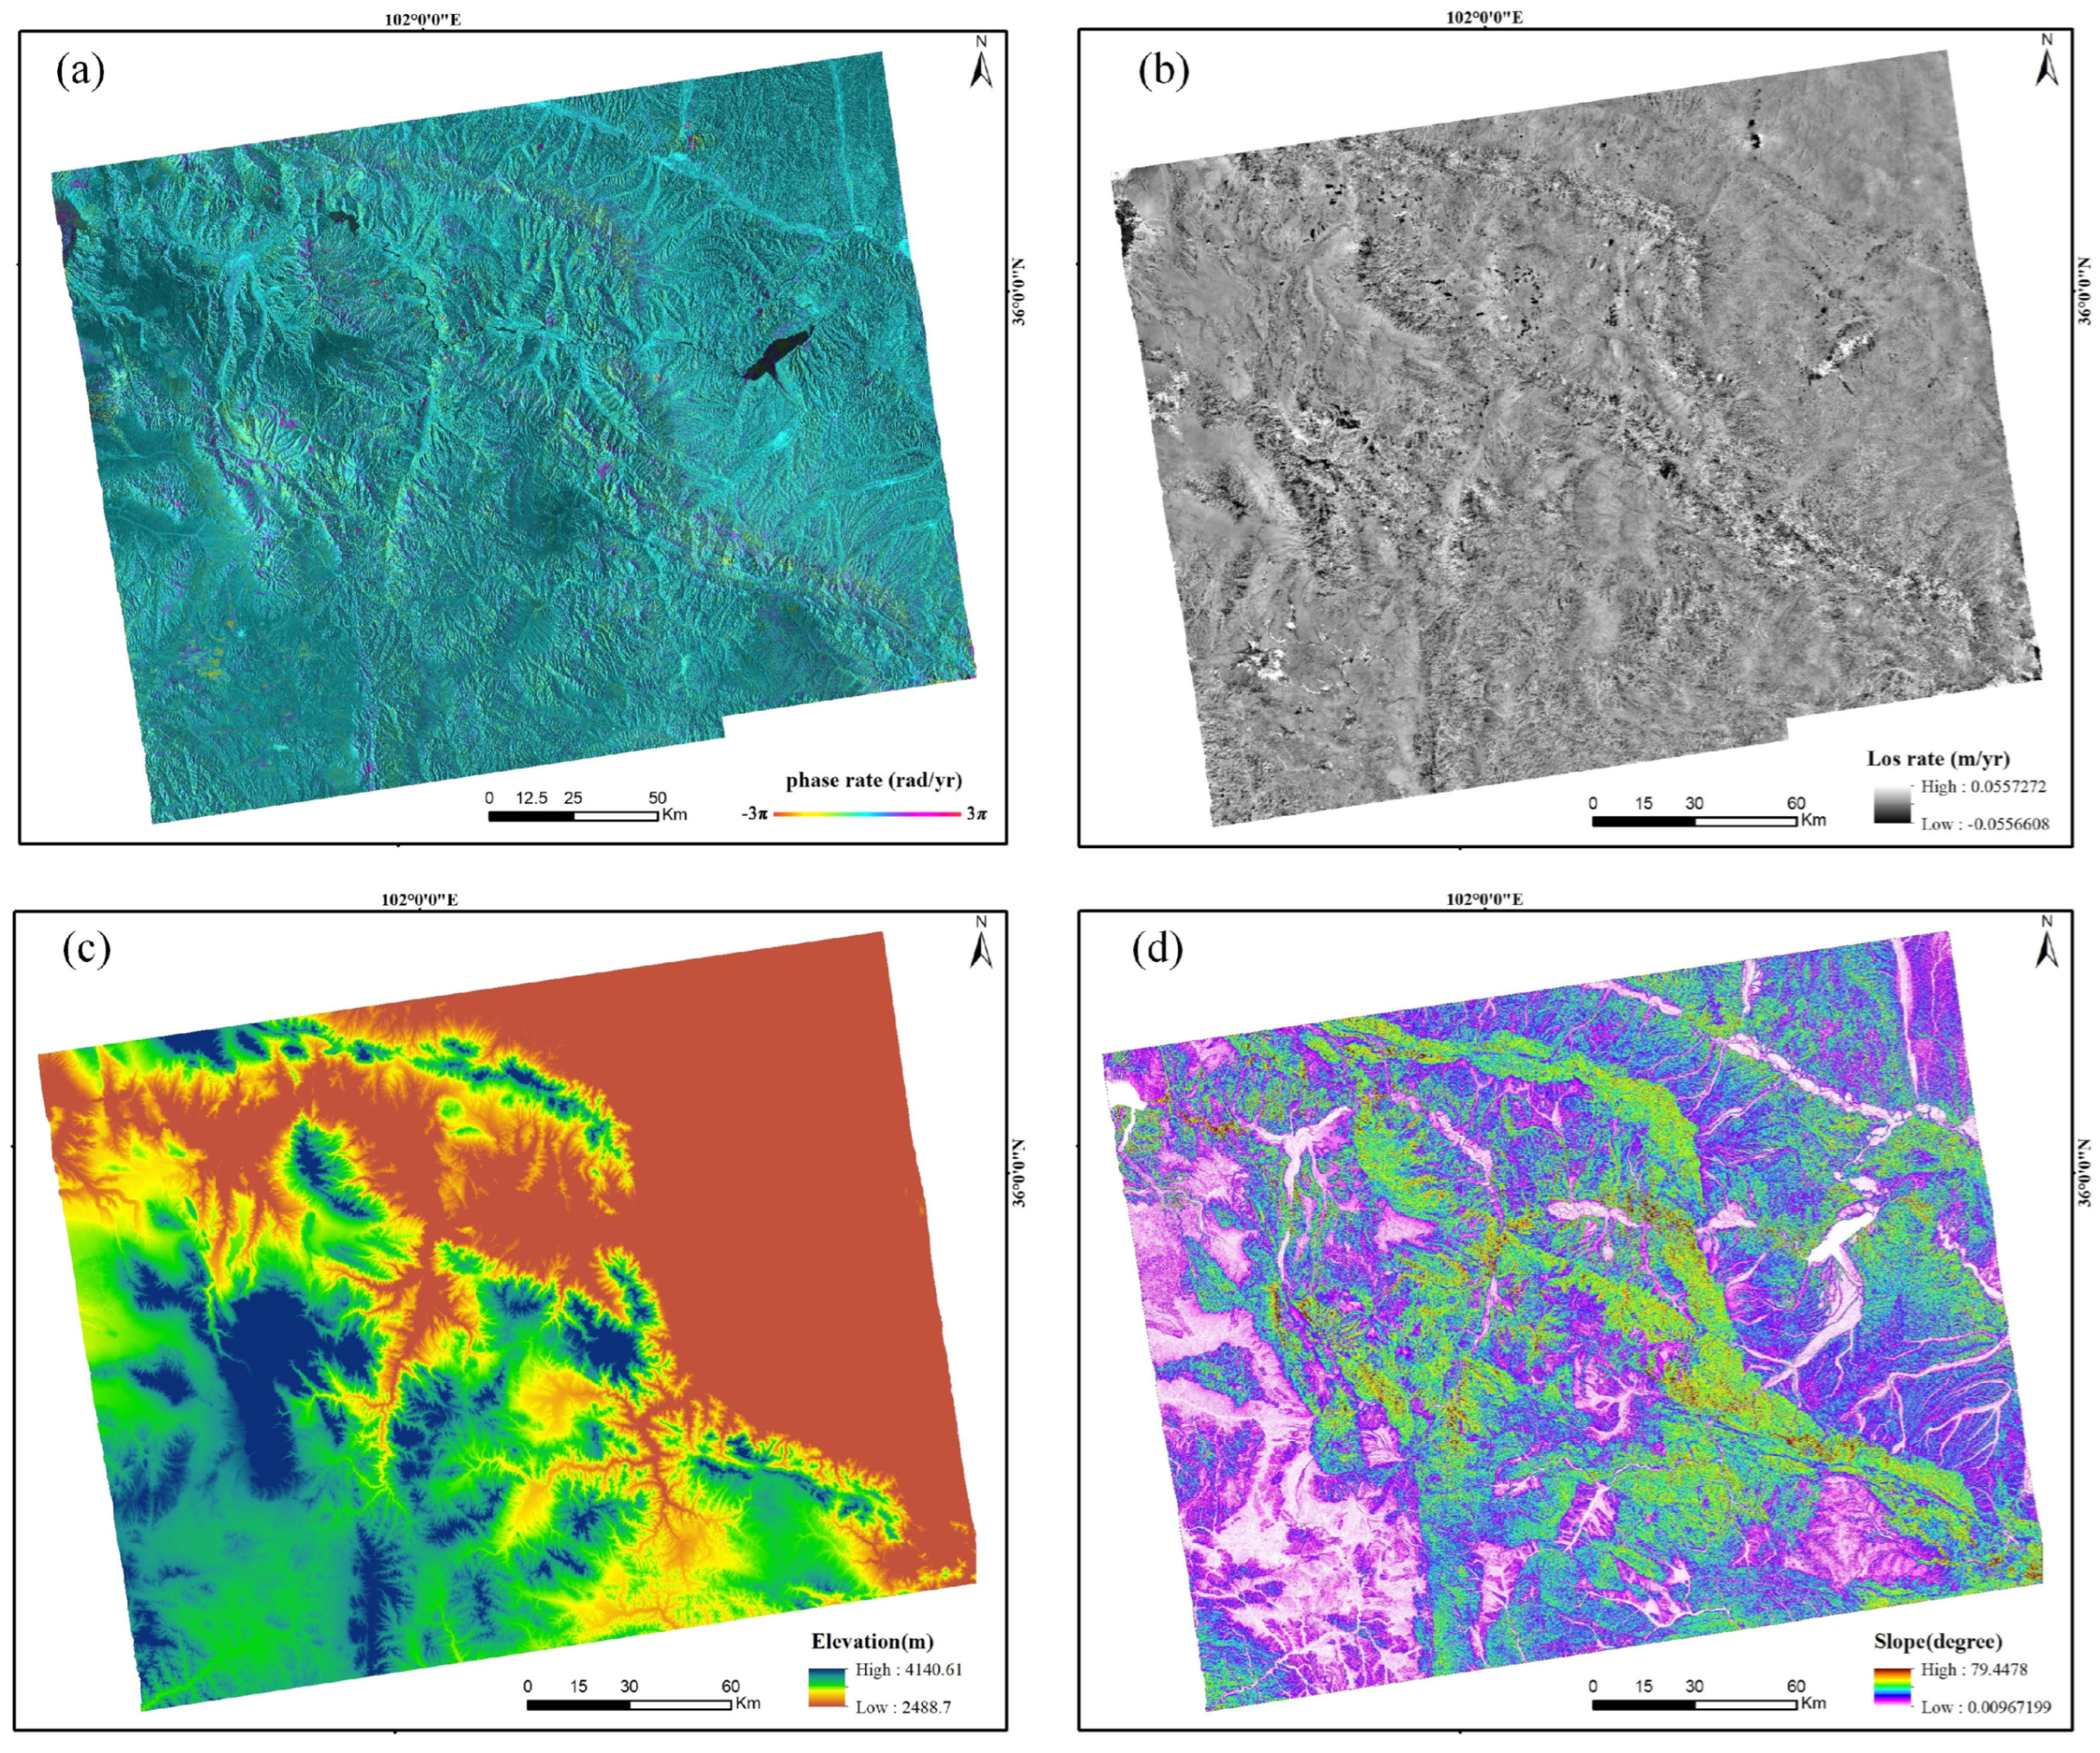
The phase rate data, the line-of-sight (LOS) rate of surface deformation, DEM, and slope data were used to construct a multi-channel sample database for detecting the active deformation areas of potential landslide. Data normalization is carried out to a range between 0 and 1. The DEM dataset is a global digital surface model (DSM) with a resolution of 30 m. It was developed by the Japan Aerospace Exploration Agency (JAXA) and is known as AWD30. Slope data are calculated based on the DEM. Details about the multi-source data are shown in Table 2. Some data are shown in Figure 2.

2.3. Methods

2.3.1. Stacking InSAR Technology

The stacking InSAR technology is a sequential interferogram stacking method. After multiple images are used by controlling the spatio-temporal baselines, multiple unwrapping differential interferograms are obtained, the interference phases are stacked, then the phase rate is estimated [46]. The method effectively solves the time and space decoherence problem and reduces the impact of atmospheric disturbance.
The formula is defined as follows:
p = j = 1 N t j j j = 1 N t j 2
where p is the phase rate, t j is the time interval of the j-th interference pair, j is the interference phase of the j-th interference image.
Then, the LOS rate is converted by the phase rate. The formula is defined as follows:
r = λ · p 4 π
where r is the LOS rate of surface deformation, λ is the radar wavelength.
Main process: (1) Firstly, single-look complex (SLC) bursts are merged into a single SLC image. Subsequently, one SLC image from a specific date is chosen as the master image. The remaining images are then registered to the master image using uniform registration in the radar coordinate system. The data covering the study area, acquired along the same path, are processed using the principles of splicing, registration, clipping, and sub-setting. (2) Spatial baseline and time baseline were set to 120 m and 40 d as thresholds, and the selected dataset were used for differential interference processing. The flat-Earth phase is calculated according to the satellite orbit parameters and the Earth ellipsoid model, and the terrain phase is calculated by the DEM, then both the flat-Earth and terrain phases are subtracted from the interference phase. (3) We further process the phase unwrapping by the minimum cost flow algorithm. (4) The phase data are estimated by stacking of multiple unwrapped differential interferograms. (5) By applying spatial low-pass and time-domain high-pass filtering techniques, we can effectively separate the atmospheric phase from the data. The phase rate is obtained, and the deformation rate of the LOS direction is calculated. (6) Using the transformation lookup table of the DEM coordinate system and image coordinate system, the phase rate and LOS rate data are converted to the geographical coordinate system. The above processes are implemented by gamma software 2020.

2.3.2. Deep Learning Technology

We proposed a deep convolutional neural network model for remote sensing data of multi-channel input. This model is composed of an encoder and a decoder (see Figure 3). The encoder on the left is based on backbone network of ResNet50 with one convolutional structure and four groups of residual bottleneck structures are used to extract image features, gradually compress the spatial dimension of the feature map, and expand the channels of the feature map. On the right is the decoder that consists of a convolution layer, double linear upsampling, ReLU activation function, and concatenating feature fusion layer. It is used to gradually recover the detail information and spatial dimension of the feature map and compress the feature map channel. Table 3 and Table 4 show the network structure of the left encoder and right encoder. Finally, 1 × 1 convolution is used to adjust the output channel as classification number 2.
The proposed network is utilized for extracting the features of various combinations of remote sensing data, then the feature extraction is predicted and classified by the softmax layer, and the performance of multi-channel combiners in the same training and validating dataset is discussed. In the sample data preprocessing, we also proposed sample construction and enhancement techniques that are used to obtain high-quality remote sensing sample sets for the training and validation of the CNN model. We used dice loss as a loss function of supervised learning because dice loss pays more attention to the mining of the foreground region in the training process. All the codes were implemented in the PyTorch deep learning environment. We can offer both code link and graphical user interface (GUI) versions on request.

2.3.3. Accuracy Evaluation

In order to evaluate the performance of our identification model, we employed several metrics. We utilized IOU1, which measures the intersection over union between the predicted and ground truth areas for the activate deformation areas. Additionally, we employed precision, recall, and F1 score to compare the identification efficiency of various multi-channel combiner convolutional neural networks (CNNs) for active deformation. These metrics allow us to assess the accuracy, completeness, and overall effectiveness of the different CNN models in identifying active deformation areas. The precision, recall, and F1 score are defined as follows:
I O U 1 = A r e a   o f   O v e r l a p A r e a   o f   U n i o n
P r e c i s i o n = T P T P + F P
R e c a l l = T P T P + F N
F 1 = 2 × P r e c i s i o n × R e c a l l P r e c i s i o n + R e c a l l
where TP is a real active deformation pixel predicted as an active deformation pixel, FP is a real active deformation pixel predicted as a non-active deformation pixel, and FN indicates a real active deformation pixel that is omitted by the proposed methods.

3. Results

In this section, we initially investigate the impact of various source domains on attaining a more precise classification model. Additionally, we present the accuracy results of the identification method. Then, we compare the outcome of different models based on the same data test. Finally, we demonstrate the validity of the proposed CNN model in unknown regions and discover the effectiveness of the model migration.

3.1. Evaluation of Detection Model Based on Different Source Domains

We compared the generalized CNN model with the phase rate data, the LOS rate of surface deformation, DEM, slope, and different multi-channel combiners to identify the active deformation area. Table 5 shows the accuracy evaluation of identification results. Firstly, we only focused on the activity characteristic information. The IOU1 is respectively 90.25% and 54.61%, and the precision and recall are respectively 95.55%, 94.21% and 82.57%, 61.73% using the phase rate data and the LOS rate data of surface deformation. Compared with the identified result based on the LOS rate, the IOU1 was increased by 35.64 percentage points, the precision and recall were respectively increased by 12.98 and 32.48 percentage points, and the F1 score was increased by 24.23 percentage points. This two-type combiner yielded more accurate results compared to using only one type of data. The IOU1 is 93.88%, which increased by 3.63 percentage points. Then, we simultaneously focused on the activity and topographic characteristic information. The IOU1 is 93.63% based on the phase rate data and DEM. Compared with slope data, the IOU1 was improved by 0.4%. The introduction of the DEM and slope resulted in noticeable improvements in the IOU1 indexes compared to the results obtained solely from the phase rate data. Based on the phase rate data and two-type topographic data, IOU1 was increased by 3.95 percentage points. The four-type data source combiners have the best performance with the highest of four evaluation indexes, respectively 94.49%, 97.41%, 96.93%, and 97.41%. Incorporating the activity characteristic information with the DEM and slope data could potentially enhance the detection results of the active deformation area.

3.2. Comparison of Different Network Architectures

We compared the outcome of similar network architectures based on the same training and validating data. VCNN is also composed of an encoder and a decoder. The encoder on the left side is a feature extraction network based on the backbone network of VGG16, which is used to extract multi-feature maps at different depths. The decoder on the right is a feature fusion network for obtaining high-level semantic features, whose feature maps at different levels and the feature maps obtained through double convolution and double linear upsampling are fused by concatenated feature fusion layers. The network design of VCNN is shown in Figure 4.
Table 6 shows the accuracy evaluation of the VCNN model. The IOU1 is respectively 71.82% and 51.04% using the phase rate data and the LOS rate data of surface deformation. The phase rate data provide a more accurate description of the active deformation area, resulting in better performance. This result that was partially in agreement with the proposed method. Using the phase rate data and the LOS rate of surface deformation showed more accurate identification results than using the one-type data. The combination of phase rate data and LOS rate of surface deformation yields more accurate identification results compared to using only one-type data. The identified precision of introducing the DEM is slight lower than that of using slope analysis. Compared to the identification results obtained using only the DEM or slope, the simultaneous introduction of both DEM and slope has shown improvement. This finding confirms that the DEM and slope can play more significant roles in the identification process. Steep slopes are typically more prone to landslides compared to flatter areas. The increased angle of the slope makes it more susceptible to gravitational forces and erosion, which can trigger landslides. The four-type combiners based on the VCNN model achieved the highest IOU1 and precision, recall, and F1 score. As shown in Figure 5, the results obtained from the proposed method showed higher performance compared to the VCNN model for all types of data. The proposed network model reached the best IOU1, precision, recall, and F1 score.

3.3. Identifying the Active Deformation Area of the Unknown Region

To assess the transferability of the proposed method, we conducted an evaluation to determine if the pretrained model, trained on the training dataset, is capable of identifying the active deformation area of potential landslides. The test region is geological disaster-prone areas. We used the pretrained model of the proposed method to identify the active deformation area of potential landslides. Figure 6 shows the identification results of active deformation areas in the test region, and the red box shows the predicted results. We randomly selected 56 active deformation areas to confirm by field survey and found that four candidates failed to be identified and the rest were recognized as potential landslides with morphological characteristics and deformation signs. The recall is 92.86%. The F1 score is 96.30%. The reason is that four candidates were not obviously displaced in the stripe of the deformation phase diagram and a relatively weak deformation area was omitted in the identifying process.
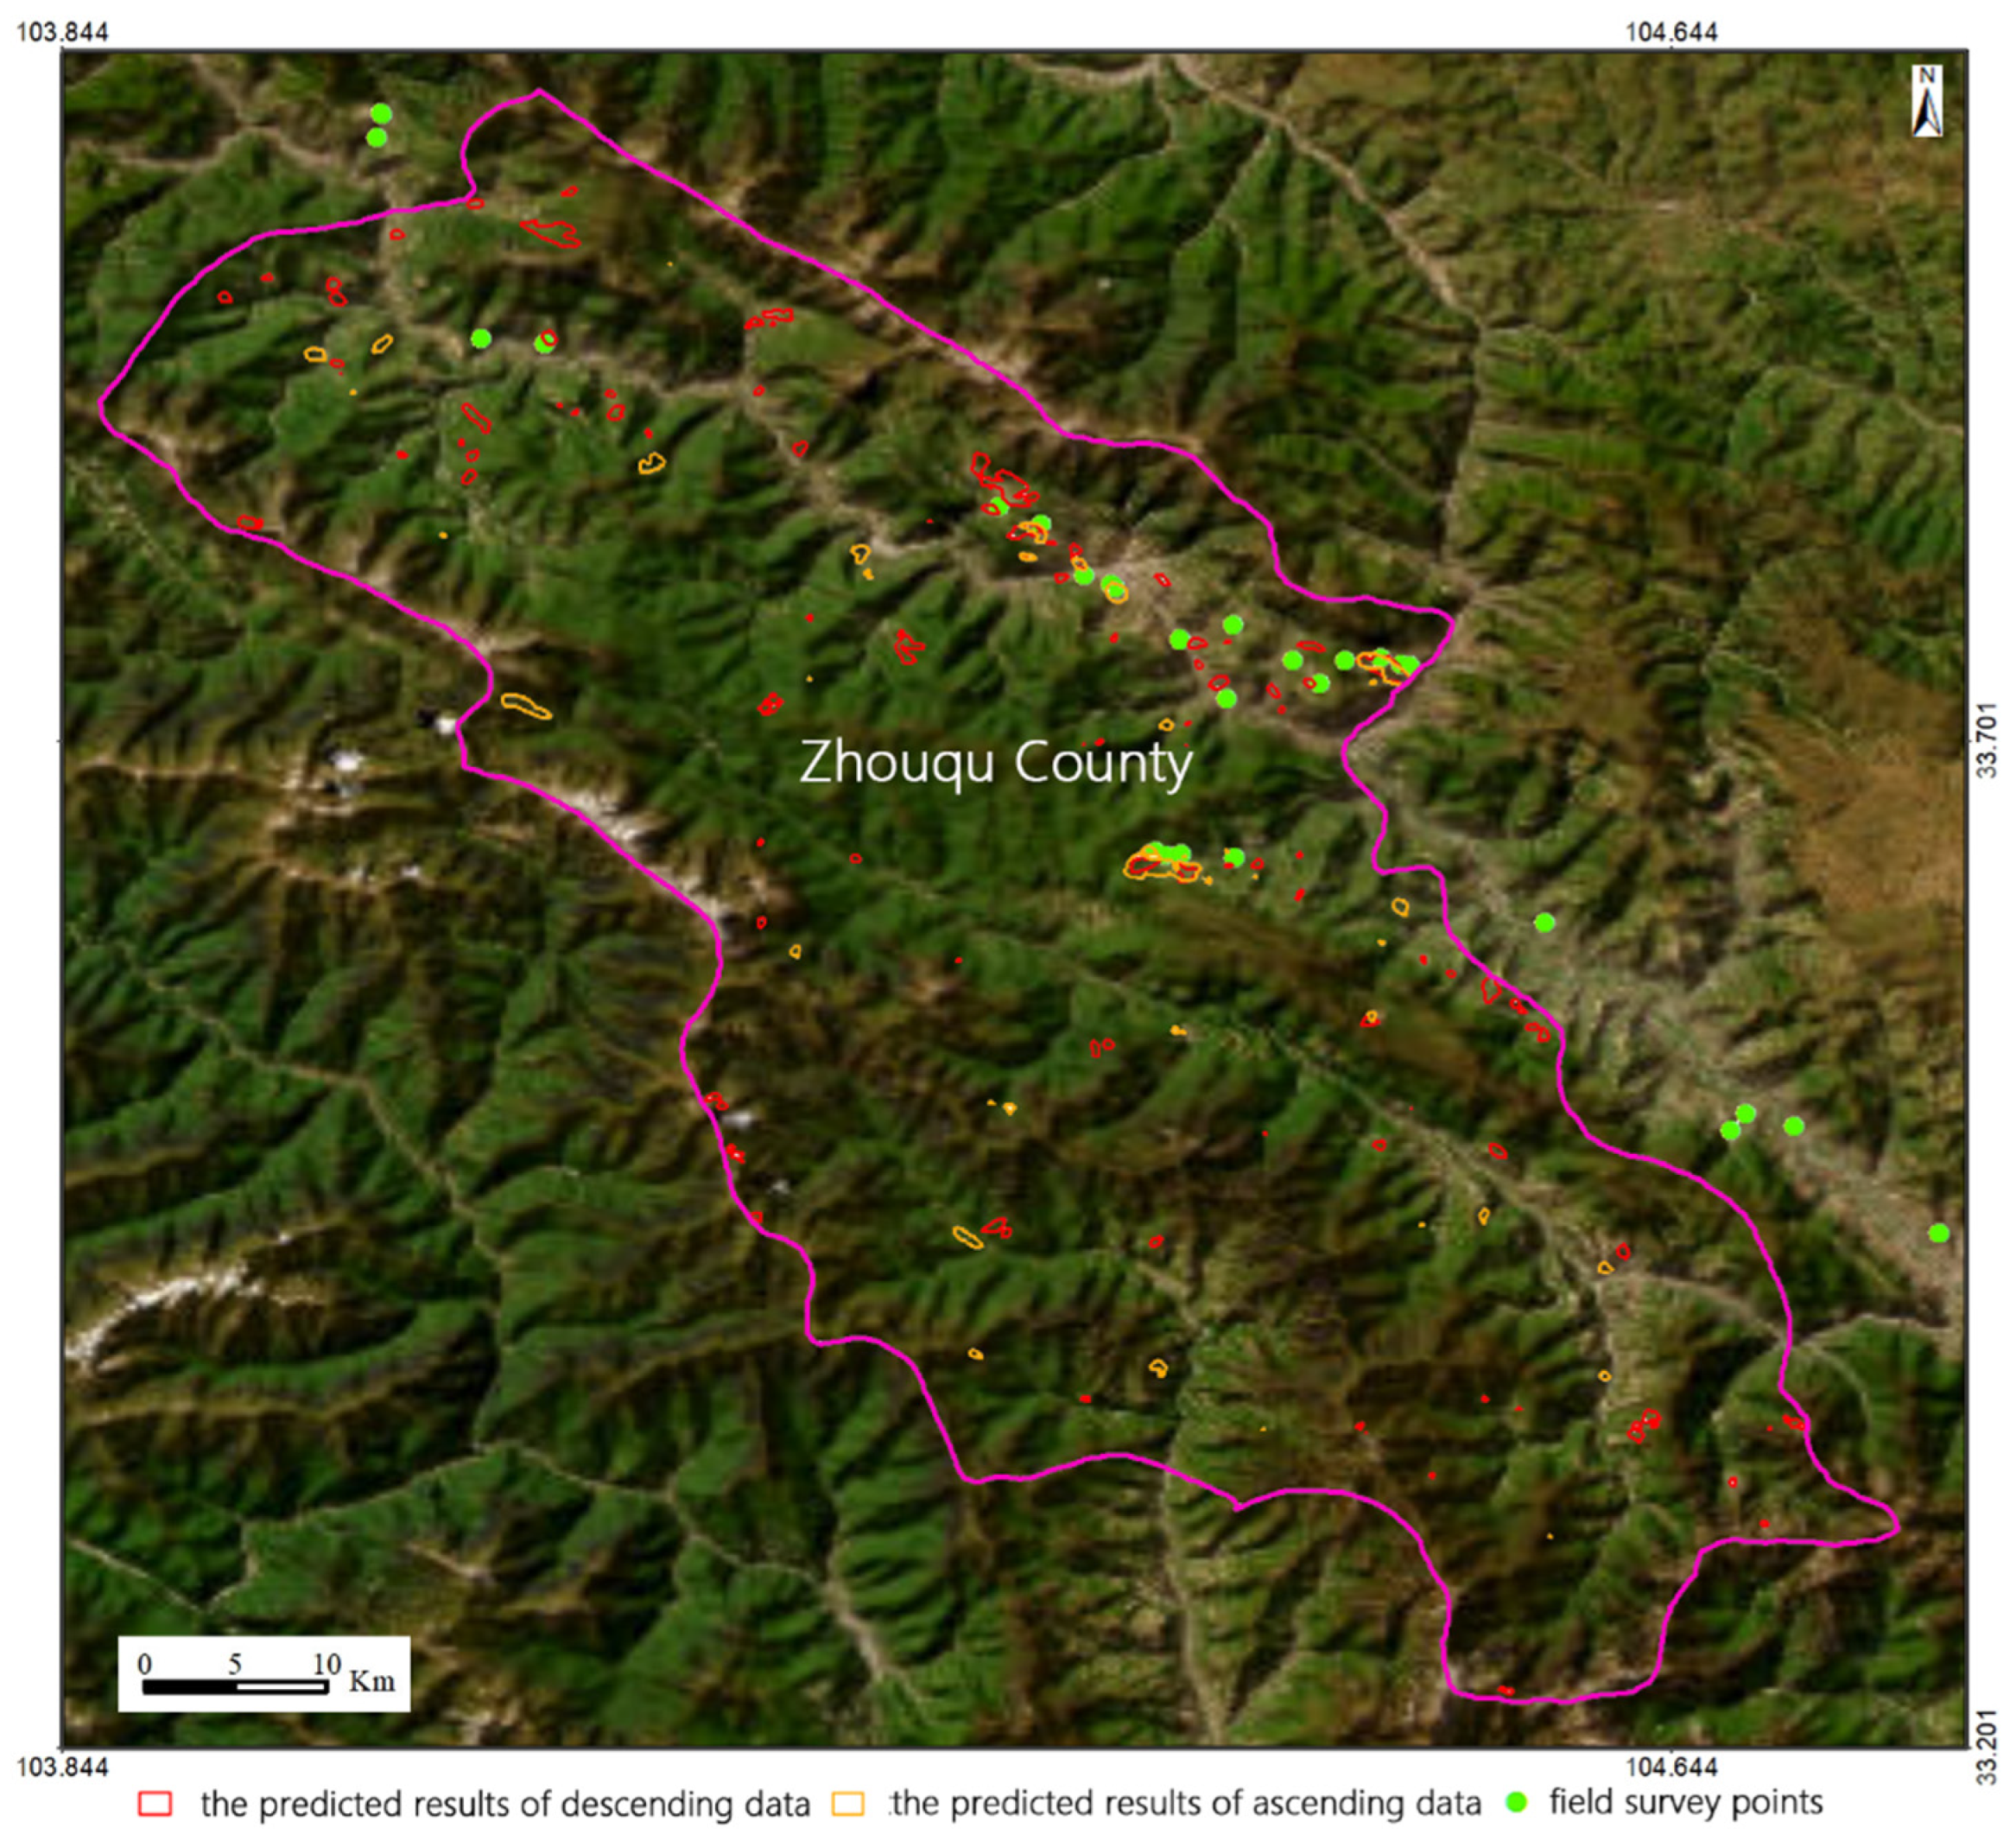
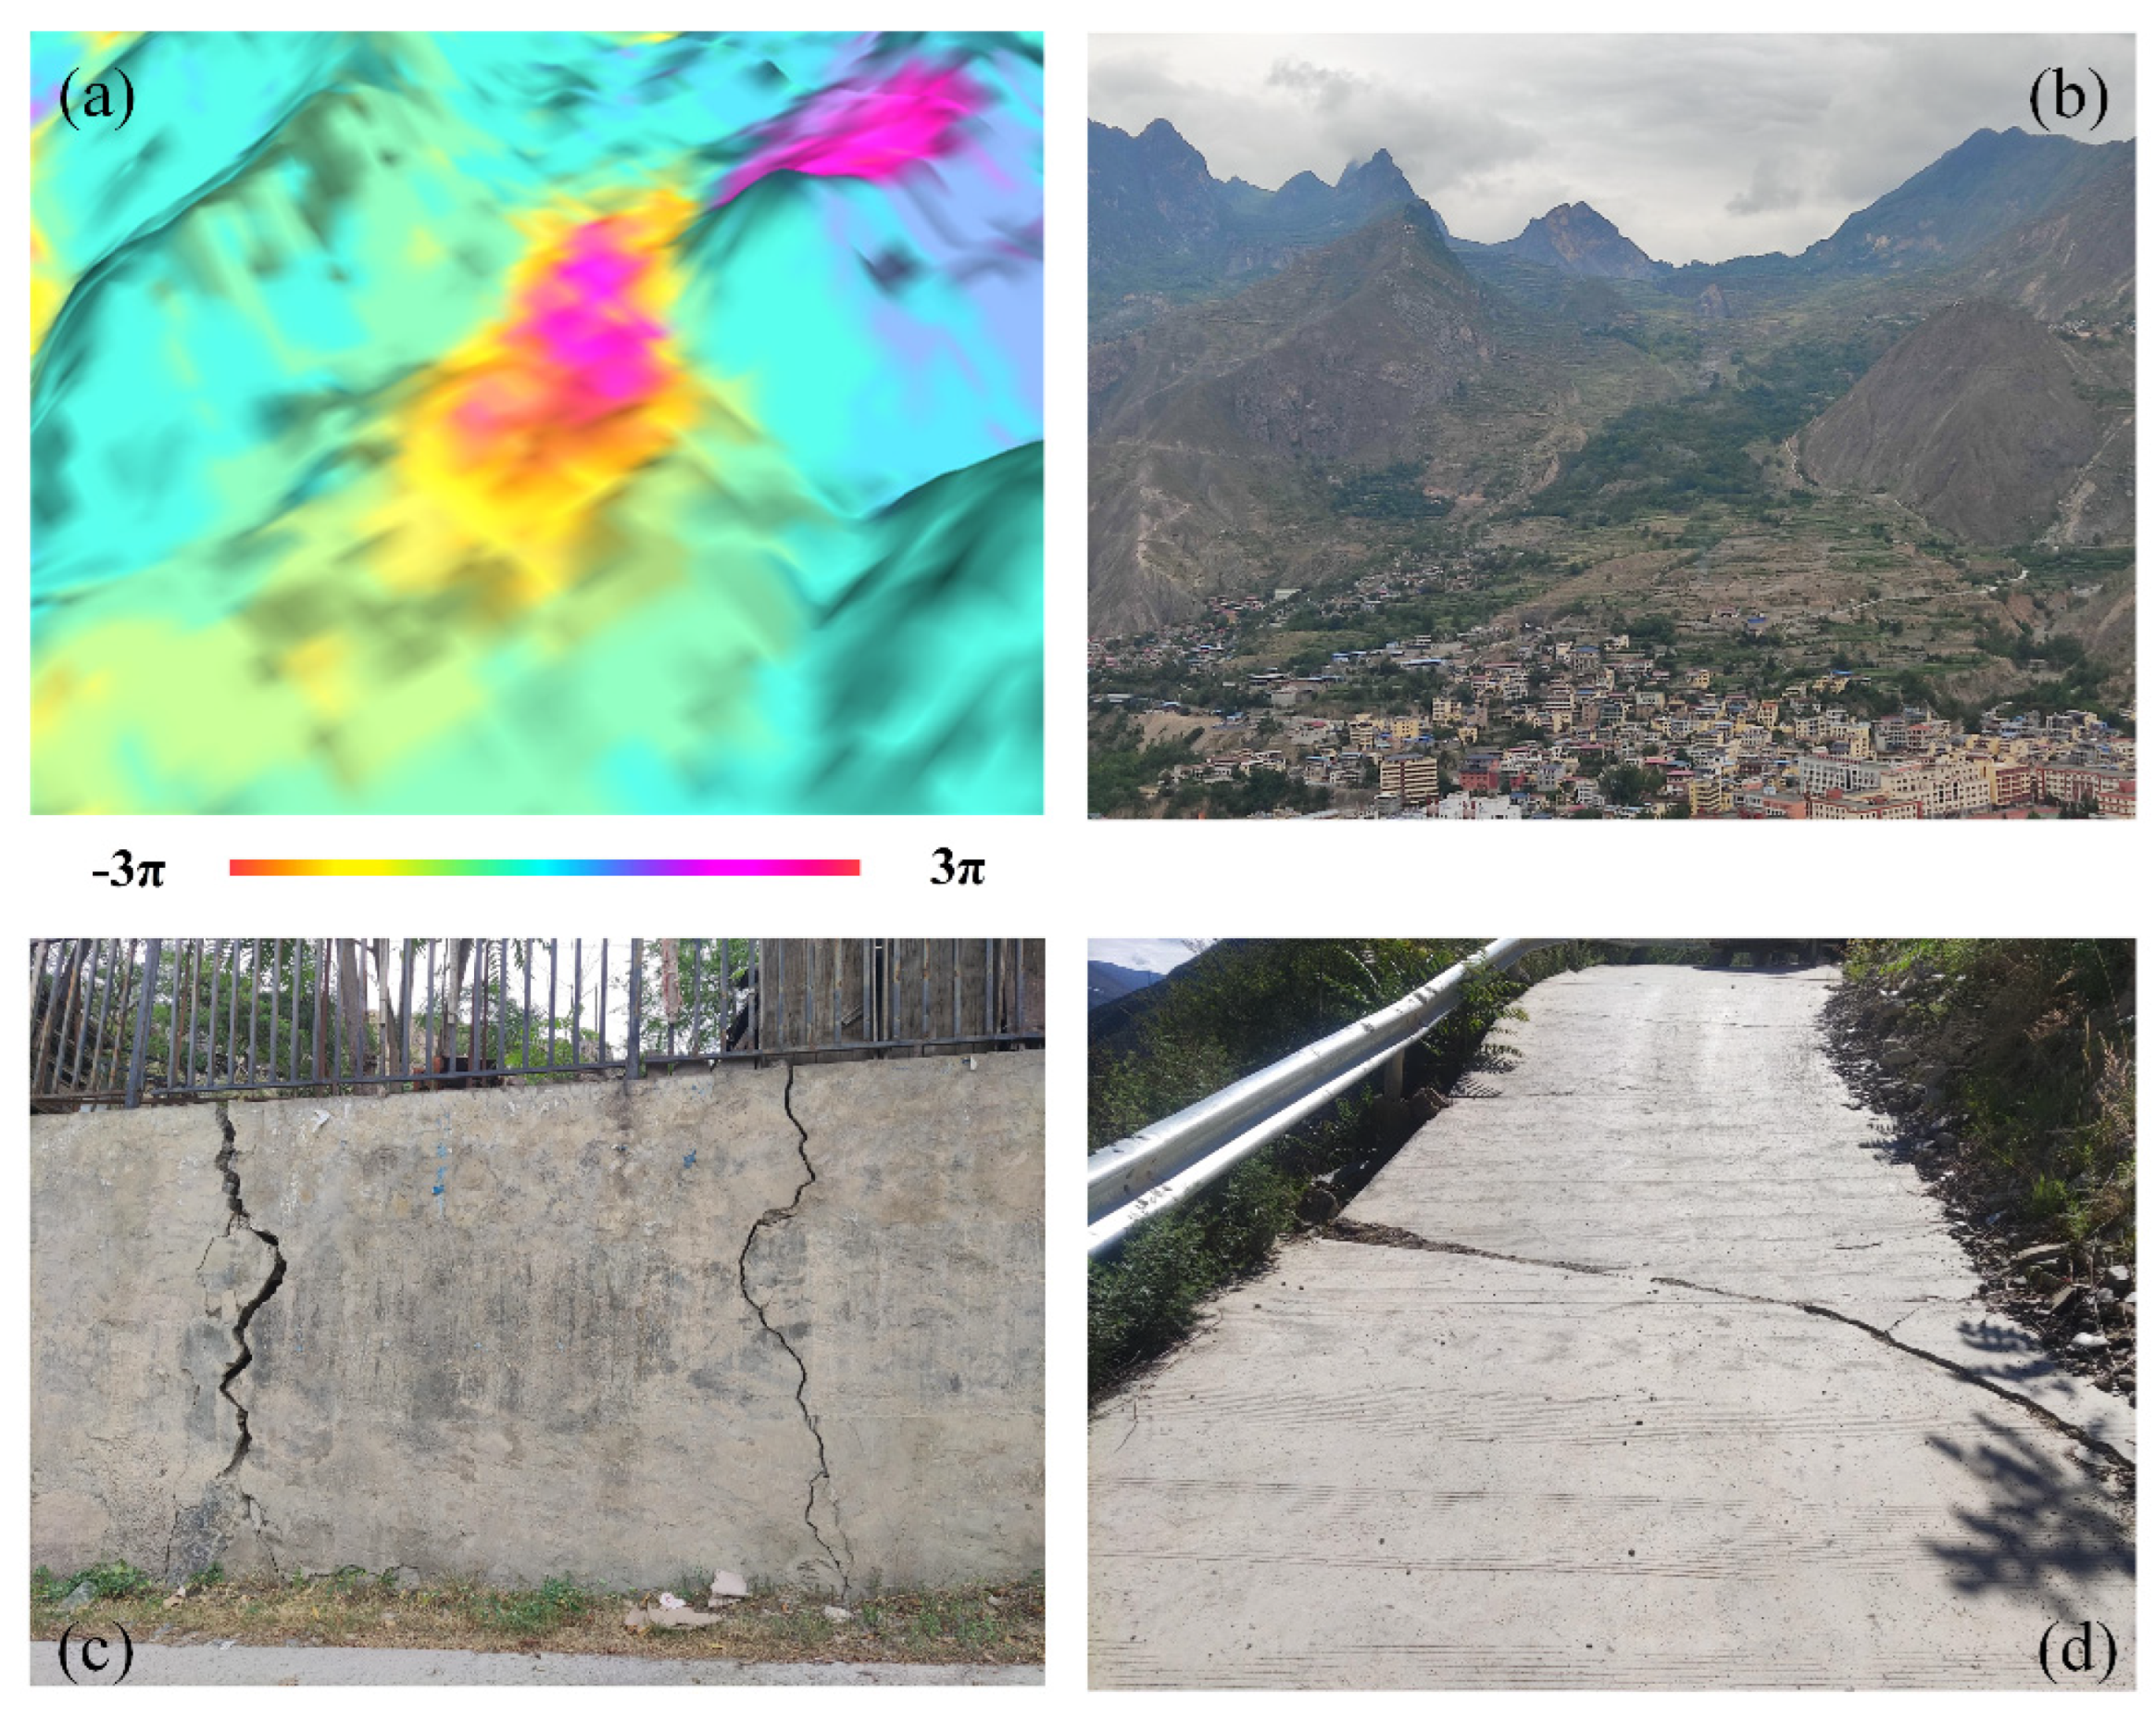
We further chose Zhouqu County to show the distributions of the active deformation areas. The predicted results of Zhouqu County are shown in Figure 7 and Figure 8. The active deformation areas identified from descending data of Track 62 are displayed in red, and orange shows the ascending data of Track 55. In the field survey, we found that the predicted active deformation areas were basically consistent with the actual situation of potential landslides, and there were obvious signs of slope deformation and failure. In some places, there were obvious the signs of tensile cracks at the rear edge and side wall, road fault damage, and house wall cracking, as shown in Figure 9.
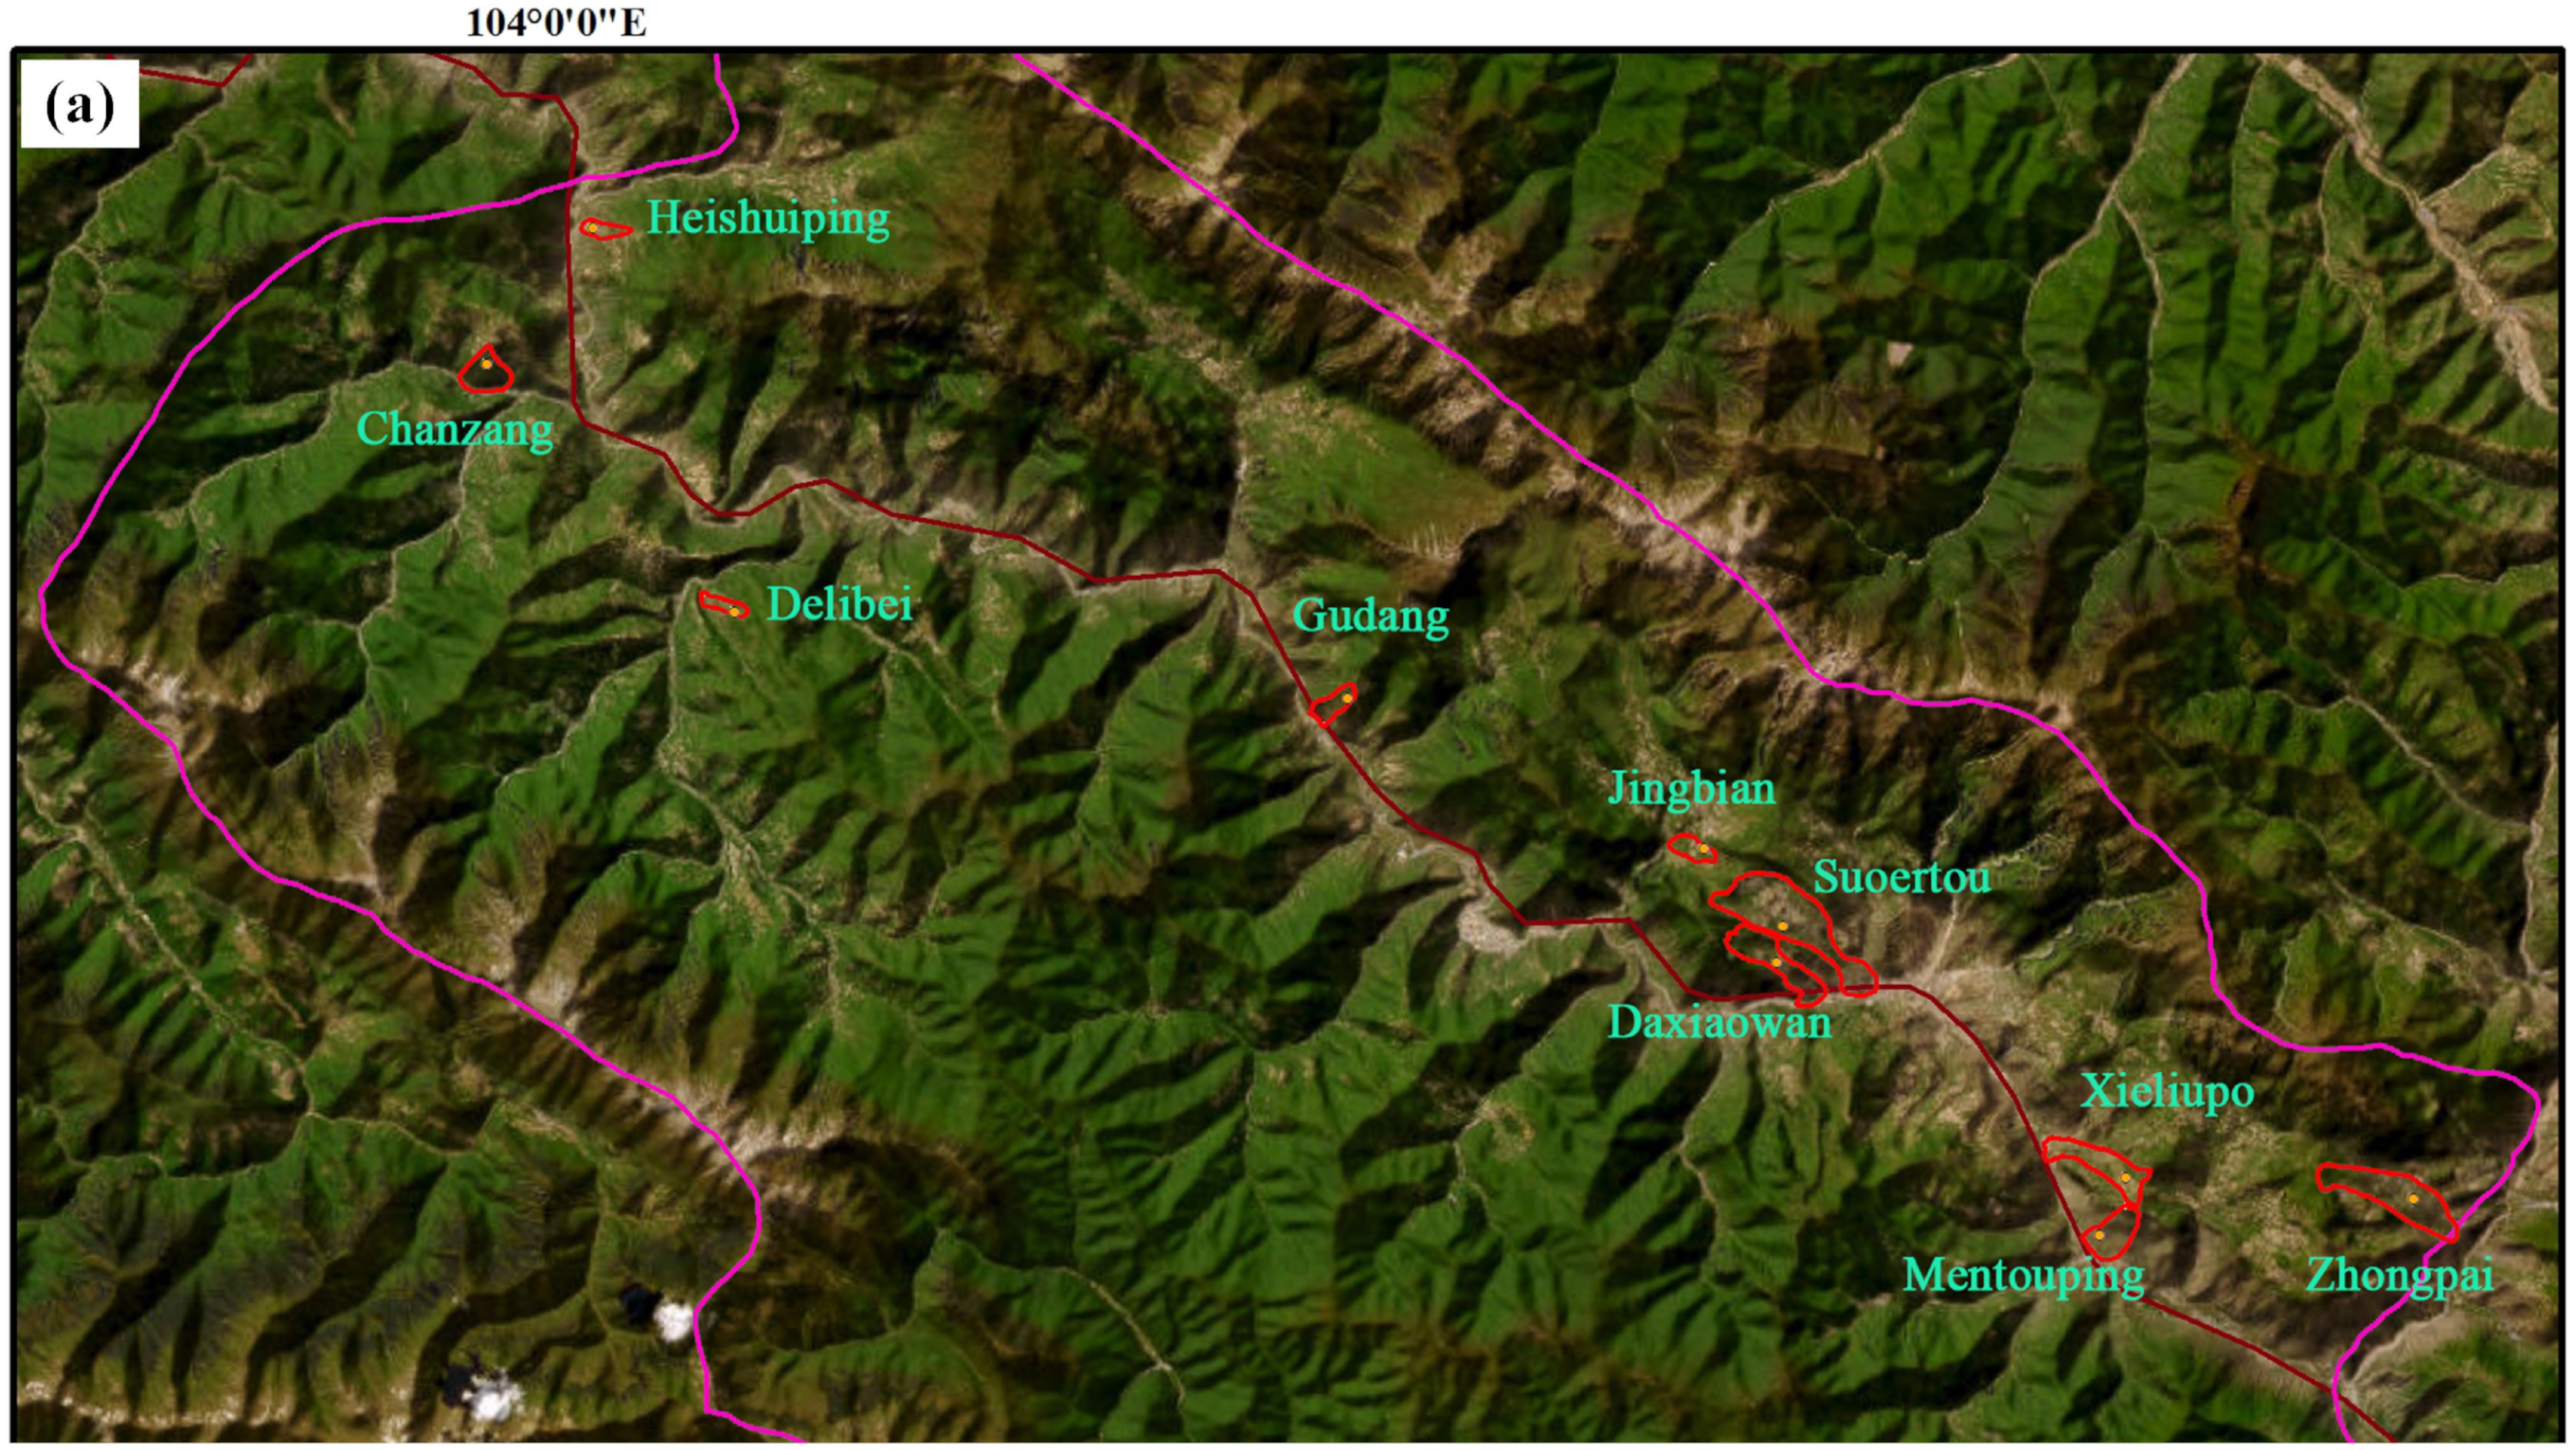
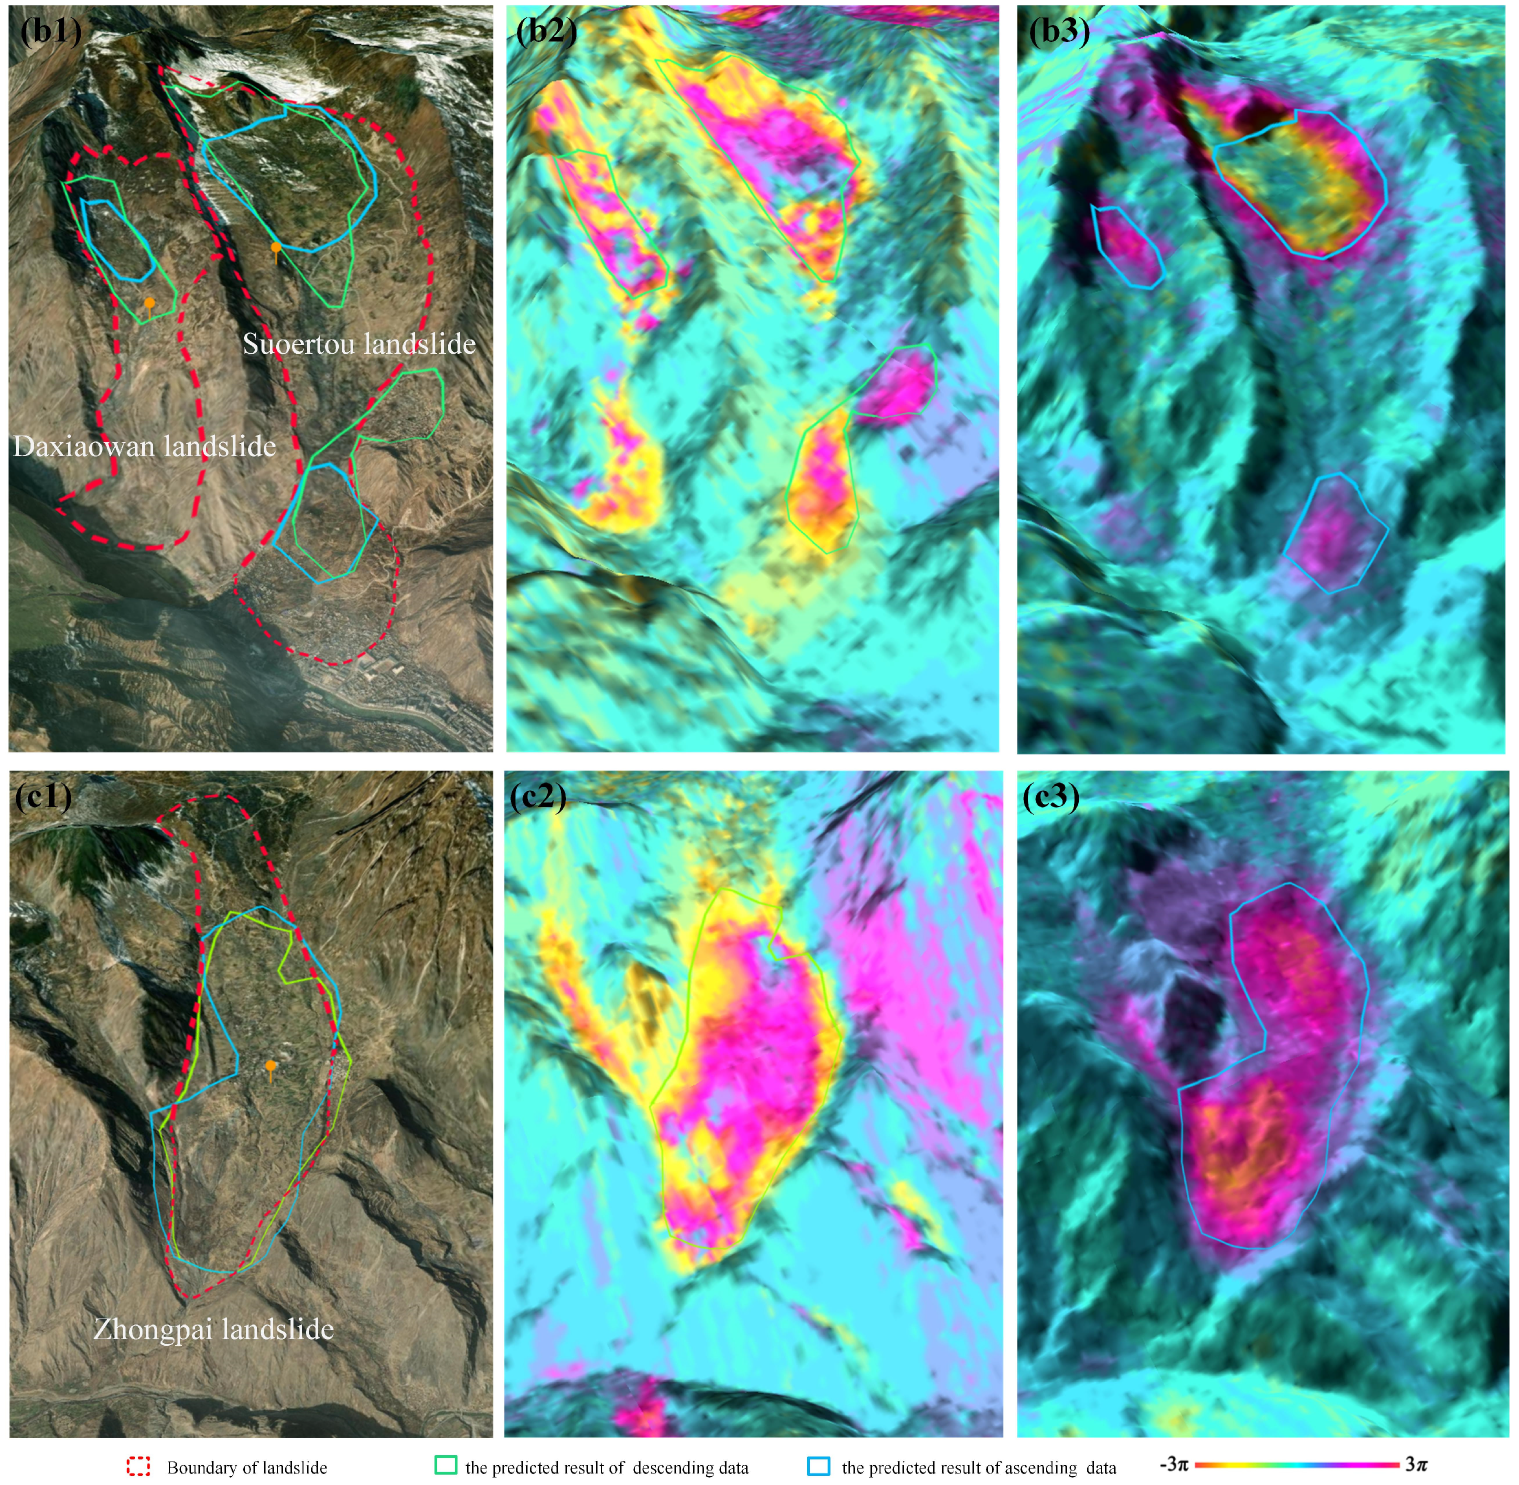
In the Zhouqu region, we detected 40 active deformation areas in the ascending data, while there were 112 active deformation areas in the descending data. Some of these deformation areas are located on the front, the middle, or the back edge of the landslides. By detecting these active deformation areas, we can find specific landslides or unstable slopes. Some larger landslides are also identified in the study, including the Suoertou, Daxiaowan, Xieliupo, Nanyumentouping, and Zhongpai landslides, all of which occurred along the Bailong River or the Min River. These landslides make up a pre-existing landslide inventory in the previous research [47,48,49,50,51]. The maximum deformation rates were detected to be greater than 136 mm/year. Active deformation areas of Suoertou, Daxiaowan, and Zhongpai landslides are auto-detected from both the ascending and descending data, as shown in Figure 10(b1–b3),(c1–c3). Green areas are identified as the active deformation areas from descending data, and blue areas are identified as the active deformation areas from ascending data in Figure 10. The largest active deformation area covers an area of 1.9 km2. Certain active fault, steeper topography, and intensive erosion of valleys may induce landslide formation and exhibit activity over several decades, resulting in the deterioration of roadways, settlements, and river damming on multiple occasions. The sustained deformation and huge volume pose a major threat to the development of these regions. Many anchor retaining walls have been set up in many places to stabilize the slopes.
Additionally, we also found other large landslides or slope instabilities, including Jingbian, Gudang, Heishuiping, Chanzang, and Delibei landslides, as shown in Figure 10a. The Jingbian landslide is situated behind the Suoertou landslides in Pingding Town. It was previously included in the landslide inventory. It exhibits a maximum rate of LOS displacement of 63 mm/year, and the distribution of the slope ranges from 15 to 40 degrees. The Gudang landslide is located in Hanban Town and exhibits a maximum LOS displacement rate of 46 mm/year, with a distribution of slope ranging between 27 and 60 degrees. The Heishuiping landslide, located along the Bailongjiang River, has a maximum LOS displacement rate of 69 mm per year, with a distribution of slope ranging between 25 and 50 degrees. The Chanzang landslide, located in Quwa Town, has a maximum LOS displacement rate of 86 mm/year, and the distribution of slope is from 30 to 56 degrees. Similarly, the Delibei landslide exhibits a maximum LOS rate of 96 mm/year, with slope angle distributed between 15 and 50 degrees. Introducing slope data helps to differentiate the active deformation area of the landslide and ground subsidence in the plain terrain.

4. Discussion

4.1. Omission of Active Deformation Areas from InSAR Technology

The research aimed at exploring a methodology to generate active deformation areas of potential landslide in remote mountainous areas. The methodology involves utilizing satellite InSAR images and deep learning technology to track ground deformation in expansive areas at regular intervals, typically every few days. We used ascending and descending images to identify the active deformation areas as far as possible because they have different imaging geometries. The ascending image is more effective for viewing slopes oriented to west aspect angles, while the descending image is more effective for viewing slopes oriented to east aspect angles. As shown in the results of Figure 7 and Figure 8, the active deformation area of potential landslides can be identified more efficiently within the observation conditions by utilizing both ascending and descending SAR images. This is consistent with previous research [44,52]. The special surveying method of the SAR system is side-looking imaging and, when the incidence angle of the SAR satellite is larger than the slope of the terrain in mountainous or complex terrain, layover and shadowing can occur, where certain areas are not fully illuminated by the SAR signal or are occluded by topographic features. This can affect the measurement of deformations in these areas. The factors mentioned can contribute to the omission of landslides in deformation results obtained from SAR satellite data.

4.2. Keys Affecting Identification Precision

For the activity characteristic of two types of data—the phase rate data and the LOS rate of surface deformation—we can see that the phase rate data can better describe the surface morphological characteristics of active deformation areas in the image visualization. This two-type combiner produces an enhanced effect that has better identification results than single data. Compared with the single-modal data, multi-data significantly improve the reliability of the identification results of significant deformation areas of geohazards. For the activity and topographic characteristic of two-type data producing the different identification results, in our study the topographical information—DEM and slope—did improve the results, and the slope data were especially useful. This is consistent with the understanding that topographic characteristics play a significant role in landslide occurrence. Steep slopes are often associated with increased landslide activity, and utilizing slope data can be beneficial for identifying areas prone to landslides. This is different from the conclusions of the study by [36] in which the DEM information did not improve the results. This result is partially in agreement with the report by [37], where the optical images by incorporating the DEM data showed significant improvement for landslide detection. The fused topographic characteristic information can reduce misclassified and omitted scores of the active deformation area, indicating that there is a strong relationship between the development process and distribution characteristics of potential geohazards. The topographical information is useful to improve the detection accuracy in the study and test region.

4.3. Comparison Methods of Identifying Related Landslides

It is worth mentioning that this one-step strategy implementation based on the fusion of topographical data can facilitate automated pipelines for the active deformation areas of potential landslide maps. The authors of [6] semi-automatically used a two-step strategy to detect active deformation areas by PS-InSAR technology, then classified landslide and subsidence of deformation phenomena by combining some additional data sources used in this process including the landslide inventory map, the vector map of urban areas, and topographic data. The authors of [44] developed a novel method to automatically detect slow-moving landslides based on phase-gradient stacking and the YOLOv3 model. However, it should be noted that this method may encounter challenges in distinguishing local subsidence areas, as these areas can exhibit similar gradient patterns in flat terrains. In the study, we solved this problem in one stage by introducing topographical data, differentiating the active deformation area of landslide and ground subsidence in the plain terrain.
Compared with the backbone network VGG16, the backbone network ResNet-50 with the adjustments of bottleneck and network depth had better performance for training and test datasets. The authors of [38] reported that a well-performing CNN is characterized by achieving a high F1 score, with balanced precision and recall scores. The authors of [42] automatically identified co-seismic landslides by using the ENVI Deep Learning Module, which is based on the U-Net model. Though the result is good in terms of the F1 score (0.83), the process of sample generation, model building, training, and landslide extraction heavily depends on the functions of the software, leading to inflexibility in landslide detection. This reliance on the software’s functions limits the adaptability and versatility of the approach for landslide identification. The authors of [53] employed Mask R-CNN to accurately extract landslides with a high F1 score of 89.09%. Mask R-CNN is a two-stage detection algorithm that first identifies target candidate boxes and then conducts classification on these candidate boxes. This method exhibits high accuracy with the same dataset; however, it demonstrates lower execution efficiency compared to one-stage algorithms. Our proposed method is a simple generalized convolutional neural network and one-stage algorithm that will improve IOU1, precision, recall, and F1 scores. CNNs excel at extracting expert knowledge from the training dataset, identifying active deformation of slopes.

4.4. Limitations and Future Prospects

In the study, the proposed method demonstrated strong performance in mapping the active deformation areas of potential landslides within corresponding testing regions. The proposed CNN’s performance on new areas was the best with higher recall scores for large regions. But the phase fringes do not have obvious deformation, and there are misclassifications and omissions. Increasing the sample size may improve the accuracy in the future. The proposed method is unable to differentiate the active deformation area of collapses caused by mining on the mountain. We will solve the problem by setting negative samples or increasing attention mechanisms.
The identified active deformation areas only reflect the location of the deformation of slope, which may differ in spatial position from the slope shape observed in optical images, but this does not affect the recognition of slow-moving slopes. In particular, the active deformation areas of the largest landslides are unclear and undervalued, and they may cause major damage to infrastructure and result in thousands of casualties in the future. Therefore, mapping products of active deformation areas of potential landslides is helpful for disaster prevention and reduction management to manage potential disaster situations.

5. Conclusions

Large-scale monitoring of landslides and risk prevention in mountain regions are difficult and have high costs. The research builds a generalized CNN model to automatically identify the active deformation areas of potential landslides. We evaluated the effects of using similar network architectures and different backbone networks with different layers based on the same training and test data. The result shows that the performance of the proposed model was better with a high F1 score of 97.41%. Application of the activity characteristics and topographic characteristics can improve the accuracy of identifying the active deformation area. We assessed the transferability of the model in the test region—Zhouqu County, We randomly selected 56 active deformation areas to confirm by field survey, with a high F1 score of 96.30%. Ten large landslides are also found in the study, i.e., the Suoertou, Daxiaowan, Xieliupo, Nanyumentouping, Zhongpai, and Jingbian landslides. The proposed CNN is a generalized convolutional neural network and simple. The proposed one-step strategy aims to streamline the implementation process by enabling automated pipelines for mapping and updating active deformation areas of potential landslides. The methodology is quite robust, and it can be used for detecting active deformation areas in new or unknown regions. The product of the active deformation area can clearly show the inventories of active and potential geohazards for the general public user. This information is particularly valuable for supporting infrastructure management.

Author Contributions

Conceptualization, D.G. and J.Y.; methodology, Q.W.; software, Y.M., Y.C., X.W. and L.Z. (Li Zhang); validation, Q.W., X.W. and Y.W.; formal analysis, Q.W.; investigation, Y.M., X.W. and Y.W.; resources, L.Z. (Ling Zhang); data curation, L.Z. (Ling Zhang); writing—original draft preparation, Q.W.; writing—review and editing, Q.W., L.Z. (Ling Zhang), and L.Z. (Li Zhang); visualization, Q.W. and Y.C.; supervision, J.Y.; project administration, J.Y.; funding acquisition, D.G. All authors have read and agreed to the published version of the manuscript.

Funding

This research was funded by the National Key Research and Development Program of China, grant number 2021YFC3000400, and Integrated Remote Sensing Identification of Potential Geological Hazards, program number DD20230083, and the Key Laboratory of Airborne Geophysics and Remote Sensing Geology Foundation, program number 2023YFL17.

Data Availability Statement

The data are available on request from the corresponding author.

Acknowledgments

The authors want to thank the ESA for providing the satellite radar data.

Conflicts of Interest

The authors declare no conflicts of interest.

References

  1. Guzzetti, F.; Mondini, A.C.; Cardinali, M.; Fiorucci, F.; Santangelo, F.; Chang, K.T. Landslide inventory maps: New tools for an old problem. Earth Sci. Rev. 2012, 112, 42–66. [Google Scholar] [CrossRef]
  2. Heim, A. Landslides and Human Lives (Bergsturz and Menschenleben); Skermer, N., Ed.; Bi-Tech Publishers: Vancouver, BC, Canada, 1932; p. 196. [Google Scholar]
  3. Hungr, O.; Leroueil, S.; Picarelli, L. The Varnes classification of landslide types, an update. Landslides 2014, 11, 167–194. [Google Scholar] [CrossRef]
  4. Cai, J.; Zhang, L.; Dong, J.; Dong, X.; Li, M.; Xu, Q.; Liao, M. Detection and characterization of slow-moving landslides in the 2017 jiuzhaigou earthquake area by combining satellite sar observations and airborne lidar dsm. Eng. Geol. 2022, 305, 106730. [Google Scholar] [CrossRef]
  5. Lacroix, P.; Handwerger, A.L.; Bièvre, G. Life and Death of Slow-Moving Landslides. Nat. Rev. Earth Environ. 2020, 1, 404–419. [Google Scholar] [CrossRef]
  6. Tomas, R.; José, I.P.; José, A.N.; Cano, M.; Pastor, J.L.; Riquelme, A.; Cuevas-González, M.; Crosetto, M.; Barra, A.; Monserrat, O.; et al. Semi-Automatic Identification and Pre-Screening of Geological-Geotechnical Deformational Processes Using Persistent Scatterer Interferometry Datasets. Remote Sens. 2019, 11, 1675. [Google Scholar] [CrossRef]
  7. Mondini, A.C.; Guzzetti, F.; Chang, K.T.; Monserrat, M.; Martha, T.R.; Manconi, A. Landslide failures detection and mapping using Synthetic Aperture Radar: Past, present and future. Earth-Sci. Rev. 2021, 216, 103574. [Google Scholar] [CrossRef]
  8. Xu, Q.; Zhao, B.; Dai, K.; Dong, X.; Li, W.; Zhu, X.; Yang, Y.; Xiao, X.; Wang, X.; Huang, J.; et al. Remote sensing for landslide investigations: A progress report from China. Eng. Geol. 2023, 323, 107156. [Google Scholar] [CrossRef]
  9. Rose, N.D.; Hungr, O. Forecasting potential rock slope failure in open pit mines using the inverse velocity method. Int. J. Rock Mech. Min. Sci. 2007, 44, 308–320. [Google Scholar] [CrossRef]
  10. Guo, Z.; Chen, L.; Gui, L.; Du, J.; Yin, K.; Do, H.M. Landslide displacement prediction based on variational mode decomposition and WA-GWO-BP model. Landslides 2019, 17, 567–583. [Google Scholar] [CrossRef]
  11. Merlin, A.B.; Solarte, A.; Bellis, L.M.; Carignano, C.; Argaaraz, J.P. DInSAR and statistical modeling to assess landslides: The case study of Sierras Chicas (central Argentina). J. S. Am. Earth Sci 2021, 108, 103179. [Google Scholar] [CrossRef]
  12. Colesanti, C.; Ferretti, A.; Prati, C.; Rocca, F. Monitoring landslides and tectonic motions with the Permanent Scatterers Technique. Eng. Geol 2003, 68, 3–14. [Google Scholar] [CrossRef]
  13. Martire, D.D.; Tessitore, S.; Brancato, D.; Ciminelli, M.G.; Costabile, S.; Costantini, M.; Graziano, G.V.; Minati, F.; Ramondini, M.; Calcaterra, D. Landslide detection integrated system (LaDIS) based on in-situ and satellite SAR interferometry measurements. Catena 2015, 137, 406–421. [Google Scholar] [CrossRef]
  14. Bekaert, D.P.S.; Handwerger, A.L.; Agram, P.; Kirschbaum, D.B. InSAR-based detection method for mapping and monitoring slow-moving landslides in remote regions with steep and mountainous terrain: An application to Nepal. Remote Sens. Environ. 2020, 249, 111983. [Google Scholar] [CrossRef]
  15. Li, L.; Wen, B.; Yao, X.; Zhou, Z.; Zhu, Y. InSAR-based method for monitoring the long-time evolutions and spatial-temporal distributions of unstable slopes with the impact of water-level fluctuation: A case study in the Xiluodu reservoir. Remote Sens. Environ. 2023, 295, 113686. [Google Scholar] [CrossRef]
  16. Lanari, R.; Mora, O.; Manunta, M.; Mallorquí, J.J.; Berardino, P.; Sansosti, E. A small-baseline approach for investigating deformation on full-resolution differential SAR interferograms. IEEE Trans. Geosci. Remote Sens. 2004, 42, 1377–1386. [Google Scholar] [CrossRef]
  17. Bianchini, S.; Cigna, F.; Righini, G.; Proietti, C.; Casagli, N. Landslide hotspot mapping by means of persistent scatterer interferometry. Environ. Earth Sci. 2012, 67, 1155–1172. [Google Scholar] [CrossRef]
  18. Calò, F.; Ardizzone, F.; Raffaele, C.; Piernicola, L.; Pietro, T.; Fausto, G.; Riccardo, L.; Maceo, G.A.; Fabrizio, P.; Michele, M. Enhanced landslide investigations through advanced DInSAR techniques: The Ivancich case study, Assisi, Italy. Remote Sens. Environ. 2014, 142, 69–82. [Google Scholar] [CrossRef]
  19. Shi, X.; Yang, C.; Zhang, L.; Jiang, H.; Liao, M.; Zhang, L.; Liu, X. Mapping and characterizing displacements of active loess slopes along the upstream yellow river with multi-temporal InSAR datasets. Sci. Total Environ. 2019, 674, 200–210. [Google Scholar] [CrossRef] [PubMed]
  20. Singh, S.; Raju, A.; Banerjee, S. Detecting slow-moving landslides in parts of Darjeeling-Sikkim Himalaya, NE India: Quantitative constraints from PS InSAR and its relation to the structural discontinuities. Landslides 2022, 19, 2347–2365. [Google Scholar] [CrossRef]
  21. Roy, P.; Martha, T.R.; Khanna, K.; Jain, N.; Kumar, K.V. Time and path prediction of landslides using insar and flow model. Remote Sens. Environ. 2022, 271, 112899. [Google Scholar] [CrossRef]
  22. Barra, A.; Solari, L.; Béjar-pizarro, M.; Monserrat, O.; Bianchini, S.; Herrera, G.; Crosetto, M.; Sarro, R.; Gonzalez-alonso, E.; Mateos, R.M.; et al. A methodology to detect and update active deformation areas based on sentinel-1 sar images. Remote Sens. 2017, 9, 1002. [Google Scholar] [CrossRef]
  23. Navarro, J.A.; María, C.; Roberto, T.; Anna, B.; Michele, C. Automating the Detection and Classification of Active Deformation Areas-A Sentinel-Based Toolset. Proceedings 2019, 19, 15. [Google Scholar]
  24. Navarro, J.; Tomás, R.; Barra, A.; Pagán, J.; Reyes-Carmona, C.; Solari, L.; Lopez Vinielles, J.; Falco, S.; Crosetto, M. ADA tools: Automatic Detection and Classification of Active Deformation Areas from PSI Displacement Maps. Int. J. Geo-Inf. 2020, 9, 584. [Google Scholar] [CrossRef]
  25. Schwegmann, C.P.; Kleynhans, W.; Engelbrecht, J.; Mdakane, L.W.; Meyer, R.G. Subsidence feature discrimination using deep convolutional neural networks in synthetic aperture radar imagery. In Proceedings of the 2017 IEEE International Geoscience and Remote Sensing Symposium (IGARSS), Fort Worth, TX, USA, 23–28 July 2017; pp. 4626–4629. [Google Scholar]
  26. Anantrasirichai, P.; Biggs, J.; Albino, F.; Hill, P.; Bull, D. Application of machine learning to classification of volcanic deformation in routinely generated InSAR data. J. Geophys. Res. Solid Earth 2018, 123, 6592–6606. [Google Scholar] [CrossRef]
  27. Rotter, P.; Muron, W. Automatic detection of subsidence troughs in SAR interferograms based on convolutional neural networks. IEEE Trans. Geosci. Remote Sens. 2021, 18, 82–86. [Google Scholar] [CrossRef]
  28. Wu, Z.; Wang, T.; Wang, Y.; Wang, R.; Ge, D. Deep Learning for the Detection and Phase Unwrapping of Mining-Induced Deformation in Large-Scale Interferograms. IEEE Trans. Geosci. Remote Sens. 2022, 60, 21532879. [Google Scholar] [CrossRef]
  29. Wang, J.; Chen, G.; Jaboyedoff, M.; Derron, M.H.; Li, F.; Li, H.; Luo, X. Loess landslides detection via a partially supervised learning and improved Mask-RCNN with multi-source remote sensing data. CATENA 2023, 231, 107371. [Google Scholar] [CrossRef]
  30. Jiang, S.; Wen, B.; Zhao, C.; Li, R.; Li, Z. Kinematics of a giant slow-moving landslide in northwest china: Constraints from high resolution remote sensing imagery and GPSmonitoring. J. Asian Earth Sci. 2016, 123, 34–46. [Google Scholar] [CrossRef]
  31. Xiang, L.; Handwerger, A.L.; Giuseppe, B. Viscoplastic modelling of rainfall-driven slow-moving landslides: Application to california coast ranges. Landslides 2023, 123, 34–46. [Google Scholar]
  32. Cook, M.E.; Brook, M.S.; Hamling, I.J.; Murry, C.; Tunnicliffe, J.F.; Rachel, H. Investigating slow-moving shallow soil landslides using sentinel-1 insar data in gisborne, new zealand. Landslides 2023, 20, 1101–1113. [Google Scholar] [CrossRef]
  33. Du, J.; Li, Z.; Song, C.; Zhu, W.; Ji, Y.; Zhang, C.; Chen, B.; Su, S. InSAR-based active landslide detection and characterization along the upper reaches of the Yellow River. IEEE J. Sel. Top. Appl. Earth Obs. Remote Sens. 2023, 16, 3819–3830. [Google Scholar] [CrossRef]
  34. Zhang, L.L.; Dai, K.R.; Deng, J.; Ge, D.Q.; Liang, R.B.; Li, W.L.; Xu, Q. Identifying Potential Landslides by Stacking-InSAR in Southwestern China and Its Performance Comparison with SBAS-InSAR. Remote Sens. 2021, 13, 3662. [Google Scholar] [CrossRef]
  35. Yu, H.; Ma, Y.; Wang, L.; Wang, X. A landslide intelligent detection method based on CNN and RSG_R. In Proceedings of the 2017 IEEE International Conference on Mechatronics and Automation (ICMA), Takamatsu, Japan, 6–9 August 2017. [Google Scholar]
  36. Ghorbanzadeh, O.; Blaschke, T.; Gholamnia, K.; Meena, S.R.; Tiede, D.; Aryal, J. Evaluation of Different Machine Learning Methods and Deep-Learning Convolutional Neural Networks for Landslide Detection. Remote Sens. 2019, 11, 196. [Google Scholar] [CrossRef]
  37. Ji, S.; Yu, D.; Shen, C.; Li, W.; Xu, Q. Landslide detection from an open satellite imagery and digital elevation model dataset using attention boosted convolutional neural networks. Landslides 2020, 17, 1337–1352. [Google Scholar] [CrossRef]
  38. Qin, S.; Guo, X.; Sun, J.; Qiao, S.; Zhang, L.; Yao, J.; Cheng, Q.; Zhang, Y. Landslide Detection from Open Satellite Imagery Using Distant Domain Transfer Learning. Remote Sens. 2021, 13, 3383. [Google Scholar] [CrossRef]
  39. Nikhil, P.; Andrea, M.; Simon, L. A new strategy to map landslides with a generalized convolutional neural network. Sci. Resports 2021, 11, 9722. [Google Scholar]
  40. Yu, B.; Xu, C.; Chen, F.; Wang, N.; Wang, L. HADeenNet: A hierarchical-attention multi-scale deconvolution network for landslide detection. Int. J. Appl. Earth Obs. Geoinf. 2022, 111, 102853. [Google Scholar] [CrossRef]
  41. Han, W.; Zhang, X.; Wang, Y.; Wang, L.; Huang, X.; Li, J.; Wang, S.; Chen, W.; Li, X.; Feng, R.; et al. A survey of machine learning and deep learning in remote sensing of geological environment: Challenges, advances, and opportunities. ISPRS J. Photogramm. Remote Sens. 2023, 202, 87–113. [Google Scholar] [CrossRef]
  42. Zhang, P.; Xu, C.; Ma, S.; Shao, X.; Wen, B. Automatic extraction of seismic landslides in large areas with complex environments based on deep learning: An example of the 2018 iburi earthquake, Japan. Remote Sens. 2020, 12, 3992. [Google Scholar] [CrossRef]
  43. Wu, Z.; Li, H.; Yuan, S.; Gong, Q.; Wang, J.; Zhang, B. Mask R-CNN–Based Landslide Hazard Identification for 22.6 Extreme Rainfall Induced Landslides in the BeijiangRiver Basin, China. Remote Sens. 2023, 15, 4898. [Google Scholar] [CrossRef]
  44. Fu, L.; Wang, T.; Zhang, Q.; Wang, T.; Li, W.; Xu, Q.; Ge, D. Detecting slow-moving landslides using InSAR phase-gradient stacking and deep-learning network. Front. Environ. Sci. 2022, 10, 963322. [Google Scholar] [CrossRef]
  45. De Zan, F.; Guarnieri, A.M. TOPSAR: Terrain Observation by Progressive Scans. IEEE Trans. Geosci. Remote Sens. 2006, 44, 2352–2360. [Google Scholar] [CrossRef]
  46. GAMMA_SOFTWARE-20201211. Available online: https://www.gamma-rs.ch/software (accessed on 1 March 2024).
  47. Li, M.; Zhang, L.; Yang, M.; Liao, M. Complex Surface Displacements of the Nanyu Landslide in Zhouqu, China Revealed by Multi-platform InSAR Observations. Eng. Geol. 2022, 317, 107069–107085. [Google Scholar] [CrossRef]
  48. Jin, J.; Chen, G.; Meng, X.; Zhang, Y.; Shi, W.; Li, Y.; Yang, Y.; Jiang, W. Prediction of river damming susceptibility by landslides based on a logisticregression model and InSAR techniques: A case study of the Bailong River Basin, China. Eng. Geol. 2022, 299, 106562. [Google Scholar] [CrossRef]
  49. Qi, T.; Meng, X.; Qing, F.; Zhao, Y.; Shi, W.; Chen, G.; Zhang, Y.; Li, Y.; Yue, D.; Su, X.; et al. Distribution and characteristics of large landslides in a fault zone: A case study of the NE Qinghai-Tibet Plateau. Geomorphology 2021, 379, 107592. [Google Scholar] [CrossRef]
  50. Wang, Y.; Cui, X.; Che, Y.; Li, P.; Jiang, Y.; Peng, X. Automatic Identification of Slope Active Deformation Areas in the Zhouqu Region of China with DS-InSAR Results. Front. Environ. Sci. 2022, 10, 883427. [Google Scholar] [CrossRef]
  51. Zhang, Y.; Meng, X.; Jordan, C.; Novellino, A.; Dijkstra, T.; Chen, G. Investigating slow-moving landslides in the Zhouqu region of China using InSAR time series. Landslides 2018, 15, 1299–1315. [Google Scholar] [CrossRef]
  52. Liu, X.; Zhao, C.; Zhang, Q.; Zhong, L.; Li, Z.; Yang, C.; Zhu, W.; Liu, Z.; Chen, L.; Liu, C. Integration of Sentinel-1 and ALOS/PALSAR-2 SAR datasets for mapping active landslides along the Jinsha River corridor, China. Eng. Geol. 2021, 284, 106033. [Google Scholar] [CrossRef]
  53. Yang, R.L.; Zhang, F.; Xia, J.; Wu, C. Landslide Extraction Using Mask R-CNN with Background-Enhancement Method. Remote Sens. 2022, 14, 2206. [Google Scholar] [CrossRef]
Figure 1. Location of the study and test area, data coverage. (a) Location of the study area. (b) Location of the test area.
Remotesensing 16 01090 g001
Figure 2. The multi-source data. (a). The phase rate data (unit: radian/year). (b). The LOS rate of surface deformation (unit: m/year). (c). DEM (unit: m). (d). Slope (unit: degree).
Remotesensing 16 01090 g002
Figure 3. The structure of proposed convolutional neural network model.
Remotesensing 16 01090 g003
Figure 4. The network design of VCNN.
Remotesensing 16 01090 g004
Figure 5. Compared detection accuracy results of the proposed method and VCNN method based on the multi-source data.
Remotesensing 16 01090 g005
Figure 6. The predicted active deformation area (red) in Zhouqu, Wudu, and Diebu counties.
Remotesensing 16 01090 g006
Figure 7. The distribution of potential landslides (red and orange) and random field survey points in Zhouqu County.
Remotesensing 16 01090 g007
Figure 8. Identification of the active deformation areas in Zhouqu County using the pretrained model. (a) The active deformation areas (red) from descending data of Track 62. (b) The active deformation areas (orange) from ascending data of Track 55.
Remotesensing 16 01090 g008
Figure 9. The field survey of potential landslide. (a). Field point example in the phase data of surface deformation. (b). Correctly identified potential landslides. (c). The signs of tensile cracks in a house wall. (d). The signs of road damage.
Remotesensing 16 01090 g009
Figure 10. (a) The location of large landslides in Zhouqu County. (b1b3) Daxiaowan landslide and Suoertou landslide, (c1c3) Zhongpai landslide.
Remotesensing 16 01090 g010aRemotesensing 16 01090 g010b
Table 1. Main information of the Sentinel-1 datasets used in this study.
Path NumberImaging PeriodScene Numbers
128From 20 March 2017 to 24 January 2023230
62From 19 February 2017 to 19 January 2023346
33From 25 March 2017 to 24 December 2022 495
135From 20 March 2017 to 24 January 2023 308
Table 2. The multi-source data.
DataSpatial ResolutionData Resource
The phase rate data30 mAverage phase rate data
over the period of 2017–2022
The LOS rate of surface deformation30 mAverage LOS rate
over the period of 2017–2022
DEM30 mALOS WORLD 3D from the Japan Aerospace Exploration Agency
Slope30 mCalculated from DEM
Table 3. The network structure of left encoder.
StageInput SizeOperatorOut-Chs
1256 × 256Conv2d 7 ×   7
BatchNorm 2d
Relu
64
2128 × 128Maxpool 3 ×   3
Bottleneck × 3
256
364 × 64Bottleneck × 4512
432 × 32Bottleneck × 61024
516 × 16Bottleneck × 32048
Table 4. The network structure of right encoder.
StageInput SizeOperatorOut-Chs
1 8   ×   8
16 × 16
UpsamplingBilinear
Concatenate
C o n 2 d   3   ×   3 R e l u   ×   2
512
216 × 16
32 × 32
UpsamplingBilinear
Concatenate
C o n 2 d   3   ×   3 R e l u   ×   2
256
332 × 32
64 × 64
UpsamplingBilinear
Concatenate
C o n 2 d   3   ×   3 R e l u   ×   2
128
464 × 64
64 × 64
UpsamplingBilinear
Concatenate
C o n 2 d   3 × 3 R e l u   ×   2
64
564 × 64UpsamplingBilinear
C o n 2 d   3 × 3 R e l u   ×   2
256
Table 5. Analysis of the generalized CNN model based on the multi-source data.
Data TypeIOU1Precision (%)Recall (%)F1 (%)
The LOS rate of surface deformation54.6182.5761.7370.65
The phase rate data90.2595.5594.2194.88
The phase rate data and the LOS rate of surface deformation93.8897.4396.2796.85
The phase rate data and DEM93.6397.3996.0496.71
The phase rate data and slope94.0397.2696.5896.92
The phase rate data, DEM, and slope94.2397.3496.7297.03
The phase rate data, the LOS rate of surface deformation, DEM, and slope94.4997.4196.9397.41
Table 6. Analysis of the VCNN model based on the multi-source data.
Data TypeIOU1Precision (%)Recall (%)F1 (%)
The LOS rate of surface deformation51.0480.8258.0867.59
The phase rate data 71.8284.8482.483.6
The phase rate data and the LOS rate of surface deformation75.1788.5483.2885.83
The phase rate data and DEM75.2087.3684.3885.84
The phase rate data and slope75.8488.9683.7286.26
The phase rate data, DEM, and slope76.7588.285.5386.84
The phase rate data, the LOS rate of surface deformation, DEM, and slope84.5993.0990.2691.65
Disclaimer/Publisher’s Note: The statements, opinions and data contained in all publications are solely those of the individual author(s) and contributor(s) and not of MDPI and/or the editor(s). MDPI and/or the editor(s) disclaim responsibility for any injury to people or property resulting from any ideas, methods, instructions or products referred to in the content.