Abstract
The farming–pastoral zone in northern China is one of the most ecologically sensitive areas globally, having experienced extensive cropland abandonment and land reclamation over decades, primarily influenced by policy adjustment and global warming. However, the spatiotemporal patterns and suitability of long-term cropland change remain poorly understood. Using the annual China land cover dataset (CLCD), we provide a cropland abandonment and land reclamation mapping approach based on actual land use processes (rather than land cover conditions) to investigate spatiotemporal features of abandonment and reclamation and evaluate the rationality. Our findings show that: (1) Returning farmland to forest and grassland has been a clear trend in the study area over the past 30 years. Specifically, cropland use has undergone three phases of change, i.e., cropland contraction and expansion alternately (before 2000), followed by substantial abandonment (after 2000), and low-intensity reclamation (after 2010). (2) In the last decade, the intensity of the abandonment of cropland with high and moderate suitability is low. The rate of abandonment decreased, while the intensity of land reclamation was relatively high. The rate of the reclamation increased, and the spatial distribution of cropland tended to be reasonable. Our study emphasizes the importance of monitoring actual cropland changes based on land use processes, and this method can be effectively extended to regional or global long-term cropland monitoring.
1. Introduction
As one of the primary components of global environmental change, land use change dramatically affects the carbon cycle, ecosystem services, and human welfare [1,2]. Recently, many areas have restored cropland to natural ecosystems in response to climate change, while others have expanded cultivation to meet growing food needs [3]. The rational use of limited cropland resources, especially high-quality cropland for potential food supply, is essential to guarantee sustainable food security and harmonize with environmental change [4], particularly in China with a vast and growing population. As one of China’s most fragile eco-climatic zones, the northern farming–pastoral zone has undergone cropland abandonment and land reclamation over several decades [5,6]. There is evidence that irrational human activities induced by population growth and urbanization, such as overgrazing, have greatly altered the ecosystem of northern China, leading to severe desertification [7]. To alleviate environmental pressure, the Chinese government adjusted agricultural development policy and launched ecological projects of ecological restoration in the late 1990s, such as “Grain to Green” and “Beijing and Tianjin Sandstorm Source Treatment”, which restored large areas of sloping farmland and dry land to ecological use [8,9]. Therefore, monitoring the cropland dynamics and assessing suitability in the northern farming–pastoral zone is of great value for formulating more targeted land management policies and improving farmers’ livelihoods.
According to the definition provided by the United Nations Food and Agriculture Organization (FAO), cropland abandonment refers to the cessation of farming activities for at least 2–5 years, during which no evidence of cultivation is found and natural vegetation is restored. Land reclamation refers to the conversion of undeveloped land into agricultural land. However, because of the long-term lack of extensive observation data on abandonment and reclamation, the widely used land cover datasets basically do not contain the classification of abandoned or reclaimed land, which has led to fewer studies on the spatiotemporal patterns and extent of abandonment and reclamation in the northern farming–pastoral zone [10,11]. Furthermore, many Chinese researchers who rely on remote sensing technologies often evaluate cropland changes at discrete time points, instead of monitoring changes over a continuous period due to dataset update limitations that do not align with typical crop rotations [12,13]. Some studies use the annual change detection method to explore cropland abandonment or land reclamation [5,14]. Although the annual change detection method provides insight into recent land cover status, this information may differ from actual land use resulting from the cropping system. For instance, if the land is in natural cover at a particular time but is only in the crop rotation stage, then the land use type should still belong to cropland rather than natural vegetation. If classified according to natural land, it will overestimate the degree of abandonment in that year and the degree of reclamation in the subsequent year, mistakenly regarding “uncultivated” as “abandoned” or “completely returned to natural land”. Therefore, considering the land use situation contributes to correctly understanding the extent of cropland abandonment and land reclamation.
High-resolution and intensively observed land cover change (LCC) products can be used to analyze the trajectory of cropland change. For example, the classical Global Land Surface Satellite Global Land Cover (GLASS-GLC), Moderate Resolution Imaging Spectroradiometer Land Cover Type (MCD12Q1), and European Space Agency Climate Change Initiative (ESA CCI) products can reflect long-term land cover change at 5 km, 500 m, and 300 m resolutions, respectively. However, they all lack spatial detail information [15,16]. Additionally, while the widely used Finer Resolution Observation and Monitoring of Global Land Cover (FROM_GLC30), China’s land use/cover datasets (CLUD), and Global Land Cover-Fine Classification System (GLC_FCS30) products can reflect China’s land cover at a 30 m spatial resolution, FROM_GLC30 only provides data for individual years [17] and CLUD has an excessively long update period (each five years) [18]. After comparing with remote sensing images of the study area, we identified an apparent orbital discontinuity issue with the GLC_FCS30 before 2005 [19]. Thus, they are insufficient to support high-spatiotemporal-resolution mapping of abandonment and reclamation. In contrast, Yang and Huang [20] generated an annual China land cover dataset (CLCD) with 30 m resolution for 1990–2020 on the Google Earth Engine (GEE) platform using Landsat 8 OLI data after 2013 and TM and ETM+ data before 2013. By extracting reliable samples from CLUD and using the random forest algorithm for classification, along with spatiotemporal filtering and logical inference methods for consistency correction, the overall accuracy of this product reaches 79.31%. Since it overcomes the shortcomings of other products in time series, resolution, and update period, CLCD can well support high-precision cropland dynamic detection, providing a more reliable land cover dataset for the detection of abandonment and reclamation in the northern farming–pastoral zone.
In addition to the spatiotemporal features of cropland abandonment and land reclamation, cropland suitability is a key factor that affects food production and coordinates environmental change [21,22]. Previous studies and policies have mostly identified land slope and elevation as the dominant limiting factors impacting cropland suitability in northern China [6,23]. Nevertheless, less attention has been given to improving policy by considering other limiting factors associated with soil quality, wind speed, and the supply of energy and water for crop growth. The combination of multiple criteria decision-making (MCDM) processes with geographical information systems (GISs), which can integrate and transform large amounts of geographic data from different sources to obtain an overall assessment of regional land suitability, is regarded as one of the most useful approaches for spatial management [24,25]. Therefore, using the GIS-MCDM method to assess the suitability of cropland distribution during different periods of abandonment and reclamation activities is of great value for better understanding the effectiveness of China’s ecological construction project and selecting appropriate agriculture planning areas.
With these ideas in mind, we aim to map cropland abandonment, land reclamation, and land change frequency in the farming–pastoral zone of northern China from 1990 to 2020 using the CLCD and analyze the rationality of cropland abandonment and land reclamation based on cropland suitability. We expect that the framework and results of our study can provide reliable support for monitoring cropland dynamics in other regions and offer valuable information for protecting cropland in the farming–pastoral zone of northern China in the future. We specifically asked:
- (1)
- How can cropland abandonment and land reclamation be monitored based on the land use process?
- (2)
- What is the process of cropland abandonment and land reclamation since 1990?
- (3)
- From the perspective of cropland suitability, is the land use decision of cropland abandonment and land reclamation reasonable?
2. Materials and Methods
2.1. Study Area
The farming–pastoral zone in northern China is an essential ecological barrier to central-eastern China, characterized by a unique mixed farming–livestock production system [26]. Although scholars have defined the region’s geographical scope from different perspectives and for various research purposes, the core areas are generally consistent [6]. According to the research of Tao et al. [27], we defined the northern farming–pastoral zone as follows (Figure 1): it is located between 34°43′31″–46°57′46″N and 100°57′11″–125°34′11″E, covering 226 counties, cities, banners, and districts in nine provinces and autonomous regions, with a total area of 69.9 × 10⁴ km2. The terrain elevation in most areas of the northern farming–pastoral zone is above 1000 m, presenting a transition from plains to mountains (e.g., Great Khingan) and plateaus (e.g., Loess Plateau). Its climate varies from semi-humid in the east to arid and semi-arid in the west, with mean annual temperature from 0 °C to 10 °C and mean annual precipitation from 200 to 650 mm. Large intra-annual and inter-annual precipitation fluctuations directly affect the stability of dryland farming and pasture growth [28].
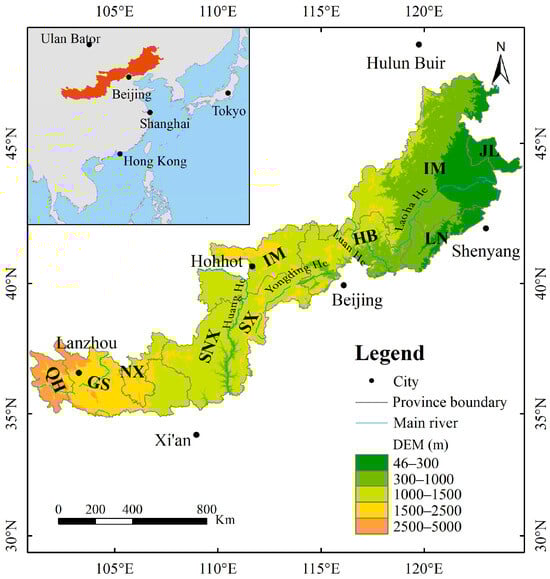
Figure 1.
Location and topography of the northern farming–pastoral zone. The definitions of the abbreviations in the figure are shown below: Qinghai (QH), Gansu (GS), Ningxia (NX), Shaanxi (SNX), Shanxi (SX), Inner Mongolia (IM), Hebei (HB), Liaoning (LN), Jilin (JL), digital elevation model (DEM).
2.2. Data and Processing
The CLCD provides annual land cover records for China from 1990 to 2020. It includes 9 classes, namely croplands, forests, shrubs, grassland, water, snow and ice, barren land, impervious surface, and wetland, all present in the northern farming–pastoral zone.
Topographic data, including slope, aspect of slope, and elevation, were derived from the SRTM V3 product. This product is the third version of the NASA Shuttle Radar Topography Mission. It uses interferometric radar measurements to obtain near-global digital elevation data with one-arc-second spatial resolution [29].
The soil data mainly include effective soil thickness, organic matter, pH, and texture, which were obtained from the “National Earth System Science Data Center” (Table 1). The effective soil thickness, pH, and texture data were derived from high-resolution three-dimensional distribution maps of soil properties obtained by spatializing soil profile sample points from the recent China Soil System Survey and China Soil System Journal project. Soil texture and pH data were collected at soil depths of 5–15 m and 0–20 m in the vertical direction, respectively.

Table 1.
Base data and brief information.
Meteorological data mainly include ≥10 °C accumulated temperature, annual precipitation, and mean wind speed in spring. Annual precipitation data were derived from the PERSIANN-CDR product of the Google Earth Engine (GEE), which provides daily rainfall estimates with a 0.25° resolution from 1983 to the present. The PERSIANN algorithm was used to estimate precipitation, using precipitation data from the National Centers for Environmental Prediction Phase IV to train an artificial neural network. The ≥10 °C accumulated temperature and spring wind speed data were derived from the GLDAS-2.1 product of the GEE platform, one of the two datasets of GLDAS version 2. It employs data assimilation techniques to generate surface states and flux fields for a broad range of studies of atmospheric and land surface processes [30].
The preprocessing of cropland suitability evaluation data involved several steps: first, we loaded precipitation, temperature, and wind speed datasets in GEE and performed annual value statistics for daily data from 2010 to 2018 and calculated multi-year averages based on annual data; then, we loaded soil and topographic data in GEE and reclassified according to rules (see Section 2.3.3); finally, we imported all data into ArcGIS 10.8 for overlay analysis. We used the bicubic interpolation algorithm to resample the data to 1 km, which was the analysis and result display unit of the suitability evaluation.
2.3. Cropland Abandonment and Land Reclamation Mapping and Cropland Suitability Evaluation
2.3.1. Cropland Abandonment and Land Reclamation
According to the definition provided by the FAO, cropland abandonment is the cessation of farming activities for 2–5 years, during which no cultivation occurs and natural vegetation regrows [31,32]. In addition, land reclamation refers to converting natural land to agricultural use. Accordingly, we regarded the initial year as the base year and the first subsequent year as the test year. We obtained land use data based on the land cover of each pixel in the base year and the following four years (i.e., the test year and the subsequent three years).
We considered all six cases of a pixel in a 5-year time window (Table 2). If a pixel is cropland in the base year, we define it as “successive cropland” if it remains cropland in the test year (i.e., the following year). We define it as “abandoned” if it becomes natural land in the test year and remains natural land in the subsequent three years. We define it as “fallow” if it is natural land in the test year but becomes cropland in at least one of the following three years. In addition, if a pixel is natural land in the base year, we define it as “successive natural” if it remains natural land in the test year. We define it as “reclamation” if it becomes cropland in the test year and remains cropland in at least one of the subsequent three years. We define it as a “mapping error” if it is cropland in the test year but becomes natural land in the subsequent three years. In particular, our definition of natural land includes only naturally covered land (including forests, shrubs, grassland, water, barren land, and wetland) but not impervious surfaces.
Table 2.
Judgment conditions and definitions of abandonment and reclamation.
Regarding the above definition, taking the process of cropland abandonment and land reclamation mapping in 1991 as an example, the specific mapping methods are as follows (Figure 2):
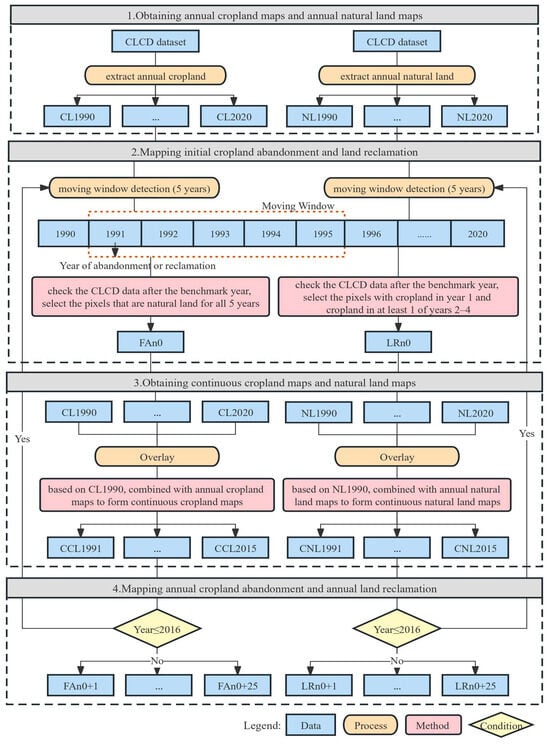
Figure 2.
Extraction techniques of cropland abandonment and land reclamation processes.
In the initial step, we extracted cropland pixels from the dataset of CLCD 1990 to establish the base map for cropland in 1990 (CL1990). Meanwhile, we extracted natural land pixels in CLCD 1990 to create the base map for natural land (NL1990).
In the second step, based on CL1990, we employed a time-sliding window to detect the CLCD after 1991. Pixels are classified as natural land in the current year, and the subsequent three years were identified as “abandoned cropland”, designating 1991 as the beginning of cropland abandonment (FA1991). Utilizing CL1990, we excluded abandoned pixels from the natural land in the current year, considering the remaining areas as fallow, and labeled them as “newly identified cropland” (NC1991). Similarly, based on NL1990, we identified the CLCD after 1991. Pixels classified as cropland in the current year but as natural land in the following three years were categorized as “mapping errors” and documented as “newly identified natural land” (NN1991). Using NL1990, we excluded mapping error pixels from the cropland pixels in the current year, considering the remaining areas as reclaimed land, and marked 1991 as the beginning year of land reclamation (LR1991).
In the third step, we merged the cropland pixels in CLCD from 1991 (CL1991) with the detected fallow pixels (NC1991) to create an updated cropland base map for 1991 (NCL1991). Meanwhile, we combined the natural land pixels in CLCD from 1991 (NL1991) with the identified mapping error pixels (NN1991). Then, we excluded the fallow pixels to generate an updated natural land base map for 1991 (NLL1991).
In the fourth step, we repeated the above processes using the updated base maps (CL1991 and NL1991), advancing the detection timing to the subsequent year. The detection concluded upon acquiring the final year of cropland abandonment and land reclamation pixels, i.e., FA2019 and LR2019. These iterative processes generated cropland abandonment and land reclamation maps, along with new land use and fallow maps from 1991 to 2019. In particular, due to insufficient data for three consecutive years of monitoring in the subsequent years (2018 and 2019), we simulated the land cover data for 2021 and 2022 by duplicating the land cover data from 2020 (this approach, rooted in the theory of handling missing data, utilizes the simulation method to estimate missing values by leveraging existing or related information, particularly in continuous processes). This simulation facilitated the completion of the detection processes outlined above (refer to the Supplementary Materials for specific codes).
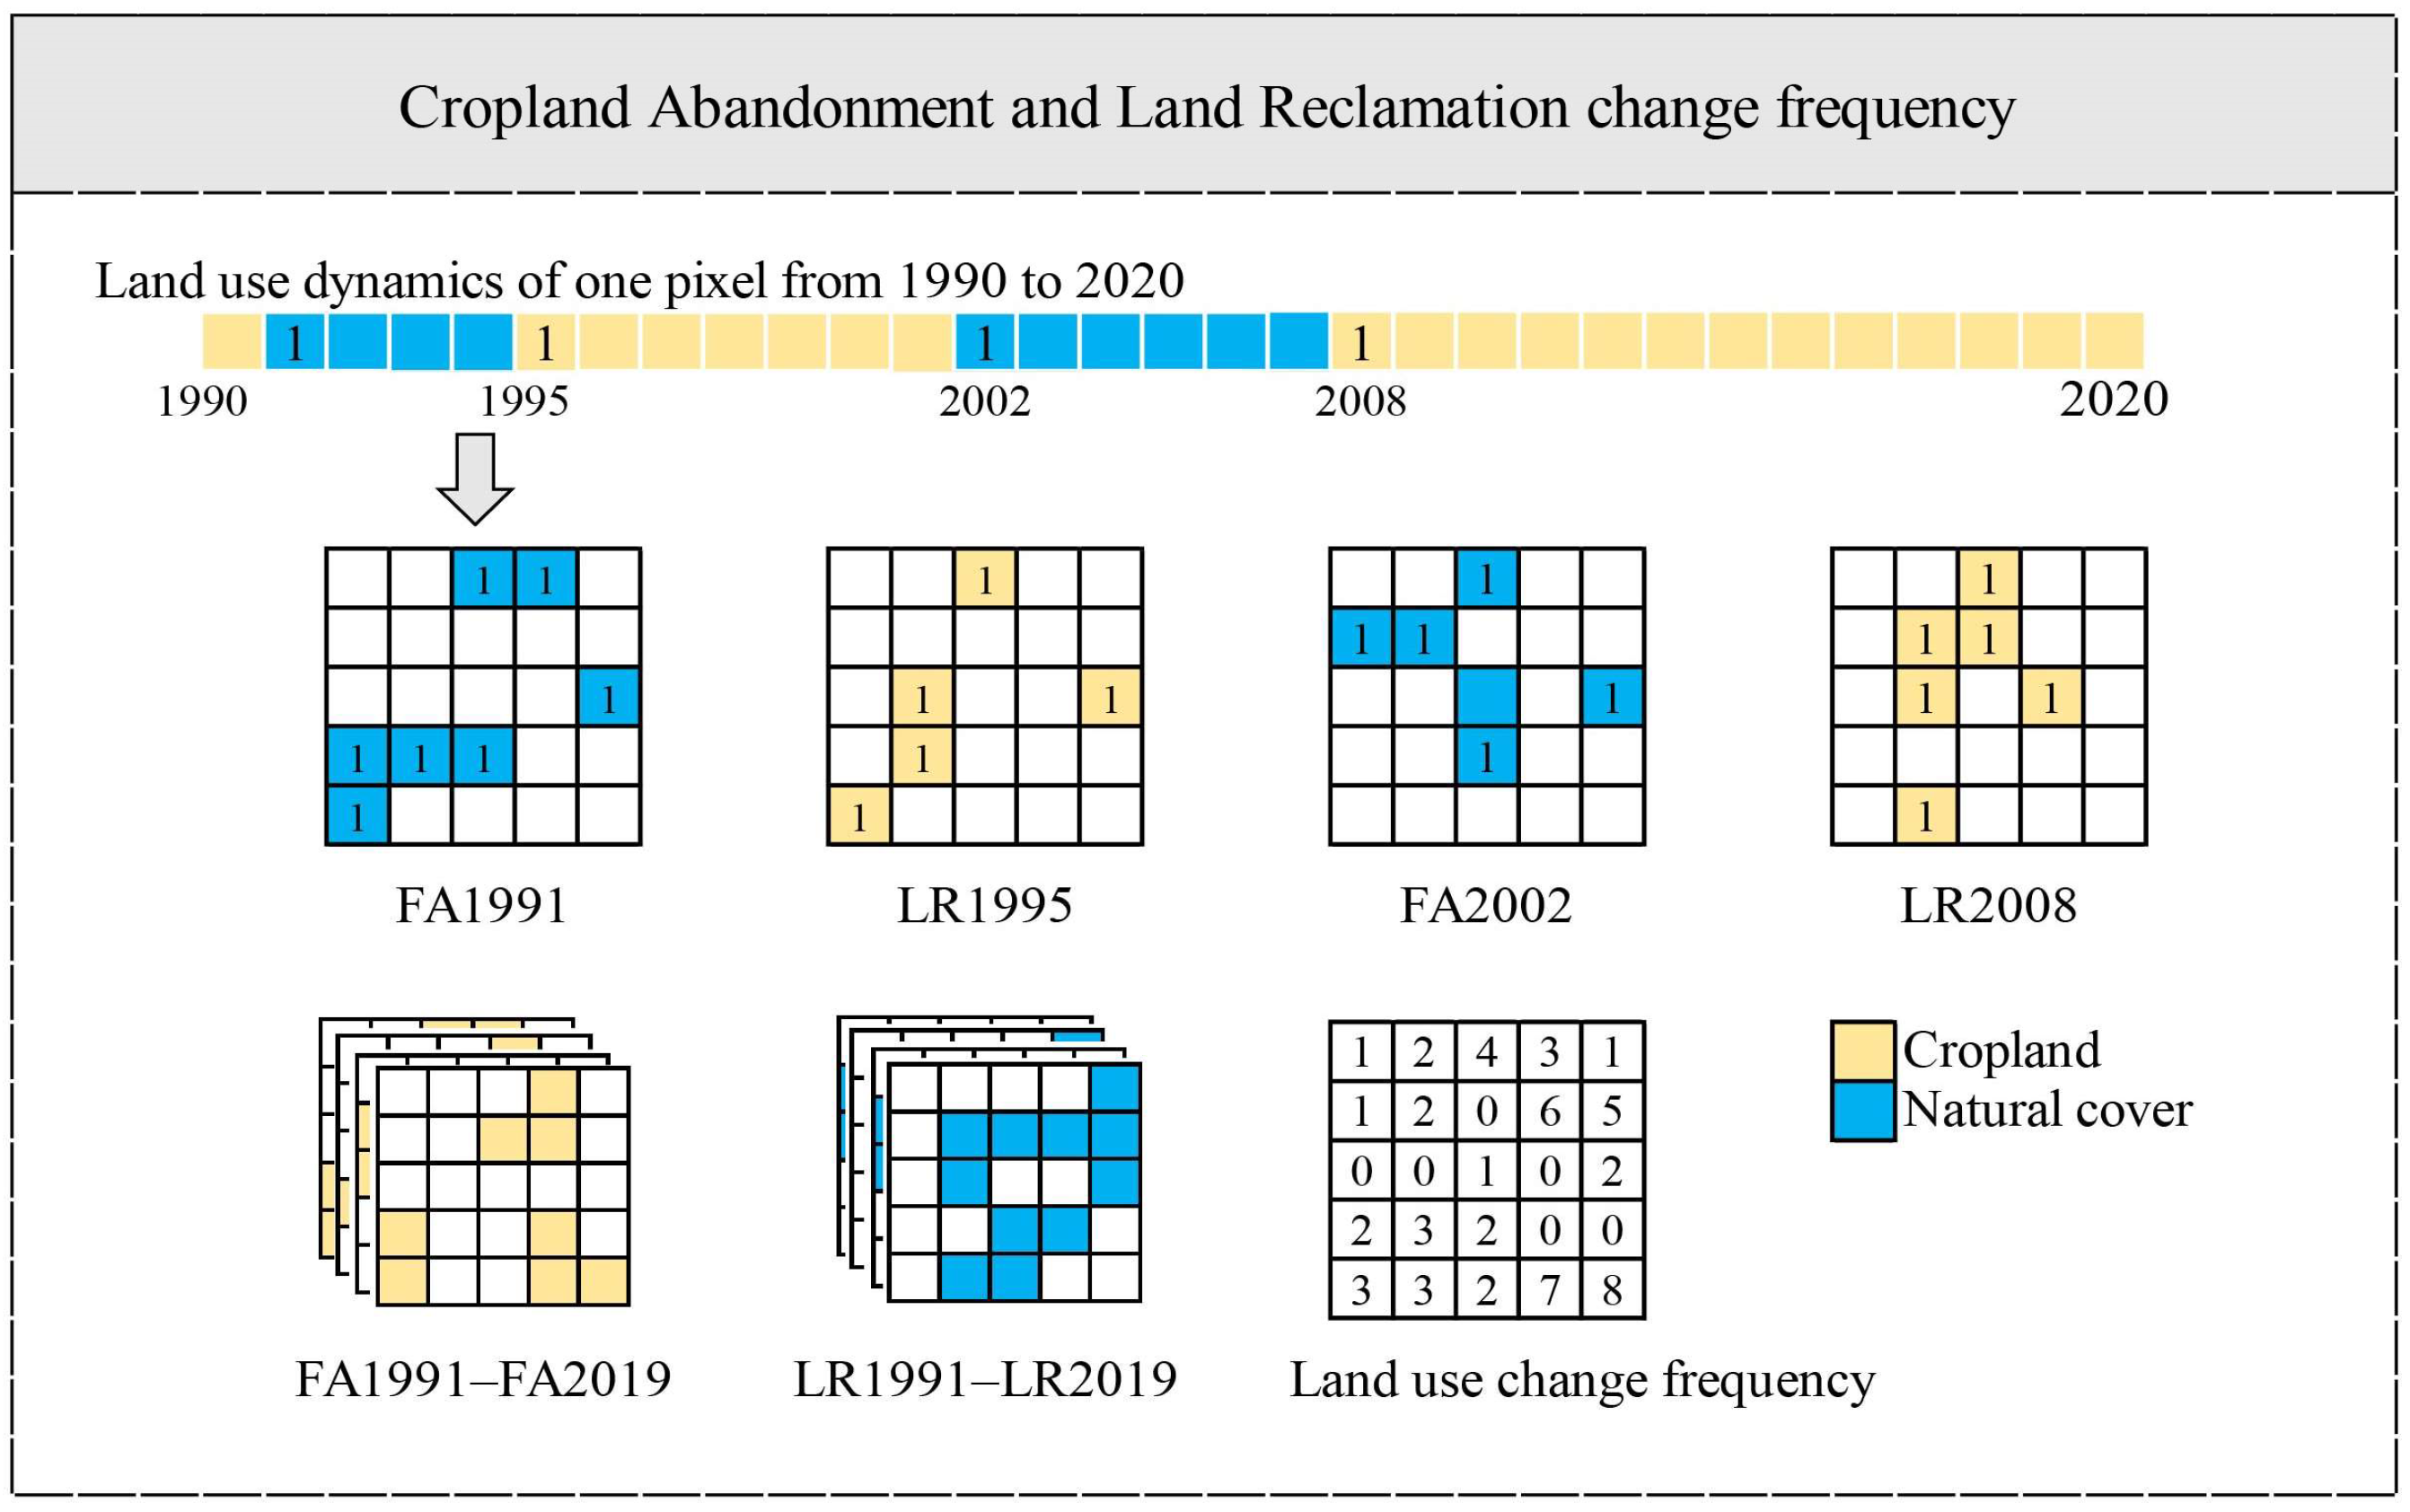
2.3.2. Land Change Frequency
Using the cropland abandonment and land reclamation datasets, we evaluated the frequency of change in abandonment and reclamation (Figure 3). Specifically, we defined a value of “1” for all non-empty pixels in the FA1991–FA2019 and LR1991–LR2019 datasets, while pixels without values were assigned a value of “0”. Subsequently, we summed these values to evaluate the frequency of change in cropland abandonment and land reclamation (refer to the Supplementary Materials for specific codes).
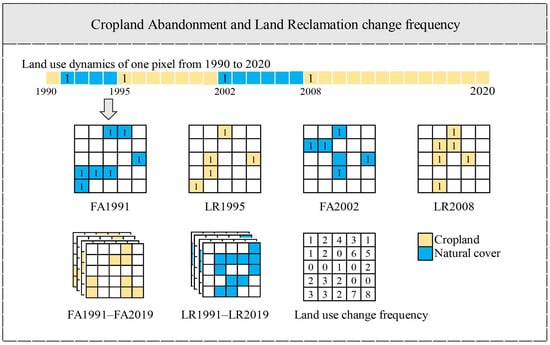
Figure 3.
Technique for mapping the change frequency in cropland abandonment and land reclamation: an example for the pixel indicated by the arrow.
2.3.3. Multiple Criteria Decision Making
The study used the multiple criteria decision-making method to evaluate the suitability of cropland in the farming–pastoral zone of northern China. Firstly, due to the fragile ecological environment and relative backwardness of the economy, the study selected 10 factors from topography, soil, and meteorology conditions to constitute the evaluation index system based on the natural environmental characteristics in the farming–pastoral zone of northern China [21]. Secondly, the weights of indicators and specific factors were assigned using the analytic hierarchy process method based on previous researchers’ knowledge of assessing cropland suitability in the farming–pastoral zone. Subsequently, the grid data were hierarchically delineated and normalized. Finally, stepwise weighted summation was carried out. Specifically, the specific factors in the three types of indicators were weighted first to obtain the corresponding topographic index, sold index, and meteorological index, and then the specialized indexes were weighted to obtain the cropland suitability comprehensive index.
Specifically, an evaluation index system was constructed from these factors:
(1) Topographic conditions: elevation, slope, and aspect of slope. Topographic conditions dominate the growth and distribution of crops by strongly influencing the redistribution of water and heat. (2) Soil conditions: effective soil thickness, soil texture, soil organic matter, and soil pH. Soil conditions are closely related to soil moisture, nutrients, and physical properties, which can affect the development of plant roots and the ability of soil to retain water and fertilizer. (3) Meteorological conditions: ≥10 °C cumulative temperature, mean annual precipitation, and spring wind speed. Accumulation temperature and precipitation have essential effects on the growth and yield of crops. Wind speed is the main factor that directly causes wind erosion of fine soil particles.
To construct an evaluation index system for cropland suitability based on ecological sustainability, we referred to the principles of land suitability evaluation outlined by the FAO and considered the specific natural environment of the farming–pastoral zone. We then determined the grading and quantification criteria of each index. In general, besides the existence of optimum intervals for soil pH, soil texture, and aspect of slope, higher precipitation, accumulated temperature, effective soil thickness, and organic matter and lower slope, elevation, and spring wind speed represent better soil quality and crop growth environment, that is, better suitability for cropland. Eight, six, four, and two scores were used to expand the suitability gap for each index and grade (Table 3).
Table 3.
Evaluation index system and classification of cropland habitat suitability.
2.3.4. Analytic Hierarchy Process
The analytic hierarchy process (AHP) is a decision support method that can transform complex multi-factor problems into a hierarchical structure, typically by integrating GIS into the AHP model to provide a reliable assessment of land suitability [33]. We used the AHP method to determine the specific weight of each index (Table 4). The process involved constructing a judgment matrix based on expert experience, normalizing it to obtain the feature vector, judging the consistency of the results by calculating the consistency index, and finally determining the weight coefficients of each indicator for the matrix that passed the consistency test.
Table 4.
The weight of habitat suitability of cropland evaluation factors.
Based on the factor weight coefficients, the composite score of cropland suitability can be calculated as follows:
where R is the composite score, W is the factor’s weight, Z is the grade score, and n is the number of participating factors. We employed the natural breakpoint method, a manual data classification approach that partitions data into classes based on inherent groups within the data distribution (natural breaks occur in the histogram at the low points of valleys), to categorize land suitability into four classes: high suitability (HS), moderate suitability (MoS), marginal suitability (MaS), and unsuitability (NS).
3. Results
3.1. Spatiotemporal Dynamics and Suitability Characteristics of Cropland
Between 1990 and 2020, the cropland area in the study region decreased from 237,500 km2 to 199,600 km2, resulting in a net reduction of 37,900 km2. This reduction was 1.63 times greater than the net expansion of forest and 2.34 times that of grassland. The region exhibited a clear trend of converting cropland back to forest and grassland (Figure 4). Specifically, the change in cropland area can be roughly divided into three stages: a slight decrease of 7400 km2 before 2000; a significant decrease of 24,300 km2 between 2000 and 2010; and a relatively stable reduction of 6200 km2 after 2010.
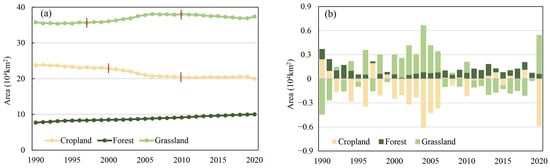
Figure 4.
Dynamics of cropland and its relationship with forest and grassland from 1990 to 2020. (a) Area of cropland, forest, and grassland, where red vertical lines indicate the primary year of cropland and grassland change; (b) the net change in cropland, forest, and grassland area. “Net change” refers to land cover/use area changes between two consecutive years.
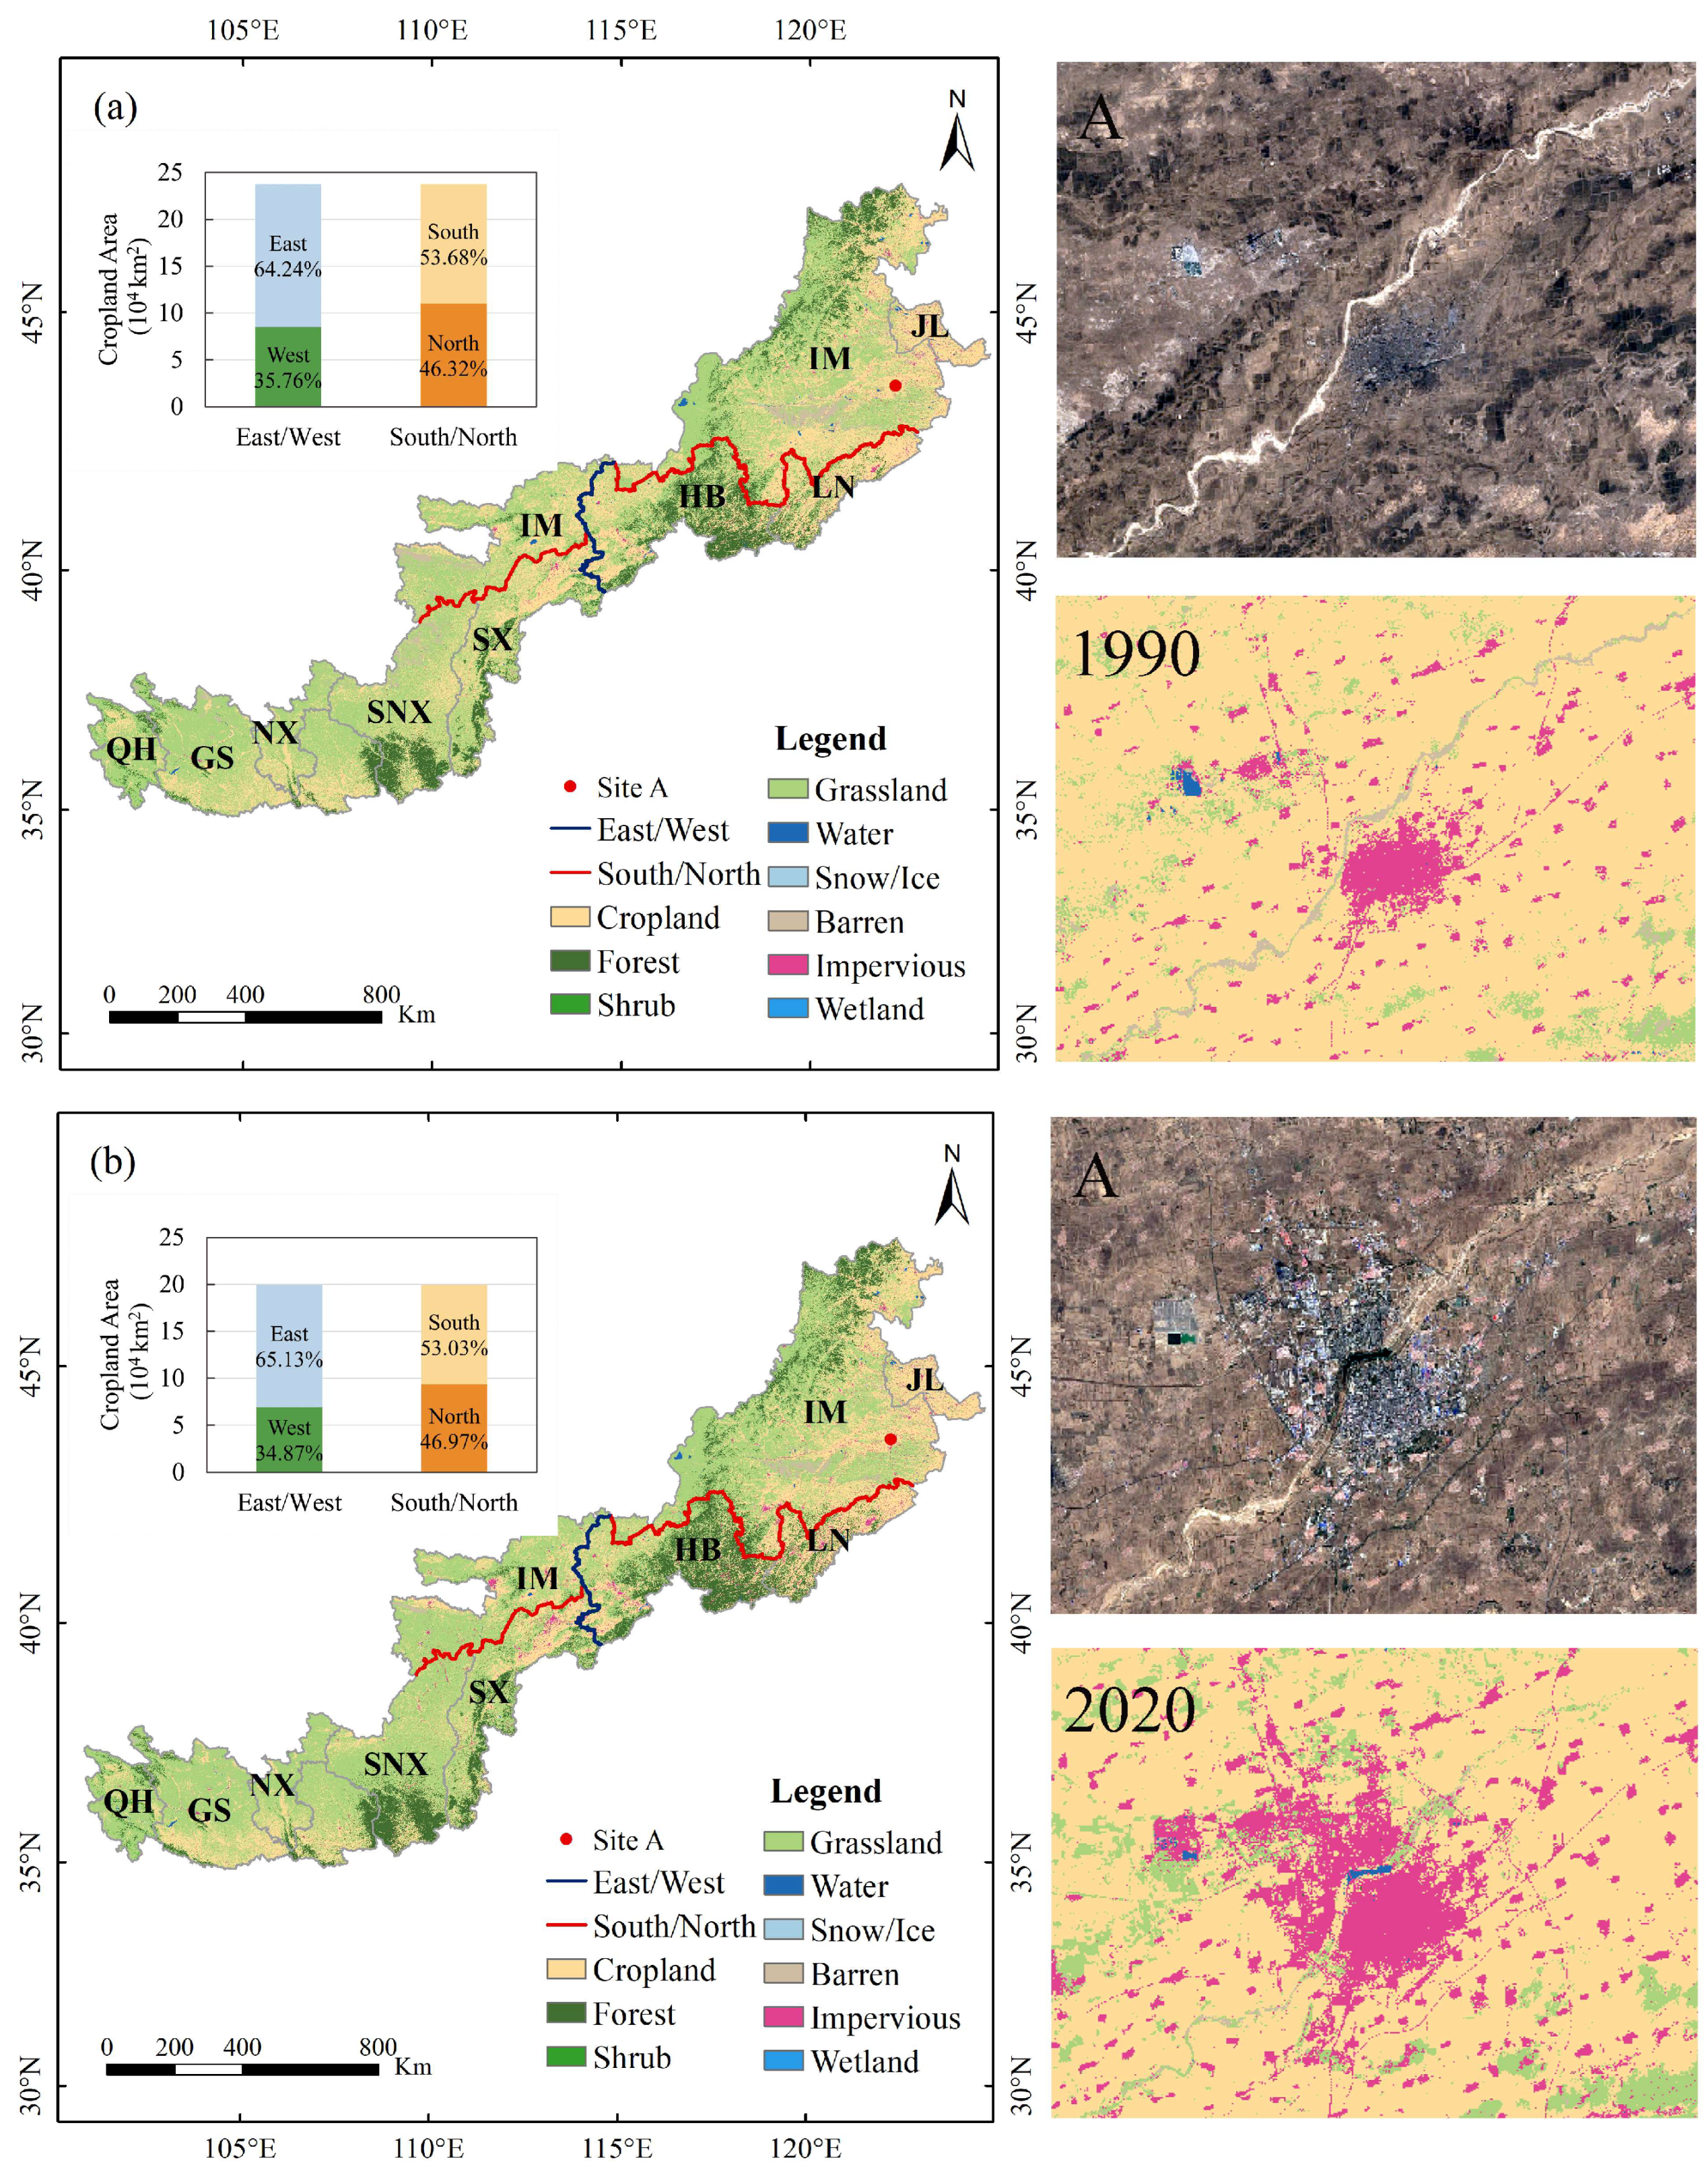
The spatial distribution of cropland in the study area exhibits spatial heterogeneity (Figure 5). In general, there is a higher proportion of cropland in the eastern region (64–65%), while the western region has a lower proportion (35–37%). Similarly, the southern region has a higher proportion of cropland (53–54%) than the northern region (46–47%). This spatial pattern has remained relatively stable over the past three decades.

Figure 5.
Spatial characteristics of land cover and cropland area proportion in the northern farming–pastoral zone. The left figure shows the comparison of overall land cover changes in the northern farming–pastoral zone; the right figure shows the close-up and Landsat images of the land cover changes at site A (Tongliao City) due to urban expansion. Figures (a,b) represent the land cover in 1990 and 2020, respectively. The western border of Hebei Province is the east–west boundary (blue line), and the southern edge of Inner Mongolia (roughly the Yinshan–Yanshan Mountains) is the north–south boundary (red line). This method of delineation based on administrative regions and mountains reflects the clarity of geographical features and the distinctiveness of regional boundaries. See Figure 1 for the detailed definitions of the abbreviations of province names.
Cropland suitability in the northern farming–pastoral zone is mainly classified as marginal, with a total score ranging from 2.79 to 7.53. According to the natural breakpoint method, the classification intervals for different suitability levels, from low to high, are as follows: NS (2.79–4.95), MaS (4.95–5.47), MoS (5.47–6.05), and HS (6.05–7.53). The spatial distribution of cropland suitability indicates that the western part of the Great Khingan and the Liaohe Plain exhibit better cropland suitability, while the northern part of the North China Plain, the southern part of the Yinshan Mountains, and the central and southern part of the Loess Plateau have moderate suitability. Conversely, the western part of the Loess Plateau and the West Liaohe Basin exhibit low cropland suitability (Figure 6).
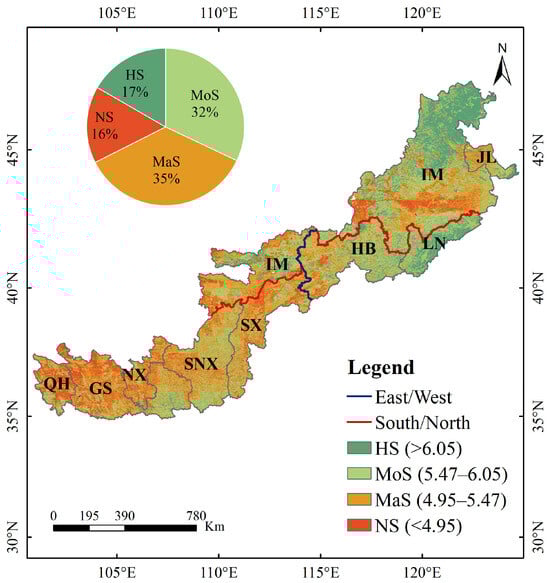
Figure 6.
Spatial pattern of cropland habitat suitability in the farming–pastoral zone of northern China. See Figure 1 for the detailed definitions of the abbreviations of province names.
More specifically, the high-suitability area (HS) covers a total area of 116,400 km2 (16.65%) and is mainly distributed in Inner Mongolia, Liaoning, and Hebei provinces. This region generally has low slope and elevation, suitable soil pH, high soil organic matter, and sufficient hydrothermal conditions, all of which contribute to enhanced crop habitat suitability. The moderate-suitability area (MoS) covers an area of 223,900 km2 (32.04%) and is primarily located in Inner Mongolia, Liaoning, and Hebei in the east and Shaanxi in the west. These areas have relatively sound natural conditions but lower effective soil thickness and soil organic matter. The marginal-suitability area (MaS) has the largest area of 248,100 km2 (35.5%) and is generally unsuitable for growing crops due to high altitude and low soil organic matter. Finally, the unsuitable area (NS) has the smallest area of 110,400 km2 (15.8%) and is concentrated in Qinghai, Ningxia, Gansu, and Inner Mongolia. The high elevation and low effective soil thickness in these areas contribute to lower suitability scores.
3.2. Cropland Abandonment and Land Reclamation Process
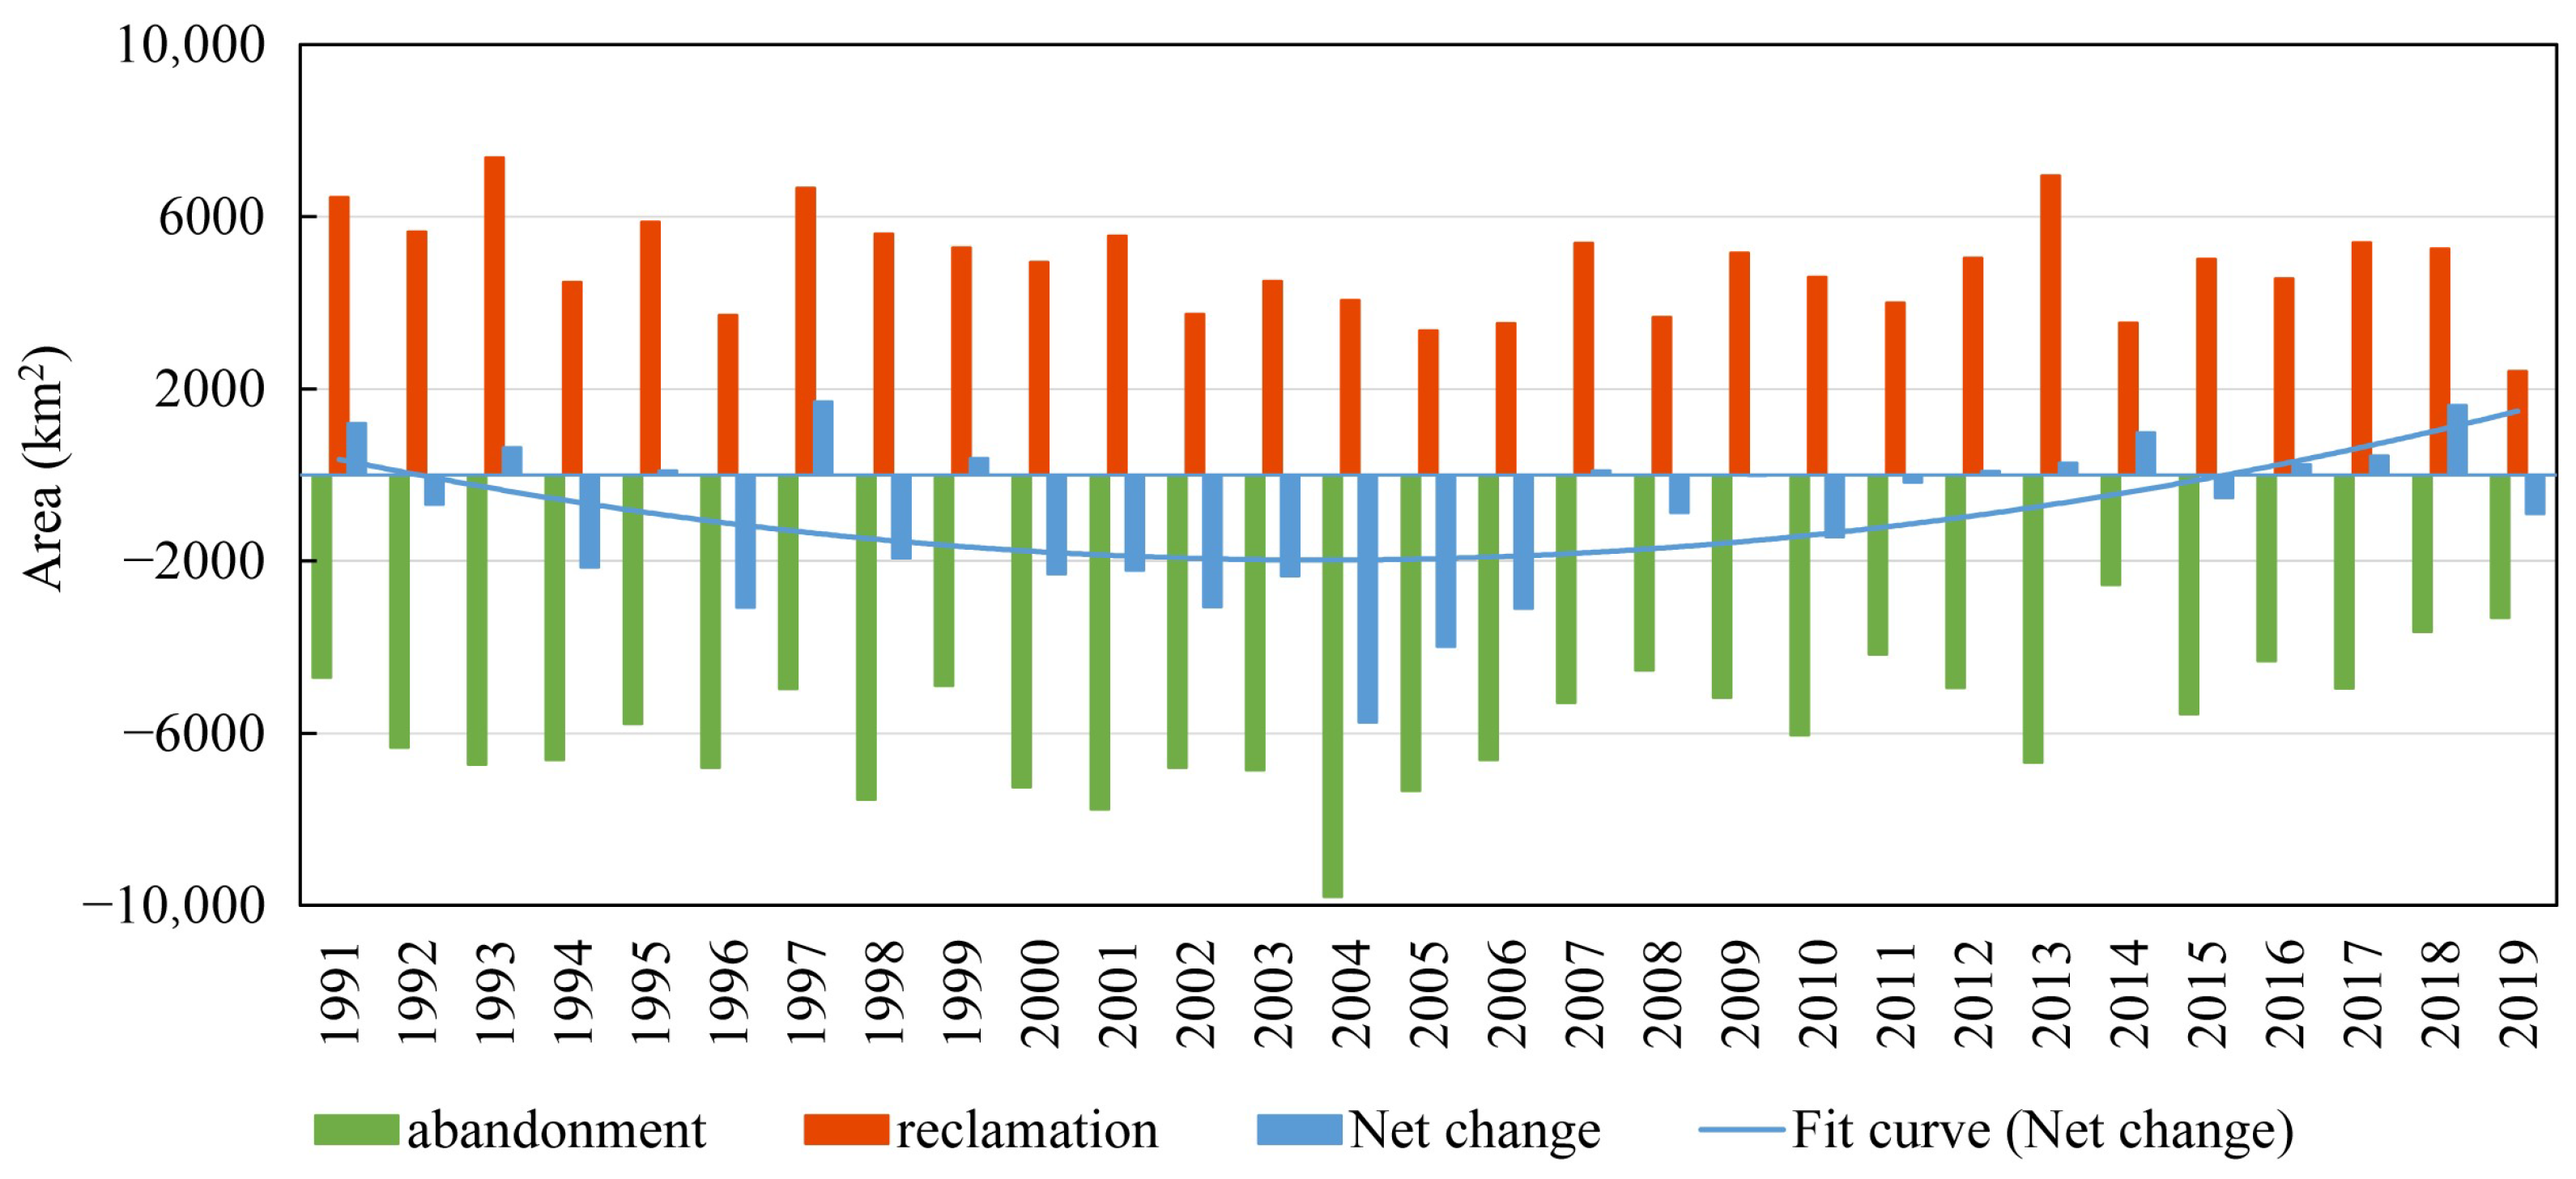
From 1991, the intensity of cropland abandonment and land reclamation in the northern farming–pastoral zone showed a general decline trend (Figure 7). The area of cropland abandonment decreased from 4702 km2 in 1991 to 3309 km2 in 2019, while the area of land reclamation decreased from 6449 km2 to 2409 km2. Before 2000, cropland contracted and expanded alternately, but the abandoned area was more than the reclaimed area (−3271 km2). From 2000 to 2011 (except for 2007), the net area of cropland contracted (−25,120 km2), and the contraction area increased first and then decreased, with the clearest contraction in 2004 (−5739 km2). From 2012 to 2019 (except for 2015 and 2019), the reclamation area was larger than the abandonment area, and cropland exhibited a low expansion trend (+275.9 km2/a).
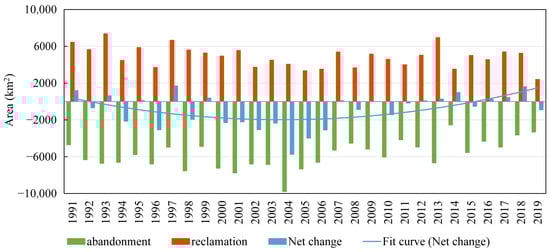
Figure 7.
Temporal dynamics and net effects of abandonment and reclamation from 1991 to 2019. The fitting method is a second-order polynomial fit.
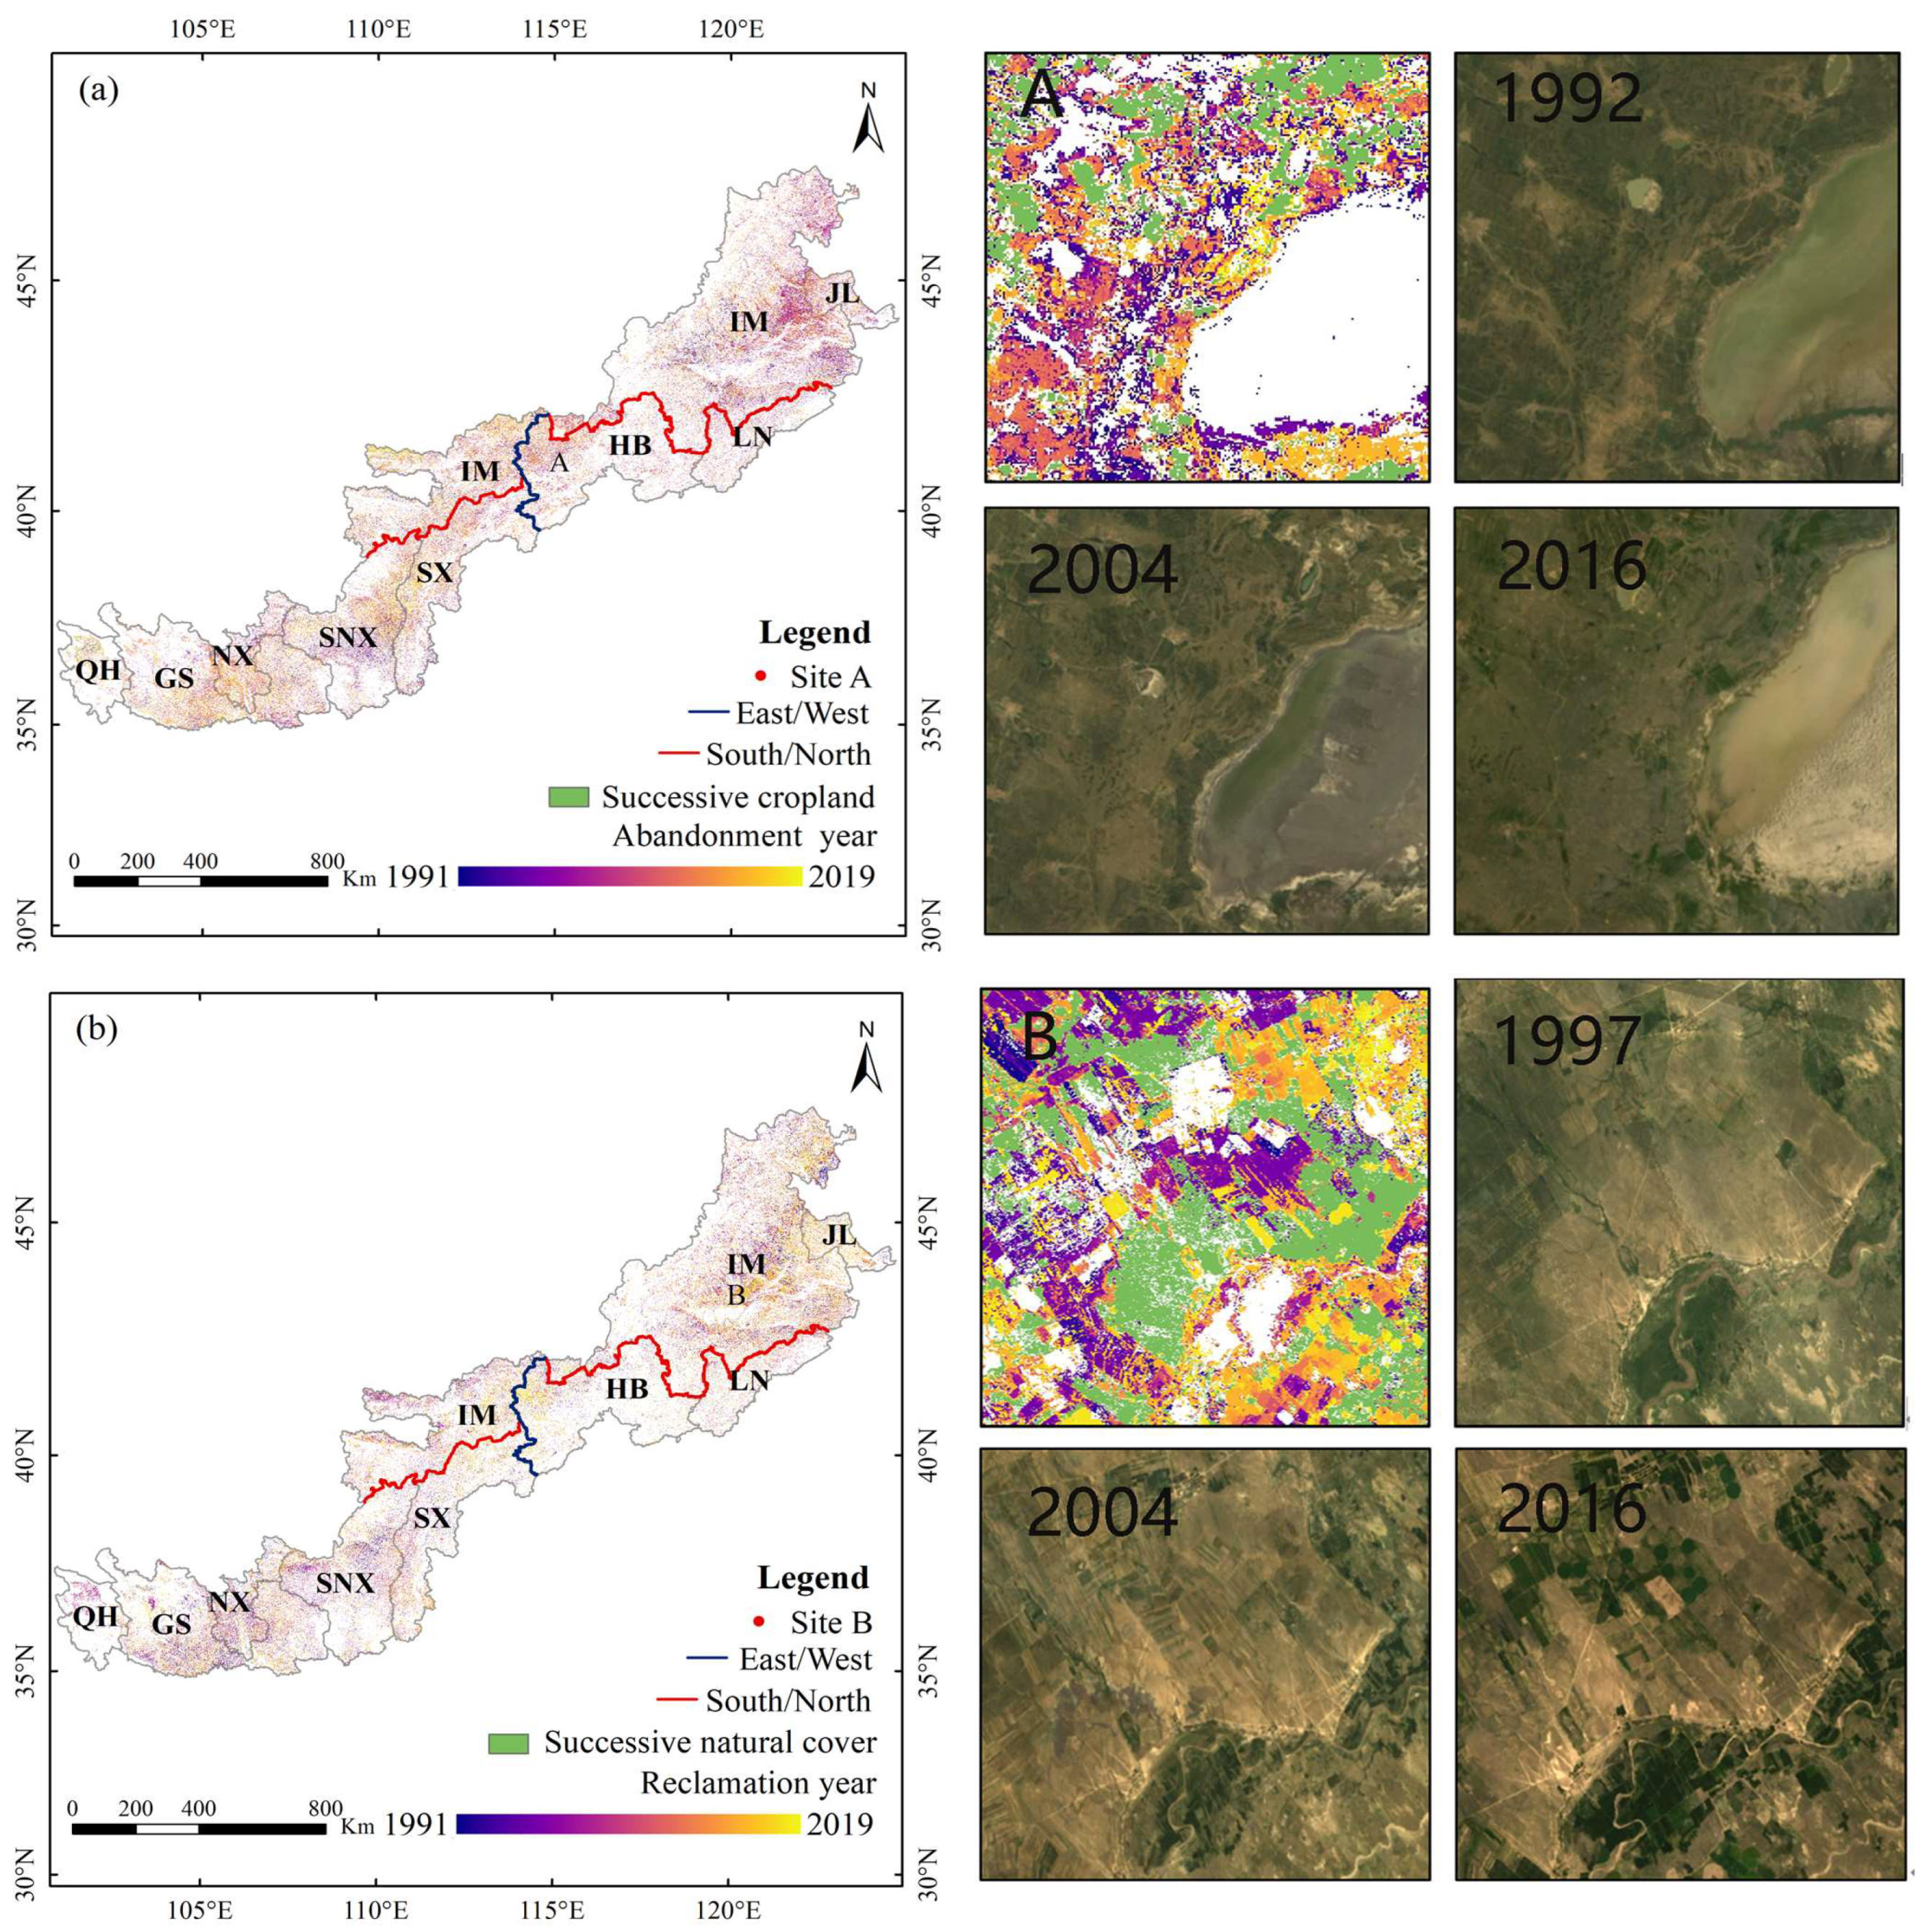
Cropland abandonment and land reclamation patterns exhibit clear spatiotemporal heterogeneity. Before 2000, cropland abandonment was concentrated in Inner Mongolia in the east and Shaanxi, Gansu, and Shanxi in the west. After 2000, the number of abandoned areas gradually increased, especially at the Inner Mongolia–Jilin and Inner Mongolia–Hebei border. Since 2011, the main abandoned cropland area has been concentrated in Inner Mongolia (Figure 8a). Meanwhile, before 2000, reclamation activities were widely distributed throughout the region, particularly in Inner Mongolia and Gansu. After 2000, land reclamation decreased, but Inner Mongolia still had the largest reclamation area. Since 2011, limited land reclamation activities have been distributed in the western Greater Khingan Mountains and Gansu (Figure 8b).
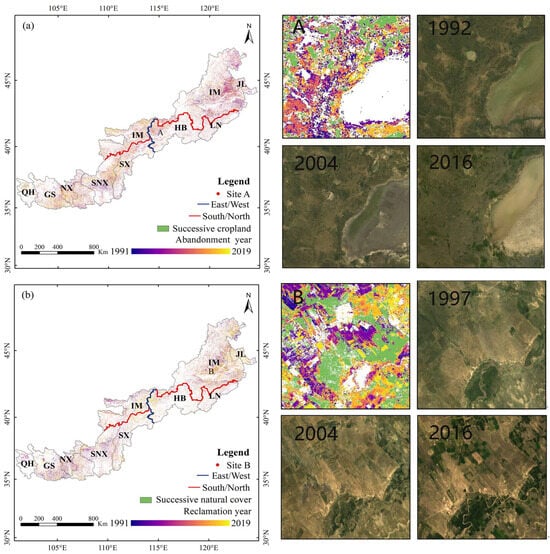
Figure 8.
Spatiotemporal pattern of abandonment and reclamation from 1991 to 2019. Figures (a,b) show the cropland abandonment and land reclamation, respectively. The right figures correspond to close-ups of site A (cropland abandonment, fallow, and successive cropland) and site B (land reclamation, successive natural land), respectively, and Landsat images at different times (RGB321). See Figure 1 for the detailed definitions of the abbreviations of province names.
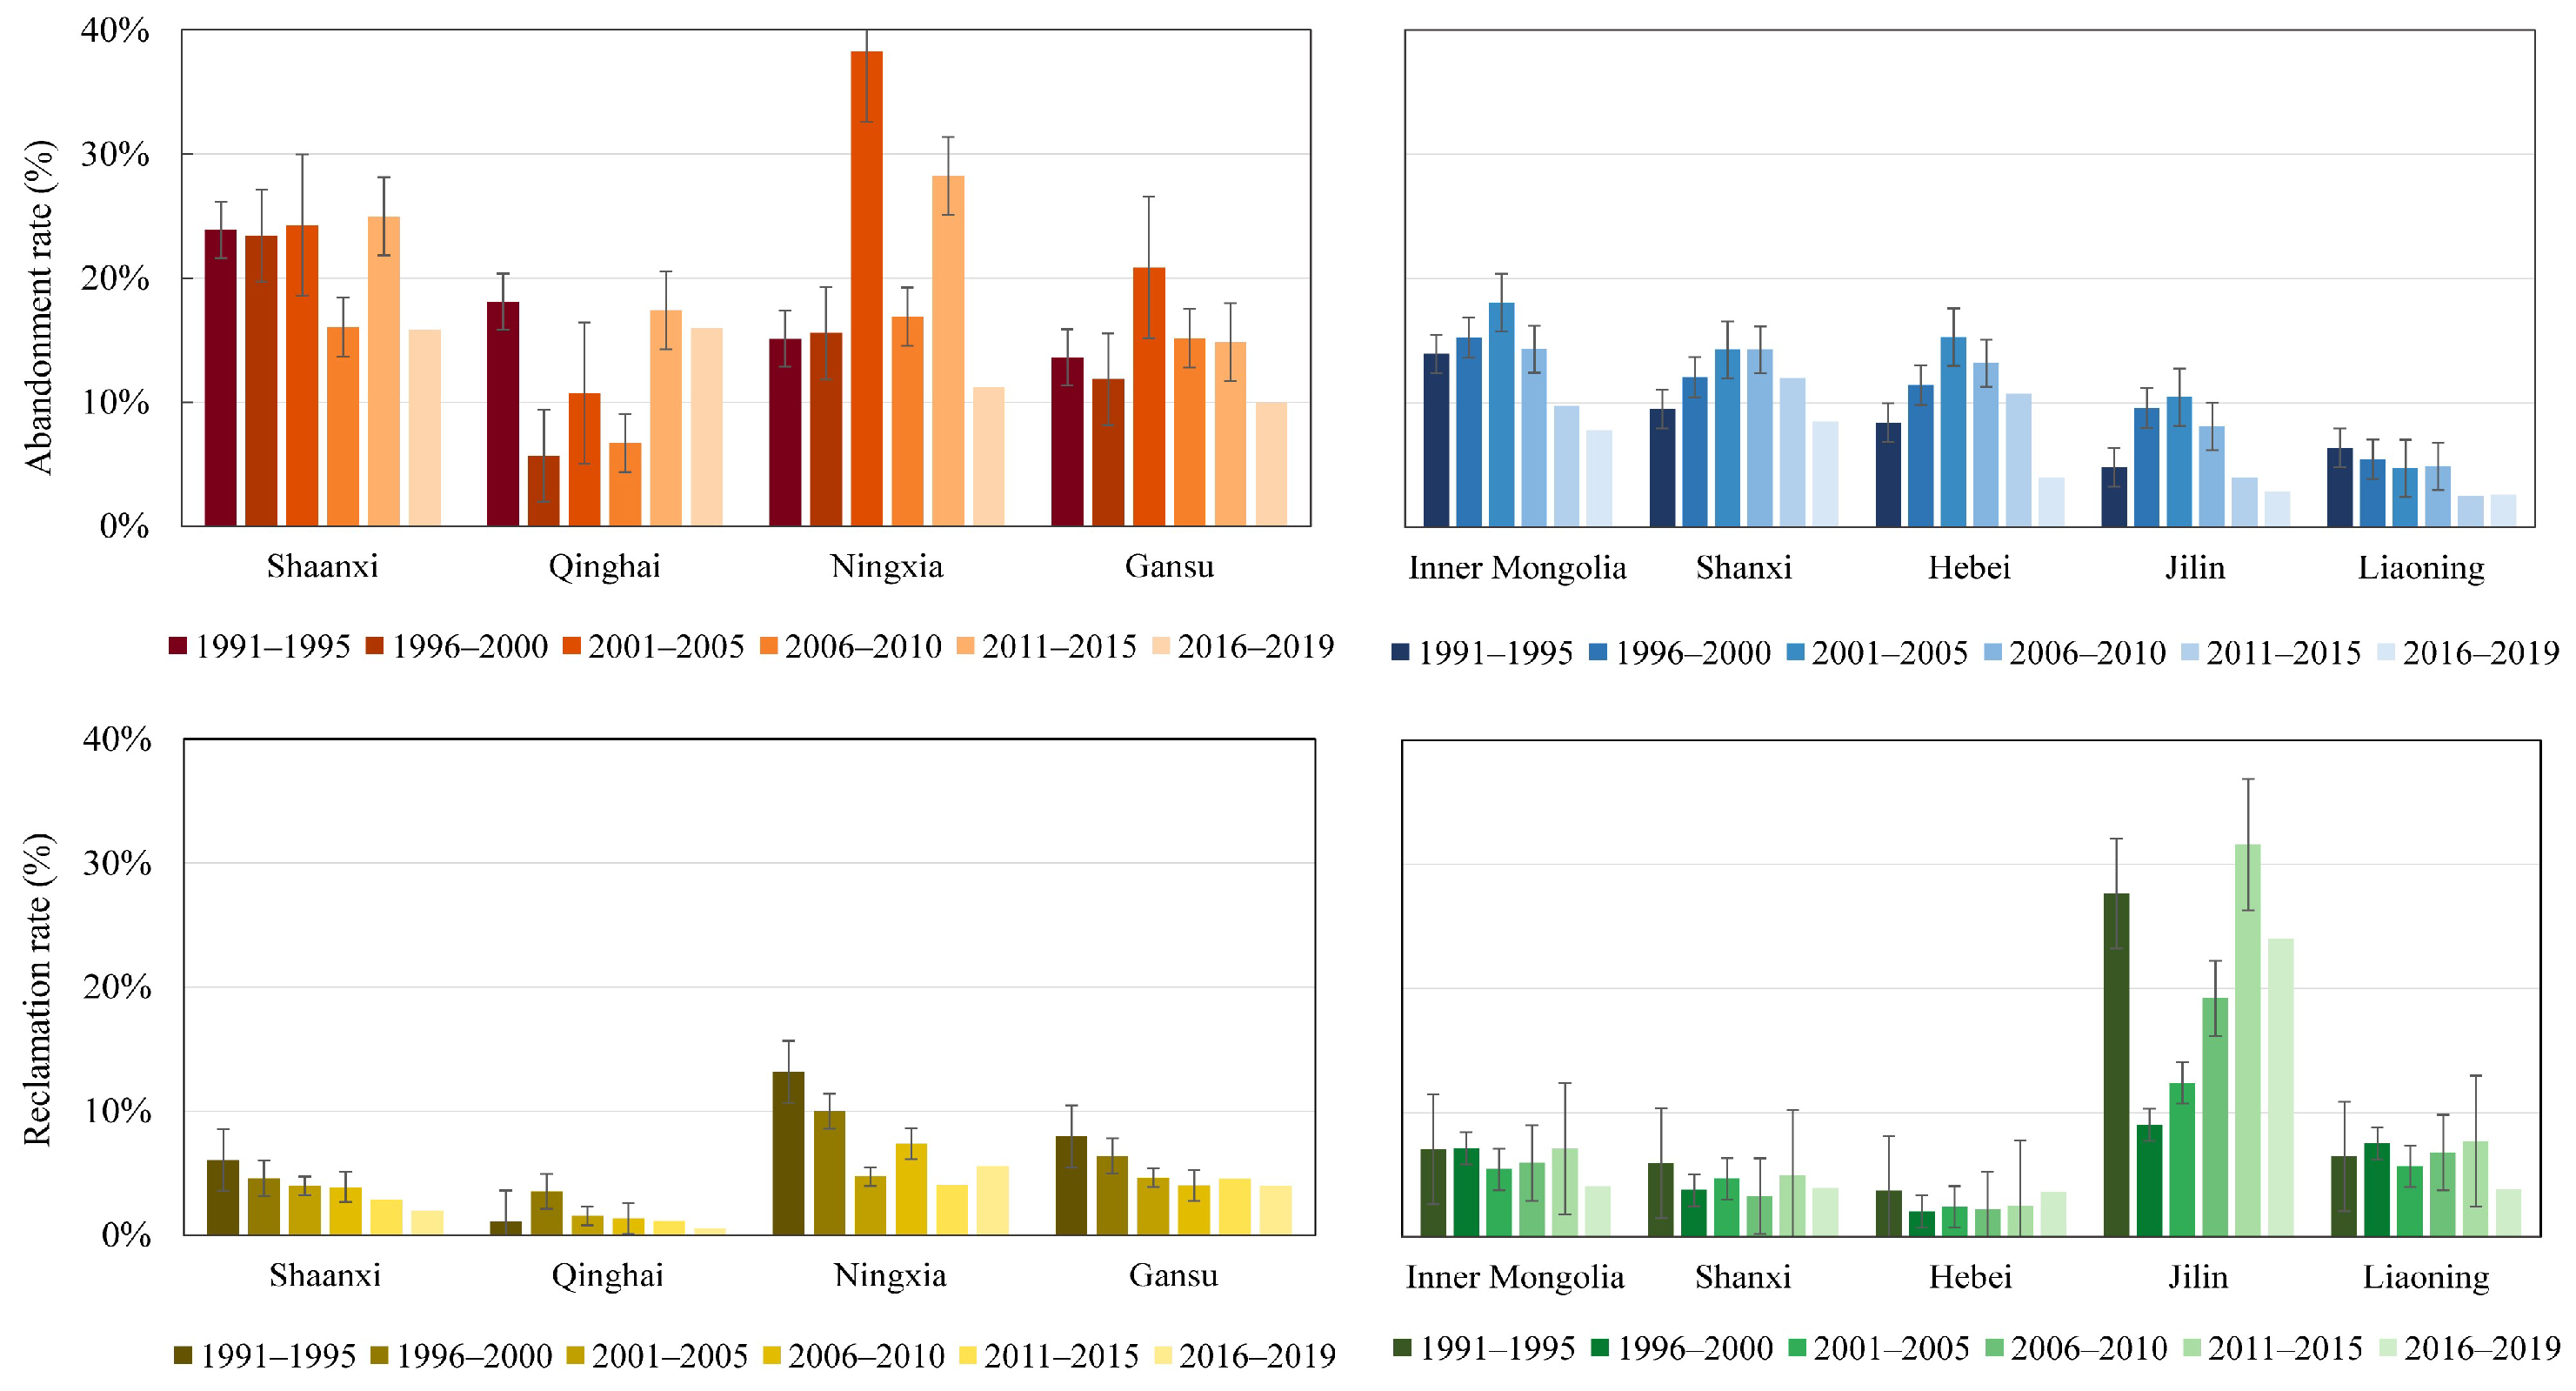
The temporal dynamics of cropland abandonment can be roughly divided into two types (Figure 9). In Shaanxi, Qinghai, Ningxia, and Gansu, the abandonment rates are high and show a repeated decreasing–increasing characteristic over time. In contrast, in Inner Mongolia, Shanxi, Hebei, and Jilin, the abandonment rates increased and decreased over time. They all peaked from 2001 to 2005 and gradually declined after 2006. Notably, the abandonment rate in Liaoning kept decreasing (3–6%) and eventually stabilized at a low level due to the region’s high-quality cropland with high food production, which makes it less prone to abandonment.

Figure 9.
Cropland abandonment rate and land reclamation rate in the farming–pastoral zone of northern China from 1991 to 2019.
Moreover, the abandonment rate in Shaanxi was almost consistently high (16–24%), mainly due to policies such as returning cropland to forests in the Loess Plateau. Similarly, two significant land patterns of reclamation were observed in different regions. In Jilin, Inner Mongolia, Liaoning, and Hebei, the land reclamation rates continuously increased from 2001 to 2015 but decreased from 2016 to 2019, with the most significant decrease observed in Jilin (−15%). In contrast, in Ningxia, Gansu, Shaanxi, Shanxi, and Qinghai, the land reclamation rates decreased from 1991 to 2019 and eventually stabilized at a lower level.
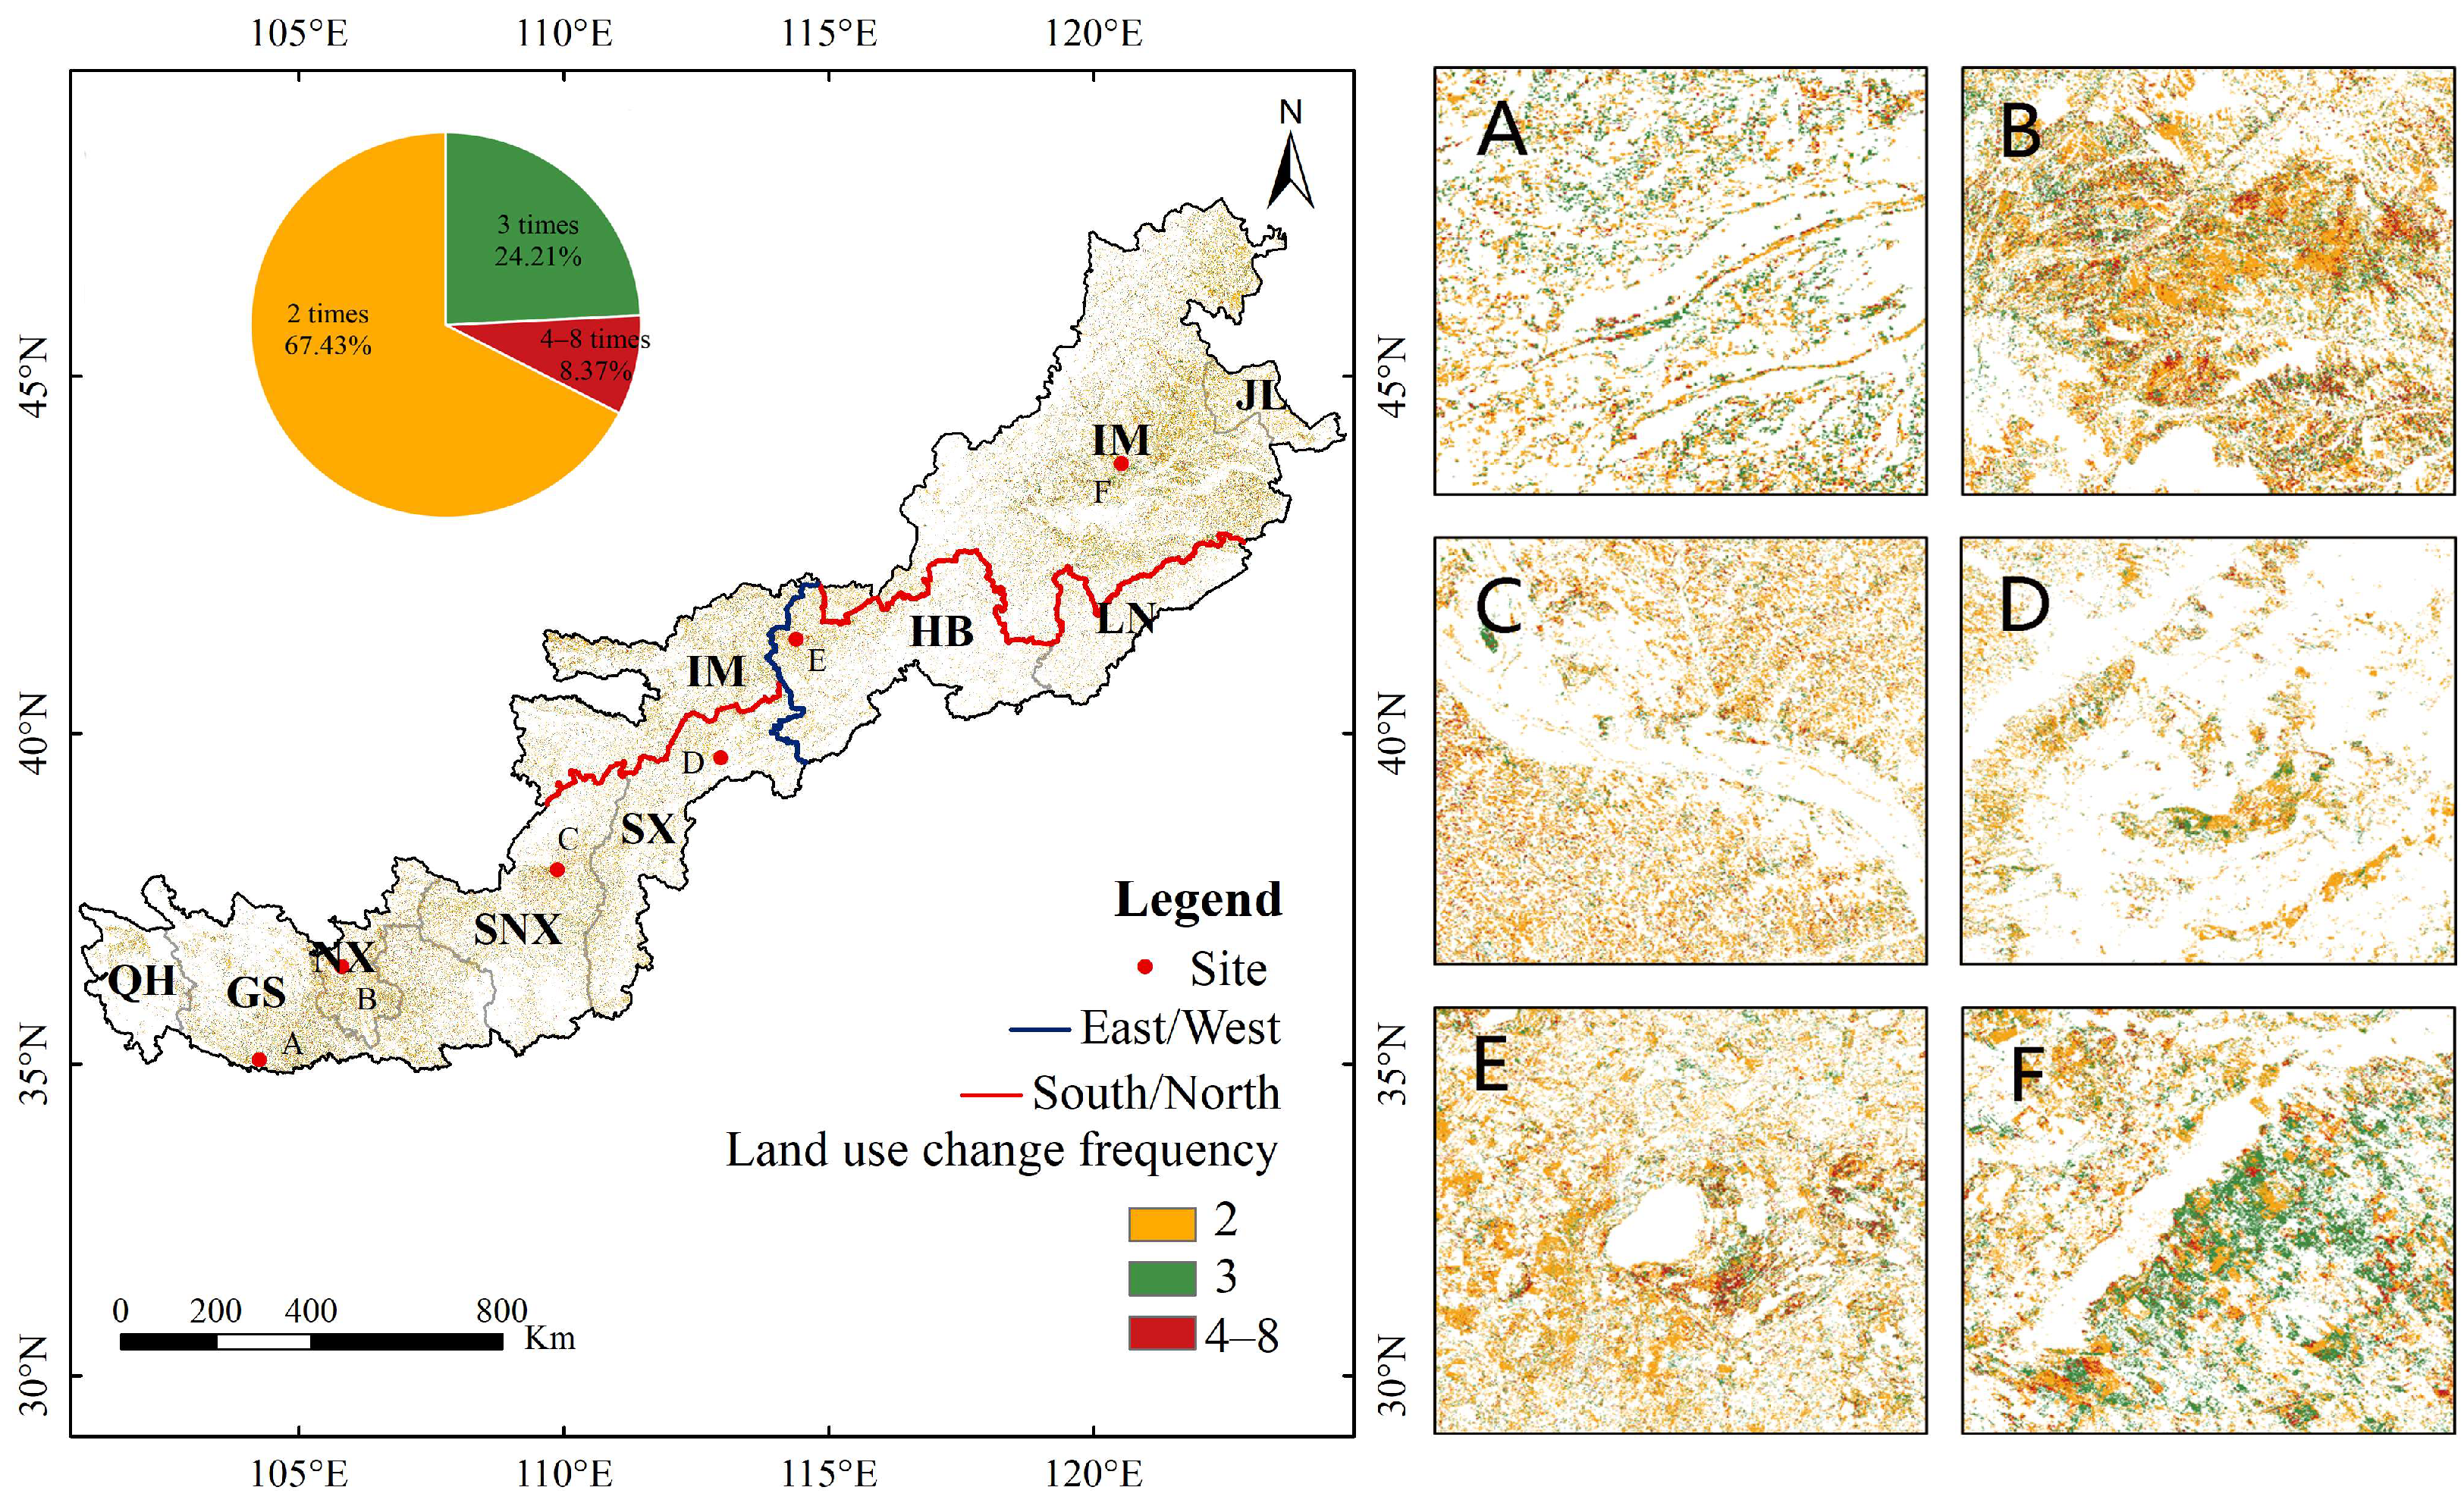
Over the past 30 years, changes in cropland abandonment and reclamation in the northern farming–pastoral zone mainly occurred 2–3 times, accounting for 91% of the total area (Figure 10). Few regions experienced a change frequency in abandonment and reclamation higher than four times. Spatially, the main areas with low frequencies of abandonment and reclamation include Inner Mongolia, Gansu, and Ningxia.
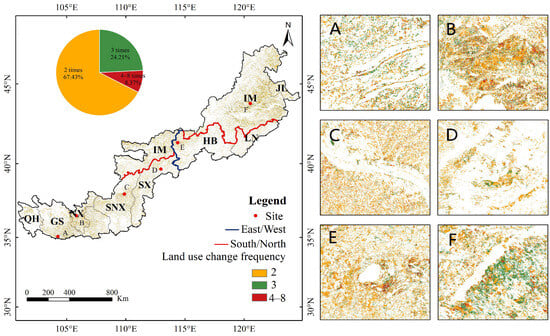
Figure 10.
Abandonment and reclamation change frequency from 1991 to 2019. The right figures (A–F) show the land use change frequency in typical sites of Gansu, Ningxia, Shaanxi, Shanxi, Hebei, and Inner Mongolia, respectively. In particular, this change excludes directional information, i.e., from abandonment to reclamation or reclamation to abandonment. See Figure 1 for the detailed definitions of the abbreviations of province names.
3.3. Suitability Ratings of Abandoned and Reclaimed Cropland
Given that cropland suitability in the northern farming–pastoral zone is mainly concentrated at moderate and marginal levels, most abandonment activities occurred in MoS (55,800 km2, accounting for 33.25% of the total area of abandoned cropland) and MaS (71,400 km2, 42.59%), while HS (21,000 km2, 12.58%) and NS (19,400 km2, 11.58%) experienced less cropland abandonment. Meanwhile, most reclamation activities were observed in MoS (45,400 km2, accounting for 32.1% of all reclaimed land) and MaS (58,500 km2, 41.37%), whereas land reclamation areas in HS (21,500 km2, 15.18%) and NS (16,000 km2, 11.36%) were more limited (Figure 11).
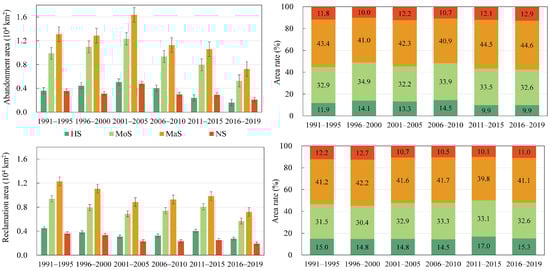
Figure 11.
Trends of the suitability of cropland abandonment and land reclamation over time. The left figures show the sum of the abandoned or reclaimed area in each period, and the right figures show the mean value of the rate of the reclaimed or abandoned area in each period.
Regarding the distribution of abandonment and reclamation in different suitability categories over the past decades, we found that the rate of cropland abandonment in NS and MaS increased gradually (from 51.6% to 57.5%), while the rate of land reclamation in HS and MoS was stable with a slight increase (46.6% vs. 47.9%). New cropland was shifted to areas with flatter terrain, lower slopes, and higher soil organic matter.
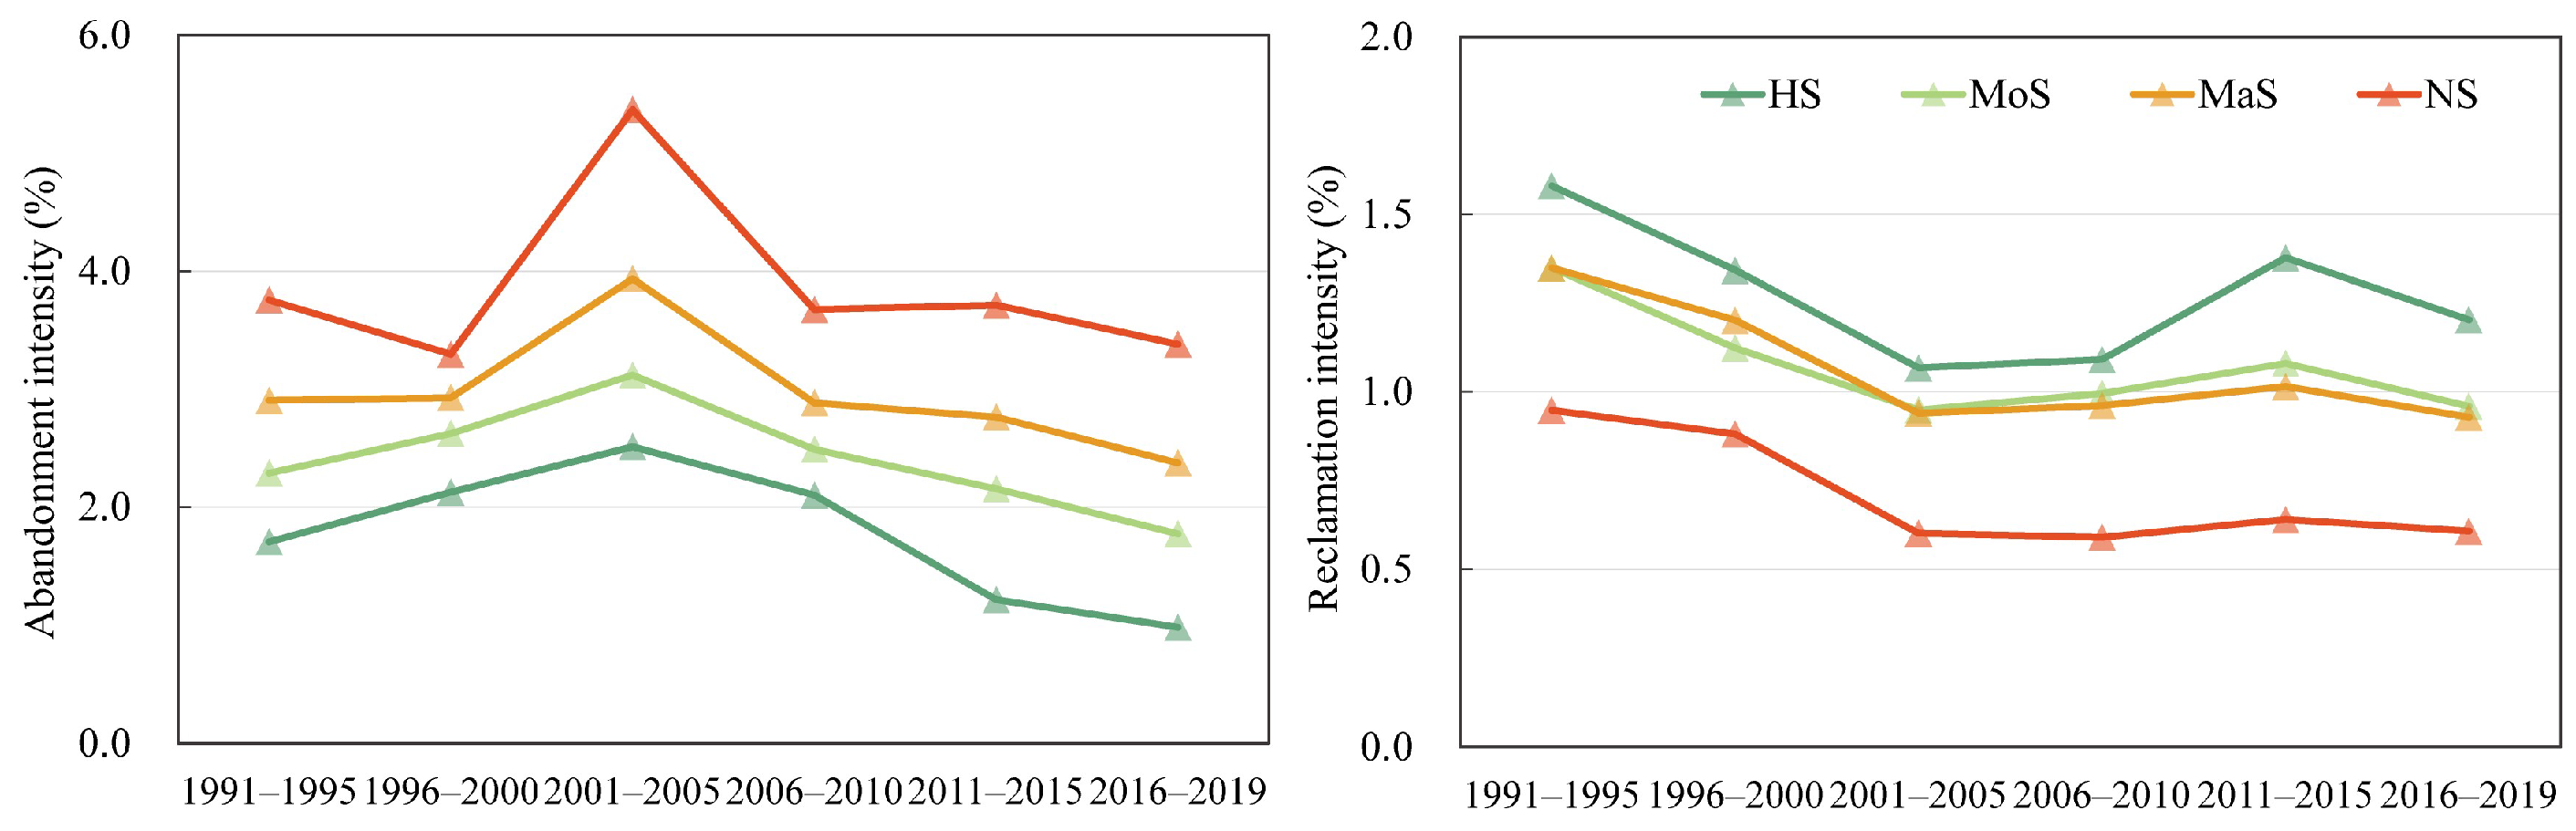
From the intensity of abandonment and reclamation (the rate of the change in abandoned area to cropland area/reclaimed area to natural land area) in areas of different suitability, the land abandonment intensity in HS and MoS is low (2.02–2.93%), and the intensity of land reclamation is relatively high (2.75–5.63%). In contrast, the land reclamation intensity in MaS and NS is low (1.54–2.3%), and the intensity of land abandonment is relatively high (5.75–9.31%). The results demonstrate that both the government’s land use policy at the macro level and the individual farmers’ decisions at the micro level are quite rational in determining abandoned and reclaimed land (Figure 12).

Figure 12.
Trends of cropland abandonment and land reclamation intensity in different suitable areas over time.
4. Discussion
4.1. Cropland Change Process Detection
Through monitoring the long-term changes of cropland abandonment and land reclamation in the farming–pastoral zone of northern China, this study explores the development stages and suitability level that the cropland undergoes in different periods of land use activities. With the land cover dataset (CLCD), we provided a cropland abandonment and land reclamation mapping method based on actual land use processes to investigate spatiotemporal features and frequency of cropland change. This method regards fallow as part of the actual cropland in the year to detect abandonment. The cropland change pattern derived by this method is time-stable and more accurate than the analysis relying on land cover datasets with coarse resolution at multiple time points. For instance, a recent study on land use change utilizing three periods of remote sensing imagery revealed that the total area of abandoned cropland in the study area from 2000 to 2020 was 36,725 km2. However, our findings demonstrate that when considering the presence of fallow, the total area of abandoned cropland is only 30,500 km2 [34]. This reflects the quantitative differences resulting from changes in assessment methods, reminding us to fully consider the complexity and variability of land use types. In addition, the method uses a complete satellite record to consider the occurrence of abandonment and reclamation, providing the specific time and magnitude of cropland transition and detecting fallow, which can be easily applied to other studies using longer or shorter time thresholds. Overall, the methodological approach developed in this study offers a valuable tool for researchers worldwide interested in monitoring cropland changes in similar agroecological zones. The findings of this study provide insights into land management practices and policy making in the farming–pastoral zone of northern China.
4.2. Uncertainty of Data and Methods
Compared with other datasets, the CLCD has advantages in terms of temporal and spatial resolution. However, this dataset is still one of the leading causes of uncertainty in the analysis of cropland dynamics. In particular, the “selecting training sample points based on year-specific CLUD” method was adopted for annual LCC mapping. This method leads to a dependence of CLCD accuracy on CLUD accuracy, and our results may be potentially affected by the misclassification of the original data. In addition, because of the presence of mixed pixels, errors in the analysis of cropland dynamics may come from the spectral similarities between cropland and grassland. While we did not explicitly test the accuracy of the CLCD in the farming–pastoral zone, previous studies have shown this possibility [5]. Despite these limitations, our results support the CLCD’s potential for analyzing cropland dynamics. Based on this, future studies will investigate combining on-the-ground field surveys with high-resolution satellite imagery to improve the accuracy of the CLCD in analyzing agricultural land dynamics. Such efforts aim to augment the reliability and precision of decision-making processes.
According to the definitions of “cropland abandonment” and “land reclamation” in Section 2.3, the rules of cropland abandonment we defined are strict, while the rules of land reclamation are relatively lenient. The reclamation map obtained by the above method includes intermittent cultivation for four years, while the abandonment map only includes natural land for four successive years. Based on the understanding of the FAO definition and actual land use, we believe that the extraction technique of the cropland abandonment and land reclamation process with the support of GEE is reasonable, and this is also the usual practice of related research [5,31]. Moreover, since the net change of cropland in Figure 7 reflects the multi-year land use change processes, while the net change in Figure 4 reflects the land cover change in adjacent years, the two results differ, which also demonstrates the importance of considering land use processes in the analysis of cropland change. Accordingly, focusing on the long-term process of cropland change can provide a more comprehensive view of land use dynamics and trends, which not only helps to reveal broader patterns of land use evolution but also enables more effective decision-making support and promotes sustainable land management.
4.3. Dynamics, Driving Mechanism, and Suitability of Cropland Change
The study indicated that the cropland in the northern farming–pastoral zone declined from 1990 to 2020. The region has undergone three cropland change stages: a slight decrease before 2000, a significant decline from 2000 to 2010, and a slight fluctuation after 2010. This trend is consistent with some studies in typical zones. For instance, Yang et al. [35] observed a significant decrease in cropland in the northeastern farming–pastoral zone between 1987 and 2007; Xue et al. [36] reported that the northern farming–pastoral zone exhibited a clear greening trend from 1982 to 2015. Before our study, we knew only one study used a trajectory-based change monitoring method to map abandonment and reclamation in a typical farming–pastoral zone. Other studies of cropland change either rely on coarse-resolution satellite data [14] or are poorly defined [37], only assuming that changes at multiple time points reflect cropland abandonment or reclamation.
The study indicated widespread cropland abandonment and land reclamation occurred over the past 30 years in the farming–pastoral zone of northern China. In particular, the abandonment rate of low-quality cropland remains high, while the reclamation rate of high-quality cropland remains high. This indicates that considering only the natural conditions, the land use pattern in the farming–pastoral zone of northern China shows a clear selective tendency. Farmers and herders are inclined to choose land with gentle slopes, lower elevation, suitable soil pH, high organic matter, and sufficient hydrothermal conditions for cultivation. Conversely, land characterized by high elevation and low effective soil thickness is largely abandoned. Furthermore, a clear reverse trend exists in the temporal patterns of cropland abandonment and land reclamation. Specifically, in the farming–pastoral zone of northern China, land abandonment intensity surged in the early 21st century (2001–2005), followed by a continuous decline (2006–2019), reaching its lowest level in the last 4 years. In contrast, land reclamation intensity showed a continuous decline during the late 20th century (1991–2000) and the early 21st century (2001–2005), followed by a slight increase (2006–2015). Over the past 4 years, land reclamation intensity has remained relatively stable.
This non-linear temporal dynamic in land systems is closely related to policies and economic development [18,34]. Around the beginning of the 21st century, the Chinese government launched a series of projects to restore natural vegetation, including the Returning Farmlands to Forest and Grassland Project (also known as the “Grain to Green Program”, GGP) and the Beijing and Tianjin Sandstorm Source Treatment Project (BTSST). The former aims to convert cropland on steep slopes or with low yields as well as grassland into forest, while the latter aims to reduce the sources of sandstorms by re-vegetating cropland. Against the background of national land restoration programs, a large amount of cropland in mountain areas has been converted into forests or grasslands [38]. As pilot areas, Shaanxi and Gansu witnessed a rapid increase in the abandonment rate during the first 5 years of the 21st century (Figure 9). However, a large amount of abandoned cropland has led to a rapid decrease in the sown grain areas, which prompted the government to limit the retirement program in 2004 and 2005 [14]. This is evidenced by significantly declining cropland abandonment rates in the provinces enrolled in the GGP and BTSST programs (Figure 9). The study results accurately reflect the dynamics of abandonment at the specified time points, demonstrating the effects of the Chinese government’s policy changes in agriculture and ecological balance management since 1990. In addition, urbanization and industrialization are also important drivers of land use change [39]. It has been shown that China’s accelerated urbanization and continued rural–urban labor migration have resulted in a significant amount of cropland abandonment over the past 20 years, not only in areas with unfavorable cultivation conditions but also in well-connected areas. This results from higher profit anticipated from new economic opportunities and urbanization [40].
The study found that the cropland suitability in the northern farming–pastoral zone is relatively low. But in the last decade, the rate of cropland abandonment occurring in the areas of high and moderate suitability has decreased, and the land reclamation rate has increased. New cropland was shifted to areas with better habitat suitability for crops. This shift demonstrates the effectiveness of the Chinese government’s ecological protection and management plan since 1990. The result is in line with Ouyang et al. [41], who found that ecosystem services were improved from 2000 to 2010. However, it is essential to note that much marginal and low-quality land is still in continuous agricultural use. Land desertification is likely to increase if these lands are not converted to ecological use soon. Meanwhile, the conversion of moderate-suitability cropland should be gradual to avoid the risk of food insecurity that may arise from rapid conversion. In addition, we lack socio-economic and agricultural policy factors in suitability assessment (e.g., per capita gross domestic product). Undoubtedly, an integrated suitability that includes more factors can better evaluate the rationality of land use within the natural–economic–social framework, which is necessary for sustainable management.
5. Conclusions
An adequate understanding of the extent and suitability of cropland abandonment and land reclamation in the farming–pastoral zone of northern China is an essential requirement for sustainable development. In the study, by using a long time-series analysis based on the land use process, we monitored the spatiotemporal pattern of cropland abandonment, land reclamation, and the change frequency in the farming–pastoral zone of northern China, taking into account the existence of fallow land, then investigated the rationality of abandonment and reclamation. We observed that in the past 30 years, extensive cropland abandonment and land reclamation have occurred in the farming–pastoral zone of northern China. During this period, changes in cropland have mainly undergone three distinct phases, including alternating abandonment and reclamation before 2000, apparent abandonment after 2000, and low-level reclamation after 2010. In addition, although the overall suitability of cropland in the region is relatively low, a large number of unsuitable areas with high altitudes and low effective soil thickness have been abandoned in the last decade, while the rate of reclamation in highly suitable areas with favorable natural conditions has gradually increased.
Although our study can reflect the extent, timing, and trends of changes in cropland in the farming–pastoral zone of northern China, given the continuous and widespread occurrence of cropland abandonment and land reclamation, the fine detection of cropland changes requires more high-quality land cover datasets, which imposes higher requirements on the stability of satellite data and the reliability of remote sensing interpretation methods. In future cropland planning, it is imperative to deeply investigate whether land use can be gradually adjusted to balance ecology and agriculture for many marginal and low-quality croplands, improving the efficiency of crop production while slowing down land degradation. Furthermore, besides essential natural factors, the comprehensive consideration of technological and economic aspects in cropland suitability assessment may prove to be more rational, which is of positive significance for the analysis of ecosystem service changes. We expect that the framework and results of this study can provide valuable information for future cropland monitoring and the agricultural and ecologically sustainable development in the farming–pastoral zone of northern China.
Supplementary Materials
We provide the principal codes for GEE data processing. The code available for producing annual land use maps, cropland abandonment maps, land reclamation maps, and land change frequency maps are as follows: https://code.earthengine.google.com/a32d79348c0fa87ca6195783983a4f4d (accessed on 10 March 2024).
Author Contributions
J.Y.: Methodology, Software, Visualization, Writing—Original Draft, Writing—Reviewing and Editing; Y.H.: Conceptualization, Methodology, Funding acquisition, Supervision; Z.F.: Supervision; L.Z.: Writing—Reviewing and Editing; Y.S.: Writing—Reviewing and Editing; Q.T.: Software; Y.Z.: Software. All authors have read and agreed to the published version of the manuscript.
Funding
This research was funded by the National Natural Science Foundation of China (42371304, 42130508, and 41977421), and the Programme of Key Project of Innovation LREIS (KPI011).
Data Availability Statement
The raw data supporting the conclusions of this article will be made available by the authors on request.
Acknowledgments
We thank all our peers who helped us in the data analysis and collection phase. Special thanks to the five reviewers for their efforts to improve the quality of the article.
Conflicts of Interest
The authors declare no conflicts of interest.
References
- West, P.C.; Gibbs, H.K.; Monfreda, C.; Wagner, J.; Barford, C.C.; Carpenter, S.R.; Foley, J.A. Trading carbon for food: Global comparison of carbon stocks vs. crop yields on agricultural land. Proc. Natl. Acad. Sci. USA 2010, 107, 19645–19648. [Google Scholar] [CrossRef]
- Foley, J.A.; DeFries, R.; Asner, G.P.; Barford, C.; Bonan, G.; Carpenter, S.R.; Chapin, F.S.; Coe, M.T.; Daily, G.C.; Gibbs, H.K.; et al. Global consequences of land use. Science 2005, 309, 570–574. [Google Scholar] [CrossRef] [PubMed]
- Lasanta, T.; Arnaez, J.; Pascual, N.; Ruiz-Flano, P.; Errea, M.P.; Lana-Renault, N. Space-time process and drivers of land abandonment in Europe. Catena 2017, 149, 810–823. [Google Scholar] [CrossRef]
- Godfray, H.; Beddington, J.; Crute, I.; Haddad, L.; Lawrence, D.; Muir, J.; Pretty, J.; Robinson, S.; Thomas, S.; Toulmin, C. Food security: The challenge of feeding 9 billion people. Science 2010, 327, 812–818. [Google Scholar] [CrossRef]
- Du, Z.R.; Yang, J.Y.; Ou, C.; Zhang, T.T. Agricultural Land Abandonment and Retirement Mapping in the Northern China Crop-Pasture Band Using Temporal Consistency Check and Trajectory-Based Change Detection Approach. IEEE Trans. Geosci. Remote Sens. 2022, 60, 4406712. [Google Scholar] [CrossRef]
- Jian, Y.Q.; Liu, Z.J.; Gong, J.Z. Response of landscape dynamics to socio-economic development and biophysical setting across the farming-pastoral ecotone of northern China and its implications for regional sustainable land management. Land Use Policy 2022, 122, 106354. [Google Scholar] [CrossRef]
- Xu, D.; Li, C.; Song, X.; Ren, H. The dynamics of desertification in the farming-pastoral region of North China over the past 10years and their relationship to climate change and human activity. Catena 2014, 123, 11–22. [Google Scholar] [CrossRef]
- Ye, J.Z.; Hu, Y.F.; Zhen, L.; Wang, H.; Zhang, Y.X. Analysis on Land-Use Change and Its Driving Mechanism in Xilingol, China, during 2000–2020 Using the Google Earth Engine. Remote Sens. 2021, 13, 5134. [Google Scholar] [CrossRef]
- Yin, R.; Yin, G.; Li, L. Assessing China’s Ecological Restoration Programs: What’s Been Done and What Remains to Be Done? Environ. Manag. 2010, 45, 442–453. [Google Scholar] [CrossRef]
- Liang, X.Y.; Li, Y.B.; Zhou, Y.L. Study on the abandonment of sloping farmland in Fengjie County, Three Gorges Reservoir Area, a mountainous area in China. Land Use Policy 2020, 97, 104760. [Google Scholar] [CrossRef]
- Ning, J.; Liu, J.; Kuang, W.; Xu, X.; Zhang, S.; Yan, C.; Li, R.; Wu, S.; Hu, Y.; Du, G.; et al. Spatiotemporal patterns and characteristics of land-use change in China during 2010–2015. J. Geogr. Sci. 2018, 28, 547–562. [Google Scholar] [CrossRef]
- Chen, W.; Li, A.J.; Hu, Y.G.; Li, L.H.; Zhao, H.M.; Han, X.R.; Yang, B. Exploring the long-term vegetation dynamics of different ecological zones in the farming-pastoral ecotone in northern China. Environ. Sci. Pollut. Res. 2021, 28, 27914–27932. [Google Scholar] [CrossRef]
- Wuyun, D.; Sun, L.; Chen, Z.X.; Hou, A.H.; Crusiol, L.G.T.; Yu, L.F.; Chen, R.Q.; Sun, Z. The spatiotemporal change of cropland and its impact on vegetation dynamics in the farming-pastoral ecotone of northern China. Sci. Total Environ. 2022, 805, 150286. [Google Scholar] [CrossRef] [PubMed]
- Yin, H.; Pflugmacher, D.; Li, A.; Li, Z.G.; Hostert, P. Land use and land cover change in Inner Mongolia—Understanding the effects of China’s re-vegetation programs. Remote Sens. Environ. 2018, 204, 918–930. [Google Scholar] [CrossRef]
- Liu, H.; Gong, P.; Wang, J.; Clinton, N.; Bai, Y.Q.; Liang, S.L. Annual dynamics of global land cover and its long-term changes from 1982 to 2015. Earth Syst. Sci. Data 2020, 12, 1217–1243. [Google Scholar] [CrossRef]
- Friedl, M.A.; McIver, D.K.; Hodges, J.C.F.; Zhang, X.Y.; Muchoney, D.; Strahler, A.H.; Woodcock, C.E.; Gopal, S.; Schneider, A.; Cooper, A.; et al. Global land cover mapping from MODIS: Algorithms and early results. Remote Sens. Environ. 2002, 83, 287–302. [Google Scholar] [CrossRef]
- Gong, P.; Liu, H.; Zhang, M.N.; Li, C.C.; Wang, J.; Huang, H.B.; Clinton, N.; Ji, L.Y.; Li, W.Y.; Bai, Y.Q.; et al. Stable classification with limited sample: Transferring a 30-m resolution sample set collected in 2015 to mapping 10-m resolution global land cover in 2017. Sci. Bull. 2019, 64, 370–373. [Google Scholar] [CrossRef]
- Liu, J.Y.; Zhang, Z.X.; Xu, X.L.; Kuang, W.H.; Zhou, W.C.; Zhang, S.W.; Li, R.D.; Yan, C.Z.; Yu, D.S.; Wu, S.X.; et al. Spatial patterns and driving forces of land use change in China during the early 21st century. J. Geogr. Sci. 2010, 20, 483–494. [Google Scholar] [CrossRef]
- Zhang, X.; Liu, L.; Chen, X.; Gao, Y.; Xie, S.; Mi, J. GLC_FCS30: Global land-cover product with fine classification system at 30 m using time-series Landsat imagery. Earth Syst. Sci. Data 2021, 13, 2753–2776. [Google Scholar] [CrossRef]
- Yang, J.; Huang, X. The 30 m annual land cover dataset and its dynamics in China from 1990 to 2019. Earth Syst. Sci. Data 2021, 13, 3907–3925. [Google Scholar] [CrossRef]
- Wang, X.H.; Lu, C.H.; Fang, J.F.; Shen, Y.C. Implications for development of grain-for-green policy based on cropland suitability evaluation in desertification-affected north China. Land Use Policy 2007, 24, 417–424. [Google Scholar] [CrossRef]
- Morton, D.C.; Noojipady, P.; Macedo, M.M.; Gibbs, H.; Victoria, D.C.; Bolfe, E.L. Reevaluating suitability estimates based on dynamics of cropland expansion in the Brazilian Amazon. Glob. Environ. Chang. 2016, 37, 92–101. [Google Scholar] [CrossRef]
- Fu, B.J.; Meng, Q.H.; Qiu, Y.; Zhao, W.W.; Zhang, Q.J.; Davidson, D.A. Effects of land use on soil erosion and nitrogen loss in the hilly area of the Loess Plateau, China. Land Degrad. Dev. 2004, 15, 87–96. [Google Scholar] [CrossRef]
- Romano, G.; Dal Sasso, P.; Trisorio Liuzzi, G.; Gentile, F. Multi-criteria decision analysis for land suitability mapping in a rural area of Southern Italy. Land Use Policy 2015, 48, 131–143. [Google Scholar] [CrossRef]
- Ustaoglu, E.; Sisman, S.; Aydınoglu, A.C. Determining agricultural suitable land in peri-urban geography using GIS and Multi Criteria Decision Analysis (MCDA) techniques. Ecol. Modell. 2021, 455, 109610. [Google Scholar] [CrossRef]
- He, Z.L.L.; Yang, X.E.; Stoffella, P.J. Trace elements in agroecosystems and impacts on the environment. J. Trace Elem. Med. Biol. 2005, 19, 125–140. [Google Scholar] [CrossRef]
- Tao, Z.; Wang, S.; Sun, P.; Li, K.; Tian, W.; Han, X.J.A.L.G. Spatio-Temporal Differentiation and Driving Factors of Cropland in the Agro-Pastoral Ecotone of Northern China. J. Nat. Resour. 2022, 45, 153–163. [Google Scholar]
- Zhang, G.; Azorin-Molina, C.; Shi, P.; Lin, D.; Guijarro, J.A.; Kong, F.; Chen, D. Impact of near-surface wind speed variability on wind erosion in the eastern agro-pastoral transitional zone of Northern China, 1982–2016. Agric. For. Meteorol. 2019, 271, 102–115. [Google Scholar] [CrossRef]
- Farr, T.G.; Rosen, P.A.; Caro, E.; Crippen, R.; Duren, R.; Hensley, S.; Kobrick, M.; Paller, M.; Rodriguez, E.; Roth, L.; et al. The shuttle radar topography mission. Rev. Geophys. 2007, 45, RG2004. [Google Scholar] [CrossRef]
- Rodell, M.; Houser, P.R.; Jambor, U.; Gottschalck, J.; Mitchell, K.; Meng, C.J.; Arsenault, K.; Cosgrove, B.; Radakovich, J.; Bosilovich, M.; et al. The global land data assimilation system. Bull. Am. Meteorol. Soc. 2004, 85, 381–394. [Google Scholar] [CrossRef]
- Yin, H.; Brandão, A.; Buchner, J.; Helmers, D.; Iuliano, B.G.; Kimambo, N.E.; Lewińska, K.E.; Razenkova, E.; Rizayeva, A.; Rogova, N.; et al. Monitoring cropland abandonment with Landsat time series. Remote Sens. Environ. 2020, 246, 111873. [Google Scholar] [CrossRef]
- FAO. The Role of Agriculture and Rural Development in Revitalizing Abandoned/Depopulated Areas; FAO: Rome, Italy, 2006. [Google Scholar]
- Dedeoğlu, M.; Dengiz, O. Generating of land suitability index for wheat with hybrid system approach using AHP and GIS. Comput. Electron. Agric. 2019, 167, 105062. [Google Scholar] [CrossRef]
- Sun, P.L.; Qu, L.; Liu, Q.G.; Xu, Y.Q.; Gong, Q.Q. Spatiotemporal differentiation characteristics and driving factors of ecological restoration in the agro-pastoral ecotone of northern China. Resour. Sci. 2022, 44, 943–954. [Google Scholar] [CrossRef]
- Yang, Z.; Li, Q.; Wei, B.; Niu, J.Z.; Fan, Z.P.; Wang, H.L.; Han, J.C.; Zhang, G.F.; Shao, W.W. Analysis of Land Use/Cover Cnanges or Typical Agro-pasture Zigzag Zone in Northeast China. Res. Soil Water Conserv. 2010, 17, 212–216+221. [Google Scholar]
- Xue, Y.Y.; Zhang, B.Q.; He, C.S.; Shao, R. Detecting Vegetation Variations and Main Drivers over the Agropastoral Ecotone of Northern China through the Ensemble Empirical Mode Decomposition Method. Remote Sens. 2019, 11, 1860. [Google Scholar] [CrossRef]
- Dong, J.W.; Liu, J.Y.; Yan, H.M.; Tao, F.L.; Kuang, W.H. Spatio-temporal pattern and rationality of land reclamation and cropland abandonment in mid-eastern Inner Mongolia of China in 1990–2005. Environ. Monit. Assess. 2011, 179, 137–153. [Google Scholar] [CrossRef] [PubMed]
- Zhang, P.; Shao, G.; Zhao, G.; Le Master, D.C.; Parker, G.R.; Dunning, J.B.; Li, Q. China’s Forest Policy for the 21st Century. Science 2000, 288, 2135–2136. [Google Scholar] [CrossRef] [PubMed]
- Mao, D.H.; He, X.Y.; Wang, Z.M.; Tian, Y.L.; Xiang, H.X.; Yu, H.; Man, W.D.; Jia, M.M.; Ren, C.Y.; Zheng, H.F. Diverse policies leading to contrasting impacts on land cover and ecosystem services in Northeast China. J. Clean. Prod. 2019, 240, 117961. [Google Scholar] [CrossRef]
- Qiu, B.; Yang, X.; Tang, Z.; Chen, C.; Li, H.; Berry, J. Urban expansion or poor productivity: Explaining regional differences in cropland abandonment in China during the early 21st century. Land Degrad. Dev. 2020, 31, 2540–2551. [Google Scholar] [CrossRef]
- Ouyang, Z.; Zheng, H.; Xiao, Y.; Polasky, S.; Liu, J.; Xu, W.; Wang, Q.; Zhang, L.; Xiao, Y.; Rao, E.M.; et al. Improvements in ecosystem services from investments in natural capital. Science 2016, 352, 1455–1459. [Google Scholar] [CrossRef]


Disclaimer/Publisher’s Note: The statements, opinions and data contained in all publications are solely those of the individual author(s) and contributor(s) and not of MDPI and/or the editor(s). MDPI and/or the editor(s) disclaim responsibility for any injury to people or property resulting from any ideas, methods, instructions or products referred to in the content. |
© 2024 by the authors. Licensee MDPI, Basel, Switzerland. This article is an open access article distributed under the terms and conditions of the Creative Commons Attribution (CC BY) license (https://creativecommons.org/licenses/by/4.0/).