Abstract
The Fabry–Perot interferometer (FPI) plays a crucial role as the frequency discriminator in the incoherent Doppler wind lidar. However, in the practical receiver system, reflections occurring between optical elements introduce non-normal incident components in the light beams passing through the FPI. This phenomenon results in the deformation of the FPI transmission spectral lines. Based on that, a theoretical model has been developed to describe the transmission spectrum of the FPI when subjected to obliquely incident light beams with a divergence angle. By appropriately adjusting the model parameters, the simulated transmission spectrum of the FPI edge channels can coincide with the experimentally measured FPI spectral line. Subsequently, the impact of deformations in the transmission spectrum of the two edge channels on wind measurements is evaluated. The first implication is a systematic shift of 30.7 m/s in line-of-sight (LOS) wind velocities. This shift is based on the assumption that the lidar echo is solely backscattered from atmospheric molecules. The second consequence is the inconsistency in the response sensitivities of Doppler frequency shift between Rayleigh signals and Mie signals. As a result, the lidar system fails to fully achieve its initial design objectives, particularly in effectively suppressing interference from Mie signals. The presence of aerosols can introduce a significant error of several meters per second in the measurement of LOS wind velocity.
1. Introduction
Measurements of the wind field in the middle atmosphere (10~80 km) hold significant scientific and practical value in various fields, including atmospheric dynamics, climate research, and aircraft design [1,2,3,4,5,6]. To conduct continuous wind measurements in this altitude range, direct detection (incoherent) Doppler lidar systems equipped with powerful lasers and large-aperture telescopes are required [7,8,9,10]. Incoherent Doppler lidar utilizes a narrow-line-width pulse laser and frequency discriminators to extract Doppler shift by detecting intensity changes of the echo signals. The Fabry–Perot interferometer (FPI) has been widely used as the primary frequency discriminator in wind lidar applications since its initial adoption by Chanin et al. at the Observatory of Haute Provence (OHP) in 1989 [11]. The Arecibo system and the Goddard Lidar Observatory for Winds (GLOW) system are also notable examples of incoherent Doppler lidar systems [12,13].
The FPI spectrum exhibits periodic characteristics, with the laser frequency positioned on the slope of the spectrum line. As the wind field induces Doppler frequency shifts in the lidar echoes, the signal intensity passing through the FPI undergoes changes. Korb proposed the dual-edge technique, which has gained widespread usage in wind lidar applications [14,15]. This technique involves controlling the coating thickness on the FPI substrate to establish two detection channels, each with identical performance but with a frequency gap between them. The collimated echo light is evenly split into the two edge channels. When the atmospheric backscattered signals experience a Doppler frequency shift relative to the emitted laser frequency, the signals of the two edge channels exhibit intensity changes of approximately equal magnitude but with opposite signs.
Under ideal conditions, when the light beam is incident on the FPI normally, its transmission spectrum follows an Airy-type pattern. Generally, researchers employ nonlinear fitting techniques to fit the measured FPI transmission spectrum data into a smooth Airy curve [16,17,18,19]. However, during the development of the rotary-platform-mounted Doppler lidar [20], we encountered a distinct phenomenon. For FPI with high resolution, when the light beam has a divergent angle and is not incident normally, the transmission spectrum of FPI deviates from the expected Airy curve. Even when the light beam is incident vertically on the FPI, reflections occurring on the optical surfaces within the receiving system can lead to multiple reflections of the light beam, further complicating the FPI transmission spectrum. This phenomenon and its impact on wind measurements have received limited attention in previous research.
This paper is organized as follows. In Section 2, the theoretical calculation of the FPI transmission spectrum under small incident angle is introduced. In Section 3, the deformation of the FPI spectrum line caused by secondary reflection of a light beam is simulated and compared with measured FPI spectrum. In Section 4, the discussion will focus on two topics: 1. For pure Rayleigh backscattering signals, the wind measurement error directly introduced by the deformation of the FPI spectrum lines. 2. For Rayleigh–Mie backscattering signals, the wind measurement error caused by the inconsistent Doppler shift responses of the two signals.
2. Theory and Modeling
2.1. FPI Spectrum Lines under Normally Incident Light Beam
When monochromatic parallel light of frequency ν is incident on an ideal F-P interferometer, the transmission spectrum function is:
where τ and R are the transmittance and reflectivity of FPI at frequency ν, respectively. θ is the incident angle of the light beam. , is the free spectral range (FSR) of the interferometer. c is the light speed in vacuum, d is the cavity length of the FPI, n is the refractive index between two plates. The series expansion of Equation (1) yields [17,21,22,23,24]:
The coating layer on the inner surface of the interferometer’s two plates has the ability to absorb light. Assuming the absorption rate is A, then A + R + τ = 1. Equation (2) can be written as:
where is the peak transmittance of the interferometer.
The light beam in the actual receiving system is not parallel, but instead has a divergence angle. Assuming the total divergence angle of the beam is 2θ, and the distribution of light intensity is uniform, when the light beam is incident on the interferometer normally, the transmission spectrum function is:
By substituting Equation (3), it becomes:
The transmission spectrum lines of the two edge channels, under different incident beam divergence angles, are illustrated in Figure 1. As the divergence angle increases, the peak of the transmitted spectrum decreases, and the full width at half maximum (FWHM) broadens.
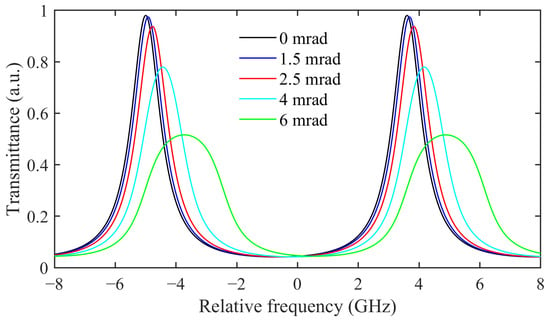
Figure 1.
Transmission spectrum lines of edge channels under different incident beam divergence angles.
2.2. FPI Spectrum Lines under Oblique Incident Light Beam with a Divergence Angle
We will discuss the situation of obliquely incident beam below. As shown in Figure 2a, a light beam with a divergence half angle θ0, incident on the interferometer with an angle α. Imagine the incident beam as a cone. The vertical distance from the cone’s apex (O point) to the surface of interferometer is H, the foot of the perpendicular is point B. The distance from O point to the center of the light spot on the interferometer surface (O′ point) is R. The plane containing segments OB and OO′ is defined as the incident plane. This cone can be viewed as an infinite assemblage of light rays. The geometric position of any ray can be represented by the angles θ and φ indicated in Figure 2b: the light ray is presented by OC. Passing through point C to form a perpendicular to the incident plane, the foot of the perpendicular is point C′. The angle between OO′ and OC is designated as θ, and the angle between OC and OC′ is designated as φ.
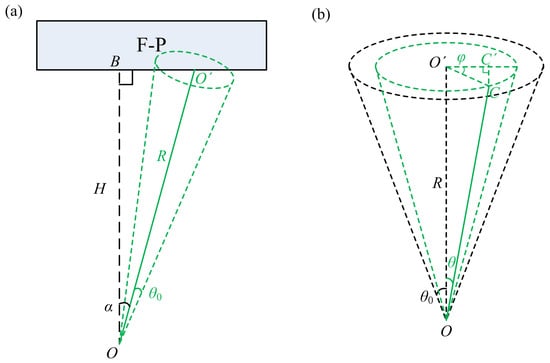
Figure 2.
(a) The case of beam with divergence angle obliquely incident on FPI. (b) The geometric position of any light ray in the beam.
Let us select the incident surface for analysis, as illustrated in Figure 3. The angle between OC and OB, namely the incidence angle of the light ray OC, is designated as β. The projection of OC onto the incident plane is OC′. Based on the geometric relationships illustrated in Figure 2 and Figure 3, β can be calculated by the following process:
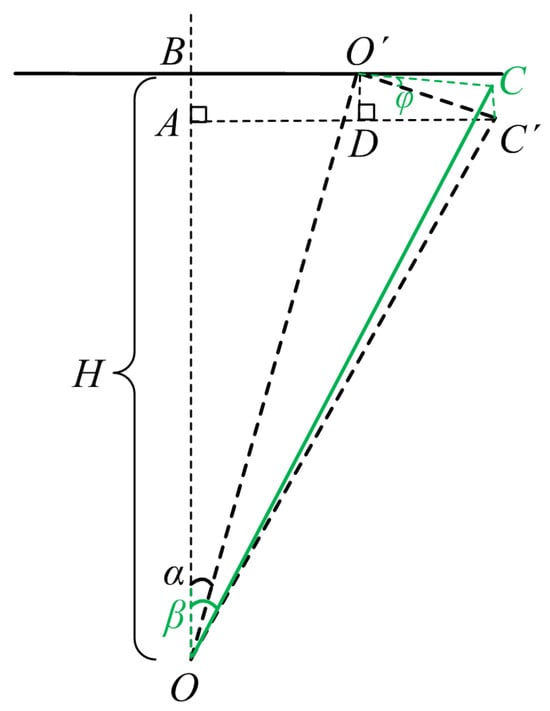
Figure 3.
The geometric relationship within the incident surface.
The incident angle of any ray within the cone can be calculated using Equation (9), and the transmittance function of this ray through the FPI can be obtained by Equation (3). By integrating all light rays within the cone using Equation (4), the FPI spectrum lines under an oblique incident light beam with a divergence angle is obtained. For a beam with a divergence angle of 2.5 mrad, when it is incident on the interferometer at various angles ranging from 0 mrad to 4 mrad, the transmission spectrum lines of the FPI are depicted in Figure 4. The result demonstrates that as the incidence angle of the beam increases, the quality of the FPI transmission spectrum significantly deteriorates.
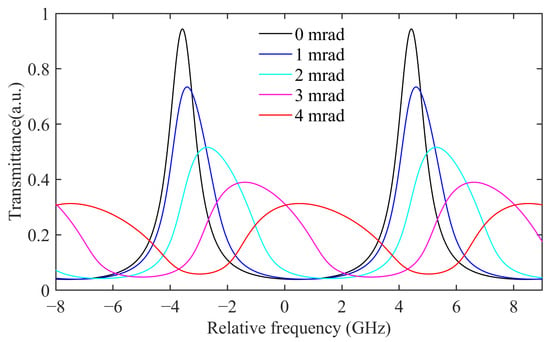
Figure 4.
The transmission spectrum lines of the FPI correspond to different incident angles.
2.3. FPI Spectrum Line under Multiple Incident Beams
While precise adjustments can ensure a normal beam incident on the interferometer, there is always the potential for multiple reflections between the optical elements in the receiver and the interferometer, leading to an oblique component in the incident beam. Based on the actual design parameters of the FPI, we have simulated its transmission spectrum. For the sake of simplicity, the analysis will be limited to the case of a single reflection. Based on the designed parameters, the effective reflectivity and absorptivity of the interferometer are set to 0.63 and 0.002, respectively. The FSR of the interferometer is set to 8.6 GHz. When the beam is incident normally for the first time, with a full divergence angle of 2.5 mrad, the transmission spectrum of the FPI (represented by T1(ν)) can be calculated using Equation (5), as shown by the blue solid line in Figure 5a. The corresponding reflection spectrum of FPI is represented by R(ν) and is illustrated by the blue dashed line in the same graph. After reflection from the front surface of the interferometer and the optical elements inside the receiver, the beam re-enters the FPI. Assuming the incident angle of the beam is 2.5 mrad, the transmission spectrum of the FPI for it is T2(ν), as shown by the green solid line in Figure 5a. Setting the reflectivity of optical elements to 0.08, the spectral lines of oblique incidence components can be represented as . The RT2 is indicated with a pink dashed line in Figure 5a. The final transmission spectrum is , as shown by the red solid line in Figure 5a.
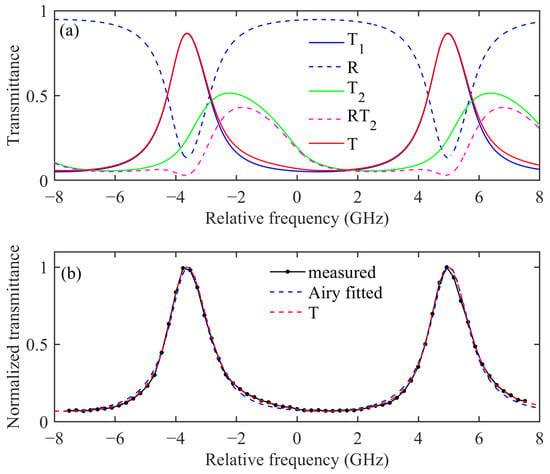
Figure 5.
The transmission spectrum lines of the FPI when multiple beams are incident. (a) Spectral components in the model (b) Measured transmission spectrum line, Airy fitting spectrum line, and calculated spectrum line for multiple beam incidence.
The actual transmission curve of an edge channel was measured and normalized, as shown by the point-to-point line in Figure 5b, in which the points represent the measured data. The curve T(ν), as calculated above, fits the measured curve very well, as illustrated by the red dashed line in Figure 5b. However, if the measured curve is fitted with the Airy function, there will be a slight divergence between them, as shown by the blue dashed line in Figure 5b. The results suggest that the multi-beam incidence model effectively represents the actual FPI transmission spectrum.
3. Impacts on Wind Measurement
The deformation of the transmission spectrum curves of the edge channels are often ignored. When researchers employ the Airy function to fit the curves and subsequently use these curves to process data, errors may be introduced into the wind measurement.
3.1. Impacts on the Response Curves
For simplicity, we assume that the transmission spectrum of the two edge channels has the same shape, but with a frequency interval of 3.48 GHz. The two edge channels are utilized to filter atmospheric backscattered echoes, and the lock channel ensures the center frequency of the FPI remains consistent with the laser frequency, as depicted in Figure 6. The signal intensities of the two edge channels were determined by the spectral convolutions between the atmospheric echoes and the edge channels, as indicated by the blue and cyan areas in the figure. The Doppler frequency shifts of echoes will change the relative position of the atmospheric backscattered spectrum, followed by the rise or fall of the two edge signals. Based on this, a response function of Doppler frequency shift has been developed:
where the subscripts 1, 2, or i indicate the edge channels, is the frequency, z is the height at which the echo was produced. I is the signal intensity detected by the edge channels, calculated from the channel detection constant C and the convolution of the transmittance spectrum of edge channels, , and the atmospheric backscattering spectrum, . The first-order derivative of the response function is defined as the response sensitivity:
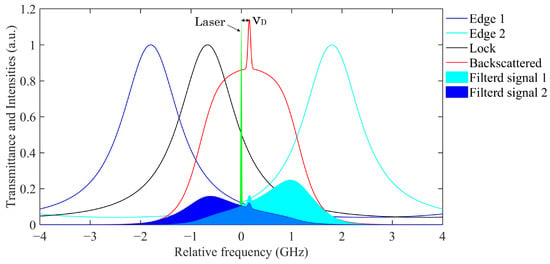
Figure 6.
Principle of Doppler shift determination using a triple channel FPI.
The line-of-sight (LOS) wind velocity VLOS is proportional to the Doppler frequency shift:
where is the Doppler frequency shift, λ is the laser wavelength. For the lidar system to work at 532.1 nm, the LOS wind velocity of 1 m/s corresponds to approximately 3.76 MHz of Doppler frequency shift. Therefore, the response curves of LOS wind velocity at various heights can be obtained. The shape of the Rayleigh scattering spectrum is determined by atmospheric temperature and pressure, leading to distinct response curves at different heights. Additionally, the width of the Rayleigh scattering spectrum differs from that of Mie scattering by several orders of magnitude, therefore the impact of Mie signals on the response curve must be considered. Figure 7 presents the response curves at the height of 24 km. The blue lines represent the response curves derived from the designed FPI spectral lines, which exhibit an Airy line shape. Through the appropriate design, the frequency response sensitivity of the FPI channels to Rayleigh signals and Mie signals can be kept consistent, thereby making the response curves of the two scattering signals almost overlap. However, the reflection between optical surfaces results in the deformation of the FPI spectral lines, deviating from the design. When the FPI operates at the same frequency, the response curves are shown as the red lines in Figure 7. The actual response curves exhibit significant deviation from the designed response curves. Furthermore, the response curves for Rayleigh and Mie signals are distinctly separated. At this time, if we still use the Airy function to fit the FPI spectral lines, we will generate incorrect LOS wind velocity response curves. Subsequently, we will analyze the resulting LOS wind velocity measurement errors in the two scenarios: pure Rayleigh signal and Rayleigh–Mie mixed signal.
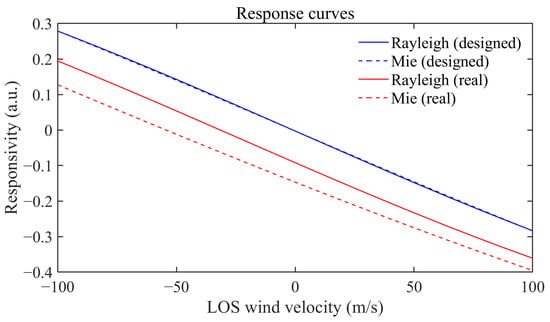
Figure 7.
The response curves of Rayleigh and Mie signals that derived from the actual FPI transmission spectral line and the designed FPI transmission spectral line.
3.2. For Pure Rayleigh Backscattering Signals
Our Doppler lidar is designed to measure wind field in the upper troposphere and stratosphere, where aerosol content is minimal, except in the presence of high clouds. Consequently, the lidar system is primarily designed to receive Rayleigh signals scattered by atmospheric molecules, while Mie signals are considered interference.
In the simulation, we assume that only the Rayleigh scattering component is present in the received signal. The input data for horizontal wind velocity and direction are derived from radiosonde, as illustrated in Figure 8a,b. The lidar operates with a pointing zenith angle of 22.5°, detecting the LOS wind velocities in the four cardinal directions: east, south, west, and north. By projecting the four LOS wind velocities onto the horizontal plane and subsequently performing vector synthesis, the horizontal wind velocity and direction can be determined [20]. Executing this process in reverse, based on the input wind field in Figure 8, can yield the LOS wind velocities in the four directions of east, south, west, and north, as illustrated by the solid lines in Figure 9, and then the Doppler frequency shifts of the four directions are obtained. Based on the transmission spectral lines of edge channels indicated by the red line in Figure 5b, we simulated the lidar signal profiles. However, when inverting the LOS wind velocities from the signal profiles, we utilized the blue dashed line in Figure 5b, resulting in a systematic shift of 30.7 m/s in all LOS wind velocities, as shown by the dashed lines in Figure 9. Fortunately, for the four-directional wind lidar, it is feasible to subtract the LOS wind velocities of two opposing directions (south–north and east–west) to compensate for this systematic shift. This is based on the assumption that the wind field remains constant during the measurement period and that the LOS wind velocities in opposing directions are equal but opposite. The final system errors in horizontal wind velocity and direction, defined as the discrepancy between retrieved and input wind profiles, are illustrated in Figure 10, exhibiting a negligible degree. However, for a wind lidar that observes along two orthogonal radial directions, it must eliminate this system error through specialized calibration. The calibration process can typically be performed by observing vertically and assuming that the vertical wind velocity is zero [25].
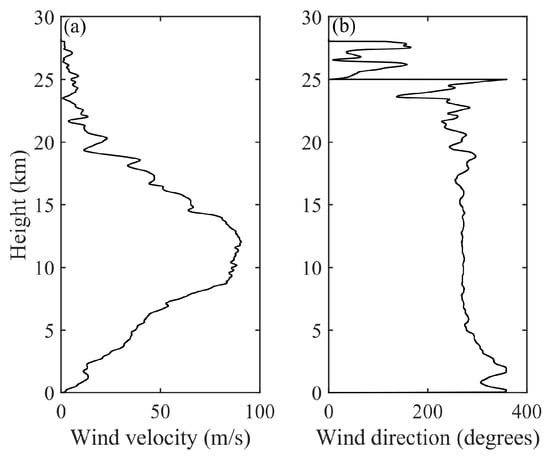
Figure 8.
The input horizontal (a) wind velocity and (b) wind direction profiles.
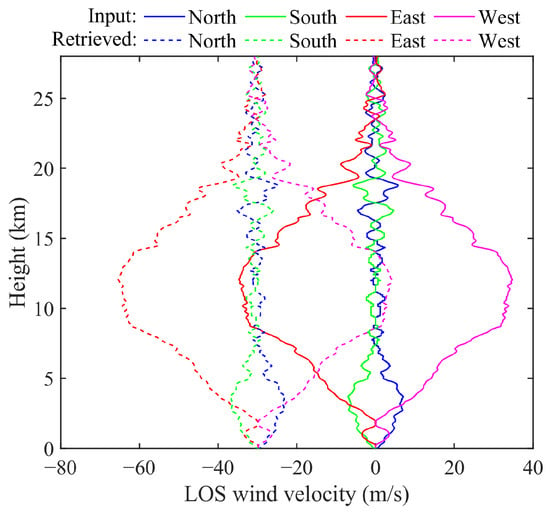
Figure 9.
The input (solid lines) and retrieved (dashed lines) LOS wind velocity profiles.
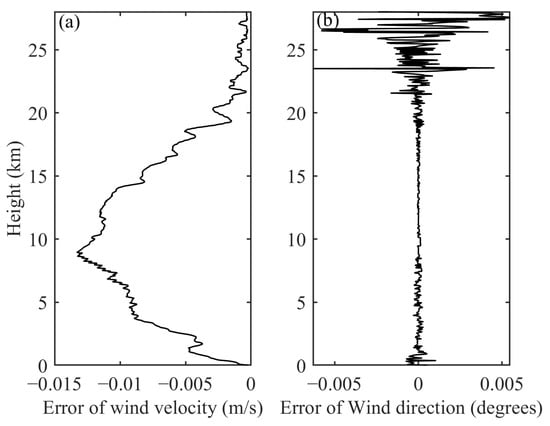
Figure 10.
The system error in the retrieved horizontal (a) wind velocity and (b) wind direction.
3.3. For Rayleigh–Mie Backscattering Signals
The system primarily measures the backscatter signal of atmospheric molecules, but there are inevitably aerosols and clouds present in the atmosphere, such as the stratospheric aerosol layer around 20 km, and the cirrus in the upper troposphere [26,27,28]. Therefore, the impact of Mie signals on wind measurement must be considered. In the design process of FPI, we set the frequency interval between the two edge channels at 3.48 GHz, with each transmittance band has a FWHM of 1.05 GHz, ensuring that the response sensitivities of Rayleigh and Mie signals are as consistent as possible, under the premise of sufficient signal-to-noise ratio [20]. The designed response sensitivity curves for Rayleigh and Mie signals are depicted in Figure 11, with the blue and red dashed lines respectively. The corresponding errors in the LOS wind velocity that are induced by Mie signals are displayed in Figure 12a. It is obviously that the error in LOS wind velocity increases as the aerosol backscatter ratio (BR, the ratio of aerosol backscatter coefficient to the total atmospheric backscatter coefficient) increases, but the error remains less than 0.33 m/s as long as the BR is less than 2, which is completely acceptable. However, the deformation of the edge channel spectral lines has resulted in changes in the response sensitivities for the two signals, particularly for the Mie signal, which has experienced a significant alteration, as illustrated by the solid lines in Figure 11. The corresponding errors in the LOS wind velocity that are induced by Mie signals are displayed in Figure 12b. As the concentration of aerosols rises, the error in LOS wind velocity due to the Mie signal increases rapidly. When the LOS wind velocity is 10 m/s and the BR is 2.0, the resulting error exceeds 8 m/s. Through the appropriate design of the FPI, it is possible to effectively suppress the interference caused by Mie signals. However, this function is compromised due to the deformation of the edge channel spectrum.
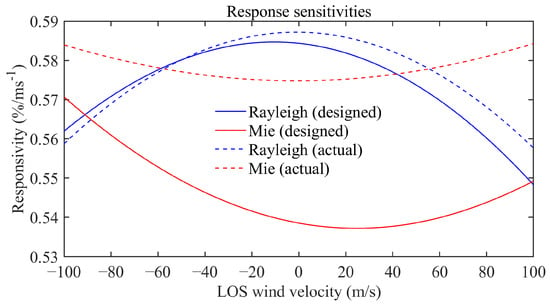
Figure 11.
The designed and actual response sensitivities for Rayleigh and Mie signals.
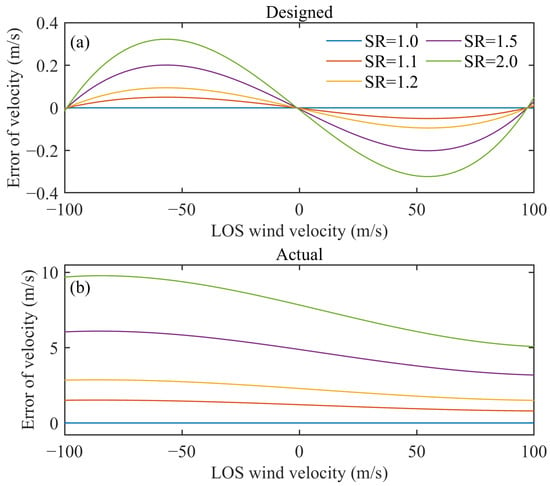
Figure 12.
Calculation of LOS wind velocity errors caused by aerosols with different transmission spectral lines. (a) design FPI spectral lines (b) actual FPI spectral lines.
4. Conclusions
Direct detection Doppler lidar is widely used for wind field measurement in the middle and upper atmosphere, with the FPI commonly employed as the primary frequency discriminator. Theoretically, when the light beam is incident normally on the FPI, its transmission spectrum follows an Airy-type pattern. However, due to the reflections between optical elements within the receiver, the light beam passing through the FPI also contains components of oblique incidence, leading to deformations in the FPI’s transmission spectral lines. In this study, we conducted a theoretical analysis of the FPI transmission spectrum when the light beam had a divergence angle and oblique incidence on the FPI. We then adjusted parameters such as optical element reflectivity and incidence angles of reflected light to ensure that the simulated transmission spectrum of the edge channels matches the measured spectrum, thus validating the theory. Based on this, we evaluated the impact of deformations in the transmission spectrum of the two edge channels on wind measurements. The deformations result in varying alterations in the response curves of Rayleigh signals and Mie signals. The first impact is a systematic shift of approximately 30.7 m/s in the LOS wind velocities. This shift has minimal impact on the four-radial detection wind lidar systems, whereas the two-radial detection wind lidar systems require calibration to accommodate this shift. The second impact of the deviation of FPI spectral lines from the design is the inconsistent response sensitivity of the system to Rayleigh signals and Mie signals. The presence of aerosols in the atmosphere poses a challenge to accurate wind measurement, as their content is elusive and exhibits significant temporal and spatial variation. Neglecting the impact of aerosols leads to rapidly escalating errors in LOS wind velocities as aerosol concentration increases. For instance, when the LOS wind velocity is 10 m/s and the aerosol backscatter ratio is 2.0, the resulting error in LOS wind velocity exceeds 8 m/s. To sum up, in the design of an incoherent Doppler lidar, it is crucial to consider the impact of reflections between optical elements within the receiver. Utilizing high-transmission films to coat optical elements is necessary. While attaching optical crystals to the surface of FPI may be feasible, the manufacturing process is complex.
Author Contributions
Conceptualization, M.Z. and J.C.; methodology, M.Z. and J.C.; software, M.Z.; validation, J.C. and L.L.; formal analysis, J.C.; investigation, J.C.; resources, J.C.; data curation, M.Z.; writing—original draft preparation, M.Z.; writing—review and editing, J.C.; visualization, M.Z.; supervision, C.X.; project administration, C.X.; funding acquisition, M.Z. and L.L. All authors have read and agreed to the published version of the manuscript.
Funding
This research was funded by Anhui Provincial Department of Education, grant number 2023AH051544, Anhui Provincial Department of Science and Technology, grant number 2022a05020010.
Data Availability Statement
The data presented in this study are available on request from the first author.
Acknowledgments
We would like to thank the Advanced Laser Technology Laboratory of Anhui Province for providing valuable support to this study.
Conflicts of Interest
The authors declare no conflicts of interest.
References
- Zhao, R.; Dou, X.; Xue, X.; Sun, D.; Han, Y. Stratosphere and lower mesosphere wind observation and gravity wave activities of the wind field in China using a mobile Rayleigh Doppler lidar. J. Geophys. Res. 2017, 122, 8847–8857. [Google Scholar] [CrossRef]
- Yang, J.F.; Xiao, C.Y.; Hu, X.; Xu, Q. Responses of zonal wind at ~40°N to stratospheric sudden warming events in the stratosphere, mesosphere and lower thermosphere. Sci. China 2017, 60, 935–945. [Google Scholar] [CrossRef]
- Mitra, G.; Guharay, A.; Batista, P.P.; Buriti, R.A. Impact of the September 2019 Minor Sudden Stratospheric Warming on the Low-Latitude Middle Atmospheric Planetary Wave Dynamics. J. Geophys. Res. Atmos. 2022, 127, e2021JD035538. [Google Scholar] [CrossRef]
- Mariaccia, A.; Keckhut, P.; Hauchecorne, A.; Khaykin, S.; Ratynski, M. Co-Located Wind and Temperature Observations at Mid-Latitudes During Mesospheric Inversion Layer Events. Geophys. Res. Lett. 2023, 50, e2022GL102683. [Google Scholar] [CrossRef]
- Ramesh, K.; Smith, A.K.; Garcia, R.R.; Marsh, D.R.; Sridharan, S.; Kishore Kumar, K. Long-Term Variability and Tendencies in Middle Atmosphere Temperature and Zonal Wind from WACCM6 Simulations During 1850–2014. J. Geophys. Res. Atmos. 2020, 125, e2020JD033579. [Google Scholar] [CrossRef]
- Bencatel, R.; Sousa, J.T.D.; Girard, A. Atmospheric flow field models applicable for aircraft endurance extension. Prog. Aerosp. Sci. 2013, 61, 1–25. [Google Scholar] [CrossRef]
- Dong, J.; Cha, H.K.; Kim, D.H.; Baik, S.H.; Wang, G.; Tang, L.; Shu, Z.; Xu, W.; Hu, D.; Sun, D. Doppler LIDAR Measurement of Wind in the Stratosphere. J. Opt. Soc. Korea 2010, 14, 199–203. [Google Scholar] [CrossRef]
- Baumgarten, G. Doppler Rayleigh/Mie/Raman lidar for wind and temperature measurements in the middle atmosphere up to 80 km. Atmos. Meas. Tech. 2010, 3, 1509–1518. [Google Scholar] [CrossRef]
- Dou, X.; Han, Y.; Sun, D.; Xia, H.; Shu, Z.; Zhao, R.; Shangguan, M.; Guo, J. Mobile Rayleigh Doppler lidar for wind and temperature measurements in the stratosphere and lower mesosphere. Opt. Express 2014, 22 (Suppl. S5), A1203. [Google Scholar] [CrossRef]
- Shen, F.; Cha, H.; Dong, J.; Kim, D.; Sun, D.; Kwon, S.O. Design and performance simulation of a molecular Doppler wind lidar. Chin. Opt. Lett. 2009, 7, 593–597. [Google Scholar] [CrossRef][Green Version]
- Chanin, M.L.; Garnier, A.; Hauchecorne, A.; Porteneuve, J. A doppler lidar for measuring winds in the middle atmosphere. Geophys. Res. Lett. 1989, 16, 1273–1276. [Google Scholar] [CrossRef]
- Tepley, C.A.; Sargoytchev, S.I.; Hines, C.O. Initial doppler rayleigh lidar results from arecibo. Geophys. Res. Lett. 1991, 18, 167–170. [Google Scholar] [CrossRef]
- Gentry, B.M.; Chen, H. Tropospheric wind measurements obtained with the Goddard Lidar Observatory for Winds (GLOW): Validation and performance. Proc. SPIE 2002, 4484, 74–81. [Google Scholar]
- Flesia, C.; Korb, C.L. Theory of the double-edge molecular technique for Doppler lidar wind measurement. Appl. Opt. 1999, 38, 432–440. [Google Scholar] [CrossRef] [PubMed]
- Korb, C.L.; Gentry, B.M.; Li, S.X.; Flesia, C. Theory of the double-edge technique for Doppler lidar wind measurement. Appl. Opt. 1998, 37, 3097–3104. [Google Scholar] [CrossRef] [PubMed]
- Xia, H.; Zhang, C.; Mu, H.; Sun, D. Edge technique for direct detection of strain and temperature based on optical time domain reflectometry. Appl. Opt. 2009, 48, 189–197. [Google Scholar] [CrossRef] [PubMed]
- Han, F.; Liu, H.; Sun, D.; Han, Y.; Zhou, A.; Zhang, N.; Chu, J.; Zheng, J.; Jiang, S.; Wang, Y. An Ultra-narrow Bandwidth Filter for Daytime Wind Measurement of Direct Detection Rayleigh Lidar. Curr. Opt. Photonics 2020, 4, 69–80. [Google Scholar]
- Han, Y.L.; Sun, D.; Han, F.; Liu, H.; Zhao, R.; Zheng, J.; Zhang, N.; Chen, C.; Li, Z. Demonstration of daytime wind measurement by using mobile Rayleigh Doppler Lidar incorporating cascaded Fabry-Perot etalons. Opt. Express 2019, 27, 34230. [Google Scholar] [CrossRef]
- Zhang, F.; Dou, X.; Sun, D.; Shu, Z.; Xia, H.; Gao, Y.; Hu, D.; Shangguan, M. Analysis on error of laser frequency locking for fiber optical receiver in direct detection wind lidar based on Fabry–Perot interferometer and improvements. Opt. Eng. 2014, 53, 124102. [Google Scholar] [CrossRef]
- Zhao, M.; Xie, C.; Wang, B.; Xing, K.; Chen, J.; Fang, Z.; Li, L.; Cheng, L. A Rotary Platform Mounted Doppler Lidar for Wind Measurements in Upper Troposphere and Stratosphere. Remote Sens. 2022, 14, 5556. [Google Scholar] [CrossRef]
- Zhang, F. Research on Doppler Wind Lidar System with Wind Detection of High Temporal and Spatial Resolution; University of Science and Technology of China: Hefei, China, 2015. (In Chinese) [Google Scholar]
- Xia, H.; Dou, X.; Shangguan, M.; Zhao, R.; Sun, D.; Wang, C.; Qiu, J.; Shu, Z.; Xue, X.; Han, Y.; et al. Stratospheric temperature measurement with scanning Fabry-Perot interferometer for wind retrieval from mobile Rayleigh Doppler lidar. Opt. Express 2014, 22, 21775–21789. [Google Scholar] [CrossRef] [PubMed]
- Shen, F.; Xie, C.; Qiu, C.; Wang, B. Fabry–Perot etalon-based ultraviolet trifrequency high-spectral-resolution lidar for wind, temperature, and aerosol measurements from 0.2 to 35 km altitude. Appl. Opt. 2018, 57, 9328–9340. [Google Scholar] [CrossRef] [PubMed]
- McKay, J.A. Modeling of direct detection Doppler wind lidar. I. The edge technique. Appl. Opt. 1998, 37, 6480–6486. [Google Scholar] [CrossRef] [PubMed]
- Souprayen, C.; Garnier, A.; Hertzog, A.; Hauchecorne, A.; Porteneuve, J. Rayleigh–Mie Doppler wind lidar for atmospheric measurements. Ⅰ. Instrumental setup, validation, and first climatological results. Appl. Opt. 1999, 38, 2410–2421. [Google Scholar] [CrossRef] [PubMed]
- Cheremisin, A.A.; Marichev, V.N.; Bochkovskii, D.A.; Novikov, P.V.; Romanchenko, I.I. Stratospheric Aerosol of Siberian Forest Fires According to Lidar Observations in Tomsk in August 2019. Atmos. Ocean. Opt. 2022, 35, 57–64. [Google Scholar] [CrossRef]
- Bernath, P.; Boone, C.; Pastorek, A.; Cameron, D.; Lecours, M. Satellite characterization of global stratospheric sulfate aerosols released by Tonga volcano. J. Quant. Spectrosc. Ra. 2023, 299, 108520. [Google Scholar] [CrossRef]
- Mbatha, N.; Shikwambana, L. First Observations of Cirrus Clouds Using the UZ Mie Lidar over uMhlathuze City, South Africa. Appl. Sci. 2022, 12, 4631. [Google Scholar] [CrossRef]
Disclaimer/Publisher’s Note: The statements, opinions and data contained in all publications are solely those of the individual author(s) and contributor(s) and not of MDPI and/or the editor(s). MDPI and/or the editor(s) disclaim responsibility for any injury to people or property resulting from any ideas, methods, instructions or products referred to in the content. |
© 2024 by the authors. Licensee MDPI, Basel, Switzerland. This article is an open access article distributed under the terms and conditions of the Creative Commons Attribution (CC BY) license (https://creativecommons.org/licenses/by/4.0/).