Abstract
Dynamic monitoring of cropland using high spatial resolution remote sensing images is a powerful means to protect cropland resources. However, when a change detection method based on a convolutional neural network employs a large number of convolution and pooling operations to mine the deep features of cropland, the accumulation of irrelevant features and the loss of key features will lead to poor detection results. To effectively solve this problem, a novel cropland change detection network (CroplandCDNet) is proposed in this paper; this network combines an adaptive receptive field and multiscale feature transmission fusion to achieve accurate detection of cropland change information. CroplandCDNet first effectively extracts the multiscale features of cropland from bitemporal remote sensing images through the feature extraction module and subsequently embeds the receptive field adaptive SK attention (SKA) module to emphasize cropland change. Moreover, the SKA module effectively uses spatial context information for the dynamic adjustment of the convolution kernel size of cropland features at different scales. Finally, multiscale features and difference features are transmitted and fused layer by layer to obtain the content of cropland change. In the experiments, the proposed method is compared with six advanced change detection methods using the cropland change detection dataset (CLCD). The experimental results show that CroplandCDNet achieves the best F1 and OA at 76.04% and 94.47%, respectively. Its precision and recall are second best of all models at 76.46% and 75.63%, respectively. Moreover, a generalization experiment was carried out using the Jilin-1 dataset, which effectively verified the reliability of CroplandCDNet in cropland change detection.
1. Introduction
As the basis of food production, cropland quality is an important factor for ensuring food security. At present, cropland protection is facing extremely serious problems, such as “non-agriculturalization” [], overdevelopment of cropland and pollution, resulting in a sharp decline in the quantity and quality of cropland. To effectively protect cropland resources, it is necessary to comprehensively and accurately measure real-time changes in cropland. With the advantages of periodicity, large-scale synchronous observation and rich detailed information from high spatial resolution remote sensing Earth observation technology have been widely used in dynamic monitoring of croplands []. By utilizing multitemporal high spatial resolution remote sensing images, cropland can be regularly and precisely monitored, enabling timely and accurate detection of cropland changes. It is crucially important for the preservation of cropland resources, effective natural resource management, and social development. The existing cropland change detection methods mainly include traditional methods and methods based on deep learning.
- (1)
- Traditional methods of cropland change detection mainly include two categories: statistical analysis methods based on pixels [,] and post-classification comparison methods based on machine learning. Statistical analysis methods based on pixels mainly use medium and low spatial resolution remote sensing images as the data source, apply the simple algebraic operations to the corresponding band of multitemporal remote sensing images, and obtain difference map; subsequently, an adaptive or manually determined threshold is used for segmentation to obtain the final change detection result []. However, the accuracy of these methods is largely limited by the threshold, and it is difficult to meet the needs of fine cropland change extraction. Given the widespread utilization of machine learning techniques in remote sensing image classification, employing post-classification comparison methods can significantly enhance the accuracy of cropland change detection []. Various machine learning methods, including support vector machine (SVM) [], decision tree (DT) [], random forest (RF) [,], maximum likelihood method [], and artificial neural networks [], have been employed for this purpose. However, the utilization of post-classification comparison methods often leads to accumulated errors [], thereby impacting the accuracy of change detection [,]. Additionally, the manual construction of features required by machine learning methods poses limitations on their applicability in cropland change detection.
- (2)
- Methods based on deep learning. With their good self-learning ability for features, deep learning methods have been widely used in the field of cropland change detection. The development of cropland change detection methods based on deep learning has been closely related to improvements in the quality and quantity of remote sensing data and computer computing abilities. Among them, network models based on convolution neural networks (CNNs) have shown good performance in terms of cropland change detection. Bhattad et al. [] used a UNet-based encoder to extract parameters and features of cropland from remote sensing images, employing the decoder to accurately locate cropland changes. Some CNN-based methods perform well in detecting other ground objects [,,]. Bai et al. [] integrated discriminative information and edge structure prior information into a single CNN framework to improve the results of change detection. Additionally, to enhance the performance of change detection networks, an increasing number of scholars have begun adding attention modules to these networks [,]. Xu et al. [] and Zhang et al. [] used a cross-attention module and multilevel change-aware deformable attention module to improve the detection performance, respectively. Although the CNN has good feature extraction ability overall, its ability to extract features is proportional to the number of layers in its own network, and the number of layers in the network determines the operation speed of the network. Therefore, a convolution neural network with more layers takes a long time in the task of accessing large datasets. Different from CNNs, transformers can obtain global dependencies in computations because of the special self-attention mechanism in their network. Moreover, transformer allows elements at each location to calculate attention weights in parallel during network training, so it is more efficient than CNN training in some tasks []. Liu et al. [] proposed a multiscale context aggregation module based on a transformer that can encode and decode multiscale context information and realize the modeling and fusion of cropland multiscale information in remote sensing images. Wu et al. [] applied a transformer-based union attention module to the decoding layer to extract global and local context information and maintain the rich spatial details of croplands in remote sensing images. In addition, the advantages of combining CNNs and transformers have been demonstrated in the field of change detection to effectively improve network detection performance [,]. Moreover, a generative adversarial network is used to perform data augmentation on change detection samples, reducing the dependence of deep learning change detection methods on large labeled datasets [,]. The above research provides a good basis for the construction of cropland change detection networks. In recent years, significant progress has been made in cropland change detection based on deep learning, but the following challenges still exist: (1) At present, to obtain the deep features of cropland in remote sensing images, mainstream cropland change detection networks based on CNNs often use a large number of convolution and pooling operations, and the accumulation of irrelevant features affects the detection accuracy in the process of mining deeper features. (2) Although the method combining CNN and a transformer compensates for the limitations of the small receptive field of CNNs, it has difficulty fully capturing multiscale features and making effective use of spatial context information when the convolution kernel size is fixed.
To effectively solve the above problems, a cropland change detection network (CroplandCDNet) based on an adaptive receptive field and multiscale feature transmission fusion is proposed in this paper. First, CroplandCDNet extracts the multiscale features of cropland from the bitemporal remote sensing images using the pretrained feature extraction module. Subsequently, the change detection module transmits the bitemporal remote sensing images layer by layer through two parallel feature transmission layers, thereby retaining the deep semantic and shallow features of the images. Finally, the multiscale features and differential features of the bitemporal remote sensing images are fused layer by layer to obtain the change results. An SK attention (SKA) module [] with a variable convolution kernel is added to the parallel feature transmission layer to emphasize the change features of cropland and suppress the transmission of irrelevant information. The main contributions of this paper are as follows:
- (1)
- A novel CroplandCDNet is proposed that combines an adaptive receptive field and multiscale feature transmission fusion module. CroplandCDNet maximize the use of the deep features of bitemporal remote sensing images, and the cropland change results are effectively output.
- (2)
- The adaptive attention module of the receptive field is introduced into the feature transmission layer. This module enhances the representation of useful feature channels and effectively extracts cropland change information while suppressing irrelevant information. In addition, the module dynamically adjusts the size of the convolution kernel according to the multiscale features of the cropland so that the network can effectively use the spatial context information of the cropland in remote sensing images and improve the accuracy of detection.
- (3)
- Six advanced change detection networks were used to conduct comparative experiments on the cropland change detection dataset (CLCD). Furthermore, the generalization experiments were carried out with the Jilin-1 cropland change detection dataset. The results show that the CroplandCDNet is optimally comprehensive.
The remainder of this paper is organized as follows: Section 2 describes the structure and principle of the proposed method. Section 3 describes the experiment, which introduces the parameter settings and experimental results in detail. Section 4 describes the ablation experiment and generalization analysis. Finally, the conclusion is given in Section 5.
2. Methodology
Detecting complex changes using shallow features of cropland is extremely difficult because a large number of convolution and pooling operations lead to the accumulation of irrelevant features and the loss of information when mining deep features. Inspired by the network DSIFN [], this paper designs the CroplandCDNet for cropland change detection. CroplandCDNet uses a feature extractor similar to a deeply supervised image fusion network (DSIFN) and builds a novel change detection module, which includes two main steps: (1) multiscale feature extraction of cropland from high spatial resolution remote sensing images (images with rich details to identify small size ground object) and (2) cropland change detection based on feature transmission and fusion. In the process of feature transmission fusion, the attention module with a variable convolution kernel will make use of spatial context information and emphasize related changes. CroplandCDNet contains two modules, a feature extraction module and a change detection module, as shown in Figure 1. The change detection module includes two parallel feature transmission layers and one feature fusion layer.
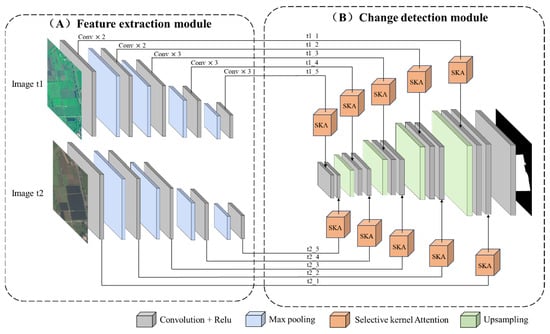
Figure 1.
The structure of CroplandCDNet.
2.1. Data Augmentation
To improve the reliability of cropland change detection results and prevent model overfitting, CroplandCDNet adopts a data augmentation strategy during the training process. As shown in Figure 2, data augmentation includes operations such as rotation, horizontal flip, vertical flip, cropping, translation, contrast change, brightness change, and addition of Gaussian noise. Through data augmentation, the cropland change detection dataset is expanded, the risk of overfitting is reduced, and the generalization of CroplandCDNet to the dataset is effectively improved [].
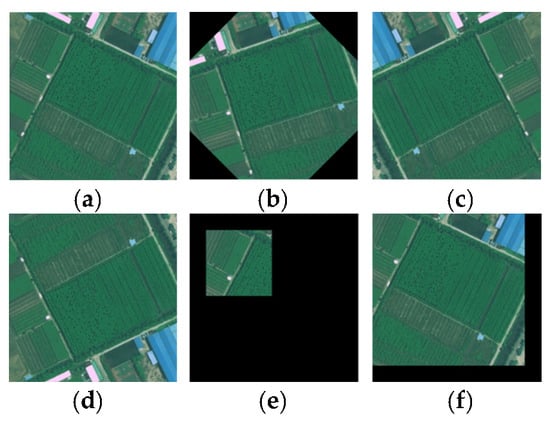
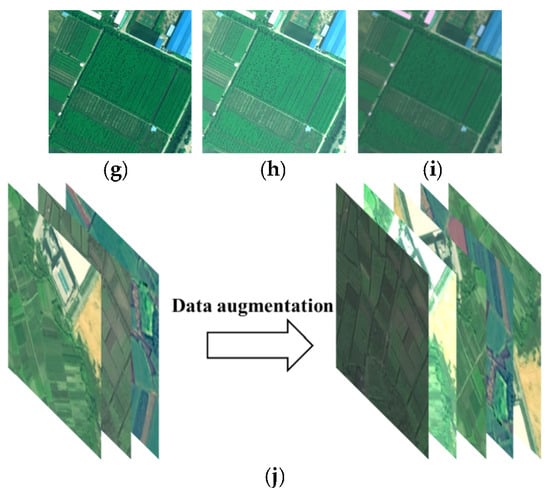
Figure 2.
Effect of data augmentation. (a) Original image. (b) Rotation. (c) Horizontal flip. (d) Vertical flip. (e) Cropping. (f) Translation. (g) Contrast change. (h) Brightness change. (i) Addition of Gaussian noise. (j) Data augmentation for multiple images.
2.2. Feature Extraction Module
In CNNs, the shallow features of croplands are usually texture features and detailed information extracted after early convolution and pooling processing. Although it has high spatial resolution, it lacks high-level semantic information and global information. The deep features of cropland extracted from the deeper or higher level of the network help the network understand the content of remote sensing images and improve the detection performance in complex scenes.
The CNN backbone of CroplandCDNet comes from the first five layers of the pretrained network VGG16 [], as shown in Figure 3. The T1 and T2 images of the multitemporal remote sensing images underwent the same convolution pooling operation, retaining as many original features of the bitemporal images as possible. To ensure that the features extracted from bitemporal remote sensing images are in the same feature space, the parameters are shared in the process of feature extraction. The whole feature extraction module begins with an input of three-channel remote sensing images:

Figure 3.
Process of the feature extraction module.
- (1)
- Two identical convolution layers of 3 × 3 × 64 are used to learn the shallow features of the cropland in the remote sensing image. After ReLU activation, the maximum pooling layer is used, with the first pooling kernel of 2 × 2 and a stride of 2 to screen the important features and reduce the number of parameters. At this time, the size of the image is changed to 128 × 128 × 64;
- (2)
- After two 3 × 3 × 128 convolution layers, the maximum pooling layer with a 2 × 2 kernel and stride of 2 is input after ReLU activation, and the size of the image is changed to 64 × 64 × 128;
- (3)
- After three 3 × 3 × 256 convolution layers, the maximum pooling layer with a third pooling kernel of 2 × 2 and a stride of 2 is input after ReLU activation, and the size of the image is changed to 32 × 32 × 256;
- (4)
- After three 3 × 3 × 512 convolution layers, the maximum pooling layer with the last pooling kernel of 2 × 2 and stride of 2 is input after ReLU activation, and the size of the image is changed to 16 × 16 × 512;
- (5)
- Finally, through three convolution layers of 3 × 3 × 512, a feature map of 16 × 16 × 512 is obtained. All the five-layer multiscale features are extracted and input into the change detection module.
2.3. Change Detection Module
The feature maps extracted from the feature extraction module are input into the change detection module, and cropland binary change detection is carried out. The change detection module includes two parallel feature transmission layers and a feature fusion layer, as shown in Figure 4.
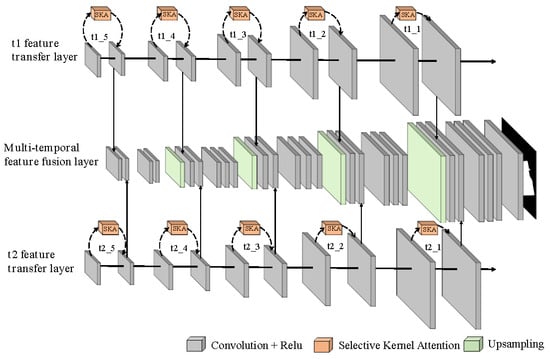
Figure 4.
Change detection module.
t1_1, t1_2, …, t1_5 and t2_1, t2_2, …, t2_5 represent the shallow and deep features of cropland in T1 and T2 temporal remote sensing images, respectively. All the feature maps are input into two parallel feature transmission layers in the change detection module, and each feature map passes through the SKA module to emphasize the change channel, suppress irrelevant information, and improve the detection ability of the network. The deepest original image features T1 and T2 are input into the feature fusion layer first through the SKA module. First, the feature fusion layer combines the bitemporal features of t1_5 and t2_5 and then convolutes them twice to obtain the image differential feature map. To restore the original resolution, the feature fusion layer samples the differential feature image, combines it with t1_4 and t2_4 to transmit features from deep to shallow, and gradually obtains all the features.
Due to features such as t1_1 and t2_1 being closer to the original input data, they are better able to capture local details and texture information in remote sensing images. Thus, shallow features can help identify small-scale changes. However, features such as t1_5 and t2_5 come from the deep layer of the network, which have richer semantic information and abstraction, and can capture more global features in remote sensing images. Thus, deep features can help identify more complex and larger scale changes, which can help to understand the scene as a whole. The feature transmission layer combines the above two to provide a more comprehensive and more abundant feature representation for the cropland change detection network. Thus, the robustness of the network is improved, and the change area under the influence of remote sensing can be accurately identified and located. In CroplandCDNet, t1_5 and t2_5 first undergo fusion, difference recognition, convolution, and upsampling operations. The difference maps obtained from t1_5 and t2_5 are fused with t1_4 and t2_4 before subsequent operations and so on until the last layer of the network. This process facilitates the transmission of deep network features to shallow network features. Each layer conveys distinct contextual information to the subsequent layers, culminating in comprehensive features at the final layer. In the process, cropland details are restored with increasing resolution. This module allows for better identification of changes in cropland.
2.4. Selective Kernel Attention
SKA controls the receptive field by adaptively adjusting the convolution kernel size of each neuron according to the scale difference of the input information. At present, many studies have shown that SKA [] can integrate feature maps from multiple receptive fields [] and can provide multiscale features from different convolutional units []. Many scholars have introduced SKA into the change detection network to prove the effectiveness of SKA for change detection tasks. For example, the networks with the introduction of SKA can adaptively focus on discriminative information [], adaptively aggregate global and local features [], and adaptively select change information between different levels to improve feature representation []. Because the size of the receptive field affects the extraction of global and local features, the SKA can better obtain the multiscale features of cropland. Second, the features of the SKA aggregation depth make it easier for the network to understand. Therefore, CroplandCDNet introduces SKA into the change detection module, which effectively improves the performance of cropland change detection.
As shown in Figure 5, SKA contains three operations: split, fuse, and select. The split operator generates multiple paths of different kernel sizes. In this section, and as shown in Figure 5, two convolution kernels of different sizes are taken as examples. In fact, multiple convolution kernels of multiple branches can be designed (the method proposed in this paper uses convolution kernels of 1 × 1, 3 × 3, 5 × 5, and 7 × 7). The fuse operator merges information from multiple branches to obtain a global representation for selecting weights. The selection operator aggregates the feature maps of convolution kernels of different sizes according to the selection weight.
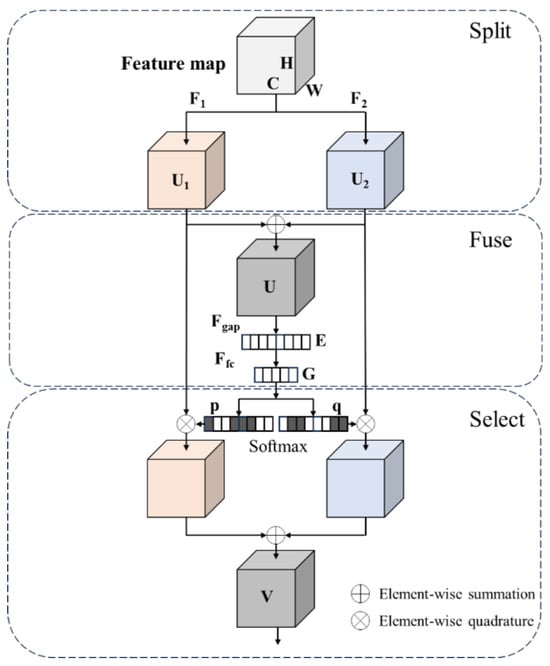
Figure 5.
The structure of SKA.
In the split operation, the input feature map is first transformed with different kernel sizes, which are F1: feature map→U1 and F2: feature map→U2. The F1 and F2 processes include convolution, batch normalization, and the ReLU activation function, aiming to extract features of different scales in the feature map.
In the fuse operation, the information from different branches is entered into the next layer. First, the transformation results of the two branches are added:
Then, the global information is embedded into the channel statistics through global average pooling:
Moreover, to reduce computational consumption, the dimension of the channel statistical information is reduced through full connection, and the guidance features for the adaptive selection of the kernel size for the SKA are obtained:
In Equation (3), and denote the ReLU activation function and batch normalization, respectively, W. k is the output size of the fully connected layer, which is calculated as follows:
where l is the reduction ratio and defaults to 16, and a is the minimum value of k, which defaults to 32.
In the selection operation, a feature G used to guide the precise and adaptive selection traverses each fully connected layer in to obtain the corresponding weight. The softmax function is applied to the resulting weights, the channel dimension is normalized, and the following is obtained:
where P, Q, their channels PC and QC, and are the elements of and in the channel dimension, respectively, and . The feature map transformed on different kernels is multiplied by the attention weight and summed in the channel dimension. The final feature map V is obtained as follows:
where , . When there are multiple kernels of different sizes (that is, multiple branches), the calculation method is the same as that for the example of two branches in this section.
2.5. Loss Function
Because of the spatial correlation between cropland pixels in remote sensing images, the binary cross entropy (BCE) loss function [] can be used to evaluate the similarity of cropland in bitemporal remote sensing images in terms of spatial information. In addition, due to the data imbalance in the cropland change detection datasets, balance adjustment can be carried out using the dice coefficient (DICE) loss function []. For this reason, CroplandCDNet adopts a mixed loss function combined with BCE loss and DICE loss, and the calculation formula is as follows:
Here, and are expressed as follows:
where represents the total number of pixels of cropland in the remote sensing image, represents the ground truth (GT) in t pixels, represents the result of cropland change detection in t pixels, represents the predicted value of cropland change detection results, represents the true value of cropland change, and ∩ represents the intersection of and .
3. Experiment
3.1. Dataset
To verify the effectiveness of the proposed method, the CLCD [] dataset is used for experimental verification in this paper. The CLCD dataset was collected by GF-2 and had a spatial resolution of 0.5 m to 2 m. Many types of cropland conversion are contained in CLCD, and the sample images in the CLCD dataset are shown in Figure 6.
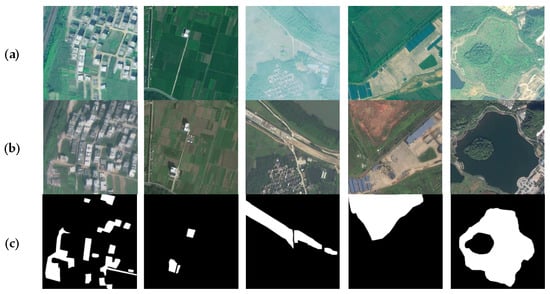
Figure 6.
Sample images in the CLCD dataset. (a) T1. (b) T2. (c) Ground truth: the white area indicates a change, and the black area indicates no change.
3.2. Comparative Experiments
This paper selects six advanced change detection methods, CDNet [], DSIFN [], SNUNet [], BIT [], L-UNet [], and P2V-CD [], to compare and verify cropland change detection with the proposed method, of which BIT is based on the CNN-Transformer.
3.3. Parameter Setting and Evaluation Metrics
The proposed method and the comparison methods are implemented in the PyTorch framework by using PyCharm Community Edition 2023.1.3. The CPU used was an Intel i7-13700KF, and the graphics card used was an NVIDIA GeForce RTX3090. The video memory and memory used were 24 GB and 64 GB, respectively. In all the experiments, the batch size was set to 8, and the number of epochs was 100. In the training process of the method proposed in this paper, the initial learning rate is 0.001, and the optimizer is Adam [].
In this paper, the precision (Pre), recall (Rec), F1-score (F1) and overall accuracy (OA) are used to quantitatively evaluate the experimental results. The calculation methods are as follows:
where TP is a true positive, indicating that a change occurs and a change is detected; FP is a false positive, meaning a change is detected but no change occurred; TN is a true negative, meaning no change has occurred and no change has been detected; and FN is a false-negative, indicating that a change has occurred but no change has been detected.
3.4. Experimental Results
Table 1 shows the test accuracy of the proposed method and all the comparison methods on the CLCD dataset. Table 1 shows that the F1 and OA of the proposed method are the best of all the methods and are 76.04% and 94.47%, respectively. Pre and Rec are the second best at 76.46% and 75.63%, respectively. The F1s of the proposed method are 6.07%, 3.08%, 6.54%, 4.37%, 8.31%, and 4.64% greater than those of CDNet, DSIFN, SNUNet, BIT, L-UNet, and P2V-CD, respectively. The OAs of the proposed method are 0.83%, 1.07%, 1.58%, 0.71%, 2.27%, and 0.59% greater than those of CDNet, DSIFN, SNUNet, BIT, L-UNet, and P2V-CD, respectively. Based on the analysis of all the evaluation metrics, it is proposed that the comprehensive performance of the method is the best among all the methods.

Table 1.
Quantitative evaluation results of comparative experiments and proposed methods on the CLCD dataset.
To further verify the detection effect of the proposed method in different scenes, four types of changes are selected for analysis:
- Scene 1: From cropland to buildings
Table 2 shows the quantitative evaluation metrics of the proposed method and the comparative methods. As shown in Table 2, the detection results of all methods are good, and the F1 and OA of the proposed method are the best among all methods, which are 96.50% and 97.47%, respectively. Pre and Rec are 99.32% and 93.84%, respectively. Figure 7 shows the visualization results of the conversion of cropland to buildings on the CLCD dataset by the proposed method and the comparative methods. The visualization results revealed a large number of missed detections in DSIFN and BIT, voids in the detection results of CDNet and P2V-CD, poor edge detection results, and a large number of missed detection results in SNUNet. The proposed method can accurately detect the edges of large-scale building changes while maintaining the integrity of the interior. Based on comprehensive quantitative evaluation metrics and visualization results, the proposed method can be used to detect the conversion of cropland into buildings effectively.

Table 2.
Quantitative evaluation results for Scene 1.
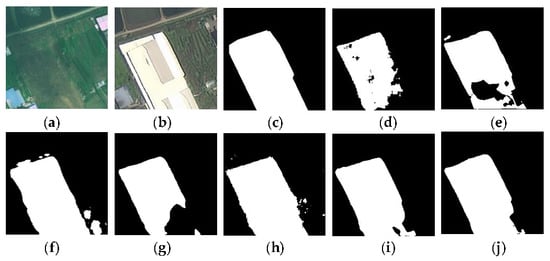
Figure 7.
Visualization results for Scene 1. (a) T1. (b) T2. (c) Ground truth. (d) CDNet. (e) DSIFN. (f) SNUNet. (g) BIT. (h) L-UNet. (i) P2V-CD. (j) CroplandCDNet (ours).
- 2.
- Scene 2: From cropland to roads
Table 3 and Figure 8 show the quantitative evaluation metrics and visualization results of the proposed method and the comparative methods. Table 3 shows that other comparative methods are not effective at detecting the conversion of cropland to roads. The Pre, F1, and OA of the proposed method were the best of all methods at 89.86%, 79.56%, and 98.35%, respectively, while its Rec, at 71.38%, was second only to that of L-UNet. However, Figure 8h,j show a large number of misdetections in L-UNet, while the proposed method has only local missed detections. Based on comprehensive quantitative evaluation metrics and visualization results, the proposed method has the best effect on detecting the conversion of cropland into roads.

Table 3.
Quantitative evaluation results for Scene 2.
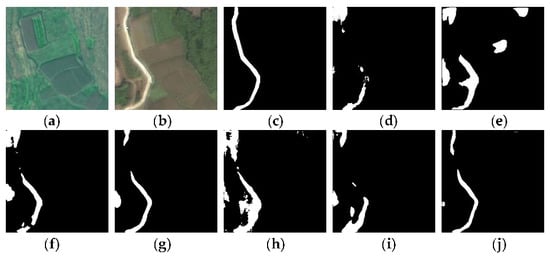
Figure 8.
Visualization results for Scene 2. (a) T1. (b) T2. (c) Ground truth. (d) CDNet. (e) DSIFN. (f) SNUNet. (g) BIT. (h) L-UNet. (i) P2V-CD. (j) CroplandCDNet (ours).
- 3.
- Scene 3: From cropland to bare land
Table 4 shows the detection accuracy of changing cropland into bare land. The Rec, F1, and OA of the proposed method are the best of all methods at 94.04%, 94.16%, and 97.86%, respectively, while its Pre, at 94.27%, is lower than that of P2V-CD and CDNet. Figure 9 shows the visualization results of the proposed and comparison methods for Scene 3. Figure 9d,i,j show voids and inaccurate edges in the detection results of CDNet, and there are a large number of missed detections in the detection results of P2V-CD. Meanwhile, the proposed method retains the complete edge and interior while having low miss detection and low error detection. After comprehensive quantitative evaluation and visualization, the proposed method achieved the best detection effect.

Table 4.
Quantitative evaluation results for Scene 3.
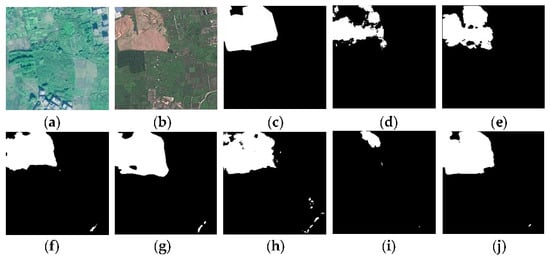
Figure 9.
Visualization results for Scene 3. (a) T1. (b) T2. (c) Ground truth. (d) CDNet. (e) DSIFN. (f) SNUNet. (g) BIT. (h) L-UNet. (i) P2V-CD. (j) CroplandCDNet (ours).
- 4.
- Scene 4: From cropland to water body
Table 5 shows the test results for the conversion of cropland into water body. The Rec, F1, and OA of the proposed method were the best of all the methods and were 98.75%, 96.11%, and 99.59%, respectively, while its Pre was 93.61%, which was lower than those of L-UNet and P2V-CD. Figure 10 shows the visualization results of the proposed method and the comparison methods for Scene 4. Figure 10h–j show different degrees of error detection and missed detection in both L-UNet and P2V-CD, and there are only a small number of error detections in the proposed method. According to the comprehensive quantitative evaluation metrics and visualization results, the comprehensive performance of the proposed method is the best at detecting changes in cropland types into water bodies.

Table 5.
Quantitative evaluation results for Scene 4.
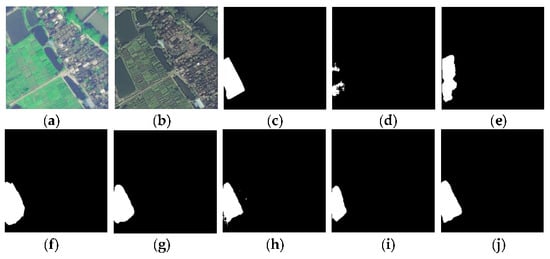
Figure 10.
Visualization results for Scene 4. (a) T1. (b) T2. (c) Ground truth. (d) CDNet. (e) DSIFN. (f) SNUNet. (g) BIT. (h) L-UNet. (i) P2V-CD. (j) CroplandCDNet (ours).
4. Discussion
4.1. Ablation Analysis
In this paper, multiscale feature transmission and fusion operations are used to retain the features of cropland in remote sensing images to the greatest extent. To verify the influence of each module of the proposed method on the experimental results, an ablation experiment was performed in this section. In this paper, the network without feature transmission is used as the baseline model, which does not include an attention mechanism. Second, this paper regards the transmission and fusion of each additional layer as a separate ablation experiment to emphasize the role of each layer of features in the network.
Table 6 and Figure 11 show the quantitative evaluation and visualization results of ablation experiments based on the proposed method on the CLCD dataset. As shown in Table 6, the F1 of the baseline model is 65.77%. After adding SKA, F1 increases to 69.08%, and the feature transmission and fusion operation of each layer improves the detection accuracy to a certain extent. Although the Pre of the proposed method is 1.38% lower than that of the four-layer feature transmission fusion operation, the Rec, F1, and OA of the proposed method are the best in the ablation experiment, which are 75.63%, 76.04%, and 94.41%, respectively. The results show that the introduction of SKA and the transmission and fusion operation of each layer of features in the proposed method are effective for cropland change detection.

Table 6.
The ablation experiments of the proposed method using the CLCD dataset quantitatively evaluating the results.

Figure 11.
Visualization results of ablation experiments of the proposed method using the CLCD dataset. (a) T1. (b) T2. (c) Ground truth. (d) Base. (e) Base + SKA. (f) Base + SKA, +layer2. (g) Base + SKA, +layer2,3. (h) Base +layer2,3,4. (i) Base + SKA, +layer2,3,4. (j) CroplandCDNet (ours).
4.2. Generalization Analysis
To further verify the robustness of the proposed method, this paper employs a cropland change detection dataset [] (data source: Jilin-1) for experimental verification. The spatial resolution of the dataset is better than 0.75 m, and the dataset contains 6000 sets of high spatial resolution remote sensing images, each of which includes bitemporal remote sensing images and one cropland change label. In this paper, 3600 sets of data were selected for training, 1200 sets of data were used for verification, and 1200 sets of data were used for testing. The evaluation metrics of the test results are shown in Table 7. The Pre, Rec, F1, and OA of the proposed method are 89.03%, 85.22%, 87.08%, and 92.94%, respectively. A portion of the experimental results are shown in Figure 12, which reveals that the network can effectively detect changes in cropland. Therefore, the proposed method can still maintain excellent cropland change detection performance on different datasets.

Table 7.
Quantitative evaluation results of the proposed method and the comparison methods on the Jilin-1 cropland change detection dataset.
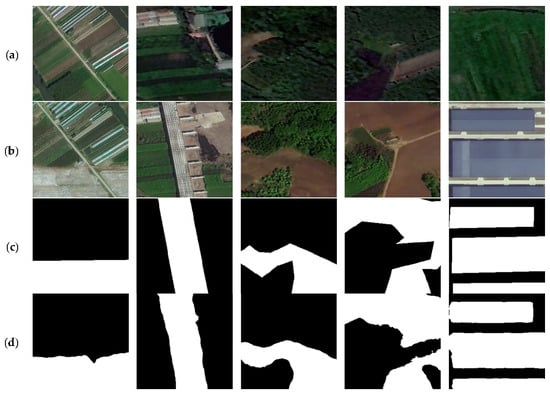
Figure 12.
Partial visualization results of the proposed method using the Jilin-1 cropland change detection dataset. (a) T1. (b) T2. (c) Ground truth: white areas indicate changes; black areas indicate no changes. (d) CroplandCDNet (ours).
4.3. Potential and Planning
For areas with cloudy and rainy weather, especially in plateau mountainous regions, it may lead to the absence of effective optical remote sensing images, which affects the applicability of cropland change detection from multitemporal optical remote sensing images. The problem of insufficient data can be effectively addressed by integrating SAR and optical remote sensing images. However, due to significant differences in data acquisition methods, spectral characteristics, and data resolution between SAR and optical remote sensing images, there are distinct differences in feature representation between SAR data and optical data []. Therefore, the proposed CroplandCDNet cannot be directly used for cropland change detection using both optical and SAR images. In the future, we will add an image domain transformation module or use a non-shared weight pseudo-siamese feature extraction module at the front end of CroplandCDNet to make optical and SAR images comparable.
Multitemporal remote sensing images play an important role in monitoring cropland change and land use change [,,]. At present, multitemporal remote sensing image change detection methods based on deep learning, such as long short-term memory (LSTM) and recurrent neural network (RNN), have been widely used in the application of cropland change detection [,]. Due to the rich temporal dimension contained in multitemporal time series data, a multitemporal feature extraction module can be considered in deep learning methods to extract features, such as time series vegetation indices or water indices, and combine RNN or LSTM to model multitemporal data. However, the bitemporal remote sensing images are weak in this aspect, so there are differences in technical methods between them. In future research, how to combine the proposed method with the multitemporal series change detection method to improve the applicability and robustness of the model is a field worthy of research.
In addition, the method is mainly used to detect fine cropland changes in small scenes based on high spatial resolution remote sensing images. In the past, middle and low spatial resolution remote sensing images, such as Landsat and Sentinel, were mainly used to detect large-scale cropland changes. However, due to the limitation of image spatial resolution, it is difficult to obtain the detection of cropland changes at the field scale. CroplandCDNet, as a deep learning-based cropland fine change detection method, can identify the cropland changes at the field level, but it requires very high computational requirements to be used at the municipal, provincial, or even national level. While large-scale cropland monitoring is of great significance for food protection and sustainable development, how to optimize the number of parameters of CroplandCDNet model and deploy it to the cloud platform so that the model can be applied to large-scale cropland change detection is our next major work.
5. Conclusions
At present, the demand for refined cropland change detection is urgent, but the cropland change detection method based on deep learning that extracts deep features through a large number of convolutional pooling will lead to the introduction of irrelevant features. In addition, the fixed size of the convolution kernel will cause the network to ignore the spatial context information. To solve above challenges, CroplandCDNet for cropland change detection is proposed in this paper. CroplandCDNet first extracts the multiscale features of cropland from multitemporal remote sensing images through the feature extraction module and then inputs the multiscale features into the change detection module to identify cropland changes. In the change detection module, the feature transmission and fusion operation strengthen the relationships between multilayer features in the network. SKA with an adaptively receptive field emphasizes cropland change and effectively utilizes spatial context information, and the ability of CroplandCDNet to detect cropland change is effectively improved. To verify the effectiveness of the proposed method for detecting cropland changes, an experimental verification is carried out using the CLCD dataset in this paper. The F1 and OA obtained by CroplandCDNet are 76.04% and 94.47%, respectively, which are the best results compared with the comparison methods. Its Pre and Rec are 76.46% and 75.63%, respectively, which are the second best among all the methods. Based on the quantitative evaluation and visualization results, CroplandCDNet has the best overall performance. Moreover, a generalization experiment is carried out using the Jilin-1 cropland dataset. Compared with the comparison methods, CroplandCDNet achieves the best results in terms of four evaluation metrics, which verifies the robustness of the proposed method. However, the proposed method is based on the detection of cropland change in small scenes, and its applicability to the detection of large-scale cropland change needs further verification. In addition, how to comprehensively use optical and SAR data or multitemporal time series data to detect cropland changes will also be the direction we should consider in the next step.
Author Contributions
Q.W.: Feasibility study, network construction and testing, and manuscript writing. L.H.: Manuscript advice and proofreading, and funding access. B.-H.T.: Project management and supervision. J.C.: Experimental environment configuration. M.W.: Data preprocessing. Z.Z.: Data preprocessing. All authors have read and agreed to the published version of the manuscript.
Funding
This research was funded by National Natural Science Foundation of China (grant no. 42361054 and 42230109), Yunnan Fundamental Research Project (grant no. 202201AT070164), the Science and Technology Program of Geological Institution of Hunan Province (grant no. HNGSTP202409), “Xingdian” Talent Support Program Project (grant no. KKRD202221036) and Yunnan Province Key Research and Development Program (grant no. 202202AD080010).
Data Availability Statement
The CLCD dataset in this paper is publicly available for download from the following link https://github.com/liumency/CropLand-CD (accessed on 19 June 2023). The Jilin-1 dataset is not yet publicly available and is only available for scientific research. If other researchers need help, please contact the first author.
Conflicts of Interest
The authors declare no conflicts of interest.
References
- Han, H.; Peng, H.; Li, S.; Yang, J.; Yan, Z. The Non-Agriculturalization of Cultivated Land in Karst Mountainous Areas in China. Land 2022, 11, 1727. [Google Scholar] [CrossRef]
- Zhang, Y.; Shao, Z. Assessing of Urban Vegetation Biomass in Combination with LiDAR and High-resolution Remote Sensing Images. Int. J. Remote Sens. 2020, 42, 964–985. [Google Scholar] [CrossRef]
- Sharma, N.; Chawla, S. Digital Change Detection Analysis Criteria and Techniques used for Land Use and Land Cover Classification in Agriculture. In Proceedings of the 2023 3rd International Conference on Advance Computing and Innovative Technologies in Engineering (ICACITE), Greater Noida, India, 12–13 May 2023; pp. 331–335. [Google Scholar]
- Useya, J.; Chen, S.; Murefu, M. Cropland Mapping and Change Detection: Toward Zimbabwean Cropland Inventory. IEEE Access 2019, 7, 53603–53620. [Google Scholar] [CrossRef]
- Liu, B.; Song, W.; Meng, Z.; Liu, X. Review of Land Use Change Detection—A Method Combining Machine Learning and Bibliometric Analysis. Land 2023, 12, 1050. [Google Scholar] [CrossRef]
- Chughtai, A.H.; Abbasi, H.; Karas, I.R. A review on change detection method and accuracy assessment for land use land cover. Remote Sens. Appl. Soc. Environ. 2021, 22, 100482. [Google Scholar] [CrossRef]
- Xie, G.; Niculescu, S. Mapping and Monitoring of Land Cover/Land Use (LCLU) Changes in the Crozon Peninsula (Brittany, France) from 2007 to 2018 by Machine Learning Algorithms (Support Vector Machine, Random Forest, and Convolutional Neural Network) and by Post-classification Comparison (PCC). Remote Sens. 2021, 13, 3899. [Google Scholar] [CrossRef]
- Sebbar, B.; Moumni, A.; Lahrouni, A. Decisional Tree Models for Land Cover Mapping and Change Detection Based on Phenological Behaviors: Application Case: Localization of Non-Fully-Exploited Agricultural Surfaces in the Eastern Part of the Haouz Plain in the Semi-Arid Central Morocco. Int. Arch. Photogramm. Remote Sens. Spat. Inf. Sci. 2020, XLIV-4/W3-2020, 365–373. [Google Scholar] [CrossRef]
- Phalke, A.R.; Özdoğan, M.; Thenkabail, P.S.; Erickson, T.; Gorelick, N.; Yadav, K.; Congalton, R.G. Mapping croplands of Europe, Middle East, Russia, and Central Asia using Landsat, Random Forest, and Google Earth Engine. ISPRS J. Photogramm. Remote Sens. 2020, 167, 104–122. [Google Scholar] [CrossRef]
- Pande, C.B. Land use/land cover and change detection mapping in Rahuri watershed area (MS), India using the google earth engine and machine learning approach. Geocarto Int. 2022, 37, 13860–13880. [Google Scholar] [CrossRef]
- Hailu, A.; Mammo, S.; Kidane, M. Dynamics of land use, land cover change trend and its drivers in Jimma Geneti District, Western Ethiopia. Land Use Policy 2020, 99, 105011. [Google Scholar] [CrossRef]
- Taiwo, B.E.; Kafy, A.A.; Samuel, A.A.; Rahaman, Z.A.; Ayowole, O.E.; Shahrier, M.; Duti, B.M.; Rahman, M.T.; Peter, O.T.; Abosede, O.O. Monitoring and predicting the influences of land use/land cover change on cropland characteristics and drought severity using remote sensing techniques. Environ. Sustain. Indic. 2023, 18, 100248. [Google Scholar] [CrossRef]
- Bai, T.; Wang, L.; Yin, D.; Sun, K.; Chen, Y.; Li, W.; Li, D. Deep learning for change detection in remote sensing: A review. Geo Spat. Inf. Sci. 2022, 26, 262–288. [Google Scholar] [CrossRef]
- Dahiya, N.; Gupta, S.; Singh, S. Qualitative and quantitative analysis of artificial neural network-based post-classification comparison to detect the earth surface variations using hyperspectral and multispectral datasets. J. Appl. Remote Sens. 2023, 17, 032403. [Google Scholar] [CrossRef]
- Bhattad, R.; Patel, V.; Patel, S. Novel H-Unet Approach for Cropland Change Detection Using CLCD. In Proceedings of the IGARSS 2023—2023 IEEE International Geoscience and Remote Sensing Symposium, Pasadena, CA, USA, 16–21 July 2023; pp. 6692–6695. [Google Scholar]
- Peng, D.; Bruzzone, L.; Zhang, Y.; Guan, H.; He, P. SCDNET: A novel convolutional network for semantic change detection in high resolution optical remote sensing imagery. Int. J. Appl. Earth Obs. Geoinf. 2021, 103, 102465. [Google Scholar] [CrossRef]
- Li, X.; He, M.; Li, H.; Shen, H. A Combined Loss-Based Multiscale Fully Convolutional Network for High-Resolution Remote Sensing Image Change Detection. IEEE Geosci. Remote Sens. Lett. 2022, 19, 8017505. [Google Scholar] [CrossRef]
- Peng, X.; Zhong, R.; Li, Z.; Li, Q. Optical Remote Sensing Image Change Detection Based on Attention Mechanism and Image Difference. IEEE Trans. Geosci. Remote Sens. 2021, 59, 7296–7307. [Google Scholar] [CrossRef]
- Bai, B.; Fu, W.; Lu, T.; Li, S. Edge-Guided Recurrent Convolutional Neural Network for Multitemporal Remote Sensing Image Building Change Detection. IEEE Trans. Geosci. Remote Sens. 2022, 60, 5610613. [Google Scholar] [CrossRef]
- Shi, Q.; Liu, M.; Li, S.; Liu, X.; Wang, F.; Zhang, L. A Deeply Supervised Attention Metric-Based Network and an Open Aerial Image Dataset for Remote Sensing Change Detection. IEEE Trans. Geosci. Remote Sens. 2022, 60, 5604816. [Google Scholar] [CrossRef]
- Liu, Y.; Pang, C.; Zhan, Z.; Zhang, X.; Yang, X. Building Change Detection for Remote Sensing Images Using a Dual-Task Constrained Deep Siamese Convolutional Network Model. IEEE Geosci. Remote Sens. Lett. 2021, 18, 811–815. [Google Scholar] [CrossRef]
- Xu, C.; Ye, Z.; Mei, L.; Shen, S.; Sun, S.; Wang, Y.; Yang, W. Cross-Attention Guided Group Aggregation Network for Cropland Change Detection. IEEE Sens. J. 2023, 23, 13680–13691. [Google Scholar] [CrossRef]
- Zhang, X.; Yu, W.; Pun, M.-O. Multilevel Deformable Attention-Aggregated Networks for Change Detection in Bitemporal Remote Sensing Imagery. IEEE Trans. Geosci. Remote Sens. 2022, 60, 7827–7856. [Google Scholar] [CrossRef]
- Zhang, C.; Wang, L.; Cheng, S.; Li, Y. SwinSUNet: Pure Transformer Network for Remote Sensing Image Change Detection. IEEE Trans. Geosci. Remote Sens. 2022, 60, 5224713. [Google Scholar] [CrossRef]
- Liu, M.; Chai, Z.; Deng, H.; Liu, R. A CNN-Transformer Network with Multiscale Context Aggregation for Fine-Grained Cropland Change Detection. IEEE J. Sel. Top. Appl. Earth Obs. Remote Sens. 2022, 15, 4297–4306. [Google Scholar] [CrossRef]
- Wu, Z.; Chen, Y.; Meng, X.; Huang, Y.; Li, T.; Sun, J. SwinUCDNet: A UNet-like Network with Union Attention for Cropland Change Detection of Aerial Images. In Proceedings of the 2023 30th International Conference on Geoinformatics, London, UK, 19–21 July 2023; pp. 1–7. [Google Scholar]
- Chen, H.; Qi, Z.; Shi, Z. Remote Sensing Image Change Detection with Transformers. IEEE Trans. Geosci. Remote Sens. 2022, 60, 5607514. [Google Scholar] [CrossRef]
- Li, Q.; Zhong, R.; Du, X.; Du, Y. TransUNetCD: A Hybrid Transformer Network for Change Detection in Optical Remote-Sensing Images. IEEE Trans. Geosci. Remote Sens. 2022, 60, 5622519. [Google Scholar] [CrossRef]
- Chen, J.; Zhao, W.; Chen, X. Cropland Change Detection with Harmonic Function and Generative Adversarial Network. IEEE Geosci. Remote Sens. Lett. 2022, 19, 2500205. [Google Scholar] [CrossRef]
- Chen, H.; Li, W.; Shi, Z. Adversarial Instance Augmentation for Building Change Detection in Remote Sensing Images. IEEE Trans. Geosci. Remote Sens. 2022, 60, 5603216. [Google Scholar] [CrossRef]
- Li, X.; Wang, W.; Hu, X.; Yang, J. Selective kernel networks. In Proceedings of the IEEE/CVF Conference on Computer Vision and Pattern Recognition, Long Beach, CA, USA, 16–20 June 2019; pp. 510–519. [Google Scholar]
- Zhang, C.; Yue, P.; Tapete, D.; Jiang, L.; Shangguan, B.; Huang, L.; Liu, G. A deeply supervised image fusion network for change detection in high resolution bi-temporal remote sensing images. ISPRS J. Photogramm. Remote Sens. 2020, 166, 183–200. [Google Scholar] [CrossRef]
- Rebuffi, S.-A.; Gowal, S.; Calian, D.A.; Stimberg, F.; Wiles, O.; Mann, T. Data augmentation can improve robustness. Adv. Neural Inf. Process. Syst. 2021, 34, 29935–29948. [Google Scholar]
- Simonyan, K.; Zisserman, A. Very deep convolutional networks for large-scale image recognition. arXiv 2015, arXiv:1409.1556. [Google Scholar]
- Zheng, D.; Wu, Z.; Liu, J.; Hung, C.-C.; Wei, Z. Detail Enhanced Change Detection in VHR Images Using a Self-Supervised Multiscale Hybrid Network. IEEE J. Sel. Top. Appl. Earth Obs. Remote Sens. 2024, 17, 3181–3196. [Google Scholar] [CrossRef]
- Chen, Z.; Song, Y.; Ma, Y.; Li, G.; Wang, R.; Hu, H. Interaction in Transformer for Change Detection in VHR Remote Sensing Images. IEEE Trans. Geosci. Remote Sens. 2023, 61, 1–12. [Google Scholar] [CrossRef]
- Fang, H.; Guo, S.; Zhang, P.; Zhang, W.; Wang, X.; Liu, S.; Du, P. Scene Change Detection by Differential Aggregation Network and Class Probability-Based Fusion Strategy. IEEE Trans. Geosci. Remote Sens. 2023, 61, 5406918. [Google Scholar] [CrossRef]
- Li, W.; Xue, L.; Wang, X.; Li, G. MCTNet: A multi-scale CNN-transformer network for change detection in optical remote sensing images. In Proceedings of the 2023 26th International Conference on Information Fusion (FUSION), Charleston, SC, USA, 27–30 June 2023; pp. 1–5. [Google Scholar]
- Li, J.; Li, S.; Wang, F. Adaptive Fusion NestedUNet for Change Detection Using Optical Remote Sensing Images. IEEE J. Sel. Top. Appl. Earth Obs. Remote Sens. 2023, 16, 5374–5386. [Google Scholar] [CrossRef]
- Zhang, J.; Shao, Z.; Ding, Q.; Huang, X.; Wang, Y.; Zhou, X.; Li, D. AERNet: An Attention-Guided Edge Refinement Network and a Dataset for Remote Sensing Building Change Detection. IEEE Trans. Geosci. Remote Sens. 2023, 61, 5617116. [Google Scholar] [CrossRef]
- De Bem, P.P.; de Carvalho Júnior, O.A.; de Carvalho, O.L.F.; Gomes, R.A.T.; Fontes Guimarães, R. Performance Analysis of Deep Convolutional Autoencoders with Different Patch Sizes for Change Detection from Burnt Areas. Remote Sens. 2020, 12, 2576. [Google Scholar] [CrossRef]
- Alcantarilla, P.; Stent, S.; Ros, G.; Arroyo, R.; Gherardi, R. Street-view change detection with deconvolutional networks. Auton. Robot. 2018, 42, 1301–1322. [Google Scholar] [CrossRef]
- Fang, S.; Li, K.; Shao, J.; Li, Z. SNUNet-CD: A Densely Connected Siamese Network for Change Detection of VHR Images. IEEE Geosci. Remote Sens. Lett. 2022, 19, 8007805. [Google Scholar] [CrossRef]
- Papadomanolaki, M.; Vakalopoulou, M.; Karantzalos, K. A deep multitask learning framework coupling semantic segmentation and fully convolutional LSTM networks for urban change detection. IEEE Trans. Geosci. Remote Sens. 2021, 59, 7651–7668. [Google Scholar] [CrossRef]
- Lin, M.; Yang, G.; Zhang, H. Transition Is a Process: Pair-to-Video Change Detection Networks for Very High Resolution Remote Sensing Images. IEEE Trans. Image Process 2023, 32, 57–71. [Google Scholar] [CrossRef] [PubMed]
- Kingma, D.; Ba, J. Adam: A method for stochastic optimization. arXiv 2015, arXiv:1412.6980v9. [Google Scholar]
- Jilin-1 Net. 2023 “Jilin-1” Cup Satellite Remote Sensing Application Youth Innovation and Entrepreneurship Competition. Available online: http://archive.today/2024.01.23-024742/https://www.jl1mall.com/contest/match (accessed on 3 July 2023).
- Kulkarni, S.C.; Rege, P.P. Pixel level fusion techniques for SAR and optical images: A review. Inf. Fusion 2020, 59, 13–29. [Google Scholar] [CrossRef]
- Mardian, J.; Berg, A.; Daneshfar, B. Evaluating the temporal accuracy of grassland to cropland change detection using multitemporal image analysis. Remote Sens. Environ. 2021, 255, 112292. [Google Scholar] [CrossRef]
- Chen, D.; Wang, Y.; Shen, Z.; Liao, J.; Chen, J.; Sun, S. Long Time-Series Mapping and Change Detection of Coastal Zone Land Use Based on Google Earth Engine and Multi-Source Data Fusion. Remote Sens. 2021, 14, 1. [Google Scholar] [CrossRef]
- Liu, B.; Song, W. Mapping abandoned cropland using Within-Year Sentinel-2 time series. Catena 2023, 223, 106924. [Google Scholar] [CrossRef] [PubMed]
- Shi, C.; Zhang, Z.; Zhang, W.; Zhang, C.; Xu, Q. Learning Multiscale Temporal–Spatial–Spectral Features via a Multipath Convolutional LSTM Neural Network for Change Detection with Hyperspectral Images. IEEE Trans. Geosci. Remote Sens. 2022, 60, 5529816. [Google Scholar] [CrossRef]
- Sun, Z.; Di, L.; Fang, H. Using long short-term memory recurrent neural network in land cover classification on Landsat and Cropland data layer time series. Int. J. Remote Sens. 2019, 40, 593–614. [Google Scholar] [CrossRef]
Disclaimer/Publisher’s Note: The statements, opinions and data contained in all publications are solely those of the individual author(s) and contributor(s) and not of MDPI and/or the editor(s). MDPI and/or the editor(s) disclaim responsibility for any injury to people or property resulting from any ideas, methods, instructions or products referred to in the content. |
© 2024 by the authors. Licensee MDPI, Basel, Switzerland. This article is an open access article distributed under the terms and conditions of the Creative Commons Attribution (CC BY) license (https://creativecommons.org/licenses/by/4.0/).