Article

Effects of Geomorphic Spatial Differentiation on Vegetation Distribution Based on Remote Sensing and Geomorphic Regionalization

1
State Key Laboratory of Resources and Environmental Information System, Institute of Geographic Sciences and Natural Resources Research, Chinese Academy of Sciences, Beijing 100101, China
2
University of Chinese Academy of Sciences, Beijing 100049, China
3
Jiangsu Center for Collaborative Innovation in Geographical Information Resource Development and Application, Nanjing 210023, China
4
Collaborative Innovation Center of South China Sea Studies, Nanjing 210093, China
5
Xinjiang Institute of Ecology and Geography, Chinese Academy of Sciences, Urumqi 830011, China
6
College of Geography and Remote Sensing Sciences, Xinjiang University, Urumqi 830017, China
*
Author to whom correspondence should be addressed.
Remote Sens. 2024, 16(6), 1062; https://doi.org/10.3390/rs16061062
Submission received: 15 February 2024 / Revised: 13 March 2024 / Accepted: 15 March 2024 / Published: 17 March 2024
(This article belongs to the Section Remote Sensing in Geology, Geomorphology and Hydrology)

Abstract

:
As the core area of human activities and economic development in the Xinjiang Autonomous Region, the hilly oasis zone of Xinjiang directly affects the regional sustainable development and stability of the ecosystem. Understanding the effects of different geomorphic types on vegetation distribution is crucial for maintaining vegetation growth and development, especially the improvement in the terrestrial ecological environment in arid areas under the background of climate change. However, there are few studies on the effect of spatial differences in detailed geomorphic types on vegetation distribution patterns. Therefore, this paper divides the Xinjiang hilly oasis zone into six geomorphologic level zones and innovatively investigates the influence of detailed geomorphologic types on the spatial distribution of vegetation and vegetation cover. Further, the area proportion of detailed landform types corresponding to different vegetation coverage in each geomorphic area was quantitatively calculated. Finally, the Geodetector method was used to detect the drivers of interactions between vegetation and the environment. The findings are shown as follows: (1) In the same climate zone, the spatial differentiation of landforms has a great influence on the vegetation distribution, manifesting as the significantly different vegetation distribution in different landform types. Grassland is the main vegetation type in the erosion and denudation of Nakayama; cultivated vegetation and meadows have a larger coverage in the alluvial flood plain and alluvial plain; and the distribution of vegetation in the Tianshan economic zone is characterized by obvious vertical zoning with the geomorphology. (2) The landform type and morphological types are the strongest driving factors for vegetation coverage with q values of 0.433 and 0.295, respectively, which effectually fill the gap caused by only using two terrain indicators, slope and elevation, to study the relationship between landforms and vegetation. (3) In addition, the improved nonlinear interaction resulting from the double factor of landform type and slope is 0.486, which has a stronger control on vegetation coverage than the single factor of landform type. These findings are conducive to enhancing the supply services of vegetation to the ecosystem in arid areas as well as providing important scientific guidance for the construction of ecological civilization and sustainable development in Xinjiang.

1. Introduction

Vegetation is an important part of terrestrial ecosystems. Geomorphological differences can directly or indirectly change the habitat conditions of vegetation, thus affecting the growth and distribution of vegetation [1,2,3]. There is an urgent need to explore the relationship between the spatial differentiation of landforms and vegetation distribution from the global scale to the local scale, because vegetation has a crucial impact on the stability of the Earth’s ecosystem [4]. Geomorphology, as one of the important branches of geography, affects the surface environment on which human existence depends and has direct and indirect influences on production, lifestyle, and social and economic activities [5,6]. Currently, there are many studies on the impact of landforms on vegetation distribution. Fan et al. [7] explored the spatiotemporal dynamics of vegetation in Horqin sandy land and its interaction with terrain and other environmental factors, and determined the effects of various environmental factors on vegetation growth. Gao et al. [8] studied the relationship between the temporal and spatial dynamics of vegetation and climate change, environmental factors, and vegetation cover in the headwaters of three rivers. However, most of the above studies are limited to basic landform types such as plains, mountains, hills, and plateaus, and there are few studies on detailed geomorphic types and vegetation distribution. When in the same climatic zone, different landform types have a crucial influence on the distribution of vegetation, and micro-landforms can determine even a small variability in the distribution of vegetation. Therefore, it is urgent to study the effects of detailed geomorphic types on the spatial distribution of vegetation from the perspective of remote sensing and geomorphic regionalization [9,10,11,12].
The study of the influence of different geomorphic types on vegetation coverage to improve vegetation growth can improve the quality and stability of the ecological environment and provide references for vegetation restoration in ecological environment restoration [13,14]. At present, most studies are about the response of vegetation distribution to topographic factors such as elevation, slope, and slope direction, mainly focusing on the vertical distribution of large-scale vegetation belts. However, there are few studies on the effect of detailed geomorphic types on vegetation coverage [15,16,17,18]. Therefore, there is an increasing need to quantitatively assess the impact of different geomorphic types on vegetation coverage, which is a new research focus. In addition, the relative contribution of each factor to vegetation change still needs further exploration. Generally, previous studies focusing on the spatial differentiation of landforms and vegetation distribution have mainly used linear correlation methods to describe the relationship between natural variables and vegetation, often ignoring the interaction between vegetation and topographic factors [19,20]. Using the Geodetector model, nonlinear and interactive algorithms can be applied to understand the complex connections between topographic factors and vegetation. It has been widely used to explore factors affecting ecological environmental changes, ecosystem health, and vegetation changes [21,22,23]. This method can help us understand the controlling effect of topographic and geomorphological factors on vegetation coverage and has important guiding significance for the planting and cultivation planning of vegetation in arid areas.
The hilly oasis zone in Xinjiang is a key area for the construction of the “One Belt and One Road” initiative. It is the core economic and cultural area in Xinjiang and directly affects the economic development of the Xinjiang Autonomous Region. The impact of the spatial differentiation of landforms on the control mechanism and changes in vegetation distribution is studied in this area, which has guiding significance for ensuring the sustainable and coordinated development of Xinjiang’s social economy and realizing the construction of a national ecological civilization. However, previous studies have mostly focused on a small area, such as the northern slope of the Tianshan Mountains or the Tianshan Economic Belt and Altay, ignoring the large landform area of the hilly oasis belt where the population is concentrated [24,25,26,27]. Therefore, exploring the control mechanism between detailed landform types and vegetation spatial distribution in the study area fills the gap in the lack of scientific research related to the hilly oasis zone and can provide strong support for relevant departments to formulate ecological environment management plans.
Aiming at the problem that there are few studies on the coupling relationship between vegetation distribution patterns and geomorphic spatial differentiation, this paper studies the influence of different geomorphic types on vegetation spatial differentiation. In addition, compared with previous studies that only explored the degree of influence of topographic factors such as elevation, slope, and slope orientation on vegetation cover, this paper innovatively adds geomorphic type as a geographical detection factor to evaluate its driving force on vegetation cover. Therefore, based on remote sensing and geomorphic regionalization, this paper explores the difference in the impact of geomorphic spatial differentiation on vegetation distribution in order to fill the gap in the study of the impact of detailed geomorphic types on vegetation coverage and vegetation spatial distribution and to provide scientific guidance for ecological civilization construction and sustainable development in Xinjiang.

2. Materials and Methods
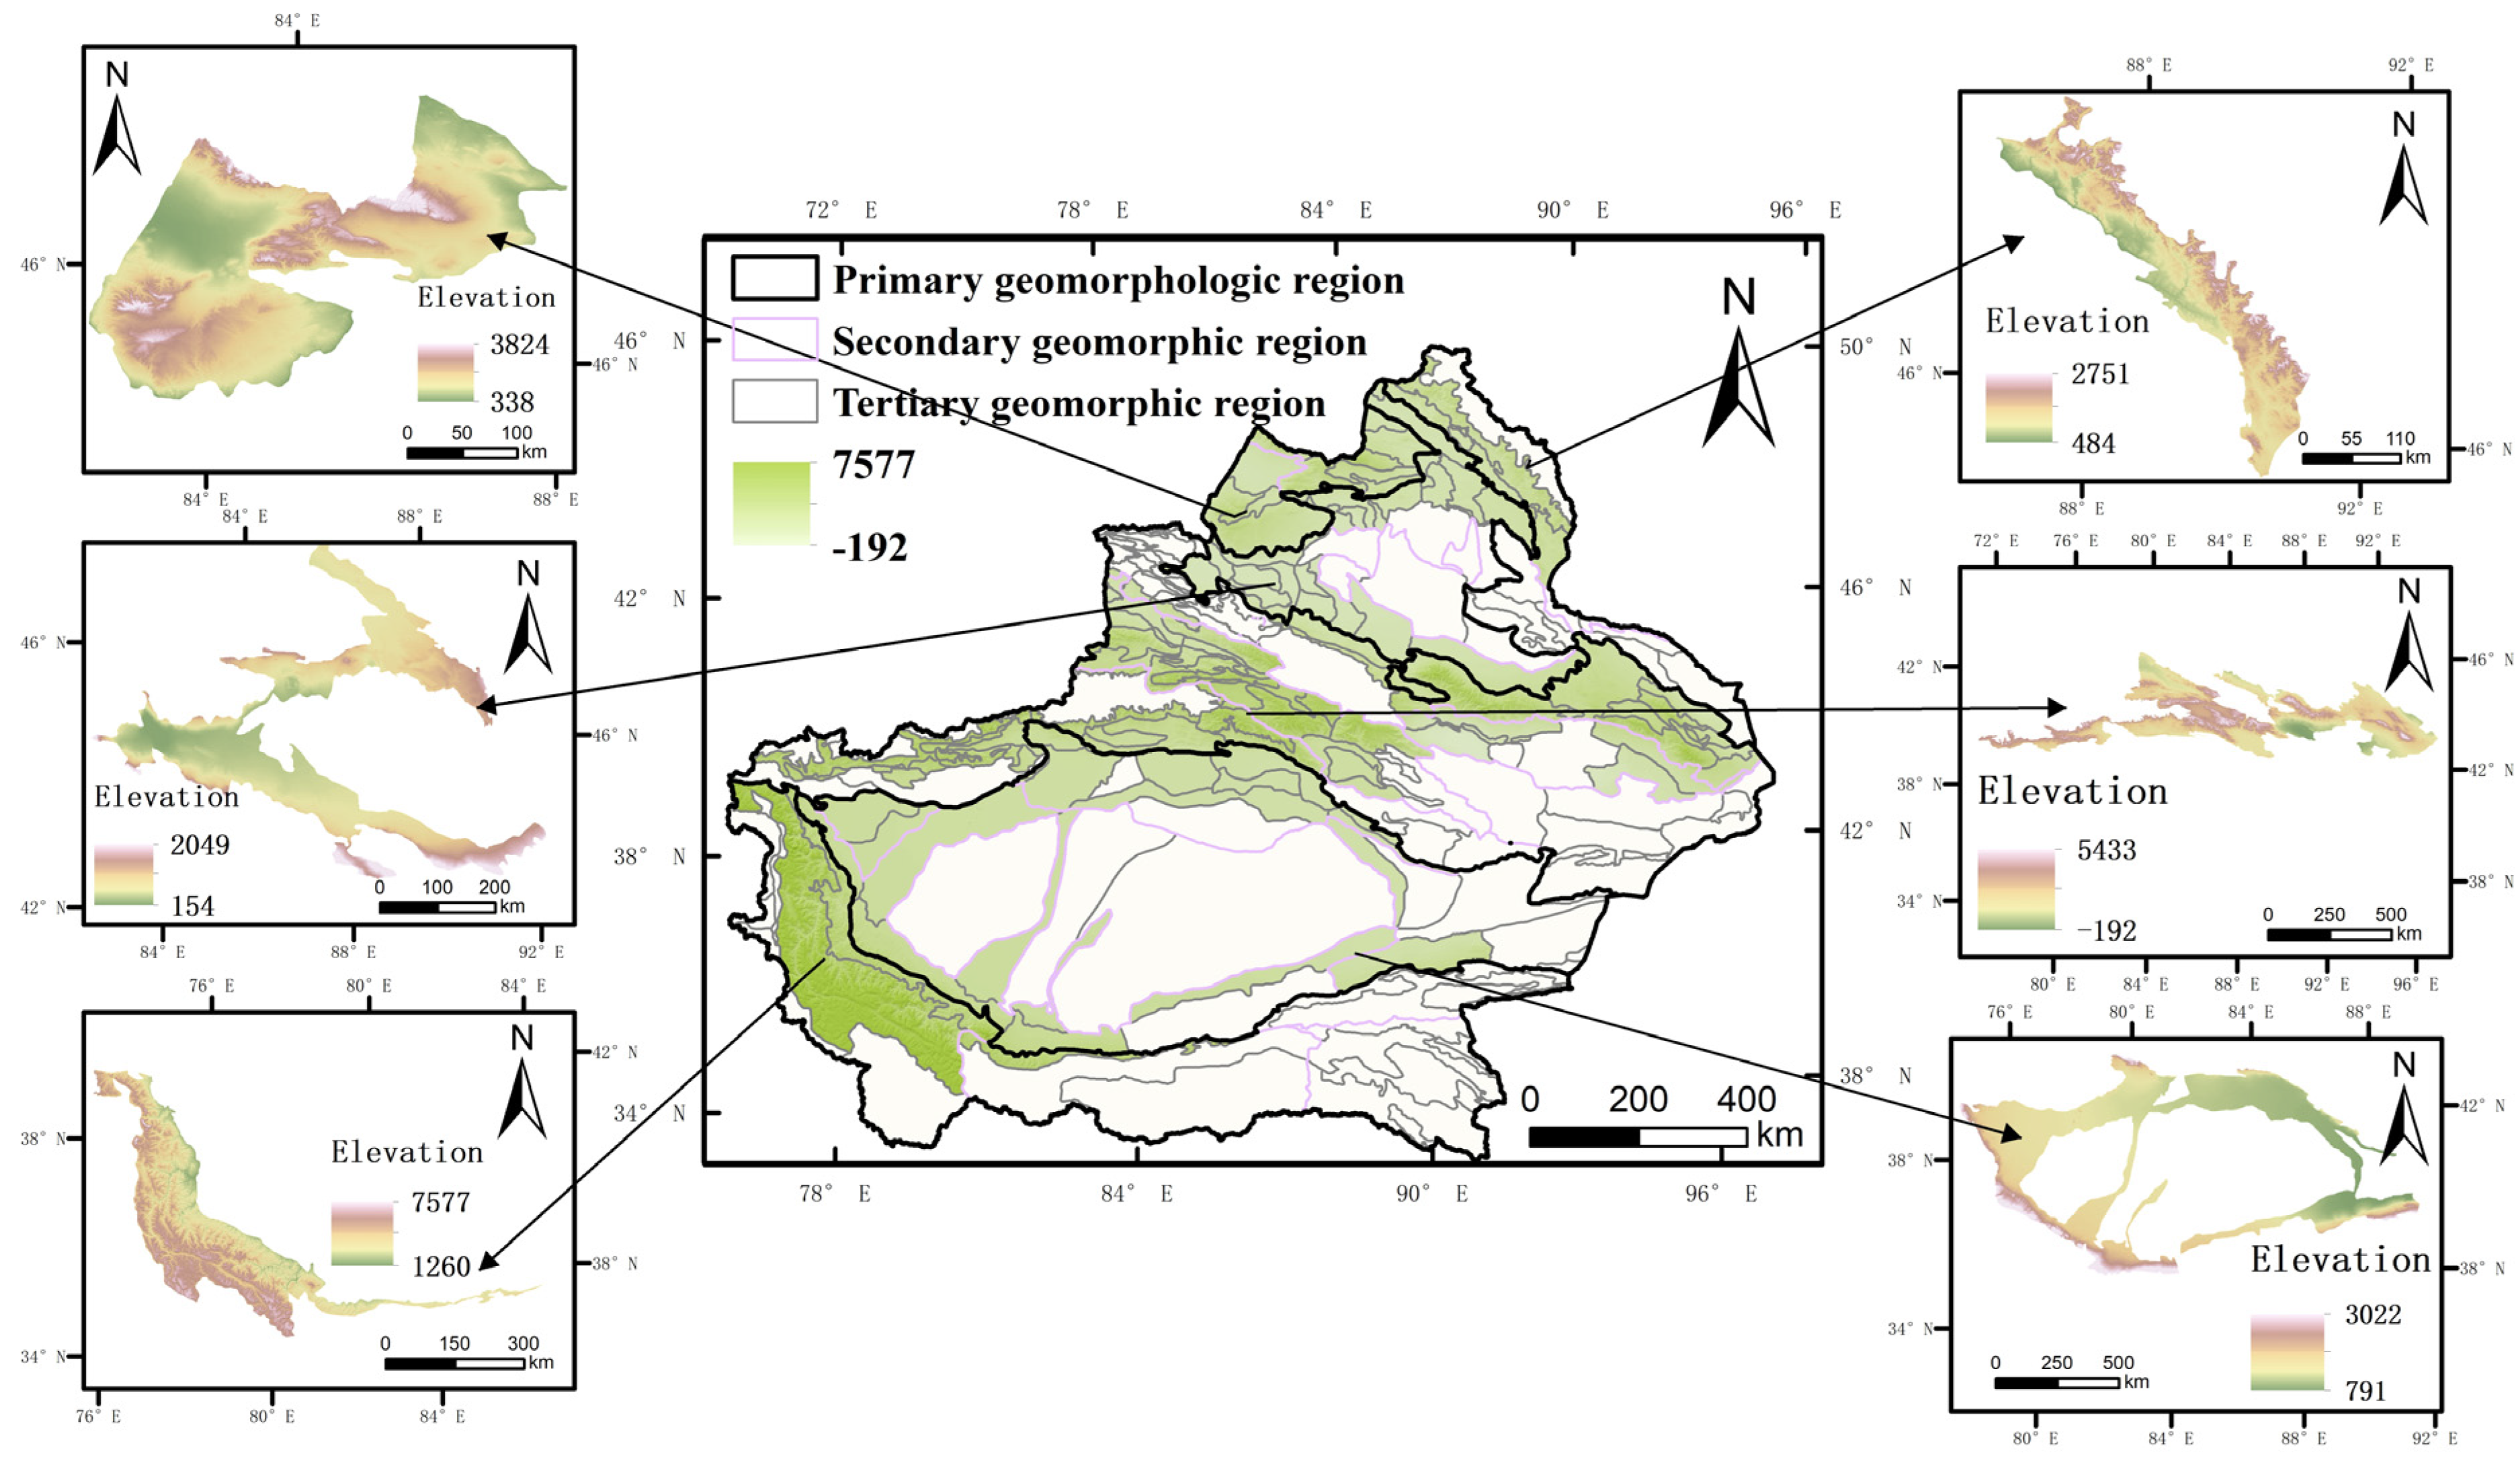
2.1. Study Area

Based on the third-level geomorphological divisions in the geomorphological zoning plan proposed by Chai et al. [28], this article selected 124 third-level geomorphological areas among the six first-level geomorphological areas as the Xinjiang hilly oasis belt research area. These six first-level geomorphological regions included the Altai and North Tower Mountains region, the Western Dzungaria Mountains region, the Junggar Basin region, the Tianshan Mountain region, the Kunlun Mountains, and the Altun Mountains region (Figure 1) [29]. Xinjiang’s hilly oasis zone is located between 73°40′–96°23′E longitude and 34°25′–49°10′N latitude. It has an obvious temperate continental climate, with large temperature differences, sufficient sunshine hours, and low precipitation [30,31]. The vegetation types in this area are complex and diverse. The main vegetation types are forests, shrubs, herbaceous vegetation, desert vegetation, alpine tundra, sparse vegetation, marshes, and aquatic vegetation [31,32,33]. Xinjiang’s hilly oasis zone is a key area for the “One Belt and One Road” initiative. It is a core area where human activities and economic and cultural gatherings occur and directly affect the economic development of the Xinjiang Autonomous Region. Therefore, research on the influence of the spatial differentiation of geomorphology on the distribution of vegetation in the hilly oasis zone of Xinjiang based on remote sensing and geomorphological zonation has an important guiding role in the construction of economic development and ecological civilization in Xinjiang [34,35].

2.2. Data Sources and Preprocessing

The 1:1 million landform data and 1:1 million vegetation data used in this study came from the “Third Scientific Expedition to Xinjiang” project team of Cheng Weiming’s team at the Institute of Geographic Sciences and Natural Resources Research, Chinese Academy of Sciences. Normalized difference vegetation index (NDVI) data were obtained via the National Aeronautics and Space Administration (https://ladsweb.modaps.eosdis.nasa.gov/, accessed on 11 August 2023) MOD13Q1-NDVI dataset acquisition. This dataset was derived from the MODIS sensor, with a spatial resolution of 250 m and a temporal resolution of 16 days [36]. Vegetation in Xinjiang grows best in August, so the NDVI dataset in August was selected to extract the vegetation coverage [37]. Further processing was performed on the selected MODIS data, such as spatial projection and the synthesis of the maximum NDVI value [38].
Digital elevation model (DEM) data with a spatial resolution of 30 metres were obtained from the Geospatial Data Cloud (https://www.gscloud.cn/, accessed on 13 August 2023). Data projection, splicing, and resampling operations were performed on the downloaded DEM data to resample the data to a resolution of 250 metres that was consistent with the MODIS data, and the DEM data were cropped using the Xinjiang Vector Administrative Region to finally obtain the elevation data.
Geodetectors were used to quantitatively analyze the control effect of topographic and geomorphological factors on the vegetation and vegetation coverage distribution, thereby exploring the control mechanism of the spatial differentiation of landforms on vegetation distribution. Three geomorphic factors, landform type (X1), elevation class (X2), and morphological types (X3), were extracted based on the landform type data. The four terrain factors of aspect (X4), slope (X5), surface roughness (X6), and curvature (X7) were obtained by processing and calculating the DEM data and resampling with the spatial analysis function of the ArcGIS 10.4 software (Table 1).

2.3. Methods

2.3.1. Geomorphic Regionalization

Geomorphic regionalization is the main content of regional geomorphological research and is an important basis for studying spatial changes in the natural environment [39]. It is also the most basic geomorphic unit. This study adopted the new Xinjiang landform division plan proposed by Cheng Weiming et al. and combined remote sensing and GIS technology to conduct qualitative and quantitative research on Xinjiang’s landform types and patterns (Figure 2) [28]. In the process of researching Xinjiang’s landform divisions, geographical grid analysis technology was used to locate and qualitatively and quantitatively study new landform divisions. Using geographical grids as a comprehensive platform for sampling or survey data with varying positioning accuracy and data scales is an effective means for regional comprehensive analysis, spatial analysis, data mining, knowledge discovery, and other applications.
ArcGIS rasterization methods and mathematical models were used to integrate the landform type data, DEM data, and original landform division data into a unified geographical grid, to establish a geographical grid-based landform division index system and a comprehensive analysis model, and to analyze the differences based on the spatial distribution characteristics and patterns of landform types. Based on the principles of similarity within regions and differences between regions, the landform types were merged step by step from bottom to top to obtain landform division units.

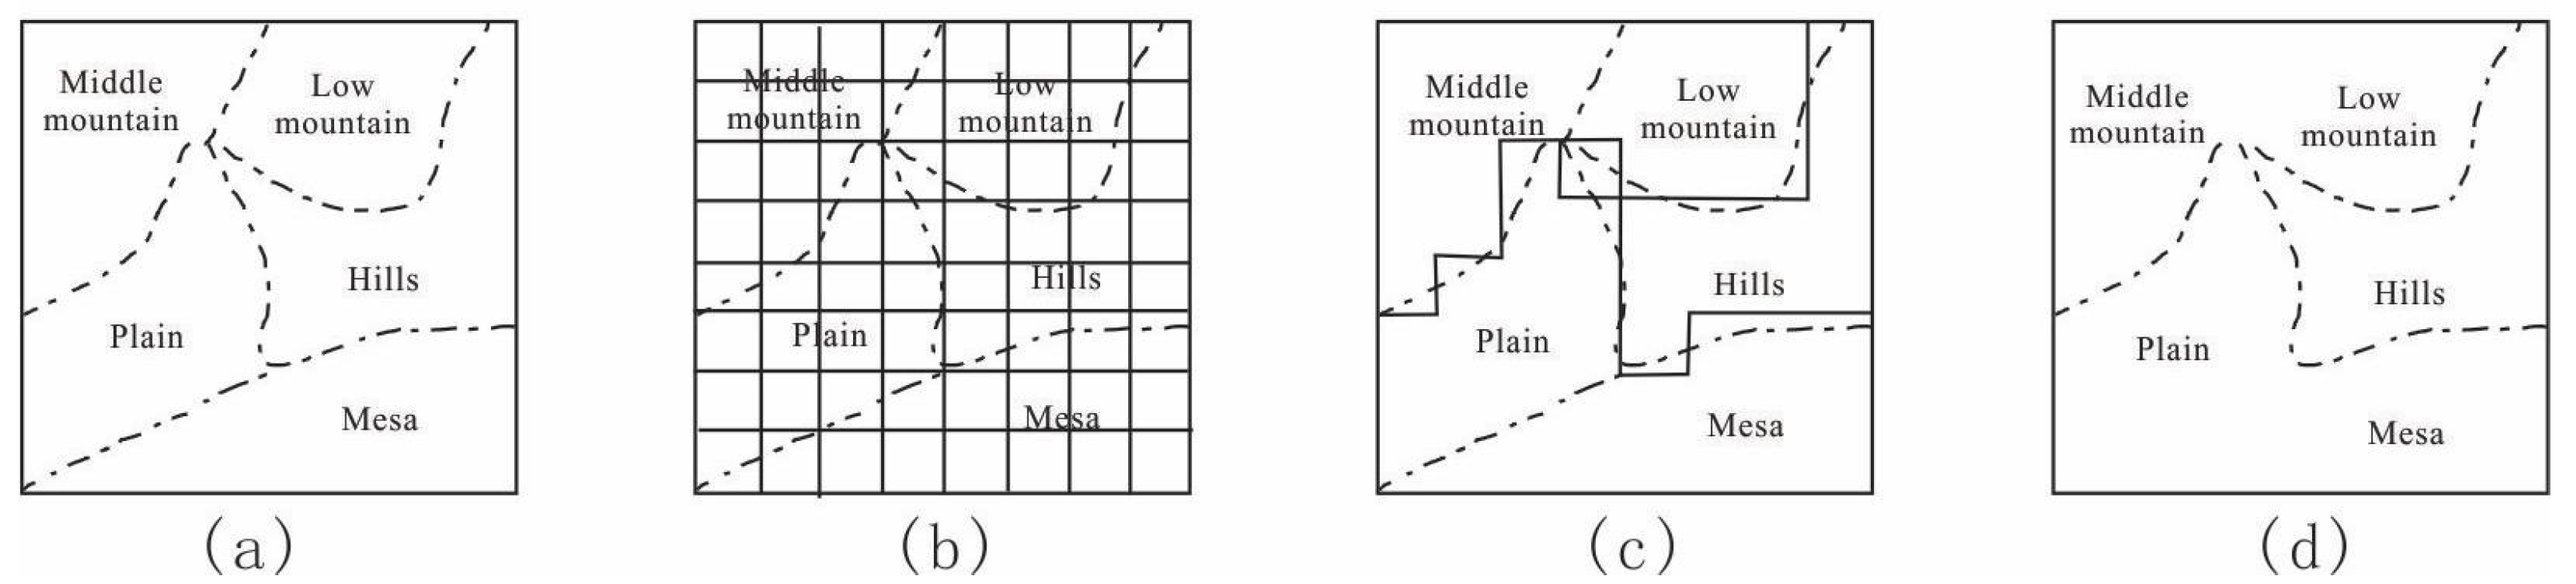
2.3.2. Landform Classification

The landform classification system in this article is based on the three-level and nine-level landform classification system proposed by Cheng Weiming et al. [40,41], which divides landforms into three levels: basic morphological class, genetic class, and morphological class. The landform types in this study were composed of the first-level macromorphological type subcategory, the second-level land altitude level subcategory, the third-level main force type subcategory, and the fourth-level main force action mode subcategory, which were divided into 54 levels of total landform types. According to the undulating changes in surface height (using the cutting depth or undulating height indicators), the surface shape was divided into plains (cutting depth < 30 m), platforms (cutting depth > 30 m), hills (undulating height < 200 m), and small-undulating mountains (200 m ≤ undulation height < 500 m), medium-undulating mountains (500 m ≤ undulating height < 1000 m), large-undulating mountains (1000 m ≤ undulating height < 2500 m), and extremely undulating mountains (undulating height ≥ 2500 m) [42]. The specific landform type names included glacial alpine, glacial extreme alpine, till plain, hillock hills, moraine terrace, ice-scoured plain, ice-eroded terrace, ice-water plain, ice-rimmed mountain, ice-rimmed extremely high mountain, ice-rimmed hills, ice-rimmed plate, plain of denudation, barrow terrace, alluvial flood plain, alluvial floodplain terrace, alluvial–lacustrine plain, alluvial plain, alluvial terrace, windswept alluvial plain, windswept low mountains, windswept high mountain, wind-induced flood plain, windswept plain, windswept hills, Eolian mountains, windswept plain, wind erosion of hills, tectonically stacked plain, river plain, floodplain and lakeshore plain, floodplain, floodplain terrace, lacustrine alluvial plain, lake plain, lake accretion terrace, lake erosion plain, lake erosion plateau, marshy plain, erosion and denudation of low mountains, erosion and denudation of high mountains, erosion and denudation of very high mountains, plateau of erosion and denudation, erosion and denudation of hills, plateau of erosion and denudation, erosion and denudation of Nakayama, plateau of eroded alluvial plain, erosional alluvial terrace, erosion accretion hills, plateau of eroded landfill, erosion of mountains, erosion hills, melting plain, and salt lake plain.

2.3.3. Vegetation Coverage

The vegetation coverage index refers to the percentage of the vertical projection area of vegetation (including leaves, stems, and branches) on the ground to the total area of the statistical area and is expressed as the lushness of vegetation growth in a certain area. It is commonly used to detect vegetation growth conditions and changes in vegetation coverage, the ecological environment, and the climate surrounding the vegetation [43,44]. The calculation formula of its pixel bisection model is as follows:
F V C = ( N D V I N D V I S S ) ( N D V I V N D V I S S )
where in the formula, NDVI represents the specific normalized vegetation value of each pixel; NDVIv is a constant representing the NDVI value of a pure vegetation pixel, which is theoretically the largest NDVI value in the study area; and NDVIs is a constant representing bare land or no vegetation. The NDVI value of the covered pixel is theoretically the smallest NDVI value in the study area [45,46]. To obtain relatively accurate NDVIv and NDVI values in this study, a cumulative percentage corresponding to 2% was defined as the NDVIs, and a cumulative percentage corresponding to 98% was defined as the NDVIv.

2.3.4. Geodetector

A Geodetector can quantitatively describe spatial differentiation, one of the basic characteristics of geographical phenomena, and it can analyze the influence of each variable on the dependent variable and the interaction of multiple independent variables on the dependent variable [47]. To explore the impact of geomorphic types on the vegetation distribution in the hilly oasis belt of Xinjiang, this study selected three geographical detectors: factor detection, interaction detection, and ecological detection.
(1)
Factor detection
This factor detects the spatial differentiation of vegetation coverage and the extent to which the influencing factors influence and explain the spatial differentiation of vegetation coverage, and it measures it with the q value. The expression is as follows [48]:
q = 1 h = 1 L N h σ h 2 N σ 2 = 1 S S W S S T
S S W = h = 1 L N h σ h 2 , S S T = N σ 2
where in the formula, h = 1, 2, 3, …, L is the division, classification, or partition of vegetation coverage or influencing factors; N represents the number of all units in the study area; Nh represents the number of units in layer h; σ 2 represents the variance of the study area; σ h 2 represents the variance of stratification h; SSW is the sum of the variances within a layer; and SST is the total variance of the entire region [49,50].
The value range of q is [0, 1]. The larger the q value is and the closer it is to 1, the more obvious the spatial differentiation of the vegetation coverage is. If the stratification is caused by the influence of detection factors, a larger q value indicates the control of the detection factors on the vegetation coverage. The stronger the control, the weaker q is. In very extreme cases, if the q value is equal to 1, the detection factor completely controls the spatial distribution of the vegetation coverage. If the q value is equal to 0, there is no relationship between the two.
(2)
Interaction detection
This evaluates the interaction between different influencing factors X and detects whether different influencing factors X1 and X2 act simultaneously to enhance or weaken the explanatory power of the vegetation coverage, or it can be concluded that the effects on the vegetation coverage are independent of each other among these influencing factors. It evaluates the influence of different interactions by comparing the degree of explanation of vegetation coverage by a single factor, the sum of two factors, and the interaction of two factors [51]. The detection method calculates the q values of the two factors X1 and X2 on the dependent variable Y, recorded as q(X1) and q(X2), respectively. Second, the q value of the superposed factors X 1 X 2 is calculated, which is recorded as q ( X 1 X 2 ) . Finally, the values of q(X1), q(X2) and q ( X 1 X 2 ) are compared. The relationship between the two factors can be divided into the following categories, as shown in Table 2.
(3)
Ecological detection
To compare whether there is a significant difference between the influence factors X1 and X2 on the spatial distribution of vegetation coverage, the statistic F is used to express the formula as follows:
F = N x 1 N x 2 1 S S W x 1 N x 2 N x 1 1 S S W x 2
S S W x 1 = h = 1 L 1 N h σ h 2 , S S W x 2 = h = 1 L 2 N h σ h 2
in the formula, NX1 and NX2 represent the sample sizes of the two factors X1 and X2, respectively; SSWX1 and SSWX2 represent the sums of the intrastratum variances of the strata formed by X1 and X2, respectively; and L1 and L2 represent the numbers of layers of variables X1 and X2, respectively, where the null hypothesis H0:SSWX1 = SSWX2. If H0 is rejected at the significance level of a, this indicates that there is a significant difference in the impact of the two factors X1 and X2 on the spatial distribution of attribute Y [52].

3. Results

3.1. Study of the Influence of Geomorphic Spatial Differentiation on Vegetation Distribution

The distribution of vegetation is closely related to topographic factors, geomorphological processes, climate, and soil (Figure 3). When the area is large and spans different climate zones, the main controlling factor of vegetation distribution is climate. However, when the region is located in the same climate type, the influence of climate on the spatial pattern of vegetation differentiation is small, and the influence of topography and geomorphology on the distribution of vegetation is obvious. Geomorphological processes interfere with surface soil erosion, landslides, and collapses, disturbing the living environment and growth area of vegetation [53,54,55]. At the same time, soil is transported to the lower slopes of hills through accumulation. Different degrees of accumulation and erosion constitute the differences in species composition of each microtopographic unit. Glacier snow and permafrost periglacial action result in a low vegetation survival rate, and the vegetation type in this landform is singular. The action of flowing water forms alluvial plains, and the water-rich oasis belt has complex vegetation types and high vegetation coverage. Topographic factors directly affect the differentiation of vegetation spatial patterns. Altitude causes vertical zoning patterns of vegetation. There are obvious differences in vegetation types and vegetation coverage at different altitudes. Aspect and slope affect the orientation and inclination through morphological control processes, and surface roughness jointly controls the spatial distribution pattern of vegetation. Vegetation absorbs water and nutrients through the soil. Topographic factors and geomorphological processes jointly affect the fertility and accumulation area of the soil, thus restricting the spatial distribution of vegetation. Therefore, the spatial differentiation of landforms has the most important and fundamental impact on vegetation distribution patterns.

3.2. Coupling Study of Landform Types with Vegetation and Cover Based on Geomorphologic Zoning

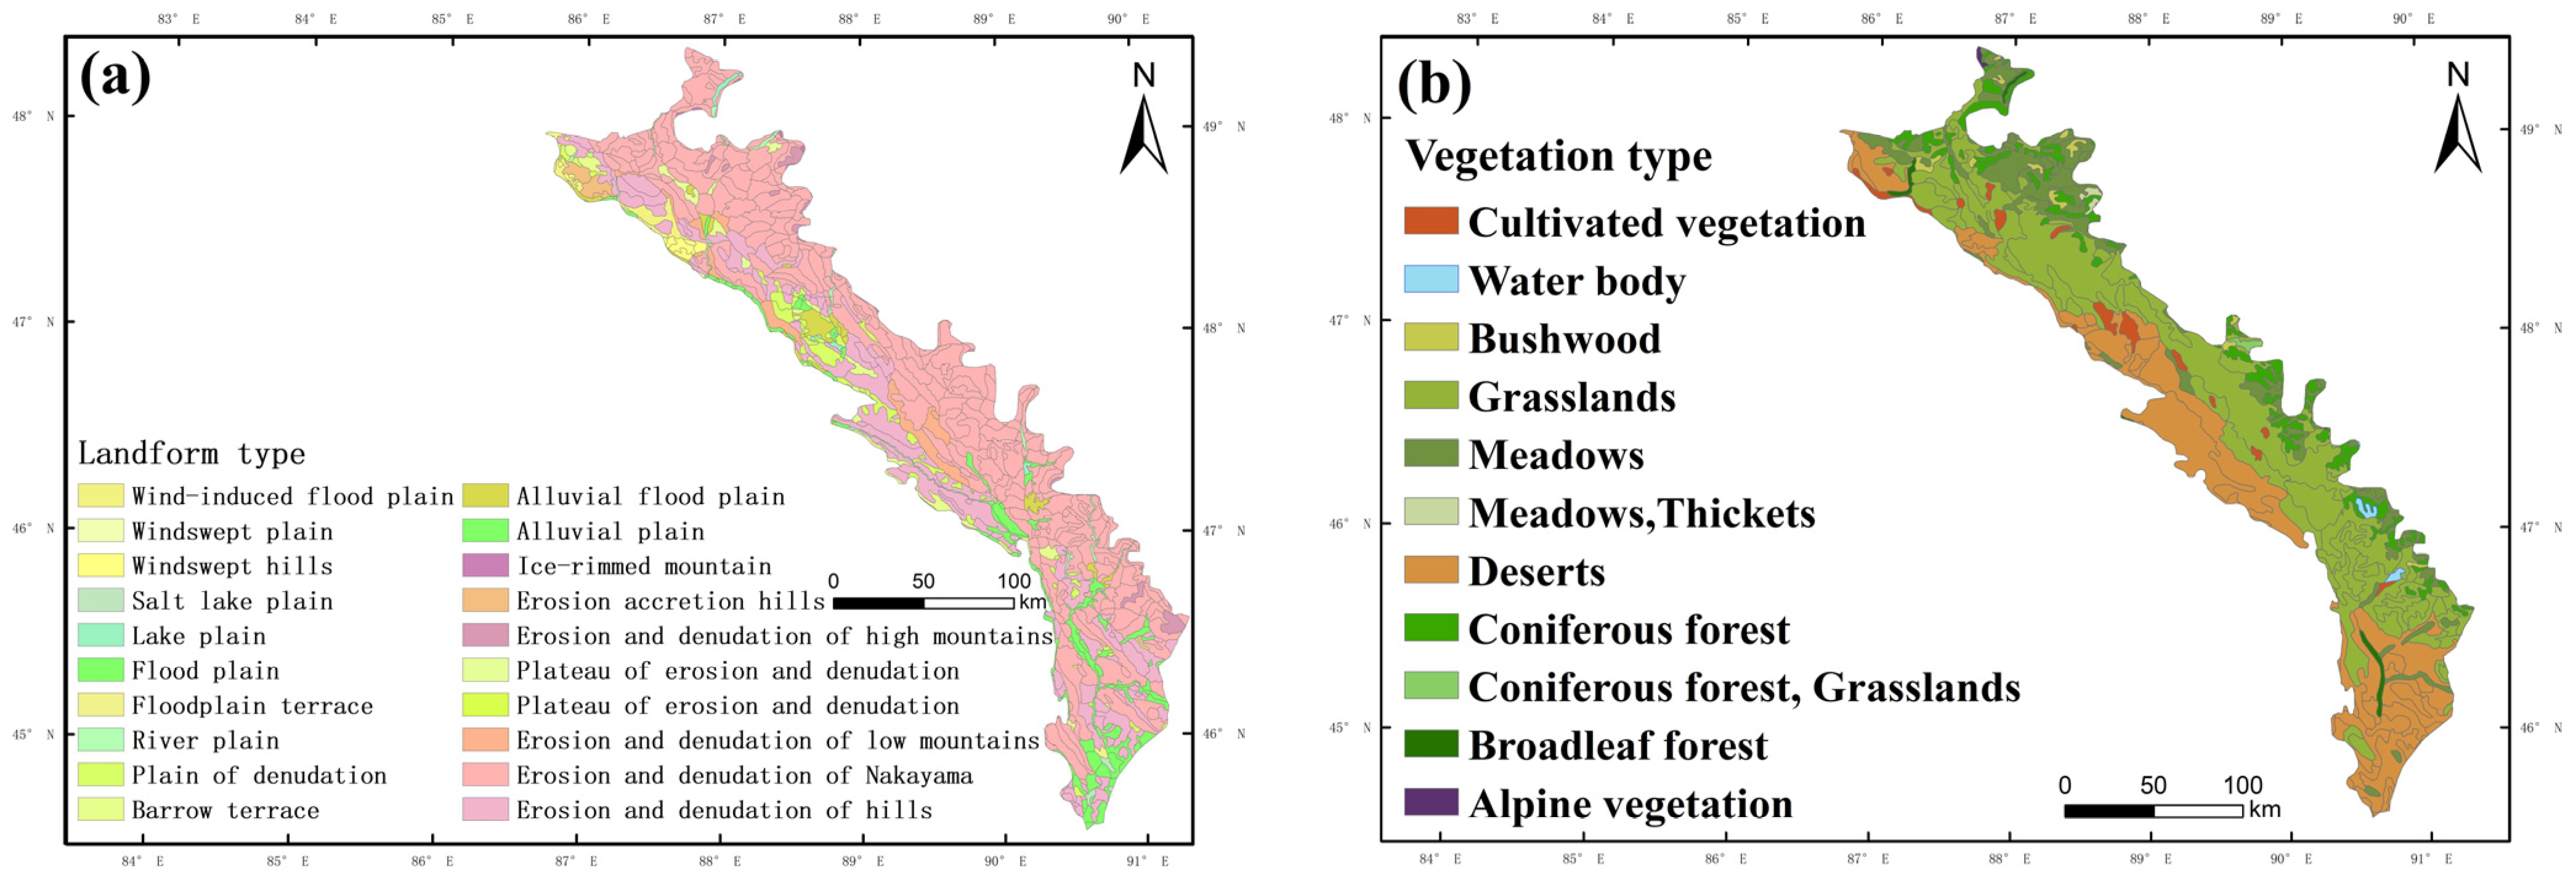
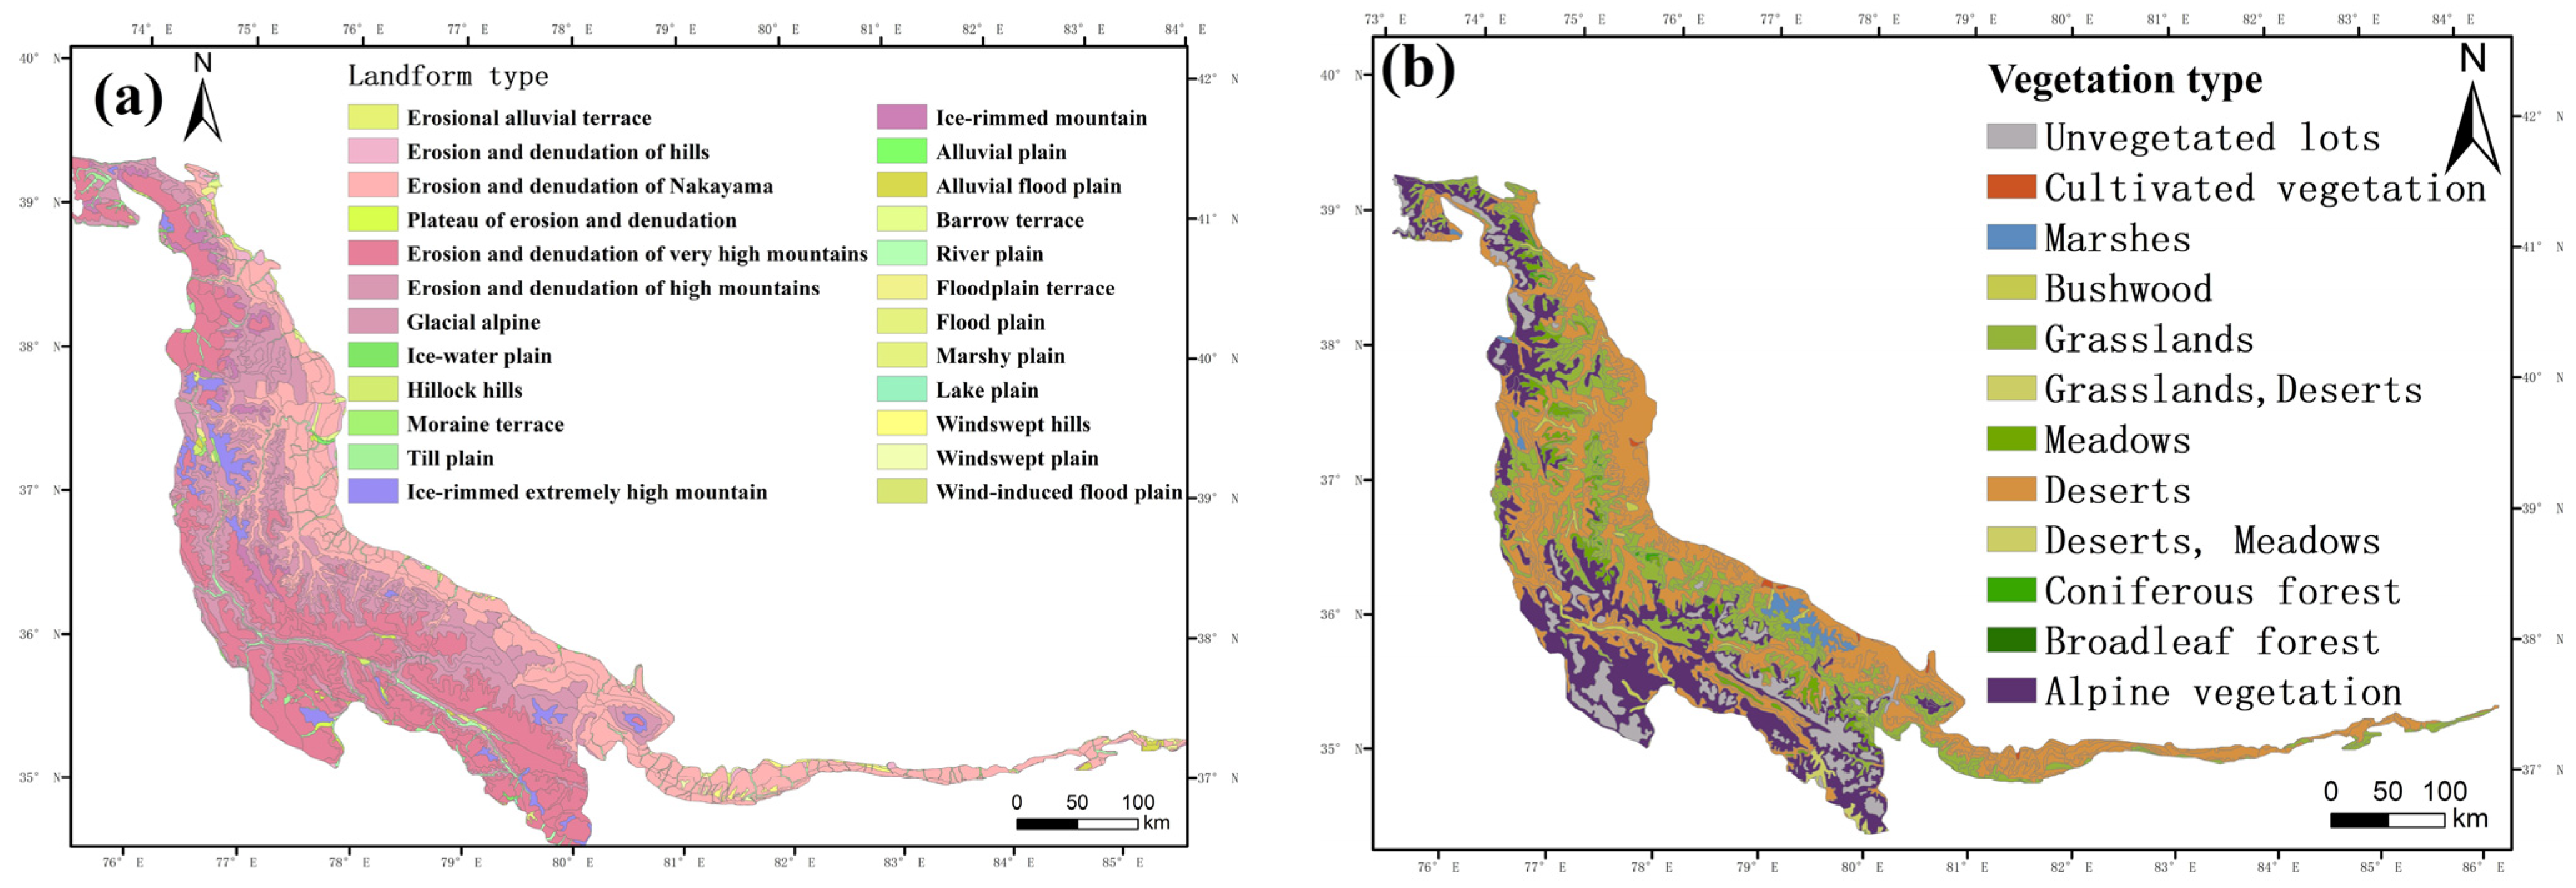
3.2.1. Patterns of Vegetation Distribution within the Six Geomorphic Zones of the Hilly Oasis Zone

The landforms of the Altai and North Tower Mountains region are spatially distributed in a northwest–southeast strip, with high altitude in the northeast and low altitude in the southwest (Figure 4). Desert vegetation is mainly distributed on the low-lying erosion and denuded hills and plains in the western region. Temperate tufted grass steppe affected by erosion and denudation of mid-mountain landforms accounts for half of the entire region and is concentrated in the central region. There is some cultivated vegetation in the middle part of the grassland that is managed by residents in this area, and their corresponding landform type is alluvial plain. There are eroded and denuded alpine landforms in the northeast and southeast. The main vegetation growing on this landform type is sagebrush and alpine meadows of forbs.
Various landform types are interlaced in the Western Dzungaria Mountains region. The middle terrain is high in altitude, and the surrounding terrain is low in altitude. The overall trend is radiation from the middle high altitude to the surrounding low altitude (Figure 5). There is a concentric-like spatial distribution pattern of vegetation in the northwest, with desert, meadow, broadleaf forest, and cultivated vegetation in sequence from the centre outwards. The cultivated vegetation in the Western Junggar Mountains region grows on alluvial plains and alluvial plain landforms. This is because humans have settled in the low-altitude oasis zones and plant crops suitable for growth here.
The hilly oasis zone in the Junggar Basin region is distributed on the edge of the Junggar Basin (Figure 6). Low-altitude alluvial plain, alluvial terrace, and windswept hilly landforms occupy two-thirds of the landform area. The terrain of the Junggar Basin is relatively low, with mostly low-altitude and mid-altitude landforms and almost no high-altitude or extremely high-altitude landforms. The vegetation type in the Junggar Basin is relatively singular. Desert vegetation covers a large area and is distributed throughout the region. Only the southern plains and erosion-impacted platforms have some cultivated vegetation.
The landforms of the Tianshan Mountains region are spatially distributed along the Tianshan Mountains in an east–west direction (Figure 7). The landform types are complex and diverse, and each landform type is evenly distributed. In the northern slope of the Tianshan Mountains region, the three landform types, alluvial plain, erosion-impacted platforms, and erosion and denudation hills, have greater dominance. Various types of vegetation are evenly distributed in various areas in the Tianshan Mountains region. The middle section of the Tianshan Mountains is mainly composed of three vegetation types: desert, subalpine meadow, and alpine meadow. Desert plants on the northern slope of the Tianshan Mountains are greatly affected by altitude constraints among terrain factors. The spatial distribution of natural vegetation in the eastern Tianshan Mountains has horizontal and vertical distribution characteristics. The natural landscape zone of the piedmont plain is divided into flood alluvial fans and alluvial plain zones. The vertical natural zone of the eastern Tianshan Mountains has vegetation distributed from high to low, including alpine shrubs, mountain grasslands, arid mountain grasslands, and desert grasslands.
The geomorphology of the Tarim Basin region is spatially presented as a ring around the Tarim Basin. The terrain is high in the west and low in the east. Alluvial plain and windswept hill landforms are widely distributed (Figure 8). The western part is dominated by alluvial plains and windswept hill landforms, while the eastern part is dominated by low-altitude plains and low-altitude hilly landforms. Desert vegetation is distributed in both plain and hilly landforms. Cultivated vegetation and meadows are generally distributed on mid-elevation and low-altitude plain landscapes. Because this is the edge of the desert, only the plains have the necessary moisture for the growth of these two types of vegetation.
The landforms of the Kunlun Mountains and Altun Mountains are distributed in strips from northwest to southeast. The terrain is high in the west and low in the east. Mountainous landforms are the main landform type (Figure 9). There are clear boundaries between each strip of landform types. From west to east, the landform types are erosion and denudation extremely high mountains, erosion and denudation high mountains, and erosion and denudation mid-mountains. Sea buckthorn shrub vegetation is concentrated in the alpine plains of the southwest. Due to the high terrain of the region, water loss is rapid, and only the alpine plains can accumulate water suitable for the growth of shrubs. The spatial positions of erosion–denudation alpine and erosion–denudation mid-mountain landforms are generally consistent with the spatial positions of alpine vegetation, indicating that the growth and distribution of alpine vegetation are affected by alpine landforms.

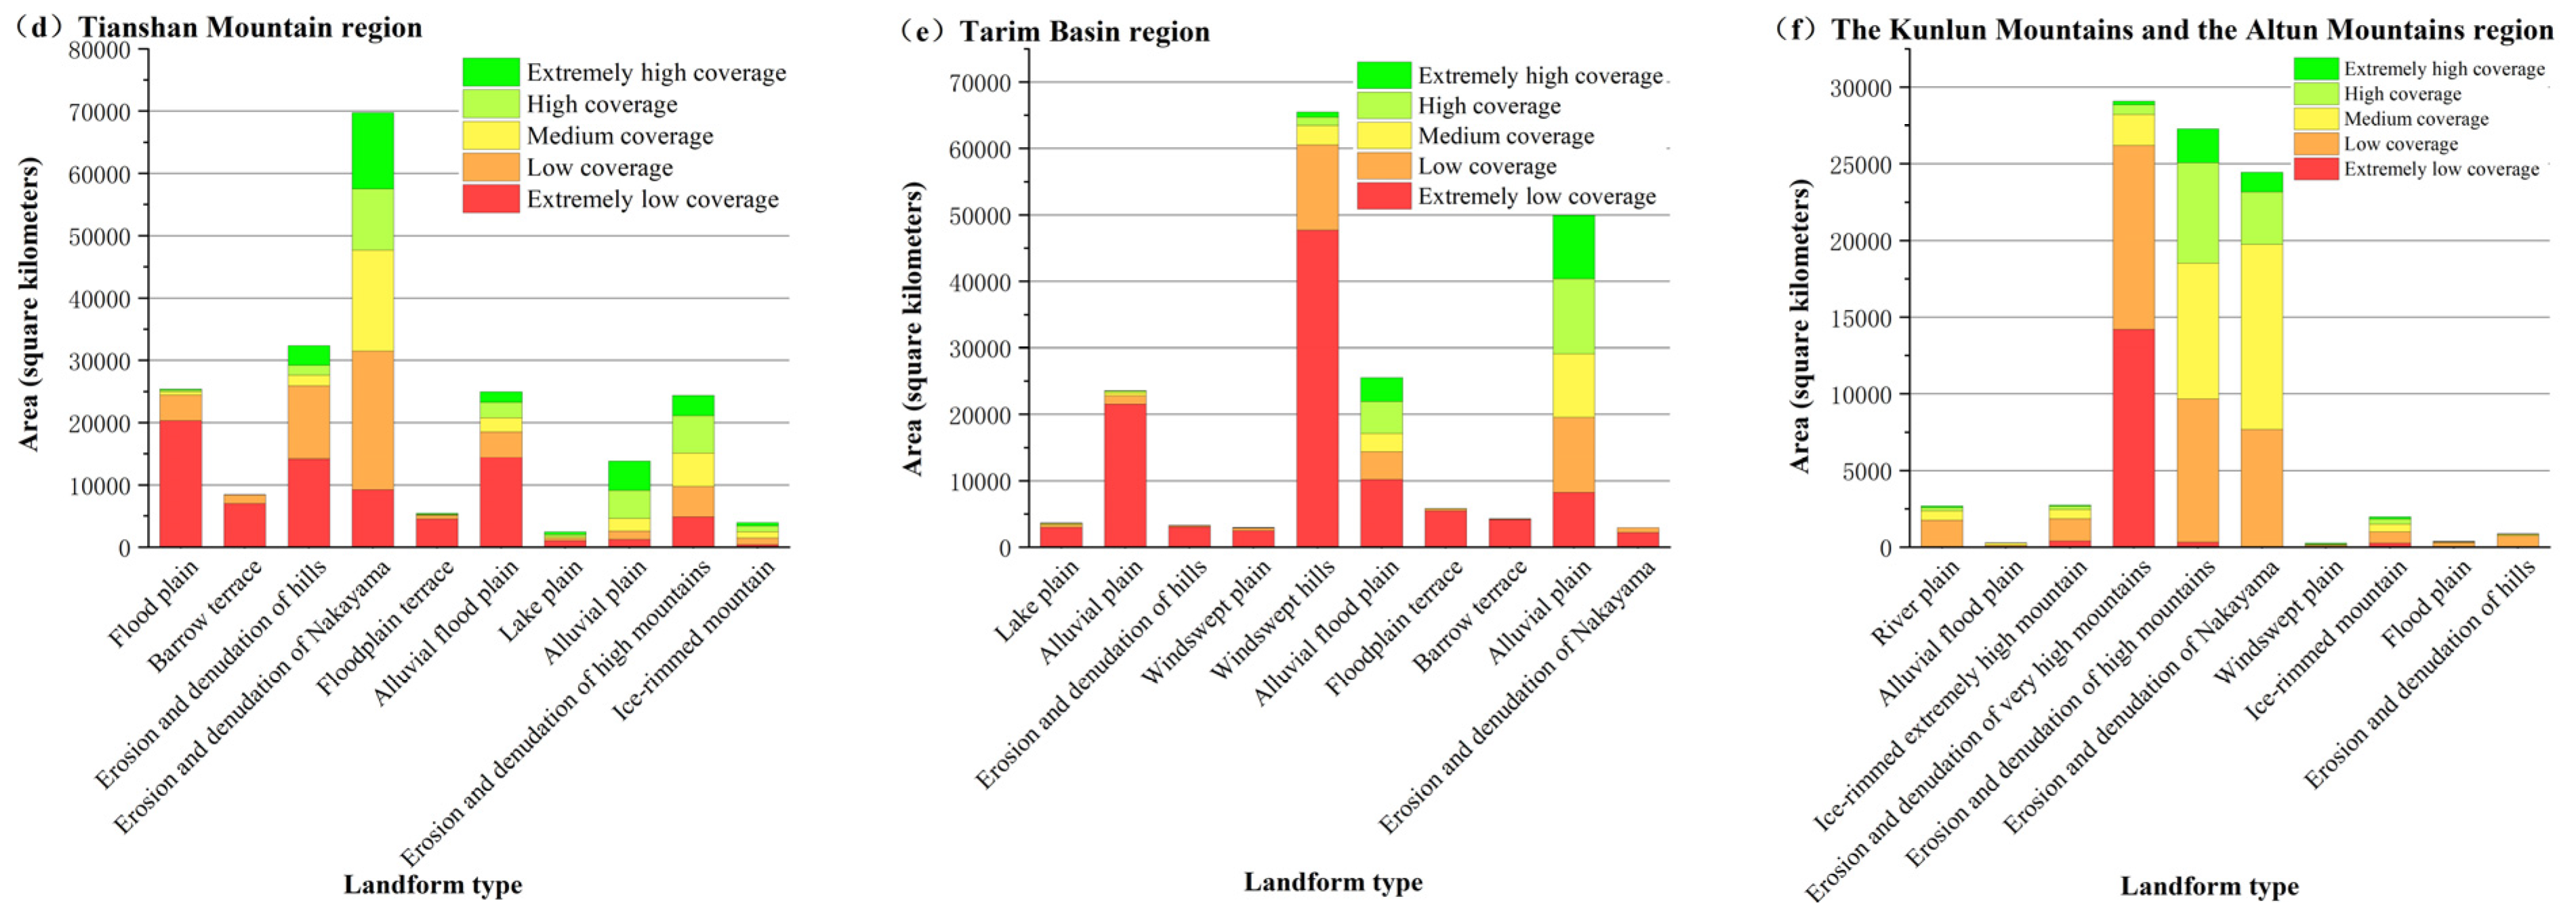
3.2.2. Response of Vegetation Cover to Spatial Differentiation of Landforms

The overall vegetation coverage in the Altai and North Tower Mountains region shows a spatial distribution trend of high in the northeast and low in the southwest (Figure 10a). Very low vegetation coverage is concentrated in the eroded and denuded hilly arid area in the southwest, where the vegetation species are single, such as Artemisia annua and Chenopodium sinensis. Plants with smaller branches and leaves are widely distributed, resulting in extremely low vegetation coverage. High-coverage and extremely high-coverage vegetation grow on mid-mountain landforms eroded by running water. The vegetation species here are mostly Siberian larch forest, Siberian spruce forest, bluegrass meadow, triple fescue, alpine goldenrod meadow, and silkworm-dense naturally growing vegetation, such as hairy roses and creeping cotoneaster shrubs. There is a clear contrast in vegetation coverage between the east and west in the Western Dzungaria Mountains region (Figure 10b). The vegetation coverage in the west is much higher than that in the east. The west is dominated by extremely high- and high-coverage vegetation, while the east is dominated by polar and low-coverage vegetation. Extremely high-coverage vegetation is concentrated on the alluvial flood plain landform. The vegetation types are mainly annual grain crops such as spring wheat, millet, flax, and rapeseed fields, as well as cold-resistant cash crop fields.
There is an obvious difference in the vegetation coverage between the north and the south in the Junggar Basin region (Figure 10c). The vegetation coverage in the entire region is low. The vegetation coverage in the south is significantly higher than that in the north. Very-low-coverage vegetation occupies the main area in the north. The south is characterized by extremely high and high vegetation coverage. High- and medium-coverage vegetation dominates. The landform types in the south and the north are roughly the same, with alluvial plains, alluvial terraces, and windswept hills being the main landforms, but the vegetation coverage is completely different. This is because the south is located in the economic belt on the northern slope of the Tianshan Mountains and has more oases and richer vegetation types, resulting in higher vegetation coverage. However, there are fewer human activities in the north, and most of them are desert vegetation with extremely low vegetation coverage, such as horsetail and Haloxylon ammodendron. The control mechanism of landforms on vegetation is greatly affected by other factors, such as human activities. The overall vegetation coverage in the Tianshan Mountain region shows a spatial distribution trend of a gradual transition from high coverage in the north to low coverage in the south (Figure 10d). Among them, extremely low and low vegetation coverage are mainly concentrated in the erosion and denudation hills, denudation platforms, and erosion and denudation at lower altitudes in the south. The Zhongshan landform area is dominated by desert vegetation such as ephedra, halophytes, and salsandra, so the vegetation coverage is very low.
The overall vegetation coverage in the Tarim Basin region is very low (Figure 10e). Spatially, low-coverage vegetation occupies approximately 80% of the area, with only some high-coverage vegetation occurring in the north and east. The spatial distribution of vegetation coverage is consistent with the spatial distribution of vegetation types. The vegetation types with extremely low coverage and low coverage are desert vegetation, while the vegetation types with high coverage are grasslands, meadows, and cultivated vegetation. The vegetation coverage in the Kunlun Mountains and the Altun Mountains region is generally low, showing a spatial distribution trend of a gradual transition from low coverage in the west to high coverage in the east (Figure 10f). Erosion–denudation alpine and erosion–denudation ultra-alpine landforms cover a large area, accounting for almost one-half of the entire area. The landform type with the highest vegetation coverage in this landform area is the erosion and denudation mountain landform.

3.2.3. Correlation between Vegetation Cover and Spatial Differentiation of Landforms

The landform types in the six major landform areas in the hilly oasis belt are complex and diverse. In this study, the top ten geomorphic types with spatial distribution areas in each geomorphic region were selected for correlation analysis with vegetation coverage. The vegetation coverage in the Altai and North Tower Mountains region is significantly affected by the landform type. Extremely high coverage accounts for a large proportion of the erosion and denudation mid-mountain landforms, with a coverage area of up to 2175.8 km2. The mid-undulating mountain belt is a medium-undulating mountainous area with a higher altitude. This type of landform has less human activity, and many larch forests and spruce forests grow naturally. The vegetation coverage is significantly higher than that of the other landform types (Figure 11a). The distribution of extremely low-coverage vegetation on eroded and denuded hills accounts for up to almost 50% of the entire area. The low soil moisture content in hilly landforms is not conducive to vegetation growth. In the Western Dzungaria Mountains region, the landform type whose main force mode is erosion covers a large area, accounting for almost two-thirds of the entire area (Figure 11b). The landform with the largest distribution area of extremely high-coverage vegetation is the impact flood plain, covering an area of 1915.6 km2. Vegetation at all levels of vegetation coverage is evenly distributed on the eroded and denuded mountain landforms. The polar coverage on erosion–denudation hills occupies a larger area, indicating that the surface of hilly landforms is mostly exposed rock and soil, which is not suitable for vegetation growth. The vegetation coverage in the Junggar Basin region is obviously controlled by landform differentiation. The landform type with the largest vegetation coverage is the alluvial plain, which covers an area of 31,208.3 km2 (Figure 11c). Very-high-coverage vegetation is sparsely distributed and concentrated on the impact plain. Very-low-coverage vegetation accounts for more than half of the three landforms: impact flood plain, denudation platform, and denudation plain.
The extremely high-coverage and high-coverage vegetation in the Tianshan Mountain region have the largest distribution areas on the eroded and denuded mid-mountain landforms, with values of 12,284.1 km2 and 9808.2 km2, respectively (Figure 11d). The flood plains in the central and northern parts of the Tianshan Mountains have an extremely high vegetation coverage. This is due to the large-scale growth of coniferous forests such as grasses, weedy meadows, and spruce. The landform type with the largest area of extremely high-coverage vegetation in the Tarim Basin region is the alluvial plain, which covers an area of 9568.6 km2 (Figure 11e). Vegetation with medium coverage and high coverage is mainly distributed in alluvial plains and alluvial plains. It is less distributed in aeolian hills and flood plains and is almost absent in other landform types. The Kunlun Mountains and the Altun Mountains region have very little vegetation with very high coverage. The landform type with the greatest vegetation coverage is the erosion and denudation alpine landform, covering an area of 2197.9 km2 (Figure 11f). Among them, extremely low- and low-coverage vegetation are concentrated in the erosion and denudation of the extremely high mountain landforms at high altitudes in the west. Typical desert vegetation species, such as coryza, Rhodiola, and weeping chrysanthemum, are the dominant species here. Alpine dwarf semishrub desert vegetation species, such as pigweed, Tibetan chrysanthemum, red sand, Kunlun artemisia, and pink flower artemisia, are distributed in the medium coverage area in the central and eastern parts of the region.

3.3. Key Environmental Drivers of Vegetation Cover

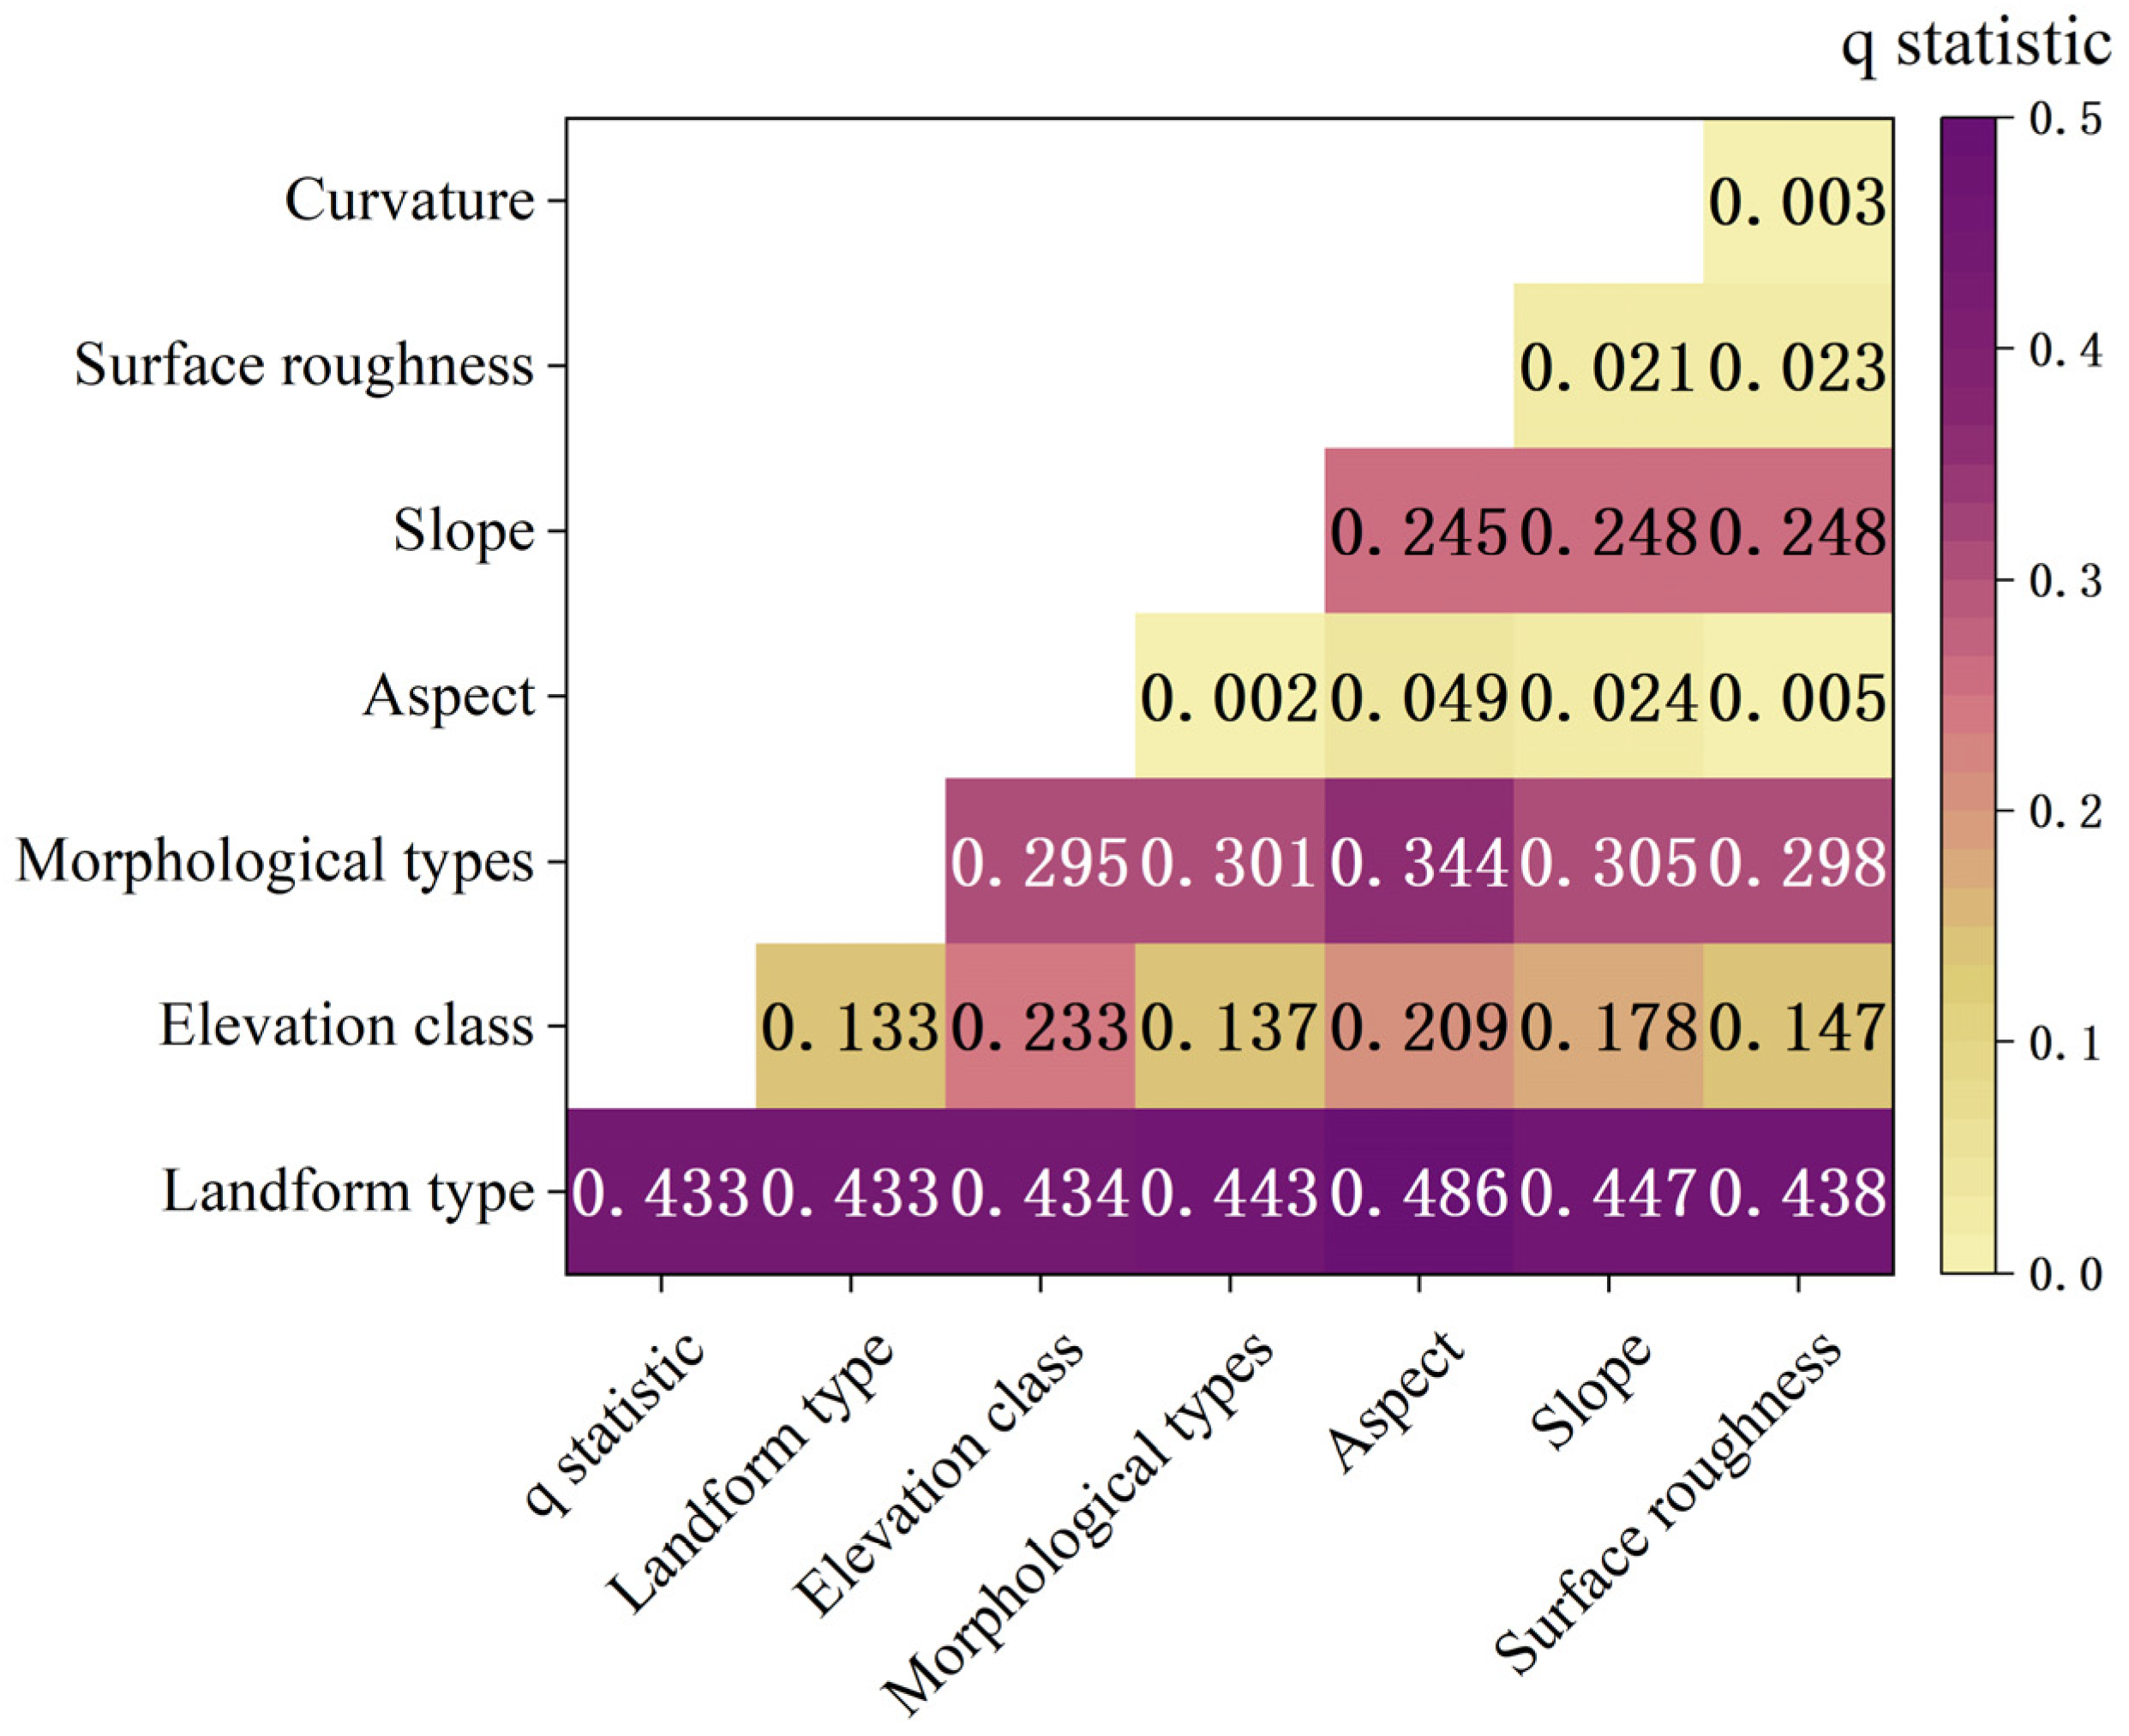
3.3.1. Factor Detection

The factor detection function was used to explore the impact of topographic and geomorphological factors on the vegetation coverage (Table 3). The response degree of each topographic and geomorphological factor to the FVC was as follows: landform type > morphological types > slope > elevation class > surface roughness > curvature > aspect. All p values were 0, indicating that the vegetation coverage responded significantly to each factor.
The maximum q value of the landform type was 0.433, indicating that it was the most important driving force controlling vegetation coverage. Second, morphological types, slope, and elevation class, with q values exceeding 0.1, all had a certain influence on the vegetation coverage. The lower q values of surface roughness, aspect, and curvature had less impact on vegetation coverage. These research results show that the spatial differentiation of landforms plays an important driving role in vegetation coverage.

3.3.2. Interaction Detection

The interaction between any two influencing factors enhances the influence of a single factor on vegetation coverage, showing nonlinear enhancement and double-factor enhancement (Figure 12). In terms of the pairs landform type and aspect, slope and landform type, curvature and landform type, elevation class and morphological types, slope and elevation class, aspect and elevation class, surface roughness and elevation class, curvature and elevation class, slope and morphological types, aspect and morphological types, slope and aspect, surface roughness and aspect, and curvature and aspect, a nonlinear improvement was observed. Furthermore, there was a two-factor enhancement due to the interaction of other environmental factors. The analysis shows that some factors enhanced each other, while other factors showed a nonlinear enhancement, indicating that the impact on vegetation coverage cannot be defined or proven by only a single driver. The interaction result between landform type and slope was 0.486, which was higher than the single factor of landform type, which better illustrates that the double factor of landform type and slope had a stronger control effect on the spatial distribution of vegetation.

3.3.3. Ecological Detection

Ecological detection reflects whether there are significant differences in the impact of each detection factor on vegetation coverage. The results show that in addition to the effects of elevation class and slope and elevation class and surface roughness on the vegetation coverage, there were significant differences in the effects of each factor on the vegetation coverage (Table 4). Overall, there were significant differences among the environmental factors. The impact of landform type on vegetation coverage was significantly different from the impact of other factors. The factor testing showed that landform type was the main driving factor for the spatial differentiation of vegetation coverage, and the ecological testing results further prove that the impact of landform type was stronger than that of other factors.

4. Discussion

4.1. Influence of Detailed Geomorphic Type on Vegetation Distribution in the Hilly Oasis Zone

The hilly oasis zone in Xinjiang’s arid areas has typical research value, whether from a natural or humanistic perspective, and it provides a representative object area for the study of the coupling relationship between landform differentiation and vegetation distribution in arid areas. Throughout domestic and foreign studies, few scholars have explored the coupled effects of detailed geomorphic types on vegetation distribution from the perspective of geomorphic regionalization. Based on the three-level geomorphic regionalization in Xinjiang, the hilly oasis belt was studied in this paper, filling the gap in the related research in this field. In the Altai and North Tower Mountains region, the erosion and denudation of the mesas affect the distribution of the temperate tufted grass steppe, which is concentrated in the central region and accounts for half of the area of the whole region. This is consistent with the results of Niu et al.’s study in Altay [56], where they found that vegetation cover is more obvious in landform areas below a 900 m elevation. The mechanism of vegetation control by geomorphology within the Western Dzungaria Mountains region is reflected in the concentration of cultivated vegetation on impact floodplain and impact plain landscapes. Xie et al. [57] pointed out in their study that the vegetation growth of swamp plain and alluvial fine soil plain landforms is significantly stronger than that of loess hills and eolian dunes. In the Tianshan Mountains region, the vertical zoning of vegetation according to the spatial differentiation of landforms is obvious; from high to low, it is divided into an alpine cushion vegetation zone, alpine meadow zone, subalpine meadow zone, mountain steppe zone, desert steppe zone, and desert zone, which is consistent with the discovery of Shen et al. [58], who believed that the distribution of vegetation and soil has a vertical zoning pattern. Cultivated vegetation and meadows in the Tarim Basin region are largely distributed over the mid-elevation plains and low-elevation plains because humans have settled in the low-elevation oasis zones and cultivated crops suitable for growing there. The temporal and spatial data set of vegetation coverage around the Tarim Basin published by Feng et al. [59] also shows that vegetation coverage is higher in meadowlands and other plains at middle and low elevations. In summary, this paper discussed in detail the response law of vegetation types and vegetation cover distribution patterns in the hilly oasis zone to the detailed geomorphic type, which is of guiding significance to the construction of Xinjiang’s economy and civilization as well as its sustainable development.

4.2. Geodetector Analysis

Identifying the main drivers of the differences in vegetation cover in the context of climate change can serve as a valuable scientific resource for ecological conservation efforts. The Geodetector method plays an important role in determining the complex interactions between multiple environmental factors. Geodetectors can not only determine the effect of a single environmental factor but also identify the effect of multiple factors interacting with each other, which was very suitable for the determination of topographic and geomorphic indicators in this study. We used the Geodetector method to investigate the nonlinear influence link between vegetation cover extracted based on the NDVI and environmental drivers in the hilly oasis zone. It was concluded that landform type was the main factor influencing vegetation cover (q = 0.44). Morphological types were an important factor influencing vegetation cover, with a q-value of 0.295. The landform type and slope interaction had a q-value of 0.486, and its control on vegetation cover was stronger than that of any single factor. However, this is different from the results of previous studies that considered slope and elevation as the main factors influencing vegetation cover. For example, Chen et al. [60], in their study of vegetation cover changes in the Guandu River Basin, concluded that the three topographic factors of elevation, slope, and slope direction had the highest correlation with vegetation cover. Chen et al. [61] suggested that elevation, slope, and curvature have the greatest influence on the spatial and temporal evolution of vegetation cover in southwest China. Huan et al. [62] proposed that the cover of alpine vegetation shows an increasing and then decreasing trend with increasing altitude and slope. The reason for these differences may be that the indicators selected by different studies vary considerably, and this paper considered the influence of detailed landform types more comprehensively than previous scholars who only considered the influence of topographic factors. The hilly oasis zone is located on the second step of China’s terrain, with complex and varied landforms and obvious differences in vegetation characteristics within different landforms. The results of this study include new indicators that can be followed by other researchers to explore the drivers that influence changes in vegetation distribution and vegetation cover.

4.3. Limitations and Future Research Directions

The distribution pattern of vegetation is not only affected by landform but also by climate, environment, soil, hydrothermal conditions, and other factors. Since this paper focused on the impact of spatial differentiation of landform on vegetation, the content of this paper focused on the response of vegetation distribution to detailed landform types. Since the coupling relationship between microgeomorphology and vegetation distribution was not deeply discussed in this study, it is hoped that the relationship between vegetation types and vegetation population distribution and microgeomorphology can be discussed in detail in subsequent studies. In the future, it is necessary to further explore the specific vegetation types controlled by geomorphic types and to quantify and index the control effects of geomorphic features on vegetation. Vegetation distribution and vegetation cover play an important role in the service function and stability of the terrestrial ecosystem, and the common method of regional ecosystem restoration and management projects is to enhance the regulatory function of the ecosystem by planting vegetation and improving the vegetation coverage rate. The distribution of vegetation is restricted by topographic and geomorphic factors and geomorphic differentiation. It is expected that the influence of geomorphic types on the spatial distribution of vegetation can be applied to specific ecological restoration so as to provide guidance for planting vegetation conducive to growth and survival on different geomorphic types and provide reference for macro decision-making.

4.4. Recommendations

According to the research results of this paper, the impact of geomorphic type on vegetation coverage is significantly stronger than that of single factors such as slope and slope direction. Therefore, it is suggested that other scholars should not only use topographic factors such as slope, slope direction, surface roughness, and curvature when exploring the impact of topography on vegetation, but they should also consider more topographic type factors. Under the background of informatization and modernization construction, this study of the effects of detailed geomorphic types on vegetation distribution pattern in arid areas of Xinjiang has a good and broad prospect for the physical geography of developing China, especially for the major cross-research topics of ecological geomorphic research in integrated physical geography. Geomorphology and geomorphic regionalization not only play an important role in land resource utilization and its pattern evolution in Xinjiang, but they also have guiding research value for the relationship between the geomorphic types and vegetation types and spatial structure characteristics in Xinjiang. At the same time, this study also provides a reference for the study of vegetation distribution and geomorphic spatial differentiation in other regions with complex geomorphic types.

5. Conclusions

From the perspective of remote sensing and geomorphic regionalization, the coupling relationship between vegetation distribution and different geomorphic types in the hilly oasis zone of Xinjiang was studied. Then, the effects of individual factors and their interactions on the differences in the distribution of vegetation cover were quantified using the Geodetector method. The results show that: (1) The vegetation distribution patterns of the six major geomorphologic zones in the hilly oasis zone of Xinjiang show a significant correlation with the spatial differentiation of landforms. This study shows that grassland is the main vegetation type in the erosion and denudation of Nakayama; cultivated vegetation and meadows have a larger coverage in the alluvial flood plain and alluvial plain; the distribution of vegetation in the Tianshan economic zone is characterized by obvious vertical zoning with the geomorphology; and desert vegetation is mainly distributed on the topography of eroded hills and denudated plains. (2) The Altai and North Tower Mountains region has a relatively large proportion of very high coverage on the erosion and denudation of mesas, covering an area of up to 2175.8 km2; the landform with the largest area with a very high coverage distribution in the Western Dzungaria Mountains region is the impact floodplain, which covers an area of 1915.6 km2; and the landform type with the largest area of very high vegetation coverage in the Tarim Basin region is the alluvial plain, which occupies an area of 9568.6 km2. (3) Landform type, with an explanatory power of 0.242, is the main factor controlling vegetation coverage, and its effect is stronger than other single factors. (4) The results of the interaction test showed that the relationship between the two environmental factors was mainly enhanced by two factors, with the most significant interaction being between landform type and slope. These findings help us to better understand the control mechanisms and their impacts that lead to differences in the distribution of vegetation and vegetation cover and can provide academic references and suggestions for vegetation conservation planning and the sustainable development of ecosystems in Xinjiang.

Author Contributions

Conceptualization, H.X.; methodology, H.X.; software, H.X.; validation, K.S. and W.C.; formal analysis, H.X, W.C. and Y.Z; investigation, B.W.; resources, Y.Z.; data curation, H.X.; writing—original draft preparation, H.X. and WC; writing—review and editing, H.X. and B.W.; visualization, R.W. and A.B.; supervision, Y.Z. and A.B; project administration, K.S., B.W. and A.B.; funding acquisition, W.C. All authors have read and agreed to the published version of the manuscript.

Funding

This research was funded by the Third Xinjiang Comprehensive Scientific Investigation Project “Scientific Research Data Platform and Standard System Construction” (2021xjkk1301) and the National Natural Science Foundation of China (Key Program) (42130110).

Data Availability Statement

Data are contained within the article.

Acknowledgments

The authors would like to thank the editors and reviewers for their constructive comments and suggestions.

Conflicts of Interest

The authors declare no conflicts of interest.

References

  1. Arruda, D.M.; Schaefer, C.E.; Corrêa, G.R.; Rodrigues, P.M.; Duque-Brasil, R.; Ferreira-JR, W.G.; Oliveira-Filho, A.T. Landforms and soil attributes determine the vegetation structure in the Brazilian semiarid. Folia Geobot. 2015, 50, 175–184. [Google Scholar] [CrossRef]
  2. Baartman, J.E.; Temme, A.J.; Saco, P.M. The effect of landform variation on vegetation patterning and related sediment dynamics. Earth Surf. Process. Landf. 2018, 43, 2121–2135. [Google Scholar] [CrossRef]
  3. Valentini, E.; Taramelli, A.; Cappucci, S.; Filipponi, F.; Nguyen Xuan, A. Exploring the dunes: The correlations between vegetation cover pattern and morphology for sediment retention assessment using airborne multisensor acquisition. Remote Sens. 2020, 12, 1229. [Google Scholar] [CrossRef]
  4. Mokarram, M.; Sathyamoorthy, D. Relationship between landform classification and vegetation (case study: Southwest of Fars province, Iran). Open Geosci. 2016, 8, 302–309. [Google Scholar] [CrossRef]
  5. Smith, M.; Pain, C. Applications of remote sensing in geomorphology. Prog. Phys. Geogr. 2009, 33, 568–582. [Google Scholar] [CrossRef]
  6. Walsh, S.J.; Butler, D.R.; Malanson, G.P. An overview of scale, pattern, process relationships in geomorphology: A remote sensing and GIS perspective. Geomorphology 1998, 21, 183–205. [Google Scholar] [CrossRef]
  7. Fan, J.; Xu, Y.; Ge, H.; Yang, W. Vegetation growth variation in relation to topography in Horqin Sandy Land. Ecol. Indic. 2020, 113, 106215. [Google Scholar] [CrossRef]
  8. Gao, S.; Dong, G.; Jiang, X.; Nie, T.; Yin, H.; Guo, X. Quantification of natural and anthropogenic driving forces of vegetation changes in the Three-River Headwater Region during 1982–2015 based on geographical detector model. Remote Sens. 2021, 13, 4175. [Google Scholar] [CrossRef]
  9. Li, X.; Guo, D. A GIS-based research on vegetation landscape pattern. In Proceedings of the Geoinformatics 2007: Geospatial Information Science, Nanjing, China, 25–27 May 2007; pp. 497–509. [Google Scholar]
  10. Shaheen, H.; Qureshi, R.A. Vegetation types of sheosar lake and surrounding landscape in deosai plains of North Pakistan, Western Himalayas. J. Med. Plants Res. 2011, 5, 599–603. [Google Scholar]
  11. Li, X.; Chang, S.X.; Liu, J.; Zheng, Z.; Wang, X. Topography-soil relationships in a hilly evergreen broadleaf forest in subtropical China. J. Soils Sediments 2017, 17, 1101–1115. [Google Scholar] [CrossRef]
  12. Ma, S.; Qiao, Y.-P.; Wang, L.-J.; Zhang, J.-C. Terrain gradient variations in ecosystem services of different vegetation types in mountainous regions: Vegetation resource conservation and sustainable development. For. Ecol. Manag. 2021, 482, 118856. [Google Scholar] [CrossRef]
  13. Sun, W.; Song, X.; Mu, X.; Gao, P.; Wang, F.; Zhao, G. Spatiotemporal vegetation cover variations associated with climate change and ecological restoration in the Loess Plateau. Agric. For. Meteorol. 2015, 209, 87–99. [Google Scholar] [CrossRef]
  14. Zhou, Y.; Fu, D.; Lu, C.; Xu, X.; Tang, Q. Positive effects of ecological restoration policies on the vegetation dynamics in a typical ecologically vulnerable area of China. Ecol. Eng. 2021, 159, 106087. [Google Scholar] [CrossRef]
  15. Qiu, D.; Yan, J.; Ma, X.; Gao, F.; Wang, F.; Wen, L.; Bai, J.; Cui, B. How vegetation influence the macrobenthos distribution in different saltmarsh zones along coastal topographic gradients. Mar. Environ. Res. 2019, 151, 104767. [Google Scholar] [CrossRef]
  16. Zhang, H.; Zha, T.; Yu, Y.; Zhang, Z.; Zhang, X.; Zhang, H.; Ji, X. Functional vegetation community responses to soil and topographic factors in the Loess Plateau of China. Land Degrad. Dev. 2023, 34, 5355–5372. [Google Scholar] [CrossRef]
  17. Hesse, R. Spatial distribution of and topographic controls on Tillandsia fog vegetation in coastal southern Peru: Remote sensing and modelling. J. Arid Environ. 2012, 78, 33–40. [Google Scholar] [CrossRef]
  18. Sun, A.; Guo, Z.; Wu, H.; Li, Q.; Yu, Y.; Luo, Y.; Jiang, W.; Li, X. Reconstruction of the vegetation distribution of different topographic units of the Chinese Loess Plateau during the Holocene. Quat. Sci. Rev. 2017, 173, 236–247. [Google Scholar] [CrossRef]
  19. Liu, Y.; Huang, H.; Meng, L.; Liu, M.; Wu, Z.; Liu, T.; Labat, D. Spatial-temporal evolution of vegetation coverage and its relationship with terrain and human factors in the upper reaches of Ganjiang River Basin, China. Front. Earth Sci. 2023, 10, 1043403. [Google Scholar] [CrossRef]
  20. Xiong, Y.; Li, Y.; Xiong, S.; Wu, G.; Deng, O. Multi-scale spatial correlation between vegetation index and terrain attributes in a small watershed of the upper Minjiang River. Ecol. Indic. 2021, 126, 107610. [Google Scholar] [CrossRef]
  21. Gao, F.; Li, S.; Tan, Z.; Wu, Z.; Zhang, X.; Huang, G.; Huang, Z. Understanding the modifiable areal unit problem in dockless bike sharing usage and exploring the interactive effects of built environment factors. Int. J. Geogr. Inf. Sci. 2021, 35, 1905–1925. [Google Scholar] [CrossRef]
  22. Ju, H.; Zhang, Z.; Zuo, L.; Wang, J.; Zhang, S.; Wang, X. Driving forces and their interactions of built-up land expansion based on the geographical detector—A case study of Beijing, China. Int. J. Geogr. Inf. Sci. 2016, 30, 2188–2207. [Google Scholar] [CrossRef]
  23. Song, Y.; Wang, J.; Ge, Y.; Xu, C. An optimal parameters-based geographical detector model enhances geographic characteristics of explanatory variables for spatial heterogeneity analysis: Cases with different types of spatial data. GISci. Remote Sens. 2020, 57, 593–610. [Google Scholar] [CrossRef]
  24. Zhang, H.; Qian, Y.; Wu, Z.; Wang, Z. Vegetation-environment relationships between northern slope of Karlik Mountain and Naomaohu Basin, East Tianshan Mountains. Chin. Geogr. Sci. 2012, 22, 288–301. [Google Scholar] [CrossRef]
  25. Luo, G.; Feng, Y.; Zhang, B.; Cheng, W. Sustainable land-use patterns for arid lands: A case study in the northern slope areas of the Tianshan Mountains. J. Geogr. Sci. 2010, 20, 510–524. [Google Scholar] [CrossRef]
  26. Aili, A.; Xu, H.; Zhao, X.; Zhang, P.; Yang, R. Dynamics of vegetation productivity in relation to surface meteorological factors in the Altay Mountains in Northwest China. Forests 2022, 13, 1907. [Google Scholar] [CrossRef]
  27. Zhang, G.; Yan, J.; Zhu, X.; Ling, H.; Xu, H. Spatio-temporal variation in grassland degradation and its main drivers, based on biomass: Case study in the Altay Prefecture, China. Glob. Ecol. Conserv. 2019, 20, e00723. [Google Scholar] [CrossRef]
  28. Chai, H.; Ou, Y.; Chen, X.; Cheng, W.; Zhou, C. A new schem a of Xinjiang geomorhpologic regionalization. Arid. Land Geogr. 2009, 32, 95–106. [Google Scholar]
  29. Chai, H.; Zhou, C.; Chen, X.; Cheng, W. Digital regionalization of geomorphology in Xinjiang. J. Geogr. Sci. 2009, 19, 600–614. [Google Scholar] [CrossRef]
  30. Yang, Y.; Chen, Y.; Li, W.; Wang, M.; Sun, G. Impacts of climatic change on river runoff in northern Xinjiang of China over last fifty years. Chin. Geogr. Sci. 2010, 20, 193–201. [Google Scholar] [CrossRef]
  31. Yao, J.; Mao, W.; Chen, J.; Dilinuer, T. Recent signal and impact of wet-to-dry climatic shift in Xinjiang, China. J. Geogr. Sci. 2021, 31, 1283–1298. [Google Scholar] [CrossRef]
  32. Shi, Q.; Lu, G.; Pan, X.; Anabiek, S.; Zhou, C.; Chang, S. Remote sensing classification method for divided areas applied to Xinjiang vegetation classification. In Proceedings of the Ecosystems Dynamics, Ecosystem-Society Interactions, and Remote Sensing Applications for Semi-Arid and Arid Land, Hangzhou, China, 23–27 October 2003; pp. 254–261. [Google Scholar]
  33. Zhang, R.; Guo, J.; Liang, T.; Feng, Q. Grassland vegetation phenological variations and responses to climate change in the Xinjiang region, China. Quat. Int. 2019, 513, 56–65. [Google Scholar] [CrossRef]
  34. Ma, S. Big Earths of China: Remotely Sensing Xinjiang along the Belt and Road. Crit. Inq. 2022, 49, 77–101. [Google Scholar] [CrossRef]
  35. Liang, Y.; Li, G. Retracted: The Silk Road Economic Belt-Urumqi Construction for Regional Financial Center Analysis. In Proceedings of the 2017 International Conference on Smart City and Systems Engineering (ICSCSE), Changsha, China, 11–12 November 2017; pp. 100–103. [Google Scholar]
  36. XiaoMing, C.; Xi, C.; AnMing, B.; Quan, W. Response of vegetation to temperature and precipitation in Xinjiang during the period of 1998–2009. J. Arid Land 2011, 3, 94–103. [Google Scholar]
  37. Yao, J.; Hu, W.; Chen, Y.; Huo, W.; Zhao, Y.; Mao, W.; Yang, Q. Hydro-climatic changes and their impacts on vegetation in Xinjiang, Central Asia. Sci. Total Environ. 2019, 660, 724–732. [Google Scholar] [CrossRef] [PubMed]
  38. He, M.; Ju, W.; Zhou, Y.; Chen, J.; He, H.; Wang, S.; Wang, H.; Guan, D.; Yan, J.; Li, Y. Development of a two-leaf light use efficiency model for improving the calculation of terrestrial gross primary productivity. Agric. For. Meteorol. 2013, 173, 28–39. [Google Scholar] [CrossRef]
  39. Li, B.; Pan, B.; Cheng, W.; Han, J.; Qi, D.; Zhu, C. Research on geomorphological regionalization of China. Acta Geogr. Sin. 2013, 68, 291–306. [Google Scholar]
  40. Cheng, W.; Zhou, C.; Chai, H.; Zhao, S.; Li, B. Ouantitative Extraction and Analysis of Basic Morphological Types of Land Geomorphology in China. J. Geo-Inf. Sci. 2009, 11, 725–736. [Google Scholar]
  41. Cheng, W.; Liu, Q.; Zhao, S.; Gao, X.; Wang, N. Research and perspectives on geomorphology in China: Four decades in retrospect. J. Geogr. Sci. 2017, 27, 1283–1310. [Google Scholar] [CrossRef]
  42. Cheng, W.; Chai, H.; Zhou, C.; Chen, X. The spatial distribution patterns of digital geomorphlolgy inXinjiang. Geogr. Res. 2009, 28, 1157–1169. [Google Scholar]
  43. Bai, H.; Li, L.; Wu, Y.; Feng, G.; Gong, Z.; Sun, G. Identifying Critical Meteorological elements for vegetation coverage change in China. Front. Phys. 2022, 10, 834094. [Google Scholar] [CrossRef]
  44. Feng, L.; Jia, Z.; Li, Q.; Zhao, A.; Zhao, Y.; Zhang, Z. Spatiotemporal change of sparse vegetation coverage in northern China. J. Indian Soc. Remote Sens. 2019, 47, 359–366. [Google Scholar] [CrossRef]
  45. Yu, Z.Z.; Zhu, J.G.; Qian, Y.L. Analysis on terrain effects to vegetation coverage by quantitative remote sensing. Adv. Mater. Res. 2012, 518, 5673–5677. [Google Scholar] [CrossRef]
  46. Zhou, L.; Lyu, A. Investigating natural drivers of vegetation coverage variation using MODIS imagery in Qinghai, China. J. Arid Land 2016, 8, 109–124. [Google Scholar] [CrossRef]
  47. Wang, J.; Xu, C. Geodetector: Principle and prospective. Acta Geogr. Sin. 2017, 72, 116–134. [Google Scholar]
  48. Wang, J.-F.; Zhang, T.-L.; Fu, B.-J. A measure of spatial stratified heterogeneity. Ecol. Indic. 2016, 67, 250–256. [Google Scholar] [CrossRef]
  49. Shen, J.; Zhang, N.; He, B.; Liu, C.-Y.; Li, Y.; Zhang, H.-Y.; Chen, X.-Y.; Lin, H. Construction of a GeogDetector-based model system to indicate the potential occurrence of grasshoppers in Inner Mongolia steppe habitats. Bull. Entomol. Res. 2015, 105, 335–346. [Google Scholar] [CrossRef] [PubMed]
  50. Wang, J.F.; Li, X.H.; Christakos, G.; Liao, Y.L.; Zhang, T.; Gu, X.; Zheng, X.Y. Geographical detectors-based health risk assessment and its application in the neural tube defects study of the Heshun Region, China. Int. J. Geogr. Inf. Sci. 2010, 24, 107–127. [Google Scholar] [CrossRef]
  51. Zhou, X.; Wen, H.; Zhang, Y.; Xu, J.; Zhang, W. Landslide susceptibility mapping using hybrid random forest with GeoDetector and RFE for factor optimization. Geosci. Front. 2021, 12, 101211. [Google Scholar] [CrossRef]
  52. Chen, W.; Yang, L.; Wu, J.; Wu, J.; Wang, G.; Bian, J.; Zeng, J.; Liu, Z. Spatio-temporal characteristics and influencing factors of traditional villages in the Yangtze River Basin: A Geodetector model. Herit. Sci. 2023, 11, 111. [Google Scholar] [CrossRef]
  53. del Valle Villalonga, L.; Timar-Gabor, A.; Fornós, J.J. Geomorphological Processes and Environmental Interpretation at Espalmador islet (Western Mediterranean). J. Mar. Sci. Eng. 2019, 7, 144. [Google Scholar] [CrossRef]
  54. Liucci, L.; Melelli, L. The fractal properties of topography as controlled by the interactions of tectonic, lithological, and geomorphological processes. Earth Surf. Process. Landf. 2017, 42, 2585–2598. [Google Scholar] [CrossRef]
  55. Kemppinen, J.; Niittynen, P.; Happonen, K.; le Roux, P.C.; Aalto, J.; Hjort, J.; Maliniemi, T.; Karjalainen, O.; Rautakoski, H.; Luoto, M. Geomorphological processes shape plant community traits in the Arctic. Glob. Ecol. Biogeogr. 2022, 31, 1381–1398. [Google Scholar] [CrossRef]
  56. Niu, Q.; Liu, M.; Zhang, M.; Cheng, W. Vegetation Dynamic Change and lts Response to Climate and Topography in Altay Region of Xinjiang in Recent 20 Years. Geomat. Inf. Sci. Wuhan Univ. 2023, 48, 1522–1530. [Google Scholar] [CrossRef]
  57. Xie, H.; Xie, H.; Liu, H.; Wen, G.; Li, Y. Relations of Vegetation with Topography and Groundwater in Yili River Valley of Xinjiang. J. Yangtze River Sci. Res. Inst. 2018, 35, 54–57. [Google Scholar]
  58. Shen, Y.; Wang, Y.; Wei, X.; Ni, P.; Dong, J. Preliminary investigalion on weathering proess and vertical zoning characleristics of clinosol in TiansnanMounains. J. Eng. Geol. 2023, 32, 1235–1246. [Google Scholar]
  59. Feng, Y.; Qiao, H.; Feng, S.; Xi, L.; Qi, Z.; Lan, L. A dataset of temporal-spatial FVC in the Ring Tarim Basin from 1990 to 2021. China Sci. Data 2023, 8, 312–319. [Google Scholar] [CrossRef]
  60. Chen, H.; Ouyang, W.; Lyu, F.; Song, Y.; Hao, R. Variation of Vegetation Cover and Its Correlation of Topographic Factors in Guandu River Basin. Res. Soil Water Conserv. 2019, 26, 135–140, 147. [Google Scholar]
  61. Chen, X.-M.; Pan, Y.-C.; Xu, Y.; Cuo, Z.-D.; Zheng, Z.-W.; Dai, O.-Y. Spatio-temporal variation of fractional vegetation cover and its relationshipwith climate and topographic factors in southwest China. Southwest China J. Agric. Sci. 2023, 36, 1307–1317. [Google Scholar]
  62. Huang, H.; Xi, G.; Ji, F.; Liu, Y.; Wang, H.; Xie, Y. Spatial and Temporal Variation in Vegetation Cover and Its Response to Topography in the Selinco Region of the Qinghai-Tibet Plateau. Remote Sens. 2023, 15, 4101. [Google Scholar] [CrossRef]
Figure 1. Distribution of the hilly oasis zone and geomorphic regionalization map.
Remotesensing 16 01062 g001
Figure 2. Illustration of the bottom-up method of dividing landform areas based on landform type data. (a) Landform type data (vector format); (b) vector data were converted to grid data, and corresponding attributes were assigned to each raster; (c) cluster analysis was performed on landform types based on geographical grid and landform zoning principles, and three geomorphic divisions were obtained (with solid lines as boundaries); (d) the grid boundary lines were not rounded and differed from the actual geomorphic boundaries, and then the actual geomorphic division boundaries (plains, hills, mountains) were obtained by correcting them based on the geomorphic boundaries.
Remotesensing 16 01062 g002
Figure 3. Distribution of the hilly oasis zone and geomorphologic zoning map.
Remotesensing 16 01062 g003
Figure 4. (a) Geomorphologic map of the Altai and North Tower Mountains region; (b) vegetation map of the Altai and North Tower Mountains region.
Remotesensing 16 01062 g004
Figure 5. (a) Geomorphologic map of the Western Dzungaria Mountains region; (b) vegetation map of the Western Dzungaria Mountains region.
Remotesensing 16 01062 g005
Figure 6. (a) Geomorphologic map of the Junggar Basin region; (b) vegetation map of the Junggar Basin region.
Remotesensing 16 01062 g006
Figure 7. (a) Geomorphologic map of the Tianshan Mountain region; (b) vegetation map of the Tianshan Mountain region.
Remotesensing 16 01062 g007
Figure 8. (a) Geomorphologic map of the Tarim Basin region; (b) vegetation map of the Tarim Basin region.
Remotesensing 16 01062 g008
Figure 9. (a) Geomorphologic map of the Kunlun Mountains and the Altun Mountains region; (b) vegetation map of the Kunlun Mountains and the Altun Mountains region.
Remotesensing 16 01062 g009
Figure 10. Vegetation cover of six landform zones in the hilly oasis zone of Xinjiang.
Remotesensing 16 01062 g010
Figure 11. Area of landform type occupied by each vegetation cover within the six landform zones of the hilly oasis zone.
Remotesensing 16 01062 g011aRemotesensing 16 01062 g011b
Figure 12. Detection of interaction factors.
Remotesensing 16 01062 g012
Table 1. Geographical detection factor classification table.
FactorsTopographic and Geomorphologic FactorsDetecting the Impact FactorClassification
Geomorphic factorsLandform typeX154
Elevation classX24
Morphological typesX37
Terrain factorsAspectX49
SlopeX59
Surface roughnessX66
CurvatureX76
Table 2. Types of interaction between two covariates.
Types of InteractionsInteraction Types
Nonlinear weakened q X 1 X 2 < M i n q X 1 , q X 2
Univariate weakened M i n q X 1 , q X 2 < q X 1 X 2 < M a x q X 1 + q X 2
Bivariate enhanced q X 1 X 2 < M ax q X 1 , q X 2
Independent q X 1 X 2 < q X 1 + q X 2
Nonlinear enhanced q X 1 X 2 > q X 1 + q X 2
Table 3. Detection of topography and geomorphology factors influencing vegetation coverage.
FactorsLandform TypeElevation ClassMorphological TypesAspectSlopeSurface RoughnessCurvature
q statistic0.4330.1330.2950.0020.2450.0210.003
p value0.0000.0000.0000.0000.0000.0000.000
Table 4. Ecological detection results.
FactorsLandform TypeElevation ClassMorphological TypesAspectSlopeSurface RoughnessCurvature
Landform type
Elevation classY
Morphological typesYY
AspectYYY
SlopeYNYY
Surface roughnessYNYYY
CurvatureYYYNYY
Disclaimer/Publisher’s Note: The statements, opinions and data contained in all publications are solely those of the individual author(s) and contributor(s) and not of MDPI and/or the editor(s). MDPI and/or the editor(s) disclaim responsibility for any injury to people or property resulting from any ideas, methods, instructions or products referred to in the content.

