Article

Contrasting Changes of Debris-Free Glacier and Debris-Covered Glacier in Southeastern Tibetan Plateau

1
College of Earth and Environmental Sciences, Lanzhou University, Lanzhou 730000, China
2
State Key Laboratory of Tibetan Plateau Earth System, Environment and Resources (TPESER), Institute of Tibetan Plateau Research, Chinese Academy of Sciences, Beijing 100101, China
3
State Key Laboratory of Water Resources Engineering and Management, Wuhan University, Wuhan 430072, China
4
School of Geospatial Engineering and Science, Sun Yat-sen University, Zhuhai 519000, China
*
Author to whom correspondence should be addressed.
Remote Sens. 2024, 16(5), 918; https://doi.org/10.3390/rs16050918
Submission received: 9 February 2024 / Revised: 2 March 2024 / Accepted: 3 March 2024 / Published: 5 March 2024
(This article belongs to the Special Issue Remote Sensing of Cryosphere and Related Processes)

Abstract

:
Debris-free and debris-covered glaciers are both extensively present in the southeastern Tibetan Plateau. High-precision and rigorous comparative observational studies on different types of glaciers help us to accurately understand the overall state of water resource variability and the underlying mechanisms. In this study, we used multi-temporal simultaneous UAV surveys to systematically explore the surface elevation change, surface velocity, and surface mass balance of two representative glaciers. Our findings indicate that the thinning rate in the debris-free Parlung No. 4 glacier UAV survey area was consistently higher than that in the debris-covered 24K glacier in 2020–2021 (−1.16 ± 0.03 cm/d vs. −0.36 ± 0.02 cm/d) and 2021–2022 (−0.69 ± 0.03 cm/d vs. −0.26 ± 0.03 cm/d). Moreover, the surface velocity of the Parlung No. 4 glacier was also consistently higher than that of the 24K glacier across the survey period, suggesting a more dynamic glacial state. The surface mass balance of the Parlung No. 4 glacier (2020–2021: −1.82 ± 0.09 cm/d; 2021–2022: −1.30 ± 0.09 cm/d) likewise outpaced that of the 24K glacier (2020–2021: −0.81 ± 0.07 cm/d; 2021–2022: −0.70 ± 0.07 cm/d) throughout the observation period, which indicates that the debris cover slowed the glacier’s melting. Additionally, we extracted the melt contribution of the ice cliff area in the 24K glacier and found that the melt ratio of this ‘hotspot’ area ranged from 10.4% to 11.6% from 2020 to 2022. This comparative analysis of two representative glaciers provides evidence to support the critical role of debris cover in controlling surface elevation changes, glacier dynamics, and surface mass balance.

1. Introduction

Since the start of the 21st century, maritime glaciers within the southeastern (SE) Tibetan Plateau have exhibited higher rates of mass loss compared to other regions across High-Mountain Asia [1,2,3,4,5]. The predominant glacier types in this region include both debris-free and debris-covered glaciers. Notably, the estimated proportion of the debris-covered area in the SE Tibetan Plateau is close to 20% of the total glacierized area, which exceeds the global average value (~4.4–7.3%) [6,7]. Therefore, a better understanding of the characteristics of different glaciers and the changes they experience is essential to comprehensively evaluate the situation regarding water resource availability in this region [8,9].
Several studies were conducted in alpine regions, with observational and modeling approaches being adopted for the study of glaciers (with or without debris cover). Some found that the presence of debris influences the responses of glaciers to global warming. When the debris thickness exceeds a few centimeters, it plays a protective role in mitigating glacier ablation [10,11,12,13,14,15]. Therefore, the ablation rates of most debris-covered glaciers (mean global debris thickness > 10 cm) [16] are supposed to be weaker than those of debris-free glaciers. Nevertheless, numerous remote sensing studies utilizing satellite imagery revealed comparable rates of thinning for both debris-free and debris-covered glaciers (i.e., “debris coverage anomaly”) [1,17,18,19,20]. Similarly, this anomaly was verified in the SE Tibetan Plateau, where the debris-covered glaciers are widely developed [21,22]. However, almost all of the above conclusions are based on satellite remote sensing data, which may be lacking in resolution. Moreover, some researchers highlighted the significant impact of ‘hotspot areas’ (such as ice cliffs and supraglacial ponds) on the mass loss of debris-covered glaciers. Due to the relatively small size of these “hotspots” areas, high-resolution data are required for accurate assessments of the contribution of ablation [23,24,25,26,27,28,29,30,31].
Since Unpiloted Aerial Vehicles (UAVs) overcome the disadvantages of the poor spatial representativeness of in situ observations and insufficient precision from satellite remote sensing data, the use of UAVs has gradually become one of the main techniques for monitoring glacier changes [24,32,33,34,35,36,37]. High-resolution digital elevation models (DEMs) and orthomosaics can be readily acquired from UAV imagery through the application of structure-from-motion (UAV-SfM) combined with multi-view stereo photogrammetry [38,39]. In the SE Tibetan Plateau, some researchers also carried out monitoring experiments on debris-covered glaciers and debris-free glaciers with high-resolution photogrammetric measurements [40,41,42,43,44,45,46]. However, there are no synchronized monitoring results based on UAV surveys for debris-covered glacier and debris-free glacier changes in the SE Tibetan Plateau. Comparative studies that accurately estimate the surface mass balance changes in two types of glaciers (debris-covered vs. debris-free) by using synchronized and high-precision UAV data are also relatively rare in the glaciology community.
In this study, we simultaneously compared the glacier changes between the debris-free Parlung No. 4 glacier (abbreviated as Parlung No. 4) and the debris-covered 24K glacier (abbreviated as 24K) in the SE Tibetan Plateau from 20 August 2020 to 22 June 2022. The objective of this study was to accurately estimate and compare the variability in mass loss and dynamic states of two typical glaciers to deepen our understanding of the response of maritime glaciers in the SE Tibetan Plateau to global warming.

2. Study Area

Parlung No. 4 and 24K are located in the SE Tibetan Plateau (Figure 1a); the distance between the two glaciers is only ~120–130 km. They are primarily influenced by the moisture from the Bay of Bengal Vortex (during spring) and the Indian Summer Monsoon (during summer) [47,48,49]. The monthly distribution of precipitation displays a double-peak pattern, with two distinct peaks occurring in the spring and summer [48]. Specifically, Parlung No. 4 (29°13.57′N, 96°55.19′E) is located at the source of the Parlung Zangbo River on the southeastern side of Mount Gangrigabu (Figure 1c). This glacier has a length of ~8 km and an area of ~11 km2, typical for a debris-free glacier in the SE Tibetan Plateau. The Parlung No. 4 catchment area is ~25 km2 (Figure 1c), and the glacier area accounts for 44% of the total area (Figure 1c). Moreover, 24K (29°45.59′N, 95°43.11′E) is also located on the northern slope of Mount Gangrigabu (Figure 1b). It is ~24 km away from Bomi City [15] and has a length of ~3 km (area: ~3 km2). The debris-covered area accounts for 41% of the 24K area, and the spatial distribution of its thickness shows a decreasing trend (Figure A1) [46], which is typical of a debris-covered glacier in the SE Tibetan Plateau. The 24K catchment area is 14 km2 (Figure 1b), and the glacier area is 21% of the total area (Figure 1e). Despite being in close proximity to each other, there is a striking difference in the climatic characteristics of the two glaciers. During the 2016 ablation period, the average temperature of 24K was 5.4 °C higher than that of Parlung No. 4, and the total precipitation of 24K was approximately nine times higher than that of Parlung No. 4 (1696.8 vs. 189.6 mm) [15].

3. Data and Methods

3.1. UAV Flights and Data Processing

High-resolution images of the survey areas were obtained by using unpiloted aerial vehicles (UAVs) during six field studies conducted from 20 August 2020 to 22 June 2022. The specific dates and details of these studies are provided in Table 1. To capture the annual glacier surface elevation change and surface displacement, we utilized the eBee Plus UAV equipped with the GNSS Post-Processed Kinematic (PPK) functionality in all of the surveys.
This UAV is a fixed-wing aircraft equipped with a 20MP camera called the SenseFly S.O.D.A. For flight planning purposes, the eMotion3® flight management software (version 3.5.0) was employed. During the survey period, the longitudinal and lateral image overlaps for the eBee Plus were set at 65% and 80%, respectively. By maintaining a consistent survey height above the glacier surface, the flight lines of both UAVs ensured a uniform ground resolution for each survey. To enhance the accuracy of the UAV-based structure-from-motion (SfM) reconstruction, a stationary base station was used. The GNSS data collected from the base station were then appended to the Exchangeable Image File Format metadata of each geotagged image [41]. This data integration process was a part of the PPK correction workflow, which was followed in an attempt to improve the precision of the UAV-SfM reconstruction. The geotagged images obtained from the UAV surveys were further utilized in the creation of orthomosaics and digital elevation models (DEMs) using the SfM-based photogrammetric software Pix4Dmapper (version 4.3.31). The accuracy of all UAV-SfM outputs was indirectly assessed by comparing the horizontal and vertical errors in the UAV-SfM outputs (2020 vs. 2021; 2021 vs. 2022). The horizontal errors were estimated by measuring the displacement of benchmarks (>30 boulders on stable non-glacier areas), while the vertical errors were calculated by counting the surface elevation change value of stable terrain, as outlined in Figure 1b,c.

3.2. Surface Elevation Change and Surface Velocity

After employing the PPK technologies, the acquired DEMs’ offsets were found to be minor [41], negating the need for the co-registration of DEMs when calculating glacier surface elevation change. For each period, we derived surface elevation change results via DEM differential analysis in ArcGIS 10.4. The horizontal displacement of each glacier was obtained by using 20 cm resolution DEM hillshades using ImGRAFT (a normalized cross-correlation algorithm) [50] within a search window of 10 × 10 pixels (2 × 2 m).

3.3. Surface Mass Balance of Glacier Ablation Area

The thinning/surface elevation change ( d h , in m) of the calculated area is equivalent to the ablation/surface mass balance ( b ˙ , in m) plus the emergence velocity ( ω , in m):
d h = b ˙ + ω
ω = Q S
Q = μ · H · D · L
where S (in m2) is the calculation zone area, and Q (in m3) is the ice flow through a given profile of the glacier. μ is the coefficient for the conversion of surface velocities to depth-averaged velocities. Following Miles et al. [25] and Zhao et al. [46], this coefficient was estimated to be 0.9; H (in m) is the thickness of the ice for the corresponding profile, D (in m) is the component of the normal surface displacement to the cross-section, and L (in m) is the breadth of the profile.
To evaluate the uncertainty of the surface mass balance ( σ b ˙ ) for the calculation area, the following equation was used:
σ b ˙ = σ d h 2 + σ ω 2
The uncertainties of d h   ( a n d   f o r   D ) were estimated by calculating the mean difference in surface elevation and the mean displacement from the non-glacial experimental areas. By averaging the values over all periods, they were determined to be 0.09 m ( σ d h ) and 0.09 m ( σ D ), respectively.
The uncertainty of the emergency velocity ( σ ω ) was given by the following:
σ ω ω = σ Q Q 2 + σ S S 2
where the uncertainty of the area of the zone ( S ) was calculated to be ±20 m from the outlines using the ‘buffer method’ [25,51]; the uncertainty of the ice flow through a glacier profile ( σ Q ) was calculated as follows:
σ q q = σ D D 2 + σ μ μ 2 + σ H H 2
where the uncertainty of the ratio μ (column-averaged velocity/surface velocity) is estimated to be 0.1 [25,52]. The uncertainty in H was ~37 m (26%) for Parlung No. 4 [53] and was assumed to be equal to 12 m for the corrected uncertainty in ice thickness for 24K [46].

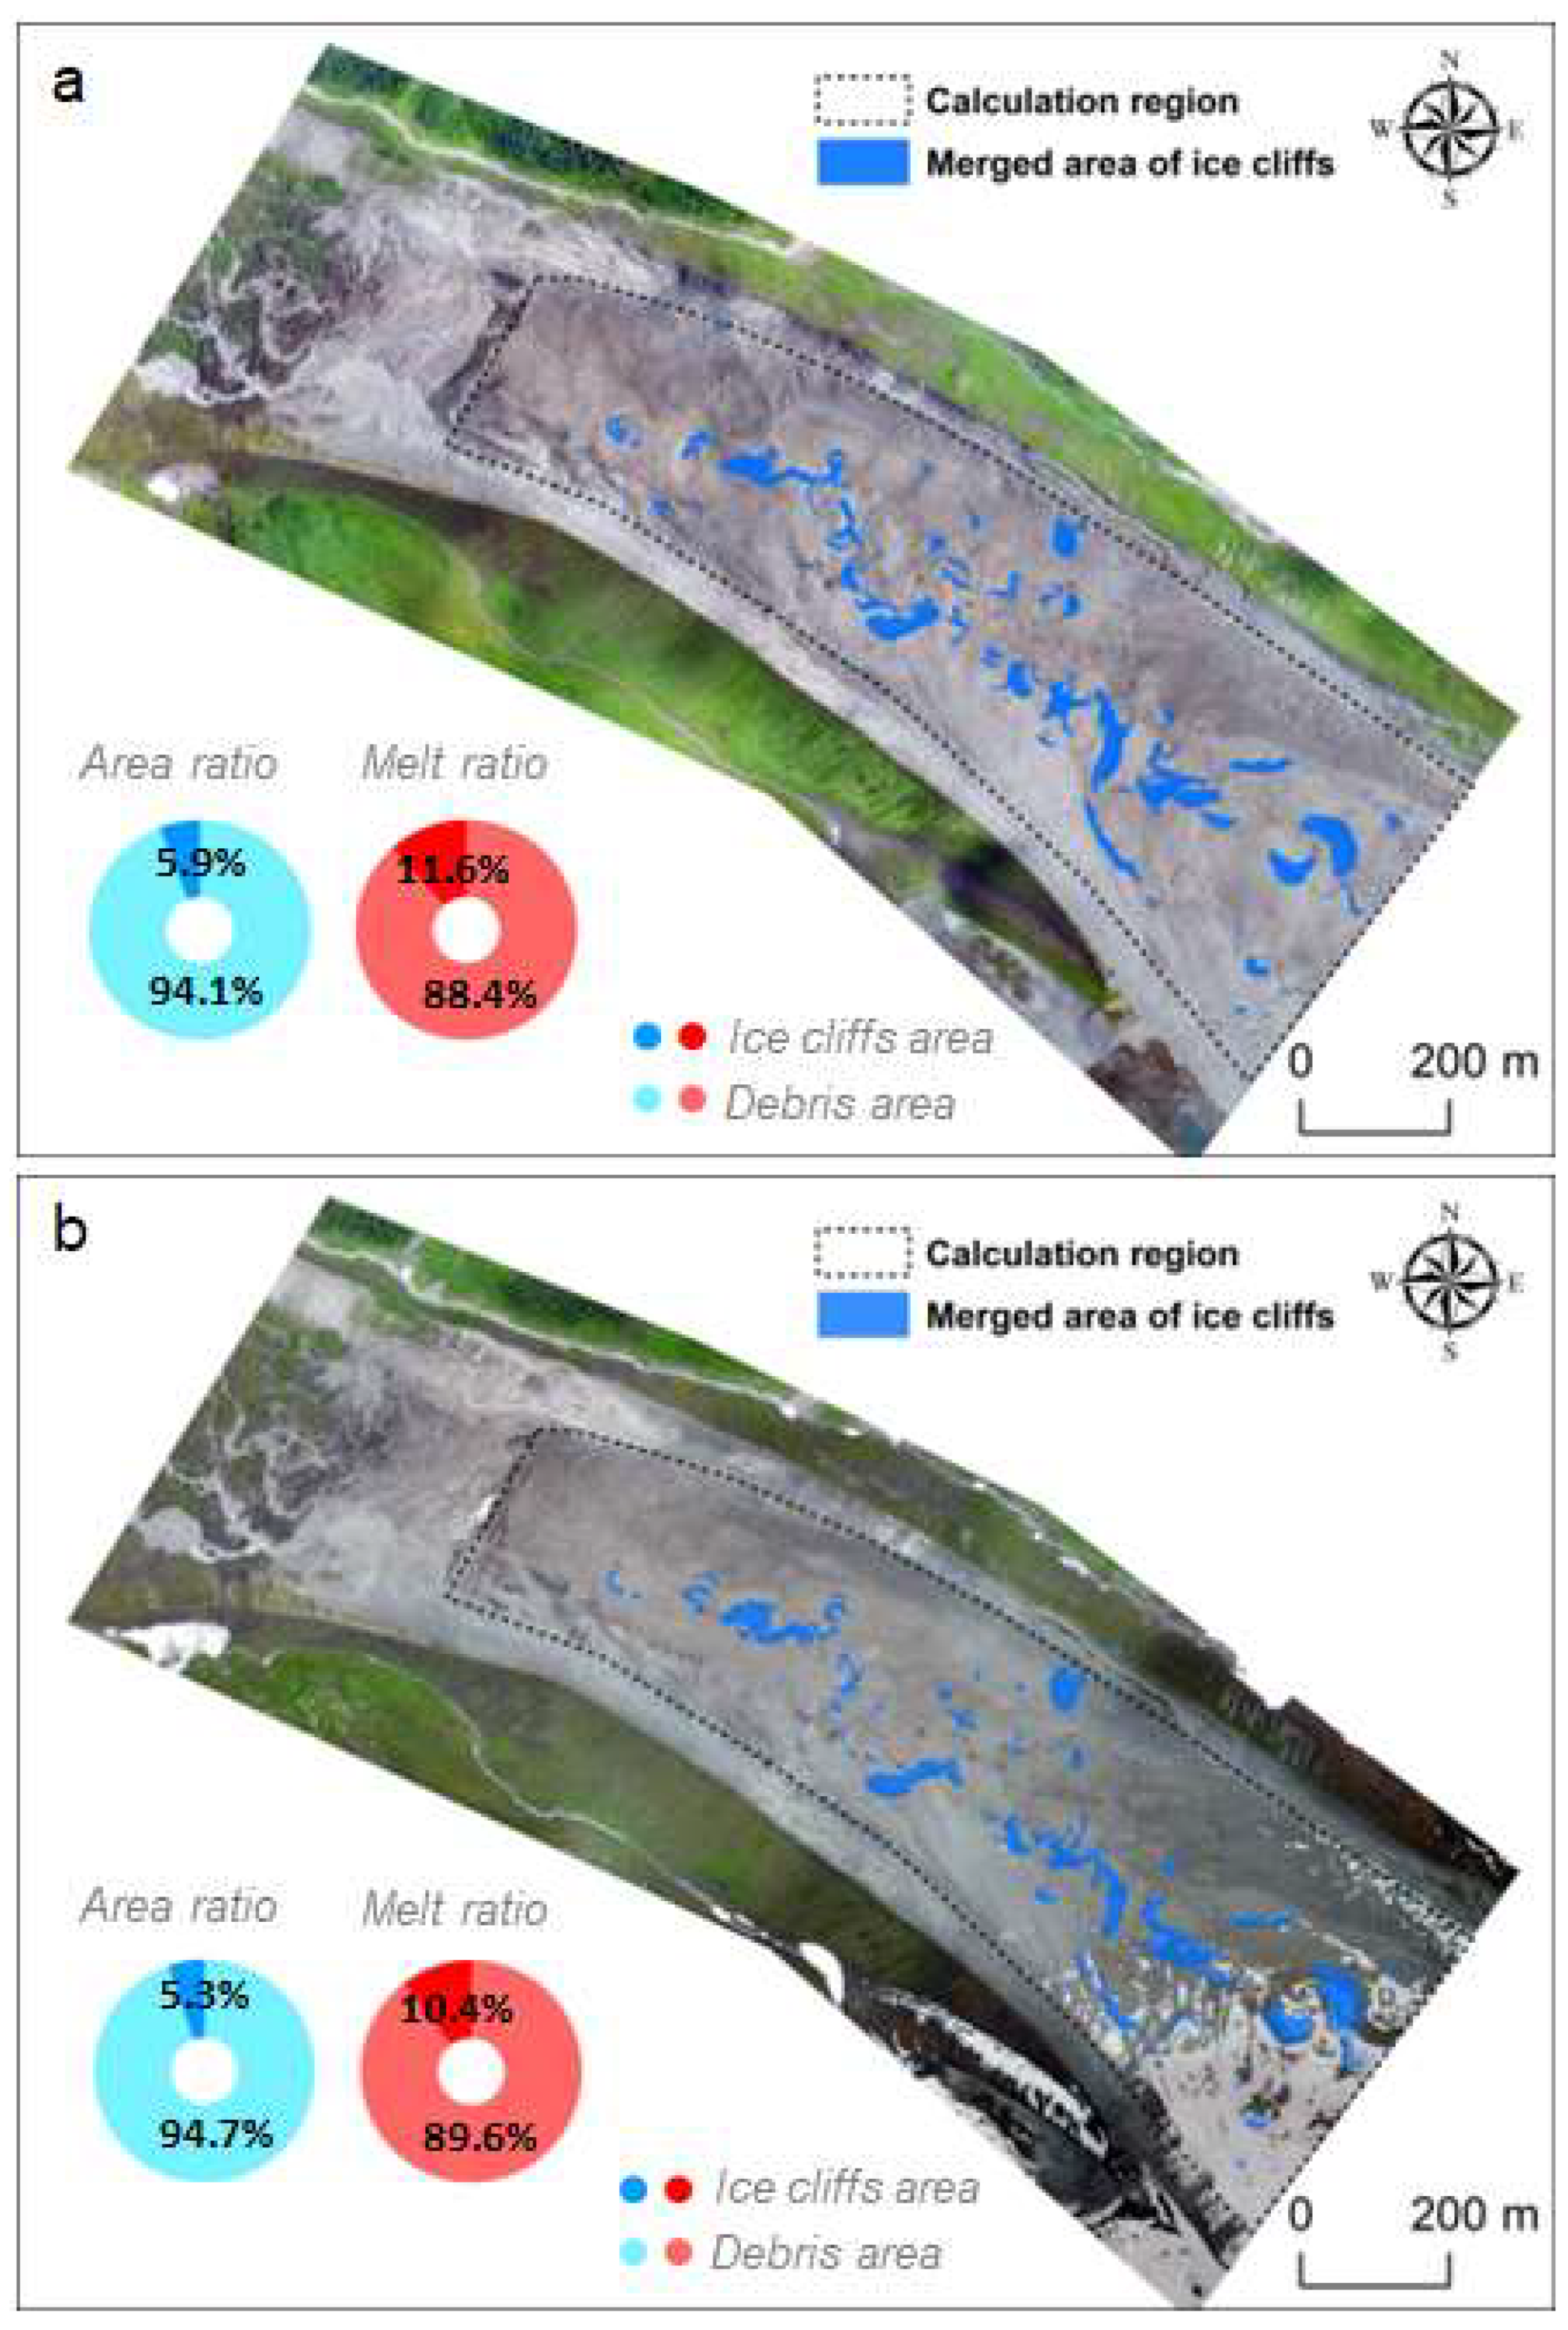
3.4. Hotspot Area Ablation Contribution

To quantify the proportion of the contribution of ablation in the “hotspots” areas, we used the merged ice cliff outline method [25,46] and the mean hotspot area enhancement factors (1.96) [46]. Only 24K exhibited developed ice cliffs, and there were few developed supraglacial ponds. Regarding the merged ice cliffs outline, the specific operation is to georegister the 2020 and 2022 orthomosaics of the glacier areas by using the reference orthomosaics (July 2021). Further details are described in Zhao et al. (2023) [46]. After completing the registration, ice cliff outlines for August 2020, July 2021, and June 2022 were manually sketched based on orthomosaics. Then, we combined the 2020 ice cliff outline with the 2021 ice cliff outline and the 2021 ice cliff outline with the 2022 ice cliff outline. The hotspot area ablation contributions between 2020 and 2022 were estimated based on the previous enhancement factor.

4. Results

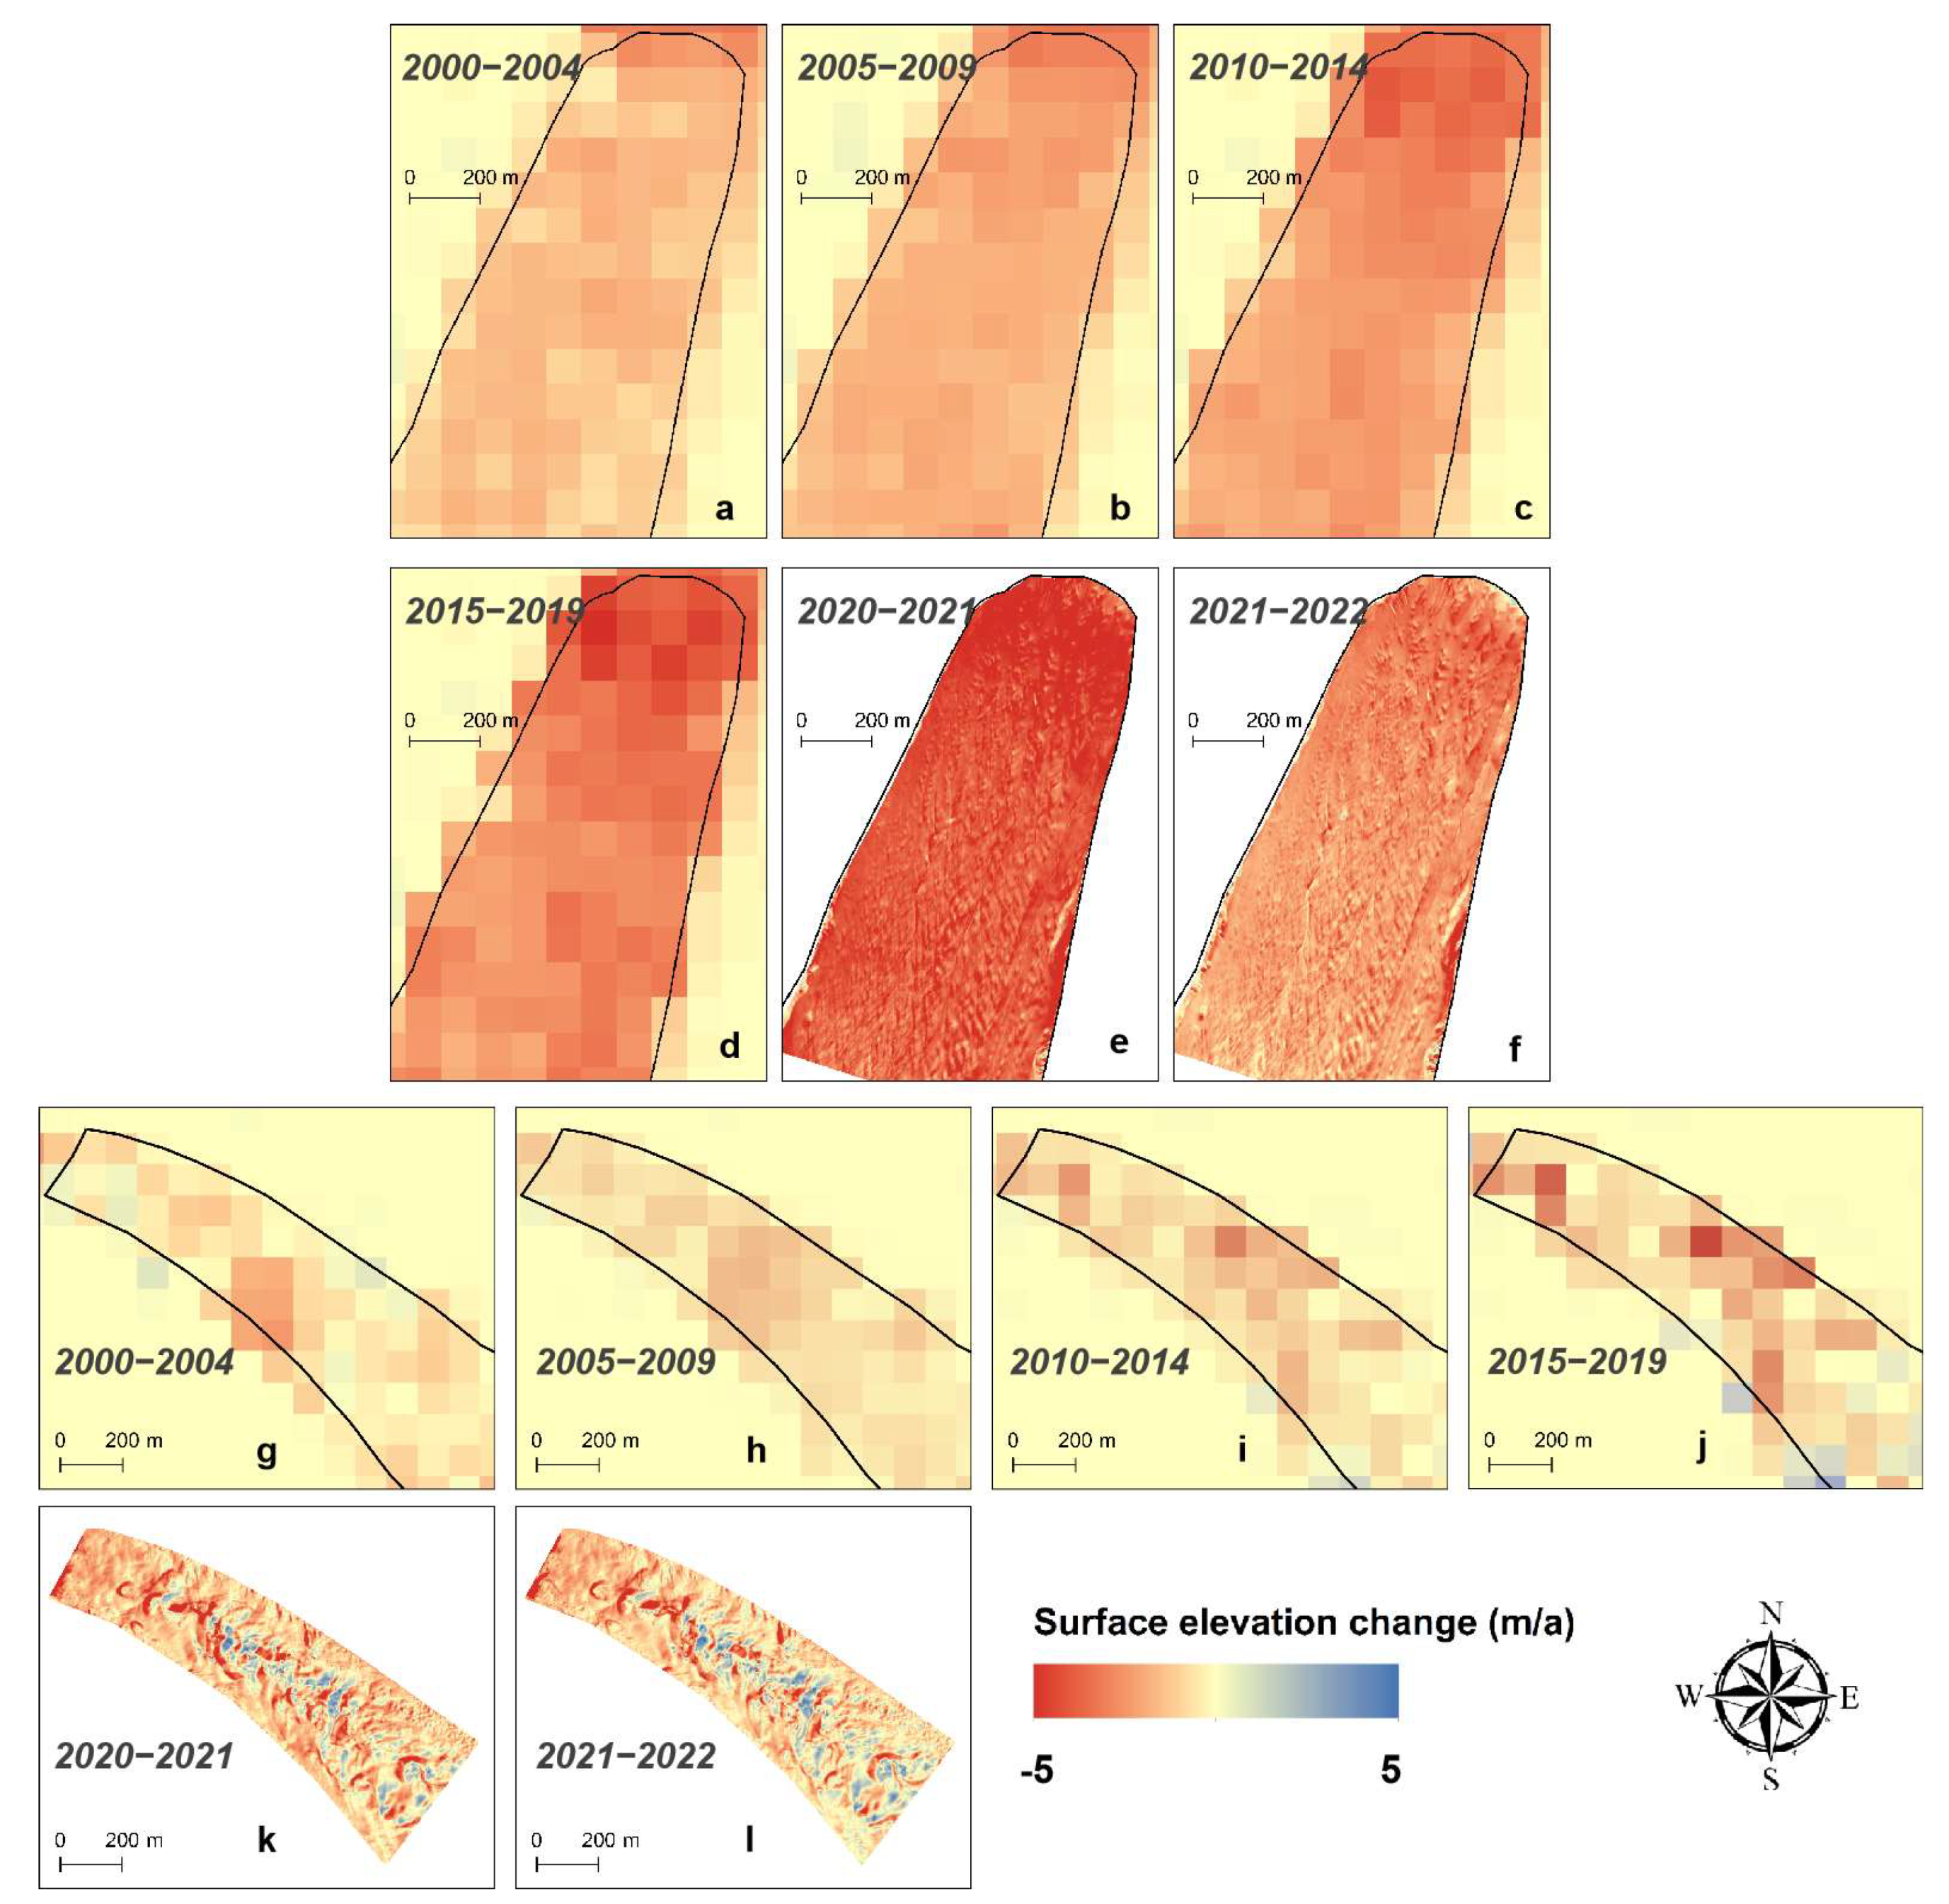
4.1. Surface Elevation Changes of Two Glaciers

Utilizing the high-resolution DEMs derived from the UAV data, we quantified the magnitude and spatial distribution of glacier surface elevation changes on Parlung No. 4. As depicted in Figure 2a,b, this analysis covered two distinct periods: from August 2020 to July 2021 (338 days) and from June 2022 to July 2021 (323 days). During 2020–2021, the mean surface elevation change within the UAV survey area of Parlung No. 4 was −3.93 ± 0.10 m (−1.16 ± 0.03 cm/d). In 2021–2022, the mean surface elevation change in the UAV survey area of Parlung No. 4 was −2.23 ± 0.10 m (−0.69 ± 0.03 cm/d), and the thinning rate in 2021–2022 was lower than that in 2020–2021. Based on the surface elevation change regarding the vertical test area, we obtained the vertical errors of the surface elevation change results for 2020–2021 (0.10 m) and 2021–2022 (0.10 m). These minimal error margins underscore the reliability and precision of the surface elevation change results obtained for the glacier areas.
During the period between August 2020 and July 2021 (337 days), UAV-based observations revealed that the surface elevation change for 24K was −1.20 ± 0.07 m, equating to a daily rate of −0.36 ± 0.02 cm/d, as illustrated in Figure 3a. In the period from July 2021 to June 2022 (334 days), 24K exhibited a mean surface elevation reduction of −0.86 ± 0.10 m, with a mean daily rate of −0.26 ± 0.03 cm/d (Figure 3b). Consistent with the situation of Parlung No. 4, the thinning rate in 2021–2022 was also lower than that in 2020–2021. Compared with Parlung No. 4, the thinning rate of the 24K ablation area was consistently lower than that of the Parlung No. 4 area, which was approximately 3.3 times as large as that of 24K in 2020–2021 and ~2.6 times as large as that of 24K in 2021–2022. Furthermore, the vertical accuracy of the DEMs for 24K remained high, as evidenced by an error value of 0.07 m in 2020–2021 and 0.10 m in 2021–2022.
Figure 4 illustrates the gradient relationship between the surface elevation change rate and altitude for each glacier at 6 m elevation bands (24K) and 10 m elevation bands (Parlung No. 4). It was found that the surface elevation change rate of Parlung No. 4 is constantly higher than that of 24K throughout all observation periods, and the magnitude of the thinning rate of 24K is only slightly above 0, apart from in the terminal ice cliffs area. Additionally, for both glaciers, a decline in thinning magnitude with increasing altitude was noted.

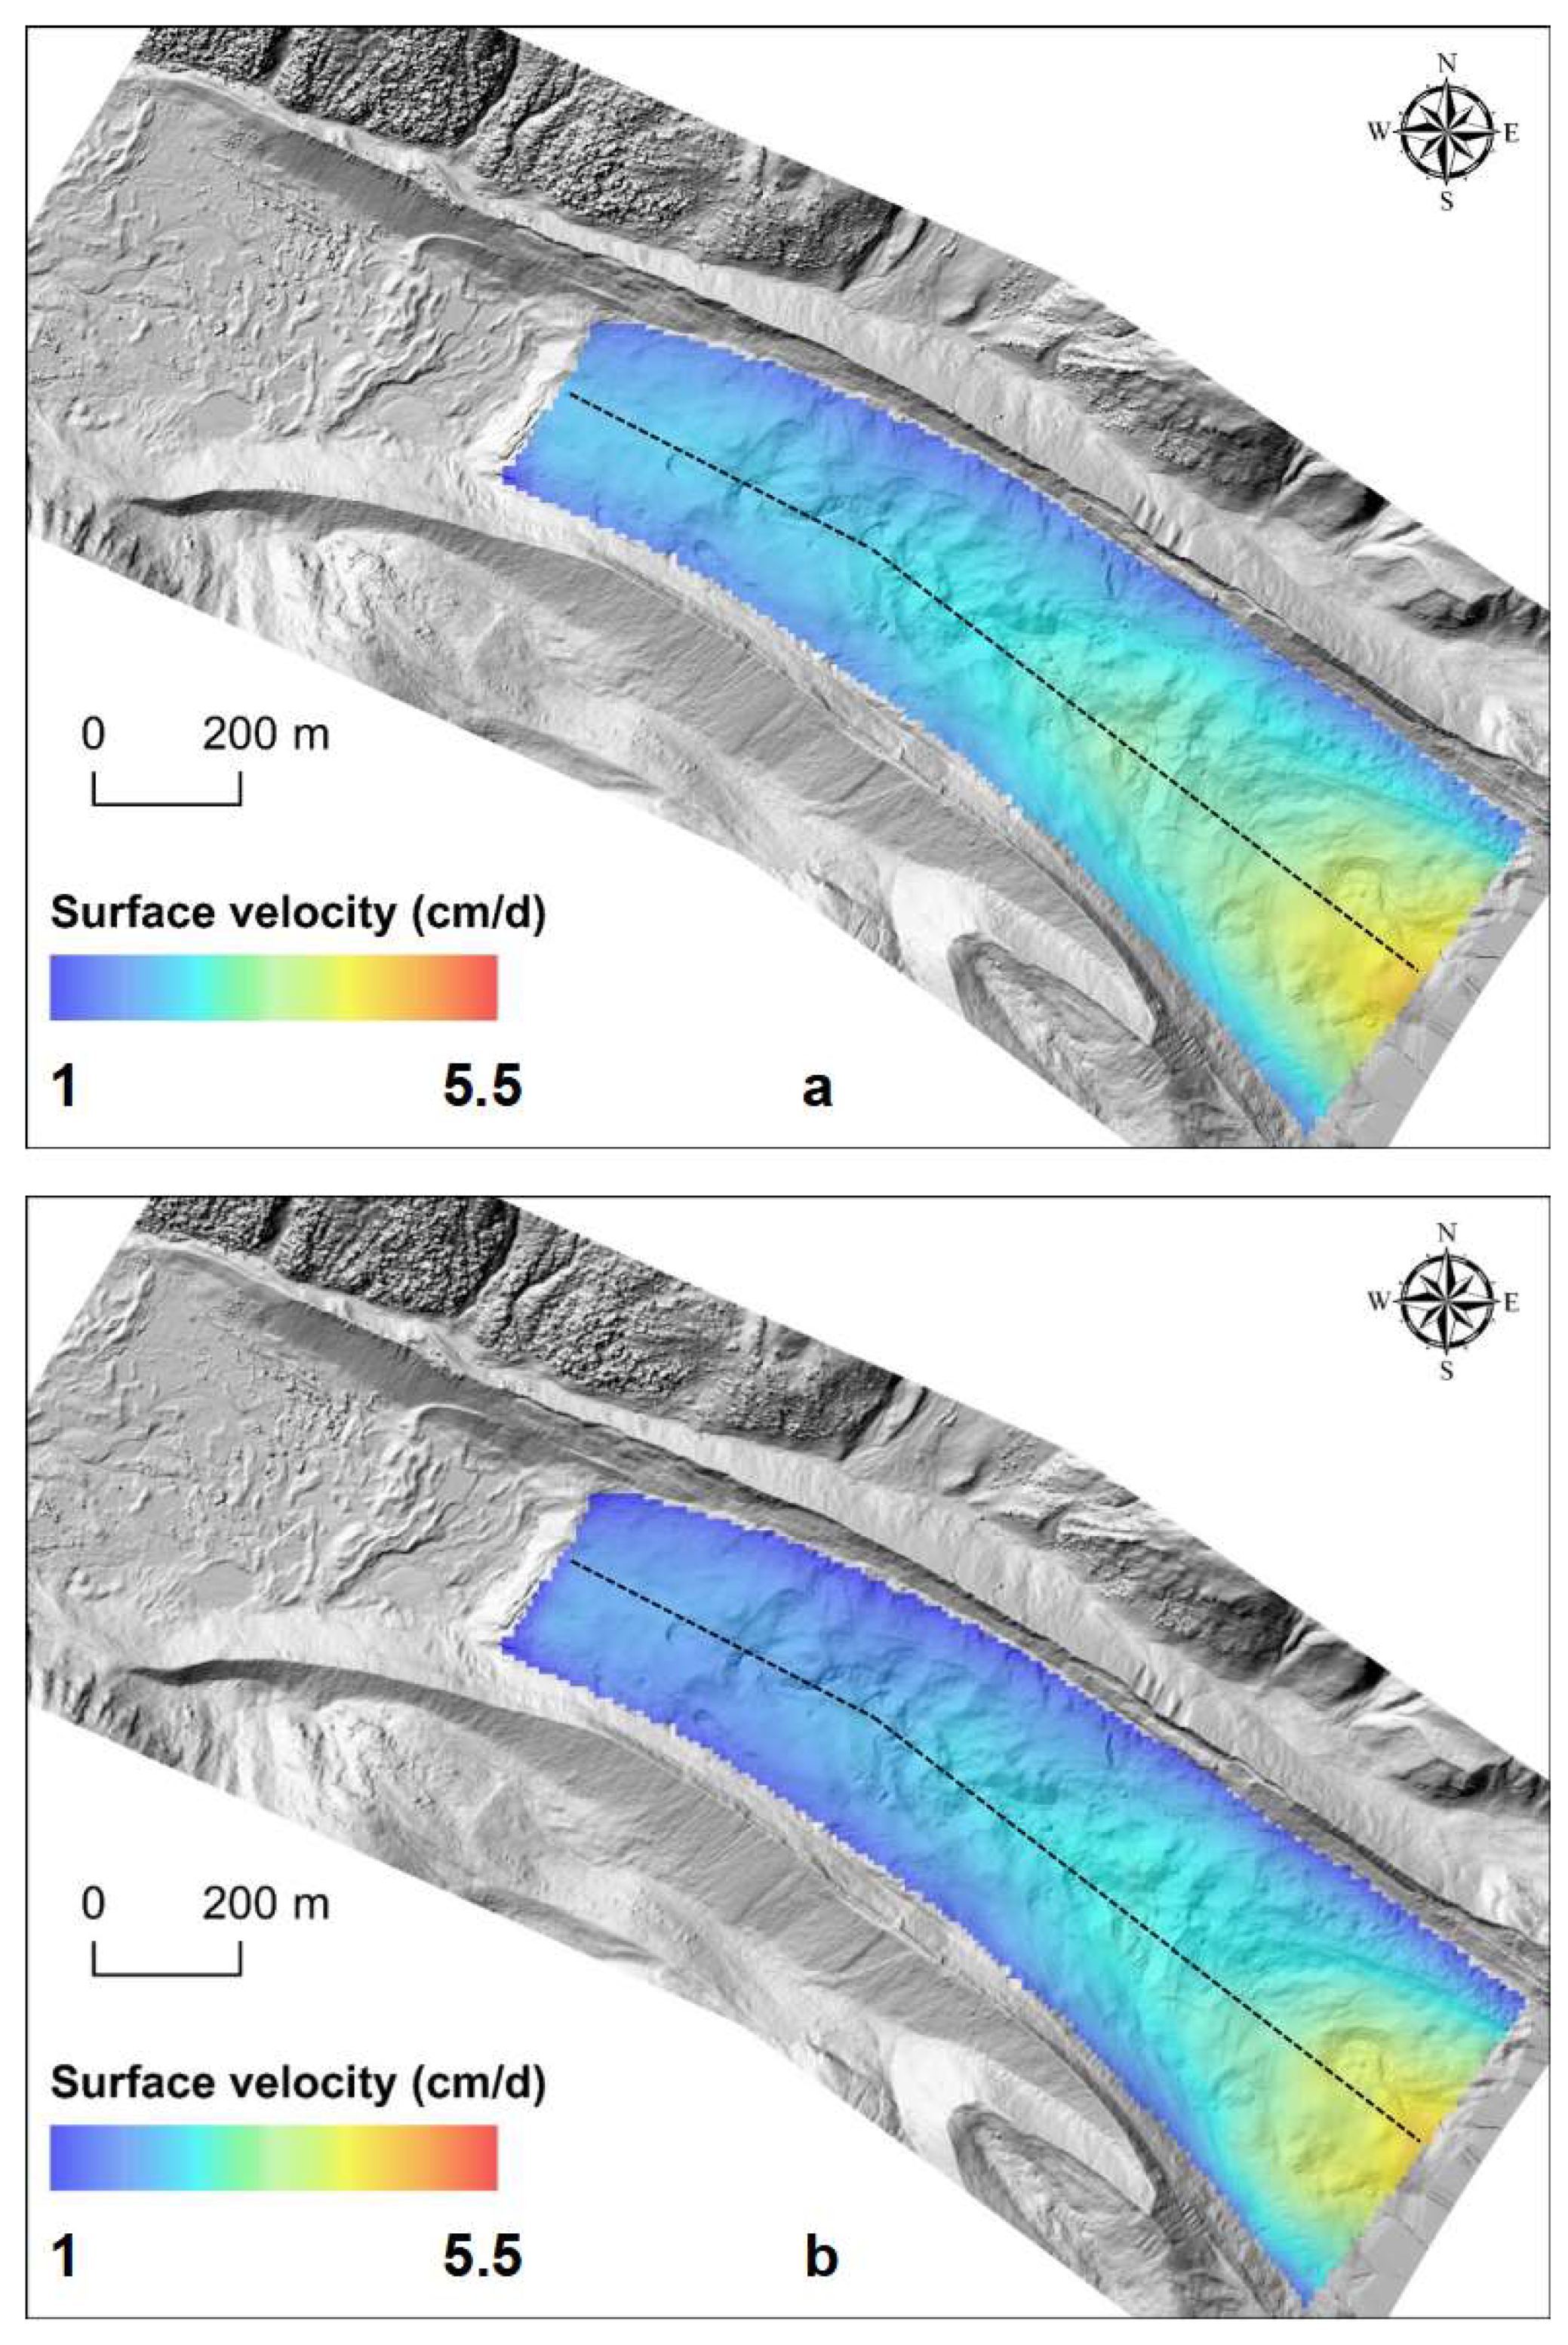
4.2. Surface Velocities of the Two Glaciers

The surface velocity within Parlung No. 4’s UAV survey area reached 4.02 ± 0.04 cm/d, with a mean displacement of 13.59 ± 0.13 m, from August 2020 to July 2021. A subsequent assessment showed a marginally reduced surface velocity of 3.91 ± 0.02 cm/d (mean displacement: 12.63 ± 0.08 m) between July 2021 and June 2022, suggesting little variation across the two periods. In addition, the surface velocity of Parlung No. 4 showed a spatial pattern of increasing with altitude in both periods (Figure 5a,b). In this study, the horizontal error (XY), calculated by using the benchmarks in the non-glacial area of the Parlung No. 4 catchment, was 0.07 m in 2020–2021 and 0.05 m in 2021–2022, which proves that the post-processed data from the UAV surveys have high horizontal accuracy. The mean value of the movement velocity of Parlung No. 4 in the vertical test area was found to be 0.13 m in 2021–2020 and 0.08 m in 2021–2022, which evidences that the surface velocity results are reliable.
The average surface velocity between August 2020 and July 2021 for 24K was 2.45 ± 0.02 cm/day (mean displacement: 8.26 ± 0.07 m). The daily surface velocity from July 2021 to June 2022 was 2.22 ± 0.02 cm/d (mean displacement: 7.41 ± 0.06 m), and the daily velocity in 2021–2022 was slightly lower than the velocity in 2020–2021. In addition, Figure 6a,b also demonstrates that the spatial pattern of 24K is characterized by a surface velocity that increases with the altitude. In this study, the horizontal error (XY) of the post-processed data sourced from the benchmarks in the non-glacial area was 0.04 m for 2020–2021 and 0.05 m for 2021–2022, which reflected a relatively preferable horizontal accuracy. The mean surface velocity for 2020–2021 in the vertical test area was 0.07 m; the value for 2021–2022 was 0.06 m.
We extracted and compared the surface velocities of two glaciers’ central flowlines in 2020–2021 and 2021–2022, respectively (Figure 7), and found that the surface velocity patterns of both glaciers are consistent, with both showing higher surface velocities at higher altitudes. In addition, the Parlung No. 4 surface velocity is significantly greater than that of 24K (~two times). The inter-annual difference in the velocity of Parlung No. 4 is not significant, whereas the velocity of 24K in 2021–2022 is smaller than the surface velocity in 2020–2021.

4.3. Surface Mass Balance Patterns of the Two Glaciers

Based on the thinning results and our computation of the overall ice flux in the UAV survey area for the two glaciers, we calculated the average surface mass balance for the two glaciers (Equations (1)–(3)). We defined two flux gate sections in the upper part of the UAV survey area for the two glaciers (Figure 1b,c). Ice flow replenishment was then calculated for the ablation areas (below the flux gate section/surface mass balance calculation area) for the debris-free glacier (Parlung No. 4) and debris-covered glacier (24K) (Figure 8). In 2020–2021, the average rates of ice flow replenishment were 0.66 ± 0.08 cm/d in the Parlung No. 4 ablation area and 0.45 ± 0.06 cm/d in the 24K ablation area. The average ice flow replenishment was 0.61 ± 0.09 cm/d for the Parlung No. 4 ablation area and 0.44 ± 0.06 cm/d for the 24K ablation area between 2021 and 2022. Taking into consideration the ice fluxes, we further calculated the overall ablation amount for these two representative glaciers (Figure 8). In 2020–2021, the average surface mass balance change rate was −1.82 ± 0.09 cm/d for the Parlung No. 4 area and −0.81 ± 0.07 cm/d for the 24K area. The average surface mass balance change rate was −1.30 ± 0.09 cm/d in the Parlung No. 4 ablation area and −0.70 ± 0.07 cm/d in the 24K ablation area in 2021–2022. Overall, the amplitude of the ice flow replenishment for the two glaciers is roughly similar. However, there is a significant difference between both glaciers in the magnitude of ablation, with the ablation rate of the Parlung No. 4 area being approximately 1.9–2.2 times that of the 24K area.

5. Discussion

5.1. Contrasting Melt Pattern of the Two Glaciers

Figure 8 and Figure 9 show that the melt rate of Parlung No. 4 is consistently higher than that of 24K, and the melt rate of both glaciers was higher in 2020–2021 than in 2021–2022. To gather meteorological data, we installed automatic weather stations in both glaciers [15]. Utilizing the data collected from these stations, we calculated the mean daily air temperature and positive cumulative temperature for both glaciers. Upon comparing the average air temperatures and positive cumulative temperatures of the two glaciers, it became apparent that significantly lower values were consistently recorded for Parlung No. 4 than for 24K (the Parlung No. 4 terminus is ~800 m higher than that of 24K). More specifically, from 2020 to 2021, the mean air temperature and positive cumulative temperature of Parlung No. 4 were −1.02 °C and 802.01 °C·d, while those of 24K were 1.82 °C and 1195.93 °C·d, respectively. In 2021–2022, the mean air temperature and positive cumulative temperature of Parlung No. 4 were −2.59 °C and 630.85 °C·d, while those of 24K were 1.30 °C and 1061.33 °C·d, respectively. Therefore, the melt rate of 24K should be higher than that of Parlung No. 4, but this is in opposition to the actual findings recorded for the two glaciers. This high-precision comparative observation confirms the role of debris cover in inhibiting ablation [10,11,12,13,14,15]. It is essential to fully consider the factor of debris cover for future large-scale reconstruction and prediction studies of glacier change and catchment runoff in the SE Tibetan Plateau.
Additionally, the mean air temperature and positive cumulative temperature of both glaciers were higher during the 2020–2021 period in comparison to the 2021–2022 period. For this reason, the melt rates recorded for both glaciers in 2020–2021 are higher than the melt rates recorded in 2021–2022. However, we found that the melt rate of Parlung No. 4 in 2020–2021 is 1.40 times higher than that of the same glacier in 2021–2022, while the melt rate of 24K in 2020–2021 is 1.16 times higher than that of the same glacier in 2021–2022 (i.e., the response of Parlung No. 4 to climate change is more sensitive than that of 24K). Our findings are in agreement with some studies that suggest that debris-covered glaciers are insensitive to climate change (e.g., Anderson and Anderson, 2016; Vincent et al., 2016) [14,20]. Based on the results of this comparative study, we suggest that the ‘debris-cover anomaly’ phenomenon [19,20] does not imply that debris is ineffective in buffering ablation; rather, it may be related to areas referred to as ‘hotspots’, where debris-covered glaciers commonly develop [27,28,54,55]. The ablation ‘hotspot’ area within the 24K UAV survey area accounted for approximately 5.9% of the UAV survey area during the period from 2020 to 2021 (Figure 10a), and its melt ratio within the UAV survey area was found to reach 11.6% (Figure 10a). In the subsequent period, from 2021 to 2022, the ‘hotspot’ area ratio within the 24K UAV survey area was 5.3%, with a corresponding melt ratio of up to 10.4% (Figure 10b). These findings indicate that the ’hotspot’ area contributes greatly to the overall melt of 24K, accounting for at least 10% of the total ablation. This partial compensation helps mitigate the restraining effect of debris cover on the overall ablation process. The proportion of ‘hotspot’ areas in the 24K UAV survey area is relatively small, while it is slightly higher in the neighboring glacier (23K Glacier: 6.8–7.2%) [46]. However, the ablation contribution of the 23K glacier (a debris-covered glacier adjacent to 24K) ‘hotspot’ area reached 31.5%, which is due to the debris thickness of the 23K glacier being higher than that of 24K (mean thicknesses: 47.1 cm vs. 24.2 cm), resulting in a low melt rate in the 23K debris cover area [46]. Compared with the debris-covered glaciers in other regions, the melt ratio of the 24K ‘hotspot’ area is still small; for example, the Changri Nup glacier in the middle Himalayas has a hotspot area melt contribution of 23–24% [24]. The ‘hotspot’ area ablation contributions of the Lirung and Langtang Glaciers in Nepal were also calculated, and they are 36.43% and 19.84%, respectively, more than that of 24K [56]. The thinner debris thickness of 24K and its smaller ‘hotspot’ area are the driving factors causing the low percentage of ablation contribution in the 24K ‘hotspot’ area.

5.2. Glacier Changes of the Two Glaciers over Two Decades

We extracted the glacier surface elevation changes for Parlung No. 4 and 24K for the periods of 2000–2004, 2005–2009, 2010–2014, and 2015–2019 from the work of Hugonnet et al. (2021) [5]. As the observation periods of 2020–2021 and 2021–2022 do not align with complete calendar years, we normalized the observed thinning/surface velocity amplitudes to annual rates by utilizing the conversion ratio (number of days in the observation period/365). For Parlung No. 4 and 24K, the ablation area exhibited an increasing trend in thinning rate from 2000 to 2019, ranging from −1.48 m/a to −3.08 m/a and −0.59 m/a to −1.21 m/a, respectively, as illustrated in Figure 11 and Figure 12. Both glaciers demonstrate similar response characteristics (i.e., increasing thinning rate) in response to climate change. These trends provide insight into the glaciers’ responses to climate change [57]. However, the thinning rate of Parlung No. 4 is always higher than that of 24K (Figure 11 and Figure 12), and the growth in the thinning of Parlung No. 4 is also greater. These findings demonstrate the key role of debris cover in characterizing glaciers’ responses to climate change.
We compared the surface velocities of the two glaciers during all periods (1999–2003, 2013–2015, 2020–2021, and 2021–2022) using the dataset provided by Dehecq et al. (2015) [58] and UAV data (Figure 11 and Figure 12). Regarding the surface velocity of both glaciers, there has been a decreasing trend since the early 2000s, indicating a weakening dynamic state. Specifically, the annual surface velocity of Parlung No. 4 was 22.06 m/a in 1999–2003, which significantly reduced to 8.32 m/a in 2013–2015. Similarly, the annual surface velocity of 24K decreased from 16.75 m/a in 1999–2003 to 7.71 m/a in 2013–2015. The most plausible reason for the weakening trend of the dynamic state derives from the decreasing ice thickness, leading to a reduction in glacier basement shear stress [52,59,60]. As two typical glaciers in the SE Tibetan Plateau, their dynamic changes also imply that the glaciers in the whole region are in a weakening state. Weakened glacier dynamics contribute to a reduction in ice flow replenishment, accompanied by a constant or increasing ablation intensity, which accelerates the thinning rate of the glaciers, thus damaging the glaciers’ health and sustainability [61].
It is worth noting that the surface velocity of Parlung No. 4 was slightly higher than that of 24K during all periods (Figure 13 and Figure 14). The surface velocity of the debris-covered glacier in this study consistently exhibited weaker dynamics compared to the debris-free glacier. We compared the average ice thickness in the aerial survey areas of the two glaciers and found that the two glaciers were close to each other (Parlung No. 4: 128.1 m; 24K: 106.7 m). In addition, we compared the mean slopes of the aerial surveys and found that the slope of 24K is nearly twice as steep as that of Parlung No. 4 (Parlung No. 4: 6°; 24K: 11°). Overall, based on the above analyses, we conclude that the dynamic state of 24K should not be weaker than that of Parlung No. 4. However, the high-precision results suggest that the dynamic state of 24K is weaker. So, this result can be attributed to the presence of debris cover, which inhibits melting and suppresses basal sliding in glaciers [62]. In addition, the glacial lake of Parlung No. 4 only emerged in recent years, which may have had an influence on the dynamic state of the glacier [63,64]. Studies found that some debris-covered glaciers are in a much weaker dynamic state [46,55,65]; these findings may contribute to the observed ‘debris-cover anomaly’ phenomenon [16,66]. Compared with the nearly stagnant glacier (ablation area), 24K is still in a relatively strong dynamic state. Compared with the neighboring 23K glacier, though they are in the same climatic setting, the higher slope of 24K is responsible for its stronger dynamic state [46]. The great amount of precipitation and thin debris cover in the 24K area are factors that facilitate basal lubrication [15,46] and, thus, make the movement of this glacier faster. Previous studies found that the developed supraglacial ponds are strongly negatively correlated with driving stresses [60]. In the 24K area, there are almost no developed supraglacial ponds, which supports the conclusion that this glacier possesses a relatively strong power state.

6. Conclusions

We explored the mass loss and dynamic states of two representative glaciers in the SE Tibetan Plateau based on repeated UAV data. Our high-precision results suggest that the two types of glaciers have contrasting responses to climate change. Our conclusions are summarized as follows:
Despite the terminus altitude of Parlung No. 4 being much higher than that of 24K (an 800 m difference), the thinning rate of Parlung No. 4 was consistently higher than that of 24K during all periods (2.7–3.2 times). In 2020–2021, the surface elevation change rates of Parlung No. 4 and 24K were −1.16 ± 0.03 cm/d and −0.36 ± 0.02 cm/d, respectively. In 2021–2022, the surface elevation change rates of Parlung No. 4 and 24K were −0.69 ± 0.03 cm/d and −0.26 ± 0.03 cm/d, respectively.
The dynamic state of the debris-free Parlung No. 4 glacier is slightly stronger than that of the debris-covered 24K glacier. In 2020–2021, the mean surface velocities of Parlung No. 4 and 24K were 4.02 ± 0.04 cm/d and 2.45 ± 0.02 cm/day, respectively. In 2021–2022, the mean surface velocities of Parlung No. 4 and 24K were 3.91 ± 0.02 cm/d and 2.22 ± 0.02 cm/d, respectively.
We calculated the surface mass balance of the two different types of glaciers in the SE Tibetan Plateau based on high-precision data, which helped confirm the key role of debris cover. In all periods, the temperature and positive cumulative temperature for Parlung No. 4 were lower than those for 24K, but the ablation rate of Parlung No. 4 was approximately 1.9–2.2 times that of 24K. In addition, both glaciers had lower temperatures and positive cumulative temperatures in 2021–2022 than in 2020–2021. The difference in ablation between these two periods for 24K was small, whereas the difference in ablation for Parlung No. 4 in these periods was large (i.e., the response of Parlung No.4 to climate change is more sensitive than that of 24K). The dominant controlling factor for the above differences is debris cover.

Author Contributions

W.Y., C.Z., Z.H., T.Z., Y.H. and Y.W. conducted the fieldwork. C.Z. and S.K. designed the study and completed the data analysis. C.Z., S.K., T.Z. and T.L. contributed to writing and revising the paper. W.Y. supervised the study. All authors have read and agreed to the published version of the manuscript.

Funding

This study was supported by the National Natural Science Foundation of China (grant nos. 41961134035, 42271138, 42271312, 42130306, and 42206249) and the Science and Technology Plan Projects of Tibet Autonomous Region (grant nos. XZ202301ZY0028G, and XZ202301ZY0022G).

Data Availability Statement

The data presented in this study are available upon request from the corresponding author. The data are not publicly available due to privacy.

Acknowledgments

We thank Hugonnet et al. (2021) [5] and Dehecq et al. (2015) [58] for their datasets of glacier surface elevation change and velocity. We would like to sincerely acknowledge and express our deep appreciation to the editor, and to four anonymous referee for their thorough review of this work.

Conflicts of Interest

The authors declare no conflicts of interest.

Appendix A

Figure A1. Debris measurement points and debris thickness spatial distribution pertaining to 24K.
Remotesensing 16 00918 g0a1

References

  1. Kääb, A.; Berthier, E.; Nuth, C.; Gardelle, J.; Arnaud, Y. Contrasting patterns of early twenty-first-century glacier mass change in the Himalayas. Nature 2012, 488, 495–498. [Google Scholar] [CrossRef]
  2. Yao, T.D.; Thompson, L.; Yang, W.; Yu, W.S.; Gao, Y.; Guo, X.J.; Yang, X.X.; Duan, K.Q.; Zhao, H.B.; Xu, B.Q.; et al. Different glacier status with atmospheric circulations in Tibetan Plateau and surroundings. Nat. Clim. Chang. 2012, 2, 663–667. [Google Scholar] [CrossRef]
  3. Brun, F.; Berthier, E.; Wagnon, P.; Kääb, A.; Treichler, D. A spatially resolved estimate of High Mountain Asia glacier mass balances from 2000 to 2016. Nat. Geosci. 2017, 10, 668–673. [Google Scholar] [CrossRef]
  4. Shean, D.E.; Bhushan, S.; Montesano, P.; Rounce, D.R.; Arendt, A.; Osmanoglu, B. A systematic, regional assessment of High Mountain Asia Glacier mass balance. Front. Earth Sci. 2020, 7, 363. [Google Scholar] [CrossRef]
  5. Hugonnet, R.; McNabb, R.; Berthier, E.; Menounos, B.; Nuth, C.; Girod, L.; Farinotti, D.; Huss, M.; Dussaillant, I.; Brun, F.; et al. Accelerated global glacier mass loss in the early twenty-first century. Nature 2021, 592, 726–731. [Google Scholar] [CrossRef] [PubMed]
  6. Scherler, D.; Wulf, H.; Gorelick, N. Global Assessment of Supraglacial Debris-Cover Extents. Geophys. Res. Lett. 2018, 45, 11798–11805. [Google Scholar] [CrossRef]
  7. Herreid, S.; Pellicciotti, F. The state of rock debris covering Earth’s glaciers. Nat. Geosci. 2020, 13, 621–627, Correction in Nat. Geosci. 2020, 13, 711. [Google Scholar] [CrossRef]
  8. Zhang, Y.; Hirabayashi, Y.; Fujita, K.; Liu, S.Y.; Liu, Q. Heterogeneity in supraglacial debris thickness and its role in glacier mass changes of the Mount Gongga. Sci. China Earth Sci. 2016, 59, 170–184. [Google Scholar] [CrossRef]
  9. Zhang, Y.; Gu, J.; Liu, S.Y.; Wang, X.; Jiang, Z.L.; Wei, J.F.; Zheng, Y.J. Spatial pattern of the debris-cover effect and its role in the Hindu Kush-Pamir-Karakoram-Himalaya glaciers. J. Hydrol. 2022, 615, 128613. [Google Scholar] [CrossRef]
  10. Hagg, W.; Mayer, C.; Lambrecht, A.; Helm, A. Sub-debris melt rates on southern inylchek glacier, central tian shan. Geogr. Ann. Ser. A-Phys. Geogr. 2008, 90A, 55–63. [Google Scholar] [CrossRef]
  11. Nakawo, M.; Yabuki, H.; Sakai, A. Characteristics of Khumbu Glacier, Nepal Himalaya: Recent change in the debris-covered area. Ann. Glaciol. 1999, 28, 118–122. [Google Scholar] [CrossRef]
  12. Nicholson, L.; Benn, D.I. Calculating ice melt beneath a debris layer using meteorological data. J. Glaciol. 2006, 52, 463–470. [Google Scholar] [CrossRef]
  13. Reid, T.D.; Brock, B.W. An energy-balance model for debris-covered glaciers including heat conduction through the debris layer. J. Glaciol. 2010, 56, 903–916. [Google Scholar] [CrossRef]
  14. Anderson, L.S.; Anderson, R.S. Modeling debris-covered glaciers: Response to steady debris deposition. Cryosphere 2016, 10, 1105–1124. [Google Scholar] [CrossRef]
  15. Yang, W.; Yao, T.D.; Zhu, M.L.; Wang, Y.J. Comparison of the meteorology and surface energy fluxes of debris-free and debris-covered glaciers in the southeastern Tibetan Plateau. J. Glaciol. 2017, 63, 1090–1104. [Google Scholar] [CrossRef]
  16. Rounce, D.R.; Hock, R.; McNabb, R.W.; Millan, R.; Sommer, C.; Braun, M.H.; Malz, P.; Maussion, F.; Mouginot, J.; Seehaus, T.C.; et al. Distributed global debris thickness estimates reveal debris significantly impacts glacier mass balance. Geophys. Res. Lett. 2021, 48, e2020GL091311. [Google Scholar] [CrossRef] [PubMed]
  17. Vincent, C.; Ramanathan, A.; Wagnon, P.; Dobhal, D.P.; Linda, A.; Berthier, E.; Sharma, P.; Arnaud, Y.; Azam, M.F.; Jose, P.G.; et al. Balanced conditions or slight mass gain of glaciers in the Lahaul and Spiti region (northern India, Himalaya) during the nineties preceded recent mass loss. Cryosphere 2013, 7, 569–582. [Google Scholar] [CrossRef]
  18. Brun, F.; Wagnon, P.; Berthier, E.; Jomelli, V.; Maharjan, S.B.; Shrestha, F.; Kraaijenbrink, P.D.A. Heterogeneous influence of glacier morphology on the mass balance variability in high mountain Asia. J. Geophys. Res. Earth 2019, 124, 1331–1345. [Google Scholar] [CrossRef]
  19. Pellicciotti, F.; Stephan, C.; Miles, E.; Herreid, S.; Immerzeel, W.W.; Bolch, T. Mass-balance changes of the debris-covered glaciers in the Langtang Himal, Nepal, from 1974 to 1999. J. Glaciol. 2015, 61, 373–386. [Google Scholar] [CrossRef]
  20. Vincent, C.; Wagnon, P.; Shea, J.M.; Immerzeel, W.W.; Kraaijenbrink, P.; Shrestha, D.; Soruco, A.; Arnaud, Y.; Brun, F.; Berthier, E.; et al. Reduced melt on debris-covered glaciers: Investigations from Changri Nup Glacier, Nepal. Cryosphere 2016, 10, 1845–1858. [Google Scholar] [CrossRef]
  21. Neckel, N.; Loibl, D.; Rankl, M. Recent slowdown and thinning of debris-covered glaciers in south-eastern Tibet. Earth Planet. Sci. Lett. 2017, 464, 95–102. [Google Scholar] [CrossRef]
  22. Ke, L.H.; Song, C.Q.; Yong, B.; Lei, Y.B.; Ding, X.L. Which heterogeneous glacier melting patterns can be robustly observed from space? A multi-scale assessment in southeastern Tibetan Plateau. Remote Sens. Environ. 2020, 242, 111777. [Google Scholar] [CrossRef]
  23. Thompson, S.; Benn, D.I.; Mertes, J.; Luckman, A. Stagnation and mass loss on a Himalayan debris-covered glacier: Processes, patterns and rates. J. Glaciol. 2016, 62, 467–485. [Google Scholar] [CrossRef]
  24. Brun, F.; Wagnon, P.; Berthier, E.; Shea, J.M.; Immerzeel, W.W.; Kraaijenbrink, P.D.A.; Vincent, C.; Reverchon, C.; Shrestha, D.; Arnaud, Y. Ice cliff contribution to the tongue-wide ablation of Changri Nup Glacier, Nepal, central Himalaya. Cryosphere 2018, 12, 3439–3457. [Google Scholar] [CrossRef]
  25. Miles, E.S.; Willis, I.; Buri, P.; Steiner, J.F.; Arnold, N.S.; Pellicciotti, F. Surface pond energy absorption across four Himalayan glaciers accounts for 1/8 of total catchment ice loss. Geophys. Res. Lett. 2018, 45, 10464–10473. [Google Scholar] [CrossRef] [PubMed]
  26. Miles, E.S.; Steiner, J.F.; Buri, P.; Immerzeel, W.W.; Pellicciotti, F. Controls on the relative melt rates of debris-covered glacier surfaces. Environ. Res. Lett. 2022, 17, 064004. [Google Scholar] [CrossRef]
  27. Buri, P.; Miles, E.S.; Steiner, J.F.; Immerzeel, W.W.; Wagnon, P.; Pellicciotti, F. A physically based 3-D model of ice cliff evolution over debris-covered glaciers. J. Geophys. Res. Earth 2016, 121, 2471–2493. [Google Scholar] [CrossRef]
  28. Buri, P.; Miles, E.S.; Steiner, J.F.; Ragettli, S.; Pellicciotti, F. Supraglacial ice cliffs can substantially increase the mass loss of debris-covered glaciers. Geophys. Res. Lett. 2021, 48, e2020GL092150. [Google Scholar] [CrossRef]
  29. Kneib, M.; Miles, E.S.; Buri, P.; Fugger, S.; McCarthy, M.; Shaw, T.E.; Zhao, C.X.; Truffer, M.; Westoby, M.J.; Yang, W.; et al. Sub-seasonal variability of supraglacial ice cliff melt rates and associated processes from time-lapse photogrammetry. Cryosphere 2022, 16, 4701–4725. [Google Scholar] [CrossRef]
  30. Sato, Y.; Fujita, K.; Inoue, H.; Sunako, S.; Sakai, A.; Tsushima, A.; Podolskiy, E.A.; Kayastha, R.; Kayastha, R.B. Ice cliff dynamics of debris-covered trakarding glacier in the Rolwaling region, nepal Himalaya. Front. Earth Sci. 2021, 9, 623623. [Google Scholar] [CrossRef]
  31. Mishra, N.B.; Miles, E.S.; Chaudhuri, G.; Mainali, K.P.; Mal, S.; Singh, P.B.; Tiruwa, B. Quantifying heterogeneous monsoonal melt on a debris-covered glacier in Nepal Himalaya using repeat uncrewed aerial system (UAS) photogrammetry. J. Glaciol. 2022, 68, 288–304. [Google Scholar] [CrossRef]
  32. Immerzeel, W.W.; Kraaijenbrink, P.D.A.; Shea, J.M.; Shrestha, A.B.; Pellicciotti, F.; Bierkens, M.F.P.; de Jong, S.M. High-resolution monitoring of Himalayan glacier dynamics using unmanned aerial vehicles. Remote Sens. Environ. 2014, 150, 93–103. [Google Scholar] [CrossRef]
  33. Brun, F.; Buri, P.; Miles, E.S.; Wagnon, P.; Steiner, J.; Berthier, E.; Ragettli, S.; Kraaijenbrink, P.; Immerzeel, W.W.; Pellicciotti, F. Quantifying volume loss from ice cliffs on debris-covered glaciers using high-resolution terrestrial and aerial photogrammetry. J. Glaciol. 2016, 62, 684–695. [Google Scholar] [CrossRef]
  34. Mölg, N.; Bolch, T.; Walter, A.; Vieli, A. Unravelling the evolution of Zmuttgletscher and its debris cover since the end of the Little Ice Age. Cryosphere 2019, 13, 1889–1909. [Google Scholar] [CrossRef]
  35. Westoby, M.J.; Rounce, D.R.; Shaw, T.E.; Fyffe, C.L.; Moore, P.L.; Stewart, R.L.; Brock, B.W. Geomorphological evolution of a debris-covered glacier surface. Earth Surf. Process. Landf. 2020, 45, 3431–3448. [Google Scholar] [CrossRef]
  36. Anderson, L.S.; Armstrong, W.H.; Anderson, R.S.; Buri, P. Debris cover and the thinning of Kennicott Glacier, Alaska: In situ measurements, automated ice cliff delineation and distributed melt estimates. Cryosphere 2021, 15, 265–282. [Google Scholar] [CrossRef]
  37. Kneib, M.; Miles, E.S.; Buri, P.; Molnar, P.; McCarthy, M.; Fugger, S.; Pellicciotti, F. Interannual dynamics of ice cliff populations on debris-covered glaciers from remote sensing observations and stochastic modeling. J. Geophys. Res. Earth 2021, 126, e2021JF006179. [Google Scholar] [CrossRef] [PubMed]
  38. Westoby, M.J.; Brasington, J.; Glasser, N.F.; Hambrey, M.J.; Reynolds, J.M. ‘Structure-from-Motion’ photogrammetry: A low-cost, effective tool for geoscience applications. Geomorphology 2012, 179, 300–314. [Google Scholar] [CrossRef]
  39. Benoit, L.; Gourdon, A.; Vallat, R.; Irarrazaval, I.; Gravey, M.; Lehmann, B.; Prasicek, G.; Gräff, D.; Herman, F.; Mariethoz, G. A high-resolution image time series of the Gorner Glacier-Swiss Alps-derived from repeated unmanned aerial vehicle surveys. Earth Syst. Sci. Data 2019, 11, 579–588. [Google Scholar] [CrossRef]
  40. Che, Y.J.; Wang, S.J.; Yi, S.H.; Wei, Y.Q.; Cai, Y.C. Summer mass balance and surface velocity derived by unmanned aerial vehicle on debris-covered region of Baishui River Glacier No. 1, Yulong Snow Mountain. Remote Sens. 2020, 12, 3280. [Google Scholar] [CrossRef]
  41. Yang, W.; Zhao, C.X.; Westoby, M.; Yao, T.D.; Wang, Y.J.; Pellicciotti, F.; Zhou, J.M.; He, Z.; Miles, E. Seasonal dynamics of a temperate Tibetan Glacier revealed by high-resolution UAV Photogrammetry and In Situ Measurements. Remote Sens. 2020, 12, 2389. [Google Scholar] [CrossRef]
  42. Fu, Y.; Liu, Q.; Liu, G.X.; Zhang, B.; Zhang, R.; Cai, J.L.; Wang, X.W.; Xiang, W. Seasonal ice dynamics in the lower ablation zone of Dagongba Glacier, southeastern Tibetan Plateau, from multitemporal UAV images. J. Glaciol. 2022, 68, 636–650. [Google Scholar] [CrossRef]
  43. Wu, K.P.; Liu, S.Y.; Zhu, Y.; Xie, F.M.; Gao, Y.P.; Qi, M.M.; Miao, W.F.; Duan, S.M.; Han, F.Z.; Grünwald, R. Monitoring the surface elevation changes of a monsoon temperate glacier with repeated UAV Surveys, Mainri Mountains, China. Remote Sens. 2022, 14, 2229. [Google Scholar] [CrossRef]
  44. Xu, S.Y.; Fu, P.; Quincey, D.; Feng, M.L.; Marsh, S.; Liu, Q. UAV-based geomorphological evolution of the Terminus Area of the Hailuogou Glacier, Southeastern Tibetan Plateau between 2017 and 2020. Geomorphology 2022, 411, 108293. [Google Scholar] [CrossRef]
  45. He, Z.; Yang, W.; Wang, Y.J.; Zhao, C.X.; Ren, S.T.; Li, C.H. Dynamic changes of a thick debris-covered glacier in the southeastern Tibetan Plateau. Remote Sens. 2023, 15, 357. [Google Scholar] [CrossRef]
  46. Zhao, C.; Yang, W.; Miles, E.; Westoby, M.; Kneib, M.; Wang, Y.; He, Z.; Pellicciotti, F. Thinning and surface mass balance patterns of two neighbouring debris-covered glaciers in the southeastern Tibetan Plateau. Cryosphere 2023, 17, 3895–3913. [Google Scholar] [CrossRef]
  47. Ye, D.; Gao, Y. Meteorology of the Tibetan Plateau; Science Press: Beijing, China, 1979; pp. 49–61. [Google Scholar]
  48. Yang, W.; Yao, T.D.; Guo, X.F.; Zhu, M.L.; Li, S.H.; Kattel, D.B. Mass balance of a maritime glacier on the southeast Tibetan Plateau and its climatic sensitivity. J. Geophys. Res. Atmos. 2013, 118, 9579–9594. [Google Scholar] [CrossRef]
  49. Yang, W.; Guo, X.F.; Yao, T.D.; Zhu, M.L.; Wang, Y.J. Recent accelerating mass loss of southeast Tibetan glaciers and the relationship with changes in macroscale atmospheric circulations. Clim. Dyn. 2016, 47, 805–815. [Google Scholar] [CrossRef]
  50. Messerli, A.; Grinsted, A. Image georectification and feature tracking toolbox: ImGRAFT. Geosci. Instrum. Methods Data Syst. 2015, 4, 23–34. [Google Scholar] [CrossRef]
  51. Bolch, T.; Menounos, B.; Wheate, R. Landsat-based inventory of glaciers in western Canada, 1985–2005. Remote Sens. Environ. 2010, 114, 127–137. [Google Scholar] [CrossRef]
  52. Cuffey, K.M.; Paterson, W.S.B. The Physics of Glaciers, 4th ed.; Academic Press: Amsterdam, The Netherlands, 2010; 704p. [Google Scholar]
  53. Farinotti, D.; Huss, M.; Fürst, J.J.; Landmann, J.; Machguth, H.; Maussion, F.; Pandit, A. A consensus estimate for the ice thickness distribution of all glaciers on Earth. Nat. Geosci. 2019, 12, 168–173. [Google Scholar] [CrossRef]
  54. Steiner, J.F.; Pellicciotti, F.; Bur, P.; Miles, E.S.; Immerzeel, W.W.; Reid, T.D. Modelling ice-cliff backwasting on a debris-covered glacier in the Nepalese Himalaya. J. Glaciol. 2015, 61, 889–907. [Google Scholar] [CrossRef]
  55. Kneib, M.; Fyffe, C.L.; Miles, E.S.; Lindemann, S.; Shaw, T.E.; Buri, P.; McCarthy, M.; Ouvry, B.; Vieli, A.; Sato, Y.; et al. Controls on ice cliff distribution and characteristics on debris-covered glaciers. Geophys. Res. Lett. 2023, 50, e2022GL102444. [Google Scholar] [CrossRef]
  56. Buri, P.; Pellicciotti, F. Aspect controls the survival of ice cliffs on debris-covered glaciers. Proc. Natl. Acad. Sci. USA 2018, 115, 4369–4374. [Google Scholar] [CrossRef] [PubMed]
  57. Jouberton, A.; Shaw, T.E.; Miles, E.; McCarthy, M.; Fugger, S.; Ren, S.; Dehecq, A.; Yang, W.; Pellicciotti, F. Warming-induced monsoon precipitation phase change intensifies glacier mass loss in the southeastern Tibetan Plateau. Proc. Natl. Acad. Sci. USA 2022, 119, e2109796119. [Google Scholar] [CrossRef] [PubMed]
  58. Dehecq, A.; Gourmelen, N.; Trouve, E. Deriving large-scale glacier velocities from a complete satellite archive: Application to the Pamir-Karakoram-Himalaya. Remote Sens. Environ. 2015, 162, 55–66. [Google Scholar] [CrossRef]
  59. Dehecq, A.; Gourmelen, N.; Gardner, A.S.; Brun, F.; Goldberg, D.; Nienow, P.W.; Berthier, E.; Vincent, C.; Wagnon, P.; Trouvé, E. Twenty-first century glacier slowdown driven by mass loss in High Mountain Asia. Nat. Geosci. 2019, 12, 22. [Google Scholar] [CrossRef]
  60. Wu, K.P.; Liu, S.Y.; Zhu, Y.; Liu, Q.; Jiang, Z.L. Dynamics of glacier surface velocity and ice thickness for maritime glaciers in the southeastern Tibetan Plateau. J. Hydrol. 2020, 590, 125527. [Google Scholar] [CrossRef]
  61. Miles, E.; McCarthy, M.; Dehecq, A.; Kneib, M.; Fugger, S.; Pellicciotti, F. Health and sustainability of glaciers in High Moun tain Asia. Nat. Commun. 2021, 12, 2868. [Google Scholar] [CrossRef] [PubMed]
  62. Delaney, I.; Anderson, L.S. Debris cover limits subglacial erosion and promotes till accumulation. Geophys. Res. Lett. 2022, 49, e2022GL099049. [Google Scholar] [CrossRef] [PubMed]
  63. Liu, Q.; Mayer, C.; Wang, X.; Nie, Y.; Wu, K.P.; Wei, J.F.; Liu, S.Y. Interannual flow dynamics driven by frontal retreat of a lake-terminating glacier in the Chinese Central Himalaya. Earth Planet. Sci. Lett. 2020, 546, 116450. [Google Scholar] [CrossRef]
  64. Sato, Y.; Fujita, K.; Inoue, H.; Sakai, A.; Karma. Land- to lake-terminating transition triggers dynamic thinning of a Bhutanese glacier. Cryosphere 2022, 16, 2643–2654. [Google Scholar] [CrossRef]
  65. Anderson, L.S.; Armstrong, W.H.; Anderson, R.S.; Scherler, D.; Petersen, E. The causes of debris-covered glacier thinning: Evidence for the importance of ice dynamics from Kennicott Glacier, Alaska. Front. Earth Sci. 2021, 9, 680995. [Google Scholar] [CrossRef]
  66. Berthier, E.; Vincent, C. Relative contribution of surface mass-balance and ice-flux changes to the accelerated thinning of Mer de Glace, French Alps, over 1979–2008. J. Glaciol. 2012, 58, 501–512. [Google Scholar] [CrossRef]
Figure 1. (a) Location of the study area. (b,c) Maps showing the topography and UAV survey information for the 24K and Parlung No. 4 catchments. (d,e) The altitudinal distribution of the glacierized and non-glacierized areas of the Parlung No. 4 and 24K catchments.
Remotesensing 16 00918 g001
Figure 2. Annual surface elevation change for Parlung No. 4 between DEMs for August 2020−July 2021 (a) and surface elevation change for July 2021−June 2022 (b).
Remotesensing 16 00918 g002
Figure 3. Annual surface elevation change for 24K between DEMs for August 2020−July 2021 (a) and surface elevation change for July 2021−June 2022 (b).
Remotesensing 16 00918 g003
Figure 4. Average surface elevation change rates within 6 m elevation bands for Parlung No. 4 and 10 m elevation bands for 24K (represented by dots) and their corresponding standard deviations (shown as horizontal error bars) for the periods of August 2020 to July 2021 (a,c) and July 2021 to June 2022 (b,d). The red-shaded sections in the figure represent the terminal ice cliffs of 24K.
Remotesensing 16 00918 g004
Figure 5. Surface velocity of Parlung No. 4 for August 2020–July 2021 (a) and surface elevation change for July 2021–June 2022 (b). The black dashed line represents the central flowline.
Remotesensing 16 00918 g005
Figure 6. Surface velocity of 24K for August 2020–July 2021 (a) and surface elevation change for July 2021–June 2022 (b). The black dashed line represents the central flowline.
Remotesensing 16 00918 g006
Figure 7. The surface velocities of central flowlines for Parlung No. 4 (red lines) and 24K (blue lines).
Remotesensing 16 00918 g007
Figure 8. Comparison of surface ablation (red bar), surface elevation changes (green bar), and emergence velocity (blue bar) of two different glaciers from 2020 to 2022.
Remotesensing 16 00918 g008
Figure 9. Comparison of the temperatures and ablation rates of the two glaciers in 2020−2021 and 2021–2022.
Remotesensing 16 00918 g009
Figure 10. Ice cliff area spatial distribution, area ratio, and melt ratio information of 24K for 2020–2021 (a) and 2021–2022 (b).
Remotesensing 16 00918 g010
Figure 11. Annual rates of surface elevation change for 2000.01–2004.12 (a,g), 2005.01–2009.12 (b,h), 2010.01–2014.12 (c,i), 2015.01–2019.12 (d,j), 2020.08–2021.07 (e,k), and 2021.07–2022.06 (f,l) for Parlung No. 4 (af) and 24K (gl).
Remotesensing 16 00918 g011
Figure 12. Surface elevation changes for the UAV survey area of Parlung No. 4 and 24K since the start of the 21st century.
Remotesensing 16 00918 g012
Figure 13. (a,b) Annual surface velocities for 1999–2003 (a,e), 2013–2015 (b,f), 2020–2021 (c,g), and 2021–2022 (d,h) for Parlung No. 4 (ad) and 24K (eh).
Remotesensing 16 00918 g013
Figure 14. Surface velocities for the UAV survey area of Parlung No. 4 and 24K since the start of the 21st century.
Remotesensing 16 00918 g014
Table 1. UAV flight information of two glaciers.
Flight
Time
Flight
Type
UAV NameGlacier NameImage NumberResolution (cm)Area (km2)
25 August 2020PPKeBee PlusParlung No. 44259.84.0
20 August 202024K16012.63.7
29 July 2021PPKeBee PlusParlung No. 44429.44.6
23 July 202124K4269.24.4
18 June 2022PPKeBee PlusParlung No. 45299.13.9
22 June 202224K24911.85.4
Disclaimer/Publisher’s Note: The statements, opinions and data contained in all publications are solely those of the individual author(s) and contributor(s) and not of MDPI and/or the editor(s). MDPI and/or the editor(s) disclaim responsibility for any injury to people or property resulting from any ideas, methods, instructions or products referred to in the content.

