Article

Flood Susceptibility Mapping Using SAR Data and Machine Learning Algorithms in a Small Watershed in Northwestern Morocco

1
Geosciences Laboratory, Department of Geology, Faculty of Sciences, University Ibn Tofail, Kenitra 14000, Morocco
2
Construction Technologies Institute, National Research Council (CNR), Polo Tecnologico di San Giovanni a Teduccio, 80146 Napoli, Italy
3
Institute of Geosciences and Earth Resources (IGG), National Research Council (CNR), Via Moruzzi 1, 56126 Pisa, Italy
4
Department of Geography, Faculty of Science, Aligarh Muslim University (AMU), Aligarh 202002, Uttar Pradesh, India
5
Faculty of Civil and Water Resources Engineering, Bahir Dar Institute of Technology, Bahir Dar University, Bahir Dar P.O. Box 26, Ethiopia
6
Centre for Climate Change and Water Research, Suresh Gyan Vihar University, Jaipur 302017, Rajasthan, India
7
School of Agricultural, Forestry, Environmental and Food Sciences, University of Basilicata, 85100 Potenza, Italy
8
ITC-CNR, Construction Technologies Institute, National Research Council (CNR), 70124 Bari, Italy
*
Author to whom correspondence should be addressed.
Remote Sens. 2024, 16(5), 858; https://doi.org/10.3390/rs16050858
Submission received: 9 January 2024 / Revised: 15 February 2024 / Accepted: 24 February 2024 / Published: 29 February 2024

Abstract

:
Flood susceptibility mapping plays a crucial role in flood risk assessment and management. Accurate identification of areas prone to flooding is essential for implementing effective mitigation measures and informing decision-making processes. In this regard, the present study used high-resolution remote sensing products, i.e., synthetic aperture radar (SAR) images for flood inventory preparation and integrated four machine learning models (Random Forest: RF, Classification and Regression Trees: CART, Support Vector Machine: SVM, and Extreme Gradient Boosting: XGBoost) to predict flood susceptibility in Metlili watershed, Morocco. Initially, 12 independent variables (elevation, slope angle, aspect, plan curvature, topographic wetness index, stream power index, distance from streams, distance from roads, lithology, rainfall, land use/land cover, and normalized vegetation index) were used as conditioning factors. The flood inventory dataset was divided into 70% and 30% for training and validation purposes using a popular library, scikit-learn (i.e., train_test_split) in Python programming language. Additionally, the area under the curve (AUC) was used to evaluate the performance of the models. The accuracy assessment results showed that RF, CART, SVM, and XGBoost models predicted flood susceptibility with AUC values of 0.807, 0.780, 0.756, and 0.727, respectively. However, the RF model performed better at flood susceptibility prediction compared to the other models applied. As per this model, 22.49%, 16.02%, 12.67%, 18.10%, and 31.70% areas of the watershed are estimated as being very low, low, moderate, high, and very highly susceptible to flooding, respectively. Therefore, this study showed that the integration of machine learning models with radar data could have promising results in predicting flood susceptibility in the study area and other similar environments.

Graphical Abstract

1. Introduction

As a natural disaster, floods can have disastrous effects, including the loss of life, significant property damage, and interruption of vital infrastructure [1]. Floods, a prevalent and devastating natural hazard, have the potential to unleash widespread chaos and suffering. These devastating occurrences, which are brought on by factors like strong winds and rain, have the potential to submerge entire communities, causing fatalities, significant property damage, and interruptions to vital infrastructure. Their far-reaching effects frequently have long-term negative effects on the economy, society, and environment in addition to the severe physical damage. Effective flood risk management and preparedness are essential to mitigating the destructive effects of floods, ensuring the safety of vulnerable populations, and safeguarding the stability of ecosystems and economies in flood-prone regions.
An essential part of disaster risk management is mapping flood susceptibility, which aids authorities and communities in anticipating, responding to, and lessening the destructive effects of flooding incidents. The frequency and severity of floods have been on the rise, necessitating the development of effective flood management [2,3]. Accurate identification of areas prone to flooding is crucial for implementing appropriate mitigation strategies and facilitating informed decision-making processes related to land-use planning and disaster management. Of all the natural catastrophes, flash floods, rain, and landslides produced the most fatalities because of increased runoff that was quickly followed by increased rainfall [4,5].
In recent years, remote sensing data and machine learning algorithms have emerged as powerful tools for flood susceptibility mapping. Remote sensing techniques, particularly those utilizing synthetic aperture radar (SAR) imagery, offer advantages making them highly suitable for flood mapping applications. SAR technology enables the acquisition of high-resolution, all-weather, day-and-night satellite imagery [6]. It measures the backscattering of radar waves to create detailed images of the Earth’s surface. The fine-grained information regarding topography, land cover, and surface roughness that SAR data can capture is essential for assessing flood susceptibility. Additionally, SAR data may be collected regularly and reliably, providing a time-series view that is very helpful for tracking changes in areas that are vulnerable to flooding.
Radar (SAR) imagery offers significant advantages for flood mapping due to its all-weather and day–night imaging capabilities [6]. SAR can penetrate cloud cover and vegetation, providing valuable information about flood extent and dynamics below canopies. SAR data has been used in a number of studies to map flood vulnerability, demonstrating how well it can capture factors linked to flooding, such as water accumulation, inundation patterns, and floodplain characteristics. For example, [7] SAR imagery was applied to map flood susceptibility in the Yangtze River Basin of China. This study employed SAR backscattering coefficients and texture features to characterize flood-prone areas, achieving satisfactory accuracy in flood susceptibility assessment. Similarly, a study conducted by [8] in the Karkheh River Basin in Iran used SAR imagery to extract flood-related features such as surface roughness and vegetation cover, leading to accurate flood susceptibility mapping [9,10].
On the other hand, machine learning models enable the processing and analysis of large volumes of data, enabling the extraction of valuable patterns and relationships that are required for accurate flood susceptibility modeling. Machine learning algorithms such as decision trees, support vector machines, and neural networks, can be employed to process and analyze SAR data for flood susceptibility mapping. These algorithms learn patterns and relationships from historical flood data, SAR images, and ancillary geospatial information such as precipitation data, land use, and soil type. Machine learning algorithms are able to identify flood-prone locations, forecast flood occurrences, and assess the possible impact of a specific flood on a given area by utilizing this multi-dimensional data. The capacity of machine learning algorithms to evaluate large datasets, spot intricate patterns, generate linkages, and produce data-driven predictions has drawn a lot of interest in the field of flood susceptibility mapping. Various machine learning techniques, including Random Forest, Support Vector Machines, and Artificial Neural Networks, have been employed for flood susceptibility mapping, contributing to improved accuracy and efficiency. For example, Ref. [11] employed Random Forest and SAR data to map flood susceptibility in the Gorganrud River Basin of Iran by incorporating several flood-related variables, such as topography, land use/cover, and hydrological characteristics and achieved a high accuracy in flood susceptibility assessment. A study conducted by [12] in the Red River Delta of Vietnam applied Support Vector Machines and SAR data and prepared accurate flood susceptibility maps [13,14,15]. Although machine learning techniques have been widely used due to their many advantages, these techniques also have some weaknesses. These include the need for large labeled datasets, vulnerability to biased or incomplete data, and challenges in interpreting “black box” models [16]. Overfitting, where models perform well on training data but poorly on new data, is common. Ethical concerns, privacy issues, and potential job displacement are also notable drawbacks.
Synthetic aperture radar (SAR) data, in combination with machine learning algorithms, have emerged as a powerful tool in this endeavor, offering enhanced predictive capabilities and a data-driven approach to flood risk assessment [17]. The capacity to recognize, evaluate, and track flood-prone locations has been transformed by this dynamic relationship of artificial intelligence and remote sensing technologies, ultimately leading to more resilient communities and efficient disaster management. Improving flood susceptibility mapping by the integration of machine learning algorithms with radar image data has demonstrated encouraging outcomes. Researchers have been able to make use of information-rich radar imaging and extract pertinent flood-related characteristics for precise flood risk assessment by merging SAR data with machine learning algorithms. For instance, Triet et al., 2020 [18] integrated SAR imagery with the Random Forest algorithm to map flood susceptibility in the Mekong Delta, Vietnam. They utilized SAR backscattering coefficients, topographic attributes, and land use data, and achieved satisfactory results in identifying flood-prone areas. Additionally, a study conducted by R. Penki et al., 2022 [19] in the Krishna River Basin of India integrated SAR data with Artificial Neural Networks to map flood susceptibility and effective flood risk management.
In the case of the Metlili watershed of Morocco, the region has experienced recurrent flood events that have had severe impacts on local communities and infrastructures. Consequently, there is an urgent need to develop a robust flood susceptibility mapping approach tailored to the specific characteristics of the area. This research aims to investigate the effectiveness of SAR imagery and machine learning algorithms for flood susceptibility mapping in the Metlili watershed, with the objective of providing valuable insights for flood risk assessment and management in the region.
The main objectives of this study are as follows:
-
To apply machine learning models like Random Forest, Classification and Regression Trees, Support Vector Machine, and Extreme Gradient Boosting to generate accurate flood susceptibility maps.
-
To validate the generated flood susceptibility maps using historical flood records and statistical evaluation metrics to assess their reliability and performance.
-
To provide recommendations for flood risk management and planning based on the obtained flood susceptibility results.
The integration of SAR data and machine learning algorithms in flood susceptibility mapping offers a data-driven, accurate, and timely approach to assessing and predicting flood risks [20]. This methodology provides valuable insights for disaster preparedness, risk reduction, and emergency response. As climate change continues to intensify the frequency and severity of flooding events, the combination of SAR data and machine learning algorithms becomes increasingly essential in helping communities adapt to these challenges and build resilience against the destructive forces of nature. By utilizing the synergy between SAR imagery and machine learning algorithms, this research broadly aims to contribute to the existing knowledge on flood susceptibility mapping, specifically focusing on the unique characteristics of the Metlili watershed in Morocco.
The novelty of this study lies in the integration of flood inventory using SAR data and state-of-the-art computational methods to address flood risk management challenges in the region. The applied machine learning models are not new and other studies have also used them for multiple purposes. However, focusing on the Metlili watershed in Northwestern Morocco provides a specific regional context for flood susceptibility mapping, addressing the unique environmental, socio-economic, and hydrological characteristics of the area. This localized approach allows for tailored flood risk management strategies and adaptation measures to be developed, contributing to more effective disaster preparedness and resilience-building efforts in the region. Overall, the combination of SAR data and machine learning algorithms in flood susceptibility mapping represents an innovative and promising approach to enhancing flood risk assessment and management in the Metlili watershed of Morocco. Therefore, the outcomes of this study are expected to enhance our understanding of flood dynamics in the area and support decision-making processes related to flood risk mitigation and resilience building.

2. Study Area

The Metlili watershed is located in the north-east of Morocco, 23 km east of the city of Taourirt. It covers an area of 208.1 km2. It lies between 2°25′00″ to 2°50′00″N altitudes and 34°15′00″ to 34°45′00″W longitudes (Figure 1). It has an altitude range of 300–1719 m.a.s.l. and the slope varies from 0 to 52.87°. The watershed is characterized by a Mediterranean climate tempered by Atlantic influences. The annual rainfall in the watershed varies between 297 mm and 491 mm. From the geological point of view, the Metlili basin is constituted of deposits of Miocene age and recent deposits of Quaternary age. The national road N6, which connects the center and east of Morocco, crosses the basin in the northern part. The most recent flooding that affected this area occurred in September 2019.

3. Data Used and Methodology Applied

3.1. Flood Inventory Map

The preparation of a flood susceptibility inventory map necessitates a data-driven approach. For effective model training and validation, flood inventories serve as a crucial component [21]. These inventories can be compiled through a combination of field investigations, historical flood events, and the analysis of remote sensing data. In this study, the flood inventory map was prepared based on four significant flood events in 2009, 2014, 2016, and 2019 collected from the Ministry of Equipment, Transport, Logistics, and Water [22]. Additionally, the flood inventory map was prepared based on Sentinel-1 image data. The coverage of flooding areas in the watershed was identified through a comparative assessment of pair(s) of SAR images taken before and after a flooding event. The highest historical flood reported to cause damages in the study area was recorded on 08 September 2019 [23]. As a result, two images from Sentinel-1 missions (https://scihub.copernicus.eu (accessed on 22 July 2020)) acquired on 04 September 2019 and 10 September 2019 were taken to represent the before and after flood scenes, respectively. The Ground Range Detection (GRD) product images were taken in the Interferometric Wide (IW) swath mode with Vertical/Horizontal (VH) polarization and spatial resolution of 10 m acquired in the ascending direction. Once the pair of SAR images are selected, the analysis of Sentinel images usually begins with applying the precise orbital file to improve the geolocation quality of images for later steps. Next, radiometric calibration was applied to the images to correct the system-specific errors and ensure consistency in the recorded signal values [24]. This step involves converting the raw digital numbers to backscatter coefficients or radar reflectivity values. Then, speckle filtering was done to suppress noise while preserving the spatial resolution of the images [21]. Finally, the images were geometrically corrected (using SRTM 30 m resolution DEM) before image thresholding was applied to generate flooded areas. The image thresholding procedure produces a binary map that allows the discrimination of flooded areas from non-flooded areas based on visual inspection. Hence, the flooded areas were assigned a categorical value of “1” while non-flooded areas were assigned a categorical value of “0” from the binary maps based on a certain cut-off threshold. Therefore, in this study, to prepare the flood inventory map, a total of 204 observation points were considered based on both Sentinel-1 data and previous events in this study; 120 of them were in flood-affected areas whereas the remaining 84 observations were in non-flood-affected areas. It means that the total dataset was split into 70% and 30% for training and validating models, respectively. The methodological flowchart followed in this study is shown in Figure 2.

3.2. Flood Conditioning Factors

The choice of conditioning variables for flood susceptibility mapping was determined by considering both data availability and insights derived from various literature studies. Thus, 12 flood conditioning factors were taken into consideration based on previous studies and the availability of data from the study region. These factors are elevation, slope, aspect, plan curvature, topographic wetness index (TWI), stream power index (SPI), lithology, distance from roads, distance from streams, land use/land cover, NDVI, and rainfall patterns. A detailed description of the data and their sources are presented in Table 1, and maps of all selected factors are shown in Figure 3, Figure 4 and Figure 5.
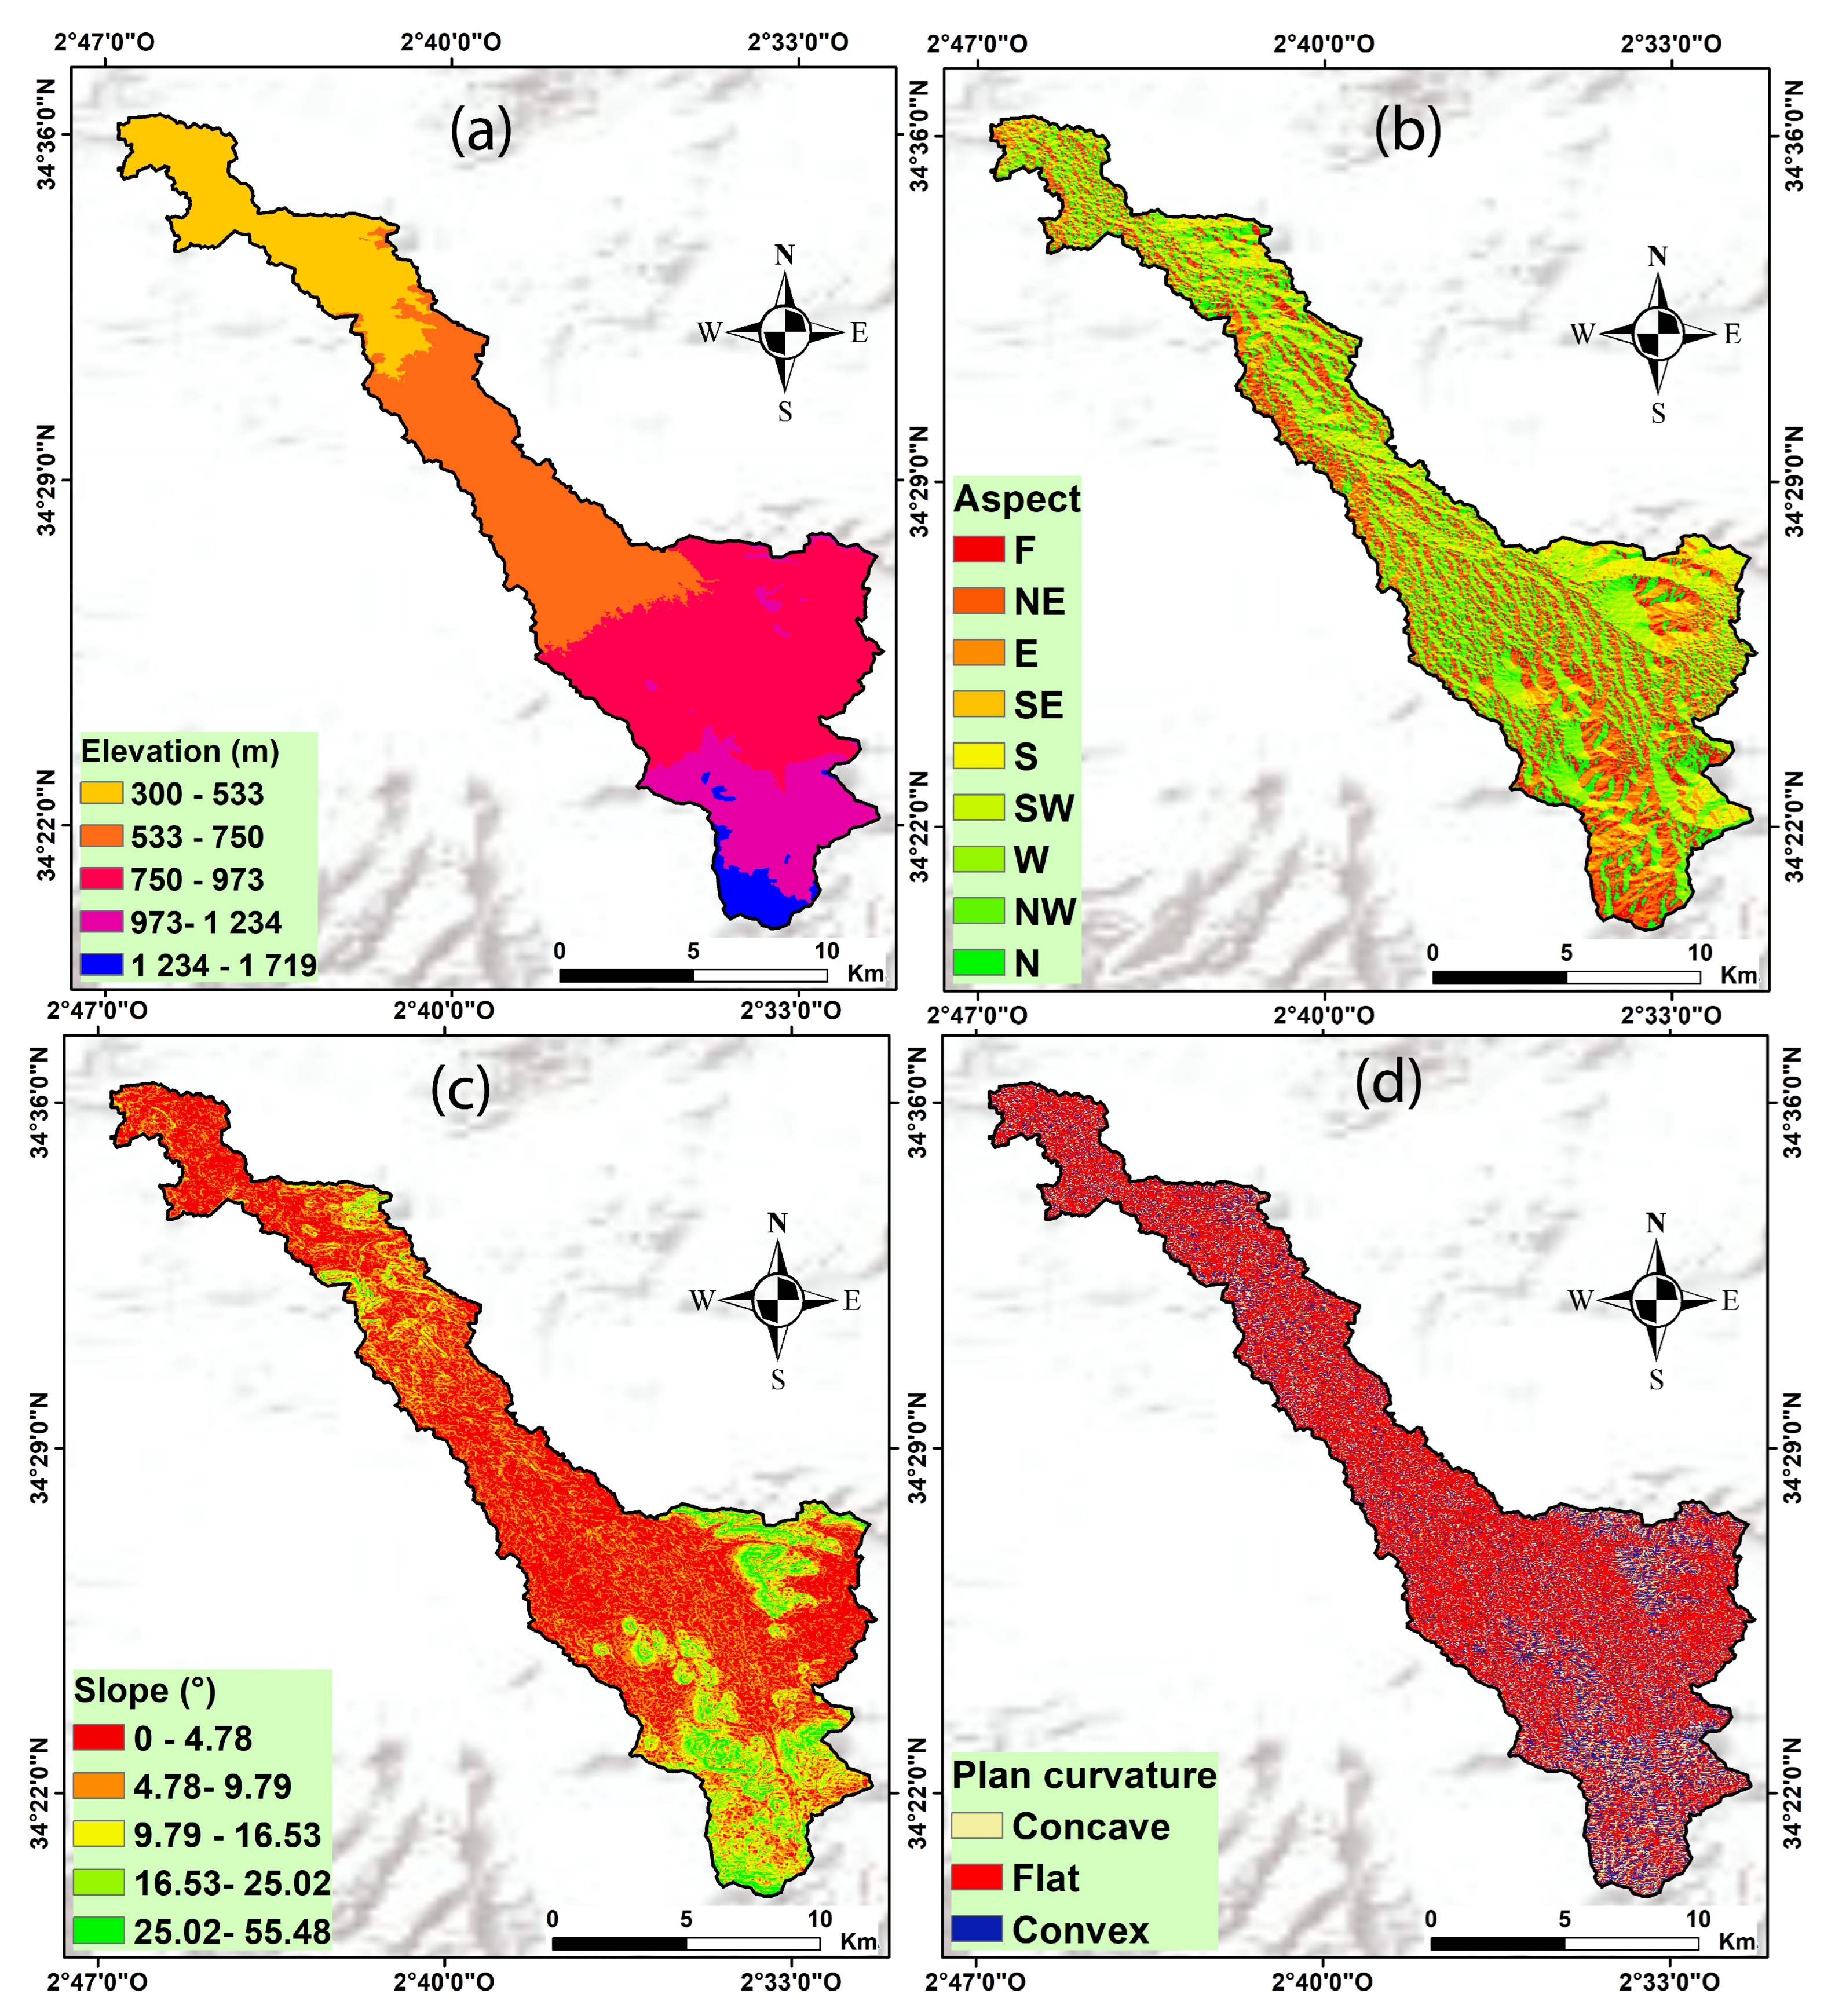
Elevation, slope angle, aspect, plan curvature, and topographic wetness index (TWI) maps were extracted from the digital elevation model (DEM) with a pixel size of 30 × 30 m using spatial analyst tools available in the ArcGIS 10.8 software. Elevation gives a variation in elevation between the upstream, which represents runoff-receiving areas with higher flood potential, and the downstream, which represents higher elevation areas with lower flood potential [25,26]. This factor was reclassified into five classes based on expert knowledge (Figure 3a): 300–533 m, 533–750 m, 750–973 m, 973–1234 m, and 1234–1719 m. Slope angle was classified into five categories based on a manual classification method, i.e., 0–4.78°, 4.78–9.79°, 9.79–16.53°, 16.53–25.02°, and 25.02–55.48° (Figure 3b). The higher the angle, the lower the infiltration of surface water and the higher the velocity of water flow and runoff [25,27,28].
Aspect gives the direction of the slope. It impacts both rainfall intensity and morphological development and contributes to the analysis of exposure to flooding [29]. This factor was also classified into nine categories using the manual classification method, i.e., F, N, NE, E, SE, S, NW, W, and SW (Figure 3c).
Plan curvature affects the flow of water in a given area. After calculating this factor, zero values represent a very significant risk of flooding [28,30]. This factor was classified into three categories: concave (positive values), flat (zero values), and convex (negative values) (Figure 3d).
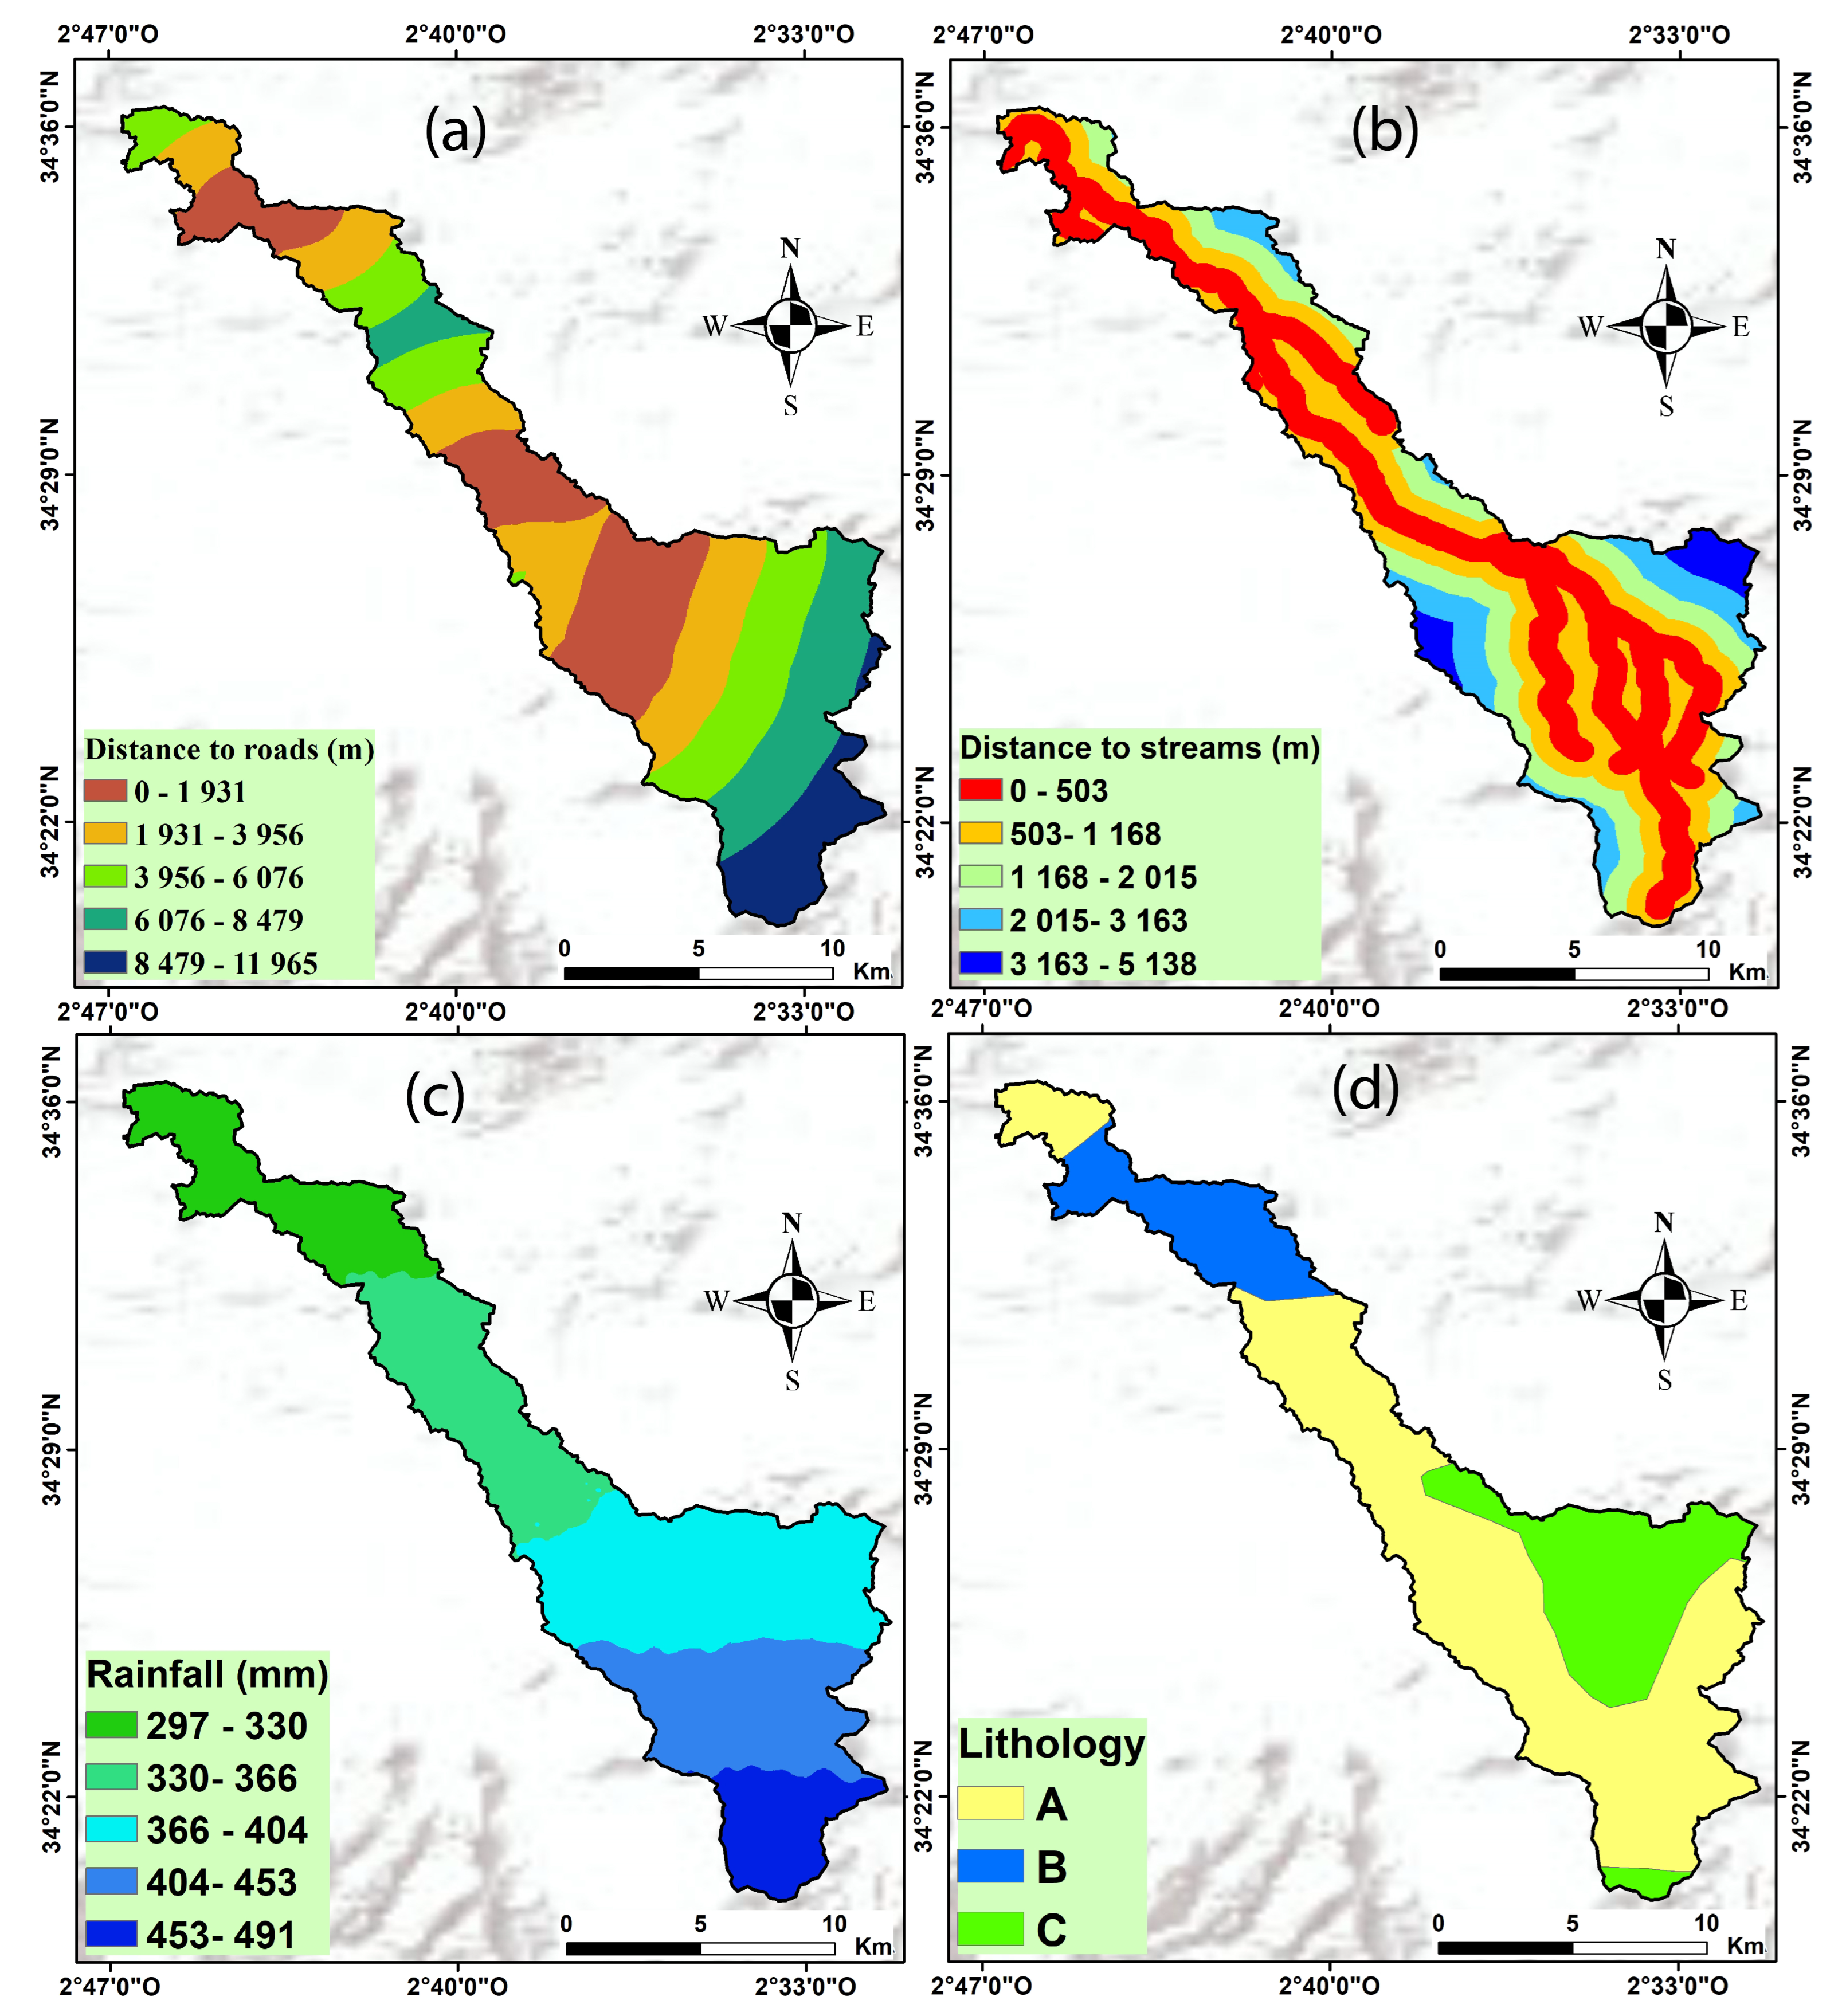
Distance from roads is an anthropogenic factor that contributes to flooding [31,32]. The distance to road buffer was generated by employing the Euclidean distance tool and was classified into five categories, i.e., 0–2393 m, 2393–4786 m, 4786–7179 m, 7179–9572 m, and 9572–11,965 m (Figure 4a).
Distance from streams represents the distance between flood zones and the river. If this distance is shorter, the probability of flooding is higher, and vice versa [33,34,35] (Figure 4b). The distance from streams in this study area was generated using the Euclidean distance tool available within the ArcGIS software (version 10.8) and then classified into five classes, i.e., 0–1027 m, 1027–2055 m, 2055–3083 m, 3083–4111 m, and 4111–5138 m.
Rainfall measures the annual rate of precipitation that falls in a given location. Precipitation represents an important factor contributing to flooding [36,37,38,39]. The rainfall map for the study area was interpolated using the Inverse Distance Weighting (IDW) tool [40] and classified into five classes using the natural breaks classification method: 297–330 mm, 330–366 mm, 366–404 mm, 404–453 mm, and 453–491 mm (Figure 4c).
Lithology is another flood conditioning factor considered in this study. The geology of the study area provides information on the lithological nature, the structures of the area, and its geometry [41]. Indeed, porous soils and rigid bedrock create a lower density of channels that stop flooding [42]. The lithostratigraphic map of the study area shows three formations: (A) Neogene and Quaternary cover, (B) Jurassic dolomites and marlstones, and (C) Jurassic dolomites and marlstones (Figure 4d).
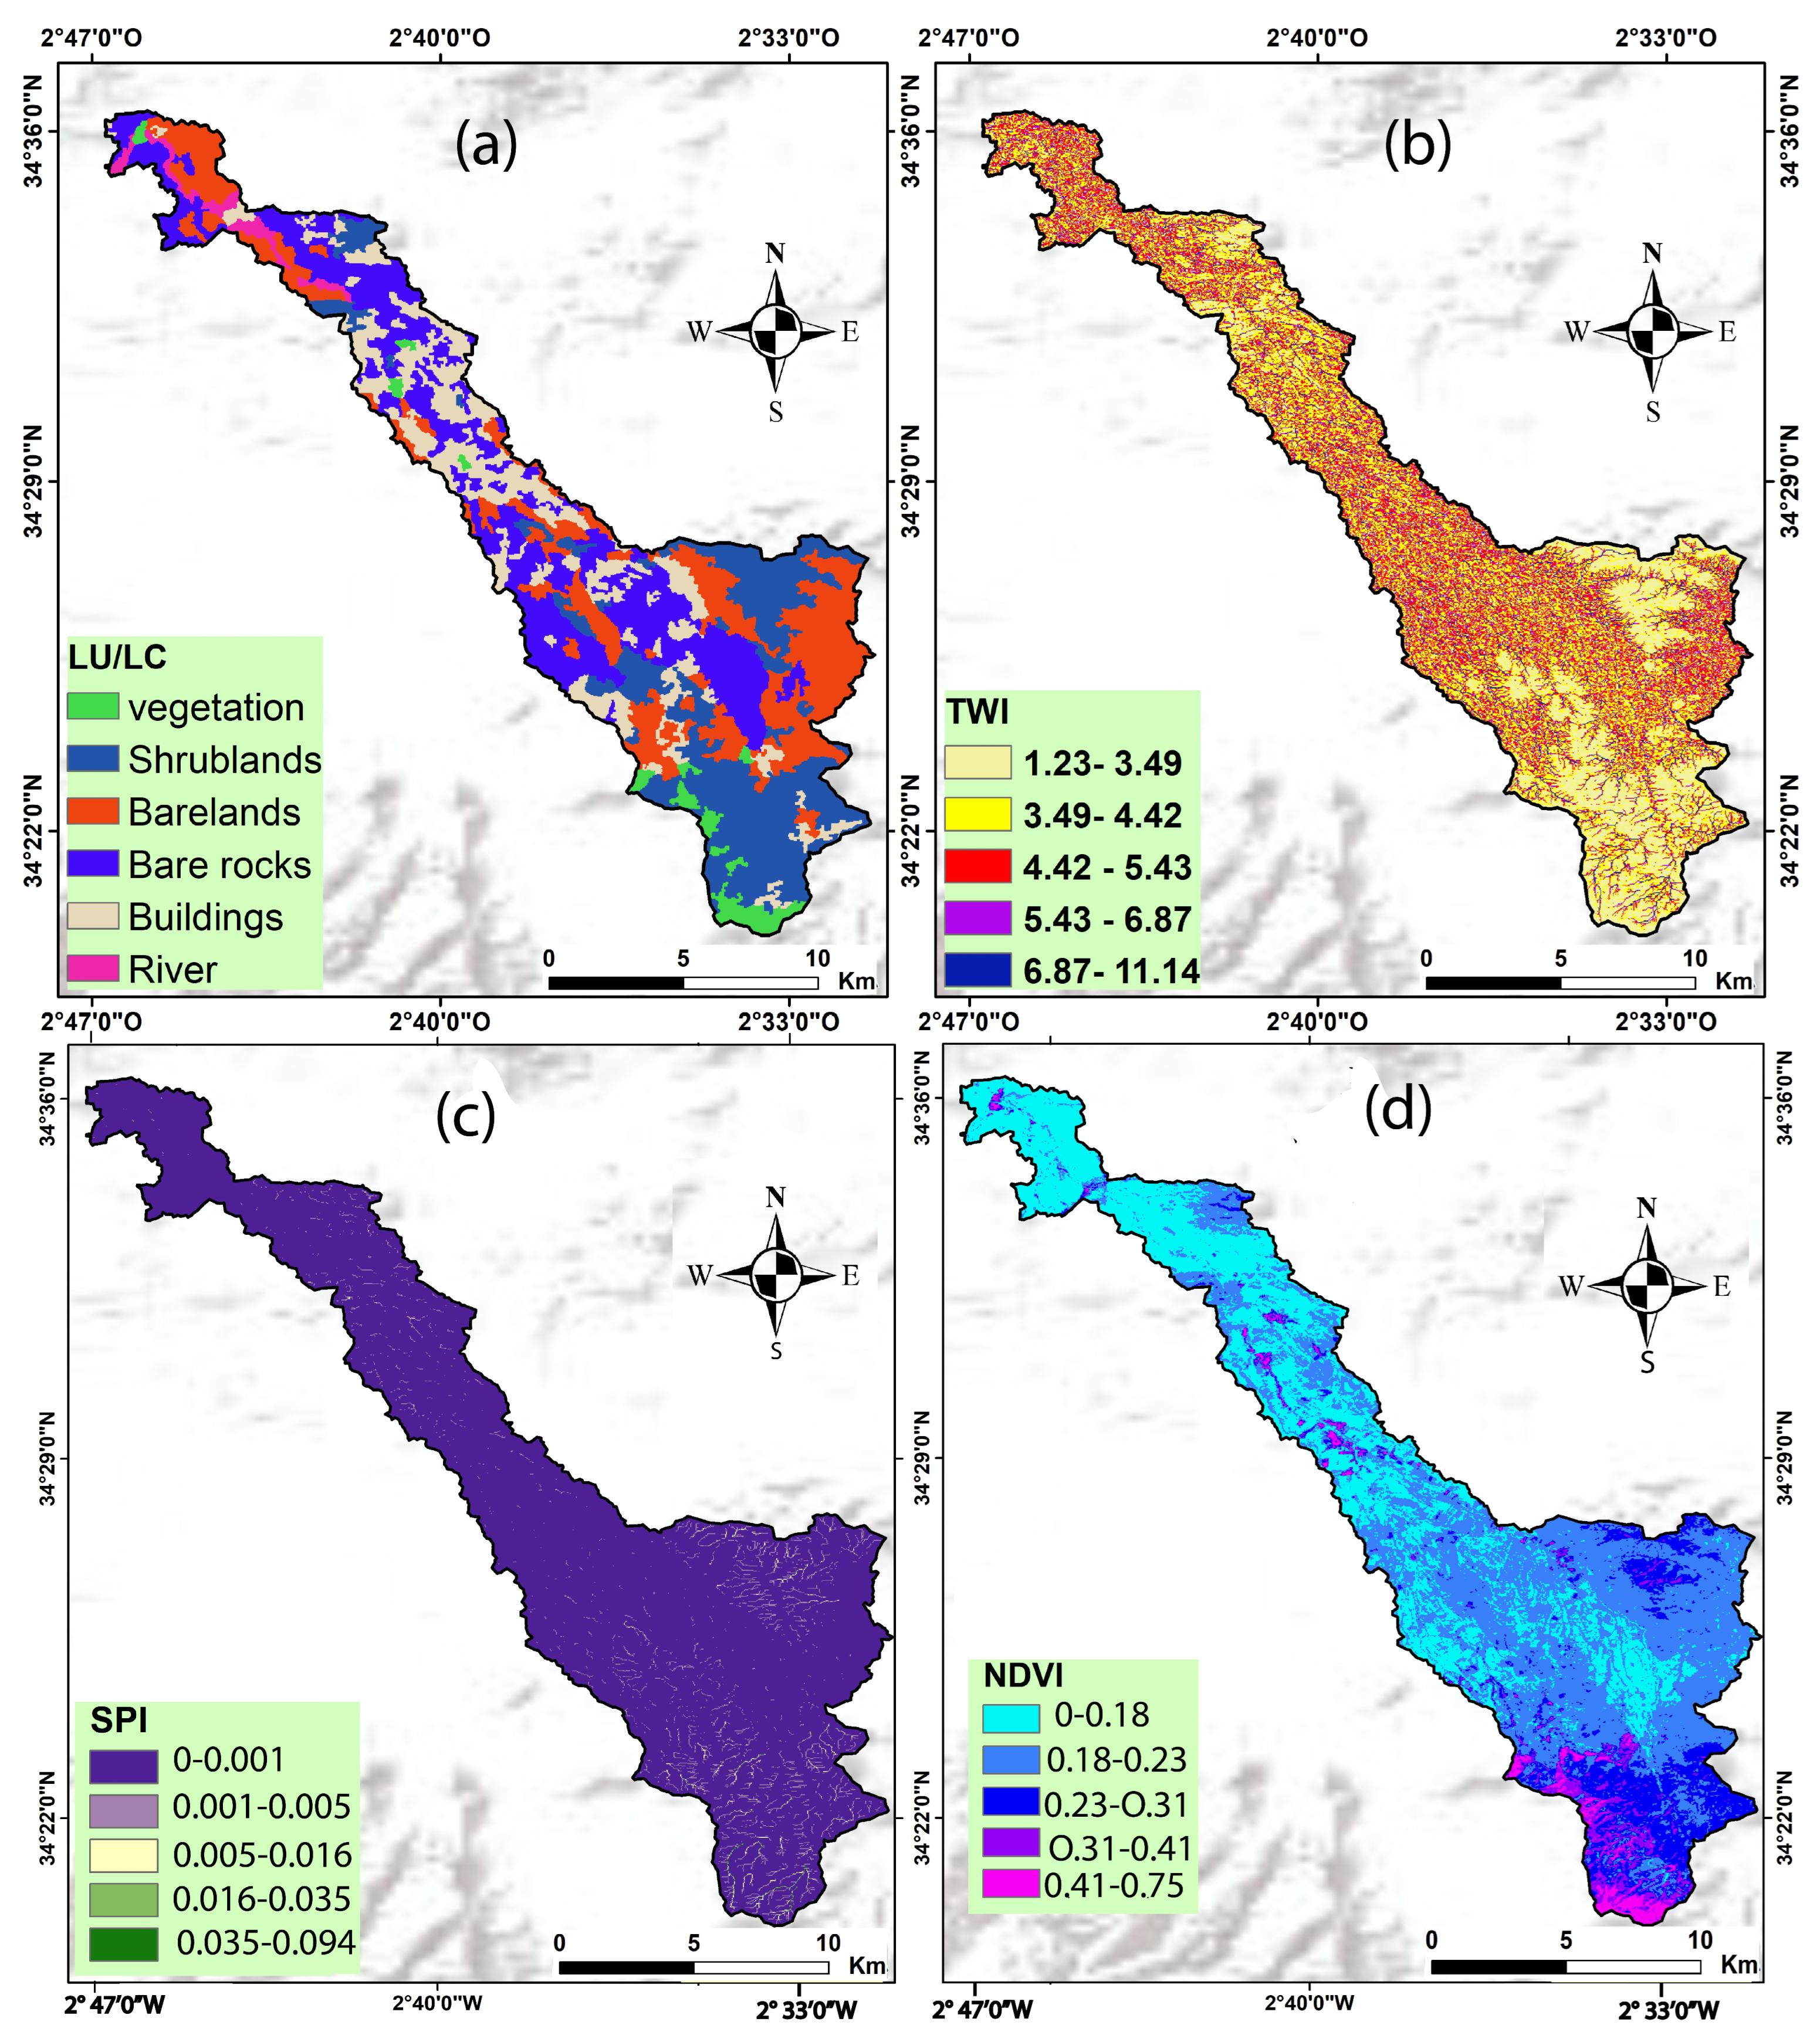
The land use/land cover (LU/LC) map, including the vegetation cover in the study area, has a significant role in the study of flood susceptibility [43]. It is commonly known that bare land contributes to flooding by increasing the potential for runoff [44]. The LU/LC of the study area was classified into six categories: vegetation, shrublands, Bare lands, Bare rocks, Buildings, and Rivers (Figure 5a).
As reported in previous studies, the topographic wetness index (TWI) is an attribute of flood occurrences. It measures the degree of moisture in a watershed under the influence of gravity [45,46]. In the present study, the TWI was calculated using the following equation [45]:
T W I = l n ( A s / t a n β )
The TWI was classified into six categories, i.e., 1.23–3.49, 3.49–4.42, 4.42–5.43, 5.43–6.87, and 6.87–11.14 (Figure 5b).
The stream power index (SPI) measures the capacity for erosion due to surface water flow [47]. It was calculated using the following equation [48], which depends on sediment transport and river channel erosion [49].
S P I = A s × t a n β
where AS is the specific area in m2/m and β is the slope angle in degrees.
The SPI was classified into five classes, i.e., 0–0.001, 0.001–0.005, 0.005–0.016, 0.016–0.035, and 0.035–0.094 (Figure 5c).
The normalized difference vegetation index (NDVI) serves as an indicator of the health status of vegetation and can control infiltration and surface runoff. Indeed, this factor contributes to flooding occurrences. The value of NDVI ranges from −1 to +1 and was calculated using the following equation [43,50]:
N D V I = N I R R e d N I R + R e d
where NIR is the reflectance in the near-infrared spectrum and RED is the reflection in the red range of the spectrum. The NDVI map was classified into five classes: 0–0.18, 0.18–0.23, 0.23–0.31, 0.31–0.41, and 0.41–0.75 (Figure 5d).

3.3. Flood Susceptibility Modeling

3.3.1. Random Forest (RF)

The RF algorithm is a popular machine learning technique that has been widely employed for flood susceptibility modeling [21]. It is an ensemble learning method that combines multiple decision trees to make predictions. Each decision tree is constructed using a random subset of the training data of features, and the final prediction is determined by taking the majority votes for classification and averaging predictions of individual trees for regression problems. This approach reduces overfitting and improves the overall accuracy and robustness of the model [51].
To run the RF algorithm, two optimized parameters should be taken into consideration [52]: the number of variables/factors to be used in each tree-building process (mtry) and the number of trees to be built in the forest to run it (ntree). In this study, the number of trees was 145, with 2 variables for the main node split. The scikit-learn package in Python version 3.9 programming language was used for random forest modeling.

3.3.2. Classification and Regression Tree (CART)

Classification and Regression Tree (CART) is a machine learning algorithm commonly used for flood susceptibility modeling [53]. CART is a decision tree-based approach that partitions the data into distinct subsets based on the values of input variables and recursively builds a binary tree structure to make predictions [54]. In flood susceptibility modeling, CART can be used for both binary classification tasks (e.g., identifying flood-prone and non-flood-prone areas) and regression tasks (e.g., predicting flood susceptibility index values) [55]. The following hyperparameters were considered in the CART model: the maximum number of splits was equal to 9, the minimum number of parent nodes was equal to 9, the minimum number of leaf nodes was equal to 7, and the smallest impurity change controlling tree growth was 0.0001.

3.3.3. Support Vector Machine (SVM)

SVM is another powerful machine learning algorithm that has been widely used for flood susceptibility modeling [21]. SVM is a binary classification algorithm that aims to find an optimal hyperplane that separates data points belonging to different classes with the largest margin [47,55]. It can also be extended for multi-class classification tasks [51]. The choice of kernel function significantly impacts the performance of Support Vector Machines (SVMs). It offers four types: the linear kernel, the radial basis function, the sigmoid kernel, and the polynomial kernel [55]. In our study, we opted for the radial basis function (RBF) kernel, widely recognized and applied in modeling natural hazards. The performance of Support Vector Machines (SVMs) with the RBF kernel depends on the values assigned to the kernel width (gamma: γ) and regularization (C) parameters. In our study, to select the optimal parameter pairs, the grid search optimization technique method was employed. Through this process, the most effective values for C and γ were identified as 0.08 and 0.1, respectively.

3.3.4. Extreme Gradient Boosting (XGBoost)

XGBoost is a popular machine learning algorithm that has gained significant attention for flood susceptibility modeling [56]. XGBoost is an optimized gradient-boosting framework that combines the predictions of multiple weak learners, such as decision trees, to create a strong ensemble model. It excels in handling complex, high-dimensional data and has been successful in various predictive modeling tasks, including flood susceptibility modeling [57].
In this research, we adopted the Bayesian optimization method to fine-tune four critical hyperparameters, namely learning rate, max_depth (maximum depth of a tree), min_child_weight (minimum sum of instance weight), and subsample (subsample ratio of the training instance). These hyperparameters have a high impact on the XGBoost model. Thus, the learning rate was set to 0.2 and the maximum depth of trees was set to 5.

3.4. Model Execution

For the modeling process, continuous variables among the conditioning variables were reclassified into five classes, guided by both expert knowledge and statistical analysis, utilizing the natural break classification method [42] using GIS tools. It is important to note that the categorical variables (i.e., lithology, land use/land cover, and aspect) were transformed into numerical ones. In order to be used as input data in the hybrid models, all conditioning factors were transformed to raster format with 30 × 30 m cell sizes and normalized between 0 and 1, as follows:
X n o r m = X X m i n X m a x X m i n
where Xnorm denotes the normalized input, X stands for the original input, and Xmin and Xmax represent the minimum and maximum values of the input ranges, respectively. The tool “Extract values from points” available in the Spatial Analyst Toolbox in the ArcGIS software (version 10.5) was used to generate CSV format files for modeling in the Python language program.
The flood-predicting dataset was prepared by merging the flood inventory map and the flood conditioning factors. As such, the final flood predicting dataset has 13 columns, with the first 12 columns representing each of the conditioning factors and the last column representing the flood inventory map (i.e., ‘1’ showing flooded areas and ‘0’ for non-flooded areas). The number of rows in the flood dataset refers to the sum of the number of flood and non-flood observation points. The total dataset was split into a ratio of 70%:30% for training and validating. Dividing the training data into 70% and 30% (or any other desired ratio) is a common practice in machine learning for creating a training set and a validation test set. One can achieve this split using various programming languages and libraries. In the present study, the ‘scikit-learn’ library in the Python console was used (i.e., train_test_split). The extraction and analysis of the flood-predicting dataset was conducted in a GIS environment using the QGIS software (Version 3.30.3).

3.5. Model Validation

Each of the four models was individually trained using the training dataset (70% of the data) while the validating dataset (30% of the data) was used to test the performance of the models. The predicted flood susceptibility maps were classified into five susceptibility classes: very low, low, moderate, high, and very high, based on Jenks natural breaks classification method. The performances of the models were evaluated using the area under the receiver’s operating characteristics curve (ROC-AUC) [49]. The training and validation of the models and their performance evaluations were carried out in the R environment.

4. Results

4.1. Flood Susceptibility Mapping

The analyses of the models applied in this study show variations in the percentages of each model. These variations depend on the degree of flood susceptibility in the area in order to identify and predict flood-prone areas.
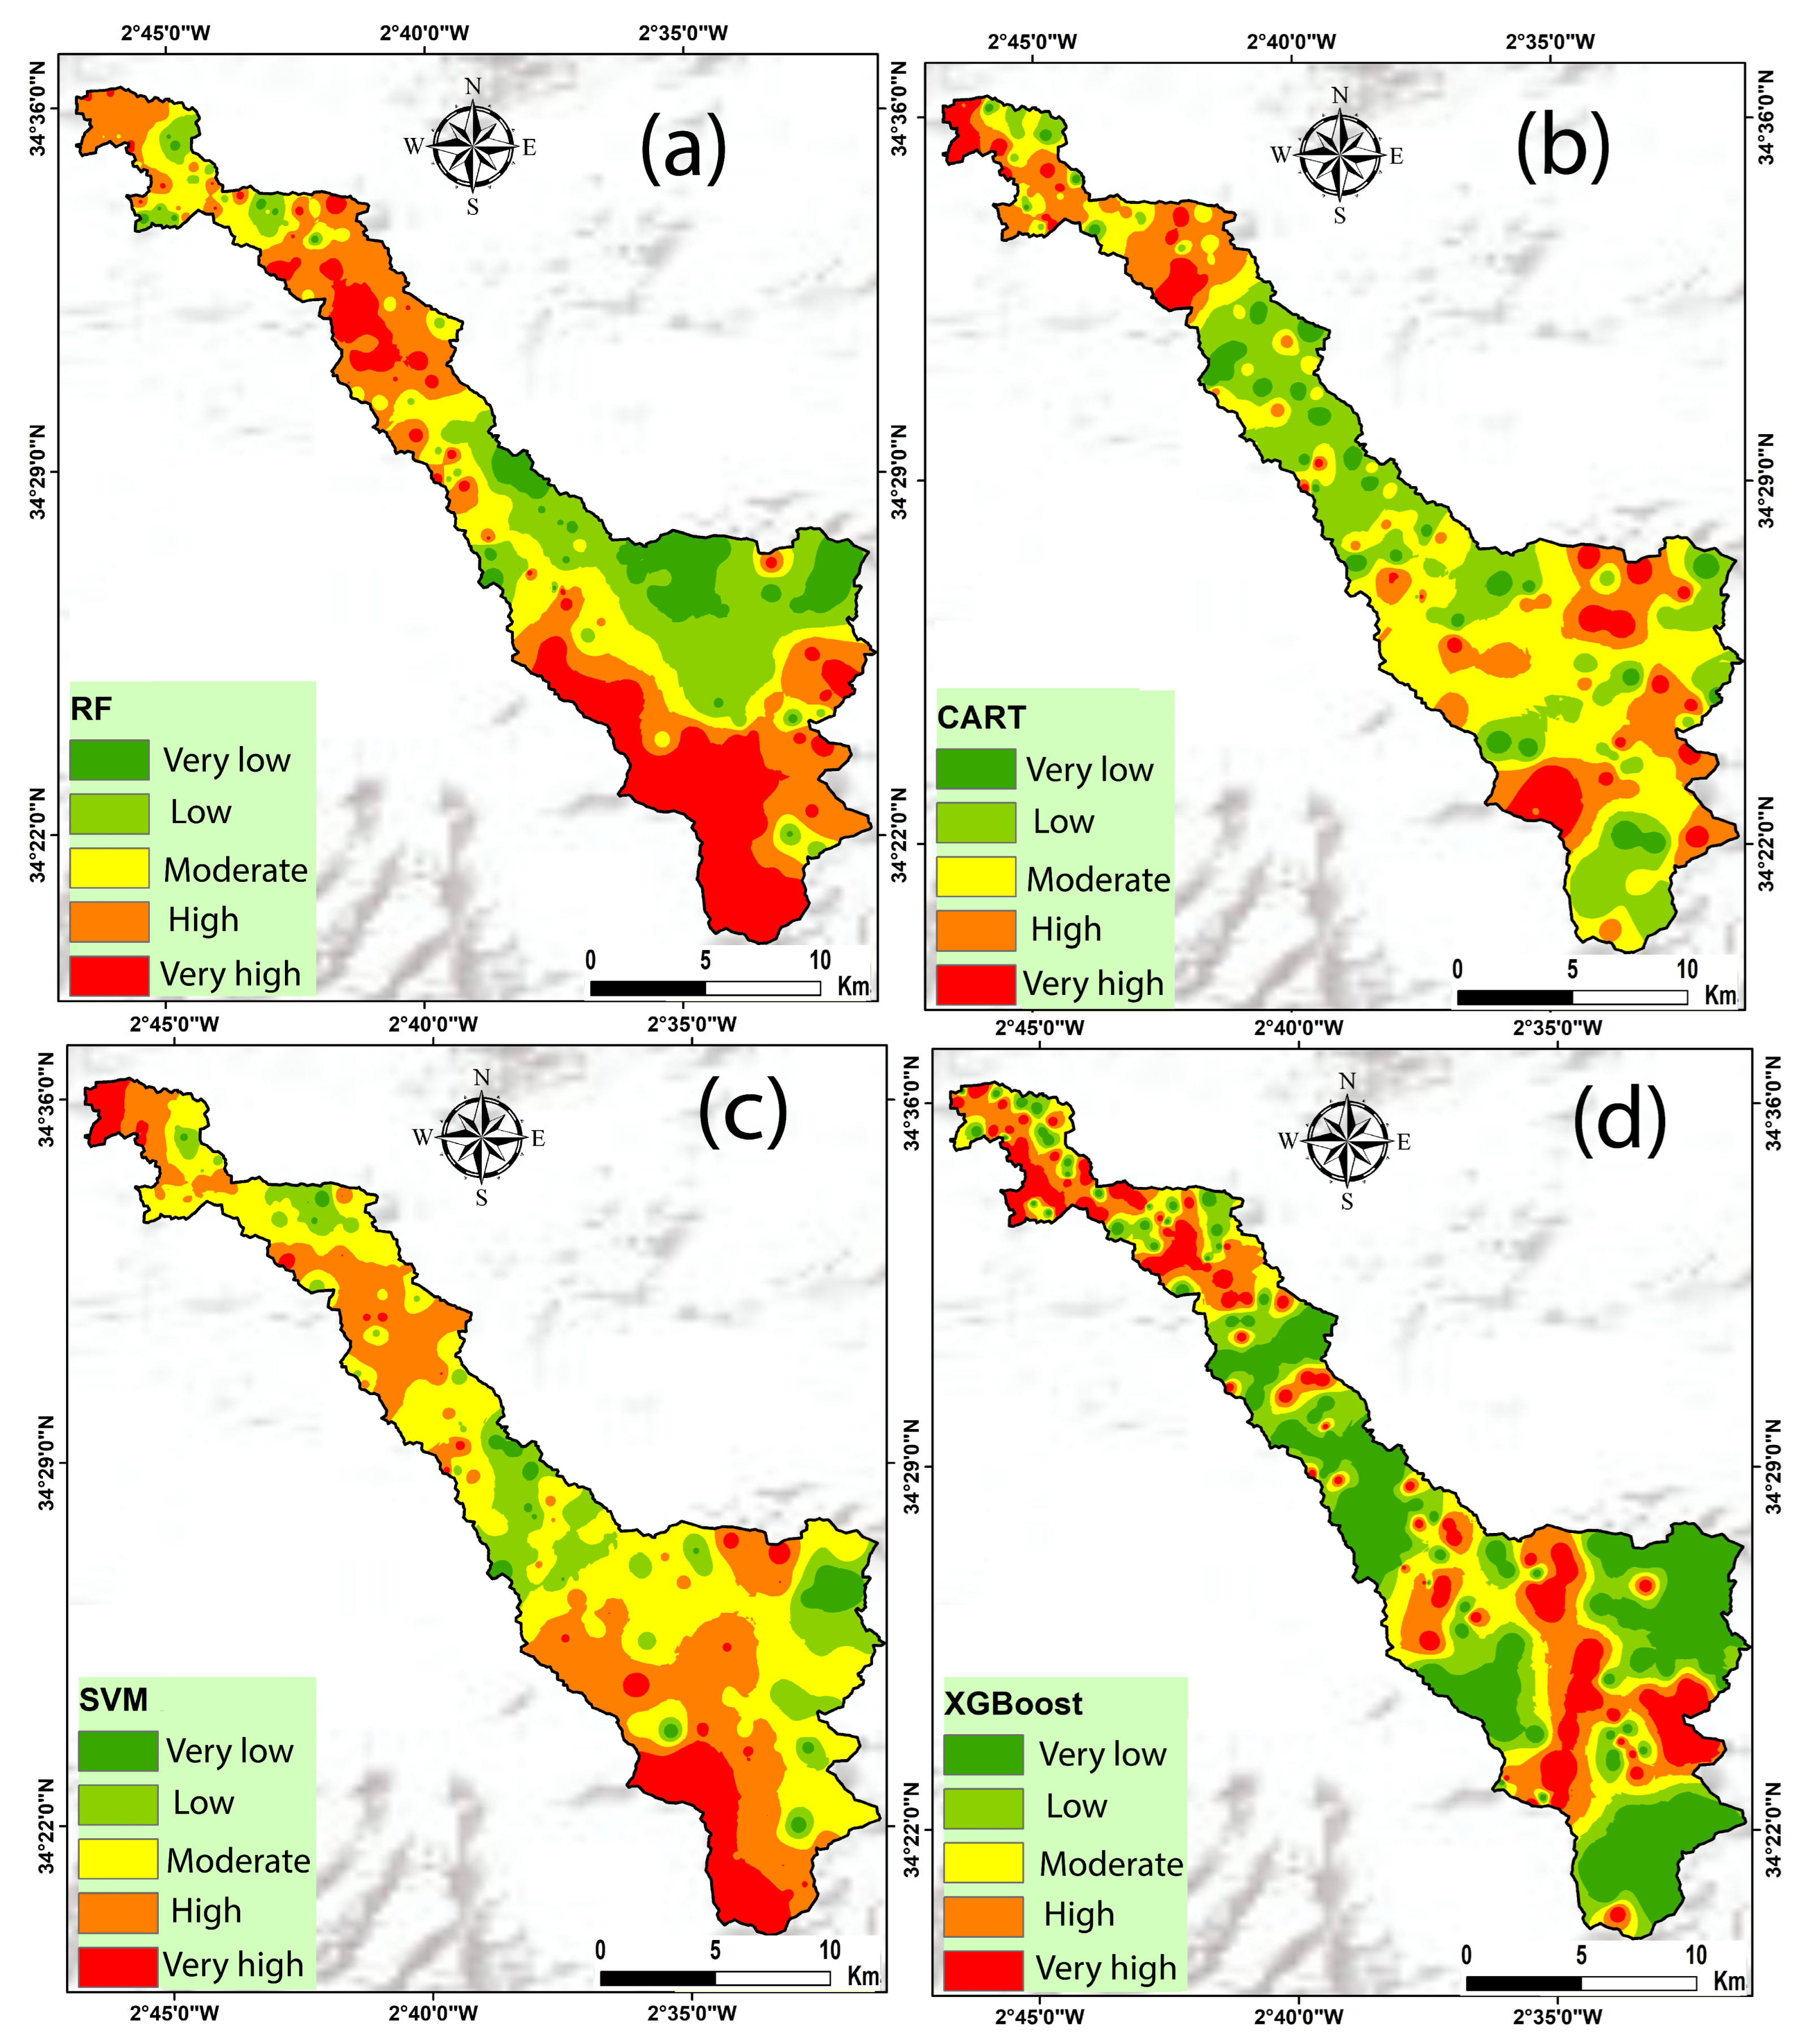
The flood susceptibility maps generated by all the models exhibited values ranging from 0.0 to 1.0 on raster maps. Each pixel was assigned a specific value indicating its susceptibility to floods. Specifically, a higher value on the scale signifies a greater susceptibility to flooding, while a lower value indicates a lower susceptibility to flooding. The generated models were classified into five susceptibility classes (Table 2 and Figure 6). These categories show the following percentages for the RF model: 22.49%, 16.02%, 12.67%, 18.10%, and 31.70%. Similarly, the very low, low, moderate, high, and very high percentage classes of the CART model were estimated as 22.88%, 35.20%, 28.72% 5.31%, and 7.90%, respectively. In addition, the flood-predicting percentage classes of the SVM model were 5.82%, 15.37%, 36.61%, 32.08%, and 10.12%, respectively, while the XGBoost model estimated 17.40%, 22.02%, 23.23%, 25.69%, and 20.66% for the very low, low, moderate, high, and very high susceptibility classes, respectively.
The results of the percentage susceptibility classes predicted by each model show that flood-prone areas in the Metlili basin are located mainly in the south-east and north-west portions of the study area. These areas follow the main course of Oued Metlili, which runs from south-east to north-west. Flood zones are characterized by a steep slope between high and low areas, which facilitates water collection during heavy rainfall. This slope also facilitates bank undercutting, where water flows easily. From a geological point of view, a comparison of these flood areas with other areas of the basin shows that the majority of these areas are made up of Quaternary and Neogene unconsolidated deposits, notably marl and sand. The lack of vegetation cover in these areas also contributes to flooding. On the other hand, the center of the study area and the non-floodable zones are characterized by very high vegetation, which stops prolonged flooding in this area.

4.2. Evaluating the Performance of Different ML Algorithms

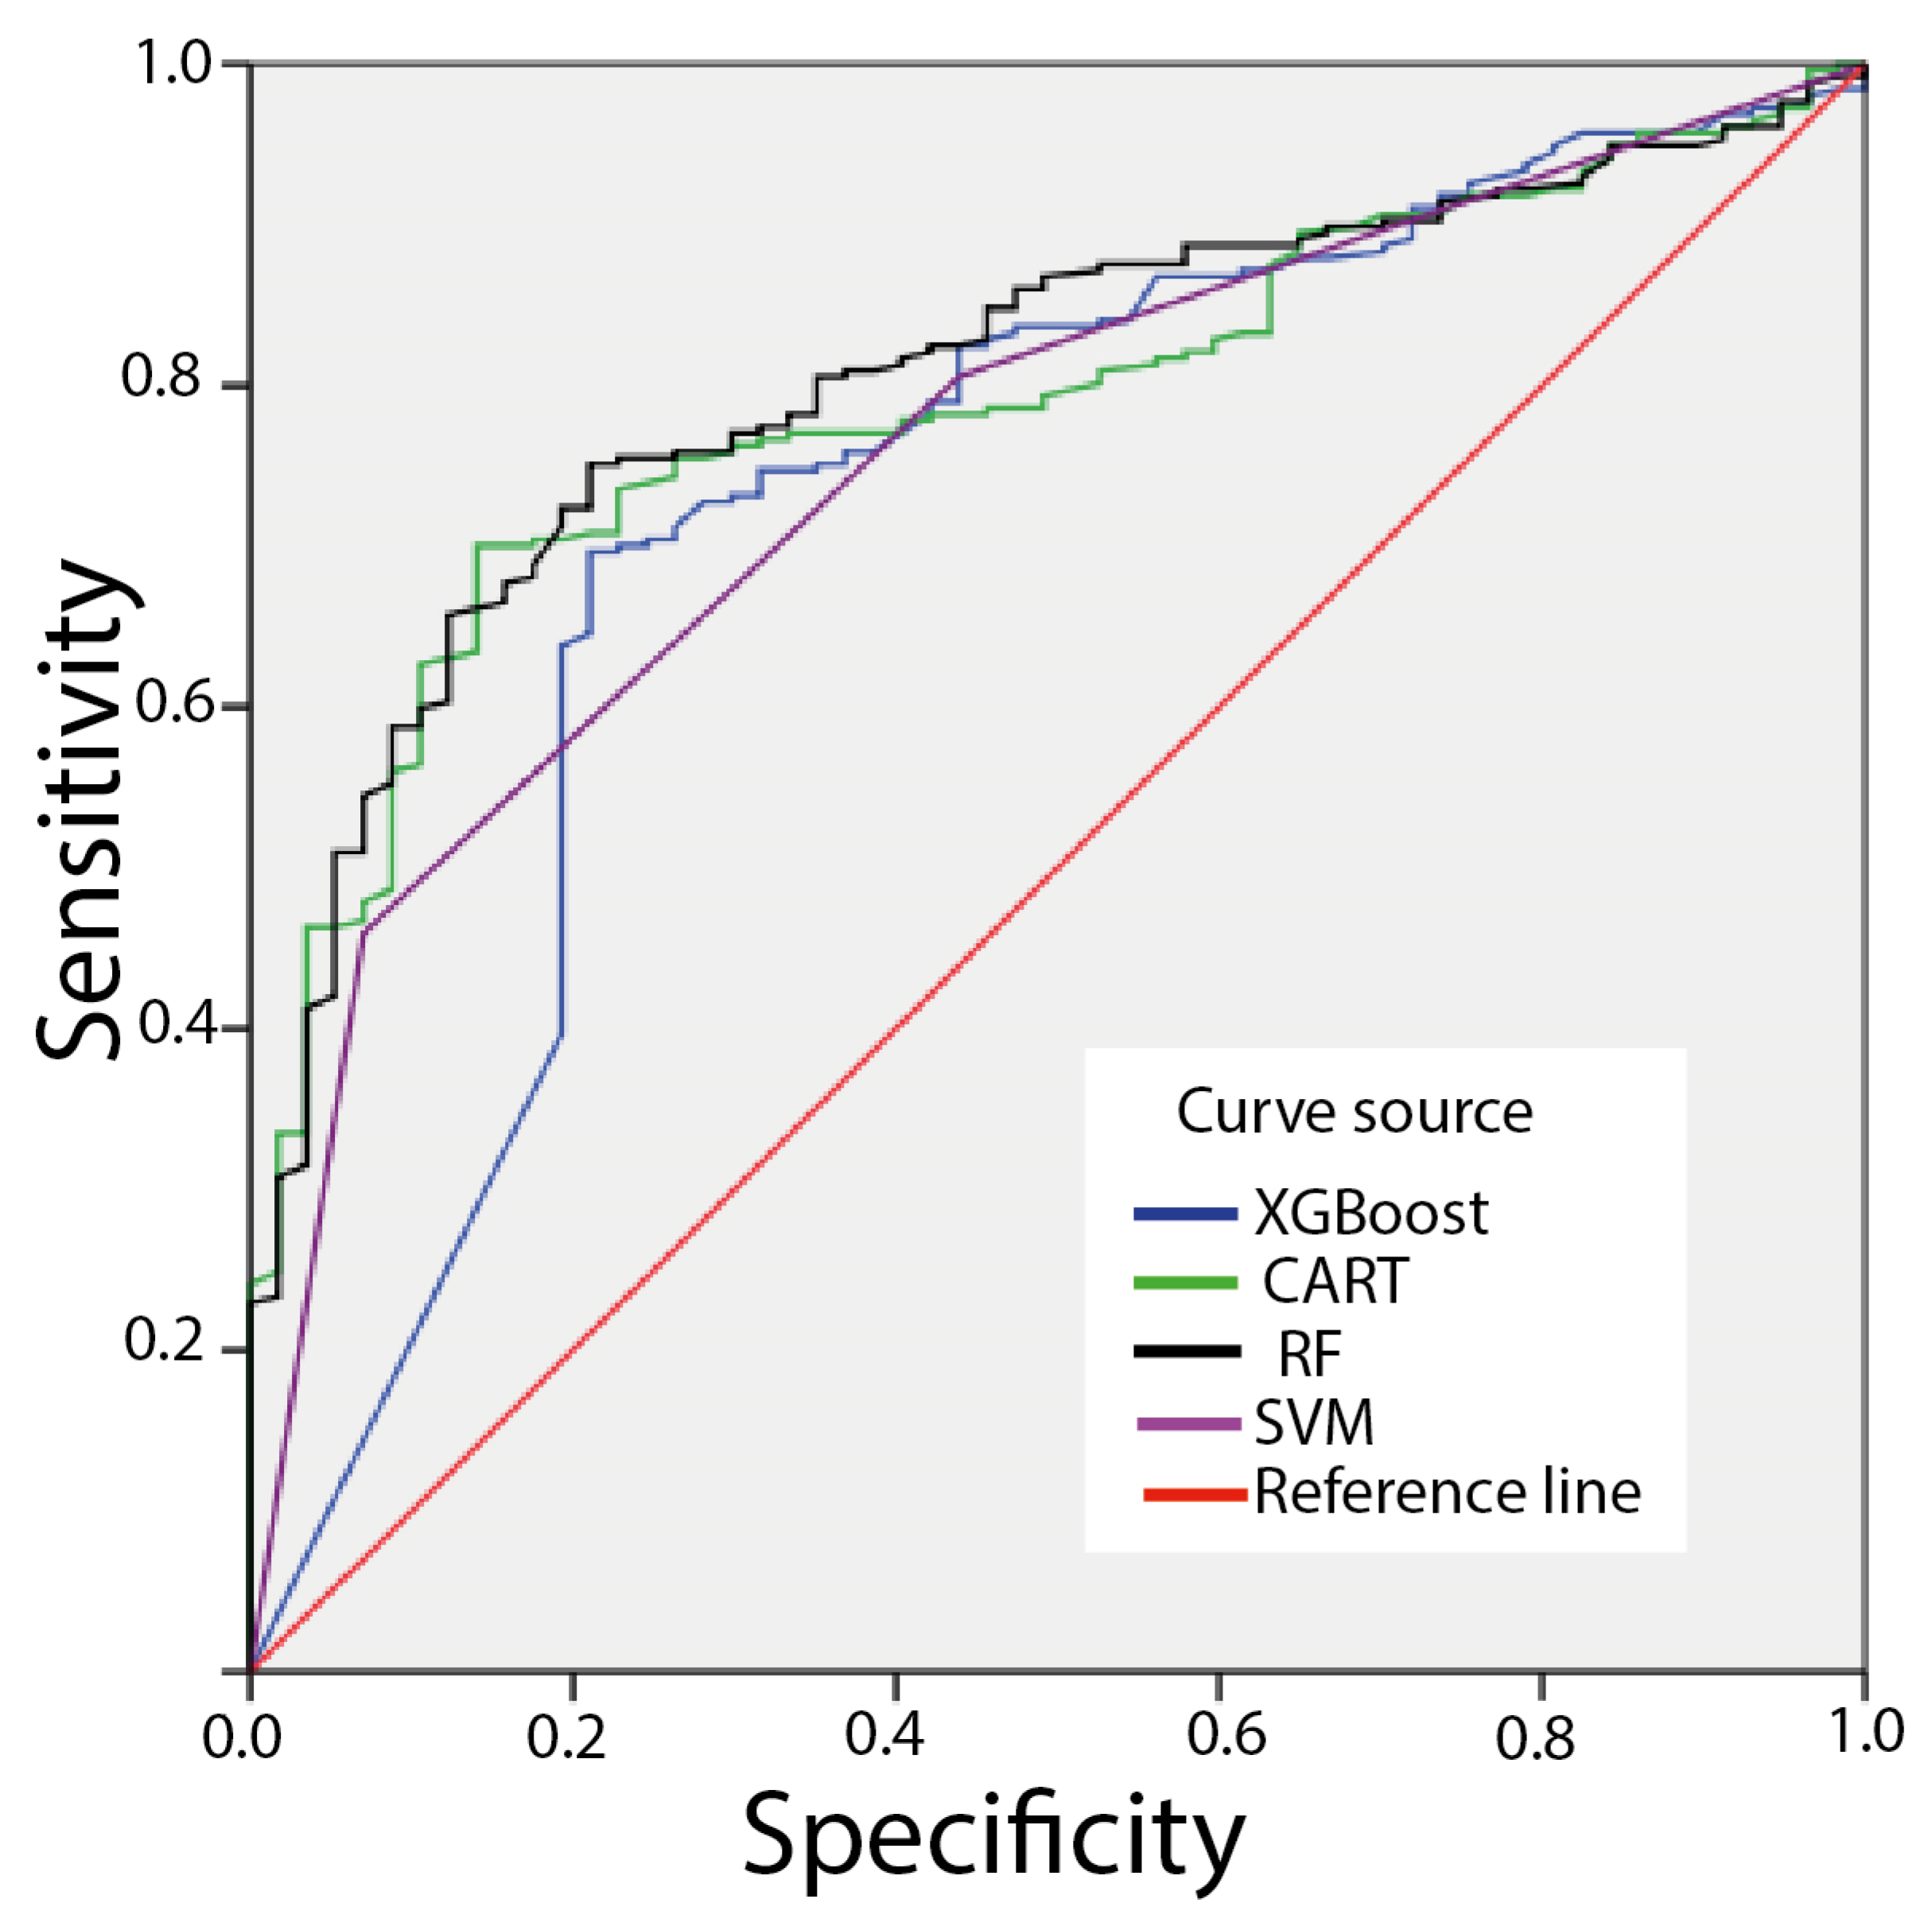
ROC curve analysis shows an asymptotic 95% confidence interval for the four models applied. The RF model was identified as the best model in this study, scoring an average AUC value of 0.807 (with confidence values varying between 0.753 and 0.860), followed by the CART model, scoring an average AUC value of 0.790 (with a confidence interval between 0.735 and 0.844). Similarly, the SVM model had an average AUC of 0.756 (with a confidence interval of between 0.692 and 0.820), while the XGBoost model had an AUC of 0.727 (with a confidence interval ranging from 0.649 to 0.805) as shown in Figure 7 and Table 3. The RF, CART, SVM, and XGBoost models had a standard error of 0.027, 0.028, 0.033, and 0.040, respectively, (Table 3). As a result, the RF model was chosen as the best model to forecast flood-prone areas. This was followed by the CART, SVM, and XGBoost models (Figure 6 and Figure 7).

5. Discussion

Floods are one of the most devastating natural disasters that impact millions of people worldwide each year [58,59,60,61]. Predicting flood susceptibility is crucial for effective disaster management and mitigation strategies. Accurate flood mapping is crucial for effective disaster management, the development of early warning systems, and resource allocation [62,63]. Traditional methods of flood mapping often rely on satellite imagery or ground-based observations, which may be limited in their coverage and timeliness [64,65]. However, recent advances in remote sensing technology, particularly radar data, coupled with machine learning algorithms, have shown great promise in enhancing flood susceptibility mapping [66,67]. The integration of radar data and machine learning techniques for flood susceptibility mapping highlights its potential benefits in enhancing flood susceptibility analysis [68,69].
Radar data, collected using spaceborne or airborne sensors, offers several advantages for flood mapping [70]. Unlike optical sensors, radar can penetrate clouds and operate under any weather conditions, enabling continuous data acquisition [71,72]. SAR is well-suited for flood monitoring because it is independent of weather conditions, can operate day and night, and provides information on surface roughness and moisture content crucial for flood analysis [73]. SAR’s ability to penetrate the Earth’s surface allows it to measure surface roughness and water content, which are crucial parameters for flood mapping [20,73].
Machine learning algorithms have emerged as powerful tools in various fields, and flood mapping is no exception. Machine learning algorithms have also gained popularity in flood susceptibility assessment due to their ability to process large datasets, extract complex patterns [43,55], and identify flood-prone areas [74,75]. Supervised learning algorithms, such as RF, SVM, CART, and XGBoost, can be trained on historical flood data and integrated with SAR data; machine learning algorithms can provide valuable insights into flood susceptibility [76,77,78].
The integration of radar data with machine learning algorithms holds immense potential for mapping flood susceptibility [79,80]. Radar data often contain noise and speckle that can affect the quality of flood mapping. Preprocessing techniques, such as speckle filtering and calibration, were used to enhance the radar images and improve accuracy [81]. Moreover, data fusion was employed to combine radar data with other complementary datasets such as elevation maps or soil moisture data [82]. In flood mapping, relevant features need to be extracted from radar images to train machine learning algorithms effectively. Features can include backscatter intensity, coherence, and texture, which provide essential information on the presence and extent of floods [79]. Once the data are preprocessed and features are extracted, machine learning models can be trained on labeled flood data. The models learn to associate certain radar image patterns with flood occurrences. The trained models are then validated using independent datasets to assess their performance and accuracy.
There are multiple benefits to using radar data and machine learning algorithms for flood mapping. Radar data, particularly from SAR sensors, offer a higher temporal resolution compared with other remote sensing methods. This enables more frequent flood monitoring and faster response times during critical flood events [83]. Unlike optical imagery, radar can penetrate clouds, making it ideal for flood mapping in regions prone to heavy cloud cover or persistent rainfall [71]. On the other hand, machine learning algorithms provide an objective and scalable approach to flood mapping [84,85,86]. Once the models are trained, they can be applied to large geographic areas, facilitating extensive flood susceptibility mapping [87,88]. Radar data can be effectively combined with other geospatial datasets, such as land-use maps, hydrological models, and historical flood records, to enhance flood susceptibility mapping.
While the combination of SAR and machine learning holds promise for flood susceptibility analysis, there are some challenges to address. (i) Data availability: high-quality radar data may not always be readily available, especially in developing regions. Additionally, access to SAR data, especially high-resolution and frequent imagery, can be limited and costly [89]. (ii) Model interpretability: some machine learning models may lack transparency, making it difficult to understand the reasoning behind their predictions. Interpretability is crucial for gaining trust in the models’ results. Additionally, some machine learning models, such as deep neural networks, are complex and challenging to interpret. The lack of interpretability can be a concern in critical decision-making processes [90]. Radar data accuracy can be affected by the terrain and urban environments, leading to errors in flood mapping. (iii) Data labeling: building a reliable dataset for training machine learning models requires expert knowledge and ground-truth data, which can be challenging to obtain in some regions. Training machine learning algorithms require a significant amount of labeled data, which may be limited, especially for rare or infrequent flood events [91].
Flood susceptibility mapping is a difficult process with many uncertainties [92]. As long as accurate historical flood inventory maps are available, machine learning techniques effectively handle these uncertainties [93]. The suggested machine learning approach offers decision-makers a less expensive and time-consuming alternative to field surveys for assessing flood risks and vulnerability. It also gives authorities advice on what extra information could be needed to develop flood maps that are more accurate for preventing additional damage. The flood susceptibility maps are thus essential tools for risk and hazard management, disaster mapping, and subsequent assessments. Our model may be used elsewhere outside of the research area.

6. Conclusions

Mapping flood susceptibility using radar data and machine learning algorithms represents a promising approach to monitoring and responding to flood events effectively. The integration of radar’s cloud-penetrating capabilities with machine learning’s data-driven modeling can lead to more accurate and timely flood susceptibility maps. While challenges exist, ongoing advancements in remote sensing technology and machine learning techniques are likely to address these limitations, making flood mapping more reliable and accessible in the future. This integration can significantly contribute to flood risk reduction, disaster preparedness, and ultimately, the protection of lives and property.
Finding all aspects of conditioning factors related to flooding is an important approach to reducing their impact and exerting control over them. We identified and mapped flood susceptibility in the Metlili watershed using SAR data. We utilized flood inventories and 12 flood conditioning parameters as model inputs. To assess and map flood susceptibility, four models (RF, CART, SVM, and XGBoost) were employed. We discovered that the predictive powers of the models were, in order of decreasing power, RF, CART, SVM, and XGBoost.
Although flood modelling is a challenging undertaking with numerous drawbacks, including issues related to the complexity of hydrological processes and the dynamic nature of environmental factors, we have shown that flood susceptibility mapping may be enhanced by machine learning techniques. Our suggested flood model is efficient, clear, and straightforward. It improves prediction accuracy by lowering the variance and noise of the training dataset. In other flood-prone areas, particularly in vast catchments where gathering data in the field is challenging and sometimes expensive, our strategy of merging SAR data with machine learning models should be examined. Machine learning approaches aid in disaster management and land-use planning by enhancing the effectiveness and accuracy of flood hazard mapping.

Author Contributions

Conceptualization, S.H. and M.M.; methodology, S.H., M.L. and M.M.; software, S.H., M.L., M.M. and A.V.; validation, S.H., S.A.A., M.M., T.A.S. and A.V.; formal analysis, S.H., M.M. and A.V.; investigation, S.H., M.M. and A.V.; resources, S.H., S.A.A., M.L., M.M. and A.V.; data curation, S.H., M.L., M.M. and A.V.; writing—original draft preparation, S.A.A., M.L., M.M., S.H., T.A.S. and G.T.; writing—review and editing, S.H., S.A.A., M.M., P.D., T.A.S., G.T. and S.K.S.; visualization, S.H., S.A.A., M.M., A.V. and T.A.S.; supervision, M.M., A.V. and P.D.; project administration, M.M., A.V. and P.D.; funding acquisition, S.A.A., M.M., A.V. and P.D. All authors have read and agreed to the published version of the manuscript.

Funding

This research received no external funding.

Data Availability Statement

The data that support the findings of this study are available from the corresponding author, Meriame Mohajane ([email protected]), on reasonable request.

Conflicts of Interest

The authors declare no conflicts of interest.

References

  1. Dodangeh, E.; Choubin, B.; Eigdir, A.N.; Nabipour, N.; Panahi, M.; Shamshirband, S.; Mosavi, A. Integrated machine learning methods with resampling algorithms for flood susceptibility prediction. Sci. Total Environ. 2020, 705, 135983. [Google Scholar] [CrossRef]
  2. Gaurav, K.; Sinha, R.; Panda, P.K. The Indus flood of 2010 in Pakistan: A perspective analysis using remote sensing data. Nat. Hazards 2011, 59, 1815–1826. [Google Scholar] [CrossRef]
  3. Kumar, A.; Houze, R.A.; Rasmussen, K.L.; Peters-Lidard, C. Simulation of a flash flooding storm at the steep edge of the Himalayas. J. Hydrometeorol. 2014, 15, 212–228. [Google Scholar] [CrossRef]
  4. O’Brien, G.R.; Kaufman, D.S.; Sharp, W.D.; Atudorei, V.; Parnell, R.A.; Crossey, L.J. Oxygen isotope composition of annually banded modern and mid-Holocene travertine and evidence of paleomonsoon floods, Grand Canyon, Arizona, USA. Quat. Res. 2006, 65, 366–379. [Google Scholar] [CrossRef]
  5. Modrick, T.M.; Georgakakos, K.P. The character and causes of flash flood occurrence changes in mountainous small basins of Southern California under projected climatic change. J. Hydrol. Reg. Stud. 2015, 3, 312–336. [Google Scholar] [CrossRef]
  6. Anusha, N.; Bharathi, B. Flood detection and flood mapping using multi-temporal synthetic aperture radar and optical data. Egypt. J. Remote Sens. Space Sci. 2020, 23, 207–219. [Google Scholar] [CrossRef]
  7. Li, J.; Chen, Y.; Wang, H.; Qin, J.; Li, J.; Chiao, S. Extending flood forecasting lead time in a large watershed by coupling WRF QPF with a distributed hydrological model. Hydrol. Earth Syst. Sci. 2017, 21, 1279–1294. [Google Scholar] [CrossRef]
  8. Hosseinpoor, H.; Samadzadegan, F. Convolutional neural network for building extraction from high-resolution remote sensing images. In Proceedings of the 2020 International Conference on Machine Vision and Image Processing (MVIP), Qom, Iran, 18–20 February 2020; pp. 1–5. [Google Scholar]
  9. Pandey, A.C.; Singh, S.K.; Nathawat, M.S. Waterlogging and flood hazards vulnerability and risk assessment in Indo Gangetic plain. Nat. Hazards 2010, 55, 273–289. [Google Scholar] [CrossRef]
  10. Kafle, K.R.; Khanal, S.N.; Dahal, R.K. Consequences of Koshi flood 2008 in terms of sedimentation characteristics and agricultural practices. Geoenviron. Disasters 2017, 4, 4. [Google Scholar] [CrossRef]
  11. Mohammadi, M.; Darabi, H.; Mirchooli, F.; Bakhshaee, A.; Torabi Haghighi, A. Flood risk mapping and crop-water loss modeling using water footprint analysis in agricultural watershed, northern Iran. Nat. Hazards 2021, 105, 2007–2025. [Google Scholar] [CrossRef]
  12. Phan, A.; Ha, D.N.; D. Man, C.; T. Nguyen, T.; Q. Bui, H.; Nguyen, T.T.N. Rapid assessment of flood inundation and damaged rice area in red river delta from sentinel 1A imagery. Remote Sens. 2019, 11, 2034. [Google Scholar] [CrossRef]
  13. Teng, J.; Jakeman, A.J.; Vaze, J.; Croke, B.F.; Dutta, D.; Kim, S. Flood inundation modelling: A review of methods, recent advances and uncertainty analysis. Environ. Model. Softw. 2017, 90, 201–216. [Google Scholar] [CrossRef]
  14. Afshari, S.; Tavakoly, A.A.; Rajib, M.A.; Zheng, X.; Follum, M.L.; Omranian, E.; Fekete, B.M. Comparison of new generation low-complexity flood inundation mapping tools with a hydrodynamic model. J. Hydrol. 2018, 556, 539–556. [Google Scholar] [CrossRef]
  15. Macchione, F.; Costabile, P.; Costanzo, C.; De Santis, R. Moving to 3-D flood hazard maps for enhancing risk communication. Environ. Model. Softw. 2019, 111, 510–522. [Google Scholar] [CrossRef]
  16. Hassija, V.; Chamola, V.; Mahapatra, A.; Singal, A.; Goel, D.; Huang, K.; Scardapane, S.; Spinelli, I.; Mahmud, M.; Hussain, A. Interpreting Black-Box Models: A Review on Explainable Artificial Intelligence. Cogn. Comput. 2023, 16, 45–74. [Google Scholar] [CrossRef]
  17. Galy, H.; Sanders, R.A. Using Synthetic Aperture Radar Imagery for Flood Modelling. Trans. GIS 2002, 6, 31–42. [Google Scholar] [CrossRef]
  18. Triet, N.V.K.; Dung, N.V.; Hoang, L.P.; Le Duy, N.; Tran, D.D.; Anh, T.T.; Kummu, M.; Merz, B.; Apel, H. Future projections of flood dynamics in the Vietnamese Mekong Delta. Sci. Total Environ. 2020, 742, 140596. [Google Scholar] [CrossRef]
  19. Penki, R.; Basina, S.; Tanniru, S. Application of Geographical Information System-Based Analytical Hierarchy Process Modeling for Flood Susceptibility Mapping of Krishna District in Andhra Pradesh. Res. Square 2022. [Google Scholar] [CrossRef] [PubMed]
  20. Sharifi, A. Flood mapping using relevance vector machine and SAR data: A case study from Aqqala, Iran. J. Indian Soc. Remote Sens. 2020, 48, 1289–1296. [Google Scholar] [CrossRef]
  21. Islam, A.R.M.T.; Talukdar, S.; Mahato, S.; Kundu, S.; Eibek, K.U.; Pham, Q.B.; Kuriqi, A.; Linh, N.T.T. Flood susceptibility modelling using advanced ensemble machine learning models. Geosci. Front. 2021, 12, 101075. [Google Scholar] [CrossRef]
  22. Ministry of Equipment, Transport, Logistics and Water, «وزارة التجهيز والماء.». Available online: https://www.equipement.gov.ma/AR/Pages/Accueil.aspx (accessed on 8 January 2024).
  23. Toufik, Z.; Farid, B.; Chourak, M.; Rachid, I. Risk of flooding of the national road N °6 at the right of crossing the wadi Asla in the region of Taourirt. Mater. Today Proc. 2021, 45, 7763–7767. [Google Scholar] [CrossRef]
  24. Fadl, M.E.; Jalhoum, M.E.M.; AbdelRahman, M.A.E.; Ali, E.A.; Zahra, W.R.; Abuzaid, A.S.; Fiorentino, C.; D’Antonio, P.; Belal, A.A.; Scopa, A. Soil Salinity Assessing and Mapping Using Several Statistical and Distribution Techniques in Arid and Semi-Arid Ecosystems, Egypt. Agronomy 2023, 13, 583. [Google Scholar] [CrossRef]
  25. Li, K.; Wu, S.; Dai, E.; Xu, Z. Flood loss analysis and quantitative risk assessment in China. Nat. Hazards 2012, 63, 737–760. [Google Scholar] [CrossRef]
  26. Nedkov, S.; Burkhard, B. Flood regulating ecosystem services—Mapping supply and demand, in the Etropole municipality, Bulgaria. Ecol. Indic. 2012, 21, 67–79. [Google Scholar] [CrossRef]
  27. Fernández, D.S.; Lutz, M.A. Urban flood hazard zoning in Tucumán Province, Argentina, using GIS and multicriteria decision analysis. Eng. Geol. 2010, 111, 90–98. [Google Scholar] [CrossRef]
  28. Mohammadi, A.; Kamran, K.V.; Al-Ansari, N. Flood detection and susceptibility mapping using sentinel-1 time series, alternating decision trees, and bag-adtree models. Complexity 2020, 2020, 4271376. [Google Scholar] [CrossRef]
  29. Yousefi, S.; Pourghasemi, H.R.; Emami, S.N.; Pouyan, S.; Tiefenbacher, J.P. A machine learning framework for multi-hazards modeling and mapping in a mountainous area. Sci. Rep. 2020, 10, 121–144. [Google Scholar] [CrossRef] [PubMed]
  30. Cardenas, M.B.; Wilson, J.L.; Zlotnik, V.A. Impact of heterogeneity, bed forms, and stream curvature on subchannel hyporheic exchange. Water Resour. Res. 2004, 40. [Google Scholar] [CrossRef]
  31. Kalantari, Z.; Nickman, A.; Lyon, S.W.; Olofsson, B.; Folkeson, L. A method for mapping flood hazard along roads. J. Environ. Manag. 2014, 133, 69–77. [Google Scholar] [CrossRef]
  32. Ngo, P.T.T.; Panahi, M.; Khosravi, K.; Ghorbanzadeh, O.; Kariminejad, N.; Cerda, A.; Lee, S. Evaluation of deep learning algorithms for national scale landslide susceptibility mapping of Iran. Geosci. Front. 2021, 12, 505–519. [Google Scholar]
  33. Aalto, R.; Maurice-Bourgoin, L.; Dunne, T.; Montgomery, D.R.; Nittrouer, C.A.; Guyot, J.-L. Episodic sediment accumulation on Amazonian flood plains influenced by El Nino/Southern Oscillation. Nature 2003, 425, 493–497. [Google Scholar] [CrossRef] [PubMed]
  34. Glenn, E.P.; Morino, K.; Nagler, P.L.; Murray, R.S.; Pearlstein, S.; Hultine, K.R. Roles of saltcedar (Tamarix spp.) and capillary rise in salinizing a non-flooding terrace on a flow-regulated desert river. J. Arid Environ. 2012, 79, 56–65. [Google Scholar] [CrossRef]
  35. Predick, K.I.; Turner, M.G. Landscape configuration and flood frequency influence invasive shrubs in floodplain forests of the Wisconsin River (USA). J. Ecol. 2008, 96, 91–102. [Google Scholar] [CrossRef]
  36. Hong, H.; Panahi, M.; Shirzadi, A.; Ma, T.; Liu, J.; Zhu, A.-X.; Chen, W.; Kougias, I.; Kazakis, N. Flood susceptibility assessment in Hengfeng area coupling adaptive neuro-fuzzy inference system with genetic algorithm and differential evolution. Sci. Total Environ. 2018, 621, 1124–1141. [Google Scholar] [CrossRef] [PubMed]
  37. Kay, A.L.; Jones, R.G.; Reynard, N.S. RCM rainfall for UK flood frequency estimation. II. Climate change results. J. Hydrol. 2006, 318, 163–172. [Google Scholar] [CrossRef]
  38. Khosravi, K.; Melesse, A.M.; Shahabi, H.; Shirzadi, A.; Chapi, K.; Hong, H. Flood susceptibility mapping at Ningdu catchment, China using bivariate and data mining techniques. In Extreme Hydrology and Climate Variability; Elsevier: Amsterdam, The Netherlands, 2019; pp. 419–434. [Google Scholar]
  39. Tien Bui, D.; Khosravi, K.; Shahabi, H.; Daggupati, P.; Adamowski, J.F.; Melesse, A.M.; Thai Pham, B.; Pourghasemi, H.R.; Mahmoudi, M.; Bahrami, S. Flood spatial modeling in northern Iran using remote sensing and gis: A comparison between evidential belief functions and its ensemble with a multivariate logistic regression model. Remote Sens. 2019, 11, 1589. [Google Scholar] [CrossRef]
  40. Elsharkawy, M.M.; Sheta, A.E.A.S.; D’Antonio, P.; Abdelwahed, M.S.; Scopa, A. Tool for the Establishment of Agro-Management Zones Using GIS Techniques for Precision Farming in Egypt. Sustainability 2022, 14, 5437. [Google Scholar] [CrossRef]
  41. Chen, W.; Pourghasemi, H.R.; Naghibi, S.A. A comparative study of landslide susceptibility maps produced using support vector machine with different kernel functions and entropy data mining models in China. Bull. Eng. Geol. Environ. 2018, 77, 647–664. [Google Scholar] [CrossRef]
  42. Wang, Y.; Hong, H.; Chen, W.; Li, S.; Panahi, M.; Khosravi, K.; Shirzadi, A.; Shahabi, H.; Panahi, S.; Costache, R. Flood susceptibility mapping in Dingnan County (China) using adaptive neuro-fuzzy inference system with biogeography based optimization and imperialistic competitive algorithm. J. Environ. Manag. 2019, 247, 712–729. [Google Scholar] [CrossRef]
  43. Mohajane, M.; Essahlaoui, A.L.I.; Oudija, F.; Hafyani, M.E.; Hmaidi, A.E.; Ouali, A.E.; Randazzo, G.; Teodoro, A.C. Land use/land cover (LULC) using landsat data series (MSS, TM, ETM+ and OLI) in Azrou Forest, in the Central Middle Atlas of Morocco. Environments 2018, 5, 131. [Google Scholar] [CrossRef]
  44. García-Ruiz, J.M.; Regüés, D.; Alvera, B.; Lana-Renault, N.; Serrano-Muela, P.; Nadal-Romero, E.; Navas, A.; Latron, J.; Martí-Bono, C.; Arnáez, J. Flood generation and sediment transport in experimental catchments affected by land use changes in the central Pyrenees. J. Hydrol. 2008, 356, 245–260. [Google Scholar] [CrossRef]
  45. Fuller, I.C. Geomorphic impacts of a 100-year flood: Kiwitea Stream, Manawatu catchment, New Zealand. Geomorphology 2008, 98, 84–95. [Google Scholar] [CrossRef]
  46. Fiorentino, C.; Donvito, A.R.; D’Antonio, P.; Lopinto, S. Experimental Methodology for Prescription Maps of Variable Rate Nitrogenous Fertilizers on Cereal Crops. In Innovative Biosystems Engineering for Sustainable Agriculture, Forestry and Food Production; Coppola, A., Di Renzo, G.C., Altieri, G., D’Antonio, P., Eds.; Lecture Notes in Civil Engineering; Springer International Publishing: Cham, Switzerland, 2020; pp. 863–872. [Google Scholar] [CrossRef]
  47. Hitouri, S.; Varasano, A.; Mohajane, M.; Ijlil, S.; Essahlaoui, N.; Ali, S.A.; Essahlaoui, A.; Pham, Q.B.; Waleed, M.; Palateerdham, S.K. Hybrid machine learning approach for gully erosion mapping susceptibility at a watershed scale. ISPRS Int. J. Geo-Inf. 2022, 11, 401. [Google Scholar] [CrossRef]
  48. Moore, I.D.; Grayson, R.B.; Ladson, A.R. Digital terrain modelling: A review of hydrological, geomorphological, and biological applications. Hydrol. Process. 1991, 5, 3–30. [Google Scholar] [CrossRef]
  49. Barker, D.M.; Lawler, D.M.; Knight, D.W.; Morris, D.G.; Davies, H.N.; Stewart, E.J. Longitudinal distributions of river flood power: The combined automated flood, elevation and stream power (CAFES) methodology. Earth Surf. Process. Landf. 2009, 34, 280–290. [Google Scholar] [CrossRef]
  50. Shahabi, H.; Ahmad, B.B.; Mokhtari, M.H.; Zadeh, M.A. Detection of urban irregular development and green space destruction using normalized difference vegetation index (NDVI), principal component analysis (PCA) and post classification methods: A case study of Saqqez city. Int. J. Phys. Sci. 2012, 7, 2587–2595. [Google Scholar]
  51. Chachondhia, P.; Shakya, A.; Kumar, G. Performance evaluation of machine learning algorithms using optical and microwave data for LULC classification. Remote Sens. Appl. Soc. Environ. 2021, 23, 100599. [Google Scholar] [CrossRef]
  52. Al-Abadi, A.M. Mapping flood susceptibility in an arid region of southern Iraq using ensemble machine learning classifiers: A comparative study. Arab. J. Geosci. 2018, 11, 218. [Google Scholar] [CrossRef]
  53. Choubin, B.; Moradi, E.; Golshan, M.; Adamowski, J.; Sajedi-Hosseini, F.; Mosavi, A. An ensemble prediction of flood susceptibility using multivariate discriminant analysis, classification and regression trees, and support vector machines. Sci. Total Environ. 2019, 651, 2087–2096. [Google Scholar] [CrossRef]
  54. Shakya, A.; Biswas, M.; Pal, M. Parametric study of convolutional neural network based remote sensing image classification. Int. J. Remote Sens. 2021, 42, 2663–2685. [Google Scholar] [CrossRef]
  55. Mohajane, M.; Costache, R.; Karimi, F.; Bao Pham, Q.; Essahlaoui, A.; Nguyen, H.; Laneve, G.; Oudija, F. Application of remote sensing and machine learning algorithms for forest fire mapping in a Mediterranean area. Ecol. Indic. 2021, 129, 107869. [Google Scholar] [CrossRef]
  56. Abedi, R.; Costache, R.; Shafizadeh-Moghadam, H.; Pham, Q.B. Flash-flood susceptibility mapping based on XGBoost, random forest and boosted regression trees. Geocarto Int. 2022, 37, 5479–5496. [Google Scholar] [CrossRef]
  57. Ehlers, M.; Klonus, S.; Rosso, P. Multi-sensor image fusion for pansharpening in remote sensing. Int. J. Image Data Fusion 2010, 1, 25–45. [Google Scholar] [CrossRef]
  58. Fawcett, T. An introduction to ROC analysis. Pattern Recognit. Lett. 2006, 27, 861–874. [Google Scholar] [CrossRef]
  59. Ali, S.A.; Parvin, F.; Pham, Q.B.; Vojtek, M.; Vojteková, J.; Costache, R.; Linh, N.T.T.; Nguyen, H.Q.; Ahmad, A.; Ghorbani, M.A. GIS-based comparative assessment of flood susceptibility mapping using hybrid multi-criteria decision-making approach, naïve Bayes tree, bivariate statistics and logistic regression: A case of Topl’a basin, Slovakia. Ecol. Indic. 2020, 117, 106620. [Google Scholar] [CrossRef]
  60. Kundzewicz, Z.W.; Su, B.; Wang, Y.; Xia, J.; Huang, J.; Jiang, T. Flood risk and its reduction in China. Adv. Water Resour. 2019, 130, 37–45. [Google Scholar] [CrossRef]
  61. Rentschler, J.; Salhab, M.; Jafino, B.A. Flood exposure and poverty in 188 countries. Nat. Commun. 2022, 13, 3527. [Google Scholar] [CrossRef]
  62. Ali, H.; Modi, P.; Mishra, V. Increased flood risk in Indian sub-continent under the warming climate. Weather Clim. Extrem. 2019, 25, 100212. [Google Scholar] [CrossRef]
  63. Gangwal, U.; Dong, S. Critical facility accessibility rapid failure early-warning detection and redundancy mapping in urban flooding. Reliab. Eng. Syst. Saf. 2022, 224, 108555. [Google Scholar] [CrossRef]
  64. Zgurovsky, M.; Yefremov, K.; Gapon, S.; Pyshnograiev, I. Modeling of Potential Flooding Zones with Geomatics Tools. In Proceedings of the 2022 IEEE 3rd International Conference on System Analysis & Intelligent Computing (SAIC), Kyiv, Ukraine, 4–7 October 2022; pp. 1–4. [Google Scholar]
  65. Hultquist, C.; Cervone, G. Integration of crowdsourced images, USGS networks, remote sensing, and a model to assess flood depth during hurricane florence. Remote Sens. 2020, 12, 834. [Google Scholar] [CrossRef]
  66. Ekpetere, K.; Abdelkader, M.; Ishaya, S.; Makwe, E.; Ekpetere, P. Integrating Satellite Imagery and Ground-Based Measurements with a Machine Learning Model for Monitoring Lake Dynamics over a Semi-Arid Region. Hydrology 2023, 10, 78. [Google Scholar] [CrossRef]
  67. Scotti, V.; Giannini, M.; Cioffi, F. Enhanced flood mapping using synthetic aperture radar (SAR) images, hydraulic modelling, and social media: A case study of Hurricane Harvey (Houston, TX). J. Flood Risk Manag. 2020, 13, e12647. [Google Scholar] [CrossRef]
  68. Kumar, V.; Azamathulla, H.M.; Sharma, K.V.; Mehta, D.J.; Maharaj, K.T. The state of the art in deep learning applications, challenges, and future prospects: A comprehensive review of flood forecasting and management. Sustainability 2023, 15, 10543. [Google Scholar] [CrossRef]
  69. Kumar, V.; Sharma, K.V.; Caloiero, T.; Mehta, D.J.; Singh, K. Comprehensive overview of flood modeling approaches: A review of recent advances. Hydrology 2023, 10, 141. [Google Scholar] [CrossRef]
  70. Riazi, M.; Khosravi, K.; Shahedi, K.; Ahmad, S.; Jun, C.; Bateni, S.M.; Kazakis, N. Enhancing flood susceptibility modeling using multi-temporal SAR images, CHIRPS data, and hybrid machine learning algorithms. Sci. Total Environ. 2023, 871, 162066. [Google Scholar] [CrossRef] [PubMed]
  71. El Yacoubi, Y.; Wahbi, M.; Maatouk, M.; El Kharki, O.; Boulaassal, H.; Alaoui, O.Y. Towards Time Series Sensor Data to Accurately Map Flood Hazard and Assess Damages under Climate Change Using Google Earth Engine Cloud Platform and GIS–Case of the Cities of Tetouan and Casablanca (Morocco). Ecol Eng. 2023, 5, 238–253. [Google Scholar] [CrossRef]
  72. Ivan Ulloa, N.; Chiang, S.-H.; Yun, S.-H. Flood proxy mapping with normalized difference sigma-naught index and Shannon’s entropy. Remote Sens. 2020, 12, 1384. [Google Scholar] [CrossRef]
  73. Agnihotri, A.K.; Ohri, A.; Gaur, S.; Shivam; Das, N.; Mishra, S. Flood inundation mapping and monitoring using SAR data and its impact on Ramganga River in Ganga basin. Environ. Monit. Assess. 2019, 191, 760. [Google Scholar] [CrossRef]
  74. Bentivoglio, R.; Isufi, E.; Jonkman, S.N.; Taormina, R. Deep learning methods for flood mapping: A review of existing applications and future research directions. Hydrol. Earth Syst. Sci. 2022, 26, 4345–4378. [Google Scholar] [CrossRef]
  75. Tehrany, M.S.; Jones, S.; Shabani, F. Identifying the essential flood conditioning factors for flood prone area mapping using machine learning techniques. Catena 2019, 175, 174–192. [Google Scholar] [CrossRef]
  76. Ahmadlou, M.; Ebrahimian Ghajari, Y.; Karimi, M. Enhanced classification and regression tree (CART) by genetic algorithm (GA) and grid search (GS) for flood susceptibility mapping and assessment. Geocarto Int. 2022, 37, 13638–13657. [Google Scholar] [CrossRef]
  77. Dwiasnati, S.; Devianto, Y. Optimization of Flood Prediction using SVM Algorithm to determine Flood Prone Areas. J. Syst. Eng. Inf. Technol. JOSEIT 2022, 1, 40–46. [Google Scholar] [CrossRef]
  78. Sanders, W.; Li, D.; Li, W.; Fang, Z.N. Data-driven flood alert system (FAS) using extreme gradient boosting (XGBoost) to forecast flood stages. Water 2022, 14, 747. [Google Scholar] [CrossRef]
  79. Jiang, X.; Liang, S.; He, X.; Ziegler, A.D.; Lin, P.; Pan, M.; Wang, D.; Zou, J.; Hao, D.; Mao, G. Rapid and large-scale mapping of flood inundation via integrating spaceborne synthetic aperture radar imagery with unsupervised deep learning. ISPRS J. Photogramm. Remote Sens. 2021, 178, 36–50. [Google Scholar] [CrossRef]
  80. Ramayanti, S.; Nur, A.S.; Syifa, M.; Panahi, M.; Achmad, A.R.; Park, S.; Lee, C.-W. Performance comparison of two deep learning models for flood susceptibility map in Beira area, Mozambique. Egypt. J. Remote Sens. Space Sci. 2022, 25, 1025–1036. [Google Scholar] [CrossRef]
  81. Dong, Z.; Wang, G.; Amankwah, S.O.Y.; Wei, X.; Hu, Y.; Feng, A. Monitoring the summer flooding in the Poyang Lake area of China in 2020 based on Sentinel-1 data and multiple convolutional neural networks. Int. J. Appl. Earth Obs. Geoinf. 2021, 102, 102400. [Google Scholar] [CrossRef]
  82. Tanim, A.H.; McRae, C.B.; Tavakol-Davani, H.; Goharian, E. Flood detection in urban areas using satellite imagery and machine learning. Water 2022, 14, 1140. [Google Scholar] [CrossRef]
  83. DeVries, B.; Huang, C.; Armston, J.; Huang, W.; Jones, J.W.; Lang, M.W. Rapid and robust monitoring of flood events using Sentinel-1 and Landsat data on the Google Earth Engine. Remote Sens. Environ. 2020, 240, 111664. [Google Scholar] [CrossRef]
  84. Costache, R.; Pham, Q.B.; Arabameri, A.; Diaconu, D.C.; Costache, I.; Crăciun, A.; Ciobotaru, N.; Pandey, M.; Arora, A.; Ali, S.A. Flash-flood propagation susceptibility estimation using weights of evidence and their novel ensembles with multicriteria decision making and machine learning. Geocarto Int. 2022, 37, 8361–8393. [Google Scholar] [CrossRef]
  85. Parvin, F.; Ali, S.A.; Calka, B.; Bielecka, E.; Linh, N.T.T.; Pham, Q.B. Urban flood vulnerability assessment in a densely urbanized city using multi-factor analysis and machine learning algorithms. Theor. Appl. Climatol. 2022, 149, 639–659. [Google Scholar] [CrossRef]
  86. Pham, Q.B.; Ali, S.A.; Bielecka, E.; Calka, B.; Orych, A.; Parvin, F.; Łupikasza, E. Flood vulnerability and buildings’ flood exposure assessment in a densely urbanised city: Comparative analysis of three scenarios using a neural network approach. Nat. Hazards 2022, 113, 1043–1081. [Google Scholar] [CrossRef]
  87. Abu El-Magd, S.A.; Orabi, H.O.; Ali, S.A.; Parvin, F.; Pham, Q.B. An integrated approach for evaluating the flash flood risk and potential erosion using the hydrologic indices and morpho-tectonic parameters. Environ. Earth Sci. 2021, 80, 694. [Google Scholar] [CrossRef]
  88. Shahiri Tabarestani, E.; Hadian, S.; Pham, Q.B.; Ali, S.A.; Phung, D.T. Flood potential mapping by integrating the bivariate statistics, multi-criteria decision-making, and machine learning techniques. Stoch. Environ. Res. Risk Assess. 2023, 37, 1415–1430. [Google Scholar] [CrossRef]
  89. Al-Hinai, H.; Abdalla, R. Mapping coastal flood susceptible areas using shannon’s entropy model: The case of muscat governorate, Oman. ISPRS Int. J. Geo-Inf. 2021, 10, 252. [Google Scholar] [CrossRef]
  90. Borch, C.; Hee Min, B. Toward a sociology of machine learning explainability: Human–machine interaction in deep neural network-based automated trading. Big Data Soc. 2022, 9, 20539517221111361. [Google Scholar] [CrossRef]
  91. Fidan, E.; Gray, J.; Doll, B.; Nelson, N.G. Machine learning approach for modeling daily pluvial flood dynamics in agricultural landscapes. Environ. Model. Softw. 2023, 167, 105758. [Google Scholar] [CrossRef]
  92. Liu, W.; Carling, P.A.; Hu, K.; Wang, H.; Zhou, Z.; Zhou, L.; Liu, D.; Lai, Z.; Zhang, X. Outburst floods in China: A review. Earth-Sci. Rev. 2019, 197, 102895. [Google Scholar] [CrossRef]
  93. Janizadeh, S.; Avand, M.; Jaafari, A.; Phong, T.V.; Bayat, M.; Ahmadisharaf, E.; Prakash, I.; Pham, B.T.; Lee, S. Prediction success of machine learning methods for flash flood susceptibility mapping in the Tafresh watershed, Iran. Sustainability 2019, 11, 5426. [Google Scholar] [CrossRef]
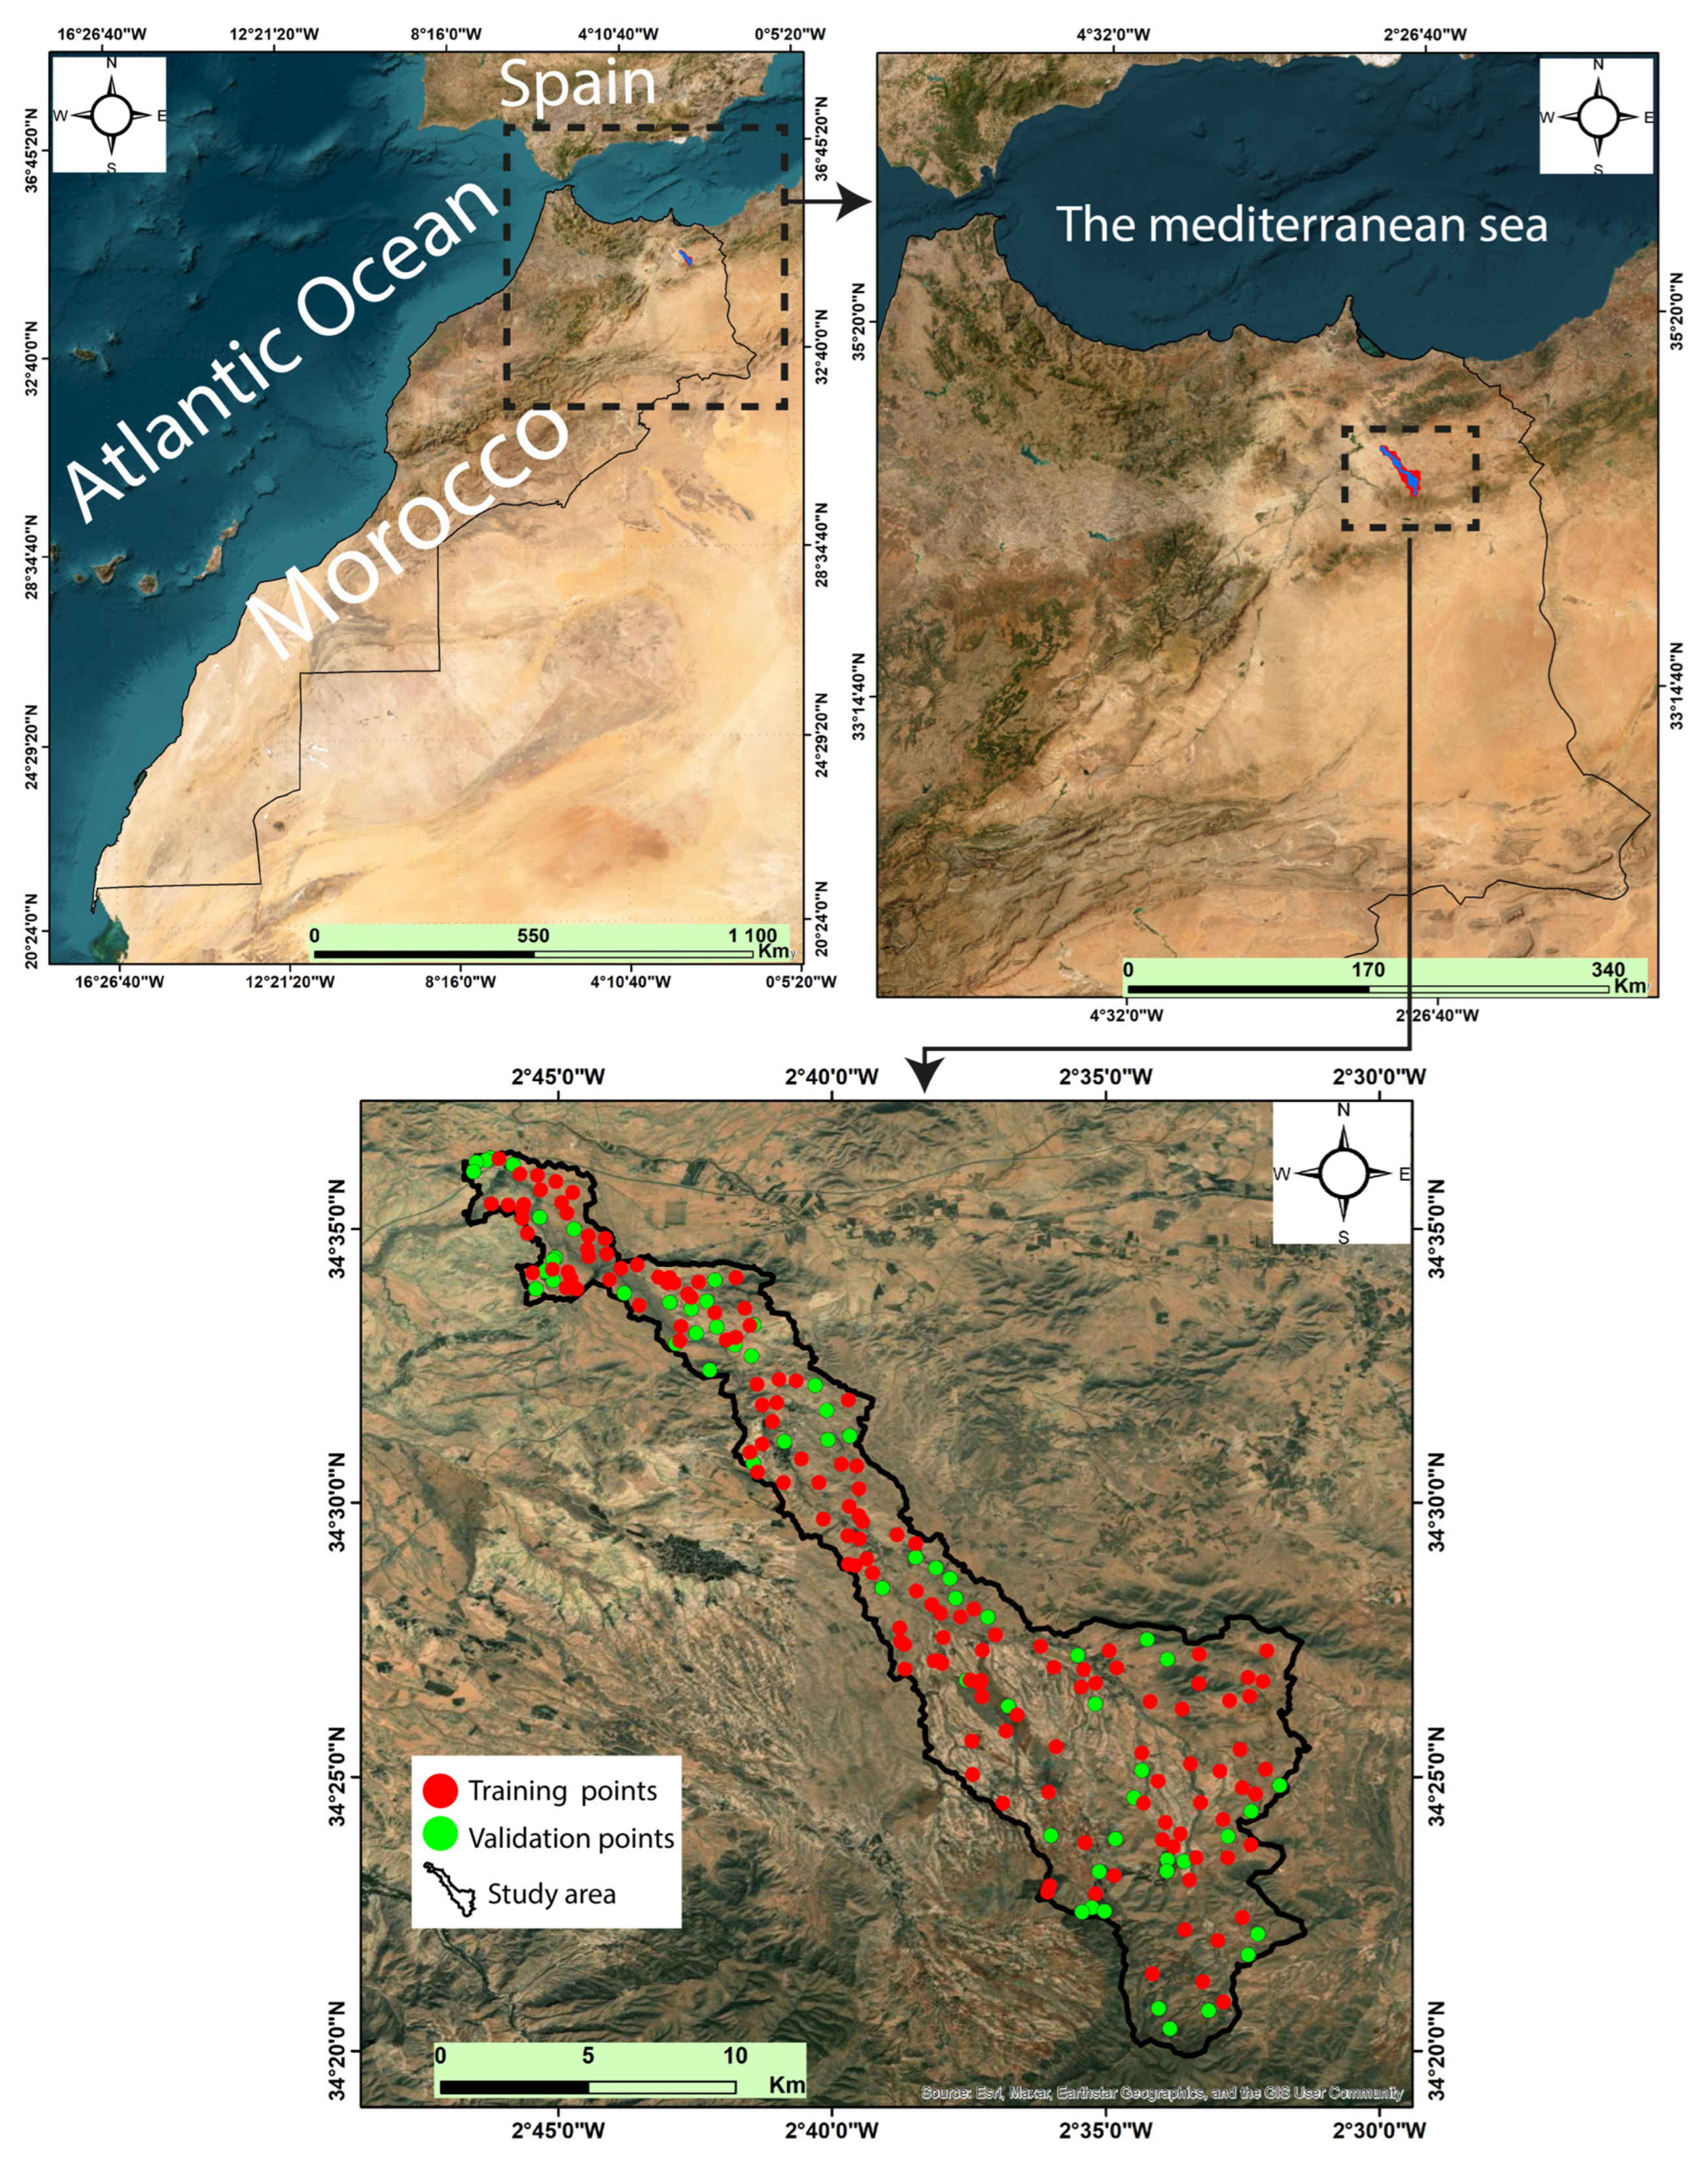
Figure 1. Location of the study area.
Remotesensing 16 00858 g001
Figure 2. Flow chart of the methodology.
Remotesensing 16 00858 g002
Figure 3. Flood conditioning factors: (a) Elevation, (b) Aspect, (c) Slope, (d) Plan curvature.
Remotesensing 16 00858 g003
Figure 4. Flood conditioning factors: (a) Distance to roads, (b) Distance to streams, (c) Rainfall, (d) Lithology.
Remotesensing 16 00858 g004
Figure 5. Flood conditioning factors: (a) LU/LC, (b) topographic wetness index (TWI), (c) stream power index (SPI), and (d) normalized difference vegetation index (NDVI).
Remotesensing 16 00858 g005
Figure 6. Flood-susceptibility maps generated using machine learning models: (a) Random Forest (RF), (b) Classification and Regression Tree (CART), (c) Support Vector Machine (SVM), and (d) Extreme Gradient Boosting (XGBoost) models.
Remotesensing 16 00858 g006
Figure 7. Validation assessment of the models using ROC curves and AUC analysis.
Remotesensing 16 00858 g007
Table 1. Data sources used in this study.
DataData Types in GISScaleSource
Flood inventoryPolygon_SAR data and previous events
ElevationGrid30 × 30 mDEM 30 m, from
https://earthexplorer.usgs.gov/
(accessed on 12 July 2022)
AspectGrid30 × 30 mDEM 30 m, from
https://earthexplorer.usgs.gov/
(accessed on 12 July 2022)
SlopeGrid30 × 30 mDEM 30 m, from
https://earthexplorer.usgs.gov/
(accessed on 12 July 2022)
Plan curvatureGrid30 × 30 mDEM 30 m, from
https://earthexplorer.usgs.gov/
(accessed on 12 July 2022)
TWIGrid30 × 30 mDEM 30 m, from
https://earthexplorer.usgs.gov/
(accessed on 12 July 2022)
RainfallGrid30 × 30 mERA-Interim, from
https://apps.ecmwf.int/datasets
(accessed on 15 July 2022)
NDVIGrid30 × 30 mLandsat-8-OLI image, from https://earthexplorer.usgs.gov/
(accessed on 12 July 2022)
LithologyPolygon-Geological map of Morocco at a scale of 1:000,000
RoadsPolygon-https://www.geojamal.com (accessed on 12 July 2022)
StreamsPolygon-https://geossc.ma (accessed on 12 July 2022)
Land use/land coverPolygon-Landsat-8-OLI image, from https://earthexplorer.usgs.gov/
(accessed on 12 July 2022)
Table 2. Percentages of gully erosion susceptibility classes.
Models
Susceptibility ClassesRF CARTSVMXGBoost
Very low (%)22.4922.885.8217.40
Low (%)16.0235.2015.3722.02
Moderate (%)12.6728.7236.6123.23
High (%)18.105.3132.0825.69
Very high (%)31.707.9010.1220.66
Table 3. Area under the curve (AUC) of models run on the validation dataset.
ModelsAUCStd. Error Asymptotic Sig.Asymptotic 95% Confidence Interval
Lower BoundUpper Bound
RF0.8070.0270.0000.7530.860
CART0.7900.0280.0000.7350.844
SVM0.7560.0330.0000.6920.820
XGBoost0.7270.0400.0000.6490.805
Disclaimer/Publisher’s Note: The statements, opinions and data contained in all publications are solely those of the individual author(s) and contributor(s) and not of MDPI and/or the editor(s). MDPI and/or the editor(s) disclaim responsibility for any injury to people or property resulting from any ideas, methods, instructions or products referred to in the content.