Article

Mapping and Monitoring of the Invasive Species Dichrostachys cinerea (Marabú) in Central Cuba Using Landsat Imagery and Machine Learning (1994–2022)

by
Alexey Valero-Jorge
1,2,
Roberto González-De Zayas
3,4,
Felipe Matos-Pupo
2,
Angel Luis Becerra-González
5 and
Flor Álvarez-Taboada
6,*
1
Department of Agrarian, Forest and Environmental Systems, Agri-Food Research and Technology Centre of Aragon (CITA), 50059 Zaragoza, Spain
2
Provincial Meteorological Centre of Ciego de Ávila, Institute of Meteorology, Avenida de los Deportes S/N, Ciego de Ávila 65100, Cuba
3
Department of Hydraulic Engineering, Faculty of Technical Sciences, Universidad de Ciego de Ávila, Ciego de Ávila 65100, Cuba
4
Centre for Geomatic, Environmental and Marine Estudies (GEOMAR), Ciudad de México 11560, Mexico
5
Moron Geodesy and Cadaster Facility, Morón 67210, Cuba
6
School of Agrarian and Forest Engineering, Universidad de León, 24404 León, Spain
*
Author to whom correspondence should be addressed.
Remote Sens. 2024, 16(5), 798; https://doi.org/10.3390/rs16050798
Submission received: 14 January 2024 / Revised: 17 February 2024 / Accepted: 22 February 2024 / Published: 24 February 2024
(This article belongs to the Section Forest Remote Sensing)

Abstract

:
Invasive plants are a serious problem in island ecosystems and are the main cause of the extinction of endemic species. Cuba is located within one of the hotspots of global biodiversity, which, coupled with high endemism and the impacts caused by various disturbances, makes it a region particularly sensitive to potential damage by invasive plants like Dichrostachys cinerea (L.) Wight & Arn. (marabú). However, there is a lack of timely information for monitoring this species, as well as about the land use and land cover (LULC) classes most significantly impacted by this invasion in the last few decades and their spatial distribution. The main objective of this study, carried out in Central Cuba, was to detect and monitor the spread of marabú over a 28-year period. The land covers for the years 1994 and 2022 were classified using Landsat 5 TM and 8 OLI images with three different classification algorithms: maximum likelihood (ML), support vector machine (SVM), and random forest (RF). The results obtained showed that RF outperformed the other classifiers, achieving AUC values of 0.92 for 1994 and 0.97 for 2022. It was confirmed that the area covered by marabú increased by 29,555 ha, from 61,977.59 ha in 1994 to 91,533.47 ha in 2022 (by around 48%), affecting key land covers like woodlands, mangroves, and rainfed croplands. These changes in the area covered by marabú were associated, principally, with changes in land uses and tenure and not with other factors, such as rainfall or relief in the province. The use of other free multispectral imagery, such as Sentinel 2 data, with higher temporal and spatial resolution, could further refine the model’s accuracy.

Graphical Abstract

1. Introduction

1.1. Invasive Plant Species in Cuba: The Case of Dichrostachys cinerea (L.)

Invasive exotic plants are non-native species that establish and disperse in areas outside their region of origin, generating a negative impact on their ecosystem, economy, and social well-being [1]. According to [2], these introduced species have been named in various ways: non-indigenous, alien, non-native, foreign, exotic, transplanted, and non-native species. These species are considered to be the second greatest threat to biodiversity and the cause of the extinction of numerous species around the world [3,4].
Human migration is considered one of the main causes of the introduction of species outside their regions of origin [5]. Globalization has accelerated the dispersal of species thanks to animal trade and exports of agricultural products [6]. Most of these species have been scattered to many parts of the world, including small islands (such as Cuba). The greatest manifestation of endemism is shown on islands, which, being surrounded by oceans, act as a barrier to the dispersal of continental plants [7]. According to [8], invasions on islands are linked to the threat suffered by endemic species; however, a notable information gap has been observed on most islands and archipelagos. The Bahamas, the Greater Antilles, and the Lesser Antilles, which make up the largest group of Caribbean islands, represent the most important island system in the New World and are considered to be a global priority for conservation [9].
Cuba is located within one of the hotspots of global biodiversity, which, coupled with high endemism and the impacts caused by various disturbances, makes it a region particularly sensitive to potential damage by invasive plants [10]. Marabú is a species native to Africa and Asia which, in the mid-19th century, was introduced to Cuba [10]. It is a shrub about five meters high, with a solid trunk, made of very hard wood. This is an invasive plant that spreads and grows rapidly, even in irregular or unfertile terrain, and therefore ends up occupying large areas [11].
Presently, Cuba is greatly affected by the invasion of three species belonging to the Fabaceae family: Dichrostachys cinerea (L.) Wight & Arn., Mimosa pigra (L.), and Vachellia farnesiana (L.) [12]. The first, colloquially known as marabú, constitutes a unique example of the devastating consequences caused by invasive species [13,14,15]. According to [16], marabú has posed a threat to agricultural production in Cuba since 1911. The marabú scrubland is currently one of the greatest concerns in the country since in 1996 it already occupied approximately 1.5 million hectares of land in Cuba [10], including 18% of the agricultural areas and 56% of the livestock areas. The same author pointed out that there was a significant increase in the infected areas of marabú in Cuba, which grew from around 268,000 ha in 1946 to 402,000 ha in 1958. However, despite the fact that for 30 years (1960–1990) different methods were used to eradicate this plant, the area covered by marabú in Cuba remained between 528,000 and 660,000 hectares. [10]. Starting in 1990, the economic crisis on the island worsened and therefore the means and techniques used for its control, which were generally expensive, were no longer implemented, so the speed of expansion of marabú multiplied throughout the country [10]. Some authors [17,18,19] have reported that the development and expansion of marabú in Cuba are related to some environmental factors (precipitation distribution, relief, soil type, etc.) and human factors (deforestation, changes in land use, etc.), but there were no clear conclusions. Furthermore, estimates of the area occupied by marabú have been very inaccurate, mainly using direct observational methods in representative plots [17].
Early identification and cartographic representation of the invasive species are of paramount importance in the formulation of efficient management strategies and the mitigation of further expansion into non-invaded areas [19]. In addition, using remote sensing enables the quantification of invasion spread rates and patterns and facilitates the evaluation of the effectiveness of various management approaches [20,21]. Some studies of marabú have been conducted by various researchers using remote sensing in parts of Cuba, such as in the Sancti Spíritus province [18,22], in the Havana province [17], and the Camagüey and Granma provinces [23]. In the Ciego de Ávila province, [24] a remote sensing methodology to study areas covered by marabú was proposed; however, the authors of that study did not show any results related to the spatial distribution of the species nor temporal changes. Thus, there is a lack of timely information for monitoring marabú, as well as about the LULC classes most significantly impacted by this invasion in the last few decades and their spatial distribution.

1.2. Remote Sensing for Invasive Species Monitoring

The objective of remote sensing and image photointerpretation is to identify and evaluate those elements found on the Earth’s surface [25]. The mapping of invasive species using remote sensing techniques was not common until the 1990s. Moderate spatial resolution images (those with pixel size greater than 10 m) have been the most commonly used [3], although it should be noted that these are only effective for large areas where these plants exist, and when large-scale management is desired [26,27], as is the case in this case study. Refs. [5,28,29,30] suggest that the key to the success of this type of approach is to take into account the unique characteristics of the plant (e.g., flowering and fruiting seasons), using a single image or a multitemporal approach. In general, multispectral free imagery used for mapping and monitoring of alien invasive plant species can be employed for applications on local to regional scales and provide accuracies ranging from very low to moderate [31,32,33].
At certain times, multispectral products have shown difficulties in detecting invasive species that exhibit similar characteristics to their environment, so the field of invasive species detection is shifting towards hyperspectral products or the use of hyperspectral products in combination with multispectral products [8]. In particular, data from both multispectral and hyperspectral sources from satellites and unmanned aerial vehicles (UAVs) coupled with machine learning algorithms have been used to discriminate invasive species from other species. Areas covered by the invasive species Hakea saricea were mapped using high spatial resolution imagery from multispectral UAVs and WorldView-2, and accuracies were achieved which allowed its eradication at a local scale to be monitored [3]. Meanwhile, Ref. [29] successfully mapped and identified the aggressive invasive species Acacia salicina and Acacia saligna using WorldView-2 imagery as well as the random forest algorithm. The authors of [30] analyzed the possibility of detecting and monitoring the spread of Asclepias syriaca in Hungary with hyperspectral images from UAVs. While hyperspectral data yield more accurate results (generally above 80% accuracy), they are mainly limited to airborne products, such as HyMap and the airborne visible/infrared imaging spectrometer (AVIRIS) [28]. However, these aerial products have a major disadvantage in large-scale mapping since the acquisition cost is high, making the economic advantage of remote sensing less obvious.
To overcome these limitations, researchers have been applying traditional machine learning techniques to land use land cover (LULC) mapping using remote sensing, such as spectral angle mapper (SAM), fuzzy adaptive resonance theory supervised predictive mapping (Fuzzy ARTMAP), or other more advanced ones, which in recent years have gained wide acceptance, such as artificial neural networks (ANNs), support vector machine (SVM), or random forest (RF) [34,35]. The three latter techniques generally provide better accuracy [36] than other traditional classification techniques, such as distance measurement [37], clustering [38], or logistic regression [39]. These advanced models often exhibit significantly higher processing speeds compared to the original physically based models, and, additionally, when given precise and representative training datasets, these models can surpass the accuracy of conventional efficient parameterizations [40]. In comparison with deep learning techniques, machine learning algorithms also achieve high accuracy with limited samples [41]. Furthermore, machine learning techniques possess the ability to incorporate variables excluded from, or unsuited for, physically based models, including nonlinear processes [40].
The development of robust and advanced non-parametric image classification algorithms represents a significant advancement in the field of mapping invasive species [31]. As satellite sensor technology continues to evolve, it is essential to explore the utilization of these advanced classifiers in conjunction with data from the latest generation of multispectral sensors, which offer improved spatial and spectral resolutions [42]. This approach is crucial for overcoming the challenges associated with invasive species classification using remote sensing. One of the many difficulties is the spectral similarity between invasive and native species, making it hard to differentiate them accurately [42]. Additionally, the heterogeneous nature of the landscape and the varying growth stages of different species further complicate the classification process [31]. Furthermore, limited spatial resolution and spectral range of remote sensing data can hinder the identification of invasive species, especially in complex environments [43]. Another challenge is the need for extensive ground truth data for training and validating classification models, which can be resource-intensive and time-consuming [44]. Moreover, the dynamic nature of invasive species and their interactions with the environment requires continuous monitoring, which may be limited by the revisit time of remote sensing platforms [43].

1.3. Objective and Aims of This Work

The works described above regarding the mapping of invasive species using remote sensing indicate that, until now, there is no precise method for mapping most of these species [3,45,46,47]. Moreover, the increasing reliance on high spatial and hyperspectral datasets for alien invasive species detection and mapping poses challenges due to the prohibitive acquisition costs, particularly for repeated and large-scale estimation and monitoring in resource-limited regions like Cuba. To optimize the detection and mapping of invasive species in these regions, it is necessary to explore the capabilities of freely available improved spatial and spectral resolution multispectral datasets, such as Landsat 8–9, in conjunction with robust and advanced machine learning algorithms [31]. Hence, three machine learning classifiers were used in this study in combination with Landsat imagery to map the invasive species. The three classifiers used were maximum likelihood (ML), support vector machine (SVM), and random forest (RF); all of them are supervised classifiers, the first being parametric and the latter two non-parametric. The ML algorithm explains each of the categories using a Gaussian function, assuming that the data follow a normal distribution; this makes it a very complex algorithm [48], but it has been widely used in the past and therefore is considered a benchmark [46]. The non-parametric SVM classifier was introduced by Vapnik [49] as a machine learning model, which is based on kernel functions to perform regression and classification tasks [50] and has been also used in previous works in the field, along with RF [45,51]. RF is a non-parametric machine learning algorithm that constitutes an ensemble of decision trees grown with a randomization process, which makes it robust against overfitting and less sensitive to noise in the data and outliers [52].
Therefore, in this study, our main objective was to find an accurate method based on remotely sensed imagery to map and monitor the marabú (Dichrostachys cinerea) invasion within the Ciego de Ávila province (Central Cuba) between 1994 and 2022. Also, another aim was to determine the LULC classes most significantly impacted by this invasion and analyze the spatial distribution and dynamics of marabú in that period of time. To achieve these goals, we used Landsat data from two different dates in combination with other auxiliary data and tested three machine learning classifiers.

2. Materials and Methods

2.1. Study Area

The Ciego de Ávila province is located in the central part of the island of Cuba (WGS84 UTM 2417694 731183 17Q), bordered to the west by the province of Sancti Spíritus, to the north by the Canal Viejo de the Bahamas, to the east by the province of Camagüey, and to the south by the Gulf of Ana María (Figure 1). It is the seventh largest province by area (6946.9 km²), representing 6.3% of the total surface area of Cuba [53]. Its political-administrative division consists of ten municipalities: Chambas, Morón, Bolivia, Ciro Redondo, Florencia, Majagua, Primero de Enero, Ciego de Ávila, Venezuela, and Baraguá [54].
The province has a predominantly flat relief, and it is one of the provinces where agroindustry and livestock are the main pillars of the economy, representing 50% of the economy of this region. The production of sugar and its derivatives is the main economic industry in the province [53]. The scarcity of studies on this province related to the impact of marabú on these sectors of the economy, as well as those aimed at its spatiotemporal expansion since the economic crisis of the 1990s, led us to carry out a study of this type of invasive species using remote sensing techniques.
This research work was conducted following the approach summarized in the flowchart shown in Figure 2. The main elements of the flowchart are described in the sections below, as follows: imagery (input) data (Section 2.2), reference data for calibration and validation of the classification (Section 2.3), classification process (separability, algorithm description) (Section 2.4), independent validation of the classifications and classifier choice (Section 2.5 and Section 2.6), and land use and land cover change analysis using the LULC maps obtained in the previous sections (Section 2.7).

2.2. Satellite Data

The LULC changes between 1994 and 2022 were analyzed, so one scene from 29 January 1994 from the Landsat 5 TM sensor and one scene from 26 January 2022 from Landsat 8 OLI were selected, both with path 013 and row 045. The images were obtained for January since this corresponds to the phenological flowering period of the species (Figure 3), when it is more likely to be differentiated from other land covers [18] and therefore the spectral signature of marabú would be easier to identify. The images chosen were the ones with the least cloud cover in the flowering period for those years. There were no clouds or cloud shadows in the study area in any of the images, and no quality issues were reported in the imagery metadata.
Both the Landsat 5 TM and Landsat 8 OLI images are at-surface reflectance products (Collection 2 Level 2), geometrically corrected to WGS 84/UTM zone 17N, so it was not necessary to make any radiometric or geometric corrections. The bands used in both cases were blue (B), green (G), red (R), near-infrared (NIR), and short-wave infrared (SWIR1 and SWIR2), which in Landsat 5 TM are 1 to 5 and 7, and in Landsat 8 OLI, from 2 to 7, with a spatial resolution of 30 m and radiometric resolution of 16 bits. The images were downloaded from the United States Geological Survey (USGS) website (https://earthexplorer.usgs.gov/, accessed on 1 January 2020) in TIF format.
For each image, the visible and infrared bands were grouped together so that we could work with a single composition of bands. To avoid working with the entire image, a square cutout that included the study area was made.

2.3. Field Reference Data

In this study, one of the aims was to identify the 10 land/water cover classes shown in Table 1, with a special focus on the marabú class. These classes were chosen in order to determine if the marabú had spread over areas of environmental importance (wetlands, grasslands) and/or economic relevance (i.e., crops).
Field reference data (LULC) were obtained corresponding to the 1994 and 2022 reference years (Figure 2). For the 1994 data, the land cover information involved the visual interpretation of Landsat satellite data coupled with on-site verification conducted by local long-term residents who possessed intimate knowledge of the study area and its historical LULC. To distinguish the marabú from the tree species present in the study area, the NIR SWIR1 RED bands were mainly used; given that, with this combination, the marabú could be differentiated from the native species because the marabú showed up on the image as intense red and the native species in the area as light red. The reference points corresponding to the 2022 image were collected across the study area using VHR satellite imagery available via Google Satellite images (https://www.google.com/maps/@22.0518467,-78.3543797,228031m/data=!3m1!1e3?entry=ttu, accessed on 1 January 2023) and verified in the field. The selection of reference data was guided by the unique characteristics of species occurrence, including elevation-induced vegetation distinctions, contiguity, homogeneity, and proximity to settlements. After the visual interpretation, small polygons were digitized for each LULC class to be used as training data in the classification process (Table 1). The approach followed to obtain the reference data for the independent validation of the classification is explained in Section 2.5.

2.4. Classification of Satellite Imagery

As a first step in the classification process (Figure 2), the spectral separability among classes was calculated to observe whether the classes defined above presented significantly different spectral signatures in the selected feature space. Separability analysis calculates the statistical distance between spectral classes [55]. In this study, the Jeffries–Matusita distance was used to evaluate the separability, giving a value of less than 1.5 when the classes are spectrally similar and a maximum value of 2 when they are very different [55]. In case of low values, the training samples should be reviewed and/or the definition of the classes, since the spectral classes would not match the classes defined in the legend.
For the classification of each image, we used three algorithms: maximum likelihood (ML), support vector machine (SVM), and random forest (RF). ML and SVM were run on ENVI 5.3.1 software, while RF was applied using the function provided in the randomForest package in the R statistical software version 4.2.3 [56].
ML works on the principle of calculating the probability distribution of each pixel. If the probability of a pixel belonging to class i is greater than the probability of it belonging to class j, it is classified as belonging to class i [55].
The non-parametric SVM algorithm identifies a single boundary between two classes, assuming that the multidimensional data are linearly separable in the input space. Specifically, it determines an optimal hyperplane to separate the data set into a discrete number of predefined classes, using the training data. To maximize separation, the algorithm uses a portion of the training sample that is closest in the feature space to the optimal decision boundary, acting as support vectors [57]. The following settings were used in this study: a kernel of the radial basis function (RBF) type and a Gamma value of 0.165; all other parameters were kept at their default values.
RF is a non-parametric machine learning algorithm employing an ensemble of randomly grown trees, where individual tree predictions are subsequently aggregated [31]. During training, each tree is exposed to a different subset of the data, and the remaining data are used for testing. In this case, 70% of the sample described in Section 2.3 was dedicated to the development of the random forest model, and the remaining 30% was allocated for the prediction estimation, yielding the ‘out-of-bag’ (OOB) error estimate [58]. The importance of each one of the input variables in the model was also calculated. Each RF model consisted of 500 trees. The rest of the parameters of the randomForest were kept as default.

2.5. Validation

In order to compare the results of the classifications using the different algorithms, an independent validation was performed using the same data for the three classifiers (Figure 2). The sample size was calculated using Equation (1), which considers the binomial probability theory [59]. An expected accuracy of 85% was established for all classes, as well as an allowable error of 10%. So a sample size of 51 points was obtained for each class, to which 4 more were added for a total of 55. Therefore, 550 points in total were used to calculate the accuracy of each classification.
N = Z2 × (p) × (q)/E2
where
p: expected accuracy of the validation sample for that class (p) (p = 0.85);
q = (100-p);
E = allowable error in the classification of that class (E = 0.10);
Z = 2, approximation of the normal standard deviation of 1.96 for the 95% confidence interval (two-tailed).
The method to locate the validation points was a stratified sampling [60,61]. With this procedure, the points were generated randomly on the classified images, and the actual LULC class was assigned using the same methods as to assign the LULC classes for the training samples (Section 2.3). It was verified that none of the points of the validation sample overlapped the areas used for training. The spatial distribution of the validation points is shown in Figure 4.
Finally, to compare the results of each classification, a confusion matrix was obtained for each year and classification, and the overall accuracy, as well as the user and producer accuracies [59,62]. For each statistic, the 95% confidence interval was calculated using the adjusted Wald method [63], which is the most widely used when the sample size is smaller than 100 for each class [63]. The F-score (see Equation in [64]) for the target class (marabú) was also calculated, as a harmonic mean of the user and producer accuracy. In addition, the ROC curve (receiver operating characteristic curve) for marabú was calculated, to show visually the performance of each classification model for that class [65], as well as the AUC (area under the ROC curve) [66]. The latter quantifies the overall performance of the classifier. A higher AUC value indicates better classification accuracy, with a value of 1 indicating a perfect classification. According to [66] AUC should be used instead of overall accuracy for the evaluation of machine learning algorithms (i.e., ML, RF).
To further evaluate the results estimated from the classifiers and compare the overall performance of the classifiers, the McNemar nonparametric statistical test [67,68] was two-tailed and computed at a 95% confidence level. This test is based on the calculation of the χ2 distribution and is commonly used to compare the classification errors between two classifiers, and test values > 3.84 show a statistical difference at a 95% confidence level [69].

2.6. Classifier Choice

The criteria to choose the most suitable algorithm for the mapping of marabú using Landsat imagery were as follows (in this order of priority): (i) the highest AUC for the marabú, (ii) the highest producer accuracy for the marabú class (lowest omission error), and (iii) the highest user accuracy for the marabú class (lowest commission error). The classifications will be used to locate the invasive species with the aim of controlling it; therefore, it is more important to minimize the omission error than the commission error.
If the results of two or more algorithms were not significantly different considering the first criterion, the second was tested, and, if needed, the following ones.

2.7. Land Use and Land Cover Change Analysis

Once the most accurate algorithm for each image was chosen, the calculation of the area occupied by each land cover was carried out in QGIS for each class of the vectorized and cropped file with the classification information for each year, 1994 and 2022 (Figure 2). Firstly, we determined the marabú spatial coverage during the period of time of the study. Then, we assessed the LULC change by constructing a cross-tabulation matrix for the time interval 1994–2022. This analysis involved the computation of gains, losses, net changes, and rates of change (Figure 2). Visual representations of LULC gains and losses were generated through the utilization of tables. In order to determine the influence of the marabú invasion on each LULC class, we subtracted the contributions of each class to marabú (losses to Marabú) from their respective gains from marabú (gains from Marabú).
To gain insights into the pattern of the invasion, we carried out an analysis of change statistics and conducted a visual assessment of the LULC maps. Our interpretation of the change output and distribution patterns was further enhanced by a comprehensive understanding of seasonal socioeconomic activities, including irrigation farming, charcoal production, and flood events. This knowledge was acquired through on-site field observations, facilitated focus group discussions, and interactions with the local community.

3. Results

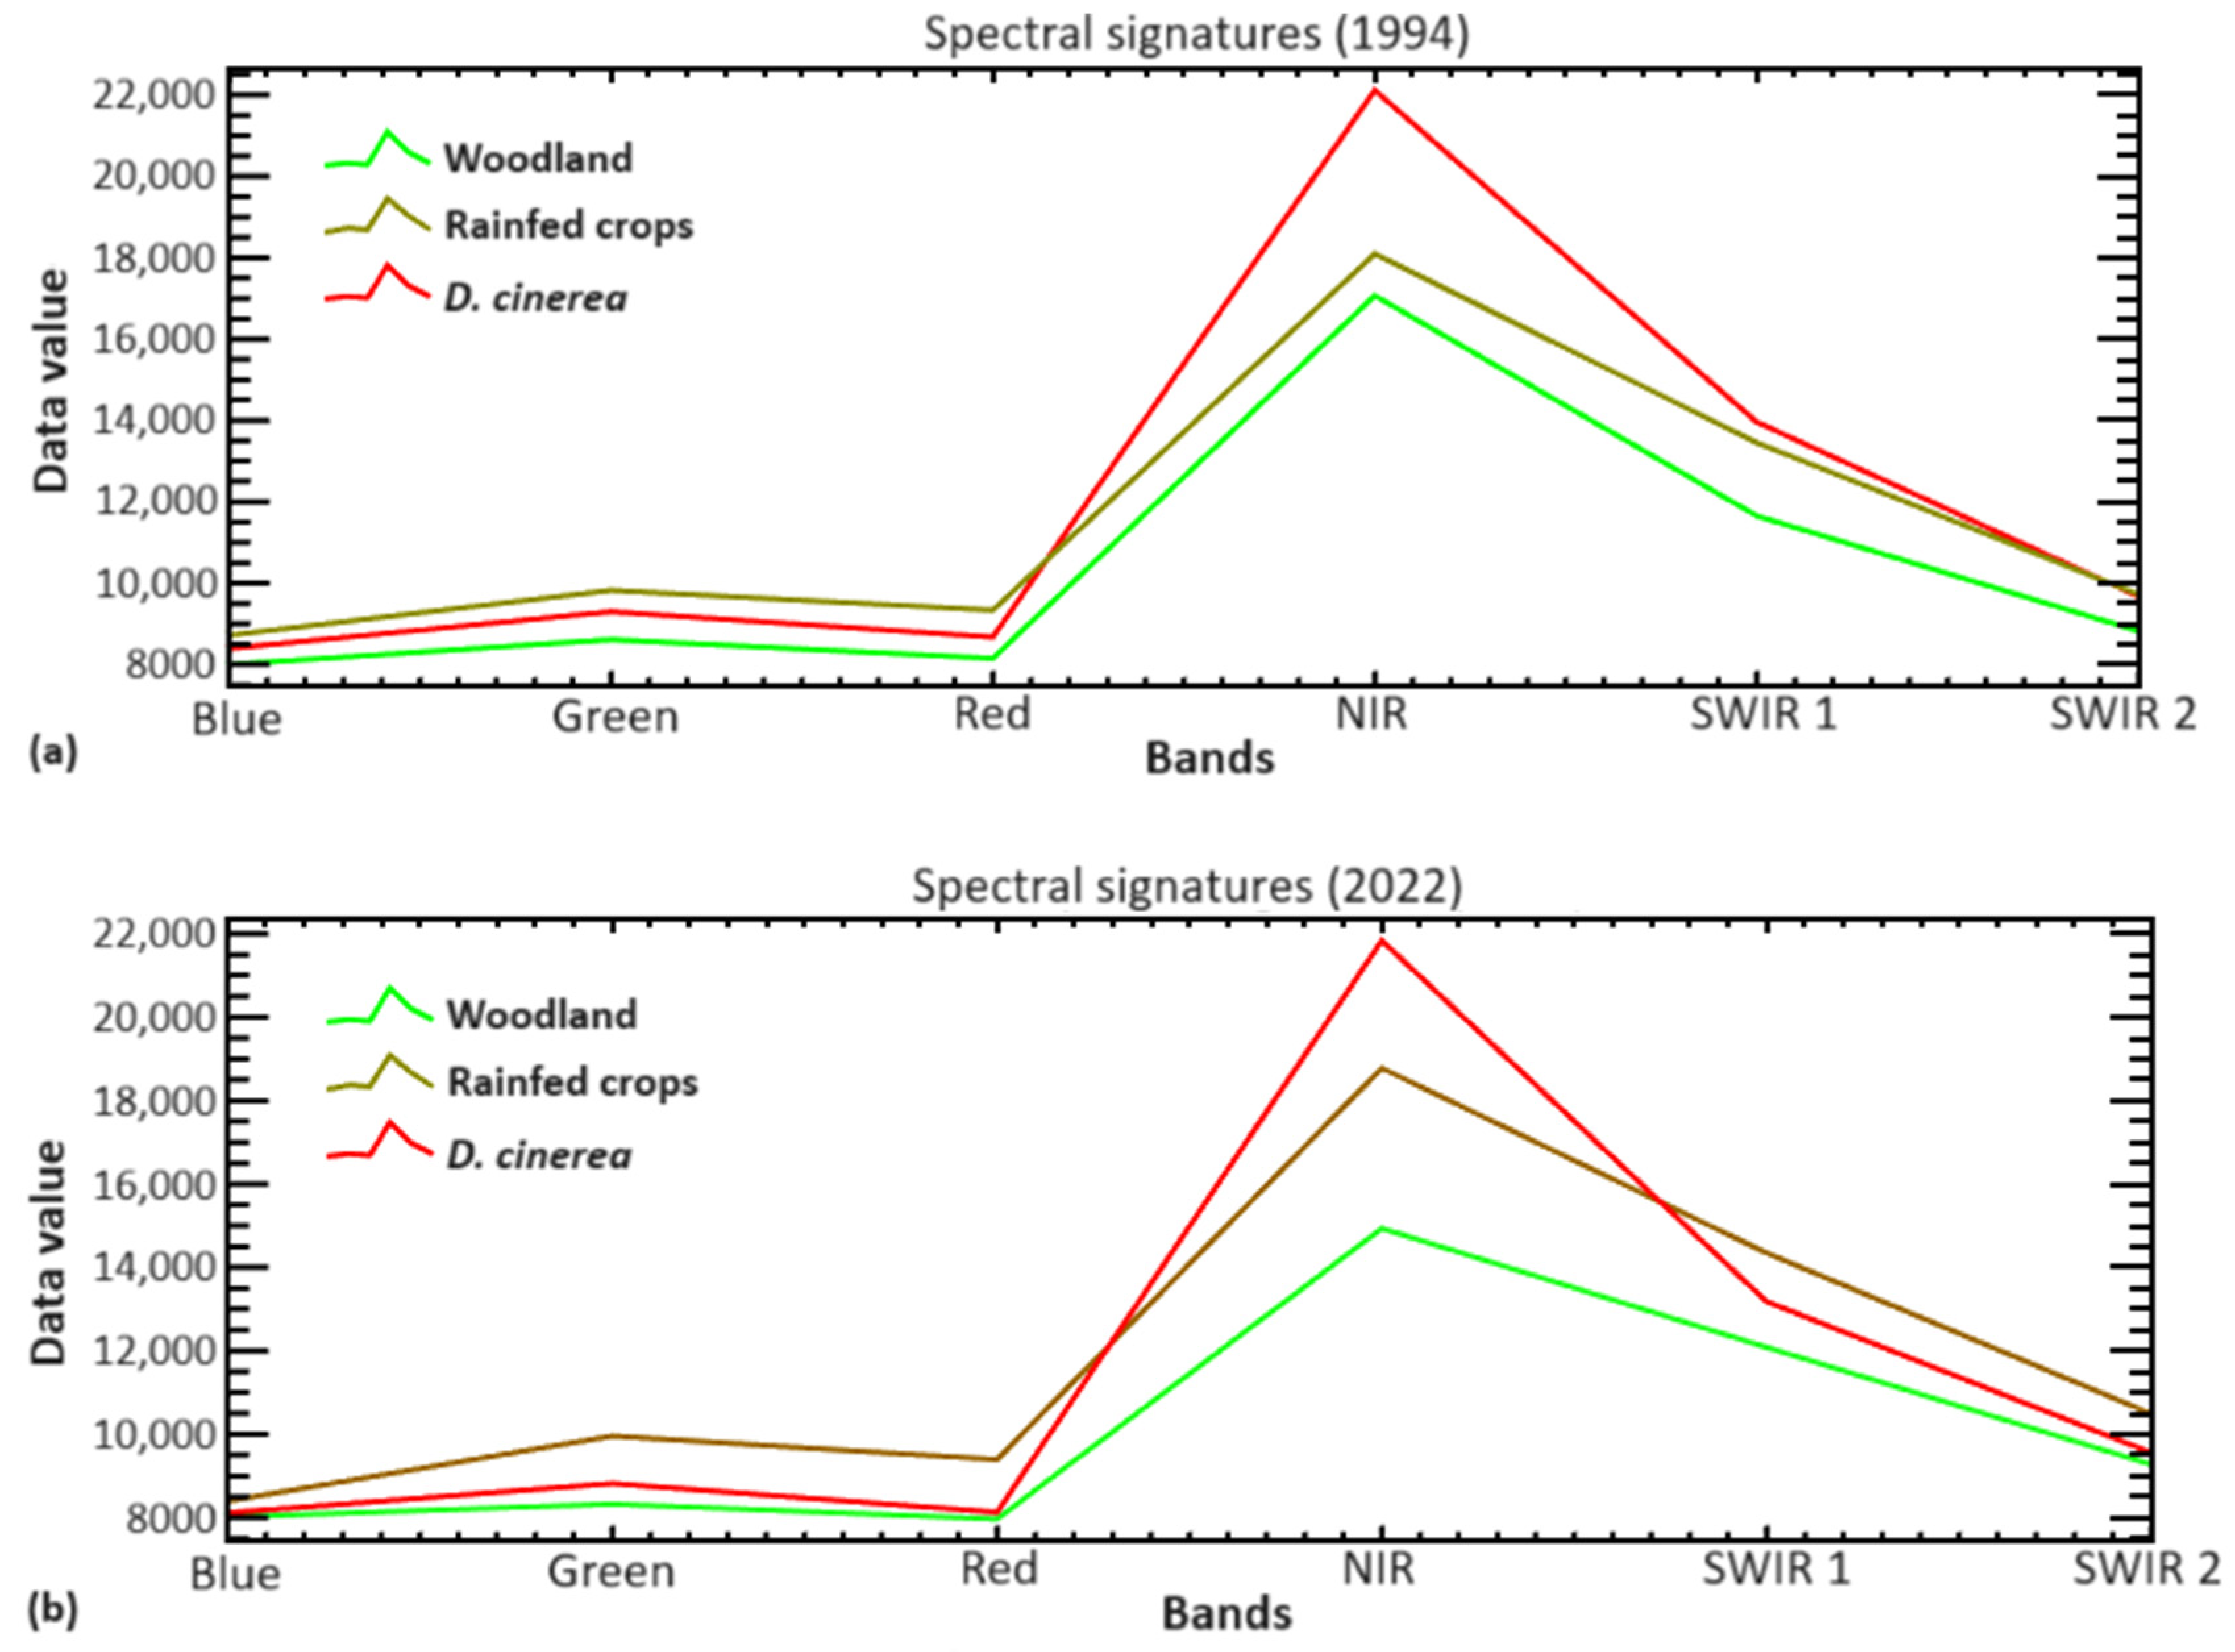
3.1. Spectral Characterization of D. cinerea

The spectral separability results obtained using the Jeffries–Matusita distance were equal to or more than 1.96 for the 1994 image and 1.98 for the 2022 image for all of the classes compared to D. cinerea. For the 1994 data, the lowest separability value was obtained with rainfed crops (1.96). For the 2022 data, the lowest separability obtained was also with rainfed crops (1.98), followed by woodlands (1.99). These values showed the suitability of the selected feature space (VIS, NIR, SWIR) for differentiating marabú from the other LULC classes. The spectral signature of marabú is clearly distinct from the spectral signatures of rainfed crops and woodlands, as shown in Figure 5, for the Landsat images from January 1994 and 2022. In both cases, the NIR band showed the largest differences in reflectance.

3.2. Dichrostachys cinerea Detection with Landsat 5 TM and Landsat 8 OLI images

The combination of Landsat imagery obtained during the flowering season and the RF algorithm was proven to be very efficient in detecting D. cinerea in the study area, with highly accurate results (AUC > 0.90 for both dates, producer accuracy (PA) > 83%, user accuracy (UA) > 93%) (Table 2). The PA and UA values for each one of the other nine LULCs also showed that RF performed better compared to ML and SVM (Tables S1 and S2 in the Supplementary Materials). The confusion matrix for the 1994 RF showed that the main sources of confusion were the woodland and grassland classes, while for 2022 they were the woodland and mangrove classes, in that order (Tables S3 and S6 in the Supplementary Materials).
The results of McNemar’s test (Table 3) confirmed that the differences in the classification performance were statistically significant for all algorithms in pairwise comparison except for ML and SVM classifiers for 1994, where χ2 0.05= 1.39 (lower than the test value 3.84; values lower than this critical value indicate that there is no statistical difference) [67,69]. This confirms that the overall accuracy of RF (Table 2) was significantly higher than the accuracies obtained with SVM and ML, for both years.
Taking into account the results shown above (Table 2 and Table 3), the RF model was chosen for mapping and estimating the area covered by Dichrostachys cinerea in 1994 and 2022.

3.3. Dichrostachys cinerea Spread from 1994 to 2022

In 1994, the total area covered by D. cinerea was 61,977.59 ha, while in 2022 it reached approximately 91,533.47 ha (Table 4). In 1994, the marabú was more widespread to the east (Primero de Enero municipality), northeast (municipality of Bolivia), center (Ciro Redondo municipality), and northwest (Chambas municipality) of the province. The areas that had less coverage of D. cinerea were in the south (municipalities of Venezuela and Baraguá) of the province and in the Morón municipality (in the north of the province) (Table 5, Figure 6a). The results from 2022 showed an increase in the area covered by marabú in all the municipalities except for two (Table 4) and a change in the spatial distribution of the species, being most prevalent in the northeast and south of the province (municipalities of Bolivia, Primero de Enero, and Venezuela) (Figure 5b). The largest densities of the D. cinerea species were found in the municipality of Bolivia, Primero de Enero (northeast of the province), and in the south of Venezuela. It should be noted that during this period of time, D. cinerea was not present in both coastal areas of the province (south and north), principally in the areas occupied by mangrove forests, wetlands, and saltmarshes (Figure 6).

3.4. Marabú-Induced Changes in other LULCs

During the 28-year period, three of the ten LULC classes (D. Cinerea, infrastructure, and bare soil) significantly increased their spatial coverage, by 48%, 173%, and 366%, respectively, while the rest decreased or had almost no change (<5%) (Table 6). Overall, the highest losses were found in the woodland class, which was reduced by 30%, followed by rainfed crops by 29%, mangrove by 26%, grassland by 23%, and irrigated crops by 11%.
Our results show that woodlands, mangroves, and rainfed crops were mostly lost to marabú during the studied period (Table 7). Within almost three decades, the marabú invasion has resulted in LULC losses of woodlands by 16,790 ha (38%), rainfed cropland by 6671 ha (4%), grasslands by 4186 ha (2,5%), flood-prone areas by 2085 ha (2%), mangroves by 1079 ha (4%), and irrigated crops by 192 ha (1%). The area that maintained a land cover of D. cinerea from 1994 to 2022 comprised 17,445.62 ha.

4. Discussion

4.1. Dichrostachys cinerea Detection Using Remote Sensing

The results obtained in mapping and detecting changes in D. cinerea cover in Central Cuba using Landsat 5 TM and 8 OLI satellite images (moderate spatial resolution with a pixel size greater than 10 m) were considered satisfactory, achieving AUC > 0.92 and overall accuracies higher than 90%, which are higher than the ones achieved in other works monitoring invasive species [31,45,70,71]. These results are supported as well by [3], the authors of which suggested that imagery with spatial resolutions of more than 10 m can generally be used to detect and map invasive species in large areas, as is the case in this study, where the invasion of D. cinerea was studied on a provincial scale. The results of the mapping of this species using different classification algorithms (ML, RF, and SVM) demonstrated the superior performance of the random forest (RF) algorithm (Table 2). The highest PA values for the Dichrostachys cinerea class (lowest omission errors) were obtained when using the RF algorithm, for both 1994 and 2022 (83.64% and 98.18%, respectively) (Table 2). RF was significantly more accurate than ML and SVM regarding PA (p < 0.05), according to the confidence intervals. Moreover, the highest UA values (lowest commission error) obtained were also with RF, for both years (93.88% for 1994 and 95.09% for 2022) (Table 2). These values were significantly higher (p < 0.05) than the ones achieved using ML and SVM, considering the confidence intervals. As expected, considering the PA and UA values, the AUC values were also higher for the classifications using RF (0.92 for 1994 and 0.97 for 2022). Regarding the performance of the classifiers for all 10 classes, the OA values achieved by RF were also the highest (90.91 and 95.09, respectively, for 1994 and 2022). Taking into account the confidence intervals, these values were significantly higher (p < 0.05) than the ones achieved using ML and SVM. These findings are in line with the broader literature on the use of different classification algorithms for mapping and monitoring invasive plant species. In [31], the authors emphasized the importance of algorithm selection in remote sensing applications for invasive species, which is corroborated by the observed performance of the RF algorithm in this study. The superior performance of RF over SVM has been also reported by [45,51,71,72,73] for land cover and invasive species mapping, while [70] also found the use of RF instead of ML more effective in mapping invasive plant species, emphasizing the relevance of these methods in remote sensing applications for invasive species management. The authors of [73] conducted a comparison between ML and SVM classifiers for tree cover mapping, also finding higher accuracy when using SVM, as shown in our work. On the one hand, one of the limitations of this work could be the possible difficulty in finding free cloud cover images for the optimal phenological status (flowering period); however, the availability of Landsat 8, Landsat 9 and, if needed, Sentinel 2 imagery simultaneously since February 2022, increases the temporal resolution and the likelihood of accessing cloud-free data [74]. On the other hand, the minimum mapping area is limited by the spatial resolution of the Landsat 5 and Landsat 8 imagery used in this study, which limits the detection of very small areas covered by marabú. This issue could be overcome by the use of Sentinel 2 imagery, which has a higher spatial resolution (10 m for VIS and NIR and 20 m for SWIR) since the critical spectral bands identified to detect marabú (NIR) are also present in Sentinel 2 imagery (Figure 5).

4.2. Dichrostachys cinerea Spread from 1994 to 2022 and Land Cover Changes

D. cinerea is considered a species of great concern; it has transformed the land cover of Cuba and has been defined as an invasive species that is not from Cuba [13]. Furthermore, it constitutes an obstacle to landscape recovery for ecological restoration and agricultural redevelopment [75].
Our results showed that there was an increase of almost 30,000 hectares covered by marabú between 1994 and 2022 (Table 6). However, except in some specific areas, such as the highest areas (more than 130 m a.s.l. (above sea level)) between the municipalities of Florencia, Chambas, and Ciro Redondo, and around Loma de Cunagua (Figure 1 and Figure 6), the areas covered by marabú changed. For example, in 2022, an increase in the density of the plant was noted towards the northwest (Bolivia and Primero de Enero municipalities) and south (Venezuela municipality), and a decrease in the density of areas covered by marabú towards the center of the province (Ciro Redondo municipality) (Table 5).
These temporal changes in the areas covered by marabú could be related, in the case of the increase, to the definitive closure of sugar mills at the beginning of 2002 (more than 20 years before the 2022 image was captured) in the municipalities of Bolivia and Venezuela and, therefore, to the decrease in areas dedicated to planting sugar cane [11]. Furthermore, both municipalities have suffered, in the last decade, a significant decrease in their populations [54]. In fact, Bolivia and Venezuela are the municipalities with the lowest population densities [54], in the province (17.2 inhabitants/km2 and 32.5 inhabitants/km2, respectively). Coupled with the fact that they are purely agricultural municipalities, this population decrease in Bolivia has also impacted the availability of a labor force in the agricultural sector, and therefore less of the land area is used for agriculture, which provides an opportunity for the establishment and expansion of marabú [17]. Table 5 shows a large decrease in irrigated and rainfed crop areas, which reinforces our previous statements.
In the area studied, only the municipalities of Ciro Redondo and Ciego de Ávila showed a decrease in the areas covered by marabú, which could be due to the fact that since 2019, a bioelectric plant has been in operation (in the Ciro Redondo municipality) that uses marabú biomass as an alternative energy. According to the feasibility studies, the yields of the areas covered by marabú in a 50 km radius around the bioelectric plant were expected to have a yield of 70 tons/ha [11]. However, reality has shown that yields do not exceed 30 tons/ha, which could be due to the estimation method, which was based on the compilation of reports from landowners, whether private or state, who contributed the values according to their own assessments [24]. For this reason, our study can offer important information for the management of this species as biomass in the production of electrical energy and for the management of marabú as an emerging popular charcoal source for wood-fired ovens and grills in Cuba [75]. In recent years, marabú charcoal has become one of the major agricultural exports from Cuba to Europe, and since 2017 it has been the largest agricultural export to the United States in more than 50 years [75].
Although some relate the prevalence of marabú to factors such as altitude, rainfall, and availability of sun, in the province where the study was conducted, these were not the determining factors in the spatial distribution of the species, since the plant populations were maintained in the highest areas of the province above sea level between 1994 and 2022 [10]. This could be due to the lack of mechanized and specialized technology for its eradication, in addition to the fact that these areas are not used as much as other areas for agricultural and livestock exploitation. According to [11], marabú eradication is so laborious and expensive that very often the invaded lands are abandoned by agricultural producers. In the case of the spatial distribution of rainfall in the province [76], a direct relationship was not determined, since marabú aggressively invaded both the areas with the lowest rainfall (<1150 mm/ year) in the province (northeast) and also the areas with significantly higher rainfall (>1340 mm/year) (west).
One of the control methods used to curb the expansion of marabú is the flooding of flat lands, since the species is not tolerant to soil inundation [11]. For this reason, the spatial distribution of the species, both in 1994 and in 2022, did not extend to the areas where marshes, wetlands, and mangroves were located in the southern and northern edges of the province; for example, in the Morón municipality (located within the Great Northern Wetland of Ciego de Ávila), the area covered by marabú remained almost the same over the time period (Table 6 and Table 7). The above also constitutes one more reason to protect these ecosystems, their freshwater sources, and the populations of species such as the mangrove forest. In fact, Table 6 shows a decrease (of around 6600 ha) in the areas covered by mangroves between 1994 and 2022, which must be monitored in order to conserve this important environmental resource.
In summary, the spatial distribution and temporal changes in D. cinerea in the Ciego de Ávila province showed heterogeneous dynamics (with an increase of around 48% of the area occupied by marabú), which was associated more with changes in land use and tenure than to other factors, such as height above sea level and rainfall.
This methodology for mapping marabú can be applied to other provinces in Cuba that have the same problem as Ciego de Ávila, in relation to the expansion of marabú and its effects on the other sectors of the Cuban economy.

5. Conclusions

This work provides a remote sensing-based tool for Dichrostachys cinerea (marabú) detection and mapping in central Cuba, offering insights into its spatial distribution, temporal changes, and impact on land cover. The findings contribute valuable knowledge for regional management and lay the groundwork for future research addressing complex challenges associated with invasive species.
This study successfully employed Landsat imagery and machine learning classifiers, achieving satisfactory results (AUC > 0.82) in detecting and mapping marabú in central Cuba. The RF algorithm demonstrated superior performance in comparison to ML and SVM. The research emphasized the critical role of algorithm and image selection (flowering time) in remote sensing applications for invasive species mapping. The independent validation of the developed model revealed a strong ability to accurately identify 10 main land covers in the area (overall accuracy >90%).
Regarding the temporal dynamics, the analysis of marabú spread from 1994 to 2022 revealed a notable increase of almost 30,000 hectares (48%) in the area occupied by this species. The analysis of the spatial distribution and dynamics of marabú during that period of time showed fluctuations in density across different areas of the Ciego de Ávila province (the highest increases in the Bolivia and Venezuela municipalities, and a decrease in the center of the province), indicating a dynamic interaction with land use and economic factors. The LULC classes most significantly impacted by this invasion have been woodlands, mangroves, and rainfed crops, with implications for agriculture and ecosystem health. Changes in land use, including the closure of sugar mills and population decline in specific municipalities, were identified as influencing factors.
The developed methodology not only provides valuable insights into marabú dynamics in Ciego de Ávila but also offers a transferable tool for other Cuban provinces facing similar challenges. The methodology and results of this paper can also be used as a base to develop detection and monitoring models for economically constrained areas, by using free multispectral imagery and the RF algorithm. This could be applicable to similar invasive species that have a flowering period different from the native species and are spectrally different from other land covers in that area, and it would contribute to advancing the understanding of the model’s robustness and applicability in other areas, potentially improving its performance and expanding its utility for management objectives.
The challenges identified in this study include the need for continuous, accurate monitoring, and the exploration of sustainable solutions for marabú management. The spread of marabú must be addressed and managed in a holistic way, which would involve the eradication of this plant in some areas; also, it could be used both as a source of energy and for the production of charcoal in other areas, which would result in an increase in income for families and municipalities linked to this activity. Future research should focus on refining mapping techniques, considering the evolving socioeconomic landscape, and developing targeted interventions to address the persistent threat posed by marabú. Exploring the integration of additional data sources, such as free higher temporal- and spatial-resolution imagery like Sentinel 2 data, could further refine the model’s usability.
Future studies could delve deeper into the socioeconomic drivers influencing marabú dynamics. Understanding the intricate relationship between economic activities, population changes, and land use decisions will enhance predictive models and management strategies. Given marabú’s impact on agriculture and ecosystems, continuous monitoring and intervention strategies should be explored. Integrating remote sensing with on-the-ground efforts can contribute to dynamic, adaptive management practices to curb marabú expansion.

Supplementary Materials

The following supporting information can be downloaded at: https://www.mdpi.com/article/10.3390/rs16050798/s1, Table S1: Producer’s Accuracy (PA) and User’s Accuracy (UA) results for 2014 classifications for all LULC classes using RF, NL and SVM algorithms; Table S2: Producer’s Accuracy (PA) and User’s Accuracy (UA) results for 2022 classifications for all LULC classes using RF, NL and SVM algorithms; Table S3: Confusion matrix obtained from the validation of the classification carried out with the RF algorithm in 1994 in the province of Ciego de Ávila; Table S4: Confusion matrix obtained from the validation of the classification carried out with the ML algorithm in 1994 in the province of Ciego de Ávila; Table S5: Confusion matrix obtained from the validation of the classification carried out with the SVM algorithm in 1994 in the province of Ciego de Ávila; Table S6: Confusion matrix obtained from the validation of the classification carried out with the RF algorithm in 2022 in the province of Ciego de Ávila; Table S7: Confusion matrix obtained from the validation of the classification carried out with the ML algorithm in 2022 in the province of Ciego de Ávila; Table S8: Confusion matrix obtained from the validation of the classification carried out with the SVM algorithm in 2022 in the province of Ciego de Ávila.

Author Contributions

Conceptualization, A.V.-J., F.Á.-T. and R.G.-D.Z.; methodology, A.V.-J. and F.Á.-T.; software, A.V.-J. and A.L.B.-G.; maps, A.V.-J. and A.L.B.-G.; investigation, A.V.-J., R.G.-D.Z. and F.M.-P.; statistical analysis, A.V.-J., F.Á.-T. and R.G.-D.Z.; writing, A.V.-J., R.G.-D.Z. and F.M.-P.; supervision, F.Á.-T., R.G.-D.Z. and F.M.-P. All authors have read and agreed to the published version of the manuscript.

Funding

This research received no external funding.

Data Availability Statement

The raw data supporting the conclusions of this article will be made available by the authors upon request.

Acknowledgments

The deepest gratitude to the Spanish Agency for International Development Cooperation (AECID) and the faculty of the Master in Geoinformatics for the Management of Natural Resources of the University of León, Spain. Without them, this research would not have been possible.

Conflicts of Interest

The authors declare no conflicts of interest.

References

  1. Dubyna, D.V.; Dziuba, T.P.; Iemelianova, S.M.; Protopopova, V.V.; Shevera, M.V. Alien Species in the Pioneer and Ruderal Vegetation of Ukraine. Diversity 2022, 14, 1085. [Google Scholar] [CrossRef]
  2. Espínola, L.A.; Júlio Junior, H.F. Espécies invasoras: Conceitos, modelos e atributos. Interciencia 2007, 32, 580–585. [Google Scholar]
  3. Álvarez-Taboada, F.; Paredes, C.; Julián-Pelaz, J. Mapping of the invasive species Hakea sericea using Unmanned Aerial Vehicle (UAV) and Worldview-2 imagery and an object-oriented approach. Remote Sens. 2017, 9, 913. [Google Scholar] [CrossRef]
  4. de Francesco, M.C.; Tozzi, F.P.; Buffa, G.; Fantinato, E.; Innangi, M.; Stanisci, A. Identifying Critical Thresholds in the Impacts of Invasive Alien Plants and Dune Paths on Native Coastal Dune Vegetation. Land 2022, 12, 135. [Google Scholar] [CrossRef]
  5. Richardson, D.M.; Pyšek, P. Elton, C.S. 1958: The ecology of invasions by animals and plants. London: Methuen. Prog. Phys. Geogr. 2007, 31, 659–666. [Google Scholar] [CrossRef]
  6. Moyle, P.B.; Ellssworth, S. Alien Invaders, Essays on Wildlife Conservation. 2004. Available online: http://marinebio.org/Oceans/Conservation/Moyle (accessed on 1 January 2023).
  7. Izco Sevillano, J. Botánica; McGraw-Hill Interamericana de España S.L.: Madrid, Spain, 1997. [Google Scholar]
  8. Pippard, H.; Ralph, G.M.; Harvey, M.S.; Carpenter, K.E.; Buchanan, J.R.; Greenfield, D.W.; Harwell, H.D.; Larson, H.K.; Lawrence, A.; Linardich, C.; et al. The Conservation Status of Marine Biodiversity of the Pacific Islands of Oceania; IUCN: Gland, Switzerland, 2017; Volume viii, 59p. [Google Scholar] [CrossRef]
  9. Mittenmeier, R.A.; Robles Gil, P.; Hoffman, M.; Pilgrim, J.; Brooks, T.; Goettsch Mittenmeier, C.; Lamoreux, J.; Da Fonseca, G. Hotspots Revisited: Earth’s Biologically Richest and Most Threatened Terrestrial Ecoregions; Conservation International: Ciudad de México, México; CEMEX: Mexico City, México, 2004. [Google Scholar]
  10. Aguilera Marín, N. Impactos de las Invasiones de Plantas en las Islas Oceánicas: El Caso de Dichrostachys cinerea (L.) Wight & Arn. 2010. Available online: https://www.researchgate.net/publication/284664079_Impactos_de_las_invasiones_de_plantas_en_las_islas_oceanicas_El_caso_de_Dichrostachys_cinerea_L_Wight_Arn/ (accessed on 1 January 2023).
  11. Sánchez-Hervás, J.M.; Ortz, I.; Maroño, M.; Ciria, P.; Ramos, R.; Arribas, L.; Domínguez, J. Gasificación de Biomasa e Hibridación AECID 2015/ACDE/001558. In Cogeneración de Energía, Eléctrica y Térmica, Mediante un Sistema Híbrido Biomasa-Solar para Explotaciones Agropecuarias en la Isla de Cuba; Informe Proyecto HYBRIDUS; Ciemat: Madrid, España, 2018. [Google Scholar]
  12. Méndez, I.; Moya, C.; Roquero, L. Primeras evidencias científicas de la presencia del marabú (Dichrostachys cinerea) en Cuba. An. La Acad. Cienc. Cuba 2022, 12. Available online: http://scielo.sld.cu/scielo.php?script=sci_arttext&pid=S2304-01062022000300012&lng=es&tlng=es (accessed on 1 January 2023).
  13. Prieto, R.; Oliver, P.; Caluff, M.; Regalado, L.; Ventosa, I.; Plasencia Fraga, J.; Baró, I.; González Gutiérrez, P.; Pérez-Camacho, J.; González-Oliva, L. Lista nacional de especies de plantas invasoras y potencialmente invasoras en la República de Cuba-2012. Bissea 2012, 6, 22–112. [Google Scholar]
  14. Nielsen, M.O.; Reinoso-Pérez, M.; Sørensen, M.; Hansen, H.; Gustafsson, J. Eco-Friendly Alternatives for Control and Use of Invasive Plants in Agroforestry Systems: The Case of Marabú (Dichrostachys cinerea) in Cuba. 2013. Available online: http://journal.um-surabaya.ac.id/index.php/JKM/article/view/2203 (accessed on 1 January 2023).
  15. Martín-Casas, N.; Reinoso-Pérez, M.; García-Díaz, J.R.; Hansen, H.H.; Nielsen, M.O. Evaluation of the feeding value of Dichrostachys cinerea pods for fattening pigs in Cuba. Trop. Anim. Health Prod. 2017, 49, 1235–1242. [Google Scholar] [CrossRef] [PubMed]
  16. Funes Monzote, R. El fin de los bosques y la plaga del marabú en Cuba. Historia de una “venganza ecológica”. Anu. Ecol. Cult. Soc. 2001, 1, 71–89. [Google Scholar]
  17. Ruiz Sinoga, J.D.; Remond Noa, R.; Fernández Perez, D. An Analysis of the Spatial Colonization of Scrubland Intrusive Species in the Itabo and Guanabo Watershed, Cuba. Remote Sens. 2010, 2, 740–757. [Google Scholar] [CrossRef]
  18. Jiménez Escudero, V.M. Desarrollo de Metodología de Teledetección para la Distribución Espacial de la Plaga Marabú (Dichrostachys cinerea) en Trinidad-Valle de los Ingenios (Patrimonio Cultural de la Humanidad UNESCO), Cuba. Master’s Thesis, Universidad Internacional de Andalucía, Seville, España, 2016. [Google Scholar]
  19. Grice, A.C.; Clarkson, J.R.; Calvert, M. Geographic Differentiation of Management Objectives for Invasive Species: A Case Study of Hymenachne Amplexicaulis in Australia. Environ. Sci. Policy 2011, 14, 986–997. [Google Scholar] [CrossRef]
  20. Mbaabu, P.R.; Ng, W.-T.; Schaffner, U.; Gichaba, M.; Olago, D.; Choge, S.; Oriaso, S.; Eckert, S. Spatial Evolution of Prosopis Invasion and its Effects on LULC and Livelihoods in Baringo, Kenya. Remote Sens. 2019, 11, 1217. [Google Scholar] [CrossRef]
  21. Bradley, B.A. Remote Detection of Invasive Plants: A Review of Spectral, Textural and Phenological Approaches. Biol. Invasions 2014, 16, 1411–1425. [Google Scholar] [CrossRef]
  22. Moreno, E.; Zabalo, A.; Gonzalez, E.; Alvarez, R.; Jimenez, V.M.; Menendez, J. Affordable Use of Satellite Imagery in Agriculture and Development Projects: Assessing the Spatial Distribution of Invasive Weeds in the UNESCO-Protected Areas of Cuba. Agriculture 2021, 11, 1057. [Google Scholar] [CrossRef]
  23. Betbeder, J.; Dubiez, E.; Gond, V.; Peltier, R. Rapport de Mission dans le Cadre de L’étude de Faisabilité Portant sur le Projet de Lutte contre la Prolifération de la Plante Invasive Marabú à Cuba; Centre de Coopération International en Recherche Agronomique pour le Développment: Montpellier, France, 2018. [Google Scholar]
  24. Almeida, E.; Dorta, D.; Alcantára, A. Metodología para estimación de área cubierta por D. cinerea a partir de imágenes satelitales. Univ. Cienc. 2010, 10, 32–44. [Google Scholar]
  25. Gaitán Rojas, D.J.; López Calle, M.I. Análisis Multitemporal de la Especie Vegetal Invasora Retamo Espinoso (Ulex europaeus) en el Embalse la Regadera, Zona Rural de la Localidad de Usme, a Partir de Imágenes Satelitales Sentinel 2 y Landsat 8 Mediante el Uso de Algoritmos de Clasificación; Universidad Distrital Francisco José de Caldas: Bogotá, Colombia, 2018. [Google Scholar]
  26. Jones, D.; Pike, S.; Thomas, M.; Murphy, D. Object- based image analysis for detection of Japanese Knotweed s.l. taxa (polygonaceae) in Wales (UK). Remote Sens. 2011, 3, 319–342. [Google Scholar] [CrossRef]
  27. Liu, M.; Li, H.; Li, L.; Man, W.; Jia, M.; Wang, Z.; Lu, C. Monitoring the invasion of Spartina alterniflora using multi-source high-resolution imagery in the Zhangjiang Estuary, China. Remote Sens. 2017, 9, 539. [Google Scholar] [CrossRef]
  28. Jensen, T.; Seerup Hass, F.; Seam Akbar, M.; Holm Petersen, P.; Jokar Arsanjani, J. Employing machine learning for detection of invasive species using sentinel-2 and Aviris data: The case of Kudzu in the United States. Sustainability 2020, 12, 3544. [Google Scholar] [CrossRef]
  29. Paz-Kagan, T.; Silver, M.; Panov, N.; Karnieli, A. Multispectral approach for identifying invasive plant species based on flowering phenology characteristics. Remote Sens. 2019, 11, 953. [Google Scholar] [CrossRef]
  30. Papp, L.; Van Leeuwen, B.; Szilassi, P.; Tobak, Z.; Szatmári, J.; Árvai, M.; Pásztor, L. Monitoring invasive plant species using hyperspectral remote sensing data. Land 2021, 10, 29. [Google Scholar] [CrossRef]
  31. Royimani, L.; Mutanga, O.; Odindi, J.; Dube, T.; Nyasha Matongera, T. Advancements in satellite remote sensing for mapping and monitoring of alien invasive plant species (AIPs). Phys. Chem. Earth Parts A/B/C 2019, 112, 237–245. [Google Scholar] [CrossRef]
  32. Matongera, T.N.; Mutanga, O.; Dube, T.; Sibanda, M. Detection and mapping the spatial distribution of bracken fern weeds using the Landsat 8 OLI new generation sensor. Int. J. Appl. Earth Obs. Geoinf. 2017, 57, 93–103. [Google Scholar] [CrossRef]
  33. Viana, H.; Aranha, J. Mapping invasive species (Acacia dealbata link) using ASTER/TERRA and LANDSAT 7 ETM+ imagery. In Forest Landscapes and Global Change-New Frontiers in Management, Conservation and Restoration Year, Proceedings of the IUFRO Landscape Ecology Working Group International Conference, Bragança, Portugal, 21–27 September 2010; IPB; IUFRO: Braganza, Portugal, 2010. [Google Scholar]
  34. Civco, D.L. Artificial neural networks for land-cover classification and mapping. Int. J. Geogr. Inf. Sci. 1993, 7, 173–186. [Google Scholar] [CrossRef]
  35. Geiß, C.; Aravena Pelizari, P.; Blickensdörfer, L.; Taubenböck, H. Virtual Support Vector Machines with Self-Learning Strategy for Classification of Multispectral Remote Sensing Imagery. ISPRS J. Photogramm. Remote Sens. 2019, 151, 42–58. [Google Scholar] [CrossRef]
  36. Carranza-García, M.; García-Gutiérrez, J.; Riquelme, J.C. A framework for evaluating land use and land cover classification using convolutional neural networks. Remote Sens. 2019, 11, 274. [Google Scholar] [CrossRef]
  37. Du, Q.; Chang, C.I. A linear constrained distance-based discriminant analysis for hyperspectral image classification. Pattern Recognit. 2001, 34, 361–373. [Google Scholar] [CrossRef]
  38. Kal-Yi, H. A synergistic automatic clustering technique (SYNERACT) for multispectral image Analysis. Photogramm. Eng. Remote Sens. 2002, 68, 33–40. [Google Scholar]
  39. Etter, A.; McAlpine, C.; Wilson, K.; Phinn, S.; Possingham, H. Regional patterns of agricultural land use and deforestation in Colombia. Agric. Ecosyst. Environ. 2006, 114, 369–386. [Google Scholar] [CrossRef]
  40. Boukabara, S.; Krasnopolsky, V.; Stewart, J.Q.; Maddy, E.S.; Shahroudi, N.; Hoffman, R.N. Leveraging Modern Artificial Intelligence for Remote Sensing and NWP: Benefits and Challenges. Bull. Am. Meteorol. Soc. 2019, 100, 473–491. [Google Scholar] [CrossRef]
  41. Geiß, C.; Pelizari, P.A.; Tunçbilek, O.; Taubenböck, H. Semi-supervised learning with constrained virtual support vector machines for classification of remote sensing image data. Int. J. Appl. Earth Obs. Geoinf. 2023, 125, 103571. [Google Scholar] [CrossRef]
  42. Ahmed, N.; Atzberger, C.; Zewdie, W. Integration of remote sensing and bioclimatic data for prediction of invasive species distribution in data-poor regions: A review on challenges and opportunities. Env. Syst. Res. 2020, 9, 32. [Google Scholar] [CrossRef]
  43. Kumar, M.; Padalia, H.; Singh, H. Remote sensing for mapping invasive alien plants: Opportunities and challenges. In A Handbook on Invasive Species, 1st ed.; Devi, K., Chaudhary, S.V., Kalia, S., Mishra, S.R., Eds.; Indian Council of Forestry Research and Education: Dehradun, India, 2020; Volume 1, pp. 16–31. [Google Scholar]
  44. Arasumani, M.; Bunyan, M.; Robin, V.V. Opportunities and challenges in using remote sensing for invasive tree species management, and in the identification of restoration sites in tropical montane grasslands. J. Environ. Manag. 2021, 280, 111759. [Google Scholar] [CrossRef] [PubMed]
  45. Shiferaw, H.; Bewket, W.; Eckert, S. Performances of machine learning algorithms for mapping fractional cover of an invasive plant species in a dryland ecosystem. Ecol. Evol. 2019, 9, 2562–2574. [Google Scholar] [CrossRef] [PubMed]
  46. Ouma, Y.O.; Gabasiane, T.G.; Nkhwanana, N. Mapping Prosopis L. (Mesquites) Using Sentinel-2 MSI Satellite Data, NDVI and SVI Spectral Indices with Maximum-Likelihood and Random Forest Classifiers. J. Sens. 2023, 2023, 18. [Google Scholar] [CrossRef]
  47. Huang, C.Y.; Asner, G.P. Applications of remote sensing to alien invasive plant studies. Sensors 2009, 9, 4869–4889. [Google Scholar] [CrossRef] [PubMed]
  48. Sims, D.A.; Gamon, J.A. Estimation of vegetation water content and photosynthetic tissue area from spectral reflectance: A comparison of indices based on liquid water and chlorophyll absorption features. Remote Sens. Environ. 2003, 84, 526–537. [Google Scholar] [CrossRef]
  49. Cervantes, J.; Garcia-Lamont, F.; Rodríguez-Mazahua, L.; Lopez, A. A comprehensive survey on support vector machine classification: Applications, challenges and trends. Neurocomputing 2020, 408, 189–215. [Google Scholar] [CrossRef]
  50. Vapnik, V. The Nature of Statistical Learning Theory, 2nd ed.; Michael, J., Lawless, J., Lauritzen, S., Nair, V., Eds.; Springer: Berlin/Heidelberg, Germany, 2000. [Google Scholar]
  51. Shang, X.; Chisholm, L. Classification of Australian Native Forest Species Using Hyperspectral Remote Sensing and Machine-Learning Classification Algorithms. IEEE J. Sel. Top. Appl. Earth Obs. Remote Sens. 2014, 7, 2481–2489. [Google Scholar] [CrossRef]
  52. Cutler, D.R.; Edwards, T.C.; Beard, K.H.; Cutler, A.; Hess, K.T.; Gibson, J.; Lawler, J.J. Random Forests for Classification in Ecology. Ecology 2007, 88, 2783–2792. [Google Scholar] [CrossRef]
  53. Hernández-Blanco, Y.; Fernández-Rigondeaux, Y. Estudio de la evolución del sistema de asentamientos humanos de la provincia de Ciego de Ávila en el período 1981-2012. Noved. Poblac. 2019, 29, 192–202. [Google Scholar]
  54. Oficina Nacional de Estadística e Información República de Cuba (ONEI). Censo de Población y Viviendas 2012. Cuba. 2012. Available online: http://www.onei.gob.cu/node/13001 (accessed on 16 February 2023).
  55. Kulkarni, K.; Vijaya, P.A. Separability analysis of the band combinations for land cover classification of satellite images. Int. J. Eng. Trends Technol. 2021, 69, 138–144. [Google Scholar] [CrossRef]
  56. R Core Team. R: A Language and Environment for Statistical Computing; R Foundation for Statistical Computing: Vienna, Austria, 2018. [Google Scholar]
  57. Sheykhmousa, M.; Mahdianpari, M.; Ghanbari, H.; Mohammadimanesh, F.; Ghamisi, P.; Homayouni, S. Support Vector Machine Versus Random Forest for Remote Sensing Image Classification: A Meta-Analysis and Systematic Review. IEEE J. Sel. Top. Appl. Earth Obs. Remote Sens. 2020, 13, 6308–6325. [Google Scholar] [CrossRef]
  58. Liaw, A.; Weiner, M. randomForest: Breiman and Cutler’s Random Forests for Classification and Regression; cran.r-project, R Package Version 4.6-7; R Package: Vienna, Austria, 2012. [Google Scholar]
  59. Congalton, R.G.; Green, K. Assessing the Accuracy of Remotely Sensed Data, 2nd ed.; CRC Press: Boca Raton, FL, USA, 2009. [Google Scholar]
  60. Olofsson, P.; Foody, G.M.; Stehman, S.V.; Woodcock, C.E. Making better use of accuracy data in land change studies: Estimating accuracy and area and quantifying uncertainty using stratified estimation. Remote Sens. Environ. 2013, 129, 122–131. [Google Scholar] [CrossRef]
  61. Anaya, J.A.; Rodríguez-Buriticá, S.; Londoño, M.C. Clasificación de cobertura vegetal con resolución espacial de 10 metros en bosques del Caribe colombiano basado en misiones Sentinel 1 y 2. Rev. Teledetec. 2023, 61, 29–41. [Google Scholar] [CrossRef]
  62. Congalton, R.G. A review of assessing the accuracy of classifications of remotely sensed data. Remote Sens. Environ. 1991, 37, 35–46. [Google Scholar] [CrossRef]
  63. Sauro, J.; Lewis, J.R. Estimating completion rates from small samples using binomial confidence intervals: Comparisons and recommendations. In Proceedings of the Human Factors and Ergonomics Society Annual Meeting, Orlando, FL, USA, 26–30 September 2005; SAGE Publications: Thousand Oaks, CA, USA; Sage: Los Angeles, CA, USA, 2005. [Google Scholar]
  64. He, H.; Garcia, E.A. Learning from Imbalanced Data. IEEE Trans. Knowl. Data Eng. 2009, 21, 1263–1284. [Google Scholar]
  65. Fawcett, T. An introduction to ROC analysis. Pattern Recog. Lett. 2006, 27, 861–874. [Google Scholar] [CrossRef]
  66. Bradley, A.P. The use of the area under the ROC curve in the evaluation of machine learning algorithms. Pattern Recognit. 1997, 30, 1145–1159. [Google Scholar] [CrossRef]
  67. Demšar, J. Statistical comparisons of classifiers over multiple data sets. J. Mach. Learn. Res. 2006, 7, 1–30. [Google Scholar]
  68. Foody, G.M. Classification accuracy comparison: Hypothesis tests and the use of confidence intervals in evaluations of difference, equivalence and non-inferiority. Remote Sens. Environ. 2009, 113, 1658–1663. [Google Scholar] [CrossRef]
  69. Tonbul, H.; Colkesen, I.; Kavzoglu, T. Classification of poplar trees with object-based ensemble learning algorithms using Sentinel-2A imagery. J. Geod. Sci. 2020, 10, 14–22. [Google Scholar] [CrossRef]
  70. Ndlovu, H.S.; Sibanda, M.; Odindi, J.; Buthelezi, S.; Mutanga, O. Detecting and mapping the spatial distribution of Chromoleana odorata invasions in communal areas of South Africa using Sentinel-2 multispectral remotely sensed data. Phys. Chem. Earth Parts A/B/C 2022, 126, 103081. [Google Scholar] [CrossRef]
  71. Pouteau, R.; Meyer, J.Y.; Taputuarai, R.; Stoll, B. Support vector machines to map rare and endangered native plants in Pacific islands forests. Ecol. Inform. 2012, 9, 37–46. [Google Scholar] [CrossRef]
  72. Linhui, L.; Weipeng, J.; Huihui, W. Extracting the forest type from remote sensing images by random forest. IEEE Sens. J. 2020, 21, 17447–17454. [Google Scholar] [CrossRef]
  73. Jombo, S.; Adam, E. Comparison between Maximum likelihood and Support Vector Machines classifiers in mapping urban tree species using spot 7 imagery. In Geography and Community Research, Learning, Impact, Proceedings of the Biennial Conference of the Society of South African Geographers; University of the Free State: Bloemfontein, South Africa, 2018; Volume 1, p. 684. [Google Scholar]
  74. Wulder, M.A.; Hermosilla, T.; White, J.C.; Hobart, G.; Masek, J.G. Augmenting Landsat time series with Harmonized Landsat Sentinel-2 data products: Assessment of spectral correspondence. Sci. Remote Sens. 2021, 4, 100031. [Google Scholar] [CrossRef]
  75. Galford, G.L.; Fernandez, M.; Roman, J.; Monasterolo, I.; Ahamed, S.; Fiske, G.; González Díaz, P.; Kaufman, L. Cuban land use and conservation, from rainforests to coral reefs. Bull. Mar. Sci. 2018, 94, 171–191. [Google Scholar] [CrossRef]
  76. Valero-Jorge, A.; González-De Zayas, R.; Alcántara-Martín, A.; Álvarez-Taboada, F.; Matos-Pupo, F.; Brown-Manrique, O. Water area and volume calculation of two reservoirs in Central Cuba using remote sensing methods. A new perspective. Rev. Teledetec. 2022, 60, 71–87. [Google Scholar] [CrossRef]
Figure 1. Location of the study area: Ciego de Ávila province (Cuba).
Remotesensing 16 00798 g001
Figure 2. Flowchart of the approach followed in this study.
Remotesensing 16 00798 g002
Figure 3. In Cuba, the D. cienerea is an invasive species that has spread rapidly throughout the country. (A) = young plants of D. cinerea, (B) = internal structure of a D. cinerea forest, (C) = expansion of a D. cinerea forest in a savannah in the province of Ciego de Ávila, and (D) = the D. cinerea plant in bloom.
Remotesensing 16 00798 g003
Figure 4. Spatial distribution of the validation points for 1994 (a) and 2022 (b).
Remotesensing 16 00798 g004
Figure 5. Spectral signatures of D. cinerea, woodland, and rainfed crops for 1994 (a) and 2022 (b).
Remotesensing 16 00798 g005
Figure 6. Spatial distribution of D. cinerea (marabú) areas in 1994 (a) and in 2022 (b) in the Ciego de Ávila province using the RF classifier.
Remotesensing 16 00798 g006
Table 1. Land use and land cover classes located in the study area and the number of training areas for each class.
LULCDescriptionTraining Areas
(Polygons/Pixels)
19942022
D. cinerea (marabú)Refers to wooded and scrub areas of D. cinerea44/30862/310
GrasslandIncludes areas of natural herbaceous vegetation or grass cover63/50454/432
Irrigated cropsIncludes herbaceous and woody crops under irrigated conditions161/96671/726
Rainfed cropsIncludes dryland herbaceous crops that depend on rainfall for water69/55244/564
WoodlandNatural areas of tree vegetation, such as forests of any species64/74382/738
MangroveIncludes coastal areas of mangroves as the main vegetation166/1358147/1323
Flood-prone areasIncludes flooded crops and areas near the coast with a high potential for flooding152/1912128/1152
Bare soilIncludes areas devoid of vegetation, dirt roads, fallow lands, mining deposits, etc. (uncovered soils)130/91281/648
InfrastructureIncludes built-up areas, generally with urban or industrial use, and paved roads86/51694/658
WaterBodies of water such as rivers, ponds, or reservoirs.64/38468/544
Table 2. General accuracy results for the 1994 and 2022 classifications. Producer accuracy (PA), user accuracy (UA) for Dichrostachys cinerea, and overall accuracy (OA) values are expressed in %. The Wald-adjusted confidence intervals (p < 0.05) are shown for OA, PA, and UA. The area under the ROC curve (AUC) and F-score is shown for the target class Dichrostachys cinerea.
D. cinereaAll Classes
YearAlgorithmPA (%)UA (%)AUCF-ScoreOA (%)
1994RF83.64 (71.51–91.37)93.88 (82.85–98.52)0.920.8890.91 (88.20–93.05)
ML58.18 (45.02–70.27)86.49 (71.55–94.56)0.720.6978.18 (74.54–81.44)
SVM56.36 (43.26–68.63)83.78 (68.48–92.73)0.690.6774.73 (70.93–78.18)
2022RF98.18 (89.49–99.99)96.43 (87.18–99.72)0.970.9795.09 (92.93–96.63)
ML80.00 (67.46–88.62)74.58 (62.11–84.04)0.870.7777.63 (73.96–80.93)
SVM80.00 (67.46–88.62)64.71 (52.81–75.02)0.720.7171.27 (67.35–74.90)
Table 3. McNemar’s comparison of classifier performances. Note: test values > 3.84 show that there is a statistical difference at a 95% confidence level. Bold values show calculated statistics smaller than the critical value (χ2 0.05) = 3.84).
YearPairwise ComparisonMcNemar´s
1994RF vs. ML28.82
RF vs. SVM41.91
ML vs. SVM1.39
2022RF vs. ML61.44
RF vs. SVM92.76
ML vs. SVM4.35
Table 4. LULC proportions for each class in hectares (ha) and percentage of the total area for 1994 and 2022.
LULC Classes19942022
Ha% of Total AreaHa% of Total Area
Water12,799.422.0412,898.862.05
Woodland44,241.827.0730,613.684.86
Infrastructure11,410.921.8231,160.164.95
Grassland163,501.1226.14125,860.5820.01
Irrigated crops19,320.33.0817,264.192.74
Bare soil16,622.472.6573,823.7112.33
Flood-prone areas95,312.7915.2499,268.1415.78
D. cinerea61,977.599.9191,533.4714.56
Mangrove25,871.494.1419,229.403.06
Rainfed crops174,248.4627.86123,366.6819.62
Table 5. Areas covered by D. cinerea (by municipality and total) in 1994 and 2022 in the Ciego de Ávila province.
MunicipalityArea 1994 (ha)Area 2022 (ha)Net Change (ha)% of Class Area in 1994
Primero de Enero10,229.0813,061.792832.7127.69
Majagua3180.966737.713556.75111.81
Ciro Redondo9869.367898.66−1970.70−19.96
Florencia6238.197387.681149.0018.41
Ciego de Ávila6468.686364.71−103.97−1.61
Bolivia8831.2818,729.049897.76112.07
Morón3257.555834.082576.5379.09
Chambas7396.348649.631253.2938.47
Baraguá4563.045994.611431.5731.37
Venezuela1943.1110,875.568932.45459.69
Table 6. The overall net changes in LULCs in hectares (ha): the percentage of the total study area by class and the percentage of change for each class between 1994 and 2022 with the base area being 1994. These changes were calculated for the 1994–2022 time period.
Net Changes 1994–2022
LULCha% of Total Area% of Change per Class by Area from 1994 to 2022
Water99.440.010.77
Woodland−13,268.14−2.21−29.99
Infrastructure19,749.243.13173.07
Grassland−37,640.54−6.13−23.02
Irrigated crops−2056.11−0.34−10.64
Bare soil60,929.249.68366.54
Flood-prone areas3955.350.544.14
D. cinerea29,555.884.6547.68
Mangrove−6642.09−1.08−25.67
Rainfed crops−50,881.78−8.24−29.20
Table 7. The net impact of D. cinerea invasion on individual LULCs for the period from 1994 to 2022. Losses to D. cinerea: changes from a LULC in 1994 to D. cinerea in 2022. Gains from D. cinerea: changes from D. cinerea in 1994 to other LULCs in 2022.
LULCLosses to D. cinerea (ha)Gains from D. cinerea (ha)Net Change (ha)% of Change for the Total Area from 1994 to 2022
Water24.30101.0776.770.59
Woodland24,691.057900.38−16,790.67−37.95
Infrastructure288.271860.211571.9413.77
Grassland18,838.8014,652.36−4186.44−2.56
Irrigated crops1388.431196.01−192.42−1.00
Bare soil1212.845166.993954.1523.78
Flood-prone areas6477.034392.27−2084.76−2.19
Mangrove1135.2655.53−1079.73−4.17
Rainfed crops20,031.3913,260.15−6771.24−3.88
Disclaimer/Publisher’s Note: The statements, opinions and data contained in all publications are solely those of the individual author(s) and contributor(s) and not of MDPI and/or the editor(s). MDPI and/or the editor(s) disclaim responsibility for any injury to people or property resulting from any ideas, methods, instructions or products referred to in the content.

