Article

Temporal and Spatial Assessment of Carbon Flux Dynamics: Evaluating Emissions and Sequestration in the Three Northern Protection Forest Project Areas Supported by Google Earth Engine

1
Precision Forestry Key Laboratory of Beijing, Beijing Forestry University, Beijing 100083, China
2
Southern Marine Science and Engineering Guangdong Laboratory (Guangzhou), Guangzhou 511458, China
3
School of Ecology, Environment and Resources, Guangdong University of Technology, Guangzhou 510006, China
4
Tianjin Centre of Geological Survey, China Geological Survey, Tianjin 300170, China
5
School of Geographical Sciences, Harbin Normal University, Harbin 150028, China
6
School of Instrumentation and Optoelectronic Engineering, Beihang University, Beijing 100083, China
*
Author to whom correspondence should be addressed.
Remote Sens. 2024, 16(5), 777; https://doi.org/10.3390/rs16050777
Submission received: 10 January 2024 / Revised: 8 February 2024 / Accepted: 12 February 2024 / Published: 23 February 2024

Abstract

:
Contemporary research on terrestrial carbon exchange processes is paramount for a nuanced comprehension of global and local climatic fluctuations and their interaction with anthropogenic activities. This study delves into the spatiotemporal dynamics of vegetation carbon exchanges within the Three Northern Protection Forest Project Area, leveraging two decades of MODIS NPP data and an innovative NEP estimation model. Our analysis highlights a generally increasing trend in Net Ecosystem Productivity (NEP) from 2000 to 2020, with significant growth in approximately 32.97% of the study area and slight increases in 24.18%. Notably, lower NEP values were found in desert and arid zones, whereas higher values were observed in more vegetated regions like Ningxia, Hebei, Inner Mongolia, and the northeast. The study also assesses the impact of climate variables and land-use changes on NEP, identifying both negative and positive correlations in specific regions. Despite the overall positive trend towards ecological restoration and enhancement, significant uncertainties remain, emphasizing the urgent need for further research to support ecosystem resilience and sustainable management practices.

1. Introduction

The carbon cycle is fundamental to our understanding of Earth’s ecological systems, offering essential insights into how ecosystems respond to climate change and highlighting the significant impact of anthropogenic activities on these dynamics [1,2]. As such, carbon cycle research has become a pivotal theme in global climate change discourse, attracting extensive international focus [3,4]. The role of terrestrial vegetation in the carbon cycle is particularly critical. Recent studies have extended beyond Gross Primary Productivity (GPP) [5,6,7] and Net Primary Productivity (NPP) [8,9,10] to broader aspects like estimating Net Ecosystem Productivity (NEP), determining regional carbon budgets, and assessing carbon sources and sinks comprehensively [4,11].
Recent IPCC reports underscore the growing impact of climate change on the carbon cycle, underscoring the necessity for robust methods to assess carbon emissions at both regional and global scales, particularly to glean critical insights into the interplay between human activities and natural processes on carbon balance. Terrestrial ecosystems, recognized both domestically and internationally for their pivotal role in sequestering atmospheric CO2 and acting as significant carbon sinks [12], remain a major research focus. However, accurately estimating carbon sinks and their spatial distribution continues to pose significant challenges. NEP is a key metric in this context, quantifying an ecosystem’s net carbon balance over a particular period [13]. The methodologies to estimate carbon sinks are diverse, incorporating field surveys [14], ecosystem flux measurements [15,16], atmospheric inversion [17,18], and model simulations [19,20], among others.
Each method has its advantages and limitations. Field surveys provide detailed, site-specific information on biomass, soil organic carbon, and vegetation characteristics but are limited in scope and require significant effort. Ecosystem flux measurements offer precise, real-time data on carbon flows within ecosystems but need lengthy data-collection periods for comprehensive analysis. Atmospheric inversion techniques estimate carbon sinks by monitoring atmospheric CO2 levels, covering large areas, but they are affected by atmospheric changes. Model simulations, using ecological models and meteorological data, allow for future predictions but depend on the accuracy and robustness of the models. Thus, selecting appropriate methods or their combination for carbon sink estimation largely depends on the research objectives and resources available, aiming for an all-encompassing dataset compilation without overstating the merits of one’s own work.
Located in the dry and semi-dry zones of Northern China, the Three Northern Protection Forest Project Area exemplifies China’s efforts in afforestation and environmental restoration across its arid regions of the northwest, North China, and northeast. This comprehensive initiative supports environmental protection, ecological improvement, climate change mitigation, biodiversity conservation, and sustainability [21,22,23,24]. Notably, the area has experienced an upward trend in annual, growing season, and non-growing season precipitation. Within the Three Northern Project Area, grasslands, as the dominant ecosystem, account for approximately 63.29% of the area, underscoring their importance in the regional ecosystem. This is followed by forested and agricultural lands, which constitute 16.33% and 13.99% of the area, respectively.
Due to its significance, this study critically assesses the spatiotemporal dynamics of carbon sources and sinks within the Three Northern Protection Forest Project Area. It focuses on: (i) understanding the role of vegetation in carbon sequestration and the effects of afforestation and restoration on carbon dynamics; (ii) exploring NEP variations using two decades of MODIS NPP data and a quantitative NEP model; and (iii) examining NEP’s relationship with key climate variables like temperature and precipitation from 2000 to 2020 to identify regions with varying correlations. Through evaluating ecological restoration’s influence on the carbon cycle and discerning NEP trends over 20 years, this research aims to forecast future shifts and contribute to strategies bolstering ecosystem resilience.

2. Data and Methodology

2.1. Overview of the Research Region and Data Source

2.1.1. The Research Region

The Three Northern Regions, as illustrated in Figure 1, encompass an expansive area, comprising 725 counties, including banners and districts, across 13 provinces, autonomous regions, and municipalities within China. This region, accounting for a considerable 42.4% of the country’s total land surface, is of significant geographic and ecological relevance. The climatic conditions across these regions predominantly feature a temperate continental climate, with some areas exhibiting polar and high-altitude mountain climate characteristics presenting a diverse range of environmental conditions [25]. The topography is characterized by its complexity and diversity, with a variety of geographical features including plateaus, mountains, plains, and deserts. Such varied terrain fosters a diverse array of surface land cover types, such as grasslands, forests, wetlands, and deserts, each integral to the region’s unique ecological tapestry [26].
In terms of human geography, there is an uneven population distribution, with a majority residing in the more fertile and accessible eastern regions, contrasting with the sparser populations in the western areas. This disparity has profound implications for the region’s economic activities and land-use patterns, predominantly based on agriculture and livestock farming, alongside notable industrial activities and an emerging tourism sector, illustrating a dynamic interaction between human activity and the natural environment. The study area’s boundaries are defined based on the demarcations provided by the Chinese Academy of Sciences’ Resource and Environment Data Center (https://www.resdc.cn/, accessed on 10 November 2022). The delineation is strategically selected to analyze the carbon sequestration processes, the impacts of climate change, and human activities comprehensively, emphasizing the importance of this region in understanding the broader environmental conservation and ecological restoration efforts within China.

2.1.2. Data Source

As shown in Table 1, the primary dataset underpinning the Net Primary Productivity (NPP) analysis in this study was sourced from the MOD17A3HGF.006 dataset, which offers annual NPP data. This dataset, with a spatial resolution of 500 m, spans from 2000 to 2020 and is readily available through the Google Earth Engine (GEE) platform (https://earthengine.google.com). The integration of this dataset into GEE leverages the platform’s advanced data processing capabilities, enabling the efficient handling and analysis of extensive satellite imagery and datasets. GEE facilitates the processing and examination of large-data volumes, allowing for a detailed exploration of NPP temporal and spatial patterns across the expansive study area. The inclusion of the MOD17A3HGF.006 dataset within GEE highlights the platform’s value in advancing environmental analysis, offering researchers the necessary tools for in-depth ecosystem productivity evaluations.
This research utilized a monthly temperature dataset developed via Gaussian Process Regression (GPR) from weather station data, notable for its detailed 1 km spatial resolution. Such resolution offers an in-depth understanding of temperature fluctuations in the region, including monthly averages, maximums, and minimums, thereby providing significant data support for analyzing the area’s thermal dynamics [27]. Similarly, the precipitation dataset, created with the “anusplin4 4” spatial interpolation software, with its 1 km spatial resolution, supplies precise and comprehensive precipitation information for the study [28]. Both temperature and precipitation datasets were subjected to meticulous adjustments, including cropping and resampling, to conform to the 500 m spatial resolution of the NPP data. These harmonized datasets played a crucial role in calculating heterotrophic respiration and facilitating partial correlation analysis with Net Ecosystem Productivity (NEP).
Furthermore, this research incorporated geospatial vector data and land-cover classification products spanning from the years 2000 to 2020, sourced from the Resource and Environment Data Center of the Chinese Academy of Sciences (http://www.resdc.cn). The amalgamation of these varied and high-resolution datasets with sophisticated analytical techniques constituted the foundation of this study, substantially enriching our comprehension of carbon dynamics within the “Three North” region.

2.2. Methodological Framework

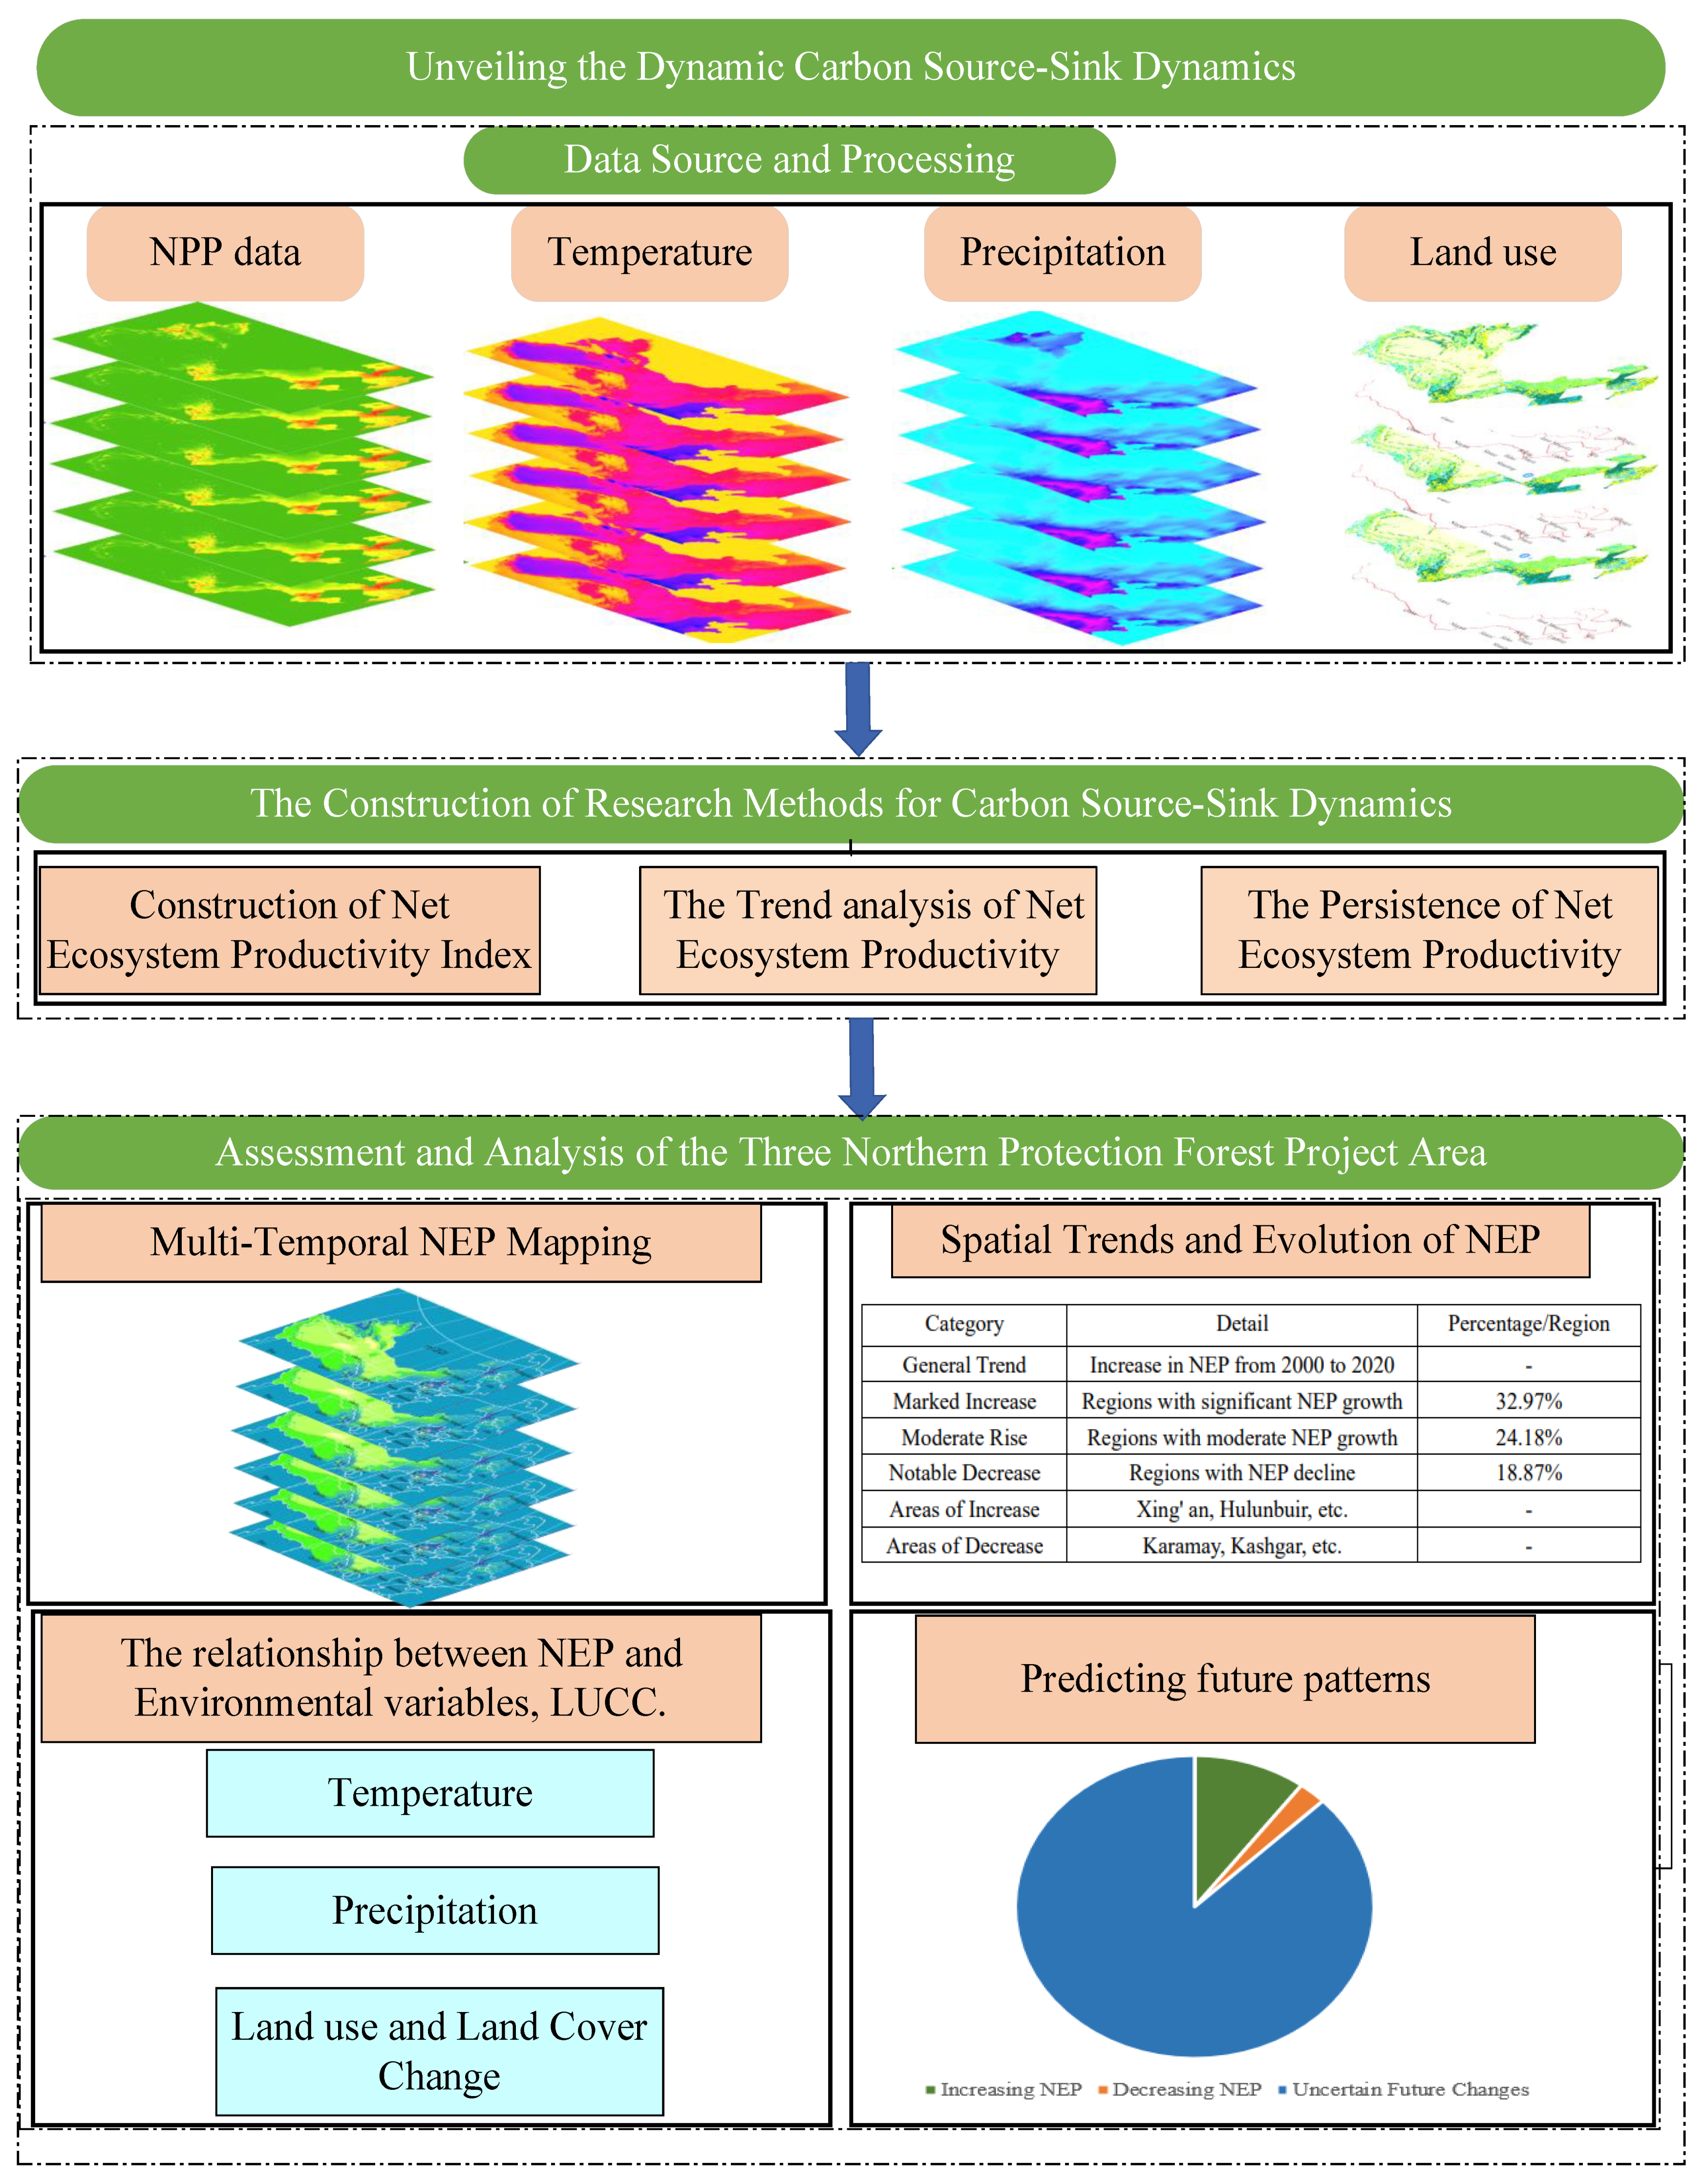
In this detailed study, a multifaceted approach was utilized, drawing from a variety of data sources and employing sophisticated analytical methods to explore Net Ecosystem Productivity (NEP) and its spatiotemporal variations within the targeted region. The methodology, depicted in Figure 2, unfolds through several critical phases:
(i) Data Acquisition and Preparation: The study commenced with the collection of an extensive MODIS NPP dataset covering a 20-year span, essential for evaluating vegetation’s net primary productivity. This dataset, including annual NPP values from 2000 to 2020, served as the foundation of the analysis. Additionally, relevant meteorological and geographical information was collected to enrich the study. A thorough data-cleaning process was undertaken to address any missing values and anomalies, followed by meticulous data formatting and geospatial alignment to ensure consistency and precision across datasets.
(ii) NEP Calculations and Simulations: With the datasets ready, the research moved to the complex tasks of calculating and simulating NEP. This stage focused on leveraging the prepared data to develop a comprehensive understanding of the net ecosystem productivity across the study area.
(iii) Analysis and Evaluation: This stage involved a broad spectrum of activities, such as multi-temporal NEP mapping, spatial trend analysis, and examining the connections between NEP variations and factors like temperature, precipitation, and land-use/cover change (LUCC). These efforts enabled researchers to deeply comprehend the dynamics of ecosystem productivity over time and its responsiveness to climatic shifts and human interventions. Furthermore, the insights from these analyses offer a scientific framework for predicting NEP’s future trajectory, thus supporting decision-makers and managers in crafting more impactful environmental conservation and sustainability strategies.
Figure 2. Illustrate the methodology utilized in this research with a diagram.
Remotesensing 16 00777 g002

2.2.1. Assessment of Net Ecosystem Productivity

Net Ecosystem Productivity (NEP), a fundamental metric in ecological research, encapsulates the net balance between the Net Primary Productivity (NPP) of vegetation and the carbon emissions attributable to soil microbial respiration (RH) within a particular ecosystem. This metric is instrumental in elucidating the role of ecosystems in the global carbon cycle. A positive NEP indicates that an ecosystem is functioning as a carbon sink, actively sequestering carbon dioxide from the atmosphere, while a negative NEP suggests that it operates as a carbon source, releasing more carbon than it absorbs [29,30].
This distinction holds critical significance in the realms of ecological health and carbon-balance management. Ecosystems demonstrating a sustained positive NEP are vital in the context of climate change, as they contribute to reducing atmospheric CO2 levels. On the other hand, ecosystems with negative NEP values signify regions where carbon release exceeds sequestration, underscoring the need for focused conservation and management interventions. An accurate assessment and comprehension of NEP enable researchers and policymakers to formulate more effective strategies aimed at preserving or augmenting the carbon-sequestration capacities of ecosystems. By focusing on NEP, we gain valuable insights into the ecological processes governing carbon dynamics, which is crucial for informed decision-making in environmental stewardship and climate change mitigation efforts.
The formula is as follows [31]:
N E P = N P P R H ,
N P P signifies the net primary productivity, while R H refers to heterotrophic respiration.
In this study, soil respiration ( R H ) was calculated using an empirical formula, and the calculation formula is as follows [32,33]:
R H = 0.22 × ( exp ( 0.0913   T ) + ln ( 0.3145 R + 1 ) ) × 30 × 46.5 % ,
T represents air temperature, R stands for precipitation, 30 corresponds to the number of days since monthly meteorological data are employed, and 46.5% represents the proportion of soil carbon emissions released through microbial respiration. This formula has been validated through on-site sampling in previous studies and can be applied for monitoring soil respiration in regions such as Northwestern China [31]. To adapt the proposed formula for global application, especially the “46.5% representing the proportion of soil carbon emissions released through microbial respiration”, these parameter values need to be adjusted based on specific regions. This percentage, derived from data in Northwestern China, may vary due to soil characteristics and environmental conditions in different regions. Researchers can obtain specific local values through field measurements, literature reviews, or model estimations. It is recommended to calibrate the necessary parameters for regional adaptability before applying the formula, to ensure the research’s accuracy and universality.

2.2.2. Analyzing Trends in Net Ecosystem Productivity

The Mann–Kendall test and Theil–Sen method were employed to analyze the interannual variations and dynamic changes in vegetation NEP from 2000 to 2020. The Mann–Kendall test is a non-parametric statistical method used to detect the presence and direction of trends in time-series data. Its primary objective is to identify monotonic trends in the time series without the need for assumptions about the data distribution. The core idea involves comparing the magnitudes of adjacent datapoints to determine whether the data exhibit an increasing or decreasing trend [34,35].
The Theil–Sen trend coefficient (β) is computed using the following calculation [36]:
β = M e d i a n ( N E P j N E P i j i ) ,
β represents the gradient of the N E P regression equation for the corresponding element, and N E P i   and N E P j   denote the time series values of NEP for the i-th and j-th years. When β is greater than zero, it indicates a positive trend in NEP over time, whereas when β is less than zero, it signifies a negative trend in NEP over time.
If the standardized value Z exceeds 0, the sequence demonstrates an ascending pattern; if it falls below 0, the sequence displays a descending trend. When the absolute magnitude of Z equals or surpasses 1.64, 1.96, and 2.58, it signifies that the time series has successfully undergone significance assessments at the confidence levels of 90%, 95%, and 99%, correspondingly [37]:

2.2.3. The Persistence of Net Ecosystem Productivity

The Hurst exponent is a statistical metric used to measure long-term memory or self-similarity in time-series data. It is commonly employed to analyze the volatility and persistence of trends in the time-series data. The Hurst exponent (H) falls within a range between 0 and 1 [38]. When the Hurst exponent (H) equals 0.5, it is considered a random walk, indicating no long-term memory or self-similarity in the evolution trend of the NEP in the Three Northern Protection Forest Project Area. When H is less than 0.5, the time series exhibits anti-persistence, meaning that the NEP trend in the Three Northern Protection Forest Project Area is opposite to previous trends. If 0.5 < H < 1, it indicates long-term memory in the time series, suggesting that the NEP trend is consistent with previous trends.

3. Results

3.1. Mapping and Temporal Analysis of Net Ecosystem Productivity Using Remote Sensing

Over the past two decades, the Net Ecosystem Productivity (NEP) within our study area has exhibited significant trends and distinct regional characteristics, which are discernible through cutting-edge remote-sensing technology. As delineated in Figure 3, our analysis revealed that areas with lower NEP values are predominantly concentrated in specific locales of the Xinjiang Uyghur Autonomous Region, including the Taklamakan Desert and Bayingolin Mongol Autonomous Prefecture. Similarly, decreased NEP values were observed in northwestern parts of the Inner Mongolia Autonomous Region, especially within the Alxa League. These findings indicate that unique environmental conditions prevalent in these regions, such as marked desertification and aridity, are likely contributing factors to the observed lower NEP values. The application of remote sensing in this study not only augments the spatial precision of our mapping but also facilitates a deeper understanding of the temporal dynamics of ecosystem productivity, thereby enabling a nuanced exploration of the environmental influences on ecological productivity across these diverse geographical areas.
The findings indicate that certain regions exhibited notably high Net Ecosystem Productivity (NEP) values, underscoring a significant geographical diversity. Notably, in the Xinjiang Uyghur Autonomous Region, areas such as the Ili Kazakh Autonomous Prefecture and cities in its northwestern part, including Urumqi and Altay, stood out. In Gansu Province, the trend was observed in its eastern and central parts, including cities like Xining and Wuwei. Similarly, the Ningxia Hui Autonomous Region showed high NEP values across its territory, with cities like Yinchuan marking significant observations. Further, Hebei Province’s northern city of Zhangjiakou, the Inner Mongolia Autonomous Region’s eastern and northeastern parts, including Xing’an League and Hulunbuir, and several cities in the northeast region, such as Harbin and Jilin, also exhibited high NEP values. These areas commonly displayed NEP values exceeding 300 gCm−2a−1 per unit area, indicating a robust ecosystem productivity.
From a broader temporal standpoint covering the years 2000 to 2020, a general increasing trend in NEP was observed across the study area, albeit with fluctuations. The average carbon sink value rose from 56.916367 gCm−2a−1 in 2000 to 101.0944 gCm−2a−1 in 2005, followed by a marginal increase to 103.133156 gCm−2a−1 in 2010, and it eventually reached 132.78133 gCm−2a−1 in 2020. Concurrently, the average carbon source value exhibited a decreasing trajectory, declining from −42.685974 gCm−2a−1 in 2000 to −22.612026 gCm−2a−1 in 2010, and further to −8.049237 gCm−2a−1 in 2020.
These observations underscore a substantial shift in the carbon balance within the region, reflecting an overall augmentation in the ecosystem’s capacity to function as a carbon sink. This trend signifies positive ecological progress and bears significant implications for regional environmental management and climate change-mitigation strategies.

3.2. Spatial Patterns of NEP in the Three Northern Protection Forest Project Area

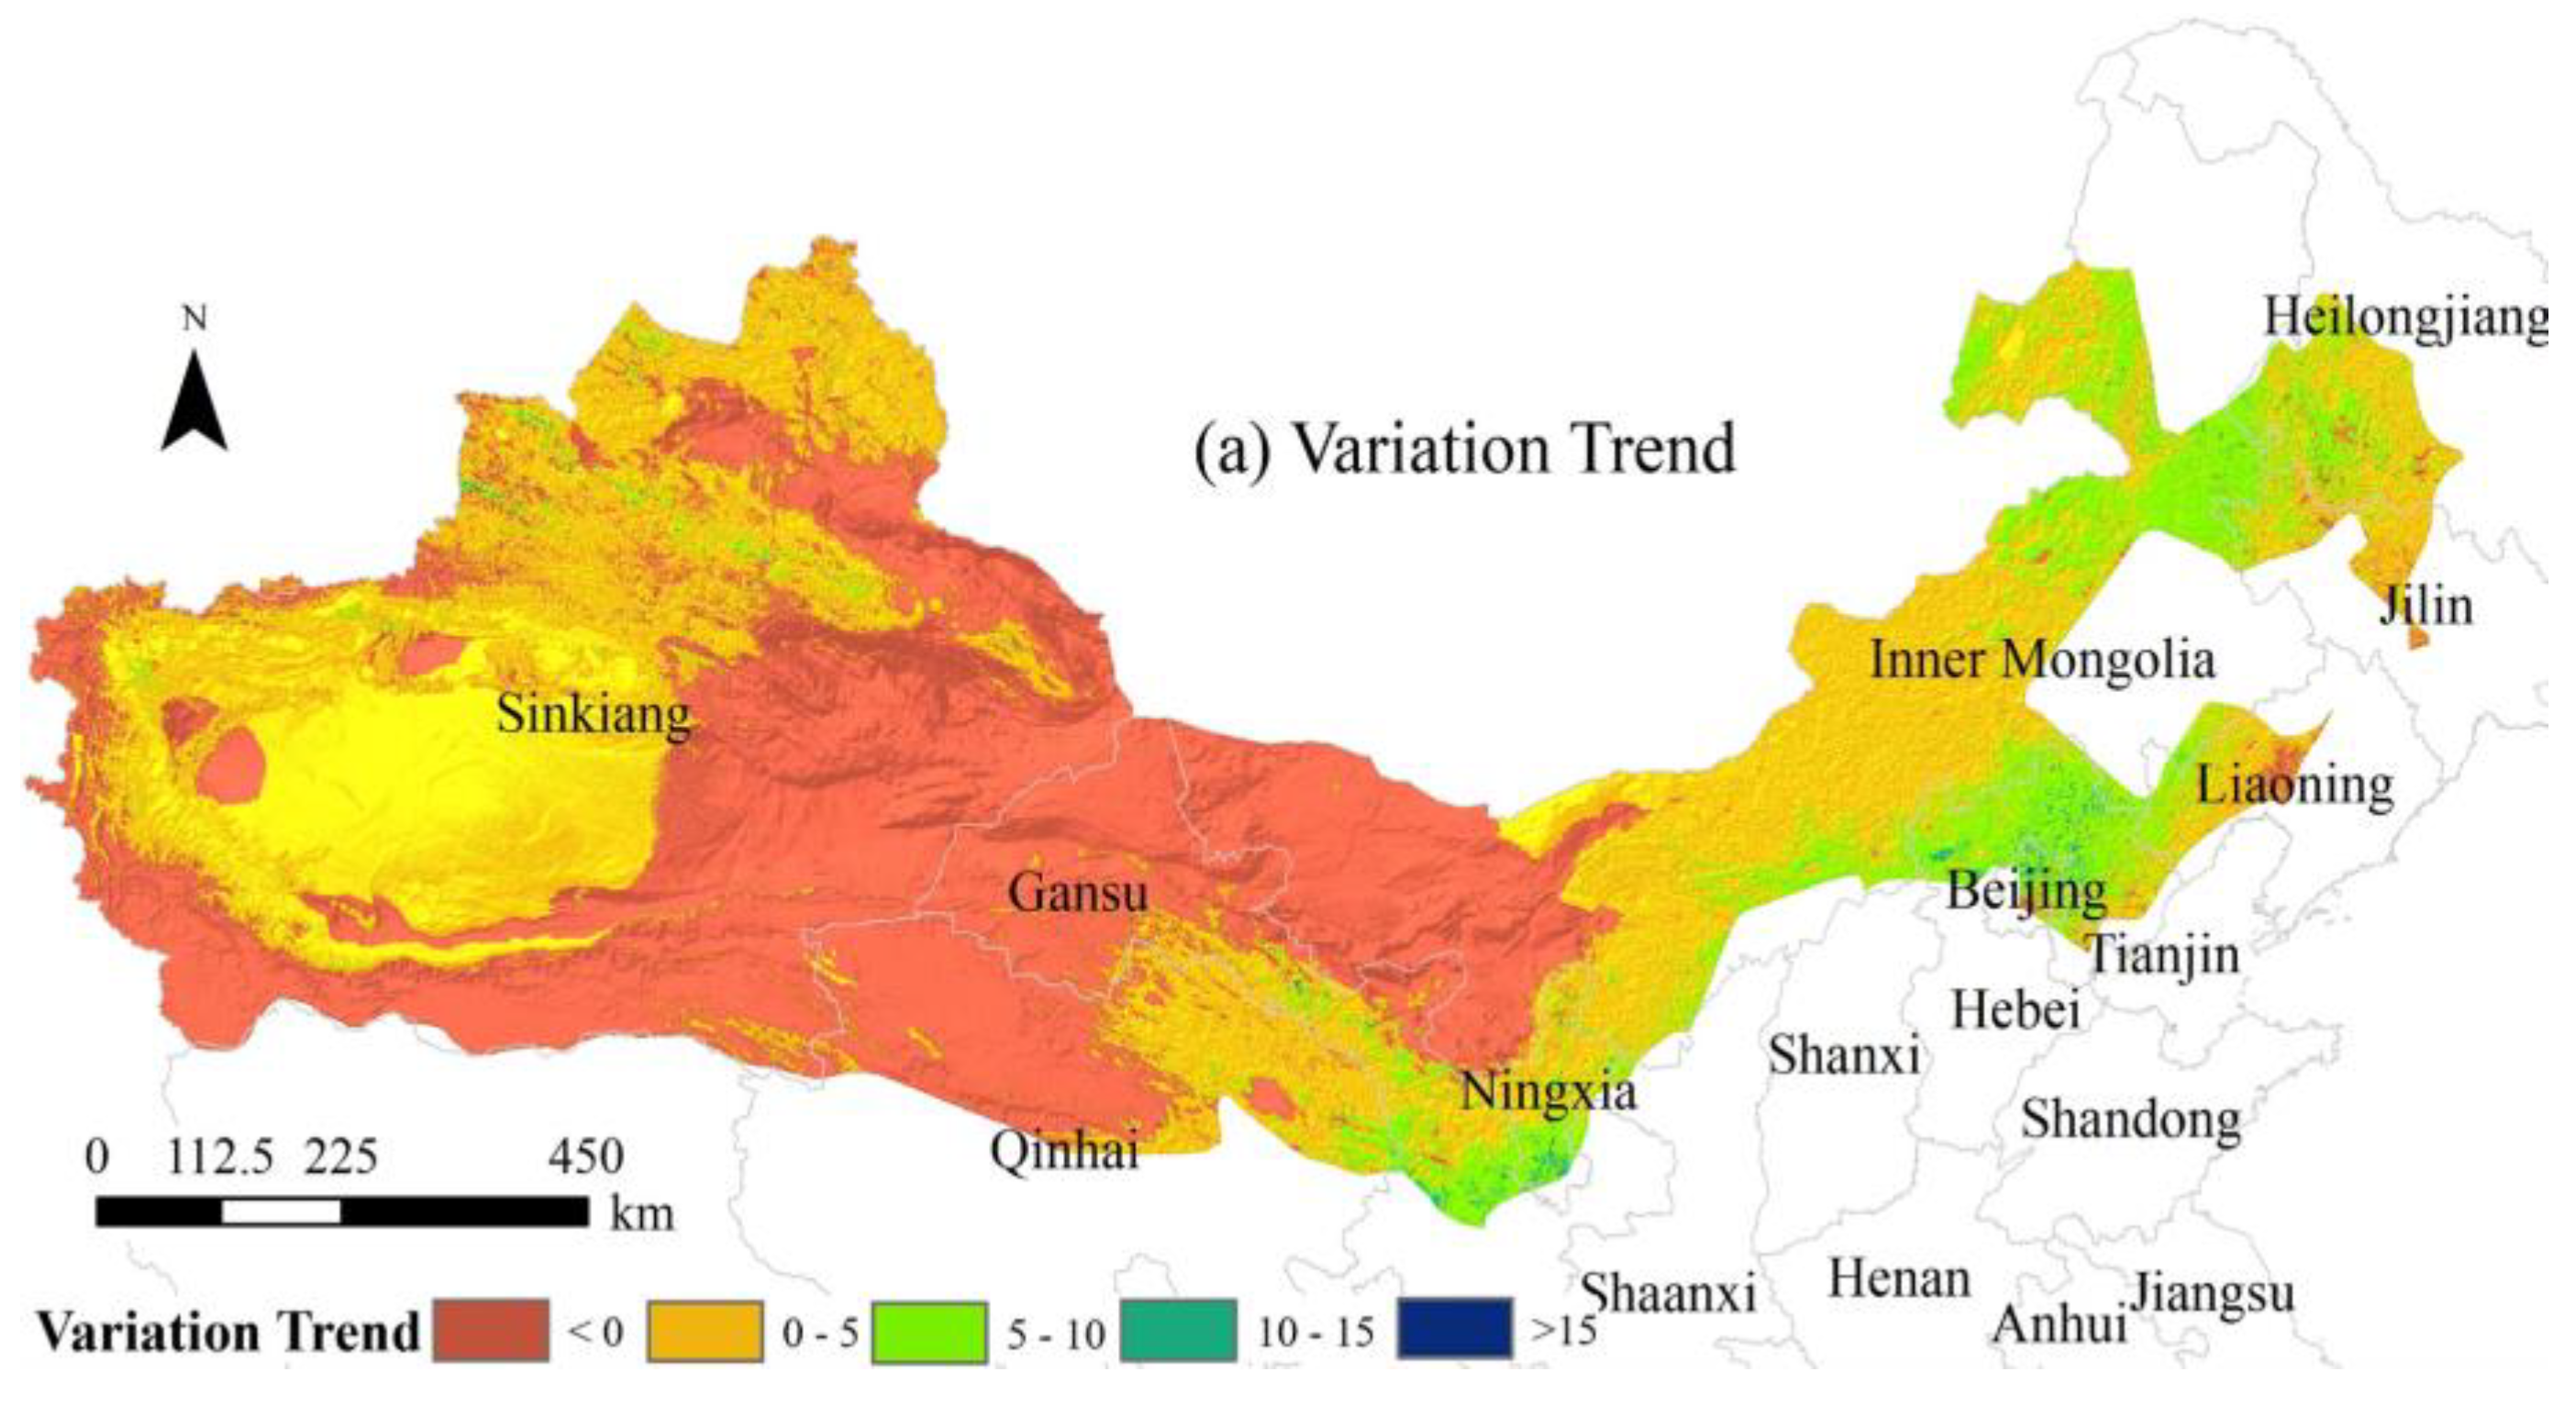
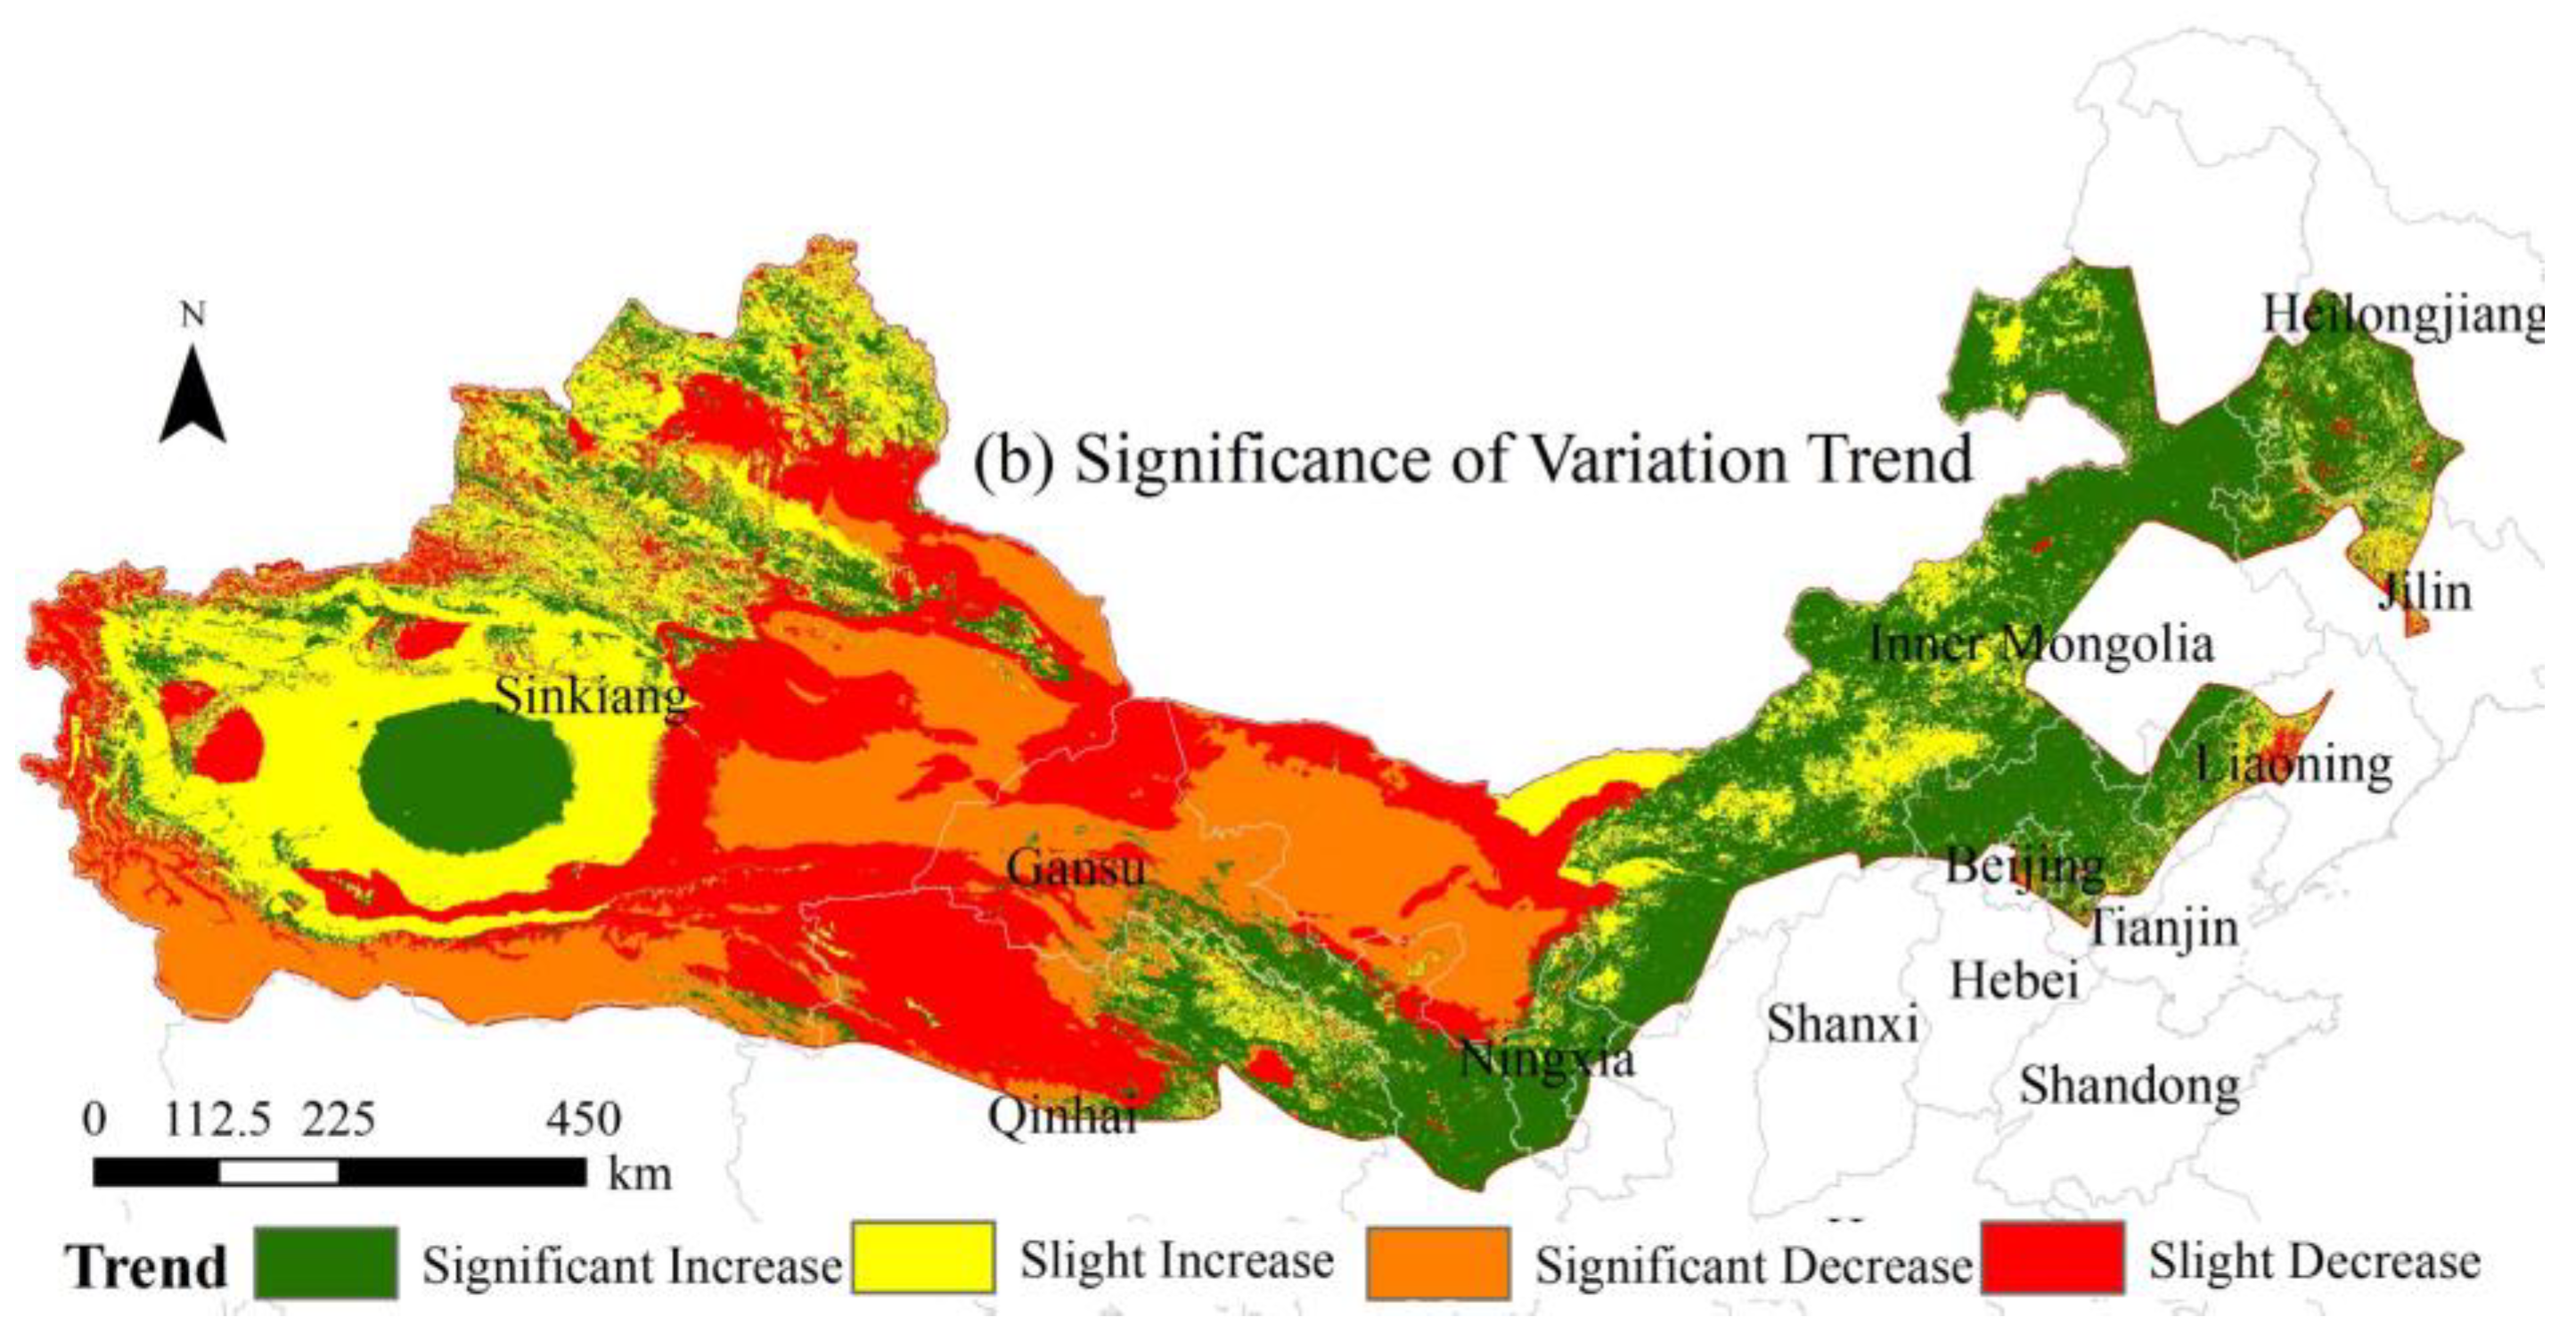
In our investigation, delineated in Figure 4, we employed the Theil–Sen trend assessment and Mann–Kendall tests to conduct an exhaustive examination of the spatial dynamics and evolution of Net Ecosystem Productivity (NEP) within the Three Northern Protection Forest Project Area over the span of two decades from 2000 to 2020. The study revealed significant spatial variations in the interannual patterns of NEP per unit area, with a predominant trend of increasing NEP across the region. Notably, the extent of areas exhibiting an upward trend in NEP significantly surpassed those with a declining trend, indicating a widespread pattern of ecosystem recovery and enhancement.
As Figure 5 highlights, our findings demonstrate that a substantial 32.97% of the areas experienced a marked increase in NEP, with an additional 24.18% showing moderate increases. In contrast, only 18.87% of the regions exhibited significant decreases in NEP. This distribution suggests a positive trajectory in ecological restoration and the amplification of ecological benefits within the region, carrying crucial implications for environmental conservation and sustainable development efforts.
As illustrated in Figure 4, this study identified significant increases in Net Ecosystem Productivity (NEP) primarily in Xing’an League and Hulunbuir City in Inner Mongolia, Baicheng City in the Northeast, Zhangjiakou and Chengde Cities in Hebei, Yinchuan, Baiyin, and Guyuan Cities in Ningxia, as well as Hotan Prefecture, Bayingolin Mongol Autonomous Prefecture, Western Tianshan, and Altay Prefecture in Xinjiang. These increases are closely linked to local vegetation-restoration efforts, effective environmental management policies, and favorable climatic conditions. Conversely, notable decreases in NEP were mainly observed in Karamay and parts of Kashgar City in Xinjiang, Alxa League in Inner Mongolia, Haixi Mongol and Tibetan Autonomous Prefecture in Qinghai, and specific areas of Jiuquan City in Gansu Province, likely due to human activities and environmental pressures such as overgrazing, land degradation, and water scarcity.
This comprehensive study not only illuminates the ecological health of ecosystems within the Three Northern Protection Forest Project Area but also underscores the critical need for ongoing monitoring and effective management of the region’s ecological environment. The observed upward trend in NEP is a testament to the success of long-term conservation strategies and sustainable land-management practices, playing an integral role in promoting and maintaining the ecological balance of the region.

3.3. Correlation between NEP and Environmental Variables in the Three Northern Protection Forest Project Area

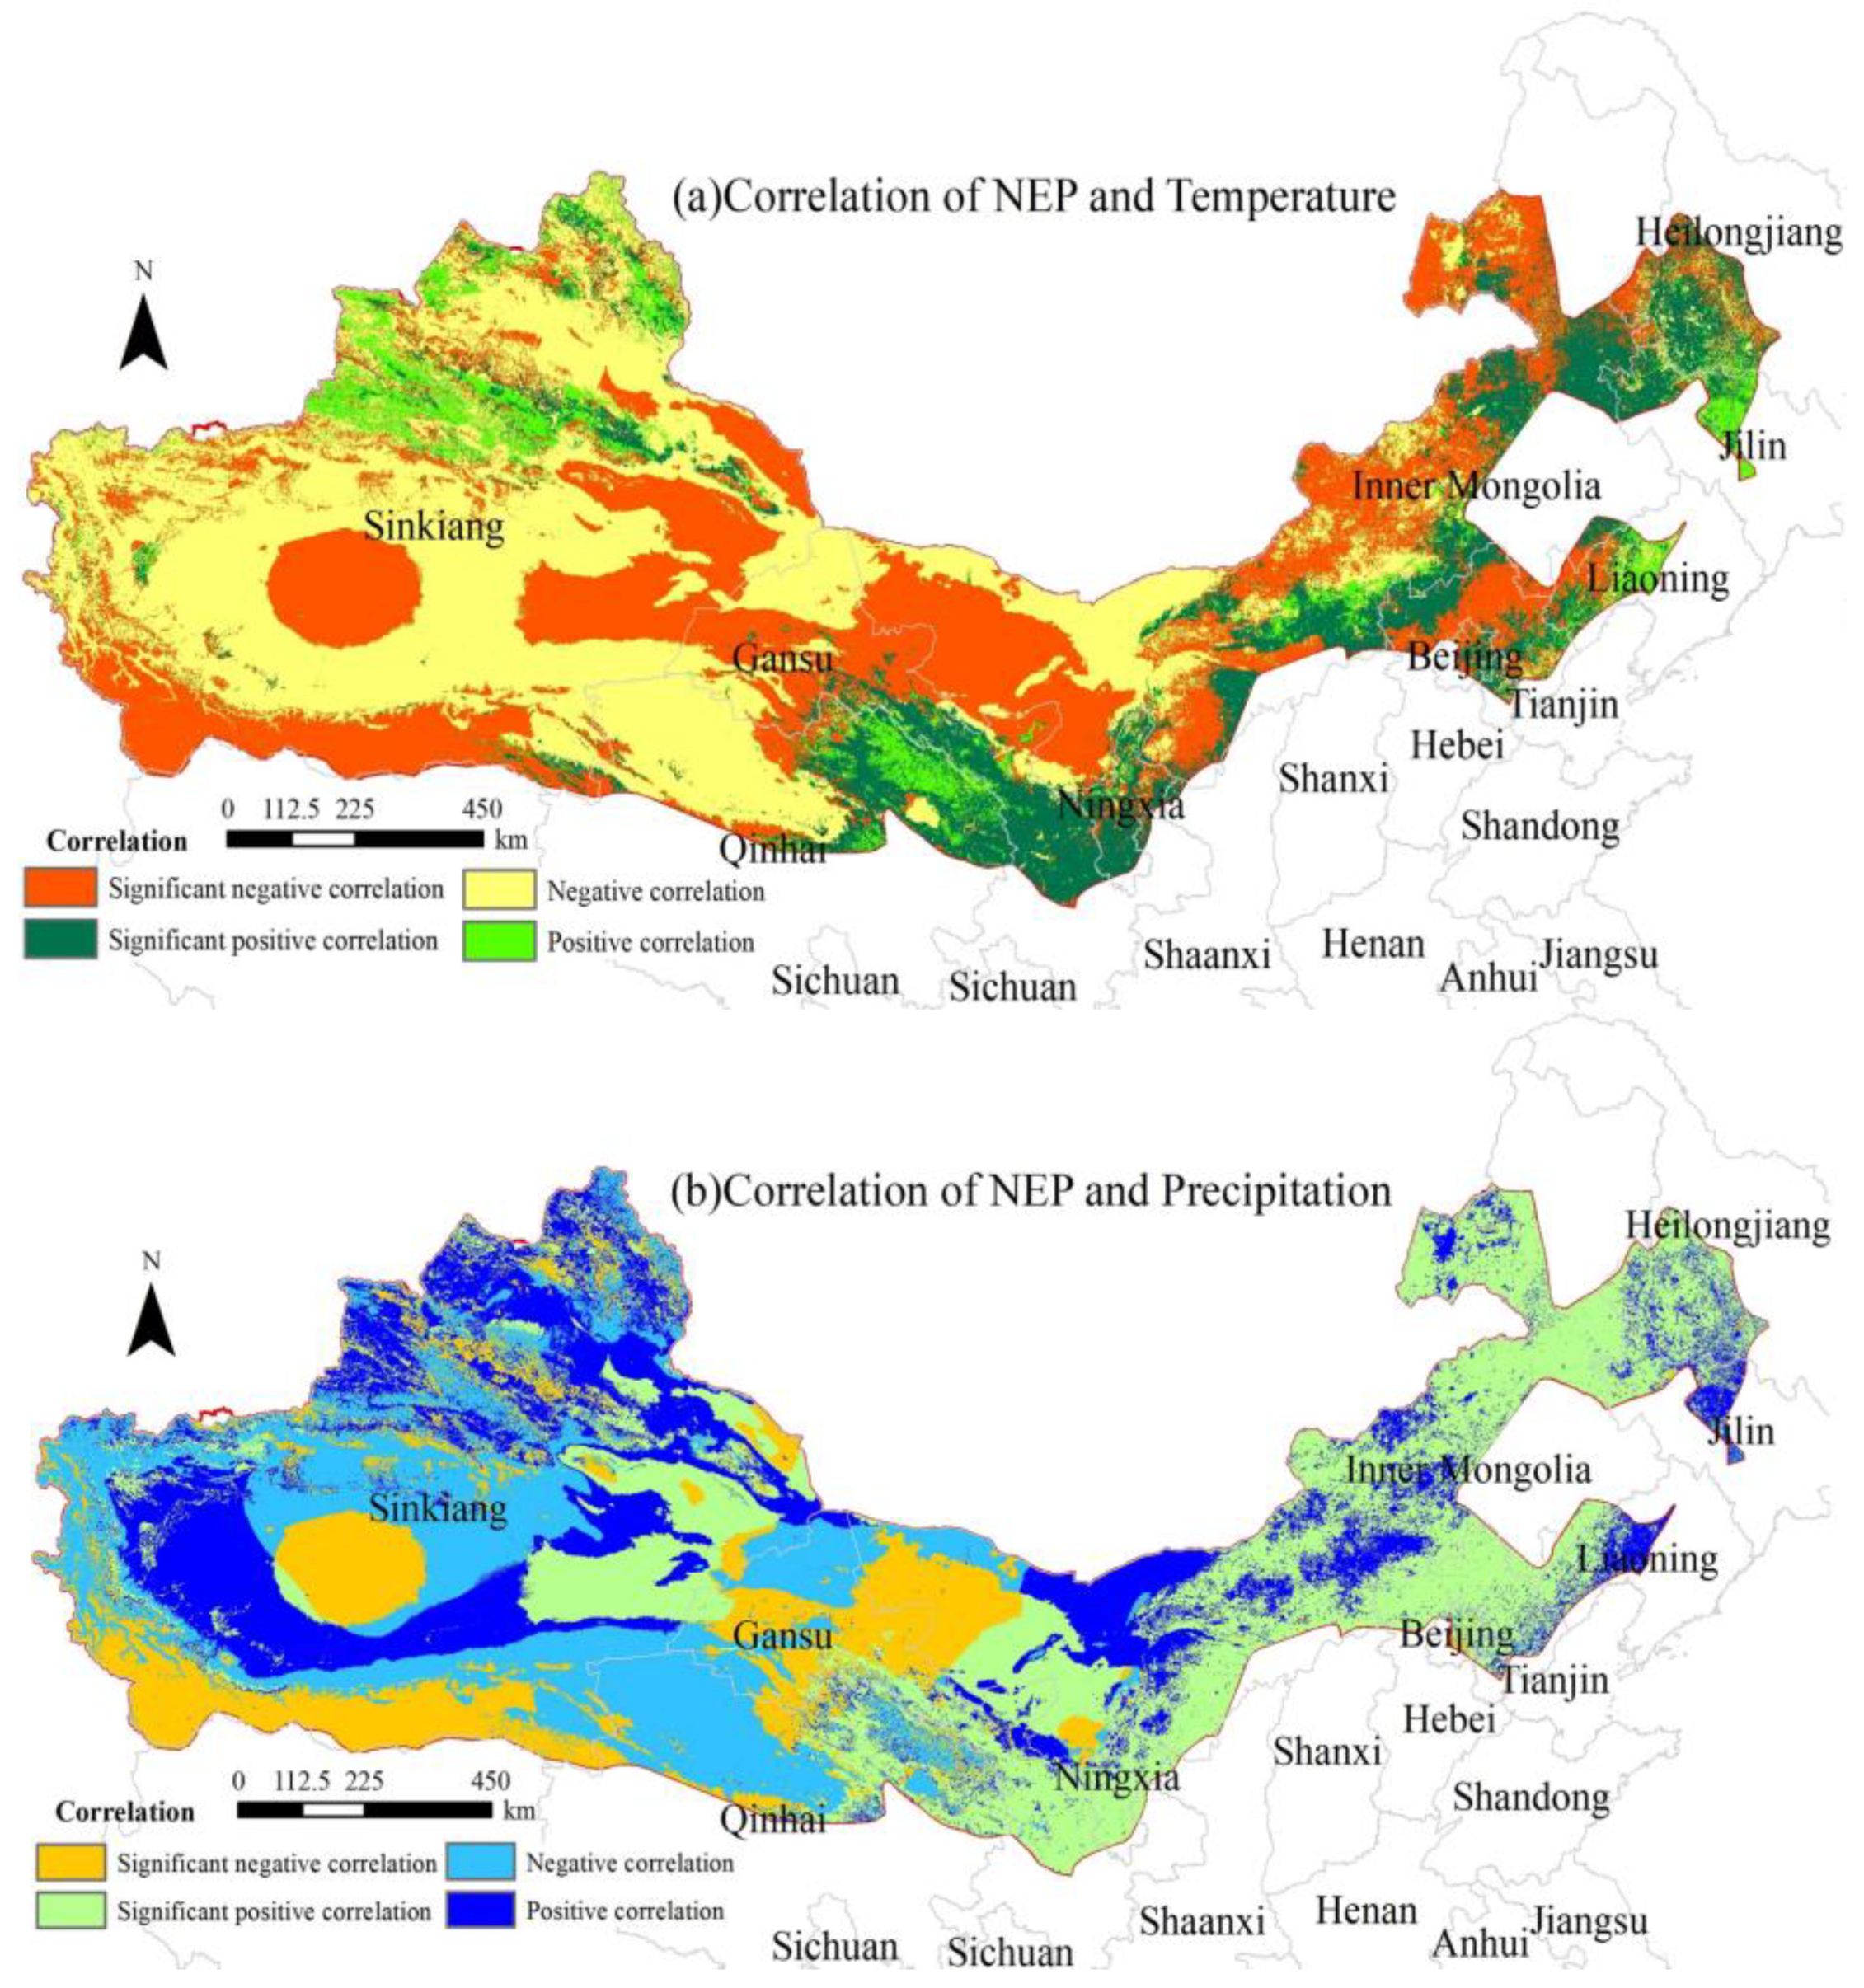
Between 2000 and 2020, the study conducted a thorough analysis of the relationship between Net Ecosystem Productivity (NEP) and annual mean temperature across the Three Northern Protection Forest Project Area, employing partial correlation analysis and significance testing. This comprehensive approach allowed us to delineate the intricate dynamics between NEP and climatic variables. We observed a broad range of partial correlation coefficients for temperature, spanning from −0.91 to 0.85. According to Figure 5, a significant negative correlation between NEP and temperature was identified in 35.60% of the regions at the 0.05 significance level. These findings were predominantly in the Xinjiang Uyghur Autonomous Region (notably in its northwestern parts), Gansu Province, the Inner Mongolia Autonomous Region, and Hebei Province.
Conversely, a positive correlation between NEP and the annual mean temperature was statistically significant in 16.27% of the regions, notably within Gansu Province and the Ningxia Hui Autonomous Region, as well as in the Inner Mongolia Autonomous Region and several northeastern areas.
Our research also explored the correlation between NEP and annual mean precipitation over the same period. The partial correlation coefficients for precipitation demonstrated variability from −0.89 to 0.91. A negative correlation with precipitation was significantly observed in only 0.16% of the regions, particularly in the southern and northwestern areas of the Xinjiang Uyghur Autonomous Region and in Gansu Province. In contrast, a positive correlation with precipitation reached statistical significance in 35.54% of the regions. This was predominantly seen across the Inner Mongolia Autonomous Region, the Ningxia Hui Autonomous Region, certain northern parts of the Xinjiang Uyghur Autonomous Region, and in Hebei Province, as well as specific areas of Beijing and several cities in the northeast.
The results of these analyses not only impart a nuanced comprehension of the interactions between NEP and pivotal environmental variables but also illuminate the intricate spatial patterns of ecosystem productivity in relation to climatic factors. This insight is invaluable for devising targeted environmental management strategies and enhancing the ecological sustainability of the region.

3.4. The Relationship between NEP and LUCC in the Three Northern Protection Forest Project Area

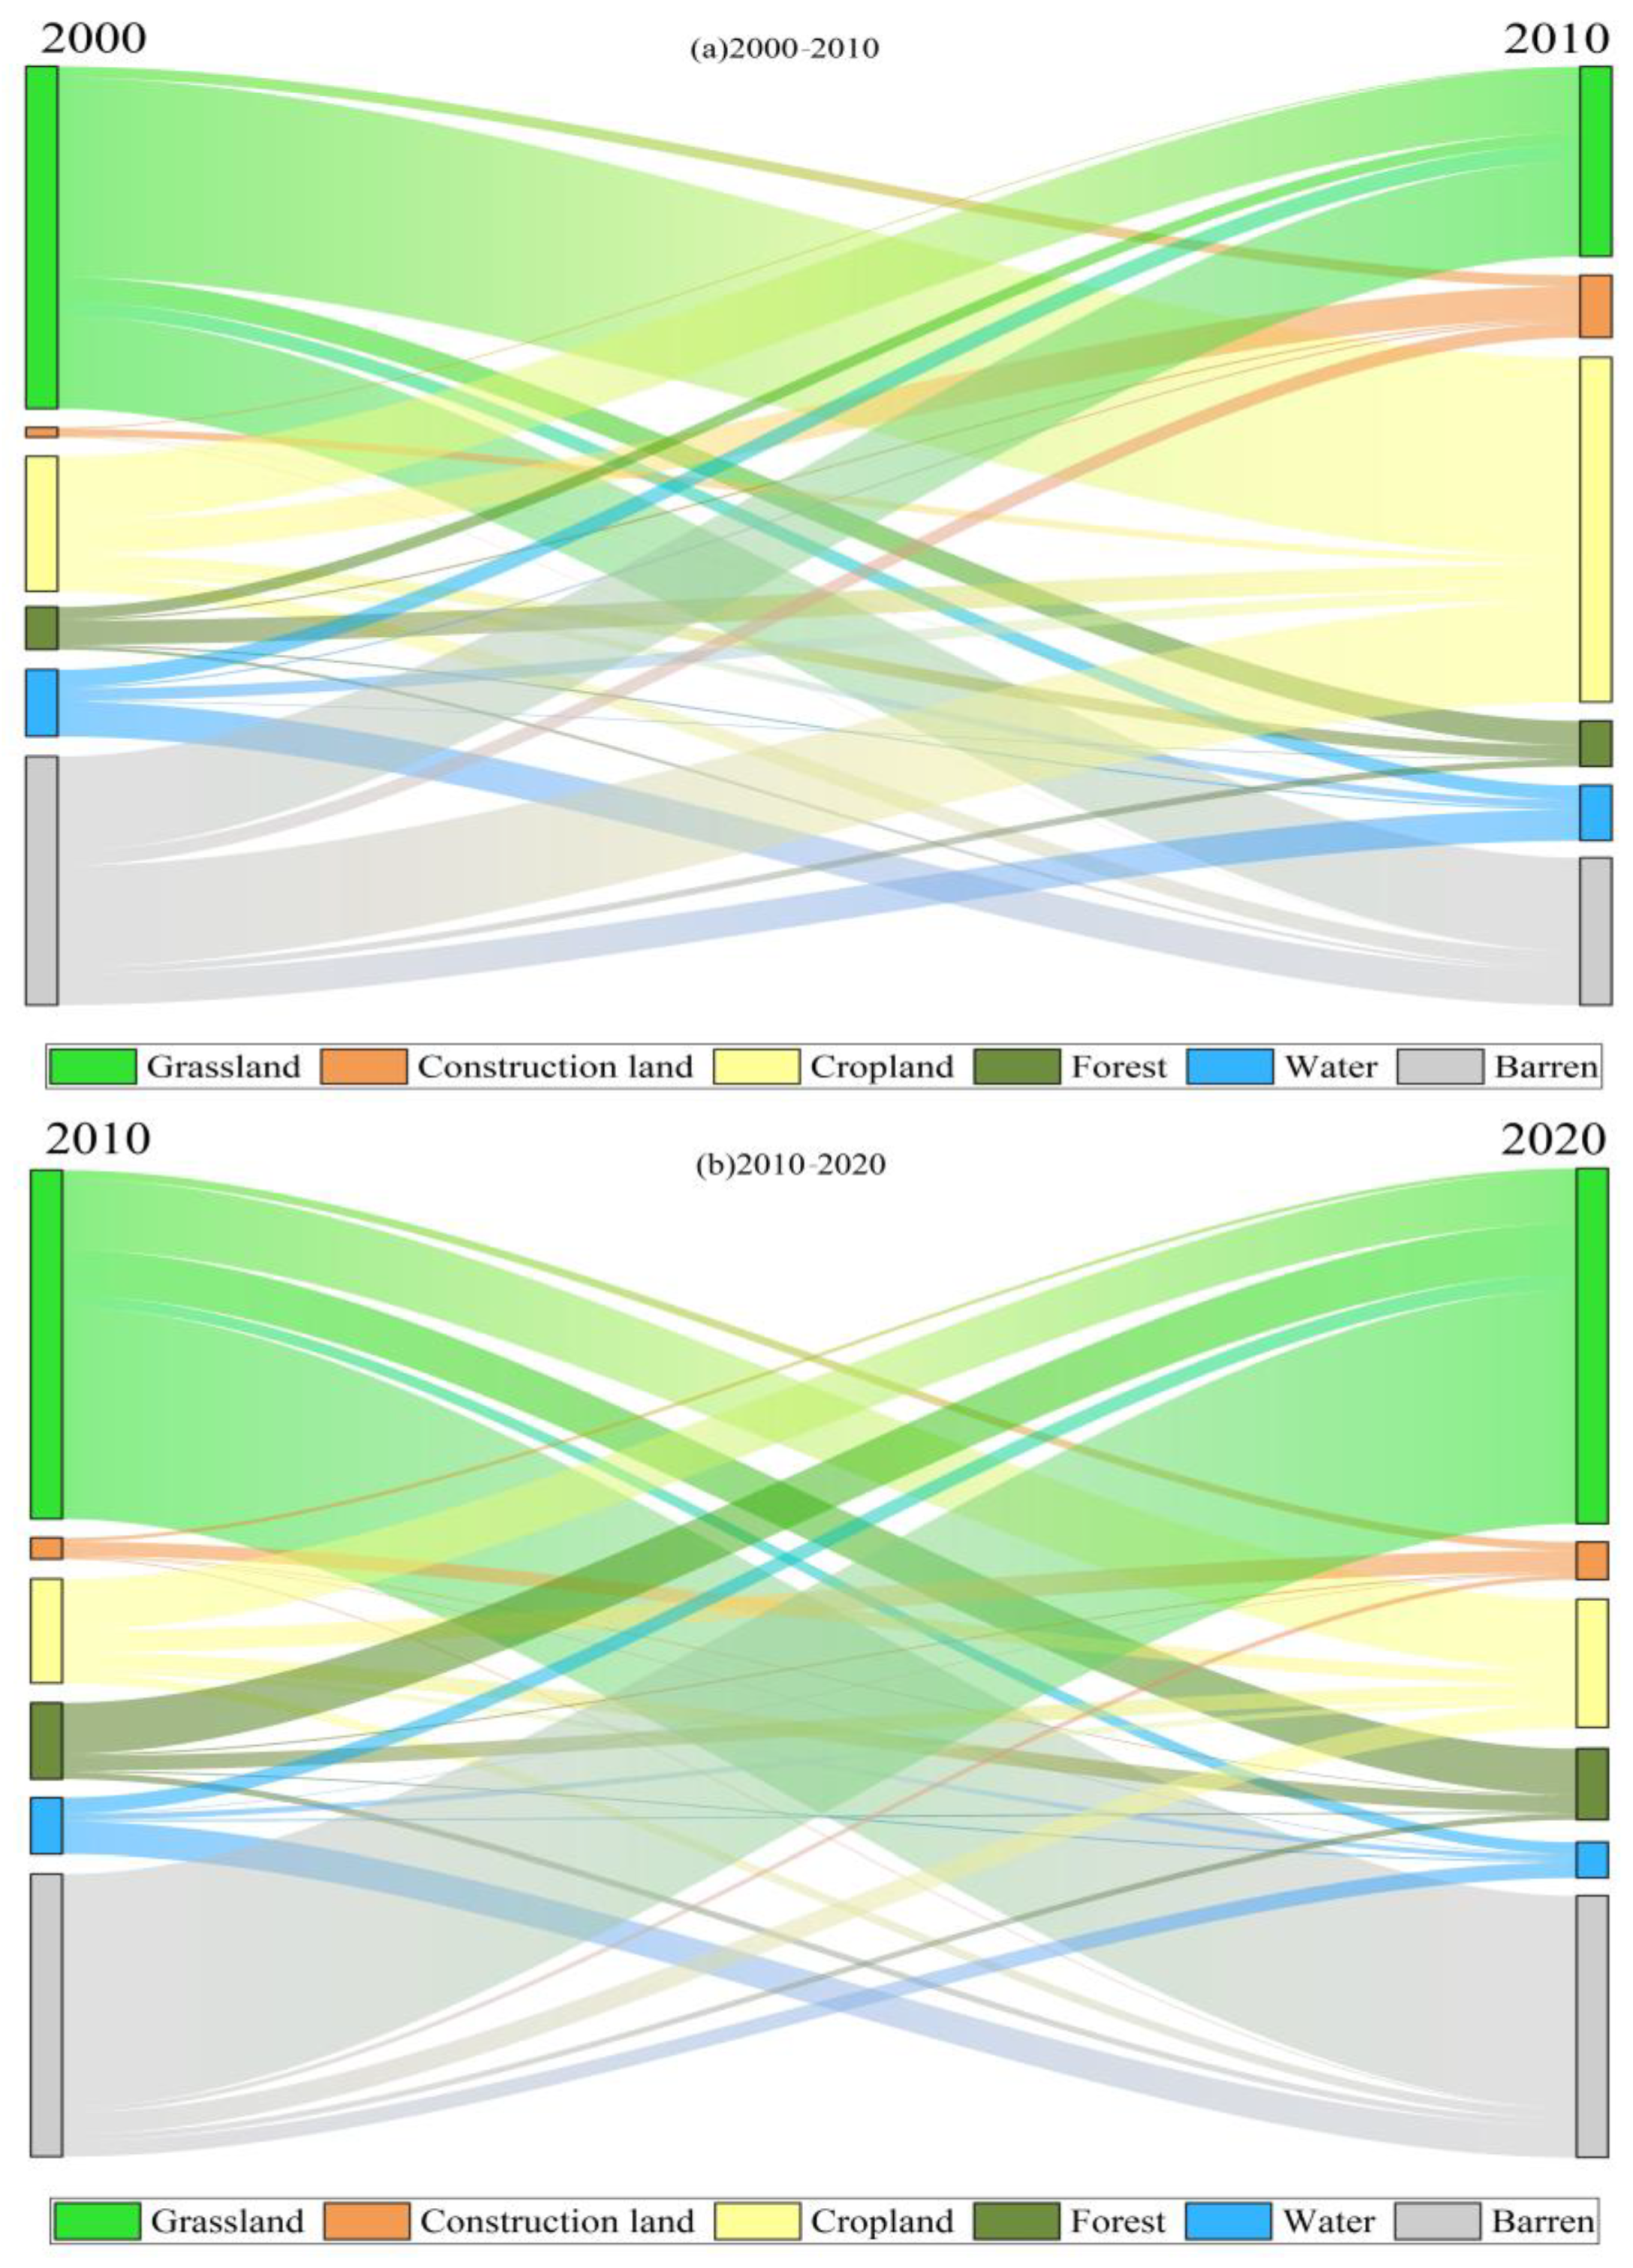
Figure 6 illustrates significant land-use and cover changes (LUCC) within the Three-North Shelter Forest Program area from 2000 to 2010. During this period, the largest reduction in land area was in grasslands, totaling 16,681.6 km2, while the smallest decrease was in urban, industrial, and residential lands, amounting to only 481.4 km2. Conversely, the largest increase was in cropland, reaching 16,807.1 km2, and the smallest was in forestland, totaling 2222 km2.
Moving into the decade from 2010 to 2020, the scale of land conversion significantly expanded. The most notable decrease was in grasslands, totaling 277,886.8 km2, while the smallest decrease was in urban, industrial, and residential lands, at 16,866.1 km2. During this stage, the largest increase was in grasslands, amounting to 283,127.9 km2, and the smallest increase was in water bodies, totaling 27,965.1 km2.
Viewing the period from 2000 to 2020 as a whole, over these 20 years, a total of 430,274.3 km2 of forests, grasslands, and farmlands were converted to rural and urban industrial areas, mining areas, residential areas, and other land uses. Conversely, 453,468.1 km2 of various land types were converted back to forests, grasslands, and farmlands. During this time, the net ecosystem productivity (NEP) of the study area generally showed an increasing trend, despite some fluctuations. The average carbon sink value rose from 56.916367 gCm−2a−1 in 2000 to 101.0944 gCm−2a−1 in 2005, slightly increased to 103.133156 gCm−2a−1 in 2010, and eventually reached 132.78133 gCm−2a−1 in 2020. Meanwhile, the average carbon source value also showed a decreasing trend, dropping from −42.685974 gCm−2a−1 in 2000 to −22.612026 gCm−2a−1 in 2010, and further to −8.049237 gCm−2a−1 in 2020.
These changes indicate that land reclamation and changes in land use led to the exposure of soil organic matter and an increase in soil carbon emissions, while the restoration of forest ecosystems increased aboveground biomass and soil organic carbon content, becoming an important carbon sink process. Converting farmland back to forests and grasslands is not only a key step in enhancing carbon sink capacity but the effect of reforestation surpasses that of grassland restoration. These land-use changes positively impacted the regional NEP, emphasizing the importance of implementing reasonable land-management strategies within the Three-North Shelter Forest Program area to promote ecological restoration and enhance carbon sink capacity, further fostering ecological balance and sustainable development.

3.5. Forecasting Future Patterns in the Three Northern Protection Forest Project Area

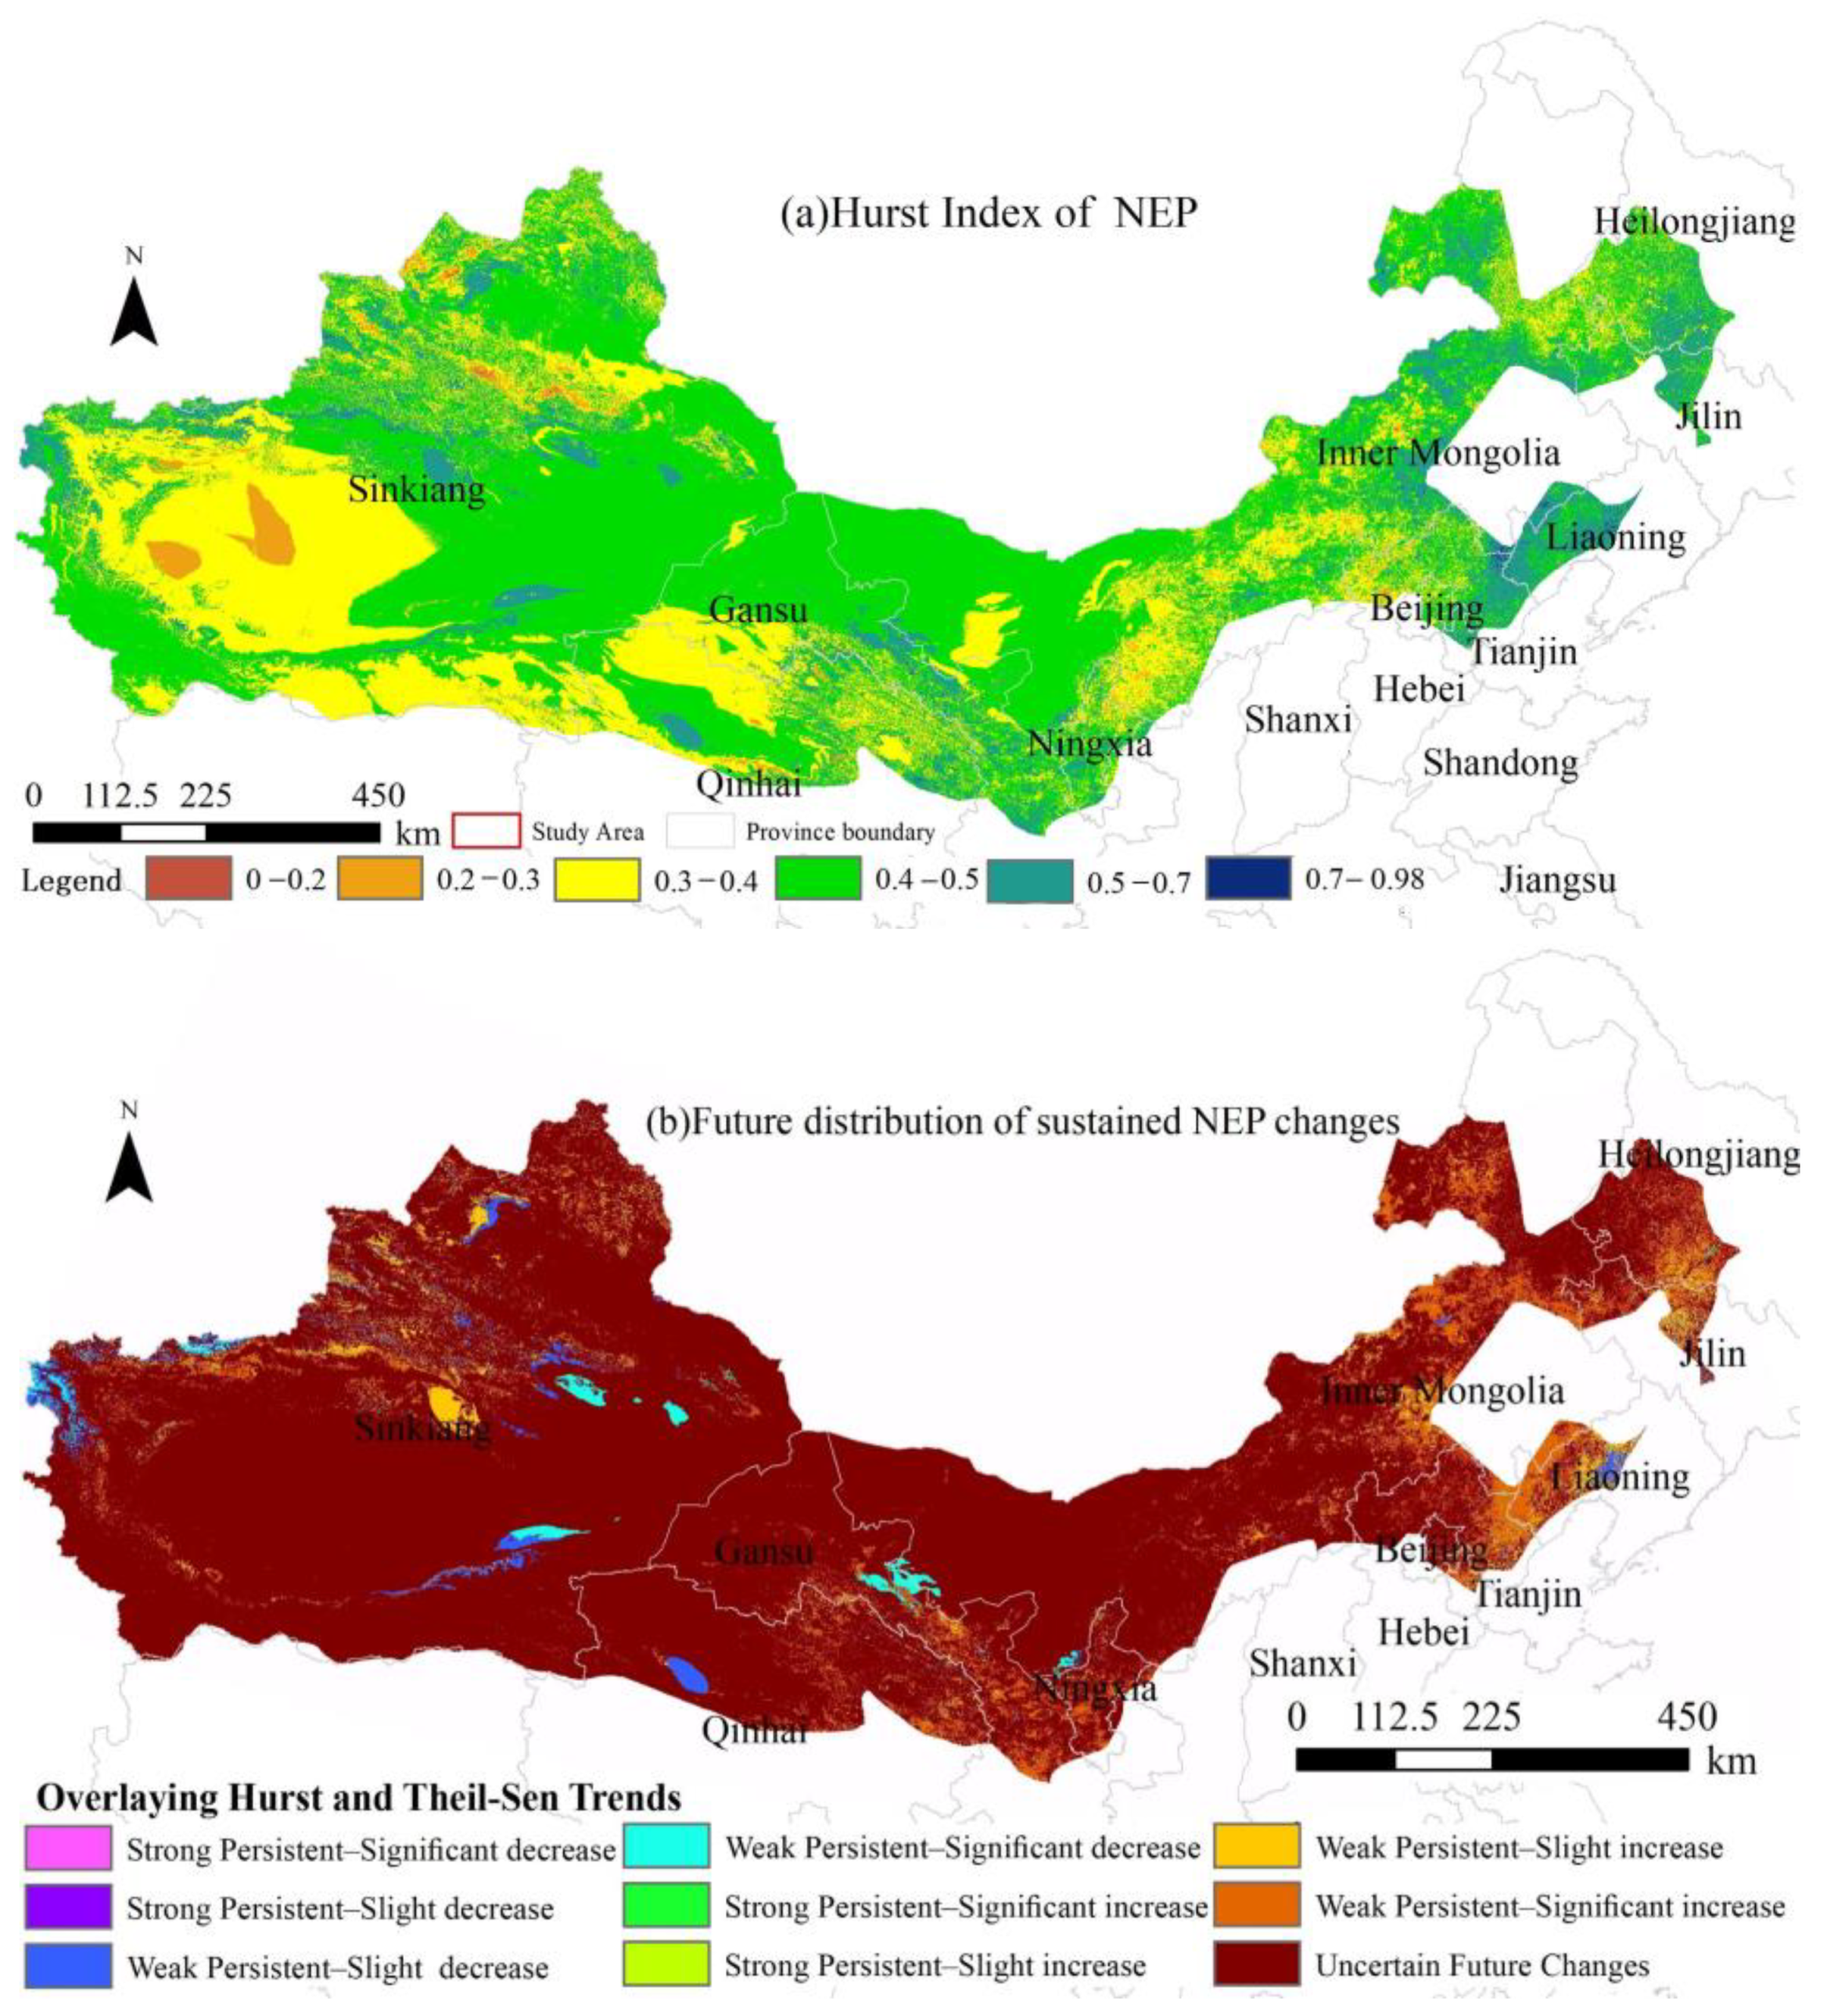
Figure 7 offers a meticulous analysis of the Hurst index for Net Ecosystem Productivity (NEP) across the study area, with values spanning from 0.07 to 0.98. This exhaustive evaluation synergistically combines the Hurst index with Theil–Sen trend analyses and Mann–Kendall test results, affording a multi-dimensional perspective on NEP dynamics throughout the entire time series. The analysis discloses that only a modest 2.49% of the study area demonstrates a decreasing NEP trend, while 10.78% shows an increasing trend. Notably, a substantial 86.73% of the area falls into a category indicative of uncertain future changes, emphasizing the inherent complexity and variability in projecting ecosystem productivity.
In our analysis of regions exhibiting a consistent increase in Net Ecosystem Productivity (NEP), we identified that a notable 7.52% of these areas fall under the category of “Weak Persistent–Significant Increase”. This trend is particularly evident across several provinces and autonomous regions, reflecting a diverse geographical spread. Specifically, the trend is observed in cities located in the eastern part of Gansu Province (such as Lanzhou City), throughout the Ningxia Hui Autonomous Region (including its capital, Yinchuan City, and other key cities), in various locations within the Inner Mongolia Autonomous Region (notably in its central and eastern parts), in the northern region of Hebei Province, and across several cities in the northeast. These areas, representing a mix of urban and rural landscapes, showcase the varied impact of environmental and climatic factors on ecosystem productivity.
The findings from this analysis not only illuminate the present state and trajectories of NEP in these regions but also highlight the substantial proportion of areas where NEP is exhibiting an upward trend, surpassing those with declining trends. The spatial delineation of these trends is vital for comprehending regional ecosystem dynamics and for informing future environmental management and policy formulations. The discernible dominance of regions with increasing NEP trends, particularly those characterized by a weak but persistent significant increase, suggests an optimistic outlook for the ecological vitality and carbon sequestration capabilities of these areas.
In this study, the category of “Weak Persistent–Slight Increase” in Net Ecosystem Productivity (NEP), covering 3.25% of the study area, is predominantly identified in specific regions of the Xinjiang Uyghur Autonomous Region, particularly in the Ili Kazakh Autonomous Prefecture, Tacheng City, and Altay Prefecture. This trend is also observed in the Xilin Gol League of the Inner Mongolia Autonomous Region and in the northeast region, specifically in Shenyang City and Changchun City. Although the increase is modest, it indicates positive ecological developments in these areas.
Conversely, the “Weak Persistent–Slight Decrease” category, representing 1.64% of the study area, is primarily found in the Bayingol Mongol Autonomous Prefecture and Turpan City in the Xinjiang Uyghur Autonomous Region, as well as in Zhangye City in Gansu Province. This slight downward trend in NEP highlights the need for targeted ecological management in these regions.
Remarkably, a substantial portion of the Three Northern Protection Forest Project Area, constituting 86.73%, is characterized by uncertainty regarding future NEP trends. This prevalent uncertainty emphasizes the imperative for enhanced efforts toward stabilizing the ecosystems in these areas. It also sheds light on the complex challenges involved in ecological preservation and sustainable development across the region, underscoring the necessity for strategic measures to ensure future ecological equilibrium and sustainable resource management.
In the context of these findings, the importance of comprehensive research and the implementation of sustainable development strategies is paramount. Such initiatives are crucial for preserving the ecological integrity and balance of the Three Northern Protection Forest Project Area. The insights gained from this study not only contribute to a deeper understanding of the current state and potential future trajectories of NEP in the region but also highlight the significance of informed and sustainable ecological management practices.

4. Conclusions and Discussion

4.1. Conclusions

This study has meticulously evaluated the dynamics of Net Ecosystem Productivity (NEP) within the specified research area from 2000 to 2020. Employing MODIS NPP data products and an advanced NEP estimation model, coupled with meteorological data integration, we have attained a comprehensive understanding of the NEP spatiotemporal characteristics and dynamic processes in the region. The key findings of our study are as follows:
(i) Throughout the past two decades, NEP in the research area exhibited a fluctuating yet generally ascending trend. We discerned that areas with lower NEP values were predominantly situated in desert and arid regions, whereas regions such as Ningxia, Hebei, Inner Mongolia, and the northeastern provinces manifested higher NEP values.
(ii) The analysis from 2000 to 2020 revealed that 32.97% of the regions experienced a significant increase in NEP, while 24.18% exhibited slight increases. Conversely, only 18.87% of the regions showed a notable decline. This pattern indicates a prevalent trend of ecosystem recuperation and enhancement, with areas exhibiting increasing NEP trends outnumbering those with decreasing trends.
(iii) The study explored the link between NEP and key environmental factors like annual mean temperature and precipitation using partial correlation analysis, revealing negative correlations in Xinjiang, Gansu, and Inner Mongolia, but positive ones in Gansu, Ningxia, Inner Mongolia, and the northeast. Future outlooks suggest a general rise in NEP across most regions. Land-use changes and climate change were identified as major influencers on regional NEP shifts. However, the future of NEP trends remains largely uncertain, emphasizing the critical need for continued research aimed at strengthening ecosystem resilience, maintaining ecological balance, and ensuring sustainable management of resources.
In conclusion, this extensive study not only illuminates the intricate dynamics of NEP within the study area but also underscores the paramount importance of ongoing research endeavors. Such efforts are crucial in deepening our comprehension of ecosystem processes and in steering effective management strategies for ecological sustainability within the Three Northern Protection Forest Project Area.

4.2. Discussion

In the arena of carbon cycle research, the significance of Net Ecosystem Productivity (NEP) has been increasingly recognized for its superior capacity to elucidate the dynamics of carbon absorption and emission, transcending the insights provided by Net Primary Productivity (NPP). NEP, indicative of the net carbon exchange between ecosystems and the atmosphere, integrates the effects of various ecological processes and climatic influences, such as temperature and precipitation, that significantly affect carbon dynamics on both seasonal and annual scales [11,39,40].
The Three Northern Protection Forest Project Area, a vital ecological bulwark in Northern China, exemplifies a region where the spatiotemporal intricacies of vegetation carbon fluxes are markedly pronounced. Through leveraging advanced remote-sensing technologies over the past two decades, our study has unveiled this region’s sensitivity to climatic fluctuations and its ecological fragility, positioning our work at the forefront of research in this field. This area’s designation as a climatically sensitive and ecologically fragile zone underscores the innovative and unique contribution of our research to the understanding of carbon cycling dynamics within it.
Our investigation extends beyond mere temporal fluctuations to explore the spatial variability in NEP, offering fresh insights into the mechanisms underpinning carbon cycling within the Three Northern Protection Forest Project Area. This understanding is instrumental for the formulation of effective ecosystem-management strategies, facilitating climate change adaptation and promoting sustainable resource utilization. By shedding light on these aspects, our study makes a significant contribution to the fields of ecology and environmental science, highlighting the criticality of focusing on ecologically vulnerable regions for future sustainable development efforts [41,42].
This investigation, while contributing valuable insights into terrestrial carbon flux dynamics, simultaneously unveils several avenues for future scholarly inquiry. First and foremost, the reliance on MODIS NPP data products as a pivotal tool for NEP estimation, despite their invaluable contribution, is not without its limitations. These data are susceptible to errors and uncertainties attributed to variables such as sensor performance inconsistencies and the omnipresent challenge of cloud cover [43,44]. To mitigate these issues and enhance the accuracy of our estimations, there is a pressing need to integrate more precise observational datasets, leverage higher-resolution remote-sensing technologies, and supplement these with comprehensive field sampling and rigorous model calibration efforts.
Furthermore, while the current study offers a detailed examination of the roles played by climatic variables and Land-Use and Land-Cover Change (LUCC) in influencing NEP, the impact of direct land-use modifications [45,46] and anthropogenic activities [47,48,49] emerges as equally significant. These elements drive alterations in vegetation cover, soil properties, and land-management methodologies, each bearing substantial implications for the variability of NEP. Thus, it becomes imperative for subsequent research to focus on quantifying the human footprint on vegetation carbon cycling processes, aiming to refine ecosystem management practices and stride towards achieving a harmonious carbon equilibrium.
Moreover, ensuing research endeavors shall delve into the realms of carbon sequestration capabilities and the interannual fluxes discernible across diverse vegetation types [50,51]. Gaining a nuanced understanding of the unique carbon cycling attributes inherent to varied ecosystems—ranging from dense forests and sprawling grasslands to vital wetlands—is crucial for devising effective conservation and sustainable management strategies.
By undertaking these comprehensive studies, our objective is to significantly deepen the scientific community’s grasp of the intricate carbon-cycling mechanisms within vegetation ecosystems, particularly within the ambit of the Three Northern Protection Forest Project Area. This endeavor is anticipated to lay down a robust scientific foundation that will inform and enhance ecosystem management protocols, facilitate adaptive responses to climate change, and promote the sustainable exploitation of ecological resources. In doing so, we aspire to catalyze continued exploration into these complex ecological processes, thereby enriching our collective understanding and stewardship of the natural world.

Author Contributions

The study was conceptualized by Q.Z. and Y.S. Data curation was jointly handled by Y.S. and Q.Z. Formal analysis was conducted by Y.S. and Q.Z. Funding acquisition was managed by Q.Z. The investigation was carried out by Y.S. and Q.Z. Methodological framework was developed by Q.Z., Y.S. and L.S. Project administration was overseen by Q.Z. and Y.S. Resources were coordinated by Q.Z. and Y.S. Supervision was provided by Y.S. and Q.Z. Validation of the study was performed by Q.Z., Y.S., L.S., X.Y. and A.W. Visualization was created by Y.S. The original draft of the manuscript was written by Y.S. and Q.Z. Review and editing of the manuscript were undertaken by Y.S., Q.Z., L.S., Z.F., X.Y., F.Y., H.J., X.L. and A.W. All authors have read and agreed to the published version of the manuscript.

Funding

This study received financial support from PI project of Southern Marine Science and Engineering Guangdong Laboratory (Guangzhou) (GML2022009) and Forestry Innovation program in Guangdong Province (2022KJCX001).

Data Availability Statement

Data are contained within the article.

Acknowledgments

We wish to extend our sincere appreciation to the editors and reviewers whose invaluable insights and recommendations have significantly enriched the quality of this study.

Conflicts of Interest

The authors declare no conflict of interest.

References

  1. Schimel, D.; Pavlick, R.; Fisher, J.B.; Asner, G.P.; Saatchi, S.; Townsend, P.; Miller, C.; Frankenberg, C.; Hibbard, K.; Cox, P. Observing terrestrial ecosystems and the carbon cycle from space. Glob. Chang. Biol. 2015, 21, 1762–1776. [Google Scholar] [CrossRef]
  2. Friedlingstein, P.; O’sullivan, M.; Jones, M.W.; Andrew, R.M.; Hauck, J.; Olsen, A.; Peters, G.P.; Peters, W.; Pongratz, J.; Sitch, S. Global carbon budget 2020. Earth Syst. Sci. Data Discuss. 2020, 12, 3269–3340. [Google Scholar] [CrossRef]
  3. Gang, C.; Zhang, J.; Li, J. The advances in the carbon source/sink researches of typical grassland ecosystem in China. Procedia Environ. Sci. 2011, 10, 1646–1653. [Google Scholar] [CrossRef]
  4. Zou, C.; Li, H.; Chen, D.; Fan, J.; Liu, Z.; Xu, X.; Li, J.; Wang, Z. Spatial-Temporal Changes of Carbon Source/Sink in Terrestrial Vegetation Ecosystem and Response to Meteorological Factors in Yangtze River Delta Region (China). Sustainability 2022, 14, 10051. [Google Scholar] [CrossRef]
  5. Turner, D.P.; Ritts, W.D.; Cohen, W.B.; Gower, S.T.; Running, S.W.; Zhao, M.; Costa, M.H.; Kirschbaum, A.A.; Ham, J.M.; Saleska, S.R. Evaluation of MODIS NPP and GPP products across multiple biomes. Remote Sens. Environ. 2006, 102, 282–292. [Google Scholar] [CrossRef]
  6. Turner, D.P.; Ritts, W.D.; Cohen, W.B.; Gower, S.T.; Zhao, M.; Running, S.W.; Wofsy, S.C.; Urbanski, S.; Dunn, A.L.; Munger, J. Scaling gross primary production (GPP) over boreal and deciduous forest landscapes in support of MODIS GPP product validation. Remote Sens. Environ. 2003, 88, 256–270. [Google Scholar] [CrossRef]
  7. Sun, Z.; Wang, X.; Zhang, X.; Tani, H.; Guo, E.; Yin, S.; Zhang, T. Evaluating and comparing remote sensing terrestrial GPP models for their response to climate variability and CO2 trends. Sci. Total Environ. 2019, 668, 696–713. [Google Scholar] [CrossRef] [PubMed]
  8. Cramer, W.; Kicklighter, D.W.; Bondeau, A.; Iii, B.M.; Churkina, G.; Nemry, B.; Ruimy, A.; Schloss, A.L.; The Participants of the Potsdam NPP Model Intercomparison. Comparing global models of terrestrial net primary productivity (NPP): Overview and key results. Glob. Change Biol. 1999, 5, 1–15. [Google Scholar] [CrossRef]
  9. Wei, X.; Yang, J.; Luo, P.; Lin, L.; Lin, K.; Guan, J. Assessment of the variation and influencing factors of vegetation NPP and carbon sink capacity under different natural conditions. Ecol. Indic. 2022, 138, 108834. [Google Scholar] [CrossRef]
  10. Matamala, R.; Gonzalez-Meler, M.A.; Jastrow, J.D.; Norby, R.J.; Schlesinger, W. Impacts of fine root turnover on forest NPP and soil C sequestration potential. Science 2003, 302, 1385–1387. [Google Scholar] [CrossRef]
  11. Lu, X.; Chen, Y.; Sun, Y.; Xu, Y.; Xin, Y.; Mo, Y. Spatial and temporal variations of net ecosystem productivity in Xinjiang Autonomous Region, China based on remote sensing. Front. Plant Sci. 2023, 14, 1146388. [Google Scholar] [CrossRef]
  12. Obame, R.M.; Copard, Y.; Sebag, D.; Touré, A.A.; Boussafir, M.; Bichet, V.; Garba, Z.; Guillon, R.; Petit, C.; Rajot, J.-L. Carbon sinks in small Sahelian lakes as an unexpected effect of land use changes since the 1960s (Saga Gorou and Dallol Bosso, SW Niger). Catena 2014, 114, 1–10. [Google Scholar] [CrossRef]
  13. Parton, W.; Morgan, J.; Smith, D.; Del Grosso, S.; Prihodko, L.; Lecain, D.; Kelly, R.; Lutz, S. Impact of precipitation dynamics on net ecosystem productivity. Glob. Chang. Biol. 2012, 18, 915–927. [Google Scholar] [CrossRef]
  14. Hubau, W.; Lewis, S.L.; Phillips, O.L.; Affum-Baffoe, K.; Beeckman, H.; Cuní-Sanchez, A.; Daniels, A.K.; Ewango, C.E.; Fauset, S.; Mukinzi, J.M. Asynchronous carbon sink saturation in African and Amazonian tropical forests. Nature 2020, 579, 80–87. [Google Scholar] [CrossRef]
  15. Yuan, G.; Xiaofang, J.; Yuting, H.; Jinghua, Z.; Nan, L. Research progress of CO2 flux in forest ecosystem based on eddy covariance technique: A review. J. Zhejiang AF Univ. 2020, 37, 593–604. [Google Scholar]
  16. Pei, W.; Yang, Z.; Wang, Y.; Wang, X.; Du, Y. Carbon Sink Characteristics and Regulatory Factors of Qinghai Spruce Forests in the Qilian Mountains. J. Agric. Sci. Technol. 2023, 26, 1–8. [Google Scholar]
  17. Wang, T.; Wang, X.; Liu, D.; Lv, G.; Ren, S.; Ding, J.; Chen, B.; Qu, J.; Wang, Y.; Piao, S.; et al. The current and future of terrestrial carbon balance over the Tibetan Plateau. Sci. China Earth Sci. 2023, 66, 1493–1503. [Google Scholar] [CrossRef]
  18. Wang, Y.; Tian, X.; Duan, M.; Zhu, D.; Liu, D.; Zhang, H.; Zhou, M.; Zhao, M.; Jin, Z.; Ding, J.; et al. Optimal design of surface CO2 observation network to constrain China’s land carbon sink. Sci. Bull. 2023, 68, 1678–1686. [Google Scholar] [CrossRef] [PubMed]
  19. Friend, A.D.; Lucht, W.; Rademacher, T.T.; Keribin, R.; Betts, R.; Cadule, P.; Ciais, P.; Clark, D.B.; Dankers, R.; Falloon, P.D. Carbon residence time dominates uncertainty in terrestrial vegetation responses to future climate and atmospheric CO2. Proc. Natl. Acad. Sci. USA 2014, 111, 3280–3285. [Google Scholar] [CrossRef]
  20. Dong, L.; Chen, G.-M.; Lin, X.; Liu, Z. Simulation of carbon sequestration and timber production in Larix olgensis plantation based on CO2FIX model. Chin. J. Appl. Ecol. 2022, 33, 2653–2662. [Google Scholar]
  21. Li, X.; Hai, Q.; Zhu, Z.; Zhang, D.; Shao, Y.; Zhao, Y.; Li, H.; Vandansambuu, B.; Ning, X.; Chen, D. Spatial and Temporal Changes in Vegetation Cover in the Three North Protection Forest Project Area Supported by GEE Cloud Platform. Forests 2023, 14, 295. [Google Scholar] [CrossRef]
  22. Duan, H.; Yan, C.; Tsunekawa, A.; Song, X.; Li, S.; Xie, J. Assessing vegetation dynamics in the Three-North Shelter Forest region of China using AVHRR NDVI data. Environ. Earth Sci. 2011, 64, 1011–1020. [Google Scholar] [CrossRef]
  23. Xie, S.; Mo, X.; Hu, S.; Chen, X. Responses of vegetation greenness to temperature and precipitation in the Three-North Shelter Forest Program. Geogr. Res. 2020, 39, 152–165. [Google Scholar]
  24. Huang, S.; Li, X.; Wu, B.; Pei, L. The Distribution and Drivers of Land Degradation in theThree-North Shelter Forest Region of China during 1982-2006. Acta Geogr. Sin. 2012, 67, 589–598. [Google Scholar]
  25. Shen, L.; Sun, Y.; Yang, Y.; Jing, Y. Spectrum Characteristic of Vegetation Coverage Change Based on NDVI in the Three-North Shelter Forest Program. Environ. Sci. Technol. 2017, 40, 70–77+106. [Google Scholar]
  26. Peng, D.; Wu, C.; Zhang, B.; Huete, A.; Zhang, X.; Sun, R.; Lei, L.; Huang, W.; Liu, L.; Liu, X. The influences of drought and land-cover conversion on inter-annual variation of NPP in the Three-North Shelterbelt Program zone of China based on MODIS data. PLoS ONE 2016, 11, e0158173. [Google Scholar] [CrossRef]
  27. He, Q.; Wang, M.; Liu, K.; Li, K.; Jiang, Z. GPRChinaTemp1km: A high-resolution monthly air temperature dataset for China (1951–2020) based on machine learning. Earth Syst. Sci. Data Discuss. 2021, 1–29. [Google Scholar]
  28. Peng, S. 1-km Monthly Precipitation Dataset for China (1901–2020); National Tibetan Plateau Data Center: Beijing, China, 2020. [Google Scholar]
  29. Tang, X.; Fan, S.; Qi, L.; Guan, F.; Du, M.; Zhang, H. Soil respiration and net ecosystem production in relation to intensive management in Moso bamboo forests. Catena 2016, 137, 219–228. [Google Scholar] [CrossRef]
  30. Wang, C.; Liu, Y.; Li, Z. Effects of ecological water conveyance on the spatial pattern of vegetation carbon sources/sinks in the lower reaches of Tarim River. Arid Land Geogr. 2021, 44, 729–738. [Google Scholar]
  31. Ye, X.; Wang, Y.; Pan, H.; Bai, Y.; Dong, D.; Yao, H. Spatial-temporal variation and driving factors of vegetation net ecosystem productivity in Qinghai Province. Arid Zone Res. 2022, 39, 1673–1683. [Google Scholar]
  32. Houghton, R. Terrestrial sources and sinks of carbon inferred from terrestrial data. Tellus B Chem. Phys. Meteorol. 1996, 48, 420–432. [Google Scholar] [CrossRef]
  33. Pan, J.; Wen, Y. Estimation and spatial-temporal characteristics of carbon sink in the arid region of northwest China. Acta Ecol. Sin. 2015, 35, 7718–7728. [Google Scholar]
  34. Yue, S.; Wang, C.Y. Applicability of prewhitening to eliminate the influence of serial correlation on the Mann-Kendall test. Water Resour. Res. 2002, 38, 4-1–4-7. [Google Scholar] [CrossRef]
  35. Hamed, K.H.; Rao, A.R. A modified Mann-Kendall trend test for autocorrelated data. J. Hydrol. 1998, 204, 182–196. [Google Scholar] [CrossRef]
  36. Wu, D.; Hou, W.; Sang, H.; Zhai, L.; Guo, J. Analysis of spatio-temporal variation of vegetation carbon sources/sinks in Tibet and its impact factors. Sci. Surv. Mapp. 2022, 47, 105–113+134. [Google Scholar]
  37. Zhou, Y.; Yan, J.; Liu, J.; Wang, Y. Spatio-temporal Variation of NEP in Ecological Zoning on the Loess Plateau and Its Driving Factors from 2000 to 2021. Environ. Sci. Technol. 2023, 1–14. [Google Scholar]
  38. Han, Z.; Tong, Y.; Wang, G. Spatial-temporal Differentiation and Evolution Trend of Marine Ecological Security in China. Sci. Geogr. Sin. 2022, 42, 1166–1175. [Google Scholar]
  39. Han, L.; Wang, Q.-F.; Chen, Z.; Yu, G.-R.; Zhou, G.-S.; Chen, S.-P.; Li, Y.-N.; Zhang, Y.-P.; Yan, J.-H.; Wang, H.-M. Spatial patterns and climate controls of seasonal variations in carbon fluxes in China’s terrestrial ecosystems. Glob. Planet. Chang. 2020, 189, 103175. [Google Scholar] [CrossRef]
  40. Chen, Z.; Yu, G.; Ge, J.; Wang, Q.; Zhu, X.; Xu, Z. Roles of climate, vegetation and soil in regulating the spatial variations in ecosystem carbon dioxide fluxes in the Northern Hemisphere. PLoS ONE 2015, 10, e0125265. [Google Scholar] [CrossRef]
  41. Zheng, Q.; Wei, H.; Chen, J.; Hou, R.; Zhou, C. Study on Carbon Sink Value Evaluation of Three-north Shelterbelt Program in the Past 40 Years. For. Econ. 2019, 41, 67–73+112. [Google Scholar]
  42. Cui, Y.; Chen, X.; Chang, Z.; Zheng, G.; Zhu, X. The carbon storage effect of forestry ecological construction and its potential in Ningxia. J. Arid Land Resour. Environ. 2012, 26, 186–190. [Google Scholar]
  43. Running, S.W.; Nemani, R.R.; Heinsch, F.A.; Zhao, M.; Reeves, M.; Hashimoto, H. A continuous satellite-derived measure of global terrestrial primary production. Bioscience 2004, 54, 547–560. [Google Scholar] [CrossRef]
  44. Wang, Z. The Research on the Impact of Data and Model Uncertainty on the Simulation of Gross Primary Production of Sample Plots and Global Scale. Master’s Thesis, Central South University of Forestry & Technology, Changsha, China, 2020. [Google Scholar]
  45. Wu, Q.; Zhang, X.; Jiang, J. Land-Use and Land Cover Change (LUCC) Detection Based on MODIS and CLCD Data and ItsImpact on the Simulation of Vegetation Gross Carbon Assimilation in the Loess Plateau. Geogr. Geo-Inf. Sci. 2023, 39, 30–38. [Google Scholar]
  46. Zhao, Y.; Ju, Z.; Wu, L. Effects of land use change on net primary productivity. Sci. Surv. Mapp. 2023, 48, 166–175. [Google Scholar]
  47. Yang, D.; Wang, X. Contribution of climatic change and human activities to changes in net primary productivity in the Loess Plateau. Arid Zone Res. 2022, 39, 584–593. [Google Scholar]
  48. Jin, K.; Wang, F.; Han, J.; Shi, S.; Ding, W. Contribution of climatic change and human activities to vegetation NDVI change over China during 1982–2015. Acta Geogr. Sin. 2020, 75, 961–974. [Google Scholar]
  49. Yu, L.; Wu, Z.; Du, Z.; Zhang, H.; Liu, Y. Quantitative analysis of the effects of human activities on vegetation in the Beijing-Tianjin sandstorm source region under the climate change. Chin. J. Appl. Ecol. 2020, 31, 2007–2014. [Google Scholar]
  50. Du, H.; Song, T.; Zeng, F.; Wang, K.; Peng, W.; Fu, W.; Li, S. Carbon storage and its controlling factors under different vegetation types in depressions between karst hills, southwest China. Acta Ecol. Sin. 2015, 35, 4658–4667. [Google Scholar]
  51. Zhao, H.; Li, Z.; Zhang, X.; Li, X.; He, S.; Zhao, J. Soil Respiration and Impact Factor of the Different Vegetation Types on Napa Lake Basin. Ecol. Environ. Sci. 2016, 25, 217–222. [Google Scholar]
Figure 1. Study area.
Remotesensing 16 00777 g001
Figure 3. The distribution of NEP in the Three-North Shelter Forest Program Area from 2000 to 2020.
Remotesensing 16 00777 g003
Figure 4. Evaluation of NEP trends and their statistical significance. Panel (a) illustrates the trend of NEP as determined by the Theil–Sen estimator, whereas panel (b) displays the trend analysis results derived from the Mann–Kendall (MK) test.
Remotesensing 16 00777 g004aRemotesensing 16 00777 g004b
Figure 5. Relationship between NEP changes and (a) temperature, (b) precipitation.
Remotesensing 16 00777 g005
Figure 6. The interplay between Net Ecosystem Productivity (NEP) and Land-Use and Land-Cover Changes (LUCC).
Remotesensing 16 00777 g006
Figure 7. NEP Hurst index and spatial patterns of long-term NEP changes.
Remotesensing 16 00777 g007
Table 1. The main data sources used in this study.
DataSourceAccess DatePeriod
Net Primary Productivity https://earthengine.google.com24 January 20232000–2020
TemperatureReference [27]5 April 20222000–2020
PrecipitationReference [28]8 May 20222000–2020
Geospatial Vector Datahttp://www.resdc.cn4 November 2022 -
Land Cover Classificationhttp://www.resdc.cn5 November 20222000–2020
Disclaimer/Publisher’s Note: The statements, opinions and data contained in all publications are solely those of the individual author(s) and contributor(s) and not of MDPI and/or the editor(s). MDPI and/or the editor(s) disclaim responsibility for any injury to people or property resulting from any ideas, methods, instructions or products referred to in the content.