Article

Optimal Integration of Optical and SAR Data for Improving Alfalfa Yield and Quality Traits Prediction: New Insights into Satellite-Based Forage Crop Monitoring

1
Biological Systems Engineering, University of Wisconsin-Madison, Madison, WI 53706, USA
2
Soil and Crop Sciences Section, School of Integrative Plant Science, Cornell University, Ithaca, NY 14853, USA
*
Author to whom correspondence should be addressed.
Remote Sens. 2024, 16(5), 734; https://doi.org/10.3390/rs16050734
Submission received: 16 January 2024 / Revised: 9 February 2024 / Accepted: 17 February 2024 / Published: 20 February 2024
(This article belongs to the Special Issue Smart Agriculture Based on Remote Sensing and Artificial Intelligence)

Abstract

:
Global food security and nutrition is suffering from unprecedented challenges. To reach a world without hunger and malnutrition by implementing precision agriculture, satellite remote sensing plays an increasingly important role in field crop monitoring and management. Alfalfa, a global widely distributed forage crop, requires more attention to predict its yield and quality traits from satellite data since it supports the livestock industry. Meanwhile, there are some key issues that remain unknown regarding alfalfa remote sensing from optical and synthetic aperture radar (SAR) data. Using Sentinel-1 and Sentinel-2 satellite data, this study developed, compared, and further integrated new optical- and SAR-based satellite models for improving alfalfa yield and quality traits prediction, i.e., crude protein (CP), acid detergent fiber (ADF), neutral detergent fiber (NDF), and neutral detergent fiber digestibility (NDFD). Meanwhile, to better understand the physical mechanism of alfalfa optical remote sensing, a unified hybrid leaf area index (LAI) retrieval scheme was developed by coupling the PROSAIL radiative transfer model, spectral response function of the desired optical satellite, and a random forest (RF) model, denoted as a scalable optical satellite-based LAI retrieval framework. Compared to optical vegetation indices (VIs) that only capture canopy information, the results indicate that LAI had the highest correlation (r = 0.701) with alfalfa yield due to its capacity in delivering the vegetation structure characteristics. For alfalfa quality traits, optical chlorophyll VIs presented higher correlations than LAI. On the other hand, LAI did not provide a significant additional contribution for predicting alfalfa parameters in the RF developed optical prediction model using VIs as inputs. In addition, the optical-based model outperformed the SAR-based model for predicting alfalfa yield, CP, and NDFD, while the SAR-based model showed better performance for predicting ADF and NDF. The integration of optical and SAR data contributed to higher accuracy than either optical or SAR data separately. Compared to a traditional embedded integration approach, the combination of multisource heterogeneous optical and SAR satellites was optimized by multiple linear regression (yield: R2 = 0.846 and RMSE = 0.0354 kg/m2; CP: R2 = 0.636 and RMSE = 1.57%; ADF: R2 = 0.559 and RMSE = 1.926%; NDF: R2 = 0.58 and RMSE = 2.097%; NDFD: R2 = 0.679 and RMSE = 2.426%). Overall, this study provides new insights into forage crop yield prediction for large-scale fields using multisource heterogeneous satellites.

1. Introduction

As the global population grows (i.e., it is predicted to reach 10 billion in 2050) and we continue to strive to improve human living standards, the need for an increasing quantity and quality of food will continue [1]. However, it will be difficult to expand the existing agricultural land base [2] while a portion of the existing land base is being converted into urban and industrial land or abandoned. Currently, global food security and nutrition is facing an unprecedented threat and challenge, exasperated by the effects of climate change [3], such as heat waves, droughts, and floods. Recently, it has been reported by the Food and Agriculture Organization (FAO) that moderate or severe food insecurity levels on a global scale have been slowly increasing since 2014; however, the increase in 2020 may be approximately the sum of the previous five years [4]. On the other hand, it was estimated that 22% of children under five years old (149.2 million) suffered from stunting in 2020 [4]. As a result, one target of the Sustainable Development Goals (SDG), a world without hunger and malnutrition by 2030, is using precision agriculture methods with interdisciplinary cooperation to expand the food base [5].
There is a growing realization that satellite remote sensing is capable of measuring food security and nutrition levels at regional and global scales [6]. Even for small scale fields, within-field crop growth monitoring and yield estimation can also benefit from satellite observations [7]. For instance, many studies have employed remote sensing data to estimate yield for cereal crops (e.g., wheat, rice, and corn) [8], tuber crops (e.g., sweet potato and potato) [9], and legume crops (e.g., soybeans, beans, and pea) [10]. These non-forage crops and their processed products are usually directly eaten and consumed by humans. Forage crops such as alfalfa, sudangrass, and tall wheatgrass are first eaten by ruminant animals (e.g., sheep, beef cattle, and dairy cows) that generate meat products and milk for human consumption [11]. In contrast, yield, which is determined by the weight of dry matter, in forage crops is rarely estimated from satellite data. In addition to yield, quality traits including crude protein (CP), acid detergent fiber (ADF), neutral detergent fiber (NDF), and neutral detergent fiber digestibility (NDFD) are also key indicators to measure the quality of forage crops. Alfalfa, known as the queen of forage crops, is one of the most important forage crops in the world since it has abundant crude protein, saponins, vitamins, sugars, and minerals [12]. Therefore, to better support the global livestock industry and advance food security and nutrition, it is beneficial to predict alfalfa yield and quality traits using satellite remote sensing data. However, few studies employed satellite images to predict alfalfa yield [13,14]. This study will attempt to develop and compare new satellite-based alfalfa yield and quality traits prediction models.
Optical satellite data within the spectral domain of 300–3000 nm are often used to monitor non-forage crop growth and yield [7]. Successful prediction of yield using optical spectral data relies on vegetation greenness and water content, which are closely correlated with yield [15]. For instance, optical vegetation indices (VIs) including normalized difference vegetation index (NDVI), 2-band enhanced vegetation index (EVI2), near-infrared reflectance of vegetation (NIRv), and normalized difference water index (NDWI) are widely employed to build a relationship with yield for non-forage crops [15,16]. Leaf area index (LAI), known as a biophysical structure parameter, is defined as the projected area of total leaves over a uniform unit of land (m2/m2). Optical satellites capture reflected solar radiation signal from the vegetation canopy [17], and hence optical VIs mainly convey vegetation canopy information [18]. Nevertheless, LAI includes vegetation structure characteristics and can also be remotely retrieved from optical satellite data [19], indicating it would be a more useful remote sensing variable to model crop yield. However, yield of non-forage crops is often estimated using only a portion of the plant. For instance, wheat yield is determined by evaluating only the ear of wheat. Although wheat yield generally increases with increasing LAI, some wheat plants with high LAI may have dense leaves with a low grain yield, and vice versa [20]. A similar phenomenon can also be found in maize [21]. This explains some studies reporting that optical VIs had a more significant relationship with yield of non-forage crops than LAI [22]. In contrast, alfalfa yield is determined by the weight of dry matter, and a greater LAI level should directly result in higher alfalfa yield [23]. This indicates that LAI may be a more suitable satellite proxy for alfalfa yield compared to optical VIs. However, in regard to relationships among alfalfa yield, optical data derived LAI and VIs have not yet been comprehensively investigated and compared.
Recently, synthetic aperture radar (SAR) satellite data have drawn more attention in modeling crop phenology and deriving yield [24,25]. For instance, Wiseman et al. [26] successfully used RADARSAT-2 polarimetric SAR variables to estimate crop biomass, including canola, corn, and soybean. Kumar et al. [27] employed Sentinel-1A SAR data to derive various winter wheat parameters including LAI, vegetation water content, plant height, and dry/fresh biomass. Mandal et al. [28] also demonstrated that corn LAI can be retrieved from Sentinel-1 SAR data with reasonable accuracy, i.e., root mean square error (RMSE) = 0.677 m2/m2. SAR satellites acquire the total backscattering coefficient associated with both vegetation and underlying soil [29]. Compared to optical satellites, SAR signals have a stronger penetration into the crop plant canopy due to their longer spectral wavelength. Typical wavelengths in SAR observations are denoted as different bands; commonly used bands include X, C, S, L, and P [24]. Their frequency range is 4–8, 2–4, 1–2, and 0.3–1 GHz, respectively, and the corresponding wavelengths are 3.8–7.5, 7.5–15, 15–30, and 30–100 cm, respectively. Consequently, (1) SAR satellites can obtain valid images under all-weather conditions, and (2) optical and SAR satellite data should present different abilities for modeling vegetation variables. For instance, Kaplan et al. [30] found that optical data performed better than SAR data in estimating cotton crop coefficient (Kc), LAI, and height. Similarly, Bhattarai et al. [31] reported the superiority of optical data over SAR data in estimating LAI of mixed forests. On the other hand, Ranjan and Parida [32] demonstrated that SAR data achieved better performance in deriving paddy yield compared to SAR data. Beeri et al. [33] found that models developed using SAR data had slightly better accuracy than those using optical data for estimating vineyard Kc and LAI. It is not yet known which type of satellite data will perform better for predicting alfalfa yield and quality traits.
It was reported that integration of optical and SAR data showed higher accuracy than results from single optical or SAR data [34]. Traditionally, previous studies often used an embedded integration approach to combine optical and SAR data [35]. In this regard, optical and SAR data were inputted into one model to estimate vegetation variables. To optimize the integration of multisource heterogeneous satellite data, we have proposed two different methods. Alfalfa parameters were first predicted from single optical or SAR data, respectively, and the predictions from two satellite prediction models were integrated through the multiple linear regression and averaging method. Then we compared them with the traditional embedded integration approach.
Therefore, the objectives of this study were to (1) investigate and compare relationships among alfalfa yield, LAI, and VIs; (2) explore if LAI provides an additional contribution to higher accuracy of alfalfa yield prediction; (3) compare optical- and SAR-based models in predicting alfalfa yield and quality traits; and (4) optimize and assess three integration approaches for predicting alfalfa parameters from combined optical and SAR satellite data. This study used Sentinel-2 and Sentinel-1 data to represent optical and SAR data, respectively.

2. Data and Method

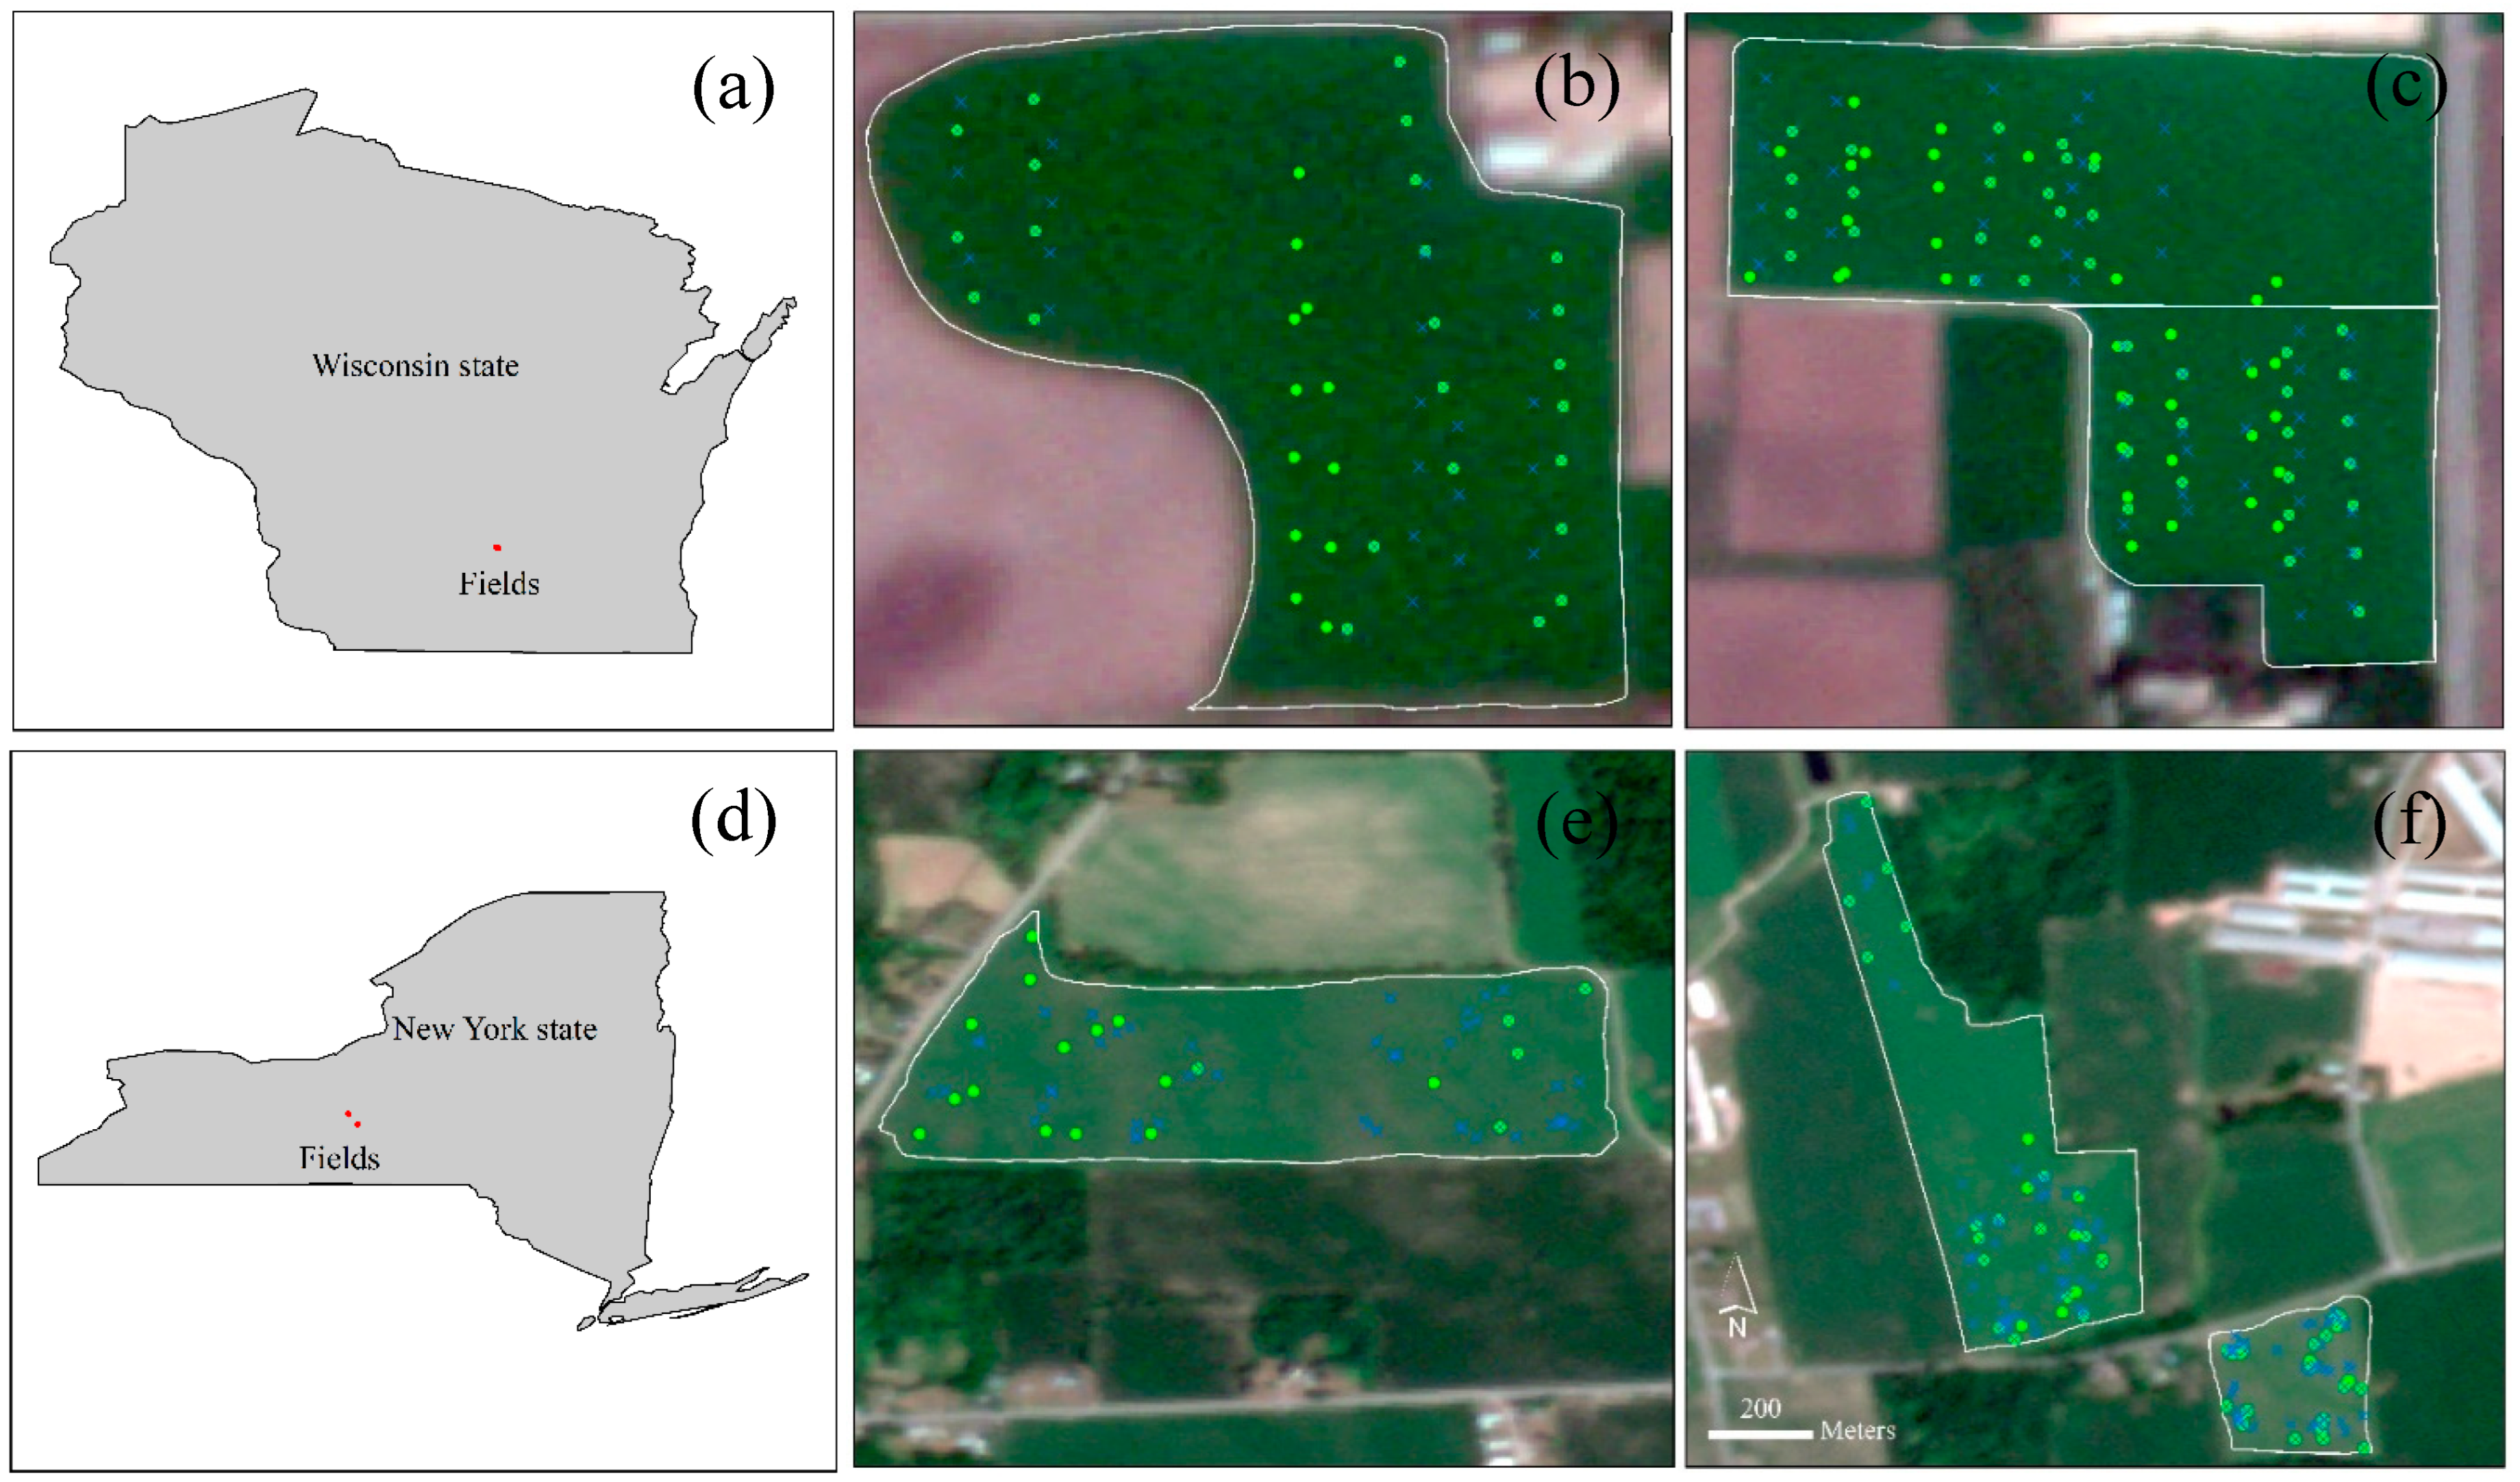
2.1. Study Site and In Situ Measurements

Wisconsin and New York are two of the top dairy states in the United States that rely on alfalfa production [36]. In situ alfalfa samples were needed to build and evaluate yield and quality traits prediction model from optical and SAR satellite data. In this study, three alfalfa fields in Wisconsin were selected as the study site. To make the developed model more applicable, we also considered three alfalfa fields in New York state. Figure 1 shows the location of six alfalfa fields in Wisconsin and New York states. There were 311 and 187 alfalfa samples with matched Sentinel-2 and Sentinel-1 data, respectively. In addition, 92 alfalfa samples were matched with concurrent Sentinel-2 and Sentinel-1 data.
Alfalfa in the study fields was mowed monthly from May to August 2022 by the farmers, and it experienced rapid regrowth after each mowing campaign. A 4–5 times alfalfa sampling was performed in each field before each mowing campaign to obtain the variation and progression of alfalfa yield and quality traits. To match the spatial scale of satellite pixels, each sampling site had a spatial range of 30 × 30 m, as per [37]. Specifically, four subsamples were evenly distributed on a circle with a radius of 7.5 m, and individual subsamples were mowed from 0.5 × 0.5 m2 areas. The center of the circle was denoted as the location of each sampling site, which was measured using a GPS position instrument (i.e., latitude and longitude). To determine alfalfa yield, the samples acquired from in situ sampling activities were immediately dried in the oven at 60 °C. Meanwhile, dry samples were further investigated in the laboratory for measuring alfalfa quality parameters (i.e., CP, ADF, NDF, and NDFD).

2.2. Sentinel-2 and Sentinel-1 Satellite Data

Sentinel-2, equipped with twin satellites Sentinel-2A and 2B, is an optical sensing constellation that provides global multispectral data every five days. Sentinel-2 satellite data have 13 spectral bands spanning from visible to shortwave infrared wavelengths. In this study, Sentinel-2 surface reflectance at 30 m spatial resolution was obtained from Harmonized Landsat and Sentinel-2 (HLS) products, which can be freely downloaded from the NASA website (https://search.earthdata.nasa.gov/search, accessed on 16 February 2024). In addition to surface reflectance at each spectral band, the HLS dataset also offered a cloud mask layer and solar-viewing angles at each pixel. Note that solar-viewing angles include solar zenith angle (SZA), solar azimuth angle (SAA), viewing zenith angle (VZA), and viewing azimuth angle (VAA). Cloud mask was used to exclude snow/ice, cloud, and cloud shadow pixels since only clear observations can give valid crop information.
Sentinel-1 provides active microwave data under all-weather conditions using a C-band SAR instrument. The original Sentinel-1 had twin satellites Sentinel-1A and 1B; however, Sentinel-1B stopped acquiring valid data on 23 December 2021 due to an unrepairable power issue. Backscattering coefficient has often been used to characterize the information among different land cover types [38]. The ready-to-use Sentinel-1 backscattering coefficients (i.e., GRD dataset) at VV and VH dual-polarization channels were directly retrieved from the Google Earth Engine (GEE) platform (https://code.earthengine.google.com/, accessed on 16 February 2024). In addition, a basic filter with spatial averaging method was often used to lower the impact of speckle noise [34,39]. To match the spatial scale of in situ alfalfa samples, the original 10 m resolution GRD data were integrated to 30 m using an average interpolation method. In addition to Sentinel-1 backscattering coefficients at VV and VH polarizations, the derived radar VIs (i.e., VH/VV and RVI) were also used to build the SAR-based prediction model since they are useful to capture crop growth [40]. Radar incident angle usually generates some biases in the backscattering coefficients, and thus it was also considered in this study.

2.3. MODIS Surface Reflectance and LAI Products

The LAI data in this study were derived using a unified hybrid model that coupled a radiative transfer model (i.e., PROSAIL), the spectral response function (SRF) of desired optical satellite, and a random forest (RF) algorithm. The developed LAI retrieval approach is a scalable optical satellite-based framework, indicating that it can be adapted to any optical satellite data and does not depend on spatial resolution. MODIS surface reflectance and LAI data were used to evaluate the accuracy of the unified hybrid model due to the unavailability of ground LAI measurements in our field experiment. Daily MODIS nadir surface reflectance data at 500 m spatial resolution were derived from the MCD43A4 product [41]. The MCD15A3H product provided global 500 m LAI data at a 4-day interval. The National Ecological Observatory Network (NEON), supported by the National Science Foundation, is composed of sites in United States in different types of biomes. MCD43A4 and MCD15A3H products in 2022 at NEON sites were obtained from the GEE platform to evaluate the performance of the unified hybrid LAI retrieval framework. Finally, 8154 pixels were obtained to evaluate LAI retrieval accuracy.

2.4. Methods

The radiative transfer model PROSAIL was developed by coupling the leaf optical model PROSPECT [42] with the canopy reflectance model SAIL [43]. The PROSAIL model has been widely used to derive various vegetation parameters, since it is a mature model used to simulate absorption and scattering of solar radiation within vegetation leaf and canopy levels. In this study, a unified hybrid model coupling the PROSAIL model and RF algorithm was first proposed to remotely derive LAI from optical data. The unified hybrid model included three steps: (1) a comprehensive simulation dataset that considered various vegetation leaf and canopy characteristics was generated with the aid of PROSAIL model. To characterize leaf optical properties, the PROSPECT model was used to derive leaf hemispherical reflectance and transmittance with four leaf parameters including leaf structure index (N), equivalent water thickness (Cw), leaf chlorophyll content (Cab), and dry matter content (Cm). The SAIL model was employed to simulate canopy reflectance through the leaf optical properties calculated from PROSPECT model and canopy parameters including average leaf angle (ALA), leaf area index (LAI), hot spot parameter (Hspot), solar zenith angle (tts), observation zenith angle (tto), and relative azimuth (psi). Biophysical parameters during PROSAIL radiative transfer simulation were determined after performing sensitivity experiment [44]. Parameter settings in the PROSAIL model are presented in Table 1. The simulation dataset included various LAI values and the corresponding hyperspectral reflectance of vegetation canopy ranging from 400 to 2500 nm with 1 nm interval. (2) The spectral reflectance from desired satellite was simulated by coupling its SRF and the simulation dataset.
R b ( k ) = λ j λ i S R F ( λ ) ρ ( λ ) d ( λ ) λ j λ i S R F ( λ ) d ( λ )
where Rb(k) represents the canopy reflectance of the desired satellite at the k-th spectral band; λi and λj denote the wavelength range of the k-th spectral band; and SRF(λ) is the SRF value at the k-th spectral band. (3) The LAI retrieval model suited to the desired satellite was built using simulated data from the second step. During the third step, a look-up-table (LUT) or machine learning algorithm was usually used to establish the relationship between VIs and LAI [44]. It has been reported that the machine learning model was more efficient and accurate than the LUT approach [45]. Thus, an RF model was used in the third step.
The LAI retrieval framework can be extended and used with any desired optical satellite since the simulation dataset had a hyperspectral reflectance with a 1 nm interval. The developed LAI retrieval approach was denoted as a scalable satellite-based LAI retrieval framework. The desired optical satellites included MODIS and Sentinel-2 in this study, and thus MODIS-based and Sentinel-2-based LAI estimation hybrid models were both established. Due to the unavailability of ground measured LAI data, an indirect evaluation approach was used to investigate the performance of the hybrid LAI retrieval framework following two steps: (1) MODIS surface reflectance was used to develop the MODIS-based LAI retrieval model under the hybrid framework, and (2) a MODIS LAI product was used to evaluate the accuracy of the MODIS-based LAI retrieval model. In addition, Sentinel-2 surface reflectance and the Sentinel-2-based LAI retrieval model were employed to investigate the relationship between alfalfa yield and LAI.
Meanwhile, four widely used VIs (NDVI, EVI2, NIRv, and NDWI) were calculated using Sentinel-2 surface reflectance to examine their correlation with alfalfa yield. For comparison, four additional VIs, green–red vegetation index (GRVI), green normalized difference vegetation index (GNDVI), green chlorophyll index (GCI), and soil adjusted vegetation index (SAVI), were also used to study their relationship with alfalfa yield; the VI calculation equations are shown in Table 2.
The RF algorithm was used to develop and assess optical- and SAR-based models for predicting alfalfa yield and quality traits. Sentinel-2 VIs (NDVI, EVI2, NIRv, and NDWI) were utilized to establish the optical-based model. Meanwhile, three red edge bands of Sentinel-2 and solar-viewing angles (SZA, SAA, VZA, and VAA) were also considered in the optical-based model, since they contribute to better model vegetation [46] or have impacts on alfalfa surface directional reflectance. Sentinel-1 backscattering coefficients at VV and VH polarizations and the derived radar VIs (i.e., VH/VV and RVI) were used to build the SAR-based model. Sentinel-1 incident angle was also input into the SAR-based model to remove its effect on backscattering coefficients. Theoretically, simultaneous satellite data should be used to model vegetation parameters. However, limited by the weather conditions, the revisit time of satellite, and the actual in situ sampling campaign [47], such data were usually difficult to obtain [48]. Previous studies usually used satellite data prior to harvest and/or sampling to model crop yield because of the continuity of crop growth [49]. We employed available Sentinel-2 and Sentinel-1 data within three days prior to the field alfalfa sampling to propose and evaluate the optical- and SAR-based models. There were 311 and 187 matched alfalfa sample pairs with Sentinel-2 and Sentinel-1 data, respectively, wherein 92 pairs were obtained at the same alfalfa sampling sites. We used the 10-fold cross validation (CV) method to assess and compare the performance of different models. To further reduce the randomness of the one time CV process, the 10-fold CV was repeated 100 times. The final evaluation indicators including the coefficient of determination (R2) and RMSE were calculated by averaging CV results 100 times.

3. Results and Discussion

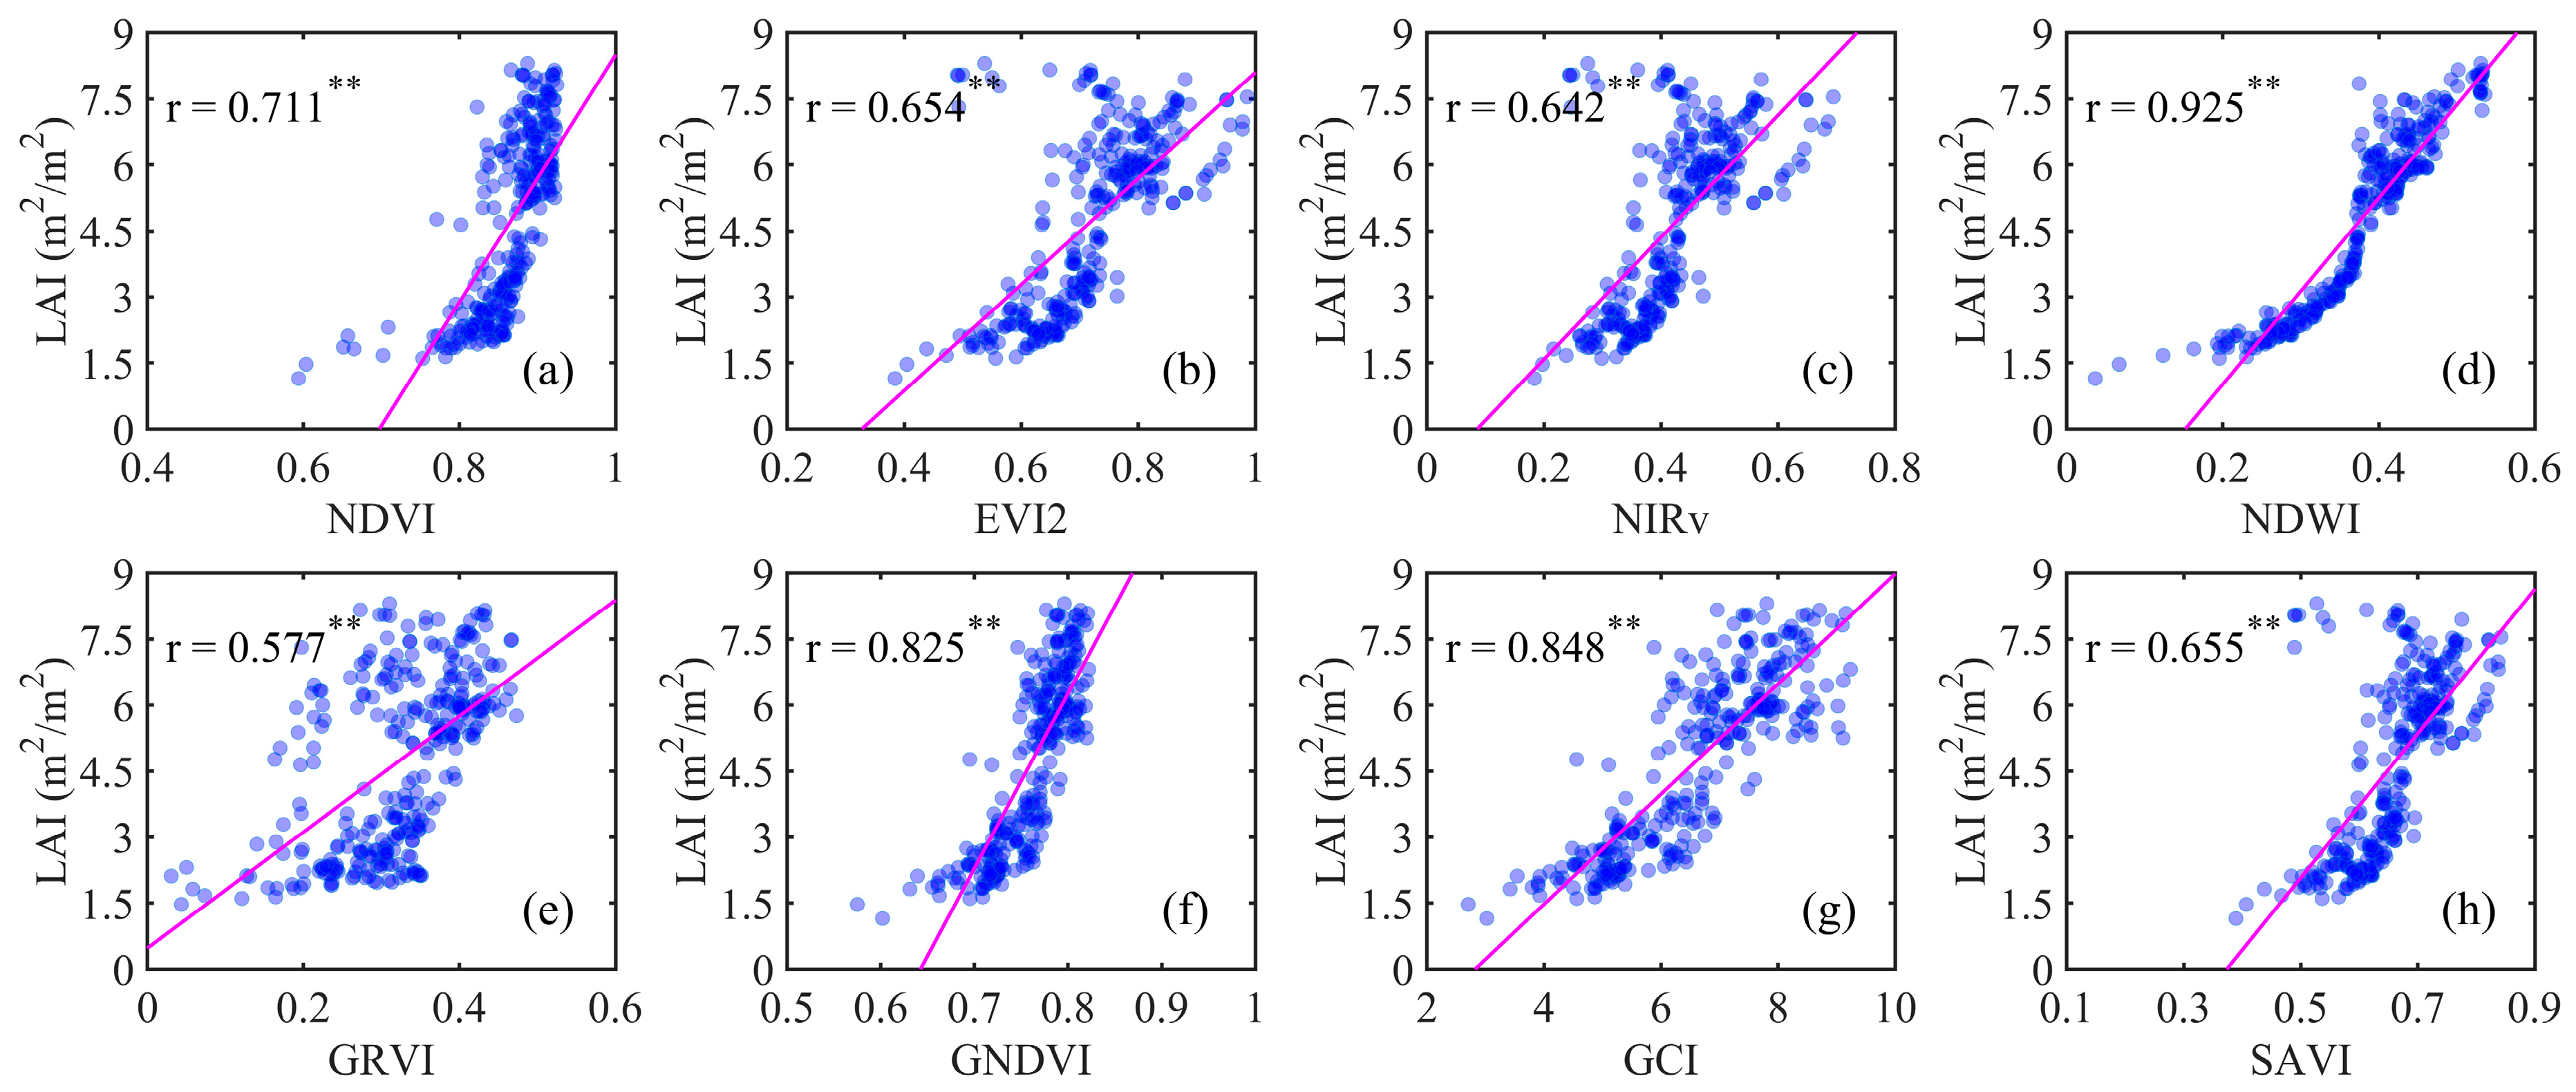
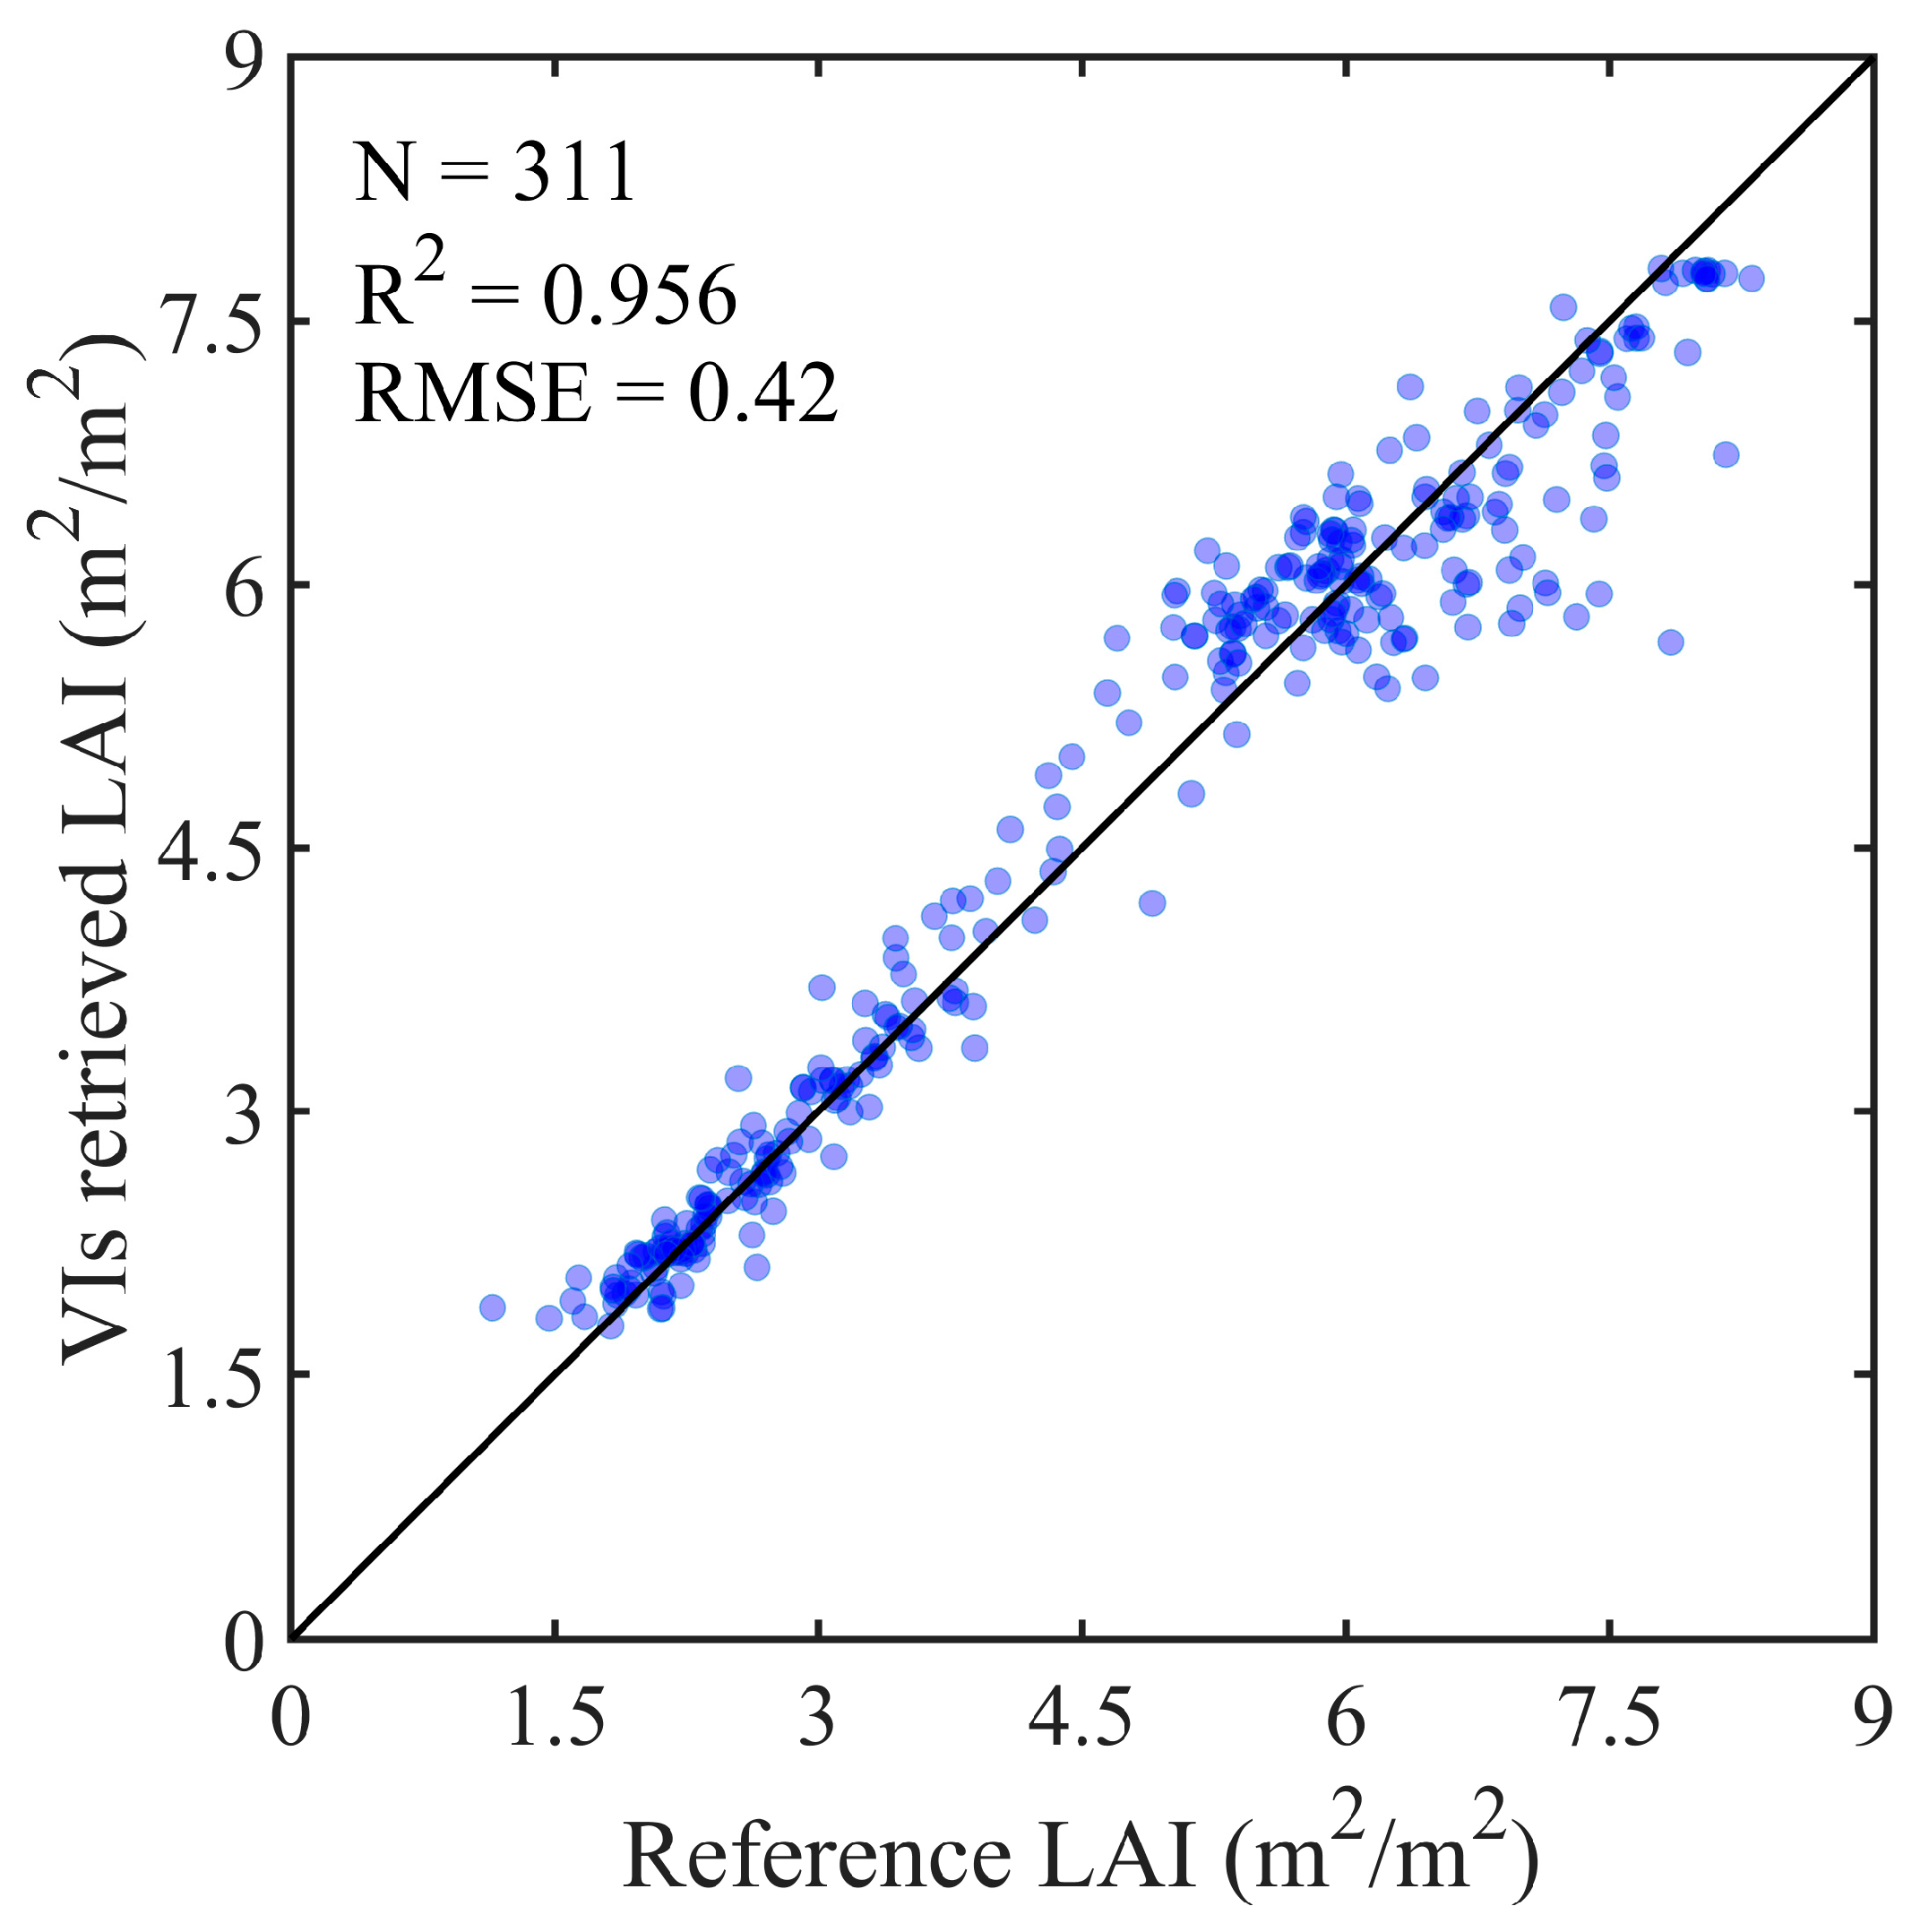
3.1. PROSAIL Simulation and LAI Retrieval Validation

To begin, 94,500 sets of simulated canopy hyperspectral reflectance at 400–2500 nm were generated using the PROSAIL model. Figure 2 shows the typical canopy hyperspectral reflectance simulated by the PROSAIL model. It was observed that the simulated canopy spectra had typical vegetation optical characteristics. For instance, reflectance troughs occurred at both blue and red wavelength ranges due to photosynthesis, while reflectance peaks appeared at green, red edge, and near-infrared (NIR) domains. Specially, reflectance at red edge and NIR wavelength ranges obviously increased with increasing LAI (Figure 2). In general, higher LAI (i.e., more leaves) would generate enhanced multiple reflections within the vegetation and thus increase the canopy reflectance, forming the physical basics of remote estimation of LAI. LAI retrieval hybrid models using MODIS or Sentinel-2 data were developed through integrating the PROSAIL simulation dataset, the SRF of specific satellites, and an RF model. Due to the unavailability of in situ measured LAI data, the existing MODIS LAI product with reasonable performance was utilized to evaluate the accuracy of the unified hybrid LAI retrieval scheme. It is an acceptable strategy to evaluate the accuracy of parameter retrievals using the existing satellite product [50]. Figure 2b presents LAI retrieval validation results (RMSE = 0.572 m2/m2) from MODIS data with the hybrid model. Results indicate that the hybrid model guided by the PROSAIL radiative transfer model had reasonable accuracy in estimating LAI.

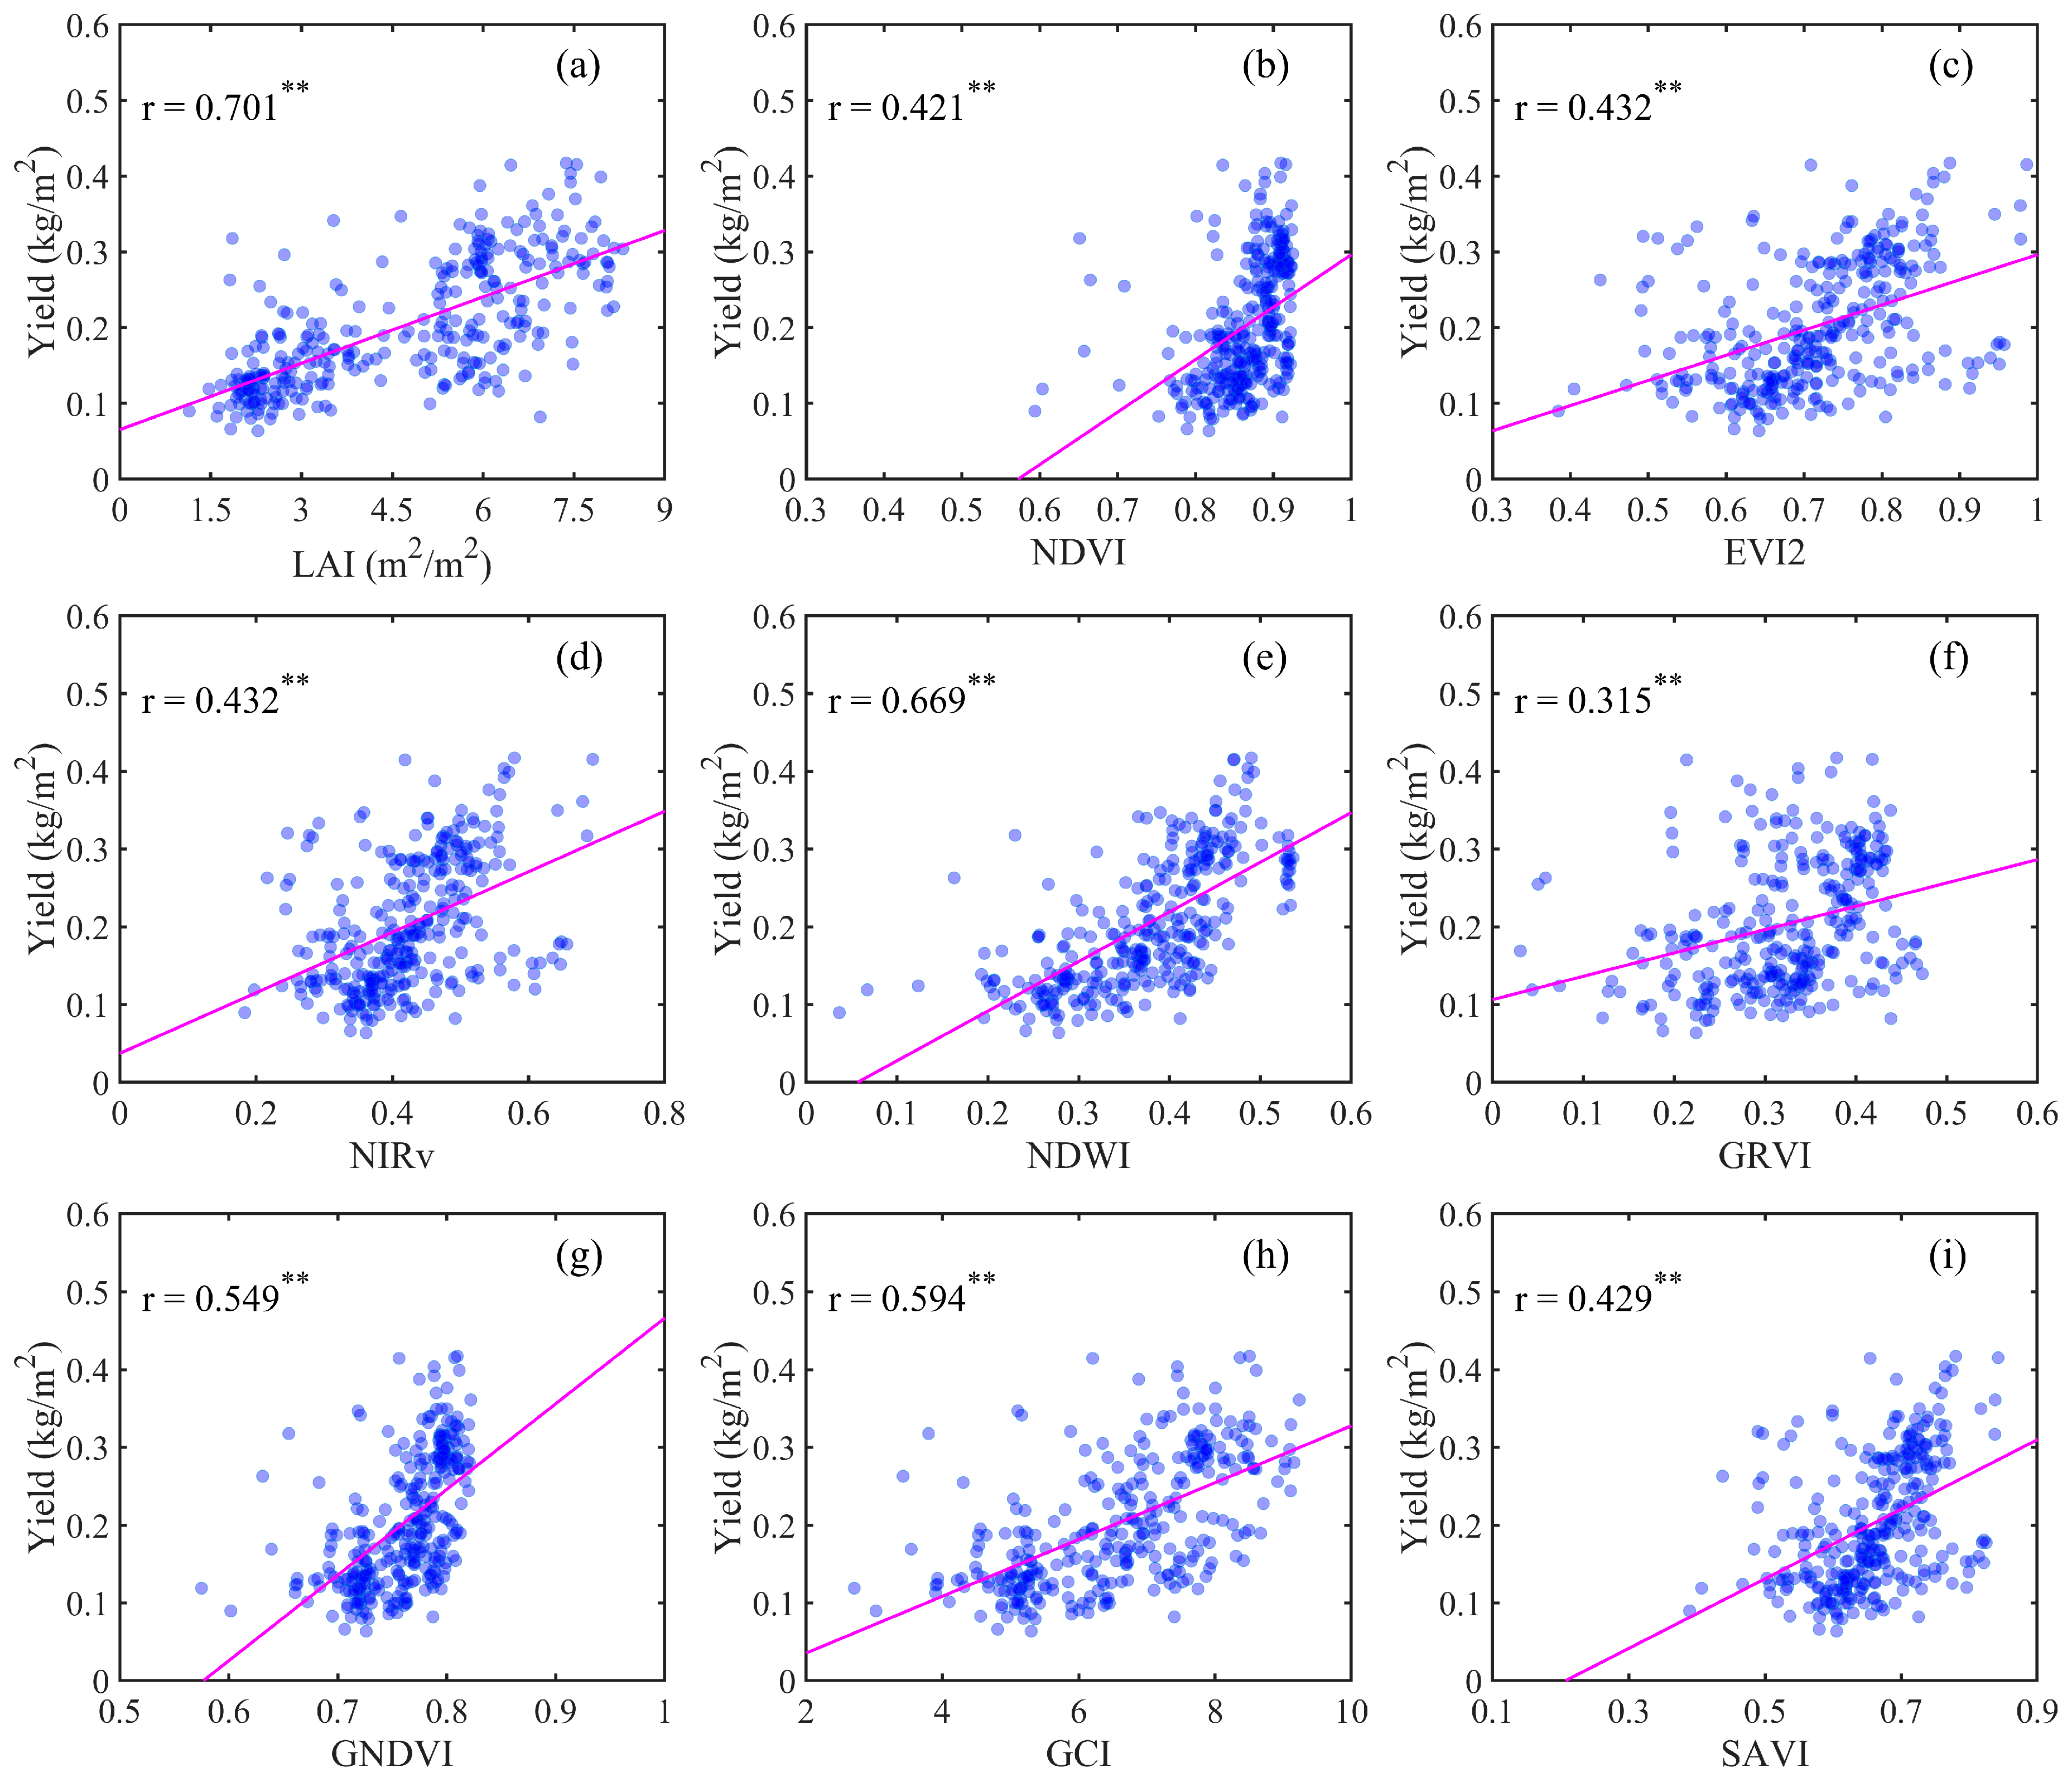
3.2. Comparison of the Relationship between Alfalfa Yield and LAI and VIs

Table 3 shows the relationship between alfalfa yield and LAI and VIs. Alfalfa yield in Figure 3 had a range of 0.0636–0.4176 kg/m2 with an average value of 0.2022 kg/m2. For data from Wisconsin, it was observed that LAI and eight VIs all had a significant correlation with alfalfa yield (p-value < 0.001). The highest correlation with yield was LAI (r = 0.804) followed by GCI (r = 0.796). NDWI had a comparable correlation (r = 0.790) with alfalfa yield compared to GCI. For data in New York state, except for GRVI, LAI and seven VIs were also significantly correlated with alfalfa yield, having r > 0.251, wherein LAI had the highest correlation (r of 0.662) followed by NDWI (r = 0.654). When data in the two states were combined, alfalfa yield also had the highest correlation with LAI (r = 0.701) followed by NDWI (r = 0.669).
Figure 3 shows the scatterplots between alfalfa yield and LAI and VIs. According to Figure 3b, NDVI increased with increasing alfalfa yield. However, NDVI was nearly unchanged when it reached ~0.9, even if alfalfa yield continued to increase. Consequently, there was an evident saturation phenomenon for NDVI when it was used to link with alfalfa yield. In reality, optical saturation issues in NDVI are widely recognized when regions are covered by dense vegetation with high LAI or biomass [51]. EVI2 improved the saturation issue to some extent compared to NDVI (Figure 3c), and thus the correlation with alfalfa yield was increased (r = 0.432 vs. 0.421). In contrast, LAI, a typical vegetation structure parameter, was not influenced by saturation issue, and it had a linear relationship with alfalfa yield (Figure 3a). In addition, other VIs either had saturation effects (e.g., GNDVI) or presented discrete sample distributions with lower correlations (e.g., GRVI).
The results indicate that LAI had the highest correlation with alfalfa yield compared to various VIs. LAI can directly deliver quantitative information on the total leaf area of alfalfa. On the other hand, alfalfa yield is measured by the weight of dry matter, and thus increased LAI would indicate higher yield. Using in situ measured LAI, Liu et al. [23] reported a significant correlation between alfalfa yield and LAI (R2 = 0.56–0.64). To the best of our knowledge, it was the first study to demonstrate this relationship from a satellite’s point of view. By contrast, for non-forage crops, Kayad et al. [22] found that VI had higher accuracy for estimating maize grain yield than LAI (R2 = 0.93 vs. 0.69). Zarco-Tejada et al. [52] also reported similar findings for cotton yield. Johnson [53] found that LAI did not match or exceed the ability of VIs for estimating crop yield, including canola, potatoes, rice, soybeans, and wheat. This study demonstrates that LAI was a suitable satellite proxy to use as a physical mechanism for estimating alfalfa yield.
Table 3 also shows the relationship between alfalfa quality traits and LAI and VIs. The results indicate that LAI and VIs had varying r values when they were used to correlate with CP, ADF, NDF, and NDFD. When data in Wisconsin and New York states were combined, four quality traits all had significant correlation to LAI, GNDVI, and GCI. It is an interesting finding that chlorophyll indices GNDVI and GCI showed higher correlation coefficients with quality traits than LAI. This may be since increased chlorophyll content would generate more nutrients during the process of photosynthesis. It should be noted that vegetation chlorophyll content can also be derived from satellite data with the PROSAIL model [54]. To better understand the physical mechanism of alfalfa quality prediction, its quantitative relationship with chlorophyll content needs further investigation.

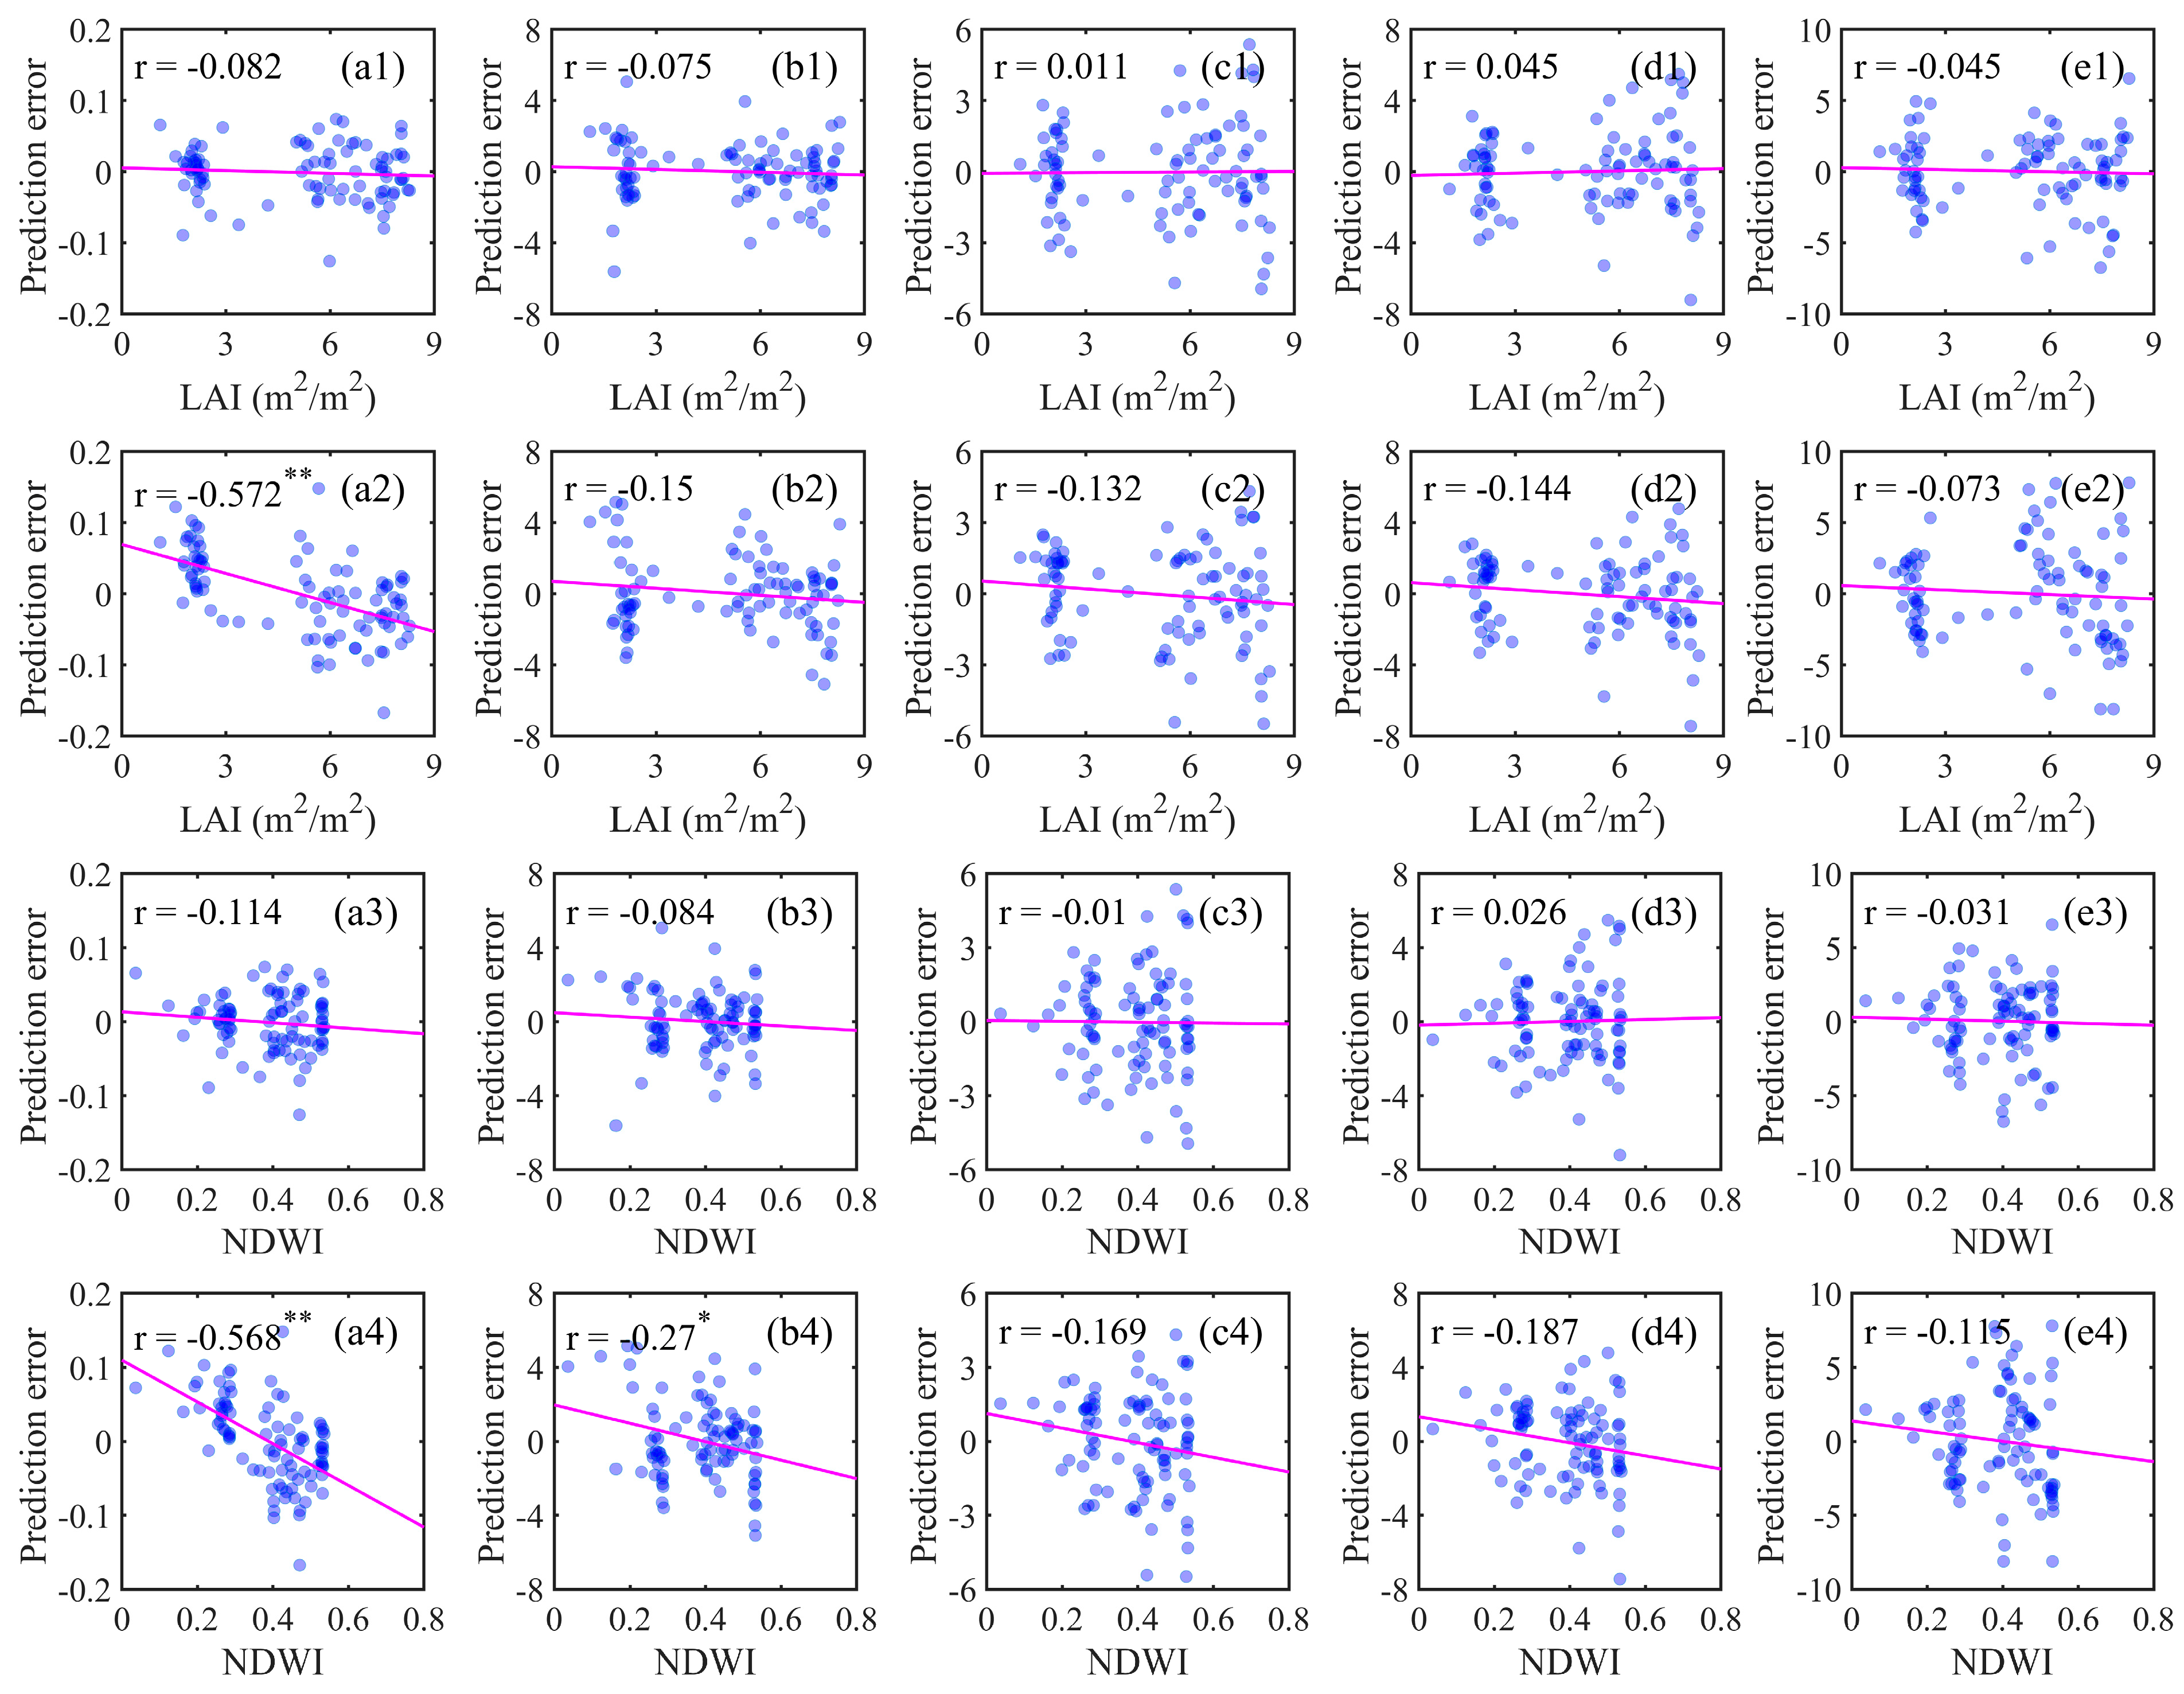
3.3. Investigation of the Additional Contribution of LAI to Prediction Accuracy

Table 4 shows alfalfa yield prediction results from Sentinel-2 data with and without LAI. The optical-based model without LAI was developed using only VIs data; it had reasonable accuracy in predicting alfalfa yield with an R2 of 0.805 and an RMSE of 0.0368 kg/m2. The prediction accuracy has an R2 of 0.789 and an RMSE of 0.0382 kg/m2 when LAI was input to the optical-based model. Results indicate that LAI did not provide an additional contribution to alfalfa yield prediction in the VIs-based model. Meanwhile, we investigated if LAI could contribute to a higher accuracy of predicted alfalfa quality traits. Table 4 also presents model validation accuracy with and without LAI for predicting alfalfa quality traits. The results denote that a model without LAI had comparable or similar accuracy than that with LAI.
Figure 4 shows the scatterplots between LAI and VIs. It was observed that eight VIs were all significantly (p-value < 0.001) related to LAI, with an r > 0.577. LAI had the highest correlation with NDWI (r = 0.925) followed by GCI (r = 0.848). Furthermore, VIs data were directly used to develop an empirical LAI estimation model with an RF algorithm. Figure 5 shows LAI comparison results of the optical Vis-based empirical model (R2 = 0.956 and RMSE = 0.42). Results demonstrate that LAI not only had collinearity with VIs but also can be accurately and empirically derived from VIs. Consequently, the role of LAI has been explained in the RF-established alfalfa yield and quality traits prediction models using VIs as inputs. This was likely the main reason that prediction accuracy was not significantly improved when LAI was inputted into the VIs-based prediction model. The collinearity of predictors and information redundancy will affect the model’s performance. For instance, Barriguinha et al. [16] found that a predictor that can be explained by other predictors did not contribute to more accurate crop yield estimation.
Although VIs can be used to accurately estimate crop yield with a machine learning model, large-scale (e.g., national and world range) within-field yield mapping requires extensive and spatio-temporally representative training data [55]. However, such valuable training data is currently unavailable for alfalfa. This study demonstrated that there was a significant linear relationship between LAI and alfalfa yield (r = 0.701) from a satellite remote sensing perspective. We used field alfalfa data across different spatial (i.e., Wisconsin and New York states) and temporal (i.e., from May to August) scales. Our findings indicate that the above-mentioned linear relationship may be less spatio-temporally dependent. On the other hand, the proposed LAI retrieval scheme can be extended to any desired optical satellite with different spatio-temporal resolutions given the SRFs. In addition, a crop growth model, e.g., Agricultural Production Systems Simulator (APSIM), could simulate an initial and inherent relationship between LAI and crop yield under various water, soil, and atmosphere conditions [56]. Assimilation of satellite-based LAI retrieval and a crop growth model enables large-scale crop yield mapping with limited field samples [57]. Thus, this study opens a significant opportunity to develop a scalable satellite-based alfalfa yield prediction module for large-scale fields in the future.

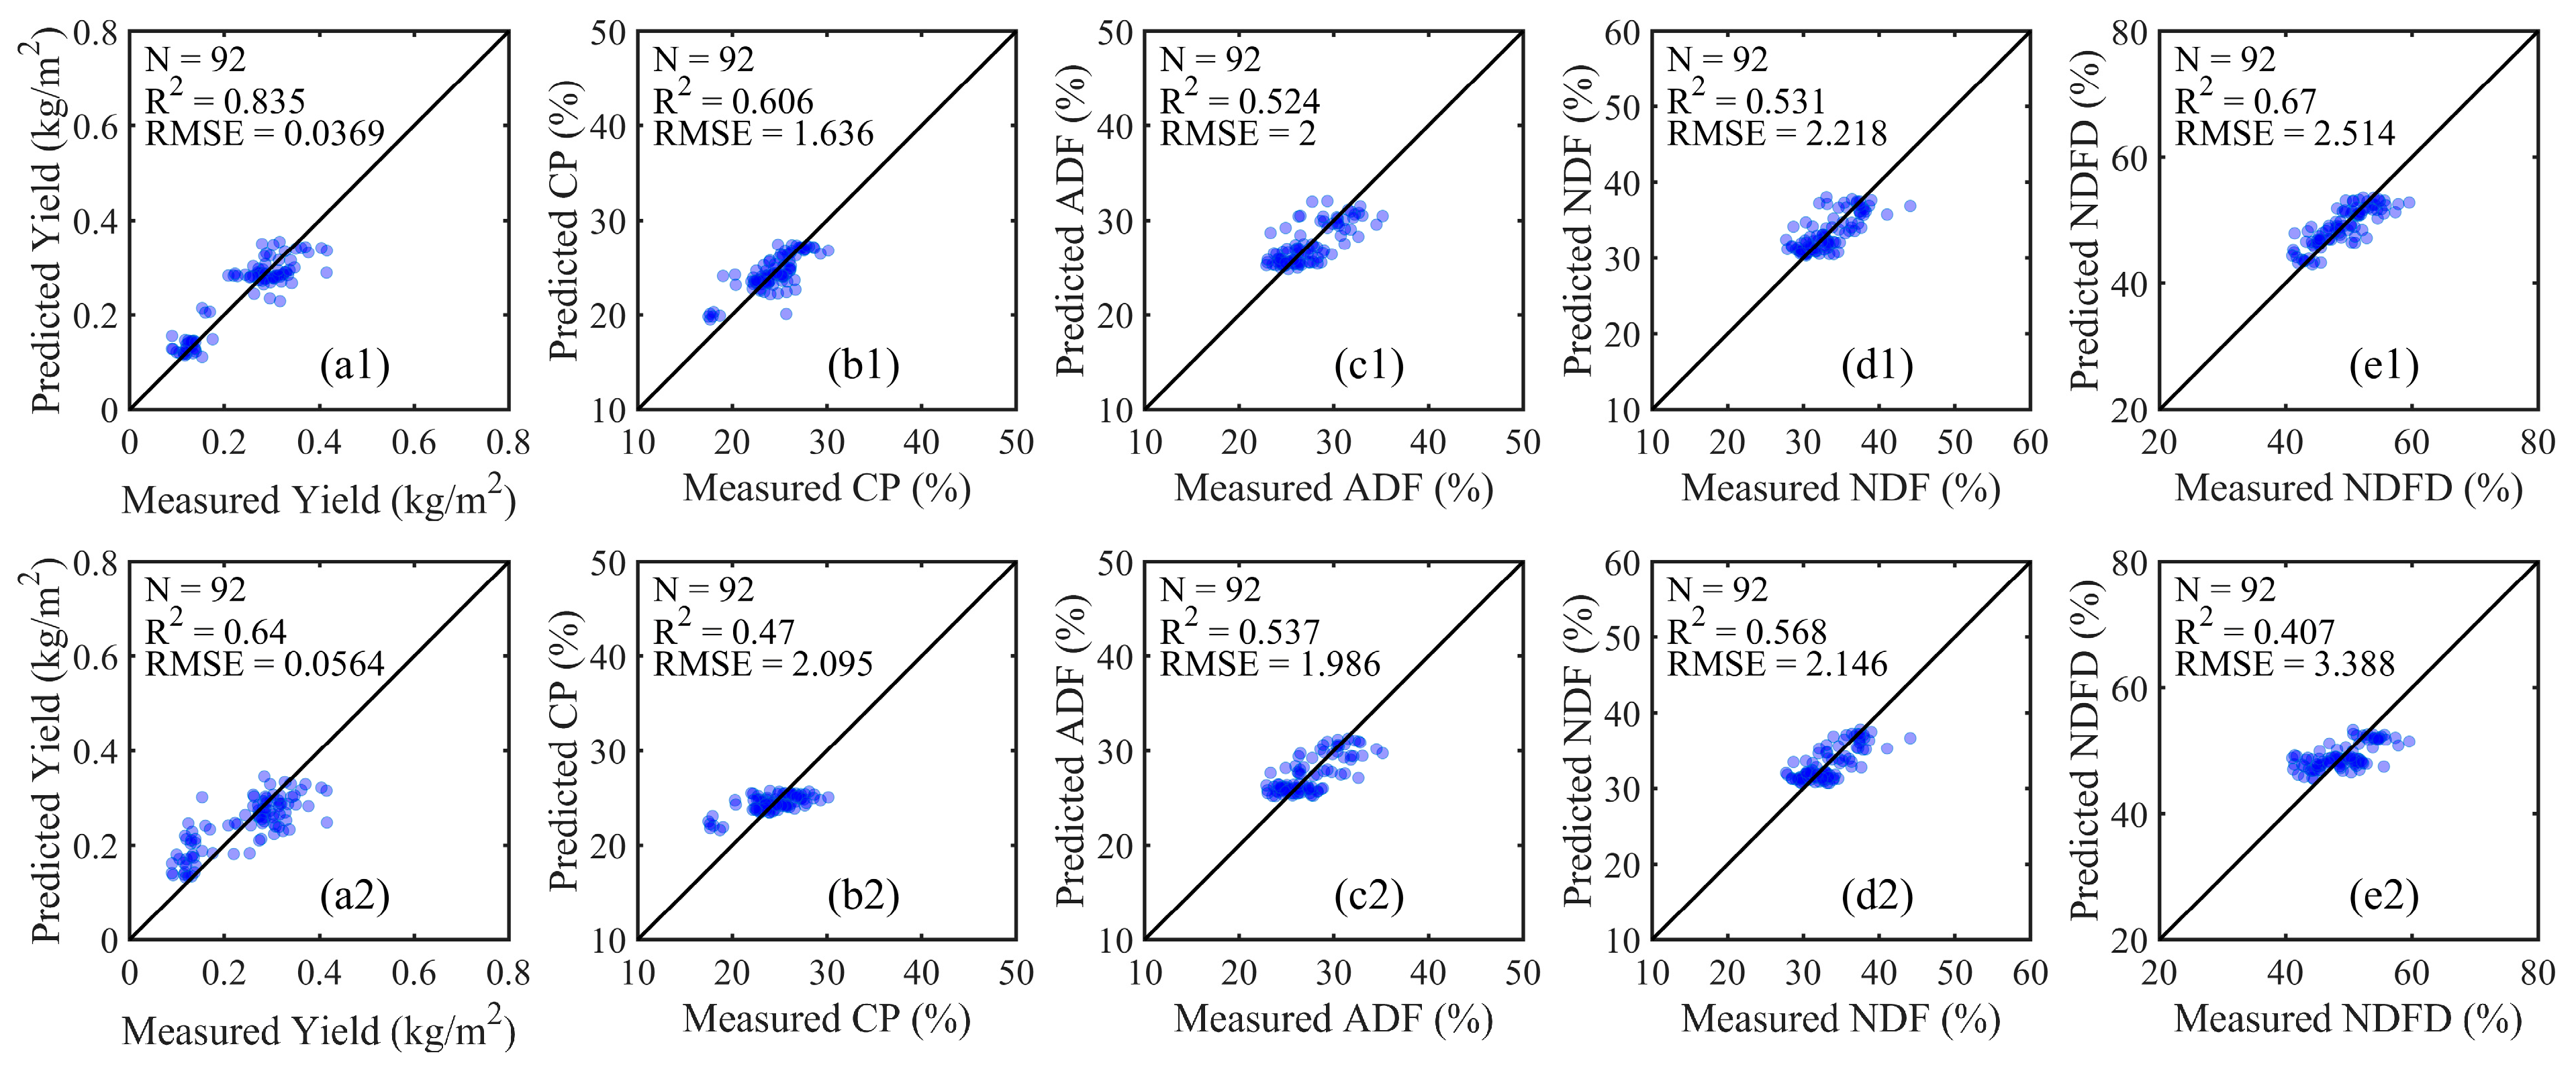
3.4. Comparison of Prediction Accuracy Using Optical- and SAR-Based Models

Figure 6 shows the validation results of predicted alfalfa yield and quality traits using optical- and SAR-based models. For the optical-based model, alfalfa yield was accurately predicted with an R2 of 0.835 and an RMSE of 0.0369 kg/m2. Meanwhile, quality traits had reasonable prediction accuracy (CP: R2 = 0.606; RMSE = 1.636%; ADF: R2 = 0.524; RMSE = 2.000%; NDF: R2 = 0.531; RMSE = 2.218%; NDFD: R2 = 0.670; RMSE = 5.514%). For the SAR-based model, alfalfa yield was predicted with R2 = 0.64 and RMSE = 0.0564 kg/m2. As to quality traits, these values were 0.47 and 2.095% for CP, 0.537 and 1.986% for ADF, 0.568 and 2.146% for NDF, and 0.407 and 3.388% for NDFD, respectively. The results denote that an optical-based model had higher accuracy than a SAR-based model in predicting alfalfa yield, CP, and NDFD. In contrast, the SAR-based model had higher accuracy for predicting ADF and NDF. Kayad et al. [14] only estimated alfalfa yield using Landsat-8 derived VIs with an R2 of 0.476. Azadbakht et al. [13] improved alfalfa yield estimation using Landsat-8 and PROBA-V time series with an R2 of 0.91. In contrast, this study jointly predicted alfalfa yield and quality traits from the optical-based model and obtained satisfactory results. This study also demonstrated that SAR satellite remote sensing provides an alternative to predict alfalfa parameters.
Crop greenness and water stress provide important information to characterize crop growth [58], and can be expressed by LAI and NDWI, respectively. The scatterplots between LAI/NDWI and alfalfa yield, CP, ADF, NDF, and NDFD prediction error from optical- and SAR-based models are shown in Figure 7. For the optical-based model, results denote that all scatter points were randomly distributed around line y = 0. The correlation coefficient r between LAI/NDWI and prediction error of all five alfalfa parameters were insignificant and small, with a range of −0.114–0.045 (p-value > 0.01). These results demonstrate that the proposed optical-based model had sufficiently explained the relationship between all five alfalfa parameters and LAI greenness and water stress. For the SAR-based model, the correlation coefficient r between LAI/NDWI and prediction error of ADF, NDF, and NDFD were insignificant, ranging from −0.187 to −0.073 (p-value > 0.01). However, yield prediction error significantly correlated with LAI (r = −0.572, p-value < 0.001) and NDWI (r = −0.568, p-value < 0.001), and CP prediction error had a weak correlation with NDWI (r = −0.27, p-value < 0.01). These results indicate that the SAR-based model had not fully explained the relationship between alfalfa yield/CP and greenness and water stress. This is the main reason that the optical-based model performed better than the SAR-based model in predicting alfalfa yield and CP. Compared to yield, quality traits had smaller correlation coefficients with LAI and NDWI (Table 3). As a result, LAI/NDWI had insignificant correlation with the prediction error of alfalfa quality traits from the SAR-based model (Figure 7(b2–e2) and Figure 7(c4–e4)).
Table 5 shows the correlation coefficients between SAR data and alfalfa yield and quality traits. There were significant correlations between alfalfa yield and backscattering coefficients at VV (r = 0.199, p-value < 0.01) and VH (r = 0.302, p-value < 0.001). However, the correlation coefficients generated from SAR data were smaller than that from optical data (Table 3). This was further evidence that an optical-based model performed better than a SAR-based model for predicting alfalfa yield. The SAR signal is usually influenced by both crop characteristics and the underlying soil moisture [59]. Consequently, changes in soil moisture will lead to the relationship between alfalfa quality traits and SAR data being nonlinear and complex with low correlation coefficients (Table 5). The RF algorithm can address the complex regression issue, and thus the proposed SAR-based model also had reasonable accuracy for predicting alfalfa quality traits.
According to the physical basis of SAR radiative transfer, the total backscattering coefficient is attributed to both backscattering from vegetation and underlying soil [29]. The proportion of backscattering from vegetation to the total backscattering coefficient changes with varying vegetation and soil conditions (i.e., LAI, leaf water content, and soil moisture level). In general, the vegetation signal detected by SAR satellites increased with increasing LAI and leaf water content [58], otherwise the backscattering signal contributed by the soil (i.e., noise source during alfalfa modeling) increased. In this study, the total backscattering coefficient was directly employed to predict alfalfa parameters, and alfalfa yield and CP were closely linked to LAI and NDWI (Table 3). The above-mentioned reasons explain the findings that: (1) alfalfa yield and CP prediction errors from SAR-based model negatively correlated with LAI and NDWI, and (2) optical-based model outperformed the SAR-based model for predicting alfalfa yield and CP. On the other hand, compared to optical data, the SAR satellite demonstrates a greater ability to penetrate vegetation due to a longer wavelength. This indicates that the received backscattering coefficients also include information on vegetation branches [60]. Therefore, the SAR-based model showed better performance for predicting ADF and NDF that relate with vegetation branches.
For non-forage crop parameters, optical-based models had a higher accuracy than SAR-based models for deriving cotton Kc, LAI, and crop height [30], while SAR-based models performed better than optical-based models for retrieving vineyard Kc and LAI [33]. For non-forage crop yield estimations, Ranjan and Parida [32] found that SAR-based models had higher accuracy for deriving rice yield. This is the first study to compare the performance of optical- and SAR-based models for predicting alfalfa yield and quality traits. Although Sentinel-2 images were selected as the optical data source, Landsat images can also be utilized for similar studies due to their similarity [61,62]. We used Sentinel-1 C-band images as the SAR data source. There are other SAR satellites operating at the X, S, L, and p bands. SAR data at different bands have varying penetration depth to crops, and thus present different abilities of monitoring crops [24]. In addition, interferometric coherence, another variable derived from SAR data, presents an added value for modeling crops compared to the backscattering coefficient [63]. Some studies have focused on the comparison and integration of interferometric coherence and backscattering coefficient to improved non-forage crop monitoring and parameters estimation [64]. Thus, more work should be conducted in the future to integrate multiple SAR satellites (e.g., C-band Sentinel-1 and L-band PALSAR-2) and different SAR products (e.g., interferometric coherence and backscattering coefficient) for predicting alfalfa parameters.

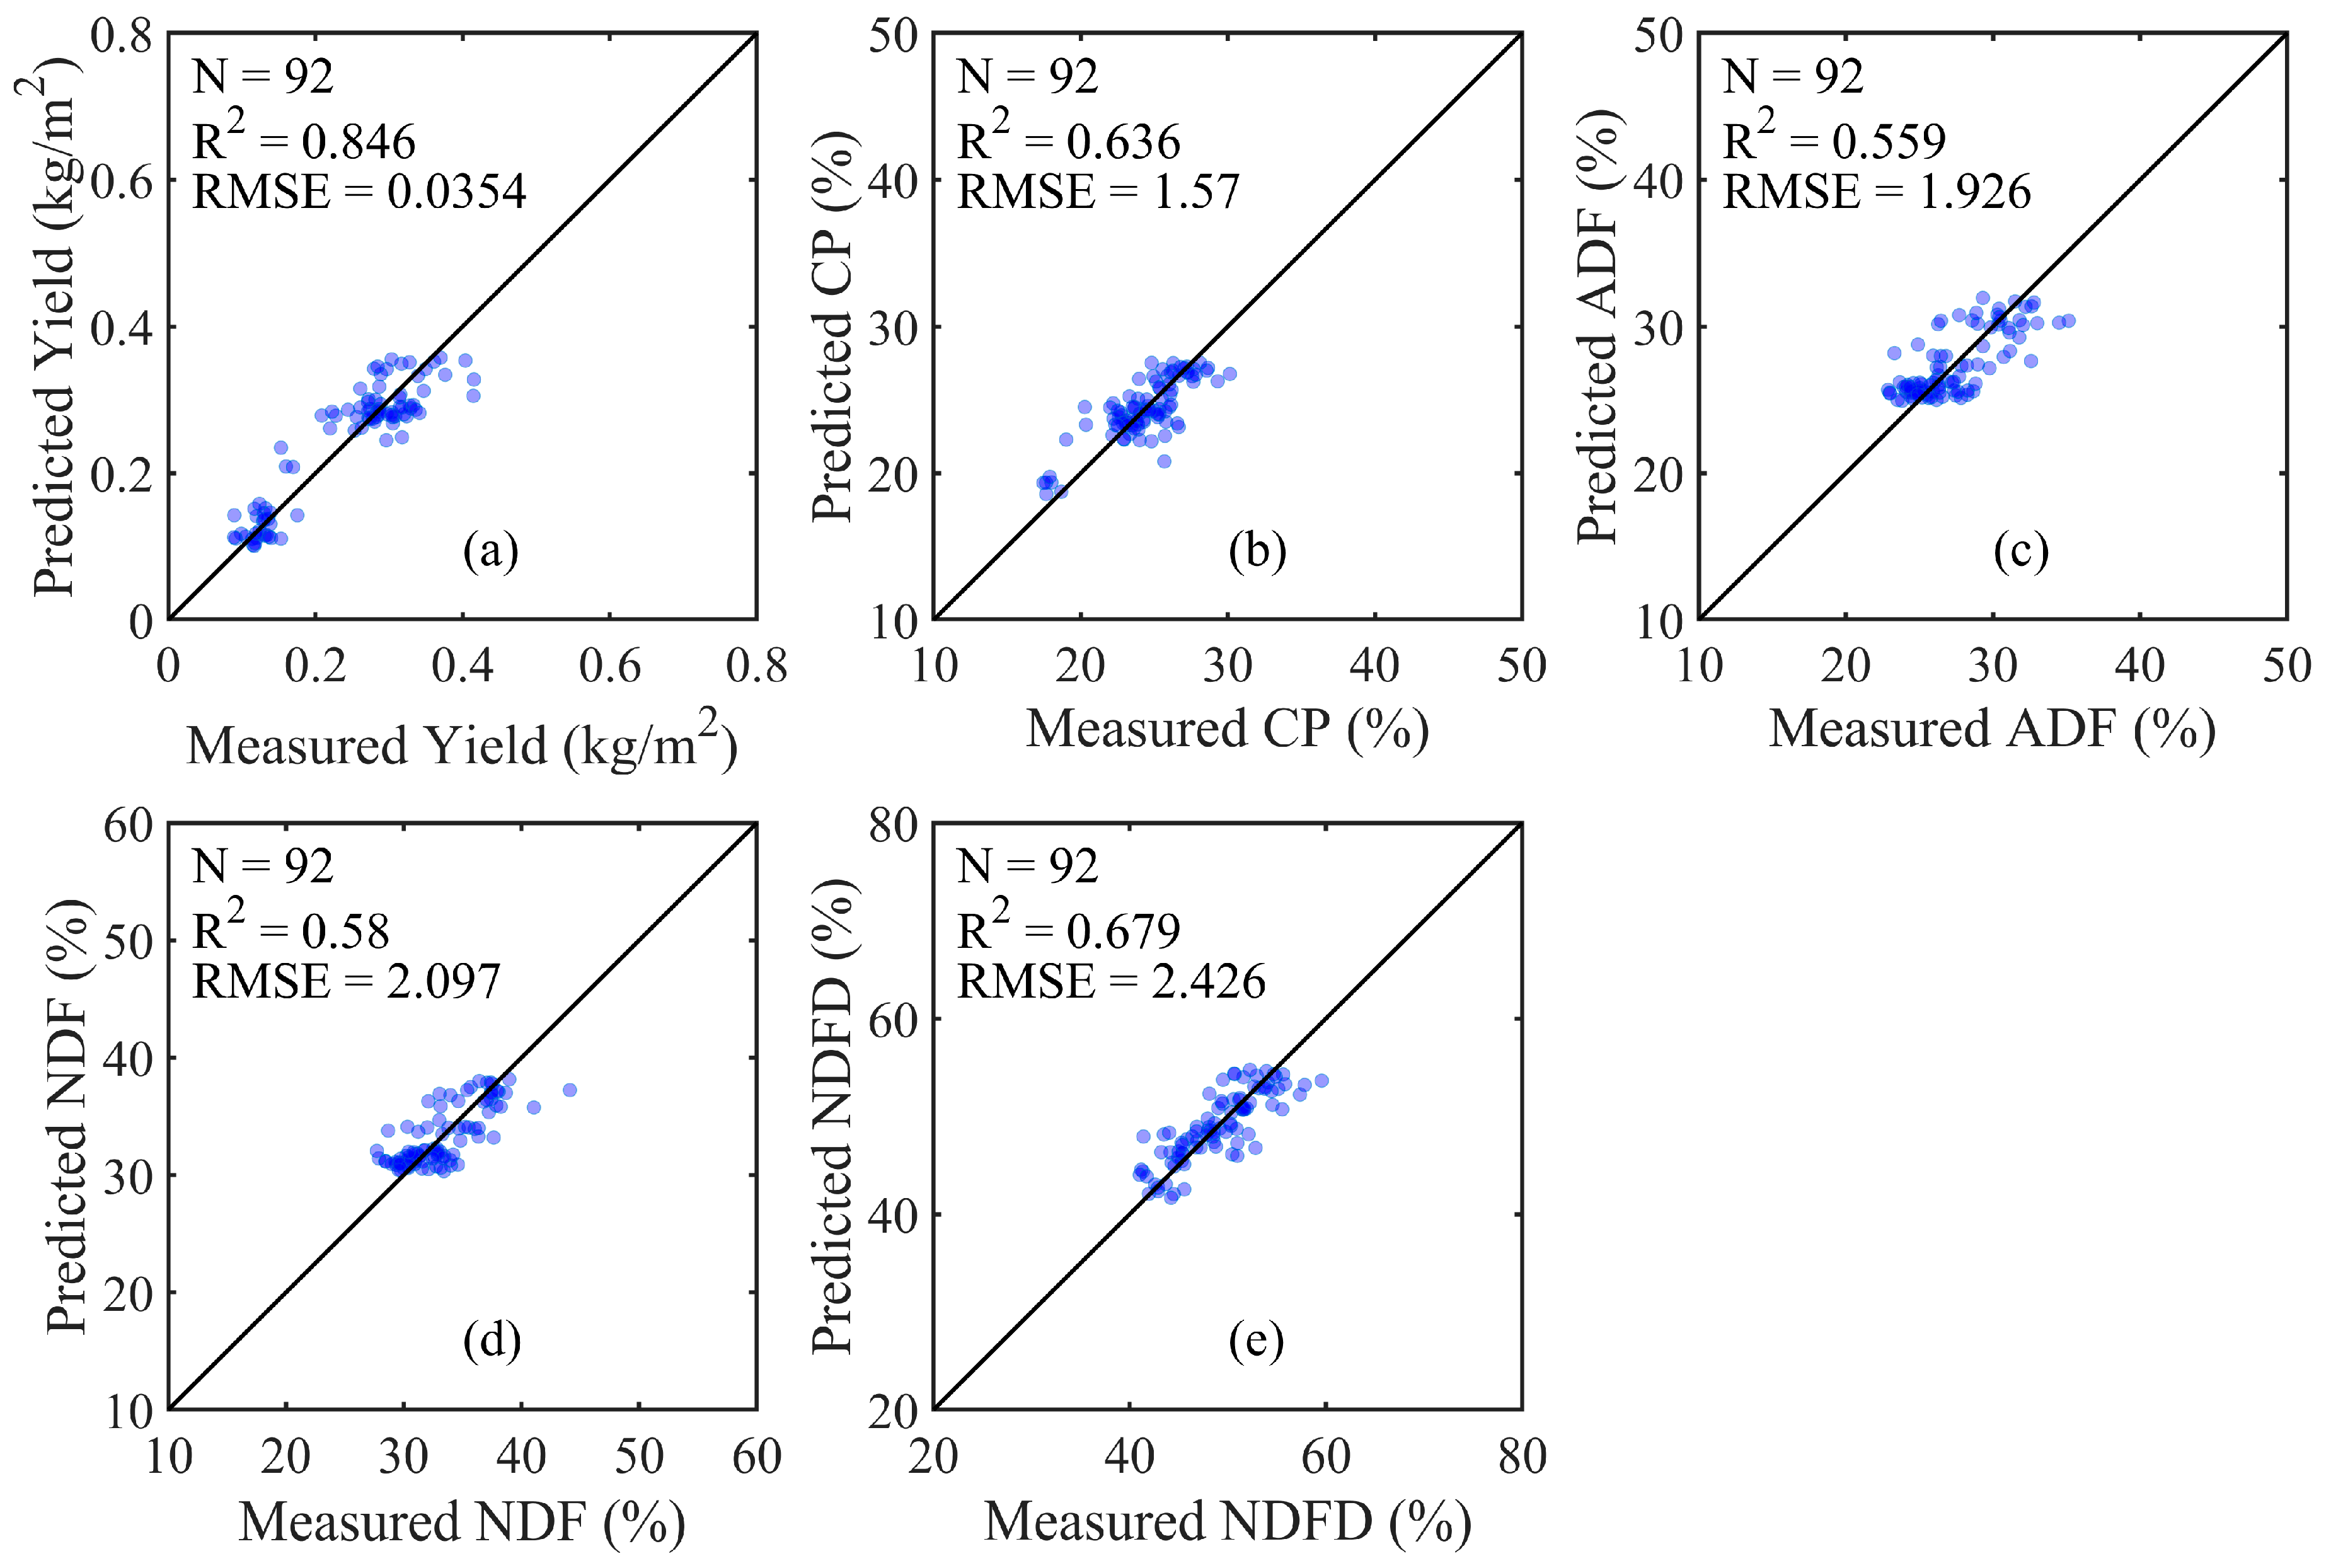
3.5. Optimal Integration of Optical and SAR Data

Table 6 shows the comparison of alfalfa yield and quality trait predictions using optical, SAR, and integrated satellite data. The traditional embedded integration approach was usually used. When optical and SAR satellite data were embedded in the same prediction model, alfalfa yield was predicted with R2 = 0.839 and RMSE = 0.0365 kg/m2, and these values were 0.621 and 1.610% for CP, 0.558 and 1.928% for ADF, 0.572 and 2.118% for NDF, and 0.685 and 2.477% for NDFD, respectively. Results indicated that the model developed using integrated optical and SAR data with the embedded approach had improved accuracy for predicting alfalfa parameters compared with single optical or SAR data. On the other hand, the proposed multiple linear integration approach performed better than the embedded method (Table 6). Figure 8 shows the scatterplots between measured and predicted alfalfa yield and quality traits using integrated optical and SAR data with multiple linear approach. Compared to Figure 6, it was observed that samples were closer to the 1:1 in Figure 8, and integration model with multiple linear approach had reduced prediction error. The embedded integration approach was usually employed to combine optical and SAR data for monitoring vegetation together [35]. This study suggests that the proposed multiple linear integration approach is a better means to optimally combine multisource heterogeneous satellite data.

4. Conclusions

This study developed and compared optical- and SAR-based models to predict alfalfa yield and quality traits, wherein some key issues were investigated. For the optical-based model, a unified hybrid LAI retrieval scheme was first proposed with the assistance of the PROSAIL radiative transfer model. The unified hybrid model showed reasonable accuracy for retrieving LAI with an RMSE of 0.572 m2/m2. The unified LAI retrieval scheme can be used to any desired optical satellite given the SRFs, called a scalable satellite-based LAI retrieval framework. LAI had the highest correlation coefficient (r = 0.701) with alfalfa yield compared to eight VIs followed by NDWI (r = 0.669). It indicates LAI was a more efficient and physical satellite proxy to alfalfa yield due to vegetation structure characteristics. As to quality traits, chlorophyll indices GNDVI and GCI had higher correlation coefficients followed by LAI. LAI did not show the additional contribution to improve alfalfa prediction accuracy in the optical-based model. This is mainly since the role of LAI has been fully explained (R2 = 0.956; RMSE = 0.42 m2/m2) in the RF-developed alfalfa yield and quality trait prediction models using VIs as inputs. SAR-based model also showed reasonable accuracy for predicting alfalfa parameters. For model comparisons, optical-based model performed better than SAR-based models for predicting alfalfa yield, CP, and NDFD, because the yield/CP prediction error from the SAR-based model was significantly correlated with alfalfa greenness and water stress. By contrast, the SAR-based model had higher accuracy for predicting ADF and NDF.
Furthermore, the model developed by the integration of optical and SAR data showed improved accuracy than models from single optical or SAR data. On the other hand, this study proposed that multiple linear regression resulted in higher performance than the traditional embedded approach for the optimal integration of multisource heterogeneous satellites. We found that there may be a linear and inherent relationship between alfalfa yield and LAI. Thus, it may be possible in the future to predict large-scale alfalfa yield with limited field samples by the assimilation of scalable satellite-based LAI retrieval and a crop growth model (e.g., APSIM). Although we focused on alfalfa monitoring using multisource heterogeneous satellites, the findings of this study may be suitable to other forage crops.

Author Contributions

Conceptualization, J.C. and Z.Z.; methodology, J.C. and Z.Z.; validation, J.C.; formal analysis, J.C.; investigation, T.Y.; resources, Z.Z.; data curation, T.Y. and J.H.C.; writing—original draft preparation, J.C.; writing—review and editing, T.Y., J.H.C. and Z.Z.; visualization, J.C.; supervision, Z.Z.; project administration, Z.Z.; funding acquisition, Z.Z. All authors have read and agreed to the published version of the manuscript.

Funding

This work was supported by the United States Department of Agriculture (USDA) National Institute of Food and Agriculture (NIFA), Alfalfa and Forage Program under Grant 1027160; the USDA NIFA grant #1028199; and the USDA Hatch project #7002632.

Data Availability Statement

Dataset available on request from the authors.

Acknowledgments

We would like to thank NASA for freely providing Sentinel-2 HLS product. We also thank the GEE platform for distributing Seninel-1 GRD data.

Conflicts of Interest

The authors declare no conflicts of interest.

References

  1. Suweis, S.; Carr, J.A.; Maritan, A.; Rinaldo, A.; D’Odorico, P. Resilience and reactivity of global food security. Proc. Natl. Acad. Sci. USA 2015, 112, 6902–6907. [Google Scholar] [CrossRef]
  2. Wu, W.; Yu, Q.; You, L.; Chen, K.; Tang, H.; Liu, J. Global cropping intensity gaps: Increasing food production without cropland expansion. Land Use Policy 2018, 76, 515–525. [Google Scholar] [CrossRef]
  3. Fujimori, S.; Hasegawa, T.; Krey, V.; Riahi, K.; Bertram, C.; Bodirsky, B.L.; Bosetti, V.; Callen, J.; Després, J.; Doelman, J.; et al. A multi-model assessment of food security implications of climate change mitigation. Nat. Sustain. 2019, 2, 386–396. [Google Scholar] [CrossRef]
  4. World Health Organization. The State of Food Security and Nutrition in the World 2021: Transforming Food Systems for Food Security, Improved Nutrition and Affordable Healthy Diets for All; Food & Agriculture Org.: Rome, Italy, 2021; Volume 2021. [Google Scholar]
  5. Pradhan, P.; Costa, L.; Rybski, D.; Lucht, W.; Kropp, J.P. A Systematic Study of Sustainable Development Goal (SDG) Interactions. Earth’s Future 2017, 5, 1169–1179. [Google Scholar] [CrossRef]
  6. Karthikeyan, L.; Chawla, I.; Mishra, A.K. A review of remote sensing applications in agriculture for food security: Crop growth and yield, irrigation, and crop losses. J. Hydrol. 2020, 586, 124905. [Google Scholar] [CrossRef]
  7. Soriano-González, J.; Angelats, E.; Martínez-Eixarch, M.; Alcaraz, C. Monitoring rice crop and yield estimation with Sentinel-2 data. Field Crops Res. 2022, 281, 108507. [Google Scholar] [CrossRef]
  8. Tanabe, R.; Matsui, T.; Tanaka, T.S.T. Winter wheat yield prediction using convolutional neural networks and UAV-based multispectral imagery. Field Crops Res. 2023, 291, 108786. [Google Scholar] [CrossRef]
  9. Tedesco, D.; de Oliveira, M.F.; dos Santos, A.F.; Costa Silva, E.H.; de Souza Rolim, G.; da Silva, R.P. Use of remote sensing to characterize the phenological development and to predict sweet potato yield in two growing seasons. Eur. J. Agron. 2021, 129, 126337. [Google Scholar] [CrossRef]
  10. Marzougui, A.; McGee, R.J.; Van Vleet, S.; Sankaran, S. Remote sensing for field pea yield estimation: A study of multi-scale data fusion approaches in phenomics. Front. Plant Sci. 2023, 14, 1111575. [Google Scholar] [CrossRef] [PubMed]
  11. Pintens, D.A.; Shinners, K.J.; Friede, J.C.; Kalscheur, K.F.; Digman, M.F.; Combs, D.K. Intensive mechanical processing of forage crops to improve fibre digestion. Grass Forage Sci. 2022, 77, 55–65. [Google Scholar] [CrossRef]
  12. Suwignyo, B.; Aristia Rini, E.; Helmiyati, S. The profile of tropical alfalfa in Indonesia: A review. Saudi J. Biol. Sci. 2023, 30, 103504. [Google Scholar] [CrossRef]
  13. Azadbakht, M.; Ashourloo, D.; Aghighi, H.; Homayouni, S.; Shahrabi, H.S.; Matkan, A.; Radiom, S. Alfalfa yield estimation based on time series of Landsat 8 and PROBA-V images: An investigation of machine learning techniques and spectral-temporal features. Remote Sens. Appl. Soc. Environ. 2022, 25, 100657. [Google Scholar] [CrossRef]
  14. Kayad, A.G.; Al-Gaadi, K.A.; Tola, E.; Madugundu, R.; Zeyada, A.M.; Kalaitzidis, C. Assessing the Spatial Variability of Alfalfa Yield Using Satellite Imagery and Ground-Based Data. PLoS ONE 2016, 11, e0157166. [Google Scholar] [CrossRef]
  15. Kang, Y.; Ozdogan, M.; Zhu, X.; Ye, Z.; Hain, C.; Anderson, M. Comparative assessment of environmental variables and machine learning algorithms for maize yield prediction in the US Midwest. Environ. Res. Lett. 2020, 15, 064005. [Google Scholar] [CrossRef]
  16. Barriguinha, A.; Jardim, B.; de Castro Neto, M.; Gil, A. Using NDVI, climate data and machine learning to estimate yield in the Douro wine region. Int. J. Appl. Earth Obs. Geoinf. 2022, 114, 103069. [Google Scholar] [CrossRef]
  17. Chen, J.; Zhu, W.N. Comparing Landsat-8 and Sentinel-2 top of atmosphere and surface reflectance in high latitude regions: Case study in Alaska. Geocarto Int. 2022, 37, 6052–6071. [Google Scholar] [CrossRef]
  18. Chen, J.M.; Liu, J.; Leblanc, S.G.; Lacaze, R.; Roujean, J.-L. Multi-angular optical remote sensing for assessing vegetation structure and carbon absorption. Remote Sens. Environ. 2003, 84, 516–525. [Google Scholar] [CrossRef]
  19. Fang, H.L.; Baret, F.; Plummer, S.; Schaepman-Strub, G. An Overview of Global Leaf Area Index (LAI): Methods, Products, Validation, and Applications. Rev. Geophys. 2019, 57, 739–799. [Google Scholar] [CrossRef]
  20. Zeng, L.; Peng, G.; Meng, R.; Man, J.; Li, W.; Xu, B.; Lv, Z.; Sun, R. Wheat Yield Prediction Based on Unmanned Aerial Vehicles-Collected Red–Green–Blue Imagery. Remote Sens. 2021, 13, 2937. [Google Scholar] [CrossRef]
  21. Ziliani, M.G.; Altaf, M.U.; Aragon, B.; Houborg, R.; Franz, T.E.; Lu, Y.; Sheffield, J.; Hoteit, I.; McCabe, M.F. Early season prediction of within-field crop yield variability by assimilating CubeSat data into a crop model. Agric. For. Meteorol. 2022, 313, 108736. [Google Scholar] [CrossRef]
  22. Kayad, A.; Rodrigues, F.A., Jr.; Naranjo, S.; Sozzi, M.; Pirotti, F.; Marinello, F.; Schulthess, U.; Defourny, P.; Gerard, B.; Weiss, M. Radiative transfer model inversion using high-resolution hyperspectral airborne imagery—Retrieving maize LAI to access biomass and grain yield. Field Crops Res. 2022, 282, 108449. [Google Scholar] [CrossRef] [PubMed]
  23. Liu, M.; Wang, Z.; Mu, L.; Xu, R.; Yang, H. Effect of regulated deficit irrigation on alfalfa performance under two irrigation systems in the inland arid area of midwestern China. Agric. Water Manag. 2021, 248, 106764. [Google Scholar] [CrossRef]
  24. Liu, C.-a.; Chen, Z.-x.; Shao, Y.; Chen, J.-s.; Hasi, T.; Pan, H.-z. Research advances of SAR remote sensing for agriculture applications: A review. J. Integr. Agric. 2019, 18, 506–525. [Google Scholar] [CrossRef]
  25. Chen, J.; Zhang, Z. An improved fusion of Landsat-7/8, Sentinel-2, and Sentinel-1 data for monitoring alfalfa: Implications for crop remote sensing. Int. J. Appl. Earth Obs. Geoinf. 2023, 124, 103533. [Google Scholar] [CrossRef]
  26. Wiseman, G.; McNairn, H.; Homayouni, S.; Shang, J. RADARSAT-2 Polarimetric SAR Response to Crop Biomass for Agricultural Production Monitoring. IEEE J. Sel. Top. Appl. Earth Obs. Remote Sens. 2014, 7, 4461–4471. [Google Scholar] [CrossRef]
  27. Kumar, P.; Prasad, R.; Gupta, D.K.; Mishra, V.N.; Vishwakarma, A.K.; Yadav, V.P.; Bala, R.; Choudhary, A.; Avtar, R. Estimation of winter wheat crop growth parameters using time series Sentinel-1A SAR data. Geocarto Int. 2017, 33, 942–956. [Google Scholar] [CrossRef]
  28. Mandal, D.; Hosseini, M.; McNairn, H.; Kumar, V.; Bhattacharya, A.; Rao, Y.S.; Mitchell, S.; Robertson, L.D.; Davidson, A.; Dabrowska-Zielinska, K. An investigation of inversion methodologies to retrieve the leaf area index of corn from C-band SAR data. Int. J. Appl. Earth Obs. Geoinf. 2019, 82, 101893. [Google Scholar] [CrossRef]
  29. Attema, E.; Ulaby, F.T. Vegetation modeled as a water cloud. Radio Sci. 1978, 13, 357–364. [Google Scholar] [CrossRef]
  30. Kaplan, G.; Fine, L.; Lukyanov, V.; Malachy, N.; Tanny, J.; Rozenstein, O. Using Sentinel-1 and Sentinel-2 imagery for estimating cotton crop coefficient, height, and Leaf Area Index. Agric. Water Manag. 2023, 276, 108056. [Google Scholar] [CrossRef]
  31. Bhattarai, R.; Rahimzadeh-Bajgiran, P.; Weiskittel, A.; Homayouni, S.; Gara, T.W.; Hanavan, R.P. Estimating species-specific leaf area index and basal area using optical and SAR remote sensing data in Acadian mixed spruce-fir forests, USA. Int. J. Appl. Earth Obs. Geoinf. 2022, 108, 102727. [Google Scholar] [CrossRef]
  32. Ranjan, A.K.; Parida, B.R. Predicting paddy yield at spatial scale using optical and Synthetic Aperture Radar (SAR) based satellite data in conjunction with field-based Crop Cutting Experiment (CCE) data. Int. J. Remote Sens. 2020, 42, 2046–2071. [Google Scholar] [CrossRef]
  33. Beeri, O.; Netzer, Y.; Munitz, S.; Mintz, D.F.; Pelta, R.; Shilo, T.; Horesh, A.; Mey-tal, S. Kc and LAI Estimations Using Optical and SAR Remote Sensing Imagery for Vineyards Plots. Remote Sens. 2020, 12, 3478. [Google Scholar] [CrossRef]
  34. Baumann, M.; Levers, C.; Macchi, L.; Bluhm, H.; Waske, B.; Gasparri, N.I.; Kuemmerle, T. Mapping continuous fields of tree and shrub cover across the Gran Chaco using Landsat 8 and Sentinel-1 data. Remote Sens. Environ. 2018, 216, 201–211. [Google Scholar] [CrossRef]
  35. Guerra-Hernández, J.; Narine, L.L.; Pascual, A.; Gonzalez-Ferreiro, E.; Botequim, B.; Malambo, L.; Neuenschwander, A.; Popescu, S.C.; Godinho, S. Aboveground biomass mapping by integrating ICESat-2, SENTINEL-1, SENTINEL-2, ALOS2/PALSAR2, and topographic information in Mediterranean forests. GIScience Remote Sens. 2022, 59, 1509–1533. [Google Scholar] [CrossRef]
  36. NASS. State Agriculture Overview—New York. 2022. Available online: https://www.nass.usda.gov/Quick_Stats/Ag_Overview/stateOverview.php?state=NEW%20YORK (accessed on 16 February 2024).
  37. Crabbe, R.A.; Lamb, D.W.; Edwards, C.; Andersson, K.; Schneider, D. A Preliminary Investigation of the Potential of Sentinel-1 Radar to Estimate Pasture Biomass in a Grazed, Native Pasture Landscape. Remote Sens. 2019, 11, 872. [Google Scholar] [CrossRef]
  38. Veloso, A.; Mermoz, S.; Bouvet, A.; Le Toan, T.; Planells, M.; Dejoux, J.-F.; Ceschia, E. Understanding the temporal behavior of crops using Sentinel-1 and Sentinel-2-like data for agricultural applications. Remote Sens. Environ. 2017, 199, 415–426. [Google Scholar] [CrossRef]
  39. Tazmul Islam, M.; Meng, Q. An exploratory study of Sentinel-1 SAR for rapid urban flood mapping on Google Earth Engine. Int. J. Appl. Earth Obs. Geoinf. 2022, 113, 103002. [Google Scholar] [CrossRef]
  40. dos Santos, E.P.; da Silva, D.D.; do Amaral, C.H.; Fernandes-Filho, E.I.; Dias, R.L.S. A Machine Learning approach to reconstruct cloudy affected vegetation indices imagery via data fusion from Sentinel-1 and Landsat 8. Comput. Electron. Agric. 2022, 194, 106753. [Google Scholar] [CrossRef]
  41. Schaaf, C.; Wang, Z. MCD43A4 MODIS/Terra+ Aqua BRDF/Albedo Nadir BRDF Adjusted RefDaily L3 Global 500 m V006. NASA EOSDIS Land Processes DAAC. 2015. Available online: https://lpdaac.usgs.gov/products/mcd43a4v006/ (accessed on 31 July 2023).
  42. Jacquemoud, S.; Baret, F. PROSPECT: A model of leaf optical properties spectra. Remote Sens. Environ. 1990, 34, 75–91. [Google Scholar] [CrossRef]
  43. Verhoef, W. Light scattering by leaf layers with application to canopy reflectance modeling: The SAIL model. Remote Sens. Environ. 1984, 16, 125–141. [Google Scholar] [CrossRef]
  44. Sun, B.; Wang, C.F.; Yang, C.H.; Xu, B.D.; Zhou, G.S.; Li, X.Y.; Xie, J.; Xu, S.J.; Liu, B.; Xie, T.J.; et al. Retrieval of rapeseed leaf area index using the PROSAIL model with canopy coverage derived from UAV images as a correction parameter. Int. J. Appl. Earth Obs. Geoinf. 2021, 102, 102373. [Google Scholar] [CrossRef]
  45. Ying, W.; Wu, H.; Li, Z.-L. Net Surface Shortwave Radiation Retrieval Using Random Forest Method With MODIS/AQUA Data. IEEE J. Sel. Top. Appl. Earth Obs. Remote Sens. 2019, 12, 2252–2259. [Google Scholar] [CrossRef]
  46. Dang, A.T.N.; Nandy, S.; Srinet, R.; Luong, N.V.; Ghosh, S.; Senthil Kumar, A. Forest aboveground biomass estimation using machine learning regression algorithm in Yok Don National Park, Vietnam. Ecol. Inform. 2019, 50, 24–32. [Google Scholar] [CrossRef]
  47. Chen, J.; Zhu, W.N.; Pang, S.N.; Cheng, Q. Applicability evaluation of Landsat-8 for estimating low concentration colored dissolved organic matter in inland water. Geocarto Int. 2022, 37, 1–15. [Google Scholar] [CrossRef]
  48. Chen, J.; Zhu, W.-N.; Tian, Y.Q.; Yu, Q. Estimation of Colored Dissolved Organic Matter From Landsat-8 Imagery for Complex Inland Water: Case Study of Lake Huron. IEEE Trans. Geosci. Remote Sens. 2017, 55, 2201–2212. [Google Scholar] [CrossRef]
  49. Wolanin, A.; Mateo-García, G.; Camps-Valls, G.; Gómez-Chova, L.; Meroni, M.; Duveiller, G.; Liangzhi, Y.; Guanter, L. Estimating and understanding crop yields with explainable deep learning in the Indian Wheat Belt. Environ. Res. Lett. 2020, 15, 024019. [Google Scholar] [CrossRef]
  50. Chen, J.; Zhu, W.N.; Tian, Y.Q.; Yu, Q.; Zheng, Y.H.; Huang, L.T. Remote estimation of colored dissolved organic matter and chlorophyll-a in Lake Huron using Sentinel-2 measurements. J. Appl. Remote Sens. 2017, 11, 036007. [Google Scholar] [CrossRef]
  51. Mutanga, O.; Masenyama, A.; Sibanda, M. Spectral saturation in the remote sensing of high-density vegetation traits: A systematic review of progress, challenges, and prospects. ISPRS J. Photogramm. Remote Sens. 2023, 198, 297–309. [Google Scholar] [CrossRef]
  52. Zarco-Tejada, P.J.; Ustin, S.L.; Whiting, M.L. Temporal and Spatial Relationships between Within-Field Yield Variability in Cotton and High-Spatial Hyperspectral Remote Sensing Imagery. Agron. J. 2005, 97, 641–653. [Google Scholar] [CrossRef]
  53. Johnson, D.M. A comprehensive assessment of the correlations between field crop yields and commonly used MODIS products. Int. J. Appl. Earth Obs. Geoinf. 2016, 52, 65–81. [Google Scholar] [CrossRef]
  54. Xie, Q.Y.; Dash, A.D.; Huete, A.R.O.; Jiang, A.H.; Yin, G.F.; Ding, Y.L.; Peng, D.L.; Hall, R.O.E.; Brown, L.K.; Shi, Y.; et al. Retrieval of crop biophysical parameters from Sentinel-2 remote sensing imagery. Int. J. Appl. Earth Obs. Geoinf. 2019, 80, 187–195. [Google Scholar] [CrossRef]
  55. Kern, A.; Barcza, Z.; Marjanović, H.; Árendás, T.; Fodor, N.; Bónis, P.; Bognár, P.; Lichtenberger, J. Statistical modelling of crop yield in Central Europe using climate data and remote sensing vegetation indices. Agric. For. Meteorol. 2018, 260–261, 300–320. [Google Scholar] [CrossRef]
  56. Holzworth, D.P.; Huth, N.I.; deVoil, P.G.; Zurcher, E.J.; Herrmann, N.I.; McLean, G.; Chenu, K.; van Oosterom, E.J.; Snow, V.; Murphy, C.; et al. APSIM—Evolution towards a new generation of agricultural systems simulation. Environ. Model. Softw. 2014, 62, 327–350. [Google Scholar] [CrossRef]
  57. Zhang, Y.; Walker, J.P.; Pauwels, V.R.N. Assimilation of wheat and soil states for improved yield prediction: The APSIM-EnKF framework. Agric. Syst. 2022, 201, 103456. [Google Scholar] [CrossRef]
  58. Togliatti, K.; Hartman, T.; Walker, V.A.; Arkebauer, T.J.; Suyker, A.E.; VanLoocke, A.; Hornbuckle, B.K. Satellite L–band vegetation optical depth is directly proportional to crop water in the US Corn Belt. Remote Sens. Environ. 2019, 233, 111378. [Google Scholar] [CrossRef]
  59. Ma, C.; Li, X.; McCabe, M.F. Retrieval of High-Resolution Soil Moisture through Combination of Sentinel-1 and Sentinel-2 Data. Remote Sens. 2020, 12, 2303. [Google Scholar] [CrossRef]
  60. Zheng-Shu, Z.; Boerner, W.M.; Sato, M. Development of a ground-based polarimetric broadband SAR system for noninvasive ground-truth validation in vegetation monitoring. IEEE Trans. Geosci. Remote Sens. 2004, 42, 1803–1810. [Google Scholar] [CrossRef]
  61. Chen, J.; Zhu, W. Consistency evaluation of landsat-7 and landsat-8 for improved monitoring of colored dissolved organic matter in complex water. Geocarto Int. 2022, 37, 91–102. [Google Scholar] [CrossRef]
  62. Chen, J.; Zhu, W.; Tian, Y.Q.; Yu, Q. Monitoring dissolved organic carbon by combining Landsat-8 and Sentinel-2 satellites: Case study in Saginaw River estuary, Lake Huron. Sci. Total Environ. 2020, 718, 137374. [Google Scholar] [CrossRef] [PubMed]
  63. Ali, I.; Barrett, B.; Cawkwell, F.; Green, S.; Dwyer, E.; Neumann, M. Application of Repeat-Pass TerraSAR-X Staring Spotlight Interferometric Coherence to Monitor Pasture Biophysical Parameters: Limitations and Sensitivity Analysis. IEEE J. Sel. Top. Appl. Earth Obs. Remote Sens. 2017, 10, 3225–3231. [Google Scholar] [CrossRef]
  64. Abdikan, S.; Sekertekin, A.; Narin, O.G.; Delen, A.; Balik Sanli, F. A comparative analysis of SLR, MLR, ANN, XGBoost and CNN for crop height estimation of sunflower using Sentinel-1 and Sentinel-2. Adv. Space Res. 2023, 71, 3045–3059. [Google Scholar] [CrossRef]
Figure 1. Location of alfalfa fields and sampling sites in Wisconsin (ac) and New York (df) states in United States. Green circle points denote samples covering optical satellite data, and blue cross points indicate samples covering SAR satellite data. Alfalfa samples were collected 4–5 times per month in each field.
Remotesensing 16 00734 g001
Figure 2. (a) PROSAIL simulated canopy reflectance varying with LAI. (b) Validation of PROSAIL model retrieved LAI from MODIS data against MCD15A3H product.
Remotesensing 16 00734 g002
Figure 3. Scatterplots between alfalfa yield and (a) LAI and (bi) VIs. Note that ** denotes the significant level of p-value < 0.001, and LAI was derived using Sentinel-2 data with the unified hybrid model.
Remotesensing 16 00734 g003
Figure 4. Scatterplots between LAI and VIs. (a) NDVI. (b) EVI2. (c) NIRv. (d) NDWI. (e) GRVI. (f) GNDVI. (g) GCI. (h) SAVI. Note that ** denotes the significant level of p-value < 0.001, and LAI was derived using Sentinel-2 data with the unified hybrid model.
Remotesensing 16 00734 g004
Figure 5. Validation of LAI retrieval using optical VIs based empirical model. Reference LAI was derived using Sentinel-2 data with the unified hybrid model.
Remotesensing 16 00734 g005
Figure 6. Scatterplots of measured and predicted alfalfa (a) yield, (b) CP, (c) ADF, (d) NDF, and (e) NDFD using (1) optical- and (2) SAR-based models.
Remotesensing 16 00734 g006
Figure 7. Scatterplots between LAI/NDWI and alfalfa (a) yield, (b) CP, (c) ADF, (d) NDF, and (e) NDFD prediction error from [(1) and (3)] optical- and [(2) and (4)] SAR-based models. Note that * and ** denote the significant levels of p-value < 0.01 and 0.001, respectively.
Remotesensing 16 00734 g007
Figure 8. Scatterplots between measured and predicted alfalfa (a) yield and (be) quality traits using integrated optical and SAR data with a multiple linear approach.
Remotesensing 16 00734 g008
Table 1. Biophysical parameters setting for PROSAIL radiative transfer simulation.
SymbolParameter RangeStepUnit Number
Leaf parameters
NLeaf structure index1.5n/aunitless1
CwEquivalent water thickness0.015n/acm1
CabLeaf chlorophyll content10–10010μg/cm210
CmDry matter content0.001–0.0190.003g/cm27
Canopy parameters
ALAAverage leaf angle30–7010degree5
LAILeaf area index0.5–90.5m2/m218
HspotHot spot parameter0.1–0.50.2m/m3
ttsSolar zenith angle20–6010degree5
ttoObservation zenith angle0n/adegree1
psiRelative azimuth0n/adegree1
Table 2. Vegetation indices calculated using Sentinel-2 data for exploring their relationships with alfalfa yield and quality traits.
Full NameAcronymFormula
Normalized difference vegetation indexNDVI N I R     R e d N I R   +   R e d
2-band enhanced vegetation indexEVI2 2.5 × N I R     R e d N I R   +   2.4   ×   R e d   +   1
Near-infrared reflectance of vegetationNIRvNDVI × NIR
Normalized difference water indexNDWI N I R     S W I R N I R   +   S W I R
Green–red vegetation indexGRVI G r e e n     R e d G r e e n   +   R e d
Green normalized difference vegetation indexGNDVI N I R     G r e e n N I R   +   G r e e n
Green
chlorophyll index
GCI N I R G r e e n 1
Soil adjusted vegetation indexSAVI N I R     R e d N I R   +   R e d   +   0.5 × 1.5
Table 3. The correlation coefficients between optical derived VIs and alfalfa yield and quality traits. Note that * and ** denote the significant levels of p-value < 0.01 and 0.001, respectively.
IndexLAINDVIEVI2NIRvNDWIGRVIGNDVIGCISAVI
Data in Wisconsin (N = 133)
Yield0.804 **0.659 **0.501 **0.469 **0.790 **0.539 **0.781 **0.796 **0.513 **
CP−0.0010.1160.1210.1110.0300.334 **−0.116−0.1040.125
ADF0.508 **0.431 **0.326 **0.306 **0.514 **0.300 **0.591 **0.621 **0.332 **
NDF0.476 **0.364 **0.270 *0.253 *0.477 **0.243 *0.536 **0.575 **0.275 *
NDFD−0.292 **−0.195−0.141−0.140−0.255 *−0.027−0.403 **−0.433 **−0.138
Data in New York state (N = 178)
Yield0.662 **0.251 **0.486 **0.511 **0.654 **0.1550.411 **0.472 **0.472 **
CP−0.398 **−0.129−0.194 *−0.200 *−0.430 **0.074−0.353 **−0.370 **−0.193
ADF0.0800.0820.1020.1110.132−0.0310.1580.1530.100
NDF0.0510.0170.0050.0070.101−0.1630.1690.1550.007
NDFD−0.245 *−0.166−0.207 *−0.220 *−0.259 **−0.112−0.206 *−0.213 *−0.200*
All data (N = 311)
Yield0.701 **0.421 **0.432 **0.432 **0.669 **0.315 **0.549 **0.594 **0.429 **
CP−0.160 *0.018−0.035−0.049−0.1400.225 **−0.211 **−0.208 **−0.029
ADF0.277 **0.252 **0.1230.1110.301 **0.157 *0.349 **0.373 **0.128
NDF0.231 **0.167 *0.0900.0790.264 **0.0110.321 **0.335 **0.095
NDFD−0.275 **−0.182 *−0.192 **−0.198 **−0.266 **−0.054−0.329 **−0.345 **−0.187 **
Table 4. Comparison of alfalfa yield and quality traits prediction using optical data without and with LAI. Groups I and II mean model without and with LAI, respectively.
GroupYieldCPADFNDFNDFD
R2RMSER2RMSER2RMSER2RMSER2RMSE
I0.8050.03680.7551.4650.5942.0390.6572.5450.6362.971
II0.7890.03820.7551.4600.5982.0300.6572.5440.6322.979
Table 5. The correlation coefficients between SAR data and alfalfa yield and quality traits. Note that * and ** denote the significant levels of p-value < 0.01 and 0.001, respectively.
ParameterVVVHVH/VVRVI
Data in Wisconsin (N = 111)
Yield0.456 **0.614 **0.0140.187
CP−0.1340.118−0.1990.206
ADF0.1490.0020.131−0.112
NDF0.148−0.0740.182−0.178
NDFD−0.0970.180−0.1980.231
Data in New York (N = 70)
Yield0.085−0.1960.232−0.265
CP0.0740.273−0.1090.200
ADF−0.113−0.2510.057−0.145
NDF−0.118−0.2540.055−0.143
NDFD0.2270.323 *0.0100.115
All data (N = 181)
Yield0.199 *0.302 **0.0100.094
CP−0.1030.139−0.1890.217 *
ADF−0.093−0.139−0.017−0.042
NDF−0.055−0.1720.043−0.105
NDFD−0.0880.173−0.1900.233 *
Table 6. Comparison of alfalfa yield and quality traits prediction using optical, SAR, and integrated satellite data. Cases a and b denote prediction results from single optical and SAR data, while cases c, d, and e indicate prediction results using integrated optical and SAR data with embedded, averaged, and multiple linear approaches.
CaseYield CP ADF NDF NDFD
R2RMSER2RMSER2RMSER2RMSER2RMSE
a0.8350.03690.6061.6360.5242.0000.5312.2180.6702.514
b0.6400.05640.4702.0950.5371.9860.5682.1460.4073.388
c0.8390.03650.6211.6100.5581.9280.5722.1180.6852.477
d0.8280.04160.6361.7370.5581.9410.5762.1220.6522.786
e0.8460.03540.6361.5700.5591.9260.5802.0970.6792.426
Disclaimer/Publisher’s Note: The statements, opinions and data contained in all publications are solely those of the individual author(s) and contributor(s) and not of MDPI and/or the editor(s). MDPI and/or the editor(s) disclaim responsibility for any injury to people or property resulting from any ideas, methods, instructions or products referred to in the content.

