Abstract
The evolution of delta and riverbank erosion within the river basin can significantly impact the environment, ecosystems, and lives of those residing along rivers. The Vietnamese Mekong Delta (VMD), counted among the world’s largest deltas, has undergone significant morphological alterations via natural processes and human activities. This research aims to examine these morphological alterations and their impacts on local economic and social conditions in the VMD. This study utilized satellite data from 1988 to 2020, coupled with population density and land use/land cover (LULC) maps from 2002, 2008, and 2015. The findings reveal that the VMD experienced widespread erosion over the past three decades, covering an area of 66.8 km2 and affecting 48% of the riverbank length (682 km). In contrast to riverbanks, islets showed an accretion trend with an additional area of 13.3 km2, resulting in a decrease in river width over the years. Riverbank and islet erosion has had a profound impact on the LULC, population, and economy of the provinces along the VMD. From 2002 to 2020, eight different land use types were affected, with agricultural land being the most severely eroded, constituting over 86% of the total lost land area (3235.47 ha). The consequences of land loss due to erosion affected 31,273 people and resulted in substantial economic damages estimated at VND 19,409.90 billion (USD 799.50 million) across nine provinces along the VMD. Notably, even though built-up land represented a relatively small portion of the affected area (6.58%), it accounted for the majority of the economic damage at 70.6% (USD 564.45 million). This study underscores the crucial role of satellite imagery and GIS in monitoring long-term morphological changes and assessing their primary impacts. Such analysis is essential for formulating effective plans and strategies for the sustainable management of river environments.
1. Introduction
The morphological evolution of rivers is a natural process under the long-term impacts of fluvial flow, sediment, vegetation, and riverbed conditions [1,2]. However, human activities in the river basin, such as land-use change, dam construction, sand mining, and riverbank protection, have disrupted this natural process, leading to abnormal and extreme conditions [3,4]. This has resulted in socio-economic and environmental issues, affecting the lives of those living along rivers [5]. One of the severe consequences is land loss due to riverbank erosion, leading to infrastructure damage and financial consequences, threatening aquatic habitats, and accelerating the sedimentation process downstream [6].
The Vietnamese Mekong Delta (VMD) ranks third globally in terms of delta area [7] and second in biodiversity [8]. It ensures food security and contributes 34.6% to the GDP of Vietnam’s agricultural sector [9,10]. However, the delta is currently facing many sustainability challenges related to sediment shortages caused by upstream dam construction and unsustainable sand mining in the river [11,12,13,14]. These sediment shortages cause riverbank erosion and instability, damaging many properties and human lives. According to the Ministry of Agricultural and Rural Development, from 2010 to 2018, there were 513 positions of collapsed riverbanks with a length of 520 km in thirteen provinces. From 2018 to 2023, Dong Thap province lost a land area of 36.7 ha and had 8379 households relocated to a safe place. In An Giang, from January to August 2023, there were 70 landslides with a total length of 3391 m, affecting 95 houses [15].
Monitoring morphological changes and assessing their main impacts is essential for effectively planning and managing river environments. Remote sensing (RS) and geographical information system (GIS) technologies are currently practical tools for studying long-term morphological evolution. RS allows for the quick and objective monitoring and detection of spatial and temporal variations in floodplains and river systems, particularly in large rivers where traditional methods cannot be easily used [16,17,18]. Another advantage of RS is its easy and freely accessible data, while GIS is also a powerful tool with a user-friendly interface for analyzing river morphological changes quickly [19,20]. However, manually analyzing a sequence of long-term satellite images is time-consuming, as in previous studies [5,19,21]. The development of the Google Earth Engine (GEE) currently enables free access to and the use of satellite data on a cloud platform (particularly Landsat images) instead of manually downloading and processing each image [22,23]. Therefore, users can analyze satellite images without restrictions when accessing the platform on personal computers [24].
Previous studies have focused on understanding the morphological evolution, riverbank erosion potential, and vulnerability along the lower Mekong River. However, the studies on river channel change using remote sensing have primarily assessed the riverbank erosion rate and area over time [13,21,24,25,26] or, alternatively, conducted a comprehensive evaluation of the morphological characteristics of the VMD in a single period using field data [27]. Additionally, these studies have not yet considered the impact of water level on the acquisition date of RS images, which affects the quality of riverbank information extraction [28,29,30]. Moreover, Kim et al. [31] applied the MK-BEHI index (Bank Erosion Hazard Index) to map riverbank erosion potential in the VMD. This study considered various factors, including near-bank stress, bank geology, vegetation cover, bank construction, accretion/erosion rate, and bank load, and revealed river segments with very high potential along the Tien and Hau Rivers. Tha et al. [26] monitored riverbank erosion using satellite images and determined riverbank erosion hotspots and the exposure of population density and land use to riverbank erosion along the Mekong River in Cambodia. However, the authors only used land cover and population maps in 2010 to assess the riverbank erosion exposure for 1990–2020 and only focused on the Mekong River part of Cambodia. Recently, Anh and Thuy [32] estimated the vulnerability of riverbank erosion caused by the waves from boat traffic in the Cho Gao Canal, an inland waterway channel in VMD. The study interviewed 120 households for information on erosion damages, vulnerability, and solutions of local government for the affected households. Using the same method as Anh and Thuy [32], Tri et al. [33] assessed, for the first time, the vulnerability of local communities to riverbank erosion in the Mekong and Bassac rivers. With 218 questionnaires of households in Dong Thap and An Giang provinces, Tri et al. [33] concluded that most of the interviewed households (70%) were in the low to high vulnerability groups. Overall, the existing studies in the VMD have only focused on a few factors of riverbank erosion [13,21,24,25,26], riverbank erosion potential [31], and people’s vulnerability to riverbank erosion [32,33]. The studies did not provide a comprehensive evaluation of the long-term morphological characteristics and impact of riverbank erosion on socio-economic conditions in the VMD, which are crucial for effectively managing rivers and proposing adaptation strategies [34]. Therefore, it is necessary to study the changes in morphological parameters and their impacts over time.
This study aims to address the limitations of previous studies via the following objectives: (1) evaluate the morphological evolution of the VMD’s main rivers and distributaries (i.e., Mekong, Bassac, and Vam Nao), hereafter referred to as the VMD, from 1988 to 2020; (2) identify the economic–social exposure to the riverbank and islet erosion; and (3) evaluate the economic damage of land loss along the lower Mekong river in Vietnam. The new contributions of this study are the (1) economic damage assessment of land loss by communes of nine provinces along the VMD; (2) exposure of LULC and population density by communes to the riverbank and islet erosion; and (3) detailed assessment of river morphological developments using factors of the area, width, length of riverbank and islet erosion, and changes in river width and sinuosity. Landsat satellite images were used to assess the morphological changes in the VMD caused by natural processes and anthropogenic activities. GEE and GIS were combined to study temporal and spatial changes in important morphological parameters. The exposure to riverbank and islet erosion was quantified by integrating information on annual LULC and population density. Using the exposure maps, we identified the impacts of riverbank and islet erosion on the socio-economic condition of the inhabitants in the study area over specific periods. This study focused on types of lost land and the economic impact of land loss.
2. Study Area: VMD
The Mekong River, spanning over 4900 km, flows through five countries (China, Myanmar, Lao PDR, Thailand, and Cambodia) before entering Vietnam and flowing into the East Vietnam Sea [35]. The VMD has two main branches, namely the Mekong and Bassac Rivers, linked by the Vam Nao River (Figure 1B). Currently, the VMD has nearly 17 million inhabitants, predominantly engaged in agriculture and aquaculture [36]. This delta covers a 39,000 km2 area and contributes to 50%, 65%, and 70% of rice, aquaculture, and fruit production, respectively, in Vietnam [10].
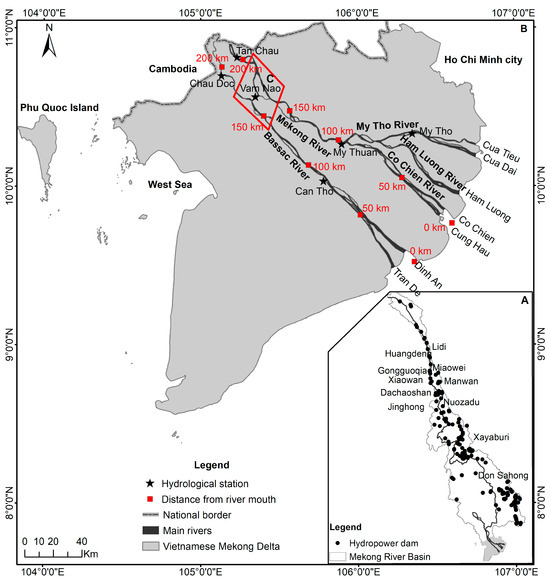
Figure 1.
(A) Mekong River basin. (B) Study area comprising the Mekong and Bassac Rivers along with their distributaries. (C) A river section for assessing the accuracy of the water classification method by Google Earth images.
The hydrological regime in the VMD changes seasonally during the dry (January–June) and flood (July–December) seasons. The average discharges during the flood and dry seasons are approximately 45,000 and 1500 m3/s, respectively [12,37]. The average annual suspended sediment load (SSL) of the VMD ranges from 40.0 to 166.7 Mt/yr [12,38,39,40], while the bed load accounts for approximately 3 Mt/yr, representing 1–3% of the total sediment load [41,42].
According to the Ministry of Agriculture and Rural Development of Vietnam, there were about 621 eroded sites along the Mekong and Bassac rivers with a total length of 610 km [43]. From January to July 2020, 28 riverbank locations in Can Tho city were recorded, leading to 76 collapsed houses and an estimated loss exceeding VND 16 billion [44]. From 2010 to 2022, Tra Vinh province experienced 222 sites of riverbank erosion, covering a total length of 75.6km. This resulted in the subsidence of 21,534 m of embankments, damage to 9940 ha of crops, fruit trees, and rice, 18 hectares of shrimp ponds, 29 hectares of forests and production land, and 171 affected houses [15].
3. Data and Methods
The workflow of this study is illustrated in Figure 2, demonstrating the integration of data from Landsat, Google Earth, and maps of population and LULC to achieve the study’s objectives. First, GEE, the FluvialCorridor V01 toolbox [45], and other tools in ArcGIS were used to detect riverbank and islet lines from satellite images and analyze the morphological changes in the VMD, respectively. Second, the socio-economic exposure to riverbank and islet erosion was assessed using population density and LULC maps, identifying the number of people and specific land use classes affected by erosion. Finally, economic damages resulting from land loss were calculated by combining the prices of land use types.
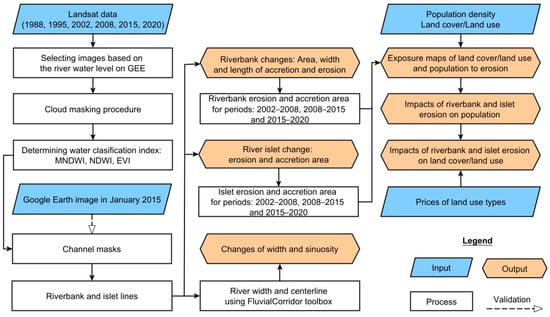
Figure 2.
Schematic of morphological change analysis and evaluation of impacts of riverbank and islet erosion on LULC and population using multiple data sources.
3.1. Data
3.1.1. Multi-Temporal Satellite Imagery Dataset
Multi-temporal Landsat images in the VMD in 1988, 1995, 2002, 2008, 2015, and 2020 were employed to analyze the morphological changes resulting from natural processes and anthropogenic activities (dams and sand mining) (Table 1). The analysis periods were selected based on the initiation of the dam operation (Manwan in 1995; Daochaoshan in 2001; Xiaowan and Jinghong in 2008; Nuozhadu and Gongguoqiao in 2011; and Xayaburi and Don Sahong in 2020) [12,21] and the sand mining periods for socio-economic development according to the Vietnamese government’s development policies for the VMD in 2003, 2008, 2009, 2012, and 2017 [10].

Table 1.
Satellite images used in the study.
To ensure the quality of the analysis results, this study used the Landsat Level-2 surface reflectance images that are already atmospherically corrected. In addition, considering that the river water level on the acquisition date of RS images greatly affects riverbank information extraction [28,29,30,46,47], two methods were applied to reduce its influence. First, only satellite images in the dry season from January to June were used due to the consistent river water levels during this period [48]. Moreover, there is a high chance of obtaining cloud-free images during this season. Second, the daily water level variability among the selected periods at the Tan Chau station on the Mekong River and the Chau Doc station on the Bassac River was ≤0.5 m [48] (Table 1). Water level data observed at stations used the national datum of Vietnam at Hon Dau, Hai Phong.
3.1.2. Population Density
The annual population count maps utilized in this study for the years 2002, 2008, and 2015 were obtained from LandScan Global, which was developed by Bright et al. [49,50,51]. These data are currently accessible from 2000 to 2022, so this study selected data for 2002, 2008, and 2015, aligning with the three analysis periods of 2002–2008, 2008–2015, and 2015–2020. LandScan Global was developed by combining innovative methods, including geospatial science, remote sensing, and machine learning. This dataset results from the integration of multiple data sources, including Census data, roads, slope NIMA’s DTED, Global Land Cover database, VMap, satellite imagery, night-time light, and regional statistics. These maps show the 24 h average ambient global population data with the highest available resolution of 1 km.
3.1.3. Land Use and Land Cover
The annual LULC maps with a 30 m spatial resolution for the years 2002, 2008, and 2015 were developed by Duong et al. [52]. These maps were created using a random-forest-based algorithm and multiple data sources, including Landsat and Sentinel-1 and -2 imagery and field and visual interpretation data. The LULC classification for the Vietnamese Mekong Delta has ten different classes, including built-up land, rice paddies, woody crops and aquaculture, grassland/herbaceous vegetation, barren land and scrub/shrub, deciduous broadleaf forest, and mangrove.
3.2. Water Classification Method and Accuracy Assessment
3.2.1. Water Classification
Currently, some popular methods are available for discriminating water bodies from other ground objects. However, to better delineate water bodies from satellite images, this study applied the spectral-based classification method of Zou et al. [53], combining three indices instead of using a single index. The classification method was applied across the contiguous USA with 97% accuracy and demonstrated good performance by Boothroyd et al. [54]. The thresholds for distinguishing water and vegetation were established at an NDVI of 0.2 [54] and an MNDWI of 0 [48]. The MNDWI was utilized for water detection, and the NDVI was employed to recognize vegetation in the detected water area. By integrating these two indices, pixels exhibiting a stronger water signal than vegetation were categorized as open-surface water bodies. To further mitigate vegetation noise, the criterion EVI < 0.1 was applied to eliminate mixed pixels of water and vegetation. Consequently, only pixels meeting the conditions (MNDWI > NDVI) and (EVI < 0.1) were identified as open-surface water body pixels, while the remaining pixels were classified as non-water pixels [53].
The formula of these indices is expressed as follows:
where Gr and MIR are the reflectances in the green and mid-infrared bands of the Landsat images, respectively.
where Gr and NIR are the reflectances in the green and near-infrared bands of the Landsat images, respectively.
where R, B, and NIR are the reflectances in the red, blue, and near-infrared bands of Landsat images, respectively; L is the soil-adjustment parameter; and C1 and C2 are atmospheric adjustment coefficients with values of the blue band (B). Generally, G = 2.5, C1 = 6.0, C2 = 7.5, and L = 1.
The Landsat images were processed using GEE, which is a cloud-based platform. All geospatial datasets on GEE are freely accessible via the data catalog (https://developers.google.com/earth-engine/datasets/catalog, accessed on 15 November 2023). This study used JavaScript codes on GEE referenced by Boothroyd et al. [54] to extract the channel masks and then export them into shape files to quantify the morphological changes in ArcGIS.
3.2.2. Accuracy Assessment of Water Extraction
The 2 m resolution Google Earth images from 2 January 2015 were used to evaluate the water classification method‘s accuracy. One river section from the Mekong, Bassac, and Vam Nao Rivers was selected for validation (Figure 1C). The acquisition dates of the Google Earth and Landsat images were close, and the water level difference between the two days was ≤0.5 m to reduce errors in the evaluation results. Water classification reliability was assessed by the error matrix method using four parameters: overall accuracy (OA), Kappa, producer’s accuracy (PA), and user’s accuracy (UA) [16,24] (Table 2). This accuracy assessment was implemented using GEE.
Table 2.
An error matrix method.
The formula of these four parameters is expressed as follows:
where E = {(a1 + a2)(a1 + b1)} + {(b1 + b2)(a2 + b2)}; T = a1 + a2 + b1 + b2; with a1, a2, b1, and b2 being correctly rejected non-water pixels, undetected water pixels, incorrectly extracted water pixels, and correctly extracted water pixels, respectively.
3.3. Analysis of the Morphological Changes
Based on the channel mask outputs from GEE, the FluvialCorridor toolbox [45] and other tools in ArcGIS 10.8 were used to assess the changes in the VMD. FluvialCorridor is an open-source toolbox using the ArcPy library in Python, which is specific to the ArcGIS platform. This toolbox allows the users to comprehensively analyze and characterize the fluvial corridors [45].
To estimate the erosion and accretion area of riverbanks, the channel masks from two different years (1988 and 2020) were intersected to create a no-change area. The residual areas, obtained by comparing the 1988 and 2020 channel masks with a no-change area, represented the accretion and erosion areas, respectively. Next, the riverbank lines of 1988 and 2020 were extracted from the channel masks for the assessment of riverbank movement. A total of 1415 cross-sections at intervals of 0.5 km along the Mekong and Bassac Rivers were drawn perpendicular to the channel axis in 1988 and intersected with the left and right riverbank lines of each year at the two sites [55]. By comparing the intersection site coordinates, the accretion and erosion widths of riverbanks at the sites between 1988 and 2020 were determined (Figure 3). Furthermore, the length of riverbank erosion/accretion in 1988–2020 was calculated by dividing the erosion/accretion area by the average erosion/accretion width of all sites during the same period. The same analysis was applied to the 1988–1995, 1995–2002, 2002–2008, 2008–2015, and 2015–2020 periods.
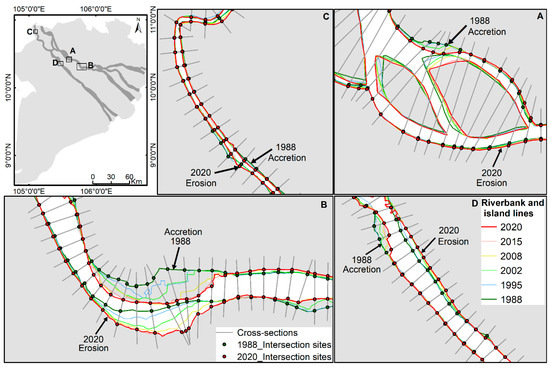
Figure 3.
Changes in riverbank and islet lines extracted from Landsat images between 1988 and 2020.
The islet erosion and accretion areas between 1988 and 2020 were determined using the same method used to determine the riverbank erosion and accretion areas. Additionally, the FluvialCorridor toolbox was used to extract river width and centerline. River width is the distance between two riverbanks at each cross-section after subtracting the islet width [5]. The sinuosity index (SI) is the ratio of the river centerline length to the meander length. The river width and SI were determined for 1988, 1995, 2002, 2008, 2015, and 2020.
3.4. Exposure of Riverbank and Islet Erosion on Population and LULC
To evaluate the erosion exposure to population and LULC for each period, this study overlapped the erosion area maps with the layers representing population density and LULC, respectively. The exposure was estimated by ArcGIS based on the administrative boundaries of communes along the VMD. Based on data availability, the study evaluated exposure to riverbank and islet erosion for three periods: 2002–2008, 2008–2015, and 2015–2020, using population and LULC data from 2002, 2008, and 2015, respectively. The erosion area map presented the area of eroded land in hectares for each period. Population distribution and land use maps were vectorized from the LandScan global and the annual LULC maps for each respective year, respectively. Furthermore, assuming that the population is equally spread over the 1 km2 area of the population map, the number of people affected by erosion for each period was determined.
3.5. Calculation of Economic Damages of Land Loss
The economic damages of land loss due to erosion were determined based on the area and price of the eroded land types, similar to the method used by Bhuiyan et al. [56]. The value of land types was the average price for that particular type, derived from Vietnam’s Decree No. 96/2019/NĐ-CP issued on 19 December 2019 on the land price framework for the Vietnamese Mekong Delta. Damage values were calculated for seven land types: built-up land, rice paddies, woody crops, aquaculture, deciduous broadleaf forest, mangrove, and grass and barren land. The land prices for built-up land and grass and barren land were calculated separately for urban and rural locations in provinces. To ensure consistency for comparison, the present price framework of land types in 2019 was used to calculate damages from land loss for all three periods (2002–2008, 2008–2015, and 2015–2020). Detailed prices for each land type are shown in Table 3.
Table 3.
Current average price of the land types over the study area.
4. Results
4.1. Validation of Riverbank Detection Result
A total of 296 points (57 non-water and 239 water points) were randomly selected from the Google Earth images for error matrix evaluation. The results showed that the water extraction method applied in this study was substantially accurate, with all four parameters exceeding 71.8% (Table 4).
Table 4.
Water classification method accuracy assessment.
4.2. Morphological Changes in the VMD over Three Decades
4.2.1. Changes in Riverbank
From 1988 to 2020, the VMD had an additional 10.3 km2 area, with 77.1 km2 of accretion and 66.8 km2 of erosion. The average accretion rates for area and width were 2.4 km2/yr and 5.2 m/yr, respectively, surpassing the average erosion rates of 2.1 km2/yr and 3.5 m/yr. Notably, riverbank erosion in length prevailed, averaging 620 km/yr (43% riverbank length). Over 32 years, the morphological changes substantially differed between the two distributaries, with the Mekong River gaining 11 km2 while the Bassac River lost 0.7 km2. Additionally, the average erosion and accretion rates of area, width, and length in the Mekong River were 1.5–3.0 times higher than those in the Bassac River (Table 5). Despite this, the Bassac River had a higher proportion of eroded riverbank length.
Table 5.
Riverbank erosion and accretion in the VMD for five study periods.
Increased erosion trends were observed in the riverbank changes over time in the Mekong and Bassac Rivers. Compared to the period 1988–1995, during 2015–2020, the erosion area and width rates increased by 38% and 22% in the Bassac River and by 53% and 46% in the Mekong River, respectively. However, using the same method, the erosion length rate in 2015–2020 increased by 9% in the Bassac and decreased by 4% in the Mekong River. Although the Mekong River exhibited higher erosion trends (area, width, and length) than the Bassac River, the eroded riverbank length percentage reversed in most periods (Figure 4). The dominant accretion area switched to the dominant erosion area in the Mekong and Bassac Rivers in 2008 and 2015, respectively (Table 5). Moreover, the erosion width rate prevailed in both rivers in 2015, while the erosion length rate prevailed in most periods except 1995–2002. Thus, these data show that the VMD shifted from accretion to erosion around 2008.
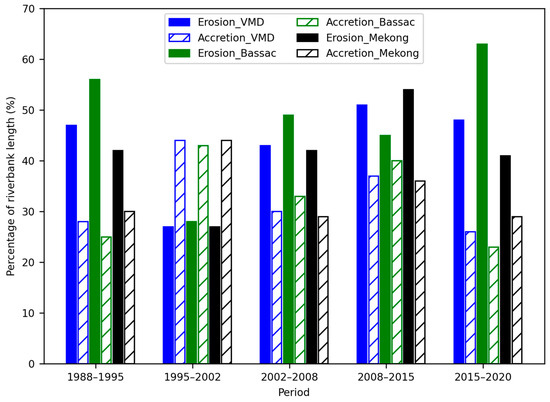
Figure 4.
Percentage of riverbank erosion and accretion length versus time.
The Mekong and Bassac Rivers experienced riverbank erosion primarily in upstream areas near the Cambodian border and the central areas, gradually stabilizing toward the estuary across the five periods (Figure 5, Figure 6 and Figure 7 and Figures S1–S4). Comparing the number of accretion and erosion sites and the average accretion and erosion width between the two banks revealed that the right banks of both rivers were more susceptible to erosion, while the left banks experienced more accretion. The erosion hotspots in the Mekong River were Tan Chau, Thuong Thoi Tien, Sa Dec, and Cao Lanh, whereas the accretion hotspots were Thuong Phuoc 2, Thanh Binh, Binh Thanh, and Sa Dec. The erosion hotspots in the Bassac River were observed in An Phu and Long Xuyen, whereas the accretion hotspots were noted in Phu Tan, Chau Doc, Cho Moi, Long Xuyen, and Can Tho.
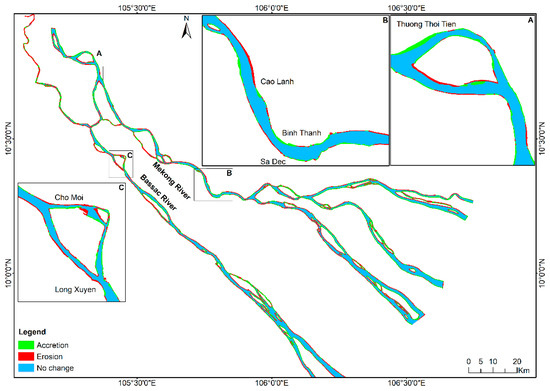
Figure 5.
Erosion and accretion map of riverbank and islets in 2015–2020.
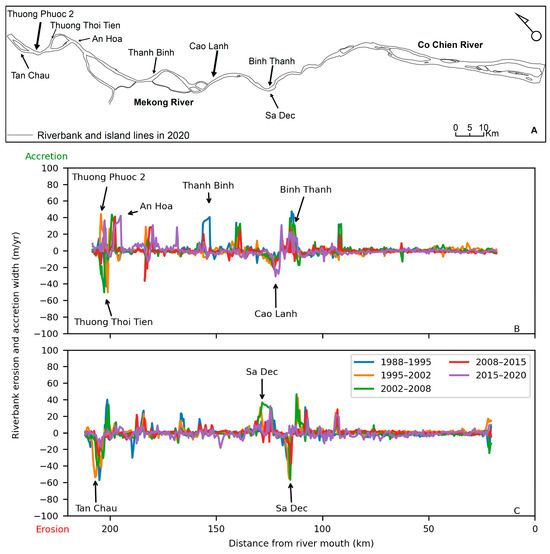
Figure 6.
Changes in erosion and accretion width along the Mekong-Co Chien-Cung Hau River between 1988 and 2020. (A) Riverbank and islet lines in 2020. (B) The left bank. (C) The right bank.
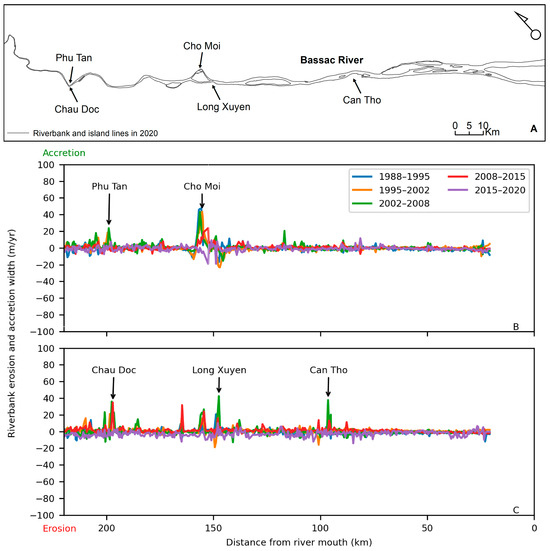
Figure 7.
Changes in erosion and accretion width along the Bassac-Dinh An River between 1988 and 2020. (A) Riverbank and islet lines in 2020. (B) The left bank. (C) The right bank.
4.2.2. Changes in the Islets
In the VMD, numerous small sandbars accreted over time and formed islets, whereas others disappeared due to the influence of the flow. The islet area expanded by 13.3 km2 between 1988 and 2020, constituting ≥33% of the total water surface area and exhibiting a 3% increase (Table S1). In all years, the islet area in the Mekong River was 3.3 times greater than that in the Bassac River. Compared to the period 1988–1995, the islet erosion rate (km2/yr) in the VMD decreased by 37–53% in 1995–2020, while the islet accretion rate increased by 12–60% during the same period, except for a 23% decrease in 2008–2015 (Figure 8).
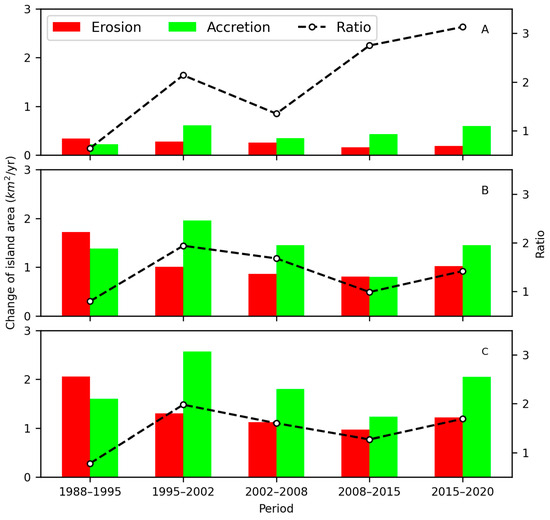
Figure 8.
Islet erosion and accretion area rate and the ratio of accretion rate to erosion rate for (A) Bassac River. (B) Mekong River. (C) VMD from 1988 to 2020.
4.2.3. Changes in River Sinuosity
Over 32 years, sinuosity in the Mekong and Bassac Rivers increased, with the Bassac River having a higher annual SI (1.22–1.23) than the Mekong River (1.15–1.17) in all years (Table S2). Apart from a meandering river section near the Cambodian border (SI = 2.13), the upstream sections of the Bassac River from the intersection with the Vam Nao River were sinuous (SI = 1.1–1.5), and the downstream section became straight toward the estuary (SI < 1.1) (Figure 9C). In the Mekong River, the SI variation was observed in three tributaries: Mekong-Co Chien-Cung Hau, Ham Luong, and My Tho-Cua Dai (Figure 9B). The Mekong-Co Chien-Cung Hau branch transitioned from sinuous (SI = 1.07–1.33) to straight (SI = 1.02–1.06) within 90 km from the river mouth, while the two remaining branches were straight in most sections with an SI < 1.1.
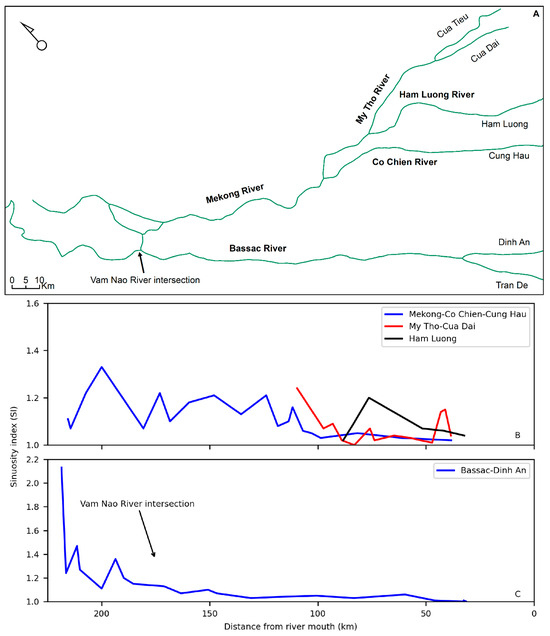
Figure 9.
(A) General map of the VMD showing branches. Changes in average sinuosity index along the (B) Mekong River. (C) Bassac-Dinh An River from 1988 to 2020.
4.2.4. Changes in RIVER width
The VMD river width ranged from 0.08 to 3.53 km, with an average of 1.29 km (Figure 10). The Mekong River, on average, was 6–9% wider than the Bassac River in all years. The VMD average width decreased from 1.31 km in 1988 to 1.28 km in 2020. The average width in 1988–2020 increased along the flow direction in the Mekong and Bassac-Dinh An Rivers. The Bassac-Dinh An River’s width increased from less than 1 km to 3.53 km downstream before reducing to 2.7 km at the river mouth (Figure 11B). Similar variational trends in average width were found in the three tributaries of the Mekong River (Figure 11A). Typically, more than 2 and 1 km wide sections in the Mekong and Bassac Rivers, respectively, have multiple channels and islets.
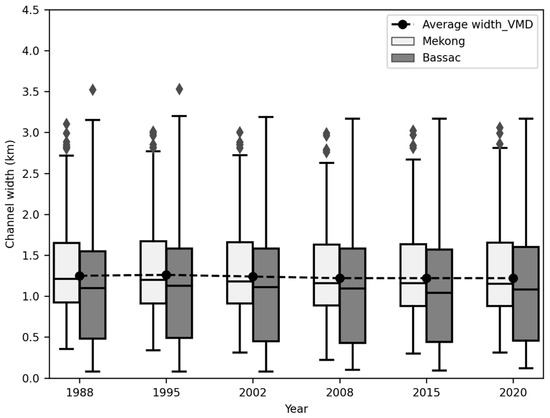
Figure 10.
Changes in river width of the VMD from 1988 to 2020.
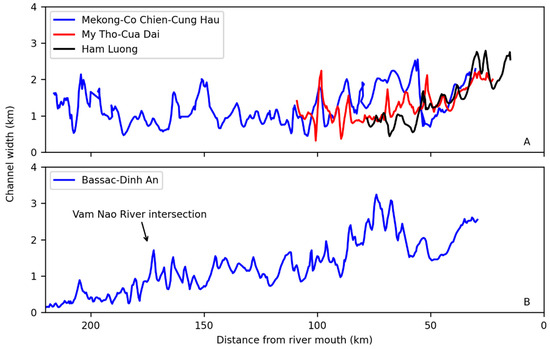
Figure 11.
Changes in average river width along the (A) Mekong River; (B) Bassac-Dinh An River during 1988–2020.
4.3. Exposures to Riverbank and Islet Erosion
4.3.1. Exposure to LULC
A total of eight land types were exposed to riverbank and islet erosion in the VMD in 2002–2020 (Figure 12 and Table 6). The agricultural land group, including rice paddies, woody crops, and aquaculture, was the most affected, accounting for over 86% of the lost land area (3235.47 ha). Built-up land followed with 6.58% (247.51 ha); the forest group, including deciduous broadleaf forest and mangrove, constituted 6.41% (241.06 ha); and the rest included grassland and barren land.
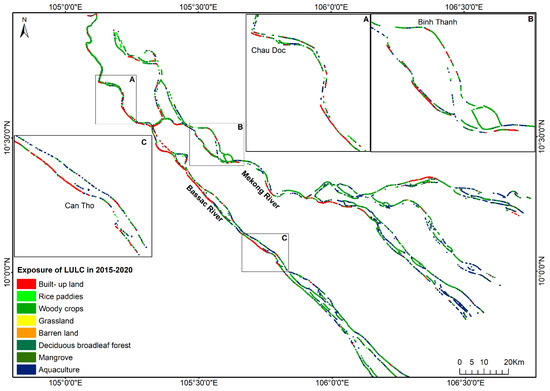
Figure 12.
Exposure of LULC to riverbank and islet erosion in the VMD in 2015–2020.
Table 6.
Land loss due to erosion.
The most affected land type in 2002–2008 and 2008–2015 was woody crops, with a proportion of 51.11% and 48.50%, respectively, while that in 2015–2020 was aquaculture, with 37.53%. Conversely, the deciduous broadleaf forest was the least affected land type in three periods, with 0.03–0.08%. The period 2002–2020 witnessed a notable increase of 3–7 times in the affected area of land types, including built-up land, aquaculture, grassland and barren land, and deciduous broadleaf forest. However, a decreasing trend, up to three times, was found in the remaining land types. The built-up land’s affected area increased the most (7 times), while the rice paddies’ affected area decreased the most between 2002 and 2020.
4.3.2. Exposure of Population
There were significant variations in population exposure to riverbank and islet erosion over three periods due to population movement and growth (Figure 13). The number of affected communes decreased from 276 in 2000–2008 to 273 and 268 in 2008–2015 and 2015–2020, respectively. From 2002 to 2020, the majority of communes affected by erosion had population densities of less than 500 people/km2 (Figure 14). However, the percentage of affected communes with this population density decreased from 69% in 2002–2008 to 45% in 2015–2020. In contrast, those with a population density of 500–1000 and 1000–1500 people/km2 increased by 22% and 4% over 18 years, respectively. These observations indicate the population’s exposure to riverbank and islet erosion gradually increases over time.
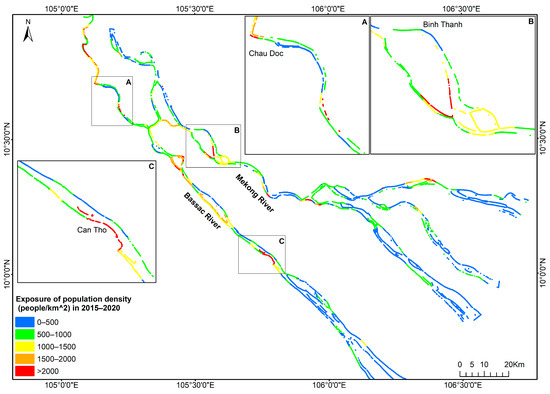
Figure 13.
Exposure of population density to riverbank and islet erosion in the VMD in 2015–2020.
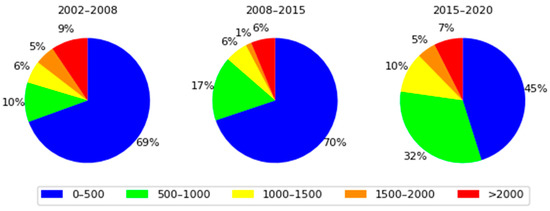
Figure 14.
Exposure levels of population density groups according to administrative boundaries of communes in 2002–2020.
The number of people affected in 2002–2008 was 11,414, with an average rate of 1902 people/yr. Compared to the period 2002–2008, the number of affected people decreased by 36.6% (7232 people) in 2008–2015 and increased by 10.6% (12,627 people) in 2015–2020. However, the annual rate of affected people sharply decreased by 45.7%, from 1902 people/yr in 2002–2008 to 1033 people/yr in 2008–2015, and increased by 32.7% (2525 people/yr) in 2015–2020 compared to 2002–2008.
4.4. Economic Damages of Land Loss
The land loss from 2002 to 2020 seriously affected local economic conditions, with a total economic damage of VND 19,409.90 billion (USD 799.50 million) (Table 7). The built-up land constituted the most economic damage, with 70.6% (USD 564.45 million), while the deciduous broadleaf forest had the least damage, with USD 0.06 million. The agricultural land group (rice paddies, woody crops, and aquaculture) contributed only 21.96% (USD 175.59 million) to the total land loss damage despite having the largest land loss area.
Table 7.
Economic damages of land loss for different land types between 2002 and 2020. Unit: USD million.
In 2002–2008, the local economy of the VMD lost VND 3873.28 billion (USD 159.54 million) due to land loss, with an annual average rate of VND 645.55 billion (USD 26.59 million). Compared to the period 2002–2008, economic losses of land decreased sharply by 32.76% of the total and 42.37% of the annual average rate in 2008–2015. In contrast, the period 2015–2020 experienced a substantial increase in land loss value, with 333.89% of the total and 400.67% of the annual average, due mainly to the loss of built-up land compared to 2002–2008.
Over 18 years, An Giang, Can Tho, Dong Thap, and Vinh Long provinces experienced land loss damage exceeding USD 100 million (Figure 15). An Giang province had the most severe economic loss, with VND 7742.3 billion (USD 318.9 million). In contrast, the Hau Giang province had the lowest economic loss, with VND 67.2 billion (USD 2.8 million). Erosion hotspots with significant land losses include Long Xuyen, Cho Moi, Chau Doc, and Tan Chau of An Giang province; Vinh Long and Mang Thit of Vinh Long province; Binh Thuy, O Mon, and Thot Not of Can Tho city; and Sa Dec, Thanh Binh, and Hong Ngu of Dong Thap province.
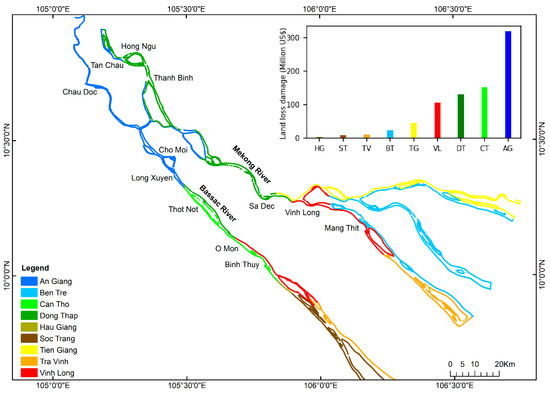
Figure 15.
Economic damages of land loss in the provinces of the VMD in 2002–2020.
5. Discussion
5.1. Morphological Evolution in the VMD
The study of morphological changes in the VMD between 1988 and 2020 showed that accretion was still higher than erosion, but due to anthropogenic activities, accretion has decreased, whereas erosion has increased over the five periods. The year 2008 was identified as the transition from dominant accretion to dominant erosion of the VMD. Our result is relatively similar to that of Li et al. [21], who found that the transition from accretion to erosion of the coastline in the VMD occurred around 2005. Both studies have made similar observations about the trend of increasing erosion, decreasing accretion, and the dominance of erosion in recent decades. Therefore, the slight difference could be attributed to the different analysis periods. The results of 48% riverbank length and 66% shoreline length [21] currently under erosion show a serious erosion situation in the VMD.
In the pre-1995 period, riverbank morphology in the VMD changed naturally because anthropogenic activities were limited. However, the erosion area, width, and length rates were relatively high during this period (2.1 km2/yr, 3.1 m/yr, and 677 km/yr, respectively). This observation is likely because the flow velocity during the flood season was substantially large, many times greater than the tolerance of the riverbank, and there was no bank protection work during this period [57,58]. Between 1995 and 2020, riverbank erosion increased unusually because of the influence of anthropogenic activities in the basin, such as dam construction [59,60], significantly increased sand mining [7,35,61,62], and the construction of protective works on the riverbanks [7]. Although the 1995–2015 period had a high erosion width, the erosion area was smaller than that in the pre-1995 period. It can be explained that the flood peak discharge during 1995–2015 decreased due to rainfall increases and the limited regulation function of relatively small dams in the Mekong River basin [36], while many bank protection works were constructed to prevent riverbank erosion, thus decreasing the riverbank erosion area due to flood impact compared to those in the pre-1995 period. However, during the dry season, dam-induced sediment supply reduction and intensive sand mining in the riverbed caused local erosion, particularly in unreinforced areas, increasing the local erosion width.
The erosion sites are mainly concentrated in the meanders, bends, and areas with large islets and sand mining activities, such as Thuong Thoi Tien, Tan Chau, Cao Lanh, Sa Dec, An Phu, and Long Xuyen (Figure 6, Figure 7 and Figures S1–S4). Our findings match the assessments by Khoi et al. [24], Hung et al. [57], and Pilarczyk [58]. Coastal areas approximately 60 km from the river mouth have an erosion width of 5–10 m/yr, with erosion sites dominating over accretion sites, resulting from a reduced sediment supply by dams and sand mining and the influence of waves and currents [21,24,63,64,65]. The erosion trend of the Mekong River is greater than that of the Bassac River, partly due to the larger river sinuosity. The Mekong River has an SI greater than 1.1 in most river sections, while the Bassac River has an SI less than 1.1, except for the upstream area of the Vam Nao diversion channel. This morphological parameter significantly influences and positively correlates with riverbank erosion (Figure S9), which means that increasing riverbank erosion is related to increasing river sinuosity [5]. The increase in the islet area decreased the annual river width between 1988 and 2020, as illustrated by the inverse correlation in Figure S10. The river width variation along the Mekong and Bassac Rivers is typical in tide-affected rivers, where it is relatively constant upstream and rapidly increases toward the sea [27]. Many other delta river systems, such as the Changjiang River delta [66] and the Fly River delta [67], show similar trends.
5.2. Causes of Riverbank Erosion in the VMD
River morphology evolves from the interaction between natural and anthropogenic factors in the river basin [30]. Flooding is a significant natural factor that changes river morphology sharply and suddenly [19,68]. This is particularly true for the VMD, located in the tropical monsoon region, where morphological processes mainly occur during the flood season. Since the shapes of the Mekong and Bassac Rivers are complicated and sinuous, with numerous distributaries and islets, the high-velocity flow upstream directly approaches the riverbanks. Simultaneously, the soft riverbank soils are washed away, resulting in weak cohesive properties that lead to erosion. These are the main causes of natural riverbank erosion in the VMD [57,58,65,69].
In addition to natural factors, anthropogenic activities significantly change the erosion and accretion processes in terms of the area, width, and length of the VMD. The optimization of operation strategies for dams and reservoirs serves only one to several stakeholder interests, but typically not the morphological issues in the basin [70]. The dams interrupt the original sediment transport of the river and retain a large amount of sand, causing hungry water downstream of the dams, eroding the riverbed [71] and riverbanks [72] to offset the sediment equilibrium [73]. In addition, dams changed the flow conditions and reduced flood levels, resulting in an adjustment of river morphology in the lower reaches [48]. A total of 143 dams in the Mekong River basin since the 1990s [21,60] reduced by 74% of the annual SSL to the delta in the post-dam period (2012–2015) (37.7 Mt/yr) [12], compared to that in the pre-dam period (144 Mt/yr) [64]. According to Binh et al. [74], the Manwan Dam has significantly reduced the sediment load to the VMD since 1993. However, the sediment load entering the delta was substantially low when the two largest dams in the Lancang cascade, Xiaowan and Nuozhadu, were operated in 2009, causing an unusual increase in erosion in the delta [74]. Our results also suggest that the change from dominant accretion to dominant erosion of the VMD occurred around the year 2008.
Sand mining in the river creates deep holes in the riverbed, which not only collapses the riverbanks at the mining site but also causes sediment imbalance, affecting the riverbank stability for kilometers upstream and downstream from the sand mining sites [75,76,77]. In the VMD, sand mining substantially increased over time, with 29.3 Mm3 (approximately 46.9 Mt) in 2018 [35], which is 3.78 times higher than that in 2012 (7.75 Mm3; approximately 12.4 Mt) [61]. Sand mining, according to Brunier et al. [7], was responsible for the loss of 200 Mm3 (approximately 320 Mt) of riverbed sand and a 1.3 m increase in bottom depth during 1988–2008. Binh et al. [74] discovered a connection between the riverbed incision in the VMD and the reduced sediment load and increased sand mining. However, according to Binh et al. [12], dams are the main cause of riverbed erosion throughout the delta, even where sand mining activity is absent. In comparison to the locations of riverbed incisions outlined in [74], it was observed that most of the riverbank erosion sites in our results were connected to the sites of riverbed incisions.
Another human factor causing erosion to worsen in the delta is waves generated by vessels during navigational activity [32]. Moreover, infrastructure projects encompassing the mass and positioning of structures along the banks of rivers and canals magnify the dangers and consequences of erosion in the VMD [78]. The interaction of these elements intensifies the incision in riverbeds and exacerbates the erosion of neighboring riverbanks, presenting substantial risks to the adjacent agricultural areas and human communities [11,75].
5.3. Exposure and Consequences of Erosion
Exposure of the study area to erosion is increasing over time due to fluctuations in land use types and population density. Due to population growth, land use tends to shift from agricultural land to built-up land, and the population density in the areas also increases rapidly. However, because the VMD is a specialized agricultural area in Vietnam, agricultural land still accounts for the majority of the current land area in the Mekong Delta. Therefore, most of the land lost to erosion between 2002 and 2020 was agricultural land. Although it only accounted for 6.58% of the total eroded land area, the built-up land had the greatest portion of the total economic damage from land loss (70.6%). This can be explained by the fact that the value of this land type is many times higher than agricultural land. Moreover, areas with significant economic damage due to land loss were also densely populated, mainly urban areas of the provinces. These areas are also consistent with the assessment of potential erosion areas by Kim et al. [31]. Due to a lack of statistical data on the economic damage of land loss, this study did not validate these results. It is worth taking the next step by conducting field surveys, as mentioned in Bhuiyan et al.’s [56] approach.
5.4. Research Limitations and Future Outlooks
The first limitation of this study was the use of Landsat images with a resolution of 30 m. With this resolution, it is impossible to accurately monitor changes in riverbank locations with less than one-pixel resolution. However, these medium-resolution satellite data are the only long-term data from the 1980s and are freely accessible; therefore, they are valuable for river morphology studies, providing an effective and low-cost long-term monitoring method for large-scale rivers. We avoided the effect of this limitation by estimating morphological changes every 5–7 years instead of every year, by which the accretion or erosion width exceeds one pixel of the Landsat imagery. In the future, high-resolution satellite images with high frequencies, such as Planet, will be used to improve accuracy. Second, to reduce the influence of the water level on erosion and accretion analysis, we used the methods presented in Section 3.1. However, because the floodplains in the VMD have a very low slope, a 0.5 m difference in water level might nevertheless create analysis errors.
Third, the annual LULC data [52] used in this study were aggregated from a set of satellite images within one year, while the results of riverbank and islet erosion areas were analyzed from the combination of two satellite images on specific dates. Therefore, due to the influence of water level on the acquisition date of RS images, there may be a difference when overlaying the two layers of LULC and erosion area to determine the exposure of LULC to erosion. As a result, the total area of LULC exposed to erosion decreased by 10–18% compared to the total calculated area of erosion, of which the reduced area is the water body. Due to the limitations of RS images and a large area like the VMD, however, the above difference is acceptable. Fourth, to simplify the damage calculation of land loss, the study used the average price of each land type under Vietnam’s Decree No. 96/2019/NĐ-CP issued on December 19th, 2019, on the land price framework for the Mekong Delta instead of using detailed land prices according to each province’s regulations. This is acceptable because access to land price information for each province is limited. Finally, although the price of land types differs among periods due to inflation and other economic factors, this study only used the present land price framework in 2019 for economic damage assessments of different periods for consistent comparison. Future research should focus on a detailed assessment of direct and indirect damage caused by erosion to the socio-economic condition and people in different periods.
6. Conclusions
The present study used remotely sensed imagery and GIS tools to estimate the morphological changes between 1988 and 2020 and determine the exposure of LULC and population to riverbank and islet erosion in the VMD. Moreover, economic losses due to erosion for communes and provinces were also established based on the area and price of the eroded land. Our results presented a comprehensive overview of the spatio-temporal morphological changes in the VMD and their socio-economic impacts.
Over the past 32 years, the VMD has experienced an increase in erosion, with 48% of the riverbank length currently under erosion. The year 2008 marked the shift from the dominant accretion to the dominant erosion of the VMD. Furthermore, a significant difference in morphological changes existed between the two main rivers of the delta, with the Mekong River showing more dynamic morphology than the Bassac River. The rates of morphological changes gradually decreased toward the river mouth, with the left banks prone to accretion and the right banks prone to erosion. Major erosion sites were found in meanders and areas with large islets and sand mining activities. In contrast to riverbanks, islets exhibited an accretion trend, adding an additional area of 13.3 km2 from 1988 to 2020.
From 2002 to 2020, the erosion of riverbanks and islets substantially impacted the LULC, population, and economy of the provinces along the VMD. Agricultural land was the most eroded, accounting for over 86% of the lost land area. However, built-up land had the highest economic damage, accounting for 70.6% of the total damage. An estimated 31,273 people from nine provinces were exposed to erosion. An Giang province had the most severe economic loss due to land loss, with VND 7742.3 billion (USD 318.9 million). The results highlighted that the morphological changes in the VMD are becoming more serious. In addition to natural factors, dams and sand mining are considered to be the main factors in river erosion. Further research should quantify the effects of drivers, namely dams and sand mining, on riverbank erosion and find their links. Such efforts are essential for effectively planning and managing this river delta.
Supplementary Materials
The following supporting information can be downloaded at https://www.mdpi.com/article/10.3390/rs16040707/s1. Table S1. Changes in the islet area from 1988 to 2020. Table S2. Changes in sinuosity index of the Mekong and Bassac Rivers during 1988–2020. Figure S1. Erosion and accretion map of riverbank and islets in 1988–1995, Figure S2. Erosion and accretion map of riverbank and islets in 1995–2002, Figure S3. Erosion and accretion map of riverbank and islets in 2002–2008, Figure S4. Erosion and accretion map of riverbank and islets in 2008–2015, Figure S5. Exposure of LULC to riverbank and islet erosion in the VMD in 2002-2008, Figure S6. Exposure of LULC to riverbank and islet erosion in the VMD in 2008-2015, Figure S7. Exposure of population density to riverbank and islet erosion in the VMD in 2002–2008, Figure S8. Exposure of population density to riverbank and islet erosion in the VMD in 2008–2015, Figure S9. A linear regression between SI and the riverbank erosion area of the VMD, Figure S10. A linear regression between the islet area and the average width of the VMD.
Author Contributions
Conceptualization, T.H.V., D.V.B., H.N.T., M.A.K., and J.S.; methodology, T.H.V., D.V.B., and J.S.; software, T.H.V. and H.N.T.; writing—original draft preparation, T.H.V.; writing—review and editing, T.H.V., D.V.B., H.N.T., M.A.K., D.D.B., and J.S.; supervision, J.S. All authors have read and agreed to the published version of the manuscript.
Funding
This study is funded by the Katholischer Akademischer Ausländer-Dienst (KAAD) scholarship program in Germany and the Ministry of Education and Training under grant number B2023-VGU-01 and the Japan-ASEAN Science, Technology and Innovation Platform (JASTIP).
Data Availability Statement
Data used in this study can be obtained by contacting the corresponding author.
Acknowledgments
This study is a part of the first author’s Ph.D. research. We would like to thank Schylar Alexandra Healy for proofreading this manuscript in English.
Conflicts of Interest
The authors declare no conflicts of interest.
References
- Camporeale, C.; Perona, P.; Porporato, A.; Ridolfi, L. On the long-term behavior of meandering rivers. Water Resour. Res. 2005, 41, W12403. [Google Scholar] [CrossRef]
- Stamm, J.; Müller, N.; Muvdi, R.T.; Mietz, S.C.; Alshomaree, R. Innovative System Solutions for Transdisciplinary and Regional Ecological Flood Risk Management and Natural Water Development. Report of the BMBF ReWaM Project In_StröHmunG, Germany. 2018. Available online: https://www.ioew.de/en/project/innovative_system_solutions_for_a_transdisciplinary_and_regional_ecological_flood_risk_management_a (accessed on 30 November 2023).
- Ortega, J.A.; Razola, L.; Garzón, G. Recent human impacts and change in dynamics and morphology of ephemeral rivers. Nat. Hazards Earth Syst. Sci. 2014, 14, 713–730. [Google Scholar] [CrossRef]
- Surian, N.; Rinaldi, M. Morphological response to river engineering and management in alluvial channels in Italy. Geomorphology 2003, 50, 307–326. [Google Scholar] [CrossRef]
- Hossain, M.A.; Gan, T.Y.; Baki, A.B.M. Assessing morphological changes of the Ganges River using satellite images. Quat. Int. 2013, 304, 142–155. [Google Scholar] [CrossRef]
- Darby, S.E.; Thorne, C.R. Development and Testing of Riverbank-Stability Analysis. J. Hydraul. Eng. 1995, 122, 8. [Google Scholar] [CrossRef]
- Brunier, G.; Anthony, E.J.; Goichot, M.; Provansal, M.; Dussouillez, P. Recent morphological changes in the Mekong and Bassac river channels, Mekong delta: The marked impact of riverbed mining and implications for delta destabilisation. Geomorphology 2014, 224, 177–191. [Google Scholar] [CrossRef]
- World Wide Fund for Nature (WWF). Ecological Footprint and Investment in Natural Capital in Asia and the Pacific. Gland, Switzerland. 2012. Available online: https://www.adb.org/publications/ecological-footprint-and-investment-natural-capital-asia-and-pacific (accessed on 30 November 2023).
- Jordan, C.; Visscher, J.; Dung, N.V.; Apel, H.; Schlurmann, T. Impacts of human activity and global changes on future morphodynamics within the tien river, Vietnamese Mekong delta. Water 2020, 12, 2204. [Google Scholar] [CrossRef]
- Vietnam Plus. Mekong Delta Hoped to See Development Breakthroughs. 2022. Available online: https://www.vietnamplus.vn/phat-trien-kinh-te-vung-dong-bang-song-cuu-long-khoi-day-dong-luc/787752.vnp (accessed on 1 December 2023). (In Vietnamese).
- Binh, D.V.; Kantoush, S.A.; Ata, R.; Tassi, P.; Tam, V.N.; Abderrezzak, K.E.K.; Bourban, E.S.; Hung, N.Q.; Doan, N.L.P.; Trung, L.V.; et al. Hydrodynamics, sediment transport, and morphodynamics in the Vietnamese Mekong Delta: Field study and numerical modelling. Geomorphology 2022, 413, 108368. [Google Scholar] [CrossRef]
- Binh, D.V.; Kantoush, S.; Sumi, T. Changes to long-term discharge and sediment loads in the Vietnamese Mekong Delta caused by upstream dams. Geomorphology 2020, 353, 107011. [Google Scholar] [CrossRef]
- Kummu, M.; Lu, X.X.; Rasphone, A.; Sarkkula, J.; Koponen, J. Riverbank changes along the Mekong River: Remote sensing detection in the Vientiane-Nong Khai area. Quat. Int. 2008, 186, 100–112. [Google Scholar] [CrossRef]
- Miyazawa, N.; Sunada, K.; Sokhem, P. Bank Erosion in the Mekong River Basin: Is Bank Erosion in My Town Caused by the Activities of My Neighbors? In Modern Myths of the Mekong, Water & Development Publications; Helsinki University of Technology: Helsinki, Finland, 2008; pp. 19–26. [Google Scholar]
- Van, V. Urgently Overcome Landslides in the Mekong Delta. 2023. Available online: https://cand.com.vn/doi-song/cap-bach-khac-phuc-sat-lo-tai-dong-bang-song-cuu-long-i703659/ (accessed on 1 December 2023). (In Vietnamese).
- Acharya, T.D.; Subedi, A.; Lee, D.H. Evaluation of water indices for surface water extraction in a landsat 8 scene of Nepal. Sensors 2018, 18, 2580. [Google Scholar] [CrossRef]
- Batalla, R.J.; Iroumé, A.; Hernández, M.; Llena, M.; Mazzorana, B.; Vericat, D. Recent geomorphological evolution of a natural river channel in a Mediterranean Chilean basin. Geomorphology 2018, 303, 322–337. [Google Scholar] [CrossRef]
- Legleiter, C.J.; Robert, D.A.; Lawrence, R.L. Spectrally based remote sensing of river bathymetry. Earth Surf. Process. Landf. 2009, 34, 1039–1059. [Google Scholar] [CrossRef]
- Langat, P.K.; Kumar, L.; Koech, R. Monitoring river channel dynamics using remote sensing and GIS techniques. Geomorphology 2018, 325, 92–102. [Google Scholar] [CrossRef]
- Smith, L.C. Satellite remote sensing of river inundation area, stage, and discharge: A review. Hydrol. Process. 1997, 11, 1427–1439. [Google Scholar] [CrossRef]
- Li, X.; Liu, J.P.; Saito, Y.; Nguyen, V.L. Recent evolution of the Mekong Delta and the impacts of dams. Earth-Sci. Rev. 2017, 175, 1–17. [Google Scholar] [CrossRef]
- Aadland, T.; Helland-Hansen, W. Progradation rates measured at modern river outlets: A first-order constraint on the pace of deltaic deposition. J. Geophys. Res Earth Surf. 2019, 124, 347–364. [Google Scholar] [CrossRef]
- Markert, K.N.; Schmidt, C.M.; Griffin, R.E.; Flores, A.I.; Poortinga, A.; Saah, D.S.; Muench, R.E.; Clinton, N.E.; Chishtie, F.; Kityuttachai, K.; et al. Historical and Operational Monitoring of Surface Sediments in the Lower Mekong Basin Using Landsat and Google Earth Engine Cloud Computing. Remote Sens. 2018, 10, 909. [Google Scholar] [CrossRef]
- Khoi, D.N.; Dang, T.D.; Pham, L.T.H.; Loi, P.T.; Thuy, N.T.D.; Phung, N.K.; Bay, N.T. Morphological change assessment from intertidal to river-dominated zones using multiple-satellite imagery: A case study of the Vietnamese Mekong Delta. Reg. Stud. Mar. Sci. 2020, 34, 101087. [Google Scholar] [CrossRef]
- Lam, N.D.; Thy, P.T.M.; Phung, H.P. Change detection of land use and riverbank in Mekong Delta, Vietnam using time series remotely sensed data. J. Resour. Ecol. 2011, 2, 370–374. [Google Scholar]
- Tha, T.; Piman, T.; Bhatpuria, D.; Ruangrassamee, P. Assessment of riverbank erosion hotspots along the Mekong River in Cambodia using remote sensing and hazard exposure mapping. Water 2022, 14, 1981. [Google Scholar] [CrossRef]
- Gugliotta, M.; Saito, Y.; Nguyen, V.L.; Ta, T.K.O.; Nakashima, R.; Tamura, T.; Uehara, K.; Katsuki, K.; Yamamoto, S. Process regime, salinity, morphological, and sedimentary trends along the fluvial to marine transition zone of the mixed-energy Mekong River delta, Vietnam. Cont. Shelf Res. 2017, 147, 7–26. [Google Scholar] [CrossRef]
- Binh, D.V.; Wietlisbach, B.; Kantoush, S.; Loc, H.H.; Park, E.; Cesare, G.D.; Cuong, D.H.; Tung, N.X.; Sumi, T. A Novel Method for River Bank Detection from Landsat Satellite Data: A Case Study in the Vietnamese Mekong Delta. Remote Sens. 2020, 12, 3298. [Google Scholar] [CrossRef]
- Bizzi, S.; Demarchi, L.; Grabowski, R.C.; Weissteiner, C.J.; Bund, W.V.D. The use of remote sensing to characterise hydromorphological properties of European rivers. Aquat. Sci. 2016, 78, 57–70. [Google Scholar] [CrossRef]
- Shrestha, B.; Cochrane, T.A.; Caruso, B.S.; Arias, M.E.; Piman, T. Uncertainty in flow and sediment projections due to future climate scenarios for the 3S Rivers in the Mekong Basin. J. Hydrol. 2016, 540, 1088–1104. [Google Scholar] [CrossRef]
- Kim, T.T.; Ngoc, P.; Nga, T.N.Q.; Nguyet, T.T.N.; Truong, N.H.; Diem, M.T.P.; Phung, K.N.; Bay, T.N. Modifying BEHI (Bank Erosion Hazard Index) to map and assess the levels of potential riverbank erosion of highly human impacted rivers: A case study for Vietnamese Mekong river system. Environ. Earth Sci. 2023, 82, 554. [Google Scholar] [CrossRef]
- Anh, H.H.; Thuy, N.N. Socio-economic assessment of riverbank erosion from heavy boat traffic: A case study at the Cho Gao Canal, Tien Giang, Vietnam. IOP Conf. Ser. Earth Environ. Sci. 2022, 967, 012005. [Google Scholar] [CrossRef]
- Tri, V.P.D.; Trung, P.K.; Trong, T.M.; Parsons, D.R.; Darby, S.E. Assessing social vulnerability to riverbank erosion across the Vietnamese Mekong Delta. Int. J. River Basin Manag. 2023, 21, 501–512. [Google Scholar] [CrossRef]
- Bizzi, S.; Piégay, H.; Demarchi, L.; Van de Bund, W.; Weissteiner, C.J.; Gob, F. LiDAR-based fluvial remote sensing to assess 50–100-year human-driven channel changes at a regional level: The case of the Piedmont Region, Italy. Earth Surf. Process. Landf. 2018, 44, 471–489. [Google Scholar] [CrossRef]
- Jordan, C.; Tiede, J.; Lojek, O.; Visscher, J.; Apel, H.; Nguyen, H.Q.; Quang, C.N.X.; Schlurmann, T. Sand mining in the Mekong Delta revisited—Current scales of local sediment deficits. Sci. Rep. 2019, 9, 17823. [Google Scholar] [CrossRef] [PubMed]
- Binh, D.V.; Kantoush, S.A.; Saber, M.; Mai, N.P.; Maskey, S.; Phong, D.T.; Sumi, T. Long-term alterations of flow regimes of the Mekong River and adaptation strategies for the Vietnamese Mekong Delta. J. Hydrol. Reg. Stud. 2020, 32, 100742. [Google Scholar] [CrossRef]
- Lu, X.X.; Siew, R.Y. Water discharge and sediment flux changes over the past decades in the Lower Mekong River: Possible impacts of the Chinese dams. Hydrol. Earth Syst. Sci. 2006, 10, 181–195. [Google Scholar] [CrossRef]
- Darby, S.E.; Hackney, C.R.; Leyland, J.; Kummu, M.; Lauri, H.; Parsons, D.R.; Best, J.L.; Nicholas, A.P.; Aalto, R. Fluvial sediment supply to a mega-delta reduced by shifting tropical-cyclone activity. Nature 2016, 539, 276–279. [Google Scholar] [CrossRef]
- Kondolf, G.M.; Gao, Y.; Annandale, G.W.; Morris, G.L.; Jiang, E.; Zhang, J.; Cao, Y.; Carling, P.; Fu, K.; Guo, Q.; et al. Sustainable sediment management in reservoirs and regulated rivers: Experiences from five continents. Earth’s Future 2014, 2, 256–280. [Google Scholar] [CrossRef]
- Nowacki, D.J.; Ogston, A.S.; Nittrouer, C.A.; Fricke, A.T.; Tri, V.P.D. Sediment dynamics in the lower Mekong River: Transition from tidal river to estuary. J. Geophys. Res. Ocean. 2015, 120, 6363–6383. [Google Scholar] [CrossRef]
- Koehnken, L. Discharge and Sediment Monitoring Program Review, Recommendations and Data Analysis: Part 2-Data Analysis of Preliminary Results. Information and Knowledge Management Programme (IKMP), Mekong River Commission, Phnom Penh. 2012. 53p. Available online: https://portal.mrcmekong.org/assets/v1/documents/Report-workshop/Technical-Report_DSMP/report_IKMP-Discharge-and-Sediment-Monitoring-Program-Review_Part1-May2012.pdf (accessed on 15 November 2023).
- Stephens, J.D.; Allison, M.A.; Leonardo, D.R.D.; Weathers, H.D.; Ogston, A.S.; McLachlan, R.L.; Xing, F.; Meselhe, E.A. Sand dynamics in the Mekong River channel and export to the coastal ocean. Cont. Shelf Res. 2017, 147, 38–50. [Google Scholar] [CrossRef]
- Tuyen, L.D. Mekong Delta Pays a High Price from Sand Mining. 2023. Available online: https://www.mekongeye.com/2023/05/01/mekong-delta-sand-mining/ (accessed on 15 November 2023).
- Thanh Liem. Landslides are Becoming More and More Serious, Can Tho Petitions the Central Government for Support. 2020. Available online: https://www.vietnamplus.vn/sat-lo-ngay-cang-nghiem-trong-can-tho-kien-nghi-trung-uong-ho-tro-post715493.vnp#google_vignette (accessed on 16 November 2023).
- Clément, R.; Adrien, A.; Mélanie, B.; Lise, V.; Hervé, P. “FluvialCorridor”: A new ArcGIS toolbox package for multiscale riverscape exploration. Geomorphology 2015, 242, 29–37. [Google Scholar]
- Yang, C.; Cai, X.; Wang, X.; Yan, R.; Zhang, T.; Zhang, Q.; Lu, X. Remotely Sensed Trajectory Analysis of Channel Migration in Lower Jingjiang Reach during the Period of 1983–2013. Remote Sens. 2015, 7, 16241–16256. [Google Scholar] [CrossRef]
- Rozo, M.G.; Nogueira, A.C.R.; Castro, C.S. Remote sensing-based analysis of the planform changes in the upper Amazon River over the period 1986–2006. J. S. Am. Earth Sci. 2014, 51, 28–44. [Google Scholar] [CrossRef]
- Wang, P.; Fu, K.; Huang, J.; Duan, X.; Yang, Z. Morphological changes in the lower Lancang River due to extensive human activities. PeerJ 2020, 8, e9471. [Google Scholar] [CrossRef] [PubMed]
- Bright, E.; Rose, A.; Urban, M. LandScan Global 2015 [Data Set]. Oak Ridge National Laboratory. 2016. Available online: https://landscan.ornl.gov (accessed on 16 November 2023).
- Bright, E.; Coleman, P.; King, A.; Rose, A.; Urban, M. LandScan Global 2008 [Data Set]. Oak Ridge National Laboratory. 2009. Available online: https://landscan.ornl.gov (accessed on 16 November 2023).
- Bright, E.; Coleman, P. LandScan Global 2002 [Data Set]. Oak Ridge National Laboratory. 2003. Available online: https://landscan.ornl.gov (accessed on 16 November 2023).
- Duong, C.P.; Ta, H.T.; Van, T.T.; Taiga, S.; Thuy, P.T.V.; Dieu, T.B.; Masato, H.; Takeo, T.; Kenlo, N.N. First comprehensive quantification of annual land use/cover from 1990 to 2020 across mainland Vietnam. Sci Rep. 2021, 11, 9979. [Google Scholar]
- Zou, Z.; Xiao, X.; Dong, J.; Qin, Y.; Doughty, R.B.; Menarguez, M.A.; Zhang, G.; Wang, J. Divergent trends of open-surface water body area in the contiguous United States from 1984 to 2016. Proc. Natl. Acad. Sci. USA 2018, 115, 3810–3815. [Google Scholar] [CrossRef] [PubMed]
- Boothroyd, R.J.; Williams, R.D.; Hoey, T.B.; Barrett, B.; Prasojo, O.A. Applications of Google Earth Engine in fluvial geomorphology for detecting river channel change. WIREs Water 2020, 8, e21496. [Google Scholar] [CrossRef]
- Baki, A.B.M.; Gan, T.Y. Riverbank migration and island dynamics of the braided Jamuna River of the Ganges-Brahmaputra basin using multi-temporal Landsat images. Quat. Int. 2012, 263, 148–161. [Google Scholar] [CrossRef]
- Bhuiyan, M.A.H.; Islam, S.M.D.; Azam, G. Exploring impacts and livelihood vulnerability of riverbank erosion hazard among rural household along the river Padma of Bangladesh. Env. Syst Res. 2017, 6, 25. [Google Scholar] [CrossRef]
- Hung, L.M.; San, D.C.; Chuong, L.T.; Long, N.T.; Hoang, T.B.; Nghi, V.V.; Tuong, T.N.; Nguyen, L.D.; Viet, P.B.; Khiet, D.V. Prediction of riverbank sliding and deposition in lower Mekong delta, mitigations measurement strategies. Report of National Project, Vietnam. 2003. Available online: http://tailieudientu.lrc.tnu.edu.vn/Upload/Collection/brief/brief_25027_28481_4544.pdf (accessed on 16 November 2023).
- Pilarczyk, K.W. Bank Erosion Mekong Delta and Red River. Delft: HYDROpil Consultancy. 2004. Available online: https://www.researchgate.net/publication/294892187_Bank_erosion_Mekong_Delta_and_Red_River (accessed on 1 November 2023).
- Bussi, G.; Darby, S.E.; Whitehead, P.G.; Jin, L.; Dadson, S.J.; Voepel, H.E.; Vasilopoulos, G.; Hackney, C.R.; Hutton, C.; Berchoux, T.; et al. Impact of dams and climate change on suspended sediment flux to the Mekong delta. Sci. Total Environ. 2020, 755, 142468. [Google Scholar] [CrossRef] [PubMed]
- Stimson. Mekong Mainstream Dams. 2020. Available online: https://www.stimson.org/2020/mekong-mainstream-dams/ (accessed on 1 November 2023).
- Bravard, J.P.; Goichot, M.; Gaillot, S. Geography of sand and gravel mining in the Lower Mekong River. EchoGéo 2013, 26. [Google Scholar] [CrossRef]
- Gruel, C.R.; Park, E.; Switzer, A.D.; Kumar, S.; Loc, H.H.; Kantoush, S.; Binh, D.V.; Feng, L. New systematicaly measured sand mining budget for the Mekong Delta reveals rising trends and significant volume underestimations. Int. J. Appl. Earth Obs. Geoinf. 2022, 108, 102736. [Google Scholar]
- Anthony, E.J.; Brunier, G.; Besset, M.; Goichot, M.; Dussouillez, P.; Nguyen, V.L. Linking rapid erosion of the Mekong River delta to human activities. Sci. Rep. 2015, 5, 14745. [Google Scholar] [CrossRef]
- Ta, T.K.O.; Nguyen, V.L.; Tateishi, M.; Kobayashi, I.; Tanabe, S.; Saito, Y. Holocene delta evolution and sediment discharge of the Mekong River, southern Vietnam. Quat. Sci. Rev. 2002, 21, 1807–1819. [Google Scholar] [CrossRef]
- Tho, N.V. Coastal Erosion, River Bank Erosion and Landslides in the Mekong Delta: Causes, Effects and Solutions. In Geotechnics for Sustainable Infrastructure Development, Lecture Notes in Civil Engineering; Springer: Singapore, 2020; pp. 957–962. [Google Scholar]
- Saito, Y.; Yang, Z.; Hori, K. The Huanghe (Yellow River) and Changjiang (Yangtze River) deltas: A review on their characteristics, evolution and sediment discharge during the Holocene. Geomorphology 2001, 41, 219–231. [Google Scholar] [CrossRef]
- Canestrelli, A.; Lanzoni, S.; Fagherazzi, S. One-dimensional numerical modeling of the long-term morphodynamic evolution of a tidally-dominated estuary: The Lower Fly River (Papua New Guinea). Sediment. Geol. 2014, 301, 107–119. [Google Scholar] [CrossRef]
- Long, J.; Li, H.; Wang, Z.; Wang, B.; Xu, Y. Three decadal morphodynamic evolution of a large channel bar in the middle Yangtze River: Influence of natural and anthropogenic interferences. Catena 2021, 199, 105128. [Google Scholar] [CrossRef]
- Tri, V.K. Hydrology and Hydraulic Infrastructure Systems in the Mekong Delta, Vietnam. In The Mekong Delta System: Inter disciplinary Analyses of a River Delta, Springer Environmental Science and Engineering; Springer: Dordrecht, The Netherlands, 2012; pp. 49–81. [Google Scholar]
- Mohammad, A.; Stamm, J. Optimizing multi-purpose reservoir operation using Swarm-Intelligence-methods. In Hydrodynamic and Mass Transport at Freshwater Aquatic Interfaces, GeoPlanet: Earth and Planetary Sciences; Springer: Cham, Switzerland, 2015; pp. 209–220. [Google Scholar]
- Allison, M.A.; Dallon, W.H.; Meselhe, E.A. Bottom morphology in the Song Hau distributary channel, Mekong River Delta, Vietnam. Cont. Shelf Res. 2017, 147, 51–61. [Google Scholar] [CrossRef]
- Darby, S.E.; Leyland, J.; Kummu, M.; Räsänen, T.A.; Lauri, H. Decoding the drivers of bank erosion on the Mekong river: The roles of the Asian monsoon, tropical storms, and snowmelt. Water Resour. Res. 2013, 49, 2146–2163. [Google Scholar] [CrossRef]
- Kondolf, G.M. Hungry water: Effects of dams and gravel mining on river channels. Environ. Manag. 1997, 21, 533–551. [Google Scholar] [CrossRef]
- Binh, D.V.; Kantoush, A.A.; Sumi, T.; Mai, N.P.; Ngoc, T.A.; Trung, L.V.; An, T.D. Effects of riverbed incision on the hydrology of the Vietnamese Mekong Delta. Hydrol. Process. 2021, 35, e14030. [Google Scholar] [CrossRef]
- Hackney, C.R.; Darby, S.E.; Parsons, D.R.; Leyland, J.; Best, J.L.; Aalto, R.; Nicholas, A.P.; Houseago, R.C. River bank instability from unsustainable sand mining in the lower Mekong River. Nat. Sustain. 2020, 3, 217–225. [Google Scholar] [CrossRef]
- Kondolf, G.M.; Smeltzer, M.; Kimball, L. Freshwater Gravel Mining and Dredging Issues. Prepared for Washington Department of Fish and Wildlife, Washington Department of Ecology, Washington Department of Transportation. April 2002. Available online: https://wdfw.wa.gov/sites/default/files/publications/00056/wdfw00056.pdf (accessed on 1 November 2023).
- Padmalal, D.; Maya, K.; Sreebha, S.; Sreeja, R. Environmental effects of river sand mining: A case from the river catchments of Vembanad lake, Southwest coast of India. Environ. Geol. 2008, 54, 879–889. [Google Scholar] [CrossRef]
- Vu, T.H.H.; Duong, V. Morphology of water-based housing in Mekong delta, Vietnam. MATEC Web Conf. 2018, 193, 04005. [Google Scholar]
Disclaimer/Publisher’s Note: The statements, opinions and data contained in all publications are solely those of the individual author(s) and contributor(s) and not of MDPI and/or the editor(s). MDPI and/or the editor(s) disclaim responsibility for any injury to people or property resulting from any ideas, methods, instructions or products referred to in the content. |
© 2024 by the authors. Licensee MDPI, Basel, Switzerland. This article is an open access article distributed under the terms and conditions of the Creative Commons Attribution (CC BY) license (https://creativecommons.org/licenses/by/4.0/).