Abstract
In search and rescue (SAR) operations, up-to-date information on the terrain is critical because every additional hour required to search for a person reduces the likelihood of success. Therefore, it is necessary to provide quick access and the best possible input data for planners and search teams and to develop tools that can help them plan and monitor actions in real-time. This paper describes a novel system based on the use of GIS for planning actions and visualizing the situation on the ground. Special focus is devoted to the algorithm for assessing the mobility of the missing person. Using this algorithm, the area of the proposed search area is modeled based on obtained information about the type of terrain on which the searches are planned. The obtained results are presented as a new Geographic Information System layer and have proven to be a quality that helps in defining the search space. Further research is discussed, especially regarding the assessment of the passability of certain types of terrain.
1. Introduction
Searches for missing or injured people in the wild are, unfortunately, frequent and not limited to specific areas, regions, or types of terrain [1,2]. The frequency of searches can vary with the seasons, the type of terrain, and other factors such as the tourist season and the like, but in fact, the need for available forces that can start a search (and rescue) mission in a very short time is permanent. Search and rescue (SAR) operations involve searching over a large area of terrain that is very often inaccessible or difficult to access. For larger actions (those that last longer than 10 h, which are about 25%), search dogs and aerial support (helicopters, airplanes, drones) are included in the search, and modern technologies such as thermal cameras are also used. Therefore, these operations are expensive and logistically very demanding. Analyzing the negative aspects of the current situation in the field of search and rescue, it is possible to single out the long duration of the process and the consumption of significant funds for search and rescue operations.
Given that the time spent on search and rescue that is inversely proportional to the probability of a positive outcome, i.e., the probability of finding a living person being searched for, decreases with an increasing search time, the necessity of shortening it is evident. Also, as the probability of survival decreases with time, the search area increases [3].
In addition to the change in approach in the organization of time and, consequently, the consumption of available resources (people, money, etc.), changes are also necessary in the methods used in search procedures.
The classic approach to search and rescue is based on a search at the ground level (professional staff and search dogs) and aerial search, which is still based on a visual inspection performed by humans without the involvement of automated systems. Detecting humans automatically from drones with a thermal camera tends to rely on finding hot spots of a given size [4]. However, thermal cameras have some limitations [5]. In some geographic areas, they are not often used due to limitations in relation to the large number of false targets they display (especially in summer due to high temperatures). Such sensors are useful at night, but as a rule, aircraft do not fly at night due to problems with navigation. The same applies to helicopter pilots who, as a rule, only fly along known corridors at night. Also, it is necessary to point out the high costs related to the helicopter’s fuel consumption, the pilot’s flight hours, the aircraft’s depreciation, etc. Nevertheless, it should be emphasized that these helicopters have the advantage of very reliable flying, even in strong winds, as well as the possibility of transporting rescuers and medical teams. The implementation of an automated system and unmanned aerial vehicles (UAVs), which have been increasingly used over the last five to ten years, appears as a logical choice that has advantages but is also compatible with the aforementioned standard procedures. It is also necessary to mention the search methods based on the detection of a mobile phone signal [6].
Classic methods of search and accompanying systems are not real competition to the project in question since its intention is not to remove classic methods but to expand their capabilities by developing a complete and automated system, thereby contributing to the success of protection and rescue operations with the optimal consumption of resources (time, money, people, equipment).
Due to the above-mentioned reasons, fast and appropriate mission planning and monitoring are critical for success. Planning should include a conscious, continuous cyclic process with the flexibility to plan modifications based on information flow and coordination [7]. The standard tool for mission leaders is the Geographic Information System (GIS). The most popular GIS solutions are ArcGIS [8] (commercial) and the QGIS Open-Source Geographic Information System licensed under the GNU General Public License [9]. These software packages are used as tools for the visualization of terrain, mission planning, and monitoring.
The current approach to search planning involves the application of a complex planning methodology based on experience and statistical data, mainly data from the International Search and Rescue Incident Database (ISRID) [10].
The planning of the search and rescue mission usually starts with determining the initial planning point (IPP). The usual position of the IPP is the Point Last Seen (PLS): the point where a reliable witness saw the subject for the last time. Alternatively, the IPP can be a location where it is relatively certain that the subject was recently located. In that case, this point is called the Last Known Position (LKP) [3]. After that, a planner has to define the area around the IPP that will be searched [11,12]. This area is usually defined using statistical data gathered from several search and rescue missions [10]. Based on the type of person that has been lost, summary statistics are available for the Euclidean distance from the IPP, the track offset, the dispersion angle, find location, scenario, mobility, and survivability.
The circular area around the IPP based on the Euclidean distance from the IPP (the so-called “Ring” approach) is the simplest and, therefore, the most commonly used approach (Figure 1). However, more complex models that use additional information have been developed [13,14].
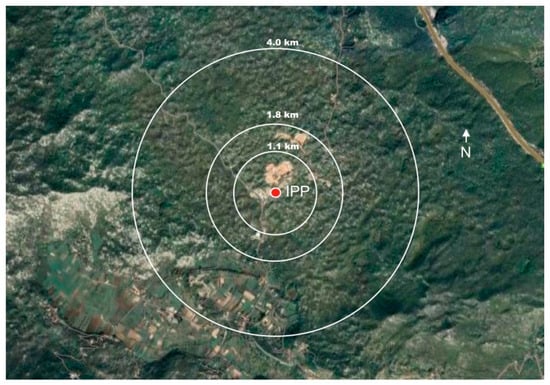
Figure 1.
“Ring approach”—standard search and rescue scenario based on Euclidean distance from the IPP (initial planning point).
After the search area borders are defined, segments with a similar type of terrain are defined, and each is divided into areas. Each area is assigned a probability based on how likely the missing person is within that location. This information is essential for the allocation of resources (searchers, dogs, drones, etc.). The standard tool for the calculation of the probability of an area (POA), as well as for adjusting these values during the search operation (depending on the outcome of the area search), is a Bayesian analysis [15,16]. Incident commanders often have to define probability maps using different sources of information, some of which may be incomplete or imperfect. As already stated, GIS software is the basis for visualizing these areas and can also be used for situational awareness and basic incident management tasks [17].
By analyzing the current situation, it is possible to single out several shortcomings of the existing search planning approach: the limited availability of people with adequate expertise and experience in search planning and the long duration of the search planning phase. Also, plans are based on maps that are not up-to-date, i.e., historical recordings are used that are not aligned with the real situation on the ground (depending also on the time of year and weather conditions), and available statistical data (ISRID) are mainly used in cases from Australia, Canada, New Zealand, South Africa, Switzerland, the United Kingdom, and the USA while cases from other regions of the world are rare or missing.
As already stated, the available online maps used in GIS may be quite old and sometimes misleading. Changes can be significant when comparing maps taken during different times of the year. Also, there is always the possibility that some new roads, houses, or other infrastructure have been built. All these facts can affect planning and search priorities. Therefore, if possible, up-to-date information about the terrain is very important and incorporates aerial images of the area of interest taken at the time of the mission by satellite or UAV (more detailed). The drawback to this approach is the additional time needed to collect and transfer needed images for new maps [18]. On the other hand, high-resolution images collected for this purpose can be used for the automatic detection of humans [19,20,21]. The mission commander assigns UAVs for a search of certain search cells (that have features compatible with this type of search).
The mentioned shortcomings regarding the complexity of the planning procedure can be avoided by using appropriate decision support software [22,23] or an expert system that can propose the whole search procedure; it generates action maps (much faster than human planners), uses maps based on updated orthophoto terrain maps collected by UAVs at the very beginning of the action, and uses statistical data for searches based on local terrain features.
Some findings and results obtained during the development of such an expert system are already presented, but they relate to the transmission of images from UAVs to the ground station [16] and novel algorithms for person detection in aerial images [24,25].
In this paper, a procedure for searching operations based on the use of UAVs and GIS as a basis for planning and implementing a search for missing persons in a non-urban area is presented. Since it is a complex system with a large number of connected modules, the focus is on the part of the system for the prediction of the search area based on terrain features. In contrast to other approaches, such as the simplest “Ring approach” and the approach that predicts the search area using regression and transfer learning models [14], our approach uses available terrain maps, segments them into areas with similar types of terrain, and then uses the stored knowledge about the passability of certain terrain to estimate the mobility area for a certain type of person.
2. Materials and Methods
2.1. Used Software Tools and Procedure Overview
As the basic framework of the system, QGIS version 2.18 [9] was used—an open-source application—which enables the visualization, management, editing, and analysis of geospatial data. The procedure is written as a plugin that communicates with the created MySQL database. The database consists of tables in which data from the ISRID database are stored, as well as tables with data on individual actions and auxiliary tables with data on the characteristics of search units and equipment (probability of detection—POD: preferred terrain, experience, …), characteristics of terrain types, etc. The tables related to actions contain all relevant necessary data for planning and monitoring an action from available search units, search cells, and their features (terrain type, POA, …) to basic information about the wanted person, location, and time of the search, outcome, and the like.
The proposed procedure consists of several steps:
- Starting/opening a new mission using the QGIS plugin;
- Inserting a georeferenced stitched image (collected with UAV) as a new raster layer in QGIS or using existing maps (Google, Bing, …);
- Editing mission data and optionally adjusting imported statistical data on missing people (ISRID data);
- Terrain segmentation and inserting the segmented image as a new QGIS layer;
- Dividing the segmented terrain image into polygons (with each polygon representing a different type of terrain);
- Optional manual corrections of polygons using available QGIS interaction tools;
- Person mobility estimation (PMA algorithm);
- The calculation of POA for chosen segments/polygons.
This procedure provides mission planners with maps of search areas, and a statistical search area alongside a new person mobility area. Also, the probability of area (POA) is calculated for all polygons selected—it is up to the planner to choose segments (according to the statistical circle and/or person mobility area).
The segmentation of the terrain map is based on the mean shift algorithm [26] because it does not require previous knowledge about the number of classes for segmentation, and it is available in QGIS toolboxes. After segmentation, each class must be linked to a particular terrain type (karst, dense forest, green surface, low vegetation, water) stored in the database table along with the integer value of the estimated terrain type’s passability. Research papers related to the terrain passability assessment are most often associated with military applications. Thus, in the literature, one can classify the division of the terrain into passable, slightly passable, and impassable [27]. In [28], the authors define a passability index (IOP) that can be between 0 (impassable terrain) and 1 (completely passable terrain). Although the final objective in the mentioned research is different from the one presented in this paper because the path with the final destination (destinations) for military units is sought, the approach to the assessment of terrain passability has a lot of similarities. Unlike the approach presented here, which is based on the generation of unit cells with an assigned passability value that varies between 1 (completely passable terrain) and 10 (impassable terrain), the authors in [27,28] form a dense network of potential paths and assign a weight value to each path segment.
For this particular implementation, terrain type recognition is conducted by comparing segment patches with stored examples of patches for each class, although some more advanced deep neural network methods should be preferred [29,30]. The estimated passability for each type of terrain has been identified as a consensus based on the voting of several people rating passability from 1 to 10. The results of this voting process are stored in the database as the initial values, but they can be easily edited and changed if needed.
2.2. Person Mobility Algorithm
The described algorithm enables the estimation of the mobility of people on non-urban terrain, that is, the estimation of the maximum distance traveled from a given starting point, depending on the elapsed time and the type of terrain.
The mobility of missing people depends on the passability of the terrain through which the person moves, the category of the person, and the time elapsed since the disappearance. As stated in the previous section, for the purposes of creating the algorithm, each type of terrain was assigned an index from 1 to 10 depending on its passability. Index 1 represents a completely passable terrain, for example, a meadow, while 10 represents an almost completely impassable terrain.
In addition to the passability of the terrain, when calculating mobility, it is necessary to enter the average speed of a person’s movement, which differs for certain categories of people. General statistical data on the mobility of certain categories of missing people in defined periods of time (<24 h, <48 h, <72 h...) are recorded in the ISRID database (and stored in the MySQL table) and serve as input parameters for the calculation of mobility with regard to the type of terrain.
The goal of this algorithm is to estimate the shape of the curve on the terrain map, which delimits the sub-area where the lost person is expected to be. In the case of only one type of terrain, that curve can have the shape of a circle whose radius depends on the passability index. Given that, in practice, we rarely encounter searches where only one type of terrain is represented, below is a description of a way to estimate the shape of the curve for the general case. The idea of the proposed algorithm is basically similar to algorithms for estimating the best path between two points, such as the Dijkstra algorithm [31] and the A-Star algorithm [32]. The improved A-Star algorithm for long-distance off-road path planning tasks was developed to identify a feasible path between the start and destination based on a terrain data map generated using a digital elevation model [33]. However, in our case, there was no final destination point, but a set of final edges to the search area was sought.
The terrain map with the center at the starting point IPP (initial planning point) must be divided into segments of equal size (grid). The size of the grid segment represents the desired resolution with which the calculation is performed, and it should be a compromise between high precision and calculation speed. For our implementation, the map of the terrain around the IPP was loaded in the form of an image in the Python program, and a matrix of segments was formed based on the defined size of the segment and the calculated area of the terrain that each pixel represented in reality (x and y dimensions of pixel in raster properties). In our example, the segment sizes 50 × 50 m and 100 × 100 m were tested.
For each segment, the passability index was calculated according to the type of terrain within the observed segment. Note: since a grid segment can include more than one terrain type (as the result of the map segmentation described in Section 2.1), the terrain type that presented with the largest number of pixels was considered the representative type. Therefore, the passability index for that type of terrain was used.
The maximum value of the statistical curve (25%, 50%, 75%, or 90%) was equal to the product of the number of hours, expressed in seconds, which is defined for the category of the missing person and the average speed of movement, expressed in meters per second. The calculation of the maximum value is shown in Equation (1). A higher terrain passability index affects the faster growth of the value of the segments, thus reducing the distance between the IPP and the maximum value in a certain direction.
where
smax is the maximum distance traveled by the missing person for the time period t [m];
is the average speed of movement of the missing person [m/s];
t is the estimated time period during which the missing person moved [s].
Next, we define the maximum value (nmax) for the PMA algorithm stopping. This value depends on the chosen resolution of the grid. For instance, if the resolution of the grid is 50 m × 50 m and smax = 2000 m, then nmax equals 2000/50 = 40. In general, the following expression applies:
Initially, all segment values except the segment with IPP (S0,0) within the smax radius are set to nmax. Also, a list (Ein) is formed in which all the segments for which the relative distance n to the starting point (IPP) is calculated are included. In the beginning, only the initial segment (IPP) with the value n = 0 was in the list.
An illustration of the above, along with the known passability matrix for the observed area, can be seen in Figure 2a.
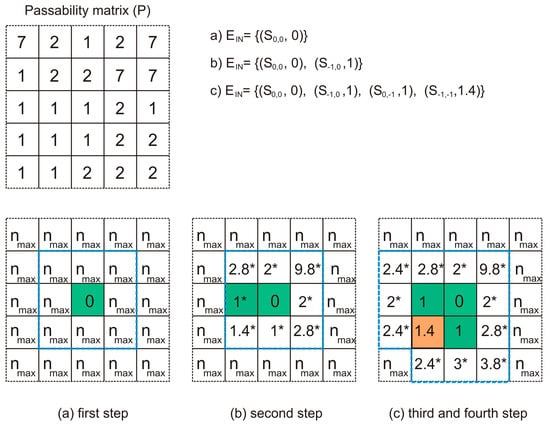
Figure 2.
Illustration of the first four steps of PMA algorithm workflow execution. The passability matrix (P) contains values determined after the observed terrain map segmentation. Values of the list containing inside border segments (EIN) after the first, second, and fourth steps of the PMA algorithm are executed. Final segment values after three steps colored green, fourth step results with value of segment colored orange. Segment values marked with (*) are temporary values.
Furthermore, a list of external segments (Eout) is formed, i.e., segments that are adjacent to segments from the Ein list but for which the relative distance to the IPP has not been calculated. In Figure 2a, the outer edges of the mentioned segments are marked with a blue dashed line.
The next step is to calculate the relative distance (n) to the IPP for each segment from the Eout list. The relative distance value (n) for the observed segment from Eout was calculated using the information of relative distance to the IPP for each of its adjacent segments from Ein, which increased for the multiplication of the passability index of the observed segment with relative distance to its adjacent segment. Therefore, Equation (3) is applied for four-neighbor segments (segments that are above, below, to the left, or to the right of each other) while Equation (4) is applied for segments that are placed diagonally from each other:
Here,
is the distance to the IPP of segment , calculated via the distance of the segment ;
is the adjacent segment’s () distance to IPP;
is the passability index for the terrain type of the segment .
Since more n values can be obtained for each observed segment (because they are calculated for each adjacent segment from Ein), only the smallest value was selected. Figure 2b shows with an asterisk all the values that were calculated for the segments from Eout. Of all the values for the Eout segments calculated in this way, only the value of the segment with the smallest calculated n was ultimately written (1* in Figure 2b), while the others remain undefined. That segment became a member of the Ein list, and after that, all other members of the Ein list were checked in order to examine whether they were still members of Ein, i.e., whether they had any neighboring segments for which the value of the relative distance to the IPP had not yet been calculated (and recorded). The previously described steps were repeated until the smallest value of the relative distance (n) of the winning segment from the Eout list was smaller than the value nmax.
Algorithm 1 summarizes the workflow of the person mobility estimation.
| Algorithm 1 PMA algorithm for person mobility estimation |
| 1: Set initial values for all segments, except IPP, on (initialize_matrix); 2: → edge list, → neighbors list; Put IPP coordinates on the edge list = {(,)}; 3: Do this for each segment in list and 8-neighbours; Neighbors ∉ {} are put in {} end for end for; 4: for each segment in the list , ni,j = = the value of passability at segment ’s location Then, for all neighbors of segment calculate: if is 4-neighbor nk,l() = () + or a diagonal neighbor nk,l () = () + if nk,l () < ni,j then ni,j = nk,l () end for end for; 5: Find from with Put → 6: If n ≥ STOP; 7: for each segment in list if ∌ 8-neighbor | n = , then remove the segment from the list 8: Go to step 3. |
3. Results
In this section, the test results of the PMA algorithm are presented, as well as a brief overview of the whole simulated scenario for planning the search mission using the QGIS and developed plugin. As already stated, QGIS version 2.18 was used along with the MySQL database. Additional modules (PMA algorithm and POA calculator) were written in Python. The operating system was Microsoft Windows 10. Additionally, the desktop computer had an nVidia ti 1080 GPU card with CUDA 10.1 installed.
3.1. PMA Algorithm Test on Sintetic Map
In order to test the performance of the PMA algorithm, the first test was performed on a computer-generated map (Figure 3a). The generated terrain image contained three types of terrain. It can be noticed that the water surface (river), in this case, was assigned a passability value of 7 and not the maximum 10 because it was estimated to not be impassable after all. The area was divided into 100,000 (100 × 100) segments. The resulting area after area expansion (PMA algorithm) is presented in Figure 3b.
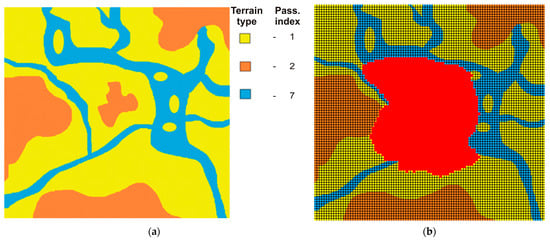
Figure 3.
Example of PMA algorithm results. (a) Segmented terrain map—input for the algorithm; (b) resulting search area (red). The grid shows the unit segments.
3.2. PMA Algorithm Test on a Real Map and a Simulated Scenario
A sparsely populated area 15 km north of Split in Croatia was chosen for this test. After QGIS was launched and a new action was created, a drone survey was carried out at the selected location. A new terrain map was generated using appropriate software [34] and superimposed over the existing Bing folder (Figure 4).
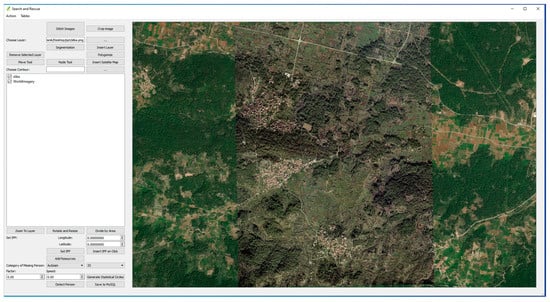
Figure 4.
Overlayed Bing map with UAV-acquired images.
The next step is shown in Figure 5. The terrain segmentation script that uses the mean shift algorithm is started, and the result is a set of polygons. Each polygon represents a different type of terrain. The color of the polygon suggests what type of terrain it is (brown—agricultural land, green—dense forest, gray—low vegetation, yellow—urban area).
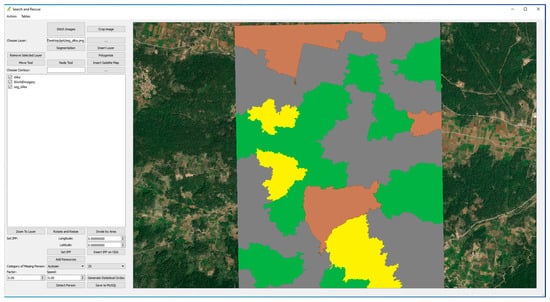
Figure 5.
Image of terrain segmented according to detected types.
To define the necessary input data in the PMA algorithm, it was necessary to determine the search area. We defined the area by setting the IPP, the type of person being sought, the estimated speed of movement, the percentage of the statistical curve from the ISRID database, and an additional heuristic factor for correcting the maximum speed of movement (Figure 6).
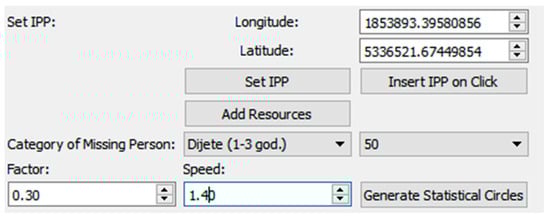
Figure 6.
Setting the IPP (initial planning point) and the category of the missing person and defining the mobility area based on data from the ISRID database and experimentally obtained data on the reduction factor and the expected speed of the person using the QGIS plugin.
After all the parameters were entered, the PMA algorithm was started, and the result was displayed on the image (a new QGIS layer was generated) together with a standard statistical circle (Figure 7). A segment size of 50 × 50 m was selected, and 100 × 100 (10,000) segments were initialized in the initial step. The algorithm’s execution time on the used computer configuration was significantly less (under 2 min) compared to the time required for terrain segmentation (~10 min). The analysis of the resulting surface shows a deviation from the standard circle in accordance with the expectations given the different characteristics of the covered parts of the terrain.
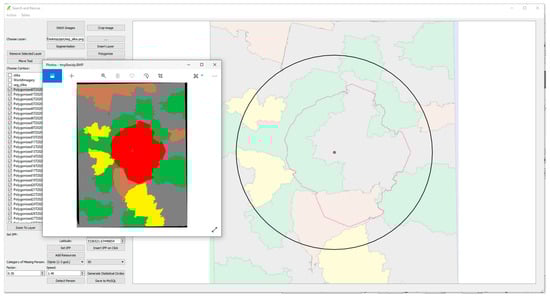
Figure 7.
Comparison of the statistical curve and the search area based on the applied PMA algorithm.
3.3. PMA Algorithm Test on Examples of Real Cases
Finally, the PMA algorithm was tested on examples of real cases available from the literature [35]. For the five cases in which the IPP point, the location of the find, and the type of person being searched for are known, the search areas generated by the PMA algorithm are drawn. As the search start time is usually much later than the moment when the person was last seen, the theoretical maximum distance that the missing person could travel would make the potential search area very large. Therefore, in the examples shown in Figure 8, the ISRID statistical circle value of 75% probability for the type of missing person was taken for the maximum distance that the missing person could travel (smax). Also, for better visualization, the calculated areas corresponding to distances of 25% and 50% are marked.
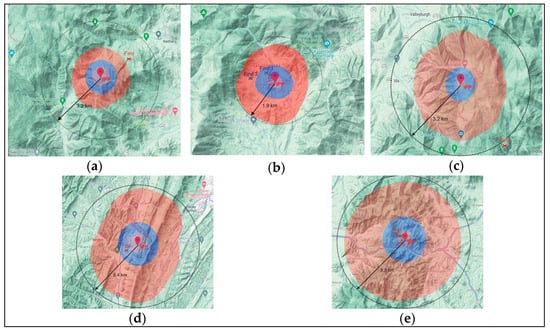
Figure 8.
Calculated search areas for five real cases from [35]. The radius of the 75% probability circle for the type of missing person is indicated. The shaded areas represent the search areas for the set maximum distances of 25%, 50%, and 75%. (a) Child 10-12, Old Rag Mountain; (b) Dementia, Brown’s Cove; (c) Despondent, Whiteoak Canyon; (d) Gatherer, Rattlesnake Run; (e) Mental Illness, Panorama—Turn Bridge Trail.
In all the examples shown in Figure 8, people were found within 75% of the ISRID circle (except the case presented in Figure 8c), where the search at the location started 4 days after the person was reported missing). For the presented cases, four levels of passability or four types of terrain are defined as the input information: 1—plain, easily passable; 2— forested, more difficult to pass; 3—steep with forest; 4—very steep with forest. A segment size of 50 × 50 m was selected. The case in Figure 8b) has markings for two persons found at different locations.
4. Discussion
Although the developed system suggests search segments and calculates their POA, detailed steps of the procedure are not given in this paper because our focus is on the PMA algorithm. As the presented tool was designed as a decision support system, the user is given complete freedom in deciding which and what areas to define as those of interest. In this sense, we can talk about a potential weak point of the presented procedure and the calculation of the PMA algorithm, which is the assessment of passability for certain types of terrain.
In the presented case, the values were assigned via the evaluation of a group of people who had limited experience with searches, so these values were subject to modification and correction. However, all these values could be edited and corrected very easily in the developed interface for accessing tables and SQL database data. It is to be expected that these coefficients will be more precisely defined in the future based on the use of experimental data on the movement of people and on certain types of terrain. Also, when creating an algorithm for assessing the passability coefficient of a particular part of the terrain, it is possible (and desirable) to use 3D information about the elevation of the terrain from the maps that are used.
In the presented examples on real cases, however, information about the slope of the terrain is partly included by including additional terrain types (steep with forest and very steep with forest). For the real cases in 3.3., the areas calculated by the PMA algorithm cover a significantly smaller area than the circle of 75% probability of finding according to the ISRID tables. This can significantly affect the next steps of assigning the probability of the area and sending search teams. However, it should be noted that in one case, the significantly reduced area (Figure 8a) does not cover the place where the person was found.
In action, UAVs can be used in the phase of collecting new terrain images, as well as in the phase of searching certain areas after the POA has been assigned. It should be noted here that new terrain mapping is time-consuming, and it is questionable whether it is suitable for a larger number of missions, considering the need to start the search as quickly as possible. Nevertheless, the expected initial time of the preparation of the action, as well as the standard procedures of rapid verification in the area within the immediate vicinity of the IPP, provides certain possibilities for this option. Also, it is expected that UAVs with greater flight autonomy will be used for these purposes (generally fixed-wing UAVs).
5. Conclusions
This paper presents a system designed to support the leaders of the search for missing people when planning actions. Complex actions that involve numerous and varied resources and use all available information to increase the chances of success are demanding, and very few people have the necessary knowledge to plan and lead them. Here, we are focused on helping with data visualization and proposing a new algorithm for evaluating the search area. The entire procedure up to the generation of the area is shown.
The use of unmanned aerial vehicles for conducting a search for people in the assigned area still has some room for development (in addition to increasing the success of detection algorithms). This primarily refers to defining the characteristics of the aerial vehicles (POD) for certain types of terrain so that this resource can be fully standardized. In the context of this work, UAVs were used both to collect new terrain maps and to search the area based on the output results of the presented system.
The expected direction of further research and improvement can largely be read from the previous discussion. The need for a more reliable assessment of the passability of certain parts of the terrain is probably one of the first challenges. Also, it is necessary to test the system in real situations with the aim of additional improvements and the generalization of the system (ISRID data prefer certain geographical areas). This is a long-term process because the analysis needs to be performed on a large number of various scenarios. The acceleration and optimization of the implementation of segmentation algorithms, as well as the PMA algorithm, are also planned in order to make better use of the available hardware and bring the planning process as close to real-time work as possible.
Finally, it is necessary to point out once again that the proposed system and the PMA algorithm as part of it are primarily intended as a tool to help action planners but not as an exclusive source of information for making a final decision.
Author Contributions
Conceptualization, V.P.; methodology, V.P., A.Š.G. and M.M.; software, A.M.; validation, M.M. and A.M.; formal analysis, V.P. and A.Š.G.; investigation, V.P. and A.Š.G.; resources, M.M.; data curation, A.M.; writing—original draft preparation, V.P.; writing—review and editing, A.Š.G. and M.M.; visualization, A.M.; supervision, V.P.; project administration, V.P.; funding acquisition, V.P. All authors have read and agreed to the published version of the manuscript.
Funding
This research was partially supported by the project “Prototype of an Intelligent System for Search and Rescue”, grant number KK.01.2.1.01.0075, funded by the European Regional Development Fund.
Data Availability Statement
The data presented in this study are available on request from the corresponding author. The data are not publicly available due to potential intellectual property protection issues.
Conflicts of Interest
The authors declare no conflicts of interest.
References
- Du, Y.-C.; Zhang, M.-X.; Ling, H.-F.; Zheng, Y.-J. Evolutionary Planning of Multi-UAV Search for Missing Tourists. IEEE Access 2019, 7, 73480–73492. [Google Scholar] [CrossRef]
- Zhang, H.; Huang, Y.; Qin, H.; Geng, Z. USV Search Mission Planning Methodology for Lost Target Rescue on Sea. Electronics 2023, 12, 4584. [Google Scholar] [CrossRef]
- Koester, R.J. Lost Person Behavior: A Search and Rescue Guide on Where to Look for Land, Air, and Water, 1st ed.; dbS Productions LLC: Charlottesville, VA, USA, 2008. [Google Scholar]
- Rudol, P.; Doherty, P. Human Body Detection and Geolocalization for UAV Search and Rescue Missions Using Color and Thermal Imagery. In Proceedings of the 2008 IEEE Aerospace Conference, Big Sky, MT, USA, 1–8 March 2008. [Google Scholar]
- Burke, C.; McWhirter, P.R.; Veitch-Michaelis, J.; McAree, O.; Pointon, H.A.G.; Wich, S.; Longmore, S. Requirements and Limitations of Thermal Drones for Effective Search and Rescue in Marine and Coastal Areas. Drones 2019, 3, 78. [Google Scholar] [CrossRef]
- Dinh, T.D.; Pirmagomedov, R.; Pham, V.D.; Ahmed, A.A.; Kirichek, R.; Glushakov, R.; Vladyko, A. Unmanned aerial system–assisted wilderness search and rescue mission. Int. J. Distrib. Sens. Netw. 2019, 15, 6. [Google Scholar] [CrossRef]
- Wright, S.; Smith, R. The SAR Planning ‘P’ Process. J. Search Rescue 2020, 4, 111–135. [Google Scholar] [CrossRef]
- ESRI: Gis Mapping Software. Available online: https://www.esri.com/en-us/home (accessed on 28 September 2023).
- QGIS. Available online: https://qgis.org/en/site/ (accessed on 28 September 2023).
- Koester, R.J. 2010 International Search and Rescue Incident Database (ISRID). Available online: http://www.dbs-sar.com/SAR_Research/ISRID.htm (accessed on 28 September 2023).
- Elena, S.; Charles, T.; Robert, K.; Mukul, S. Evaluating Lost Person Behavior Models. Trans. GIS 2015, 20, 38–53. [Google Scholar]
- Paul, D.; Jared, D.; Quinghua, G.; Don, F. An analysis of probability of area techniques for missing persons in Yosemite National Park. Appl. Geogr. 2014, 47, 99–110. [Google Scholar]
- Lin, L.; Goodrich, M.A. A Bayesian approach to modeling lost person behaviors based on terrain features in wilderness search and rescue. Comput. Math. Organ. Theory 2010, 16, 300–323. [Google Scholar] [CrossRef]
- Šerić, L.; Pinjušić, T.; Topić, K.; Blažević, T. Lost Person Search Area Prediction Based on Regression and Transfer Learning Models. ISPRS Int. J. Geo-Inf. 2021, 10, 80. [Google Scholar] [CrossRef]
- Rossmo, D.K.; Velarde, L.; Mahood, T. Optimizing Wilderness Search and Rescue: A Bayesian GIS Analysis. J. Search Rescue 2019, 3, 44–58. [Google Scholar] [CrossRef]
- Rossmo, D.K.; Velarde, L.; Mahood, T. Optimizing Wilderness Search and Rescue: Discovery and Outcomes. J. Search Rescue 2023, 6, 37–45. [Google Scholar] [CrossRef]
- MapSAR Online Web Mapping Application v3. Available online: https://www.arcgis.com/home/item.html?id=bedf10d744ce471b8a28c3e059a49b7e (accessed on 28 September 2023).
- Papić, V.; Šolić, P.; Milan, A.; Gotovac, S.; Polić, M. High-Resolution Image Transmission from UAV to Ground Station for Search and Rescue Missions Planning. Appl. Sci. 2021, 11, 2105. [Google Scholar] [CrossRef]
- Niedzielski, T.; Jurecka, M.; Miziński, B.; Remisz, J.; Ślopek, J.; Spallek, W.; Witek-Kasprzak, M.; Kasprzak, Ł.; Świerczyńska-Chlaściak, M. A real-time field experiment on search and rescue operations assisted by unmanned aerial vehicles. J. Field Robot. 2018, 35, 906–920. [Google Scholar] [CrossRef]
- Turić, H.; Dujmić, H.; Papić, V. Two-stage Segmentation of Aerial Images for Search and Rescue. Inf. Technol. Control 2010, 2, 138–145. [Google Scholar]
- Božić-Štulić, D.; Marušić, Ž.; Gotovac, S. Deep Learning Approach in Aerial Imagery for Supporting Land Search and Rescue Missions. Int. J. Comput. Vis. 2019, 127, 1256–1278. [Google Scholar] [CrossRef]
- Wysokiński, M.; Marcjan, R.; Dajda, J. Decision Support Software for Search & Rescue Operations. Procedia Comput. Sci. 2014, 35, 776–785. [Google Scholar]
- Nasar, W.; Da Silva Torres, R.; Gundersen, O.E.; Karlsen, A.T. The Use of Decision Support in Search and Rescue: A Systematic Literature Review. ISPRS Int. J. Geo-Inf. 2023, 12, 182. [Google Scholar] [CrossRef]
- Kundid Vasić, M.; Papić, V. Multimodel Deep Learning for Person Detection in Aerial Images. Electronics 2020, 9, 1459. [Google Scholar] [CrossRef]
- Kundid Vasić, M.; Papić, V. Improving the Model for Person Detection in Aerial Image Sequences Using the Displacement Vector: A Search and Rescue Scenario. Drones 2022, 6, 19. [Google Scholar] [CrossRef]
- Comaniciu, D.; Meer, P. Mean shift: A robust approach toward feature space analysis. IEEE Trans. Pattern Anal. Mach. Intell. 2002, 24, 603–619. [Google Scholar] [CrossRef]
- Pokonieczny, K.; Dawid, W.; Wyszyński, M. Methodology of using pathfinding methods in military passability maps. In Proceedings of the International Conference on Military Technologies (ICMT), Brno, Czech Republic, 23–26 May 2023; pp. 1–6. [Google Scholar] [CrossRef]
- Dawid, W.; Pokonieczny, K. Methodology of Using Terrain Passability Maps for Planning the Movement of Troops and Navigation of Unmanned Ground Vehicles. Sensors 2021, 21, 4682. [Google Scholar] [CrossRef]
- Yang, J.; Xu, J.; Lv, Y.; Zhou, C.; Zhu, Y.; Cheng, W. Deep learning-based automated terrain classification using high-resolution DEM data. Int. J. Appl. Earth Obs. Geoinf. 2023, 118, 103249. [Google Scholar] [CrossRef]
- Zhang, G.; Roslan, S.N.A.B.; Wang, C.; Quan, L. Research on land cover classification of multi-source remote sensing data based on improved U-net network. Sci. Rep. 2023, 13, 16275. [Google Scholar] [CrossRef]
- Dijkstra, E.W. A note on two problems in connexion with graphs. Numer. Math. 1959, 1, 269–271. [Google Scholar] [CrossRef]
- Hart, P.E.; Nilsson, N.J.; Raphael, B. A formal basis for the heuristic determination of minimum cost paths. IEEE Trans. Syst. Sci. Cybern. 1968, 4, 100–107. [Google Scholar] [CrossRef]
- Hong, Z.; Sun, P.; Tong, X.; Pan, H.; Zhou, R.; Zhang, Y.; Han, Y.; Wang, J.; Yang, S.; Xu, L. Improved A-Star Algorithm for Long-Distance Off-Road Path Planning Using Terrain Data Map. ISPRS Int. J. Geo-Inf. 2021, 10, 785. [Google Scholar] [CrossRef]
- Agisoft Metashape. Available online: https://www.agisoft.com (accessed on 30 September 2023).
- Koester, R.J. Lost Person Behavior: Instructor Activity Guide. 2010. Available online: https://www.dbs-sar.com/InstructorNetwork/DRAFT%20Instructors%20Activity%20Guide.pdf (accessed on 30 September 2023).
Disclaimer/Publisher’s Note: The statements, opinions and data contained in all publications are solely those of the individual author(s) and contributor(s) and not of MDPI and/or the editor(s). MDPI and/or the editor(s) disclaim responsibility for any injury to people or property resulting from any ideas, methods, instructions or products referred to in the content. |
© 2024 by the authors. Licensee MDPI, Basel, Switzerland. This article is an open access article distributed under the terms and conditions of the Creative Commons Attribution (CC BY) license (https://creativecommons.org/licenses/by/4.0/).