Article

An Adaptive INS/CNS/SMN Integrated Navigation Algorithm in Sea Area

School of Automation, Northwestern Polytechnical University, Xi’an 710072, China
*
Author to whom correspondence should be addressed.
Remote Sens. 2024, 16(4), 612; https://doi.org/10.3390/rs16040612
Submission received: 11 December 2023 / Revised: 4 February 2024 / Accepted: 4 February 2024 / Published: 6 February 2024

Abstract

:
In this paper, we present an innovative inertial navigation system (INS)/celestial navigation system (CNS)/scene-matching navigation (SMN) adaptive integrated navigation algorithm designed to achieve prolonged and highly precise navigation in sea areas. The algorithm establishes the structure of the INS/CNS/SMN integrated navigation system. To ensure the availability of CNS in the Nanhai Sea (South China Sea) area, a cloud and fog model is meticulously constructed. Three distinct types of sea area landmarks are defined, and an automated classification model for sea area landmarks, employing support vector machines (SVM), is developed. Corresponding matching methods and strategies for these landmarks are also delineated. Concurrently, the observable probability of each landmark is computed to generate a probability cloud, representing the usability of sea area landmarks. The proposed INS/CNS/SMN adaptive integrated navigation algorithm is simulated and validated across varied altitudes and trajectories in the sea area. The results show that CNS and SMN can dynamically assist INS in achieving prolonged and highly precise navigation.

1. Introduction

The inertial navigation system (INS) is an autonomous navigation system that operates independently of external information, offering the advantages of discreet operation and robust anti-interference capabilities. However, a notable drawback of INS is the rapid accumulation of errors over time, making it challenging to rely on for prolonged and highly precise navigation [1,2,3,4,5]. Typically, supplementary navigation devices such as the celestial navigation system (CNS) [6,7,8,9,10] and scene-matching navigation (SMN) [11,12,13,14,15,16,17] are employed to assist INS in forming an integrated navigation system that aligns with the demands of long-term, high-precision navigation.
Currently, the INS/CNS/SMN integrated navigation system is extensively utilized [18,19,20,21,22,23]. This system leverages measurements provided by CNS and SMN to mitigate the accumulation of errors in INS over time.
CNS determines navigation information, such as position, by utilizing the altitude and azimuth angle of observed navigation satellites. This approach offers benefits of strong autonomy, high accuracy, and mitigated cumulative errors. However, a limitation of CNS lies in its discontinuous output information, susceptible to disruption by cloud cover and fog during flight operations. SMN ascertains the aircraft’s position by matching a prepared landmark image with real-time images, offering advantages of compact size, cost-effectiveness, autonomous operation, and precise positioning. Nonetheless, in the sea flight zones, the scarcity of available landmarks and the limited richness of their features pose challenges. Additionally, discerning color, texture, and distinguishing features among various islands presents difficulty, rendering the traditional method of landmark selection impractical.
Reference [24] delineates the requisite feature indicators pivotal in the landmark selection process and delves into the analysis of matching regions, algorithms, and performance assessment within SMN. References [25,26,27,28,29,30,31] predominantly scrutinize the automated selection methodology for landmarks, the performance of landmarks amidst varying blur sizes, and the model for measuring errors in scene matching. These methodologies predominantly concentrate on land-based SMN research, characterized by an abundance of landmarks and diverse features. However, in the sea areas, landmarks primarily comprise natural islands that have undergone screening, presenting a limited count and lacking conspicuous image features. Consequently, the above approach for landmark selection is inadequately applicable. Moreover, due to the scarcity and uneven distribution of landmarks across sea areas, aircraft might not consistently observe landmarks throughout extended flight durations. SMN can only aid INS when the flight trajectory intersects these landmarks. Consequently, assessing landmark usability across the global flight range after preparatory measures and leveraging this information for route planning holds substantial significance in ensuring long-term, high-precision INS navigation.
The support vector machine (SVM) is recognized as one of the potent supervised machine learning techniques for both classification and regression [32,33]. SVM has been widely used by researchers to address diverse practical applications. In recent years, researchers have proposed several nonparallel hyperplane SVM classifiers to tackle the binary classification issues [34,35], which have shown distinct advantages in solving nonlinear, small sample, and high-dimensional pattern recognition problems. Based on this, the study delves into the exploration of SVM multi-classifiers and applies it to the automatic multi-classification of sea area landmarks, which provides important technical support for aircraft sea area SMN based on landmarks.
In addressing the above issues, this paper develops a model for cloud and fog dynamics within the Nanhai Sea (South China Sea) area and verifies the availability of CNS in different heights and different flight areas. Three types of sea area landmarks are defined based on the distribution and distinctive characteristics of natural islands in the Nanhai Sea area. We establish an automatic classification methodology utilizing SVM and formulate a corresponding scene-matching algorithm for these identified landmarks. Concurrently, we scrutinize multi-mode matching strategies for these three landmark types, considering variations in noise and flight altitudes. Subsequently, we propose an algorithm for evaluating landmark usability, serving as a foundational tool for trajectory planning within flight areas. Finally, we simulate and validate the INS/CNS/SMN adaptive integrated navigation algorithm in the Nanhai Sea area under diverse altitudes and trajectories. The results show that the INS/CNS/SMN adaptive integrated navigation algorithm for sea area proposed in this paper exhibits remarkable robustness and accuracy. Leveraging CNS and SMN measurements, the algorithm assists INS, achieving high-precision and long-term navigation. The algorithm introduces innovative approaches for aircraft integrated navigation, particularly addressing challenges posed by GPS signal interference in the sea flight areas.

2. Methodology

2.1. INS/CNS/SMN Adaptive Integrated Navigation Structure

The schematic representation of the INS/CNS/SMN adaptive integrated navigation system is depicted in Figure 1. The INS primarily generates continuous data on attitude, velocity, and position. The CNS seamlessly integrates with INS in scenarios where a sufficient number of navigation satellites are unimpeded by cloud and fog interference. Simultaneously, the SMN collaborates with INS when a landmark is observable. In achieving the realization of INS/CNS/SMN adaptive integrated navigation, this paper contributes significantly through the following key aspects:
  • The development of the INS/CNS/SMN adaptive integrated navigation system, encompassing the formulation of the INS state equation, as well as the CNS and SMN measurement equations;
  • Establishment of a cloud and fog model, serving as a foundational framework to determine the availability of CNS;
  • Definition of three distinct types of sea area landmarks, accompanied by the introduction of an automatic classification model based on SVM. Additionally, the design of corresponding matching methods and strategies for these landmarks is presented.

2.1.1. State Equation of INS

The state equation of INS is
X ( t ) = F ( t ) X ( t ) + G ( t ) W ( t )
here F t is the system state transition matrix, G t is the control matrix, and W t is the system noise term.
The state vector is
X = [ ϕ E , ϕ N , ϕ U , δ E , δ N , δ U , δ L , δ λ , δ h , ε x , ε y , ε z , x , y , z ] T
where ϕ E , ϕ N , ϕ U are the error angle of the three platforms, δ E , δ N , δ U are the velocity error of east, north, and vertical directions, δ L , δ λ , δ h are the error of latitude, longitude, and height, ε x , ε y , ε z are the zero offsets of the three-axis gyro constant along the carrier coordinate system, and x , y , z are the three axis accelerometer constant offset values along the carrier coordinate system.

2.1.2. Measurement Equation of CNS and SMN

  • Measurement equation of CNS
The coordinate transfer matrixes caused by INS error are
C c n = 1 δ λ sin L δ λ cos L δ λ sin L 1 δ L δ λ cos L δ L 1
C n p = 1 ϕ U ϕ N ϕ U 1 ϕ E ϕ N ϕ E 1
where C c n represents the coordinate transfer matrix from the calculated geographic horizontal coordinate (c-frame) to the navigation coordinate (n-frame), while C n p denotes the coordinate transfer matrix from the navigation coordinate (n-frame) to the local geographic coordinate (p-frame). Additionally, L signifies latitude, δ L and δ λ represent the errors in latitude and longitude, respectively, and ϕ E , ϕ N , ϕ U stand for the error angles of the three platforms.
The transformation of the starlight unit vector between the local geographic coordinate and the calculated computational geographic horizontal coordinate is described as follows
X p = C n p C c n X c
X p = cos H p sin A p   cos H p cos A p   sin H p T
X c = cos H c sin A c   cos H c cos A c   sin H c T
where H c and A c are the altitude and azimuth angle in the calculated geographic horizontal coordinate, and H p and A p are the altitude and azimuth angle in the local geographic coordinate.
We define the CNS measurement Δ A = A p A c and Δ H = H p H c , and the final measurement of the CNS is
Z C N S = H C N S X + V C N S = Δ A Δ H = tan H c × sin A c tan H c × cos A c cos A c sin A c 1 0 , 0 2 × 3 , tan H c sin A c tan H c cos A c cos L c sin L c cos A c sin A c cos L c , 0 2 × 7 X + V C N S
where H C N S is the CNS measurement matrix and V C N S is the measurement noise of the CNS.
2.
Measurement Equation of SMN
Defining the SMN measurement by the position difference between SMN and INS, the measurement of SMN is
Z S M N = H S M N X + V S M N = L I N S L S M N λ I N S λ S M N = 0 2 × 6 , 1 0 0 1 , 0 2 × 7 X + V S M N
where H S M N is the SMN measurement matrix and V S M N is the measurement noise of SMN.

2.1.3. Design of Kalman Filter

Due to the linear measurement information of both CNS and SMN, a Kalman filter can be used for integrated navigation. The state equation of the integrated navigation system is shown in Equation (1), and the measurement equation is
Z ( k ) = H k X ( k ) + V k
here Z ( k ) = Z C N S T k   Z S M N T k T , V ( k ) = V C N S T k   V S M N T k T , H ( k ) = H C N S T k   H S M N T k T .
For discrete linear measurement equations, the Kalman filtering method is used for computational processing, and the filtering recursive equation is ultimately obtained
X k | k 1 = Φ k X k 1 P k | k 1 = Φ k P k 1 Φ k T + Q k 1 K k = P k | k 1 H k T H k P k | k 1 H k T + R k 1 X k = X k | k 1 + K k Z k H k X k | k 1 P k = I K k H k P k | k 1
where X k | k 1 is the one-step prediction of the state, P k | k 1 is the one-step prediction error variance matrix, Q k 1 is the system noise variance matrix at time k − 1, R k is measurement noise variance matrix at time k, K k is the filtering gain matrix at time k, P k is the state estimation error variance matrix at time k, and X k is state estimation at time k. Additionally, Φ k = I + F ( k ) T denotes the state transfer function at time k and T signifies the sampling time.
Due to the different sampling periods in CNS and SMN measurements, synchronization is not achieved in observation and data collection. Consequently, a centralized filtering structure is employed, with local measurement updates executed at suitable intervals aligned with continuous time updates of the system.

2.2. SMN in Sea Area

2.2.1. Definition of Sea Area Landmarks

Due to the prevalence of ocean-dominated images in most sea areas, lacking distinct features, and with landmarks sparsely distributed, alongside closely resembling image attributes such as color and texture, this study addresses these challenges. It introduces a methodology based on the relative position relationships among landmarks, categorizing natural islands into three types as follows:
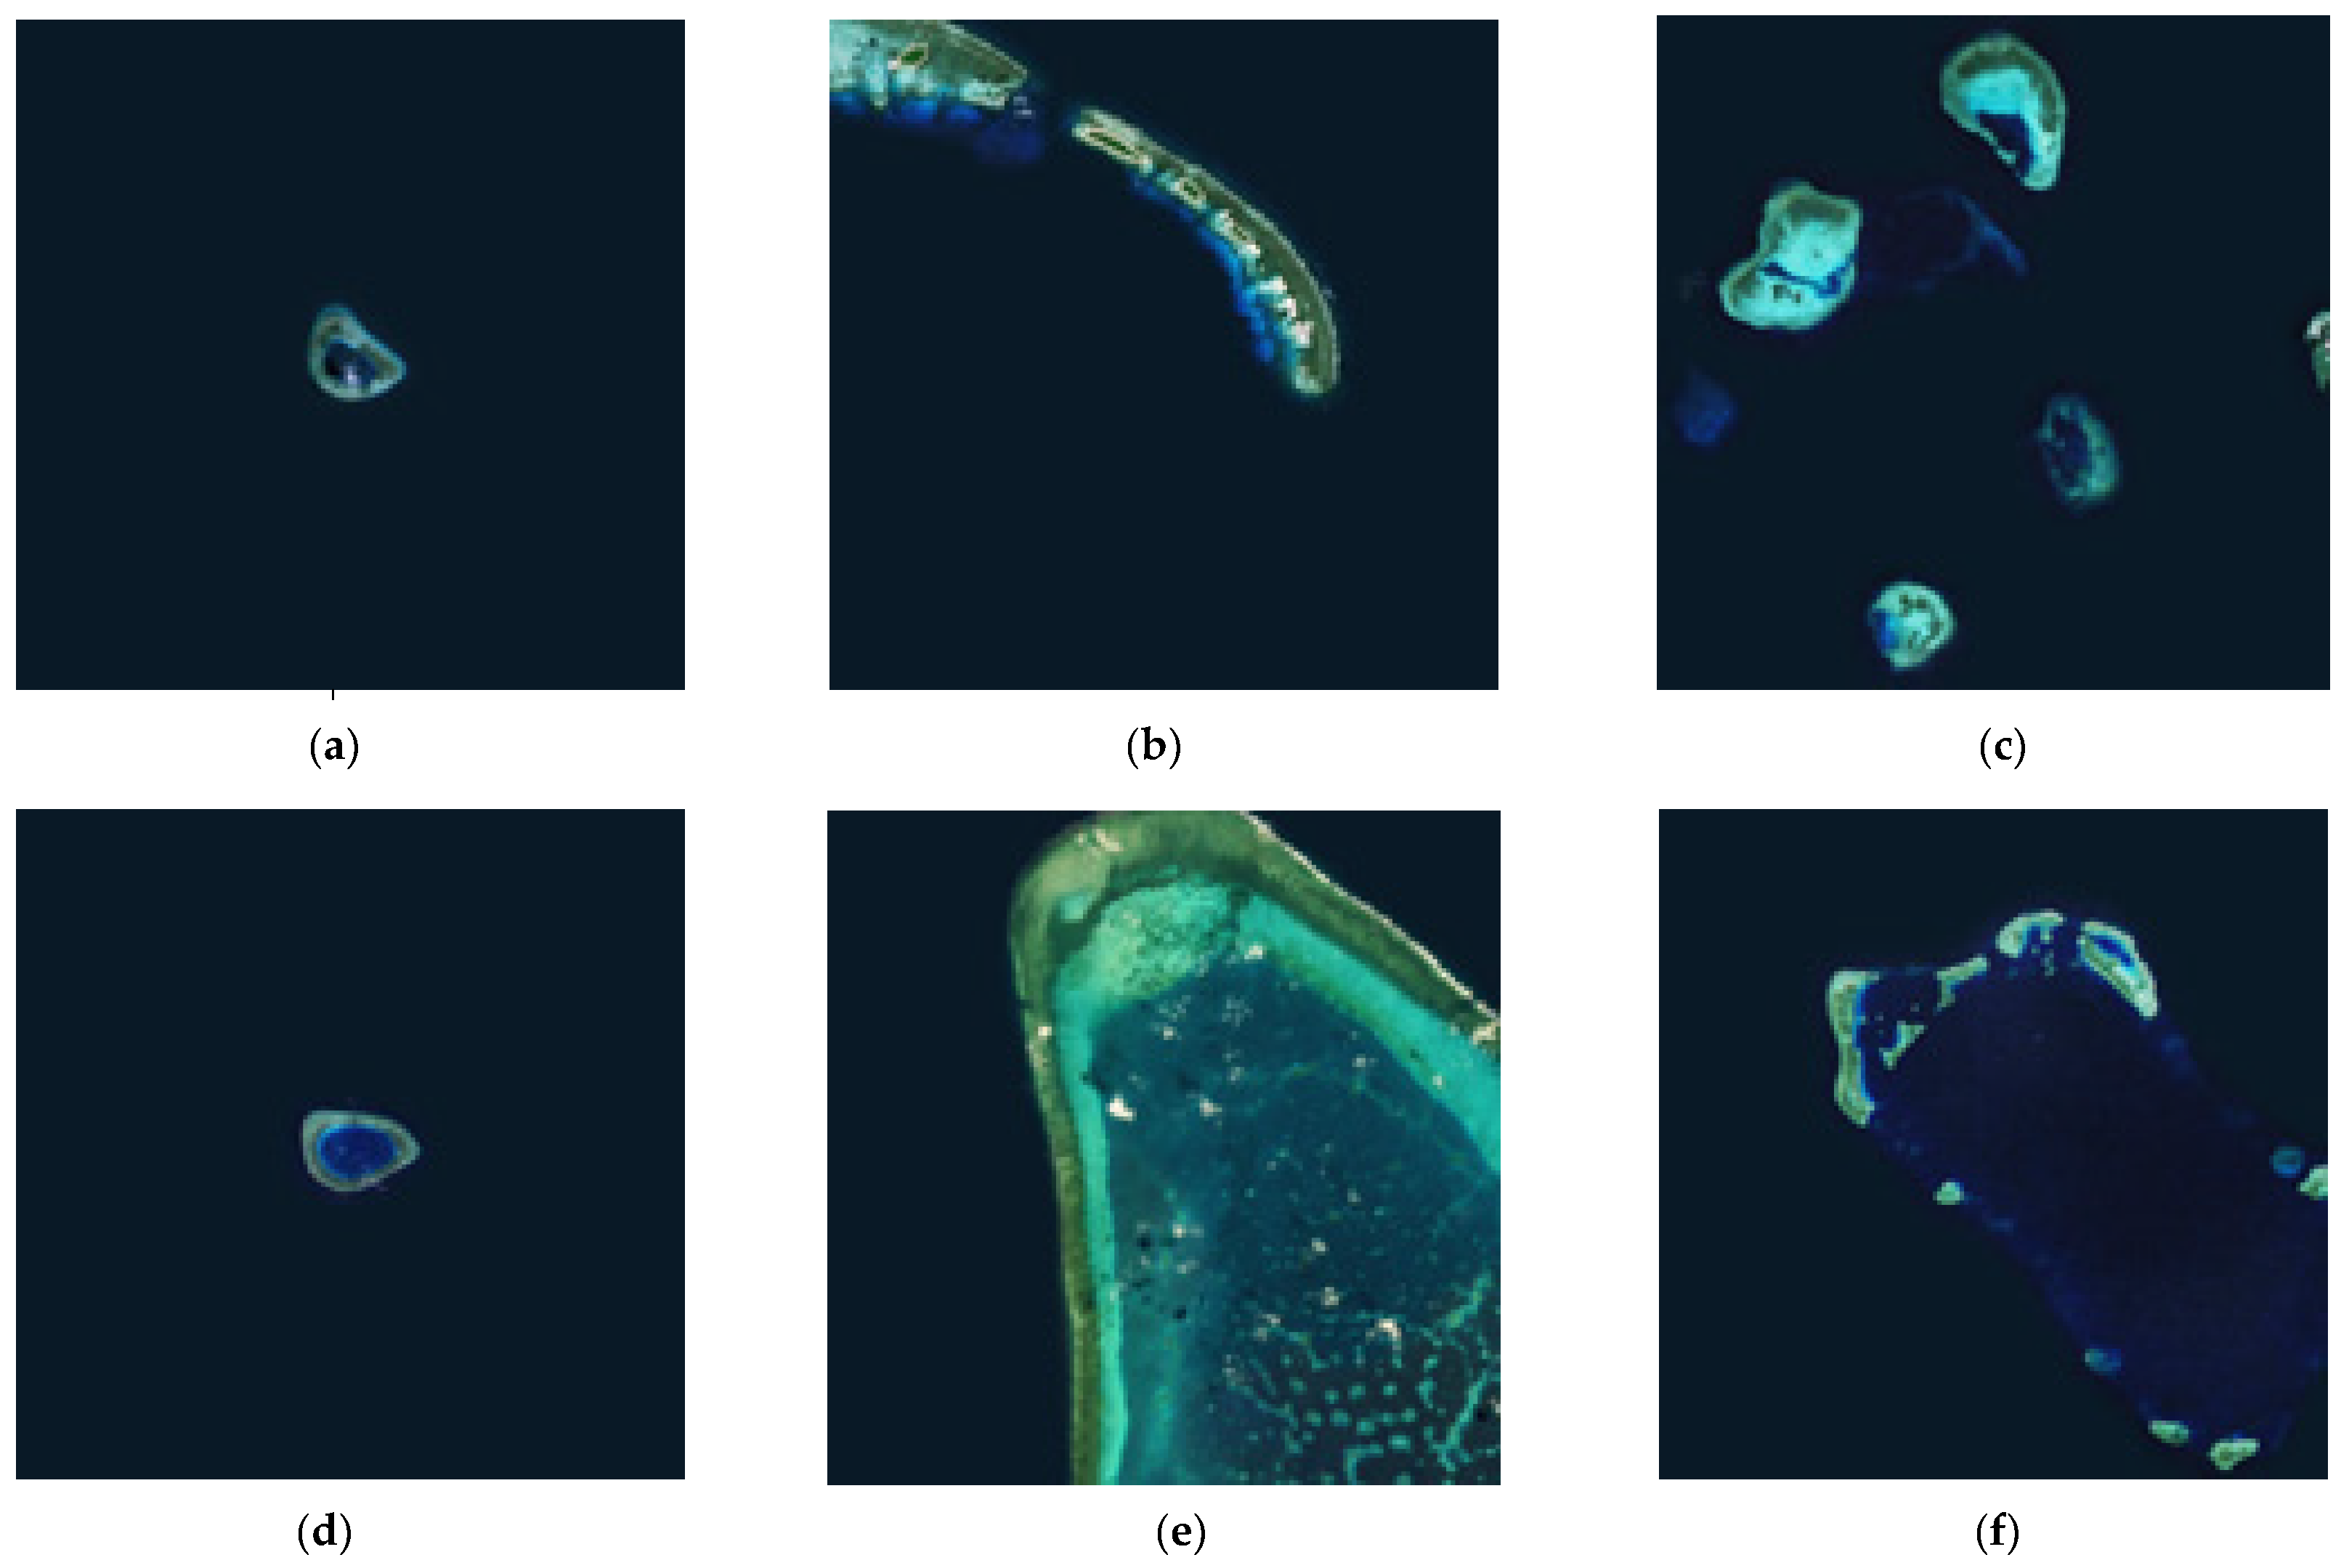
  • Type I (isolated island): The proportion of landmark image pixels constitutes less than 3% of the field of view. The edge is well-defined, with no adjacent islands. The landmark solely retains the geographic information of the central point of the island;
  • Type II (big island): The proportion of image pixels attributed to the landmark surpasses 3% in the field of view, exhibiting a clear shape. The landmark archives both the grayscale information of the image and the geographical coordinates of the image center;
  • Type III (multi-island): There are more than two islands within the viewing field. The landmark records the triangular “edge-edge-edge” information formed by the central position of the base island and any other two islands.
The study captures three types of landmarks at 5000 m in the Nanhai Sea area using ArcGIS satellite mapping. The typical images of these landmarks are illustrated in Figure 2.

2.2.2. Automatic Classification Model of Sea Area Landmarks

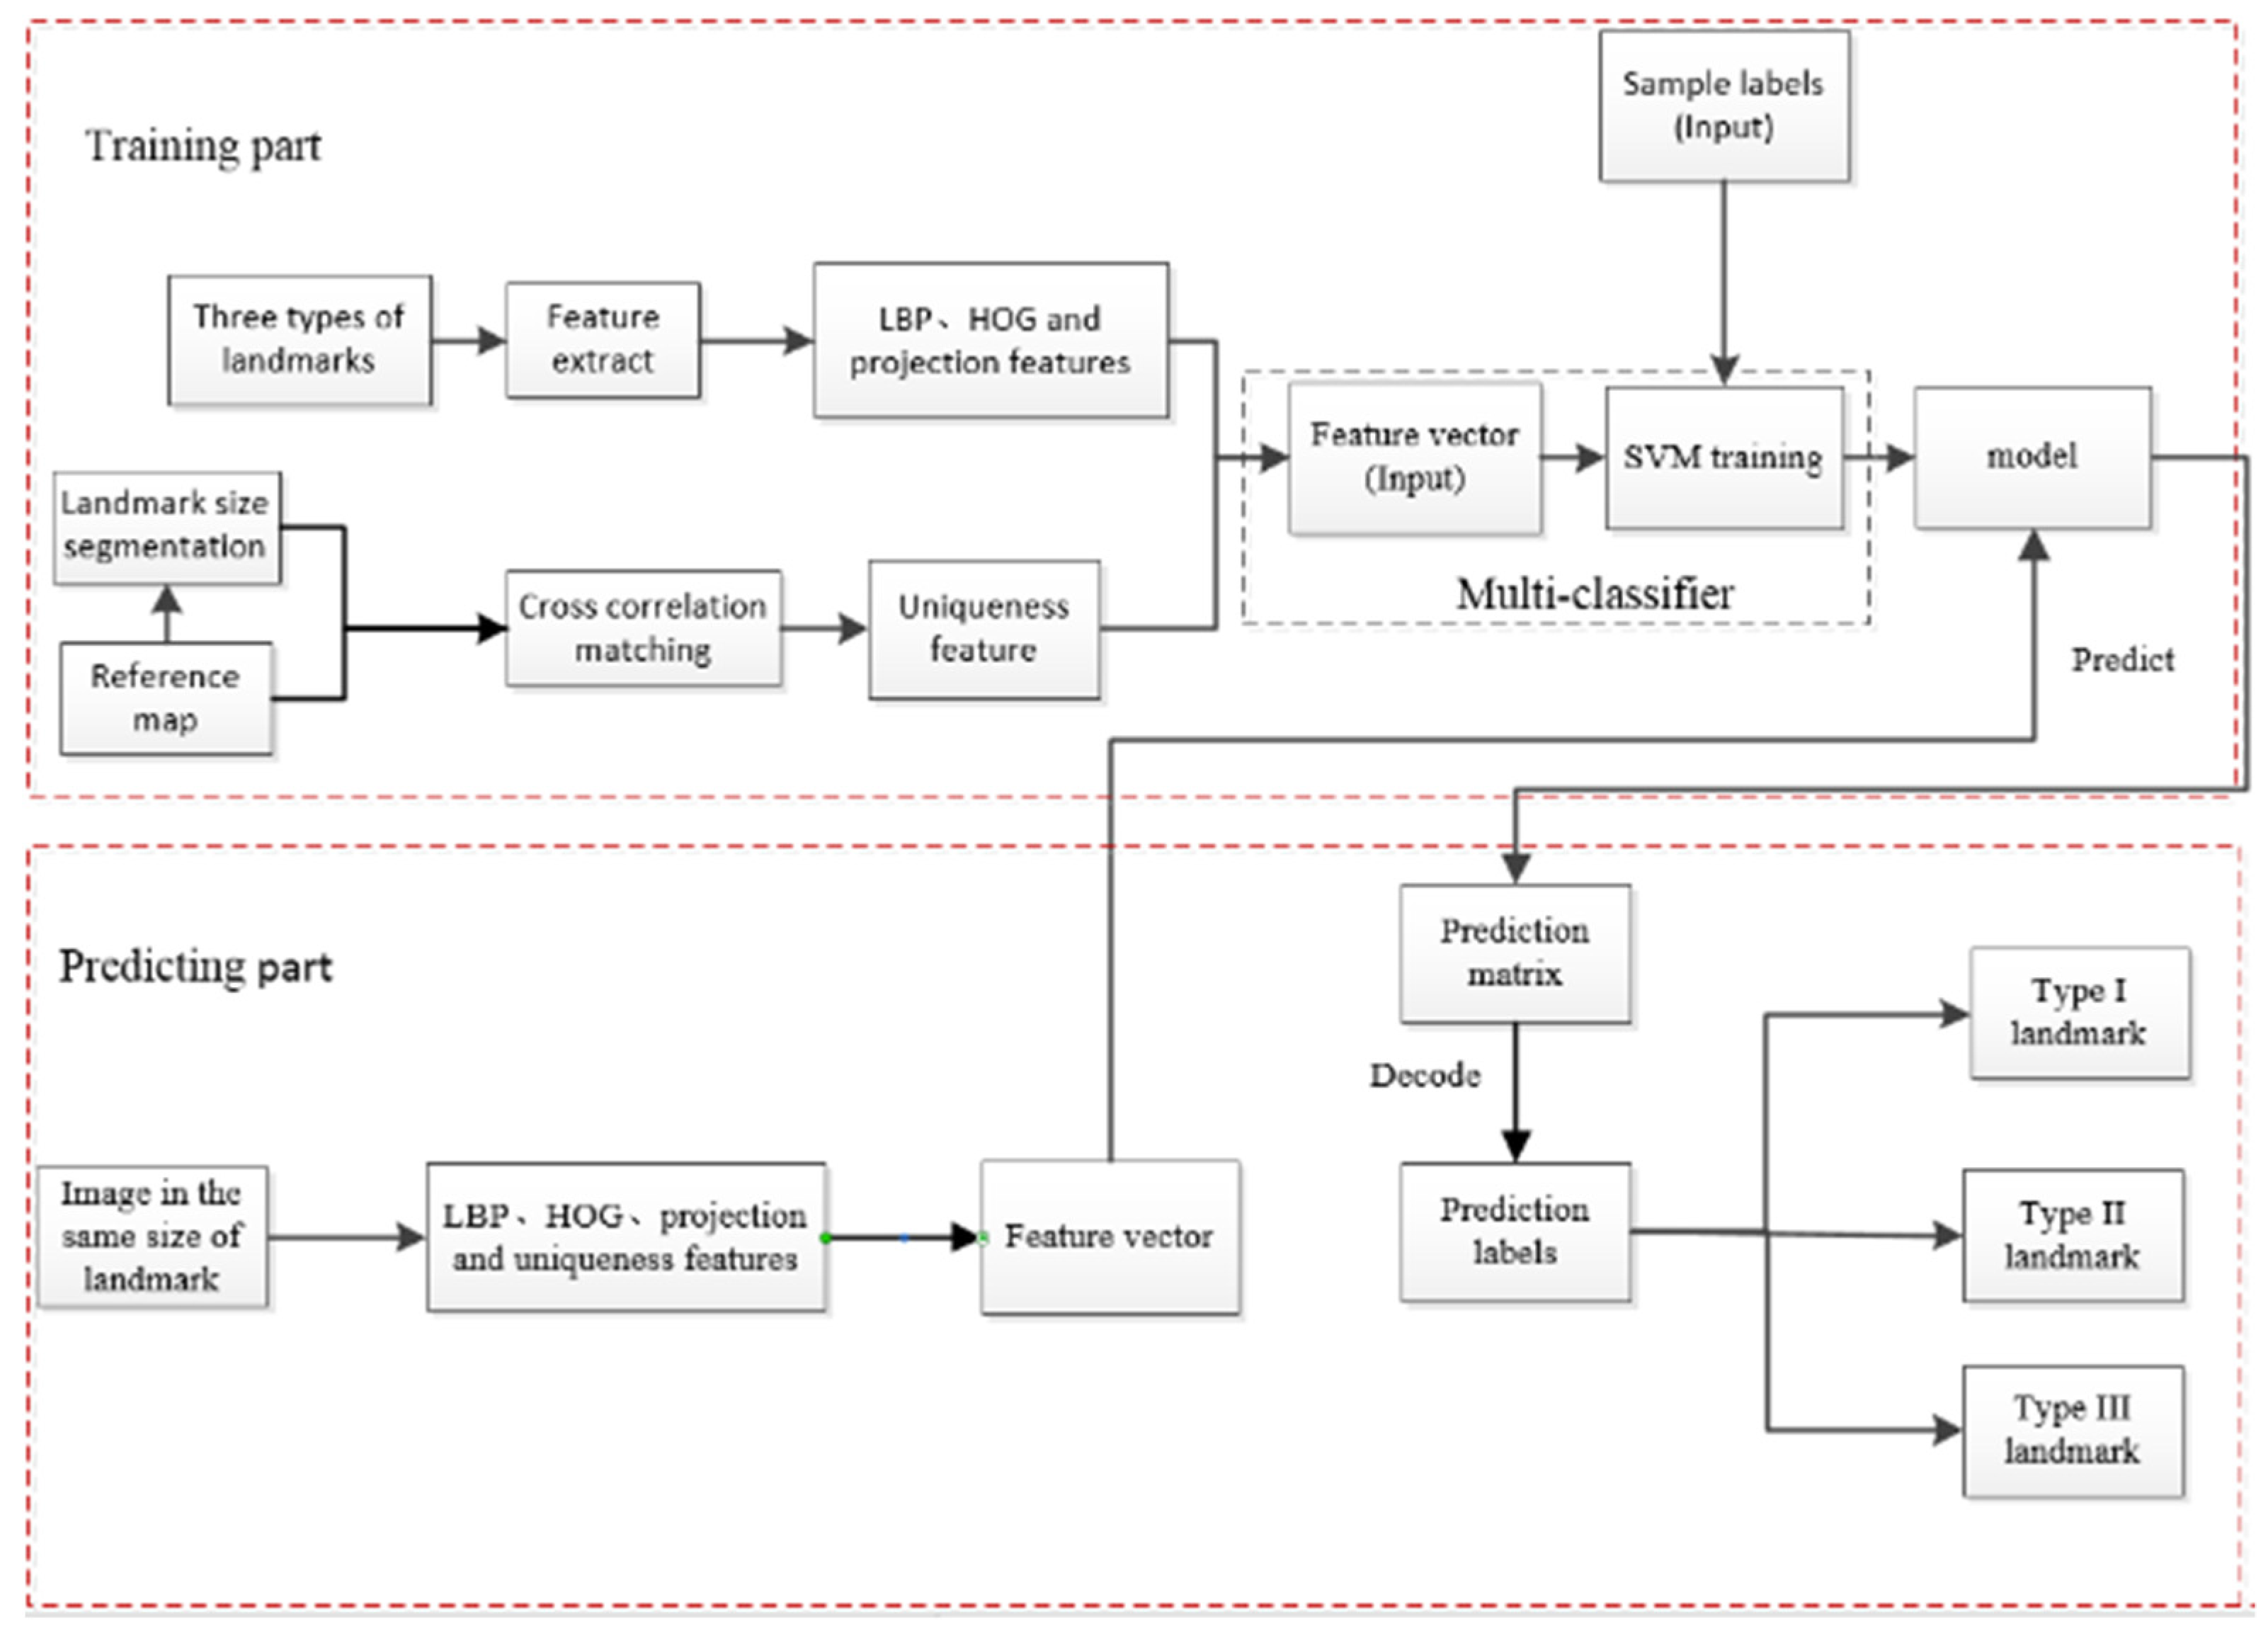
To accurately and succinctly portray the suitability of the landmark image [24], we employ a meticulous feature analysis of the sea area image. The HOG feature [36] is chosen to delineate the landmark’s significance, while the LBP [37] and projection features are utilized to characterize the landmark’s stability and richness. Additionally, we employ the peak sharpness of the normalized cross-correlation algorithm [38] to elucidate the uniqueness of Type I and Type II landmarks. For Type III landmarks, which exhibit an evident topological structure, a probability parameter for triangle matching [39] is constructed to articulate their uniqueness.
Subsequently, the uniqueness, LBP, HOG, and projection features of landmarks are extracted as learning vectors. Simultaneously, manually assigned landmark labels are fed into the SVM multi-classifier [40,41,42] for training purposes. This process culminates in the development of an automatic classification model for sea area landmarks, as illustrated in Figure 3.

2.2.3. Multi–Mode Matching Strategies of Sea Area Landmarks

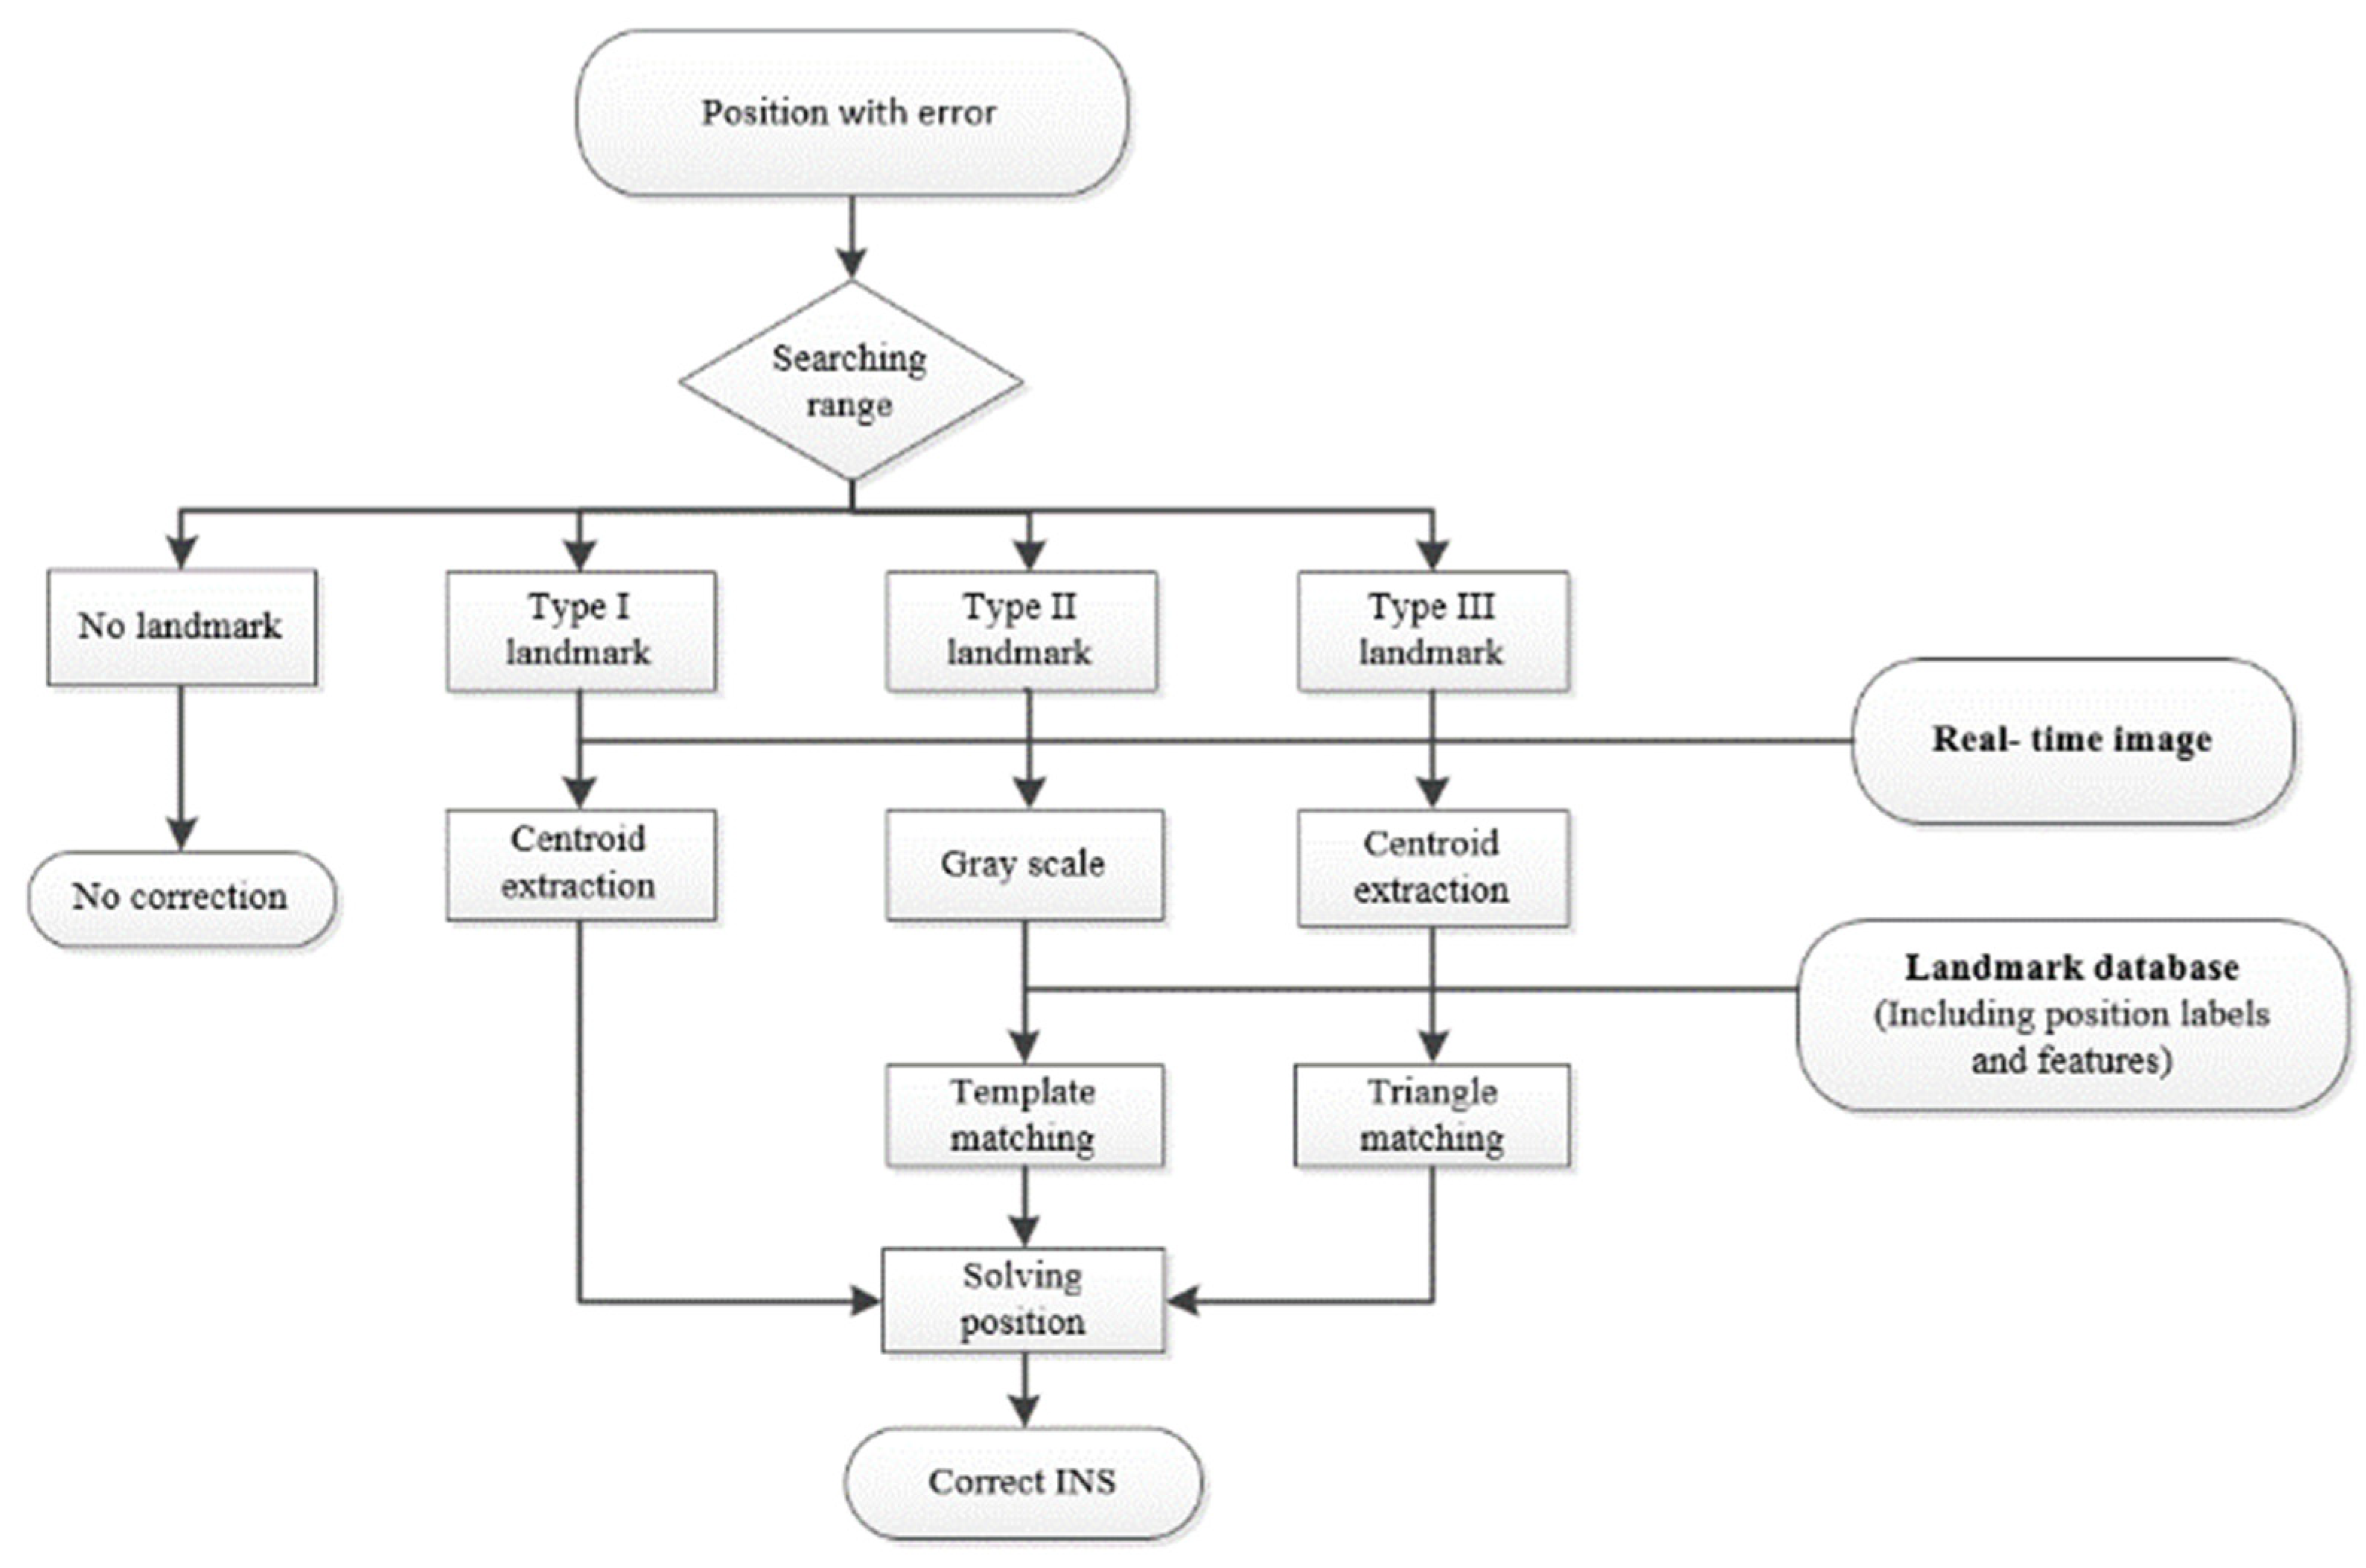
Different matching methods are employed for distinct categories of sea area landmarks, and the multi-mode matching strategies are outlined below:
  • Type I Landmarks: These landmarks, comprised of isolated islands without adjacent counterparts in the field of view, ensure the uniqueness of each landmark, obviating the need for matching. The detection of islands can be efficiently achieved through an image segmentation method [43]. Subsequently, the centroid of the island can be extracted using centroid extraction techniques [44], facilitating the determination of the aircraft’s current position;
  • Type II Landmarks: Utilizing a variable step template matching algorithm [45], the matching position between the landmark and real-time image is derived through the analysis of gray information. This approach is employed to calculate the current position of the aircraft;
  • Type III Landmarks: Introducing a consideration of the relative position relationship among islands, an “edge-edge-edge” information structure is formed by connecting the centroids of the three islands. This information is then employed for triangle matching [39,46], revealing the matching position between the landmark and real-time image, subsequently allowing for the computation of the aircraft’s current position.
The matching strategies for the three types of landmarks are shown in Figure 4.

2.2.4. Usability Evaluation Algorithm of Sea Area Landmarks

1.
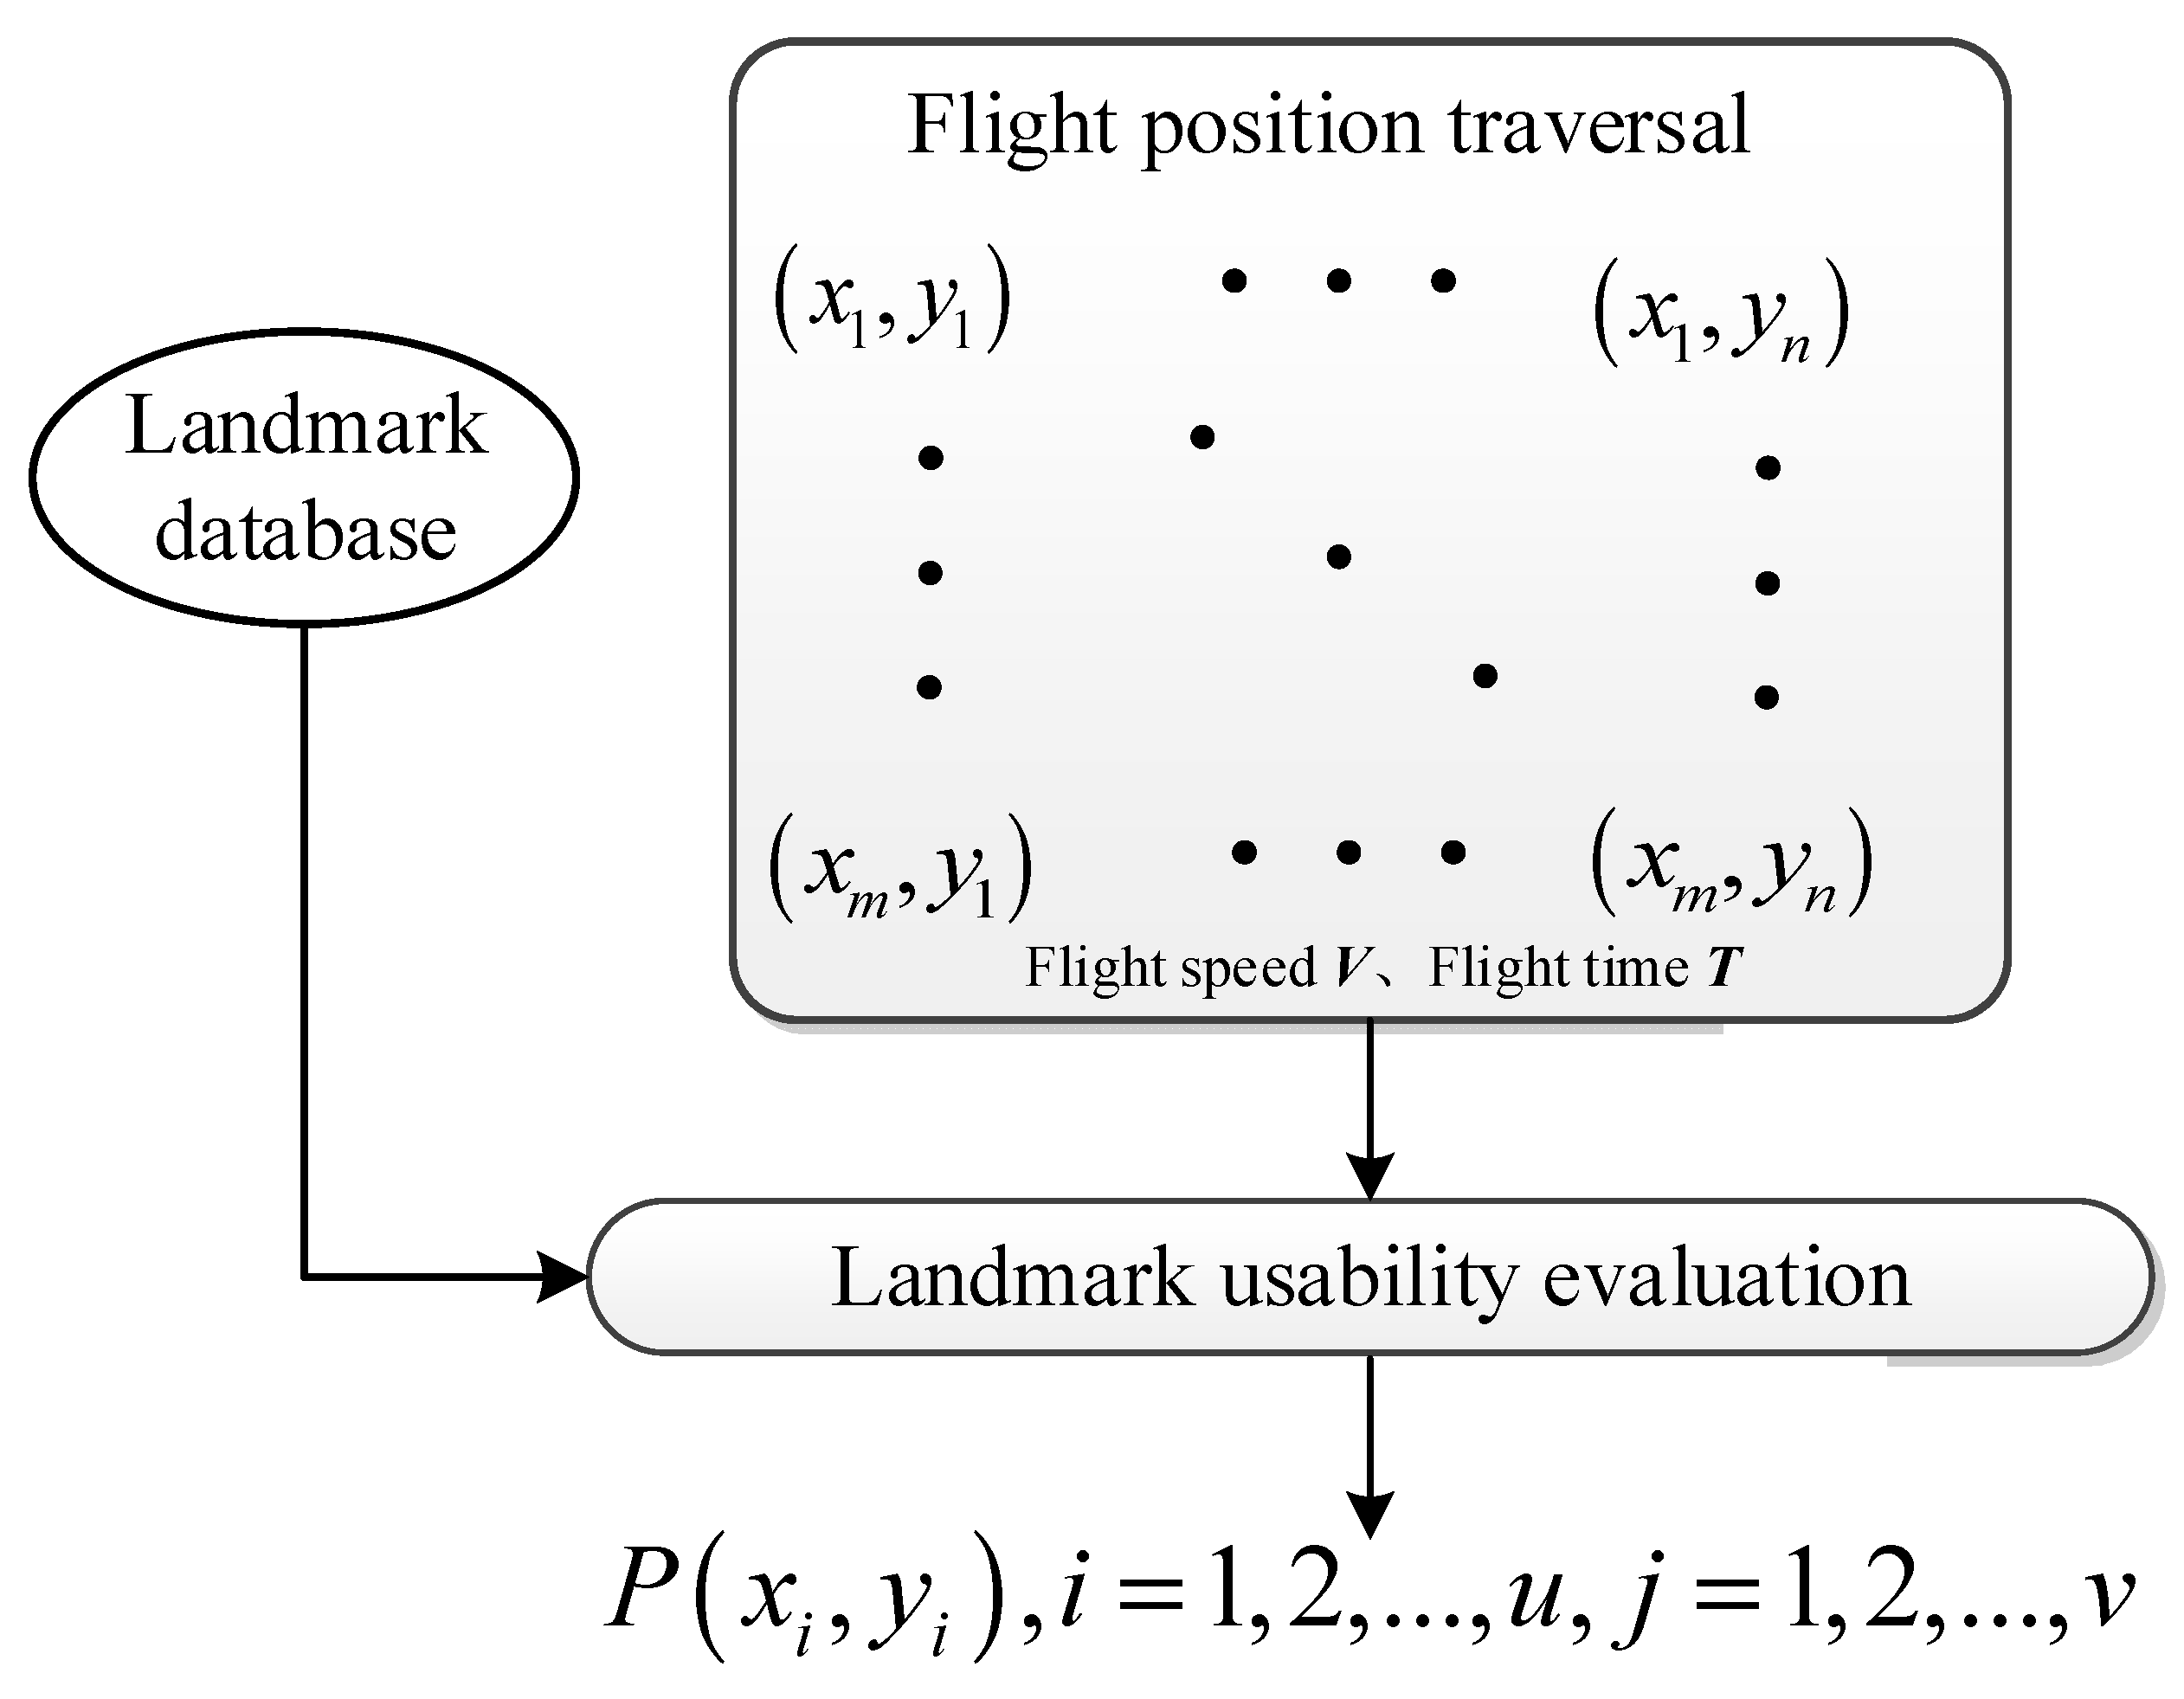
Algorithm framework
The schematic representation of the landmark usability evaluation can be observed in Figure 5. When the aircraft is in the sea area flight zone at a certain position x i , y j as the initial flight point, the landmark database is preprepared to include the positions and sizes of all landmarks in the sea area flight zone. Given that the aircraft typically travels along a uniform straight path while seeking landmarks during flight, it can be approximated that the aircraft moves uniformly in a straight line within a horizontal projection plane at a designated flight altitude H and speed V . To ensure the observation of landmarks within a specified flight duration, denoted as flight time T , the likelihood of the aircraft sighting landmarks within this timeframe at the current position is defined as P x i , y j . For the entirety of the sea area map, the probability of sighting landmarks at each position can be delineated by P x i , y j ,   i = 1 , 2 , u ,   j = 1 , 2 , , v , enabling the construction of a probability cloud map model P u v i , j = P x i , y j ,   i = 1 , 2 , , u ,   j = 1 , 2 , , v encompassing all positions within the sea area flight zone. This model serves as a foundational element for evaluating the usability of landmarks within the sea area.
2.
Calculation of landmark visible range
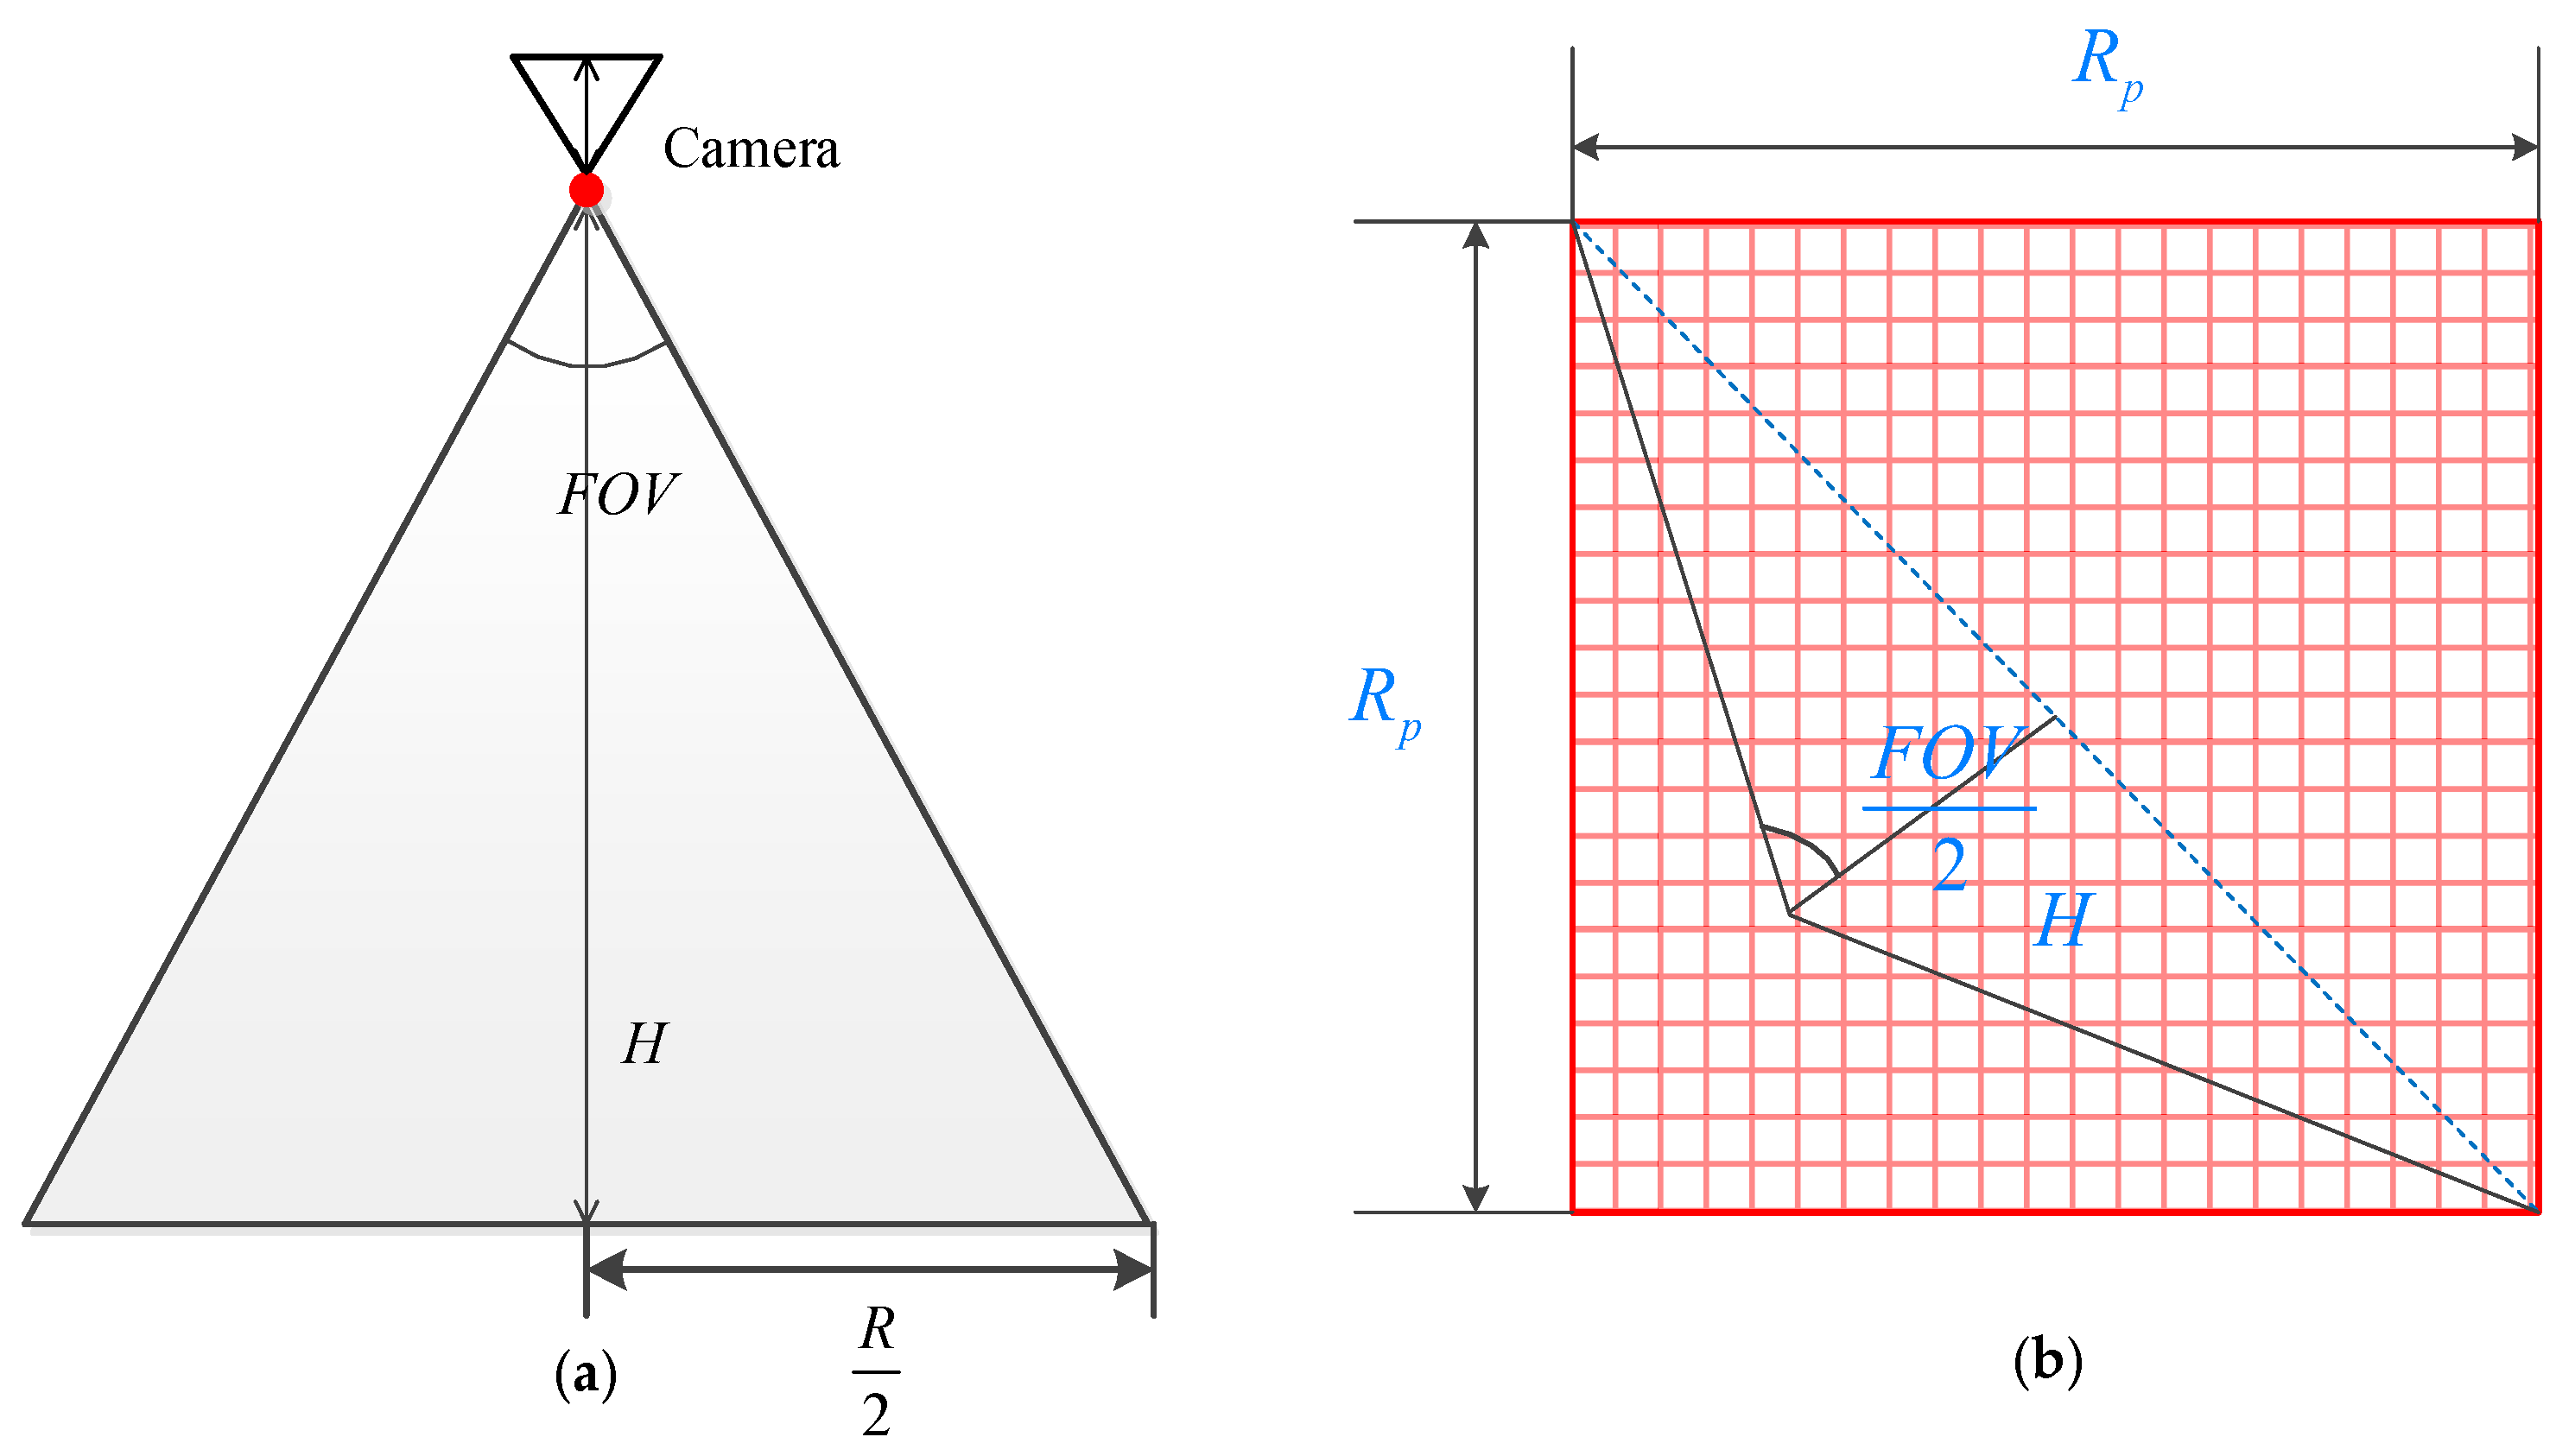
The visual range captured by the aircraft’s camera is depicted in Figure 6a, correlating with the aircraft’s flight altitude of H . Assuming a square-shaped field of view for the camera, the angle of the field of view measures F O V = F O V x = F O V y , and the side length R of the square field of view range is
R = 2 H tan F O V / 2
Given an assumed flying altitude of the aircraft, denoted as H 5000 m, and a camera resolution size of R p × R p   pixel 2 , the landmarks stored within the database are assumed to be square-shaped, comprising r p × r p   pixel 2 and are prepared at the specific height H = 5000 m; the corresponding resolution of these landmarks is p = 2 5000 tan F O V / 2 / R p , as shown in Figure 6b.
The geographical size of the landmark is r × r , here
r = r p 2 5000 tan F O V / 2 / R p
The matching probability between the landmark and real-time image is p r l , where l = 1 , 2 , 3 is the category of the landmark. As the aircraft flies at different altitudes, symbolized by H , the corresponding ground resolution p is different. The relationship is expressed in Equation (14).
p = 2 H tan ( F O V / 2 ) / R p
Due to the preparation of the landmark image at H = 5000 m, when the flight altitude H exceeds 5000 m, as shown in Equation (14), the resolution of the real-time image experiences a decline. Consequently, it becomes imperative to proportionally scale the landmark image to ensure its resolution aligns with that of the real-time image. Subsequently, the scaled landmark is matched with the real-time image. As shown in Equation (12), the geographic size R × R of the real-time image is solely dependent on the flight altitude H and the field of view angle F O V , while the geographic size r × r of the landmark remains constant as shown in Equation (13). The reduction in the ground resolution of the landmark image is a direct consequence of the scaling process. When the flight altitude H surpasses 5000 m, the matching probability between the landmark and the real-time image is lower than that of H = 5000 m.
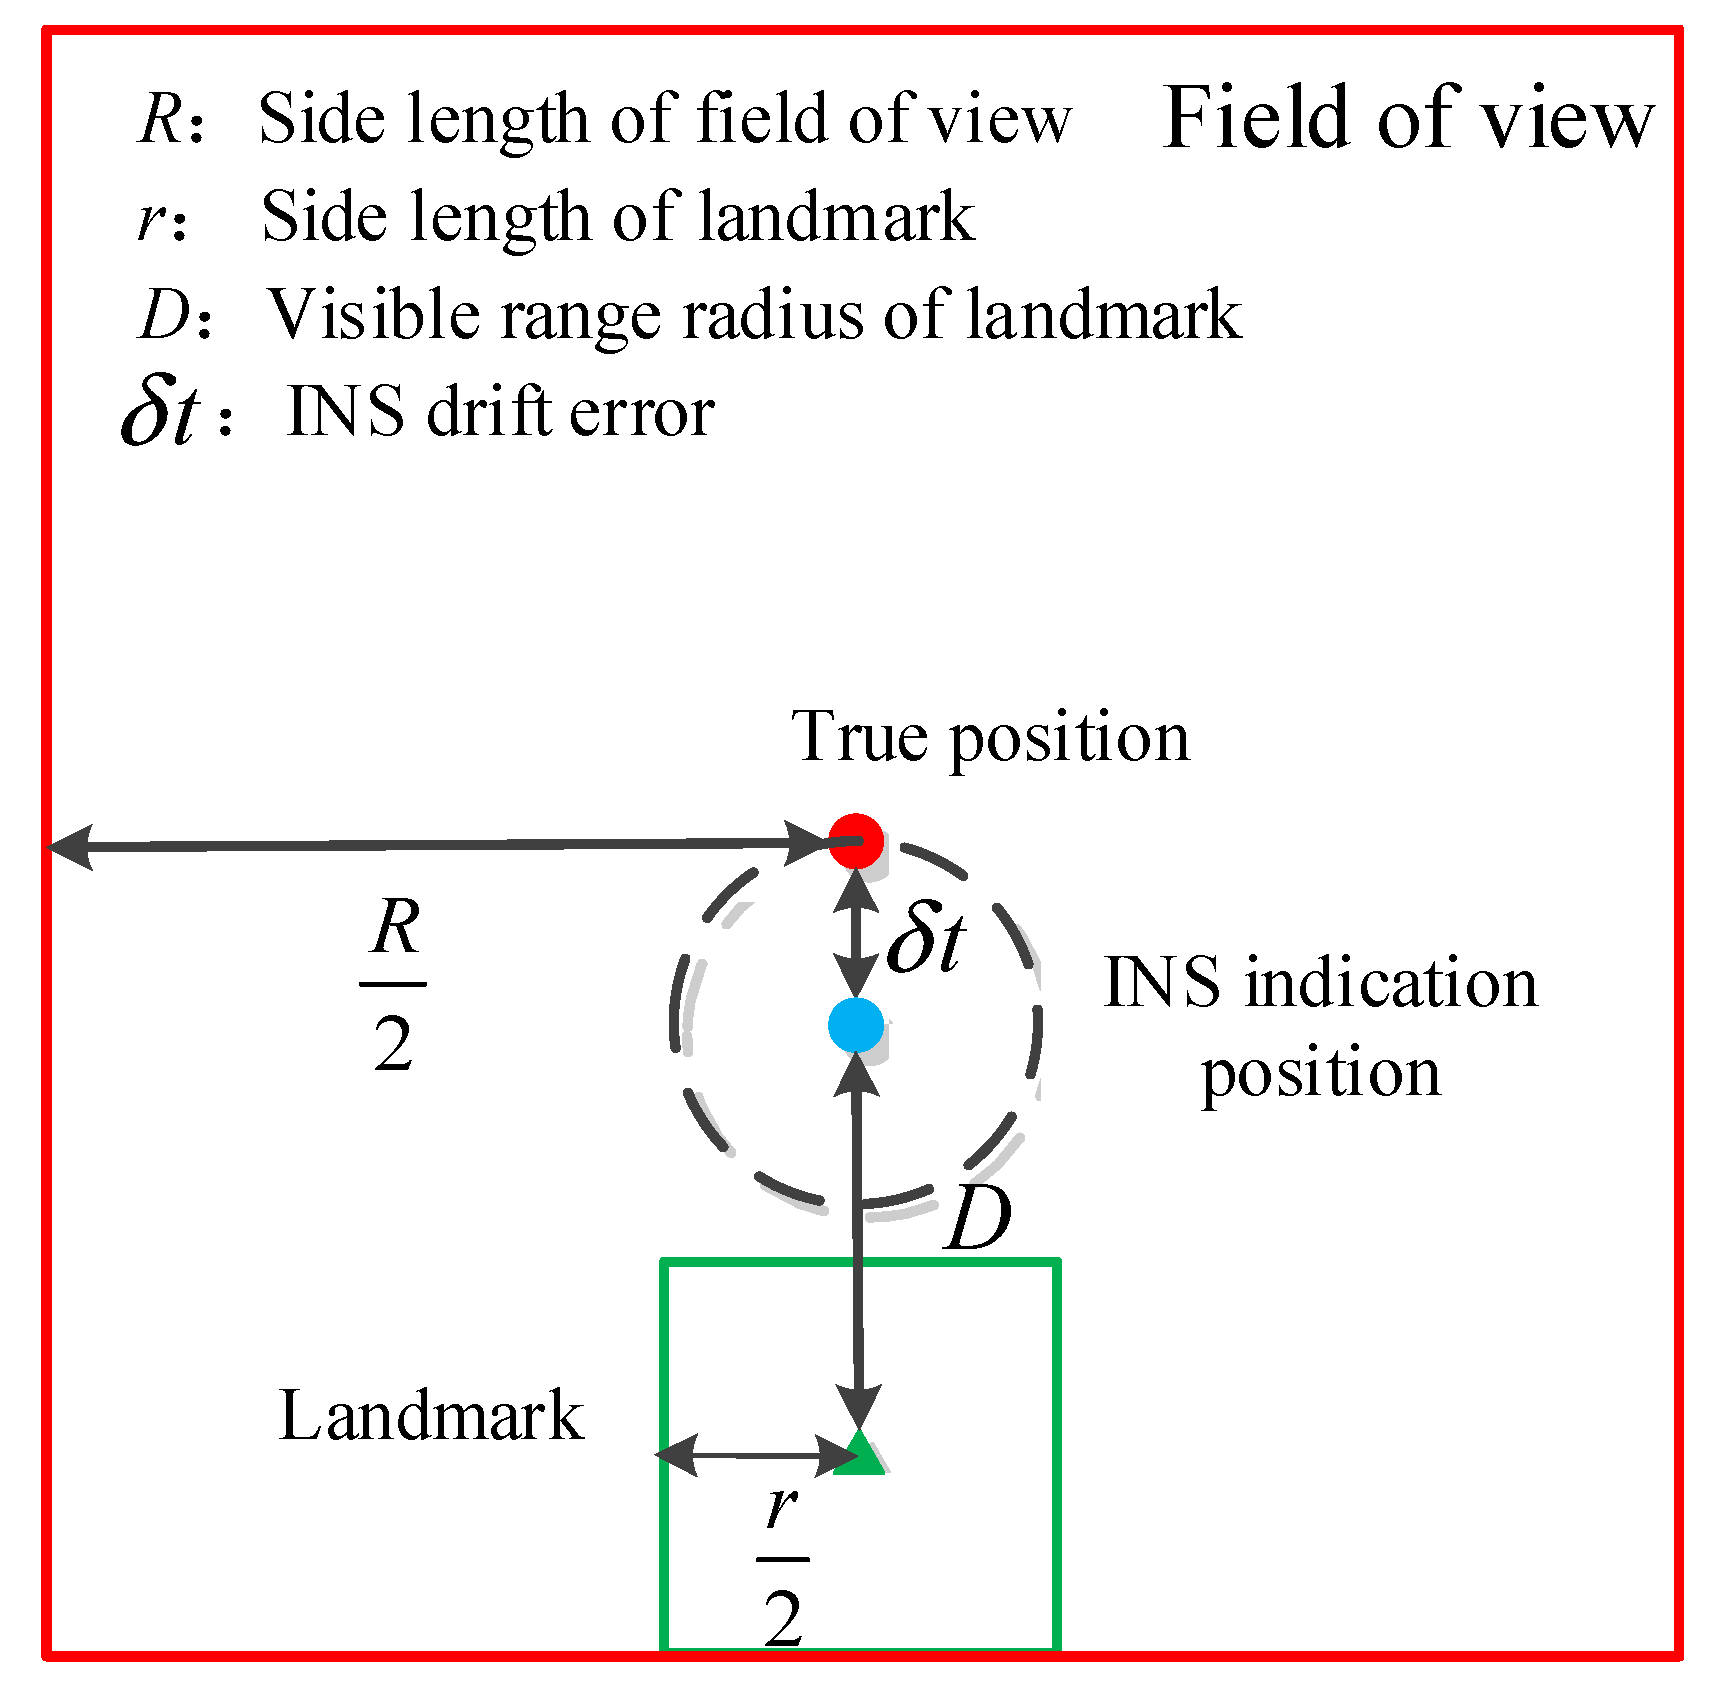
The visible range of the landmark is illustrated in Figure 7, with a radius denoted as D. The green square with size r × r represents the geographical range of the landmark and is accompanied by a green triangle signifying its central position. The red square represents the aircraft’s field of view, with a red dot pinpointing its center. The size of the field of view is notated as R × R . Additionally, the blue dot corresponds to the position designated by the INS, and δ t denotes the INS’s drift error size. This drift error is contingent upon the hourly drift size δ of INS and the duration of time t required for the aircraft to approach the landmark.
δ t = δ t
The radius D of the visible range of the landmark is calculated as follows
D = R 2 r 2 δ t
3.
Calculation of landmark observable probability
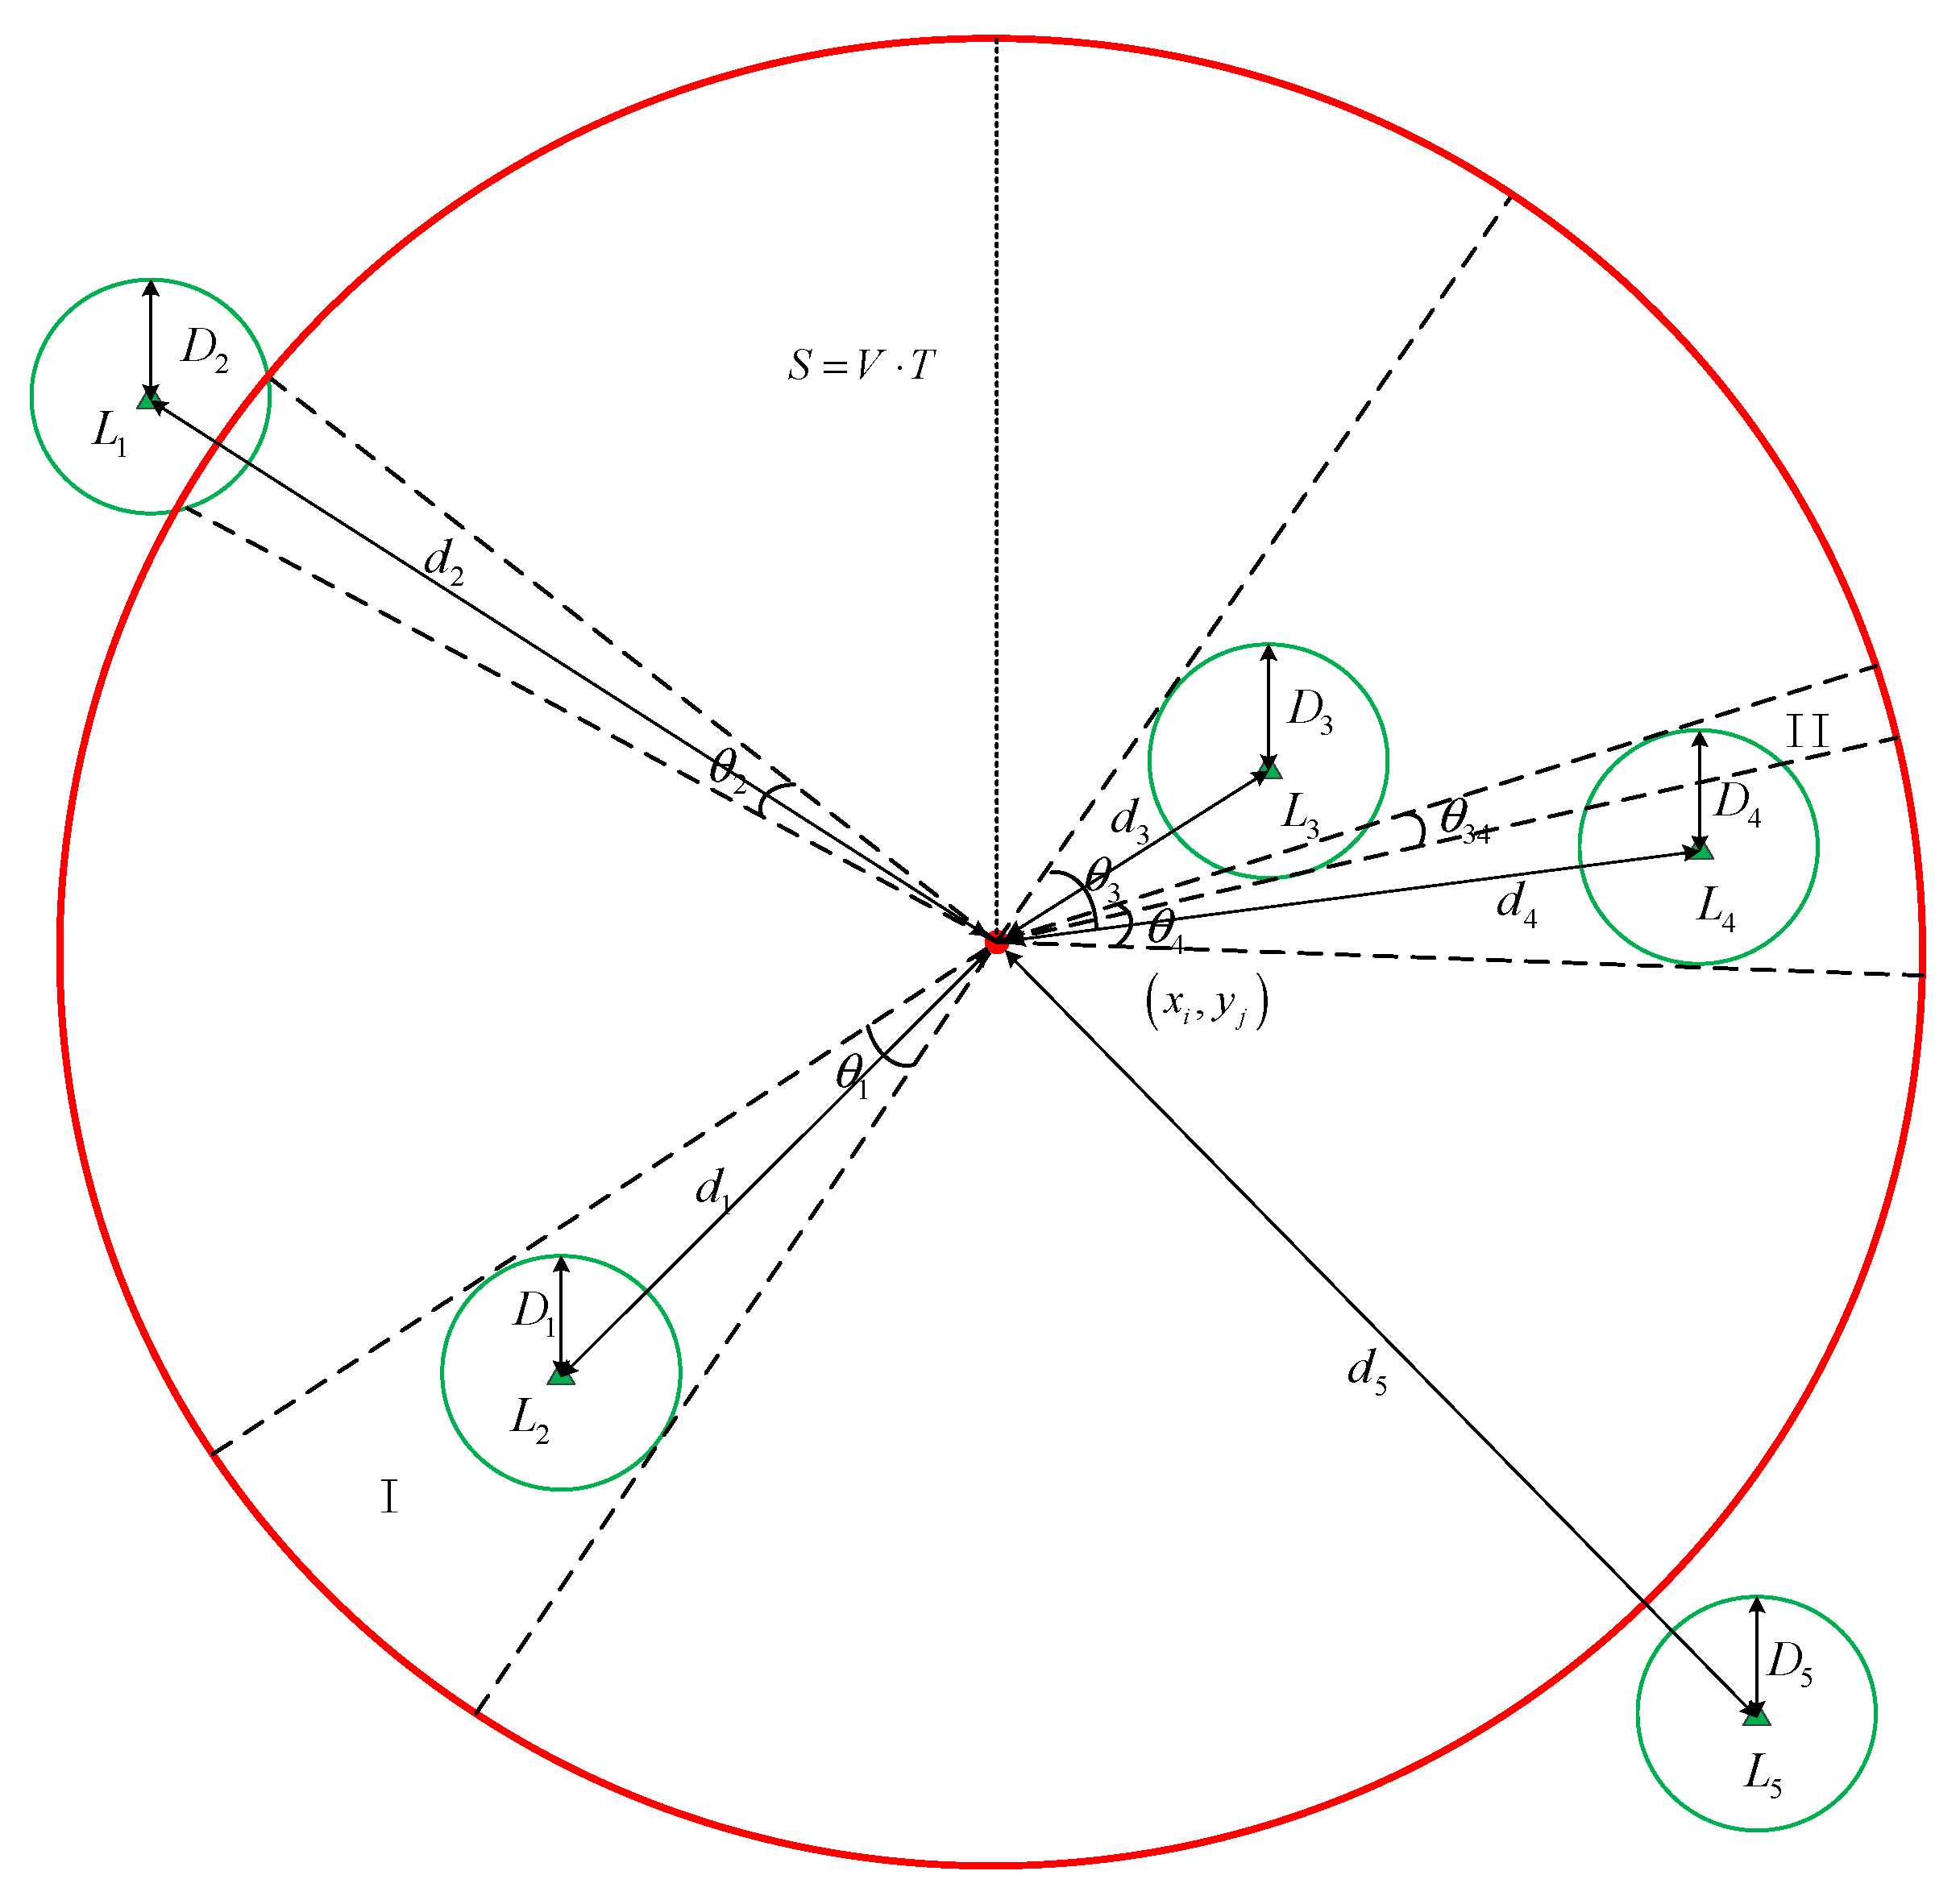
From the above section, the radius defining the observation range concerning a specific landmark L k is denoted as D k . Figure 8 illustrates the relative correlation between a particular spatial position and the observable area of the landmark.
Here, the red circle x i , y j denotes a specific initial spatial position of the aircraft, while the green triangle represents the center position of landmark L k . The green circle delineates the observable range of landmark L k , V is the flight speed, T is the longest flight time, and S = V T corresponds to the furthest distance covered during this period, with its scope indicated by the red circle. θ k denotes the observable angular range of the landmark L k . It is assumed that the aircraft can traverse landmark L k within the time T when the aircraft’s heading angle falls within the interval of θ k . The probability of successfully navigating through landmark L k is given by
P x i , y j | k = p r k l θ k 2 π
where θ k represents the angular range wherein the aircraft enters into the observable range of landmark L k within the time T , and p r k l signifies the matching probability of the landmark L k . The variable θ k is related to the Euclidean distance d k between a spatial point x i , y j and landmark L k , the flight limit distance T of the aircraft over time T , and the observable range radius D k corresponding to each landmark L k , which can be succinctly expressed as follows
θ k = 2 π ,             d k < D k 2 arcsin D k d k ,       D k d k < D k 2 + S 2 2 arccos d k 2 + S 2 D k 2 2 d k S ,   D k 2 + S 2 d k < D k + S 0 ,             d k D k + S
Given that the observable angle range θ k of multiple landmarks may intersect, for instance, the overlapping range of area θ 3 and θ 4 in Figure 8 is θ 34 , it becomes imperative to account for the correlation between landmarks. Consequently, the probability of a spatial point x i , y j traversing any observable landmark can be expressed as follows
P x i , y j = n = 1 N λ n 2 π
where λ n represents the likelihood of the aircraft descending within the N angular intervals ( ϕ n , n = 1 , 2 , N , N K ) of the local standard observation range at time T . When the angle interval is a single set ( ϕ n θ k ), as shown in region I in Figure 8, the likelihood can be defined as
λ n = p r k l θ k
When the angle interval is the intersection of multiple sets ( ϕ n θ 1 , θ 2 , , θ m ), as shown in area II in Figure 8, the likelihood can be expressed as
λ n = p r k l θ k
where m denotes the count of visual landmarks encompassed within the angular interval ϕ n .
From Equations (19)–(21), we traverse each position in the sea space, calculate the probability of observable landmarks in time T , and finally prepare the probability cloud map P u v z
P u v z i , j = P x i , y j , i = 1 , 2 , , u , j = 1 , 2 , , v
Here
z = 1 ,   Type   I   landmarks 2 ,   Type   II   landmarks 3 ,   Type   III   landmarks A l l ,   All   landmarks

2.3. Cloud and Fog Model

In this section, we construct a cloud and fog model to assess their impact on CNS during flight. The Nanhai Sea covers an approximate area of 2,000,000 km2. The data influencing cloud variation are derived from the monthly average observations recorded throughout the entire year in the Nanhai Sea.

2.3.1. Area and Size Model of the Cloud and Fog Area

The classification of clouds is based on 130 related parameters, such as cloud cover, cloud top pressure, cloud optical thickness, etc. The clouds can be divided into three types by the cloud top pressure: low cloud above 680 HPA, middle cloud between 680 HPA and 440 HPA, and high cloud below 440 HPA. According to the data [47], the height of the low cloud top is 3 km, the height of the middle cloud top is 7 km, and the height of the high cloud top is 12 km, which are regarded as random distribution. The thickness of the low cloud is 1 km, the thickness of the middle cloud is 3 km, and the thickness of the high cloud is 6 km. Each of the three types of clouds takes 50 sample points to scatter, and the sample points are regarded as a cuboid model, regardless of cloud overlap. The radius of cloud area is reckoned by the average value of cloud cover in different seasons.
It is assumed that the radius of cloud sample points follows the normal distribution N ( μ 1 , σ 1 2 ) , set σ 1 = 10 km. The cloud regional radius model is truncated according to the Pauta criterion, and the distribution of cloud radius with seasonal variation at different heights is obtained, as shown in Table 1.
It is assumed that the height of fog is uniformly distributed in the range of 240 m–530 m. The Nanhai Sea fog area is 200,000 km 2 according to the data [48]. We take 100 sample points to scatter randomly, and the sample points are regarded as a cuboid model. It is assumed that the radius of fog sample points follows a normal distribution N ( μ 2 , σ 2 2 ) , set σ 2 = 5 km. The fog regional radius model is truncated according to the Pauta criterion, and the distribution of cloud radius is in [29.72 km, 59.72 km].

2.3.2. Moving Model of Cloud and Fog Area with Time

It is assumed that the area of the cloud and fog remains unchanged during the moving process, and the cloud and fog moving can be regarded as a point moving. The point is located at the center of the cloud and fog cuboid model, and the model movement is replaced by the movement of the model center. After the movement of the model center, the cloud and fog cuboid model is constructed at the next position. The moving direction of the model is at the local geographic coordinate and α is the angle between the cloud movement vector and the east direction. The direction of the angle α is calculated counterclockwise from east direction.
The moving speed and direction of cloud and fog are affected by the sea breeze. According to the statistics of seasonal characteristics of sea surface wind field in the Nanhai Sea in the last 10 years, the moving speed and direction of the cloud and fog are obtained, as shown in Table 2.

2.3.3. Design of Weather Simulation Model

The weather setting simulation program function module is mainly composed of two parts. The first part is the data generation module, the input parameters are the season (1 is spring; 2 is summer; 3 is autumn; 4 is winter) and timeout (field of view output interval).
When selecting different seasons, corresponding to different cloud side lengths, moving speeds, and moving directions, when entering a certain flight time, the longitude and latitude position and direction of each cloud will change every certain timeout, so the data output is
  • Center position of cloud and fog;
  • Side length, moving speed and direction of cloud and fog.
At the same time, we access the second part of the program, that is, the field of view generation module. First, we input the following parameters
  • Camera parameters: latitude, longitude, and altitude of the camera, the distance from the camera to the field of view;
  • Parameters of cloud and fog: longitude and latitude of cloud and fog center, type of cloud and fog, and side length of cloud and fog.
We analyze individual cloud and fog entities and process the input longitude and latitude information for both cloud and fog, as well as camera coordinates. We convert the relative longitude and latitude of the cloud and fog positions and camera position into relative distance (unit: m), utilizing camera coordinates as the origin. Subsequently, we assess whether the cloud is positioned above or below the camera, taking into account the cloud type and the camera’s elevation. Additionally, we evaluate the relative distance between the cloud and the camera to ascertain whether the cloud and fog obstruct the camera view. If affirmative, document the intersection of the cloud and fog with the camera view and incorporate this information into the image. Therefore, the output is
  • The intersection matrix between the camera field of view and the cloud and fog;
  • The two composite images obtained by overlaying clouds and fog onto the upper and lower field of view of the camera;
  • Matrix describing the cloud and fog coverage (parameter 00 represents no coverage of the camera by clouds and fog, 01 represents full coverage of the camera’s upper field of view by cloud and fog, 10 represents full coverage of the camera’s lower field of view by cloud and fog, 21 represents partial coverage of the camera’s upper field of view by cloud and fog and 22 represents partial coverage of the camera’s lower field of view by cloud and fog).
According to the weather model, the influence of cloud and fog obstruction on the aircraft’s field of view can be determined under different climatic conditions. This helps to assess whether a sufficient number of navigation satellites can be observed to enable CNS. When CNS is available, CNS measurements can be extracted based on the information of observed navigation satellites, assisting INS in integrated navigation positioning, as described in Section 2.1.

3. Results

3.1. Automatic Classification and Matching Algorithm of Three Types of Landmarks

  • Landmark automatic classification
The ArcGIS satellite image covering the Nanhai Sea area (specified by north latitude 2 ° 20 ° , east longitude 108 ° 118 ° ) is utilized to establish the landmarks at the flight altitude H = 5000 m. The image resolution is 19.11 m/pixel, and the landmark image size is 750 pixel × 750 pixel. The landmark database includes 35 Type I landmarks, 369 Type II landmarks, and 166 Type III landmarks. In total, 90% of them are selected as training samples and the remaining 10% serve as prediction samples for algorithm validation. According to the automatic classification model of sea area landmarks designed in Section 3.2, the samples for training include 3 Type I landmarks, 30 Type II landmarks, and 16 Type III landmarks. A total of 49 images are put into the model for prediction. The results are shown in Table 3.
As shown in Table 3, the prediction accuracy for Type I landmarks is 100%, because the Type I landmarks are mostly isolated islands, which can easily be distinguished compared to the Type II and Type III landmarks. The prediction accuracy for Type II landmarks slightly surpasses that of Type III landmarks, with all of the accuracies registering above 90%.
2.
Landmark matching algorithm
The image size of the real-time image is 1000 × 1000 pixel2, and the camera field of view angle is F O V = 96 . The flight altitude of the aircraft is set as H = 5000 m, H = 7500 m, and H = 10,000 m. The landmark database is prepared by the above experiment, it is assumed that the landmark image noise follows a normal distribution N ( μ , σ 2 ) ; we set μ = 0 , σ = 0.1 , and set the threshold of matching accuracy to a b s = 2   pixel . If the matching error is less than the threshold, it is considered that the matching is successful. The matching probability is the proportion of successful landmark matching to the total matching number. We calculated the matching probabilities for 35 Type I landmarks, 369 Type II landmarks, and 166 Type III landmarks at three different heights using different matching algorithms proposed in Section 2.2.3. The results are shown in Table 4.
As shown in Table 4, at H = 5000 m, the matching probability for the Type I landmarks is 1, because of the uniqueness of the Type I landmarks by definition which only need extraction of the centroid of the landmark image. The matching probability for the Type II landmarks is 0.8826, and the Type III landmarks is 0.932. This discrepancy arises from the fact that the matching algorithm for Type II landmarks utilizes gray information from the image, which is more susceptible to noise. Conversely, the matching algorithm for Type III landmarks relies on topology information from the islands in the image, proving less affected by noise. Since all landmarks are prepared at the flight altitude of H = 5000 m, when flying at an altitude of H = 7500 m or H = 10,000 m, it is necessary to scale the landmarks to their corresponding scale and match them with the real-time image, which will introduce additional scaling errors, leading to a reduced matching probability compared to H = 5000 m.

3.2. Landmark Usability Evaluation

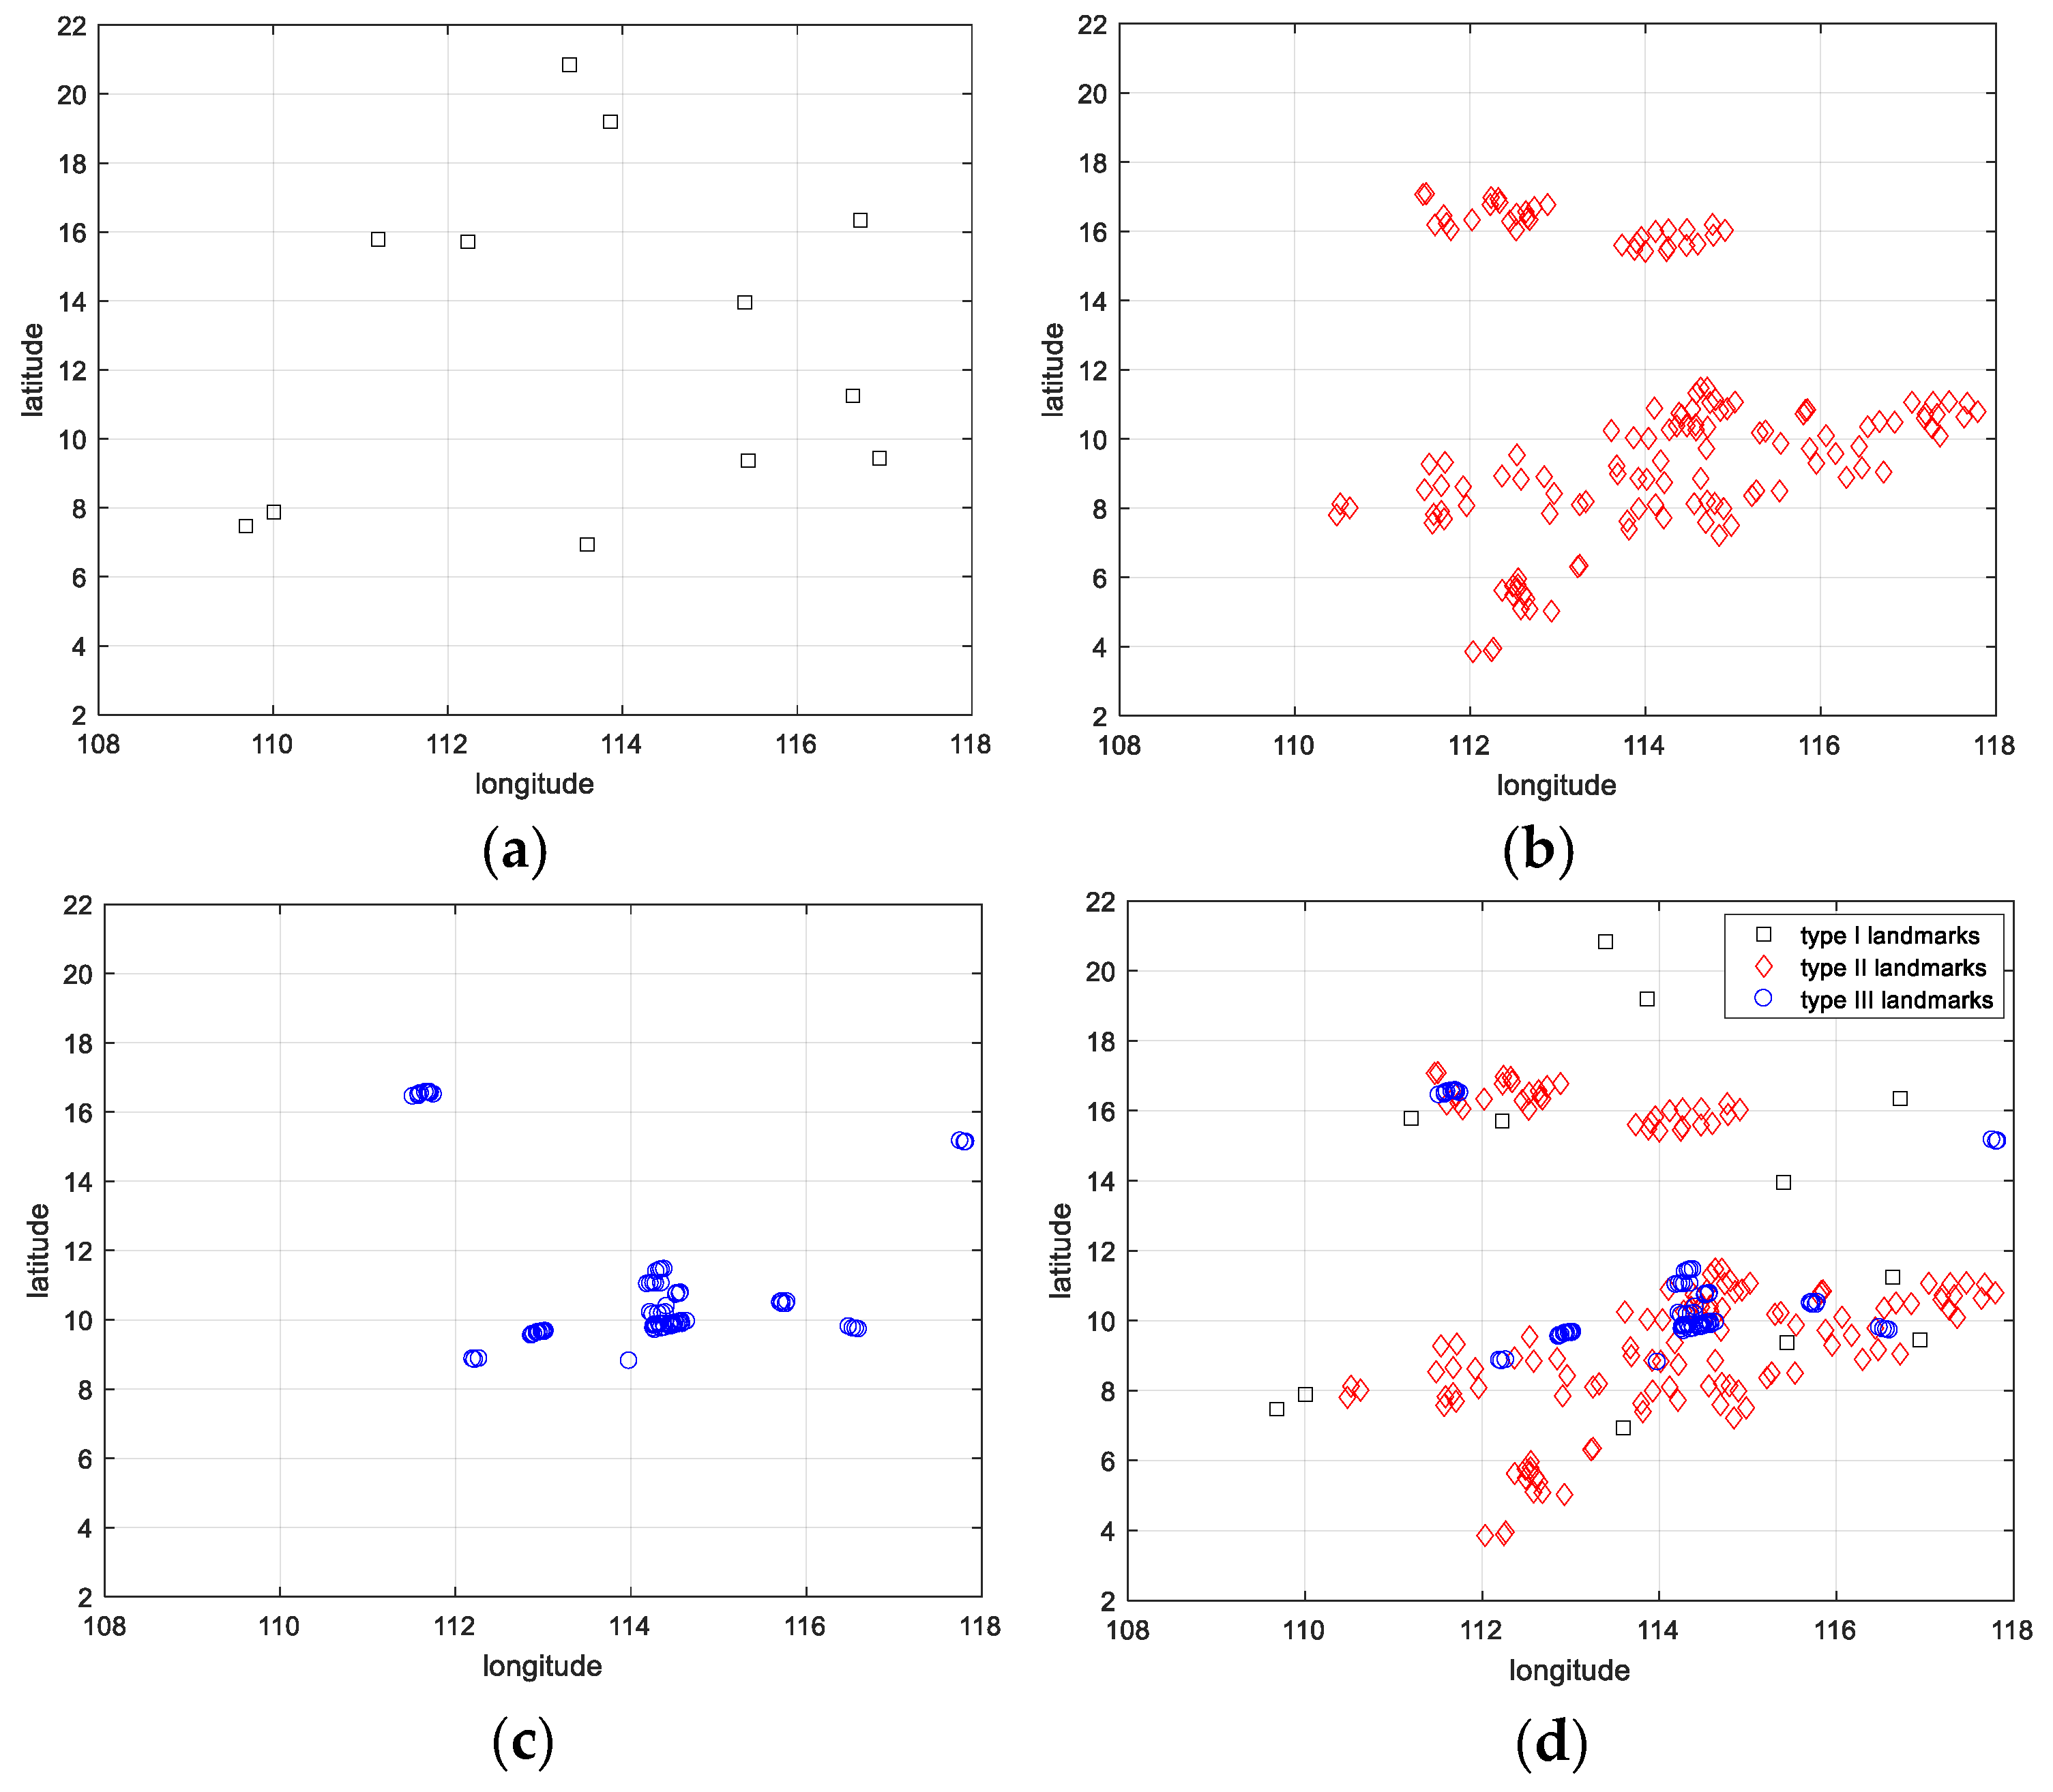
We let the aircraft fly at three different heights in the sea area within the range of north latitude 2 ° 22 ° and east longitude 108 ° 118 ° , setting V = 200 m/s, T = 3 h, δ = 200 m/h, and FOV = 96°. In total, 12 Type I landmarks, 143 Type II landmarks, and 77 Type III landmarks from the landmark database according to the matching probability analyzed in Section 3.1 are selected to evaluate the usability in the Nanhai Sea area. The positions of various types of landmarks are shown in Figure 9.
According to the matching probabilities of different types of landmarks at different heights obtained in Section 3.1, the observable probabilities of landmarks are calculated every 1000 m in the longitude and latitude directions. Finally, three different types and a comprehensive cloud map of observable probabilities of landmarks are obtained, as shown in Figure 10, Figure 11 and Figure 12.
As shown in Figure 10, Figure 11 and Figure 12, the red-shaded area denotes a heightened probability of observable landmarks, reaching a maximum of one, implying enhanced usability. Conversely, the blue-shaded area signifies a diminished probability of observable landmarks, with a minimum of zero indicating reduced usability. Examining the extent of the red area in Figure 10, Figure 11 and Figure 12 reveals that the usability of Type II landmarks surpasses that of Type I and III at different altitudes. This discrepancy is primarily attributed to variations in the proportion and distribution of the three types of landmarks. Nevertheless, among the three types of landmarks, areas with a higher landmark density exhibit superior usability, while areas with sparse landmarks demonstrate a relatively lower usability. Moreover, a comparative analysis of Figure 10d, Figure 11d and Figure 12d with Figure 10b, Figure 11b and Figure 12b in the same figures reveals that, despite Type II landmarks having the highest proportion under various height conditions, the usability significantly improves when incorporating Type I and Type III landmarks. This suggests that supplementing other types of landmarks enhances the overall availability for a single type of landmark. Comparing Figure 10d, Figure 11d and Figure 12d reveals that with increasing flight altitude, despite a decrease in matching probability of landmarks, there is an expansion in the field of view, resulting in an enlarged visible range of landmarks, as shown in Equation (14). Consequently, the usability of landmarks progressively improves across the global range.

3.3. CNS Availability

The Nanhai Sea area map was generated using Matlab, and the cloud and fog model data are presented in Section 2.3. Using spring data as an example, we assumed an eastward movement of the clouds, causing the clouds to shift every four hours to produce a simulation map. In this representation, the color scheme distinguishes between different atmospheric elements: blue denotes fog, yellow represents low clouds, red signifies middle clouds, and green indicates high clouds. The fog, low clouds, middle clouds, and high clouds are successively generated every 4 h, as shown in Figure 13a.
For the simulation involving visible satellites, the satellite positions are emulated, and a visible satellite is incorporated when within the field of view. The occlusion of the visible satellites can be ascertained through image analysis. A red area indicates that field of view is covered, while a blue area indicates non-coverage. The red dots denotes the position of visible satellites in the field of view. Consequently, the simulation diagram of visible satellites is shown in Figure 13b.
As shown in Figure 13a, the four types of clouds exhibit gradual movement, aligning with the assumption that the higher-altitude clouds demonstrate increased velocity, while shorter cloud lengths correspond to higher speeds. Figure 13b reveals variations in satellite occlusion caused by low, middle, and high clouds at specific positions, emphasizing the necessity to assess satellite occlusion across all cloud types.
The four trajectories at three altitudes of H = 8000 m–10,000 m, H = 2000 m–5000 m, H = 5000 m–8000 m, and H = 2000 m–10,000 m are simulated in the Nanhai Sea area by Matlab. For each trajectory, five consecutive hours were randomly selected for analysis. If the cumulative time of more than three visible satellites exceeded 0.5 h within the five-hour period, it is considered that CNS is available, otherwise, it is considered unavailable. The effective probability of CNS is defined as the ratio of available time to total sampling time, as detailed in Table 5.
As shown in Table 5, the CNS effective probability at the height of 8000 m–10,000 m and 5000 m–8000 m is higher than the CNS effective probability at the height of 2000 m–5000 m, because the flight height is higher, and there are more visible satellites. Furthermore, the CNS effective probability is 0.41 at the height of 2000 m–10,000 m, which is irrelevant to the other two results.

3.4. INS/CNS/SMN Adaptive Integrated Navigation

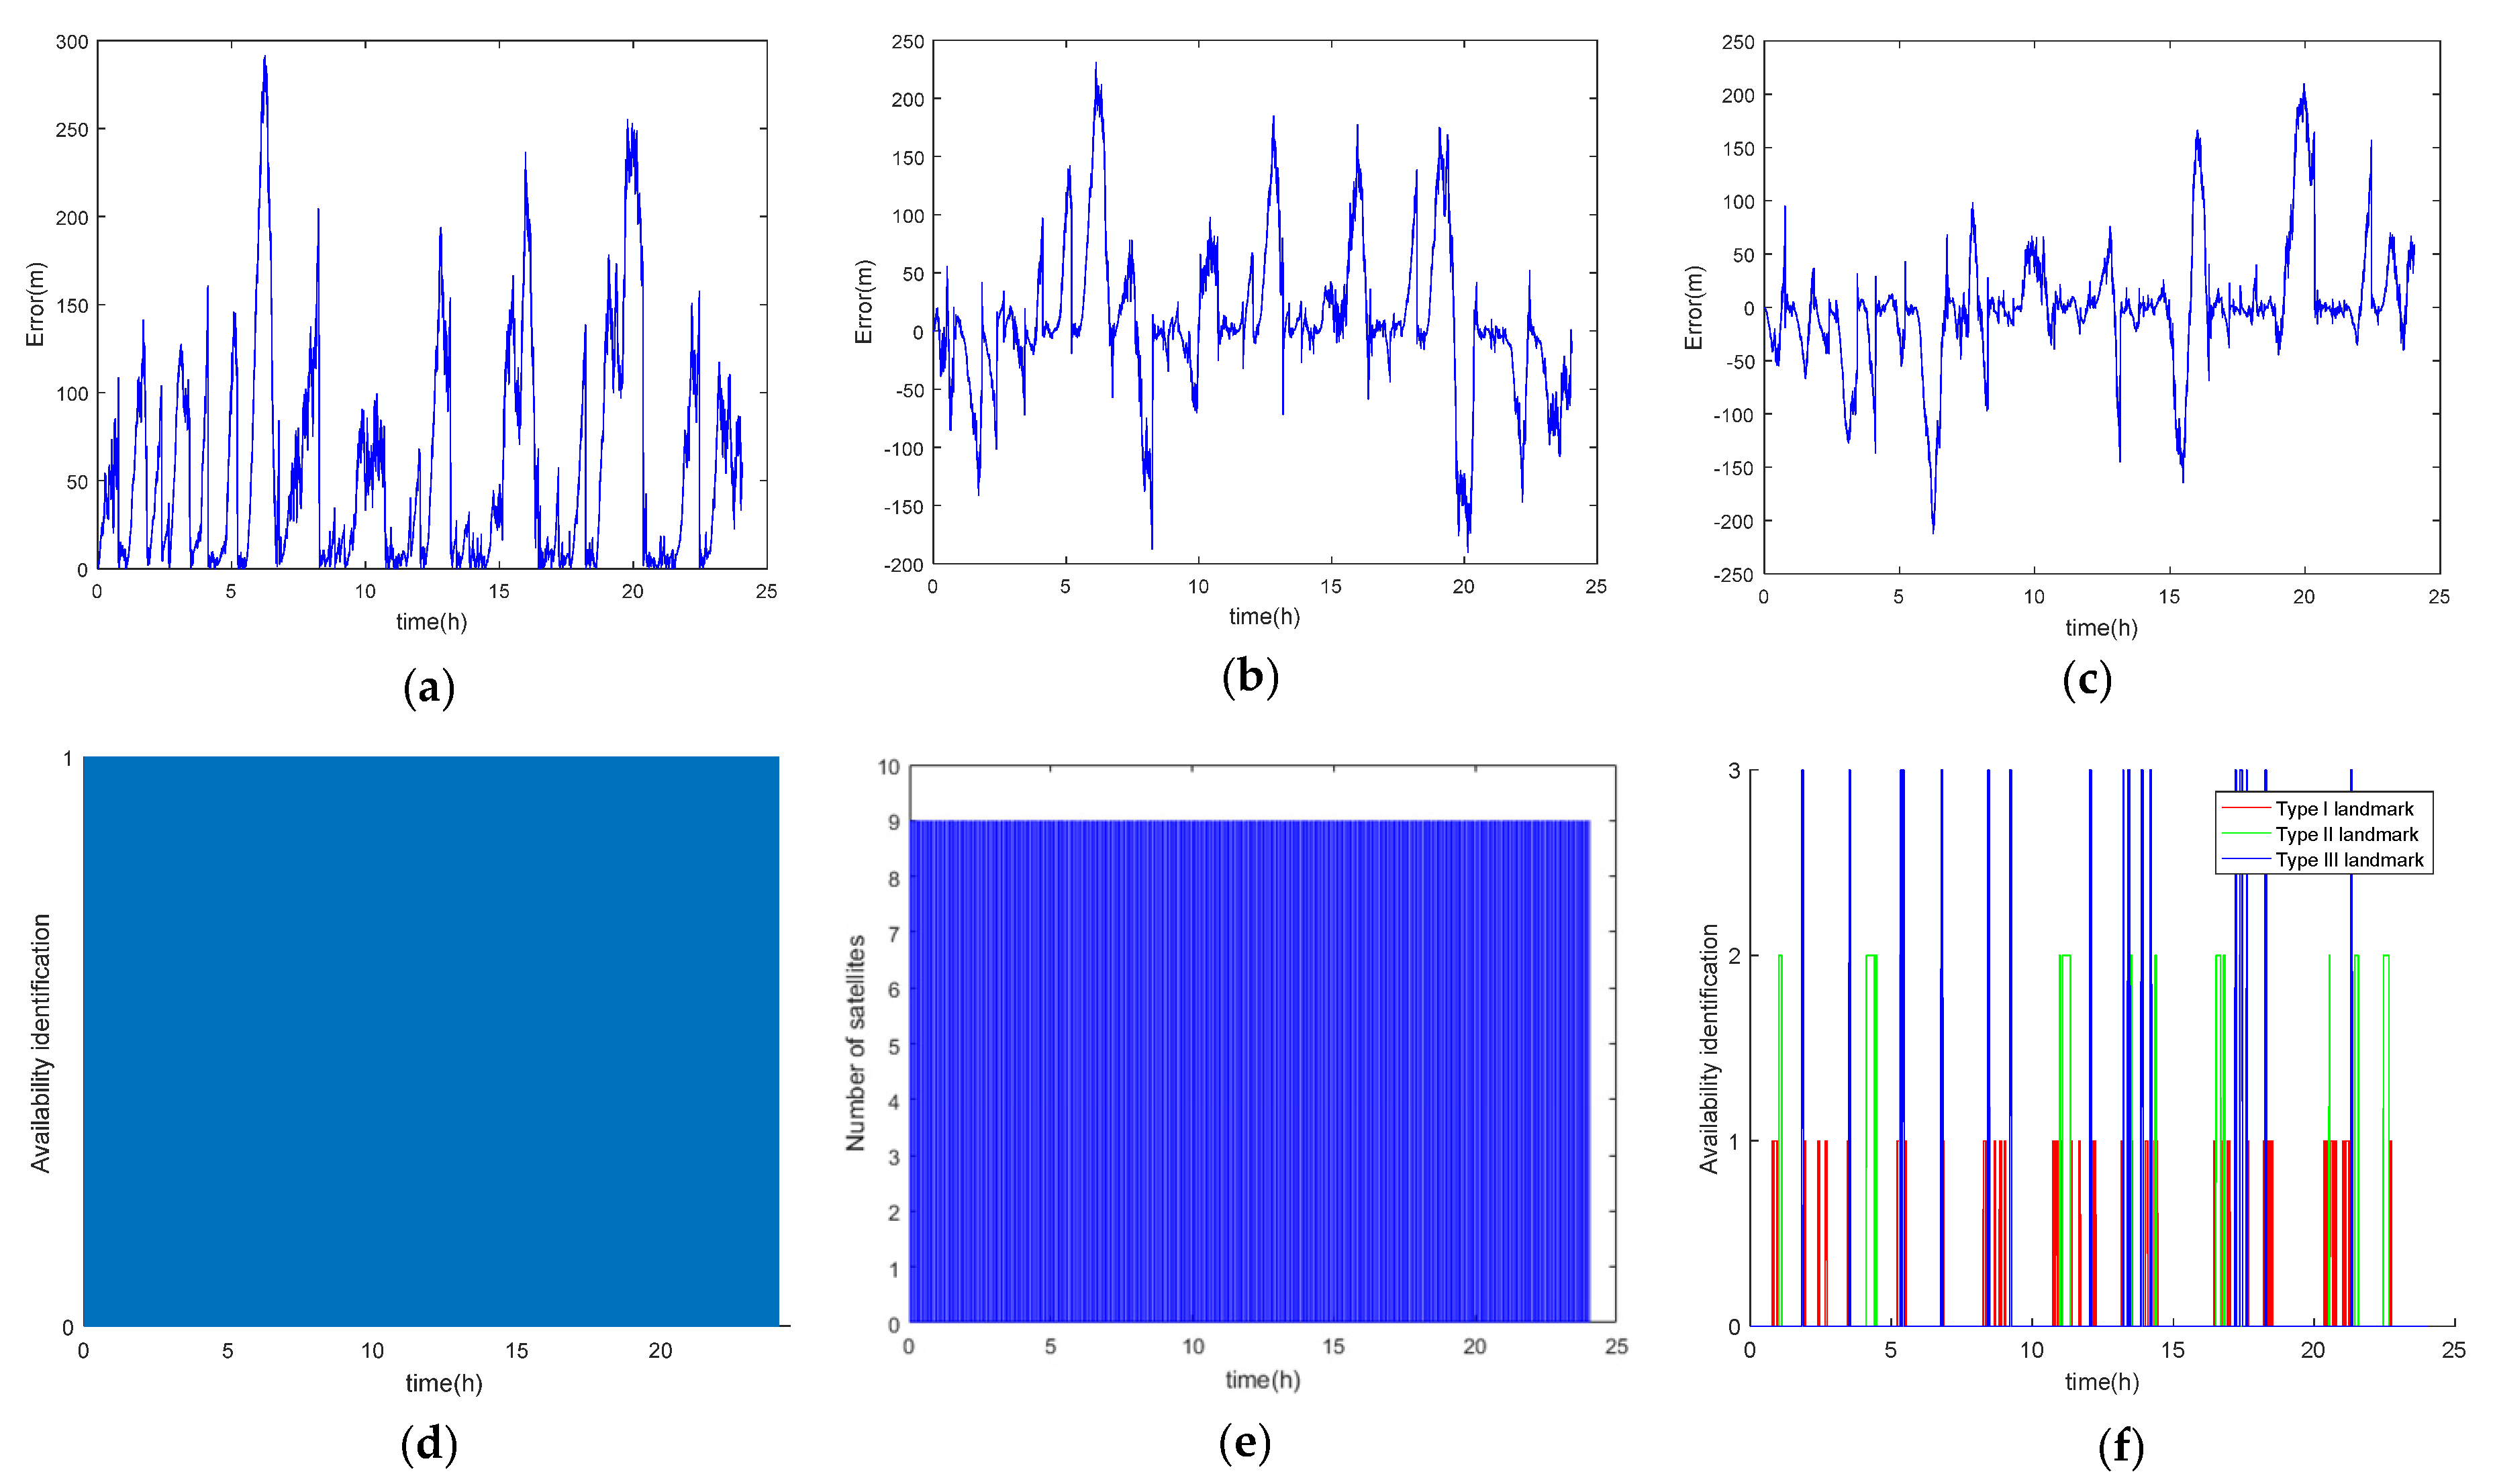
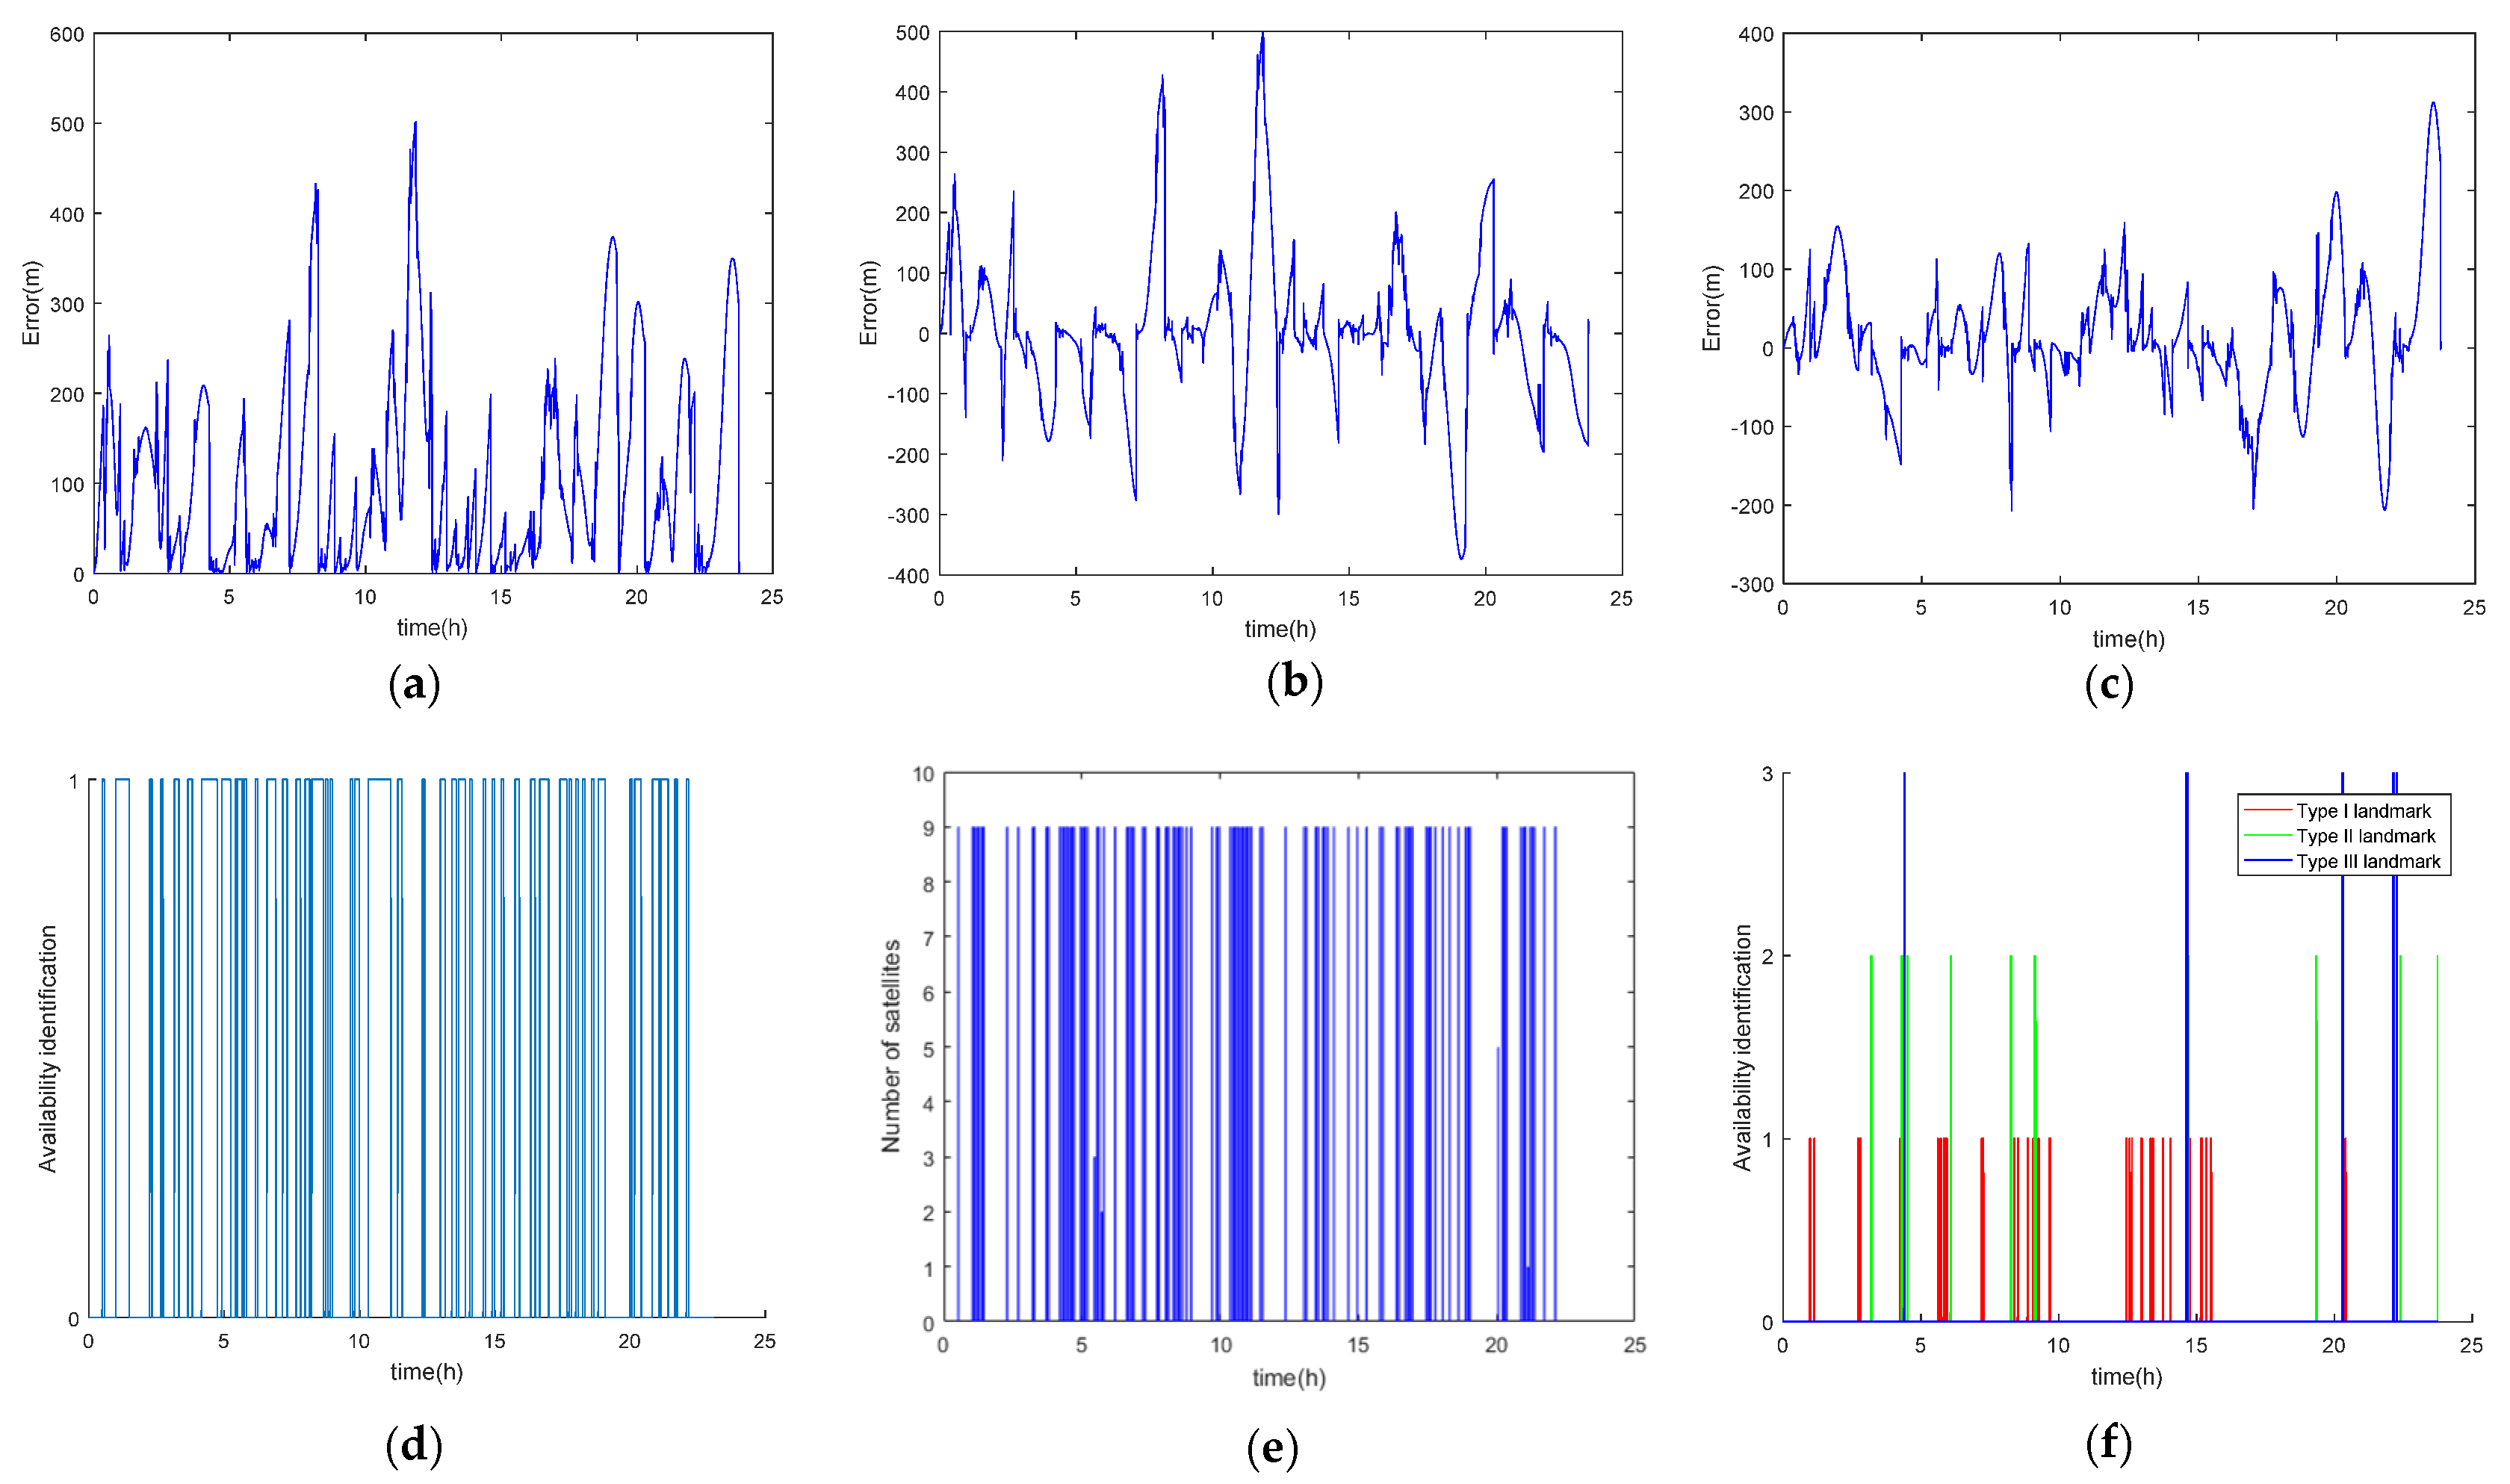
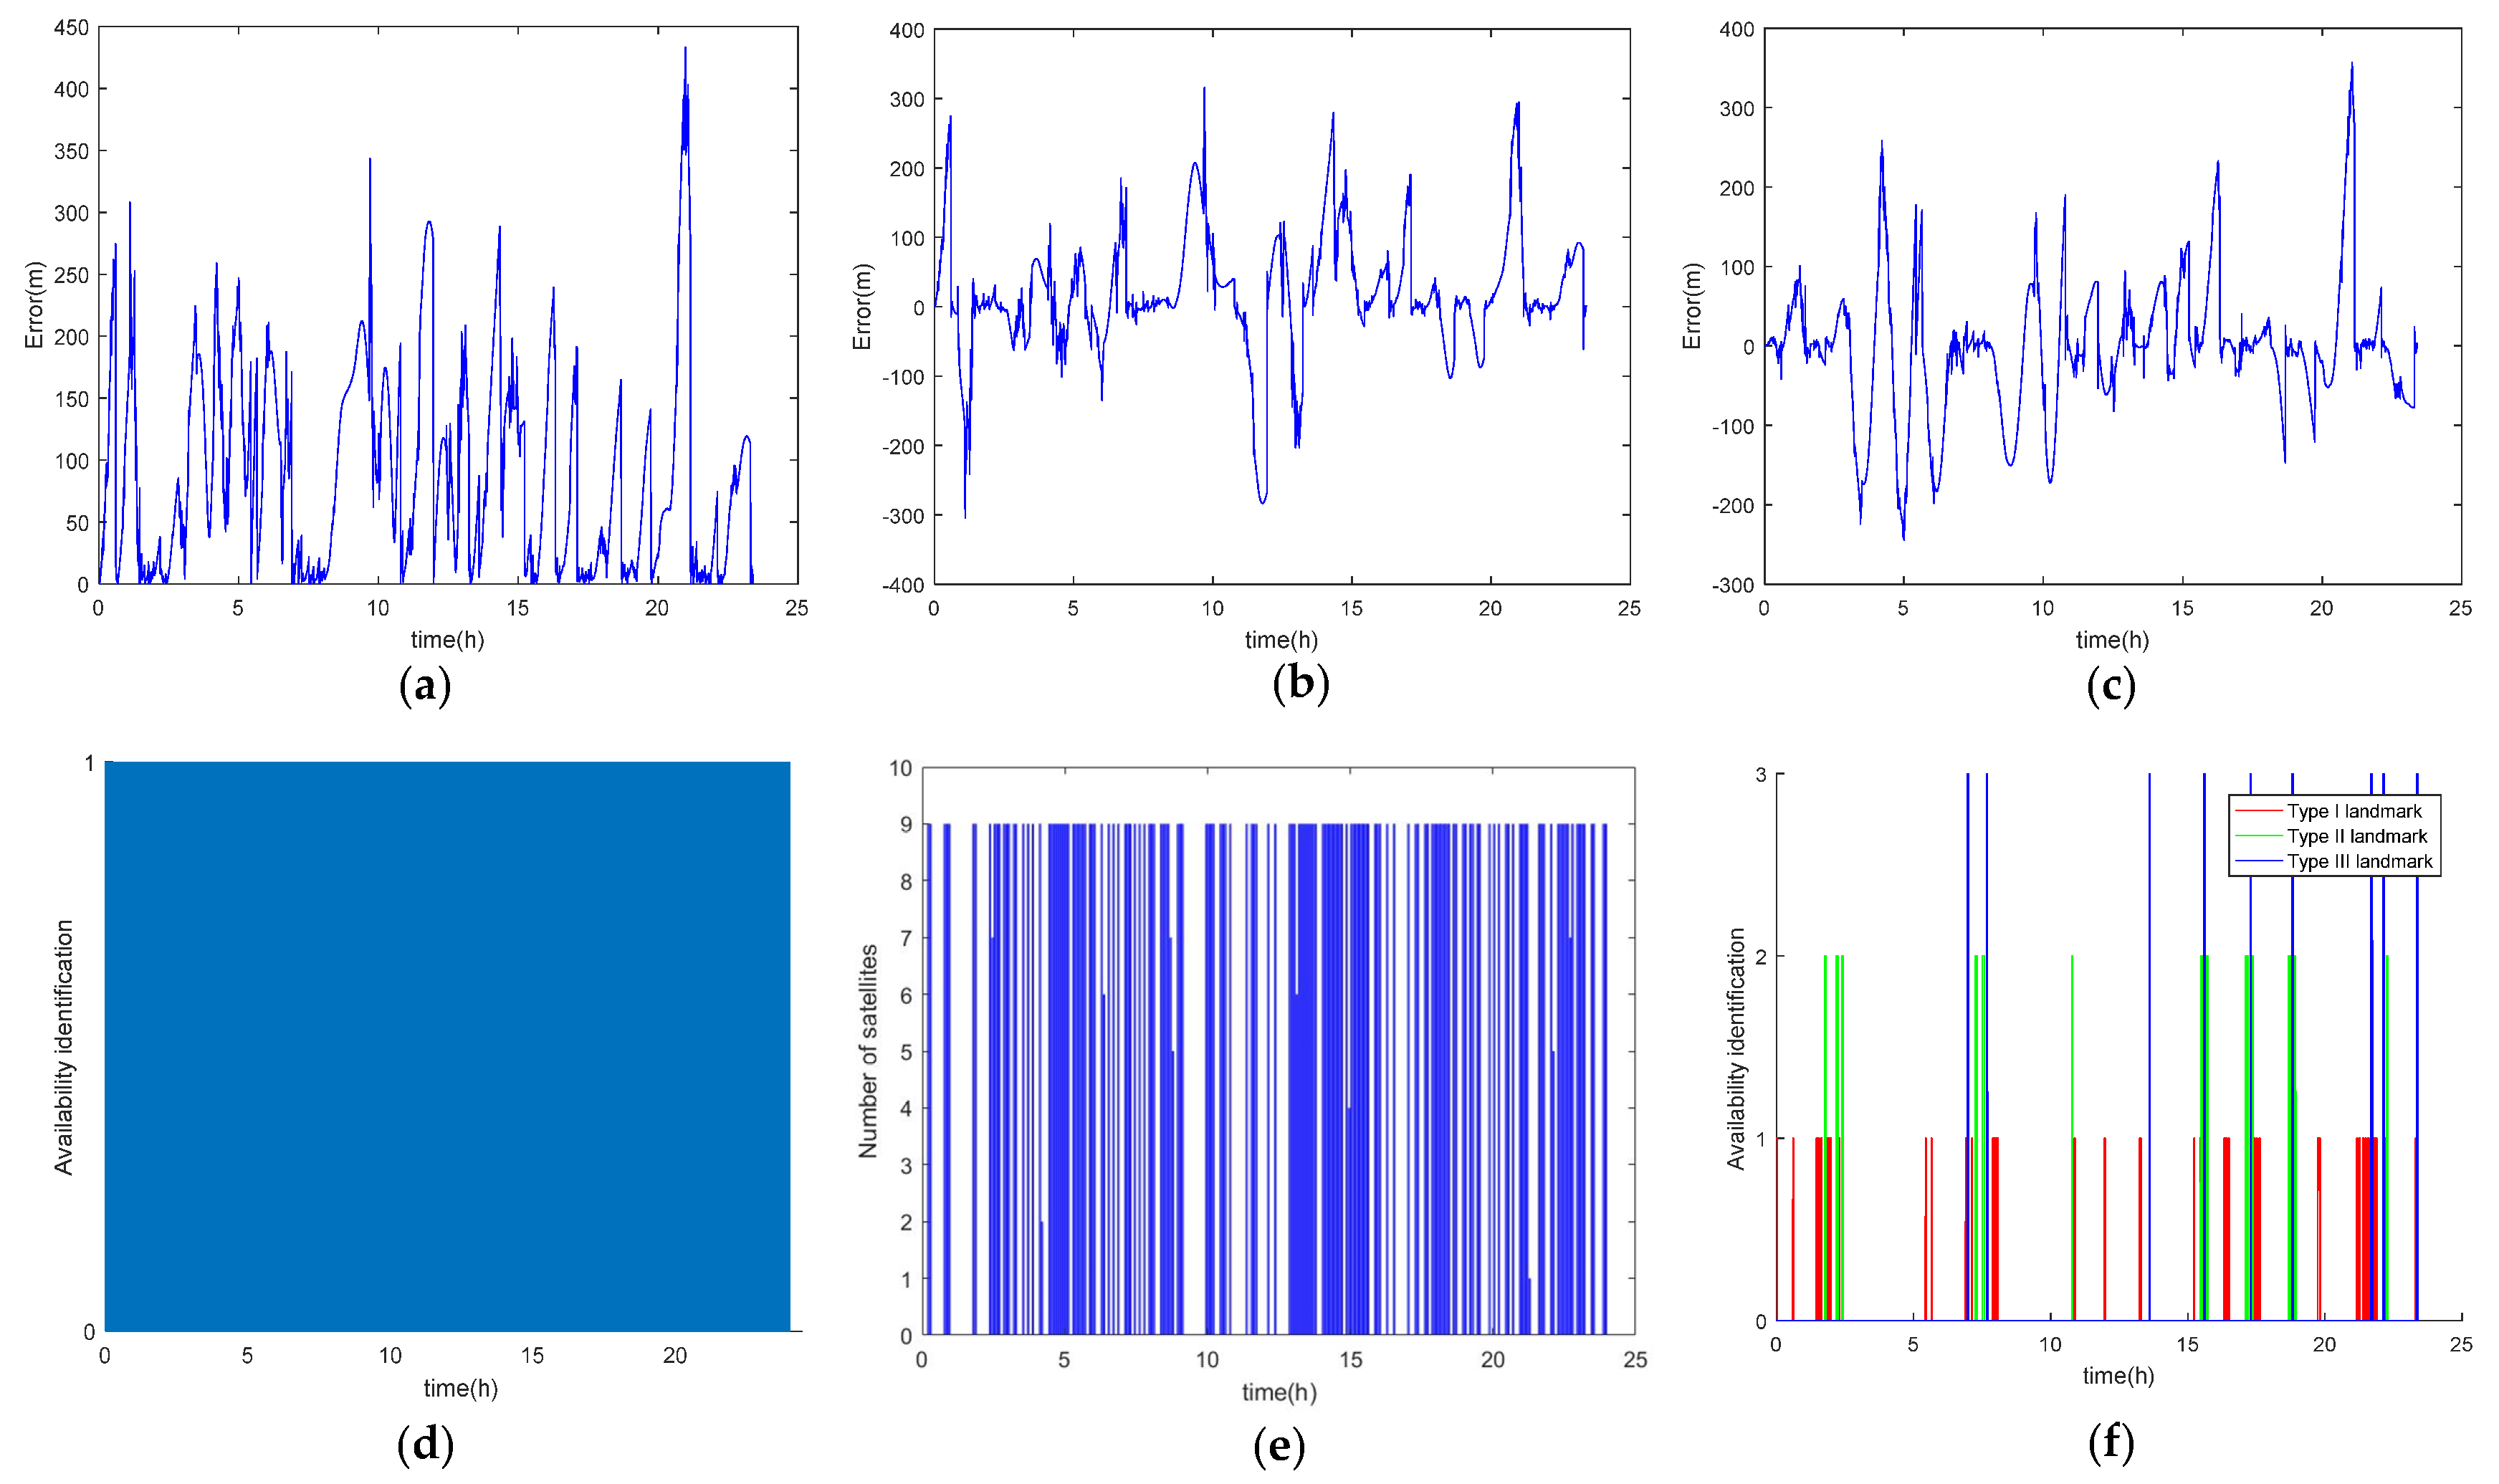
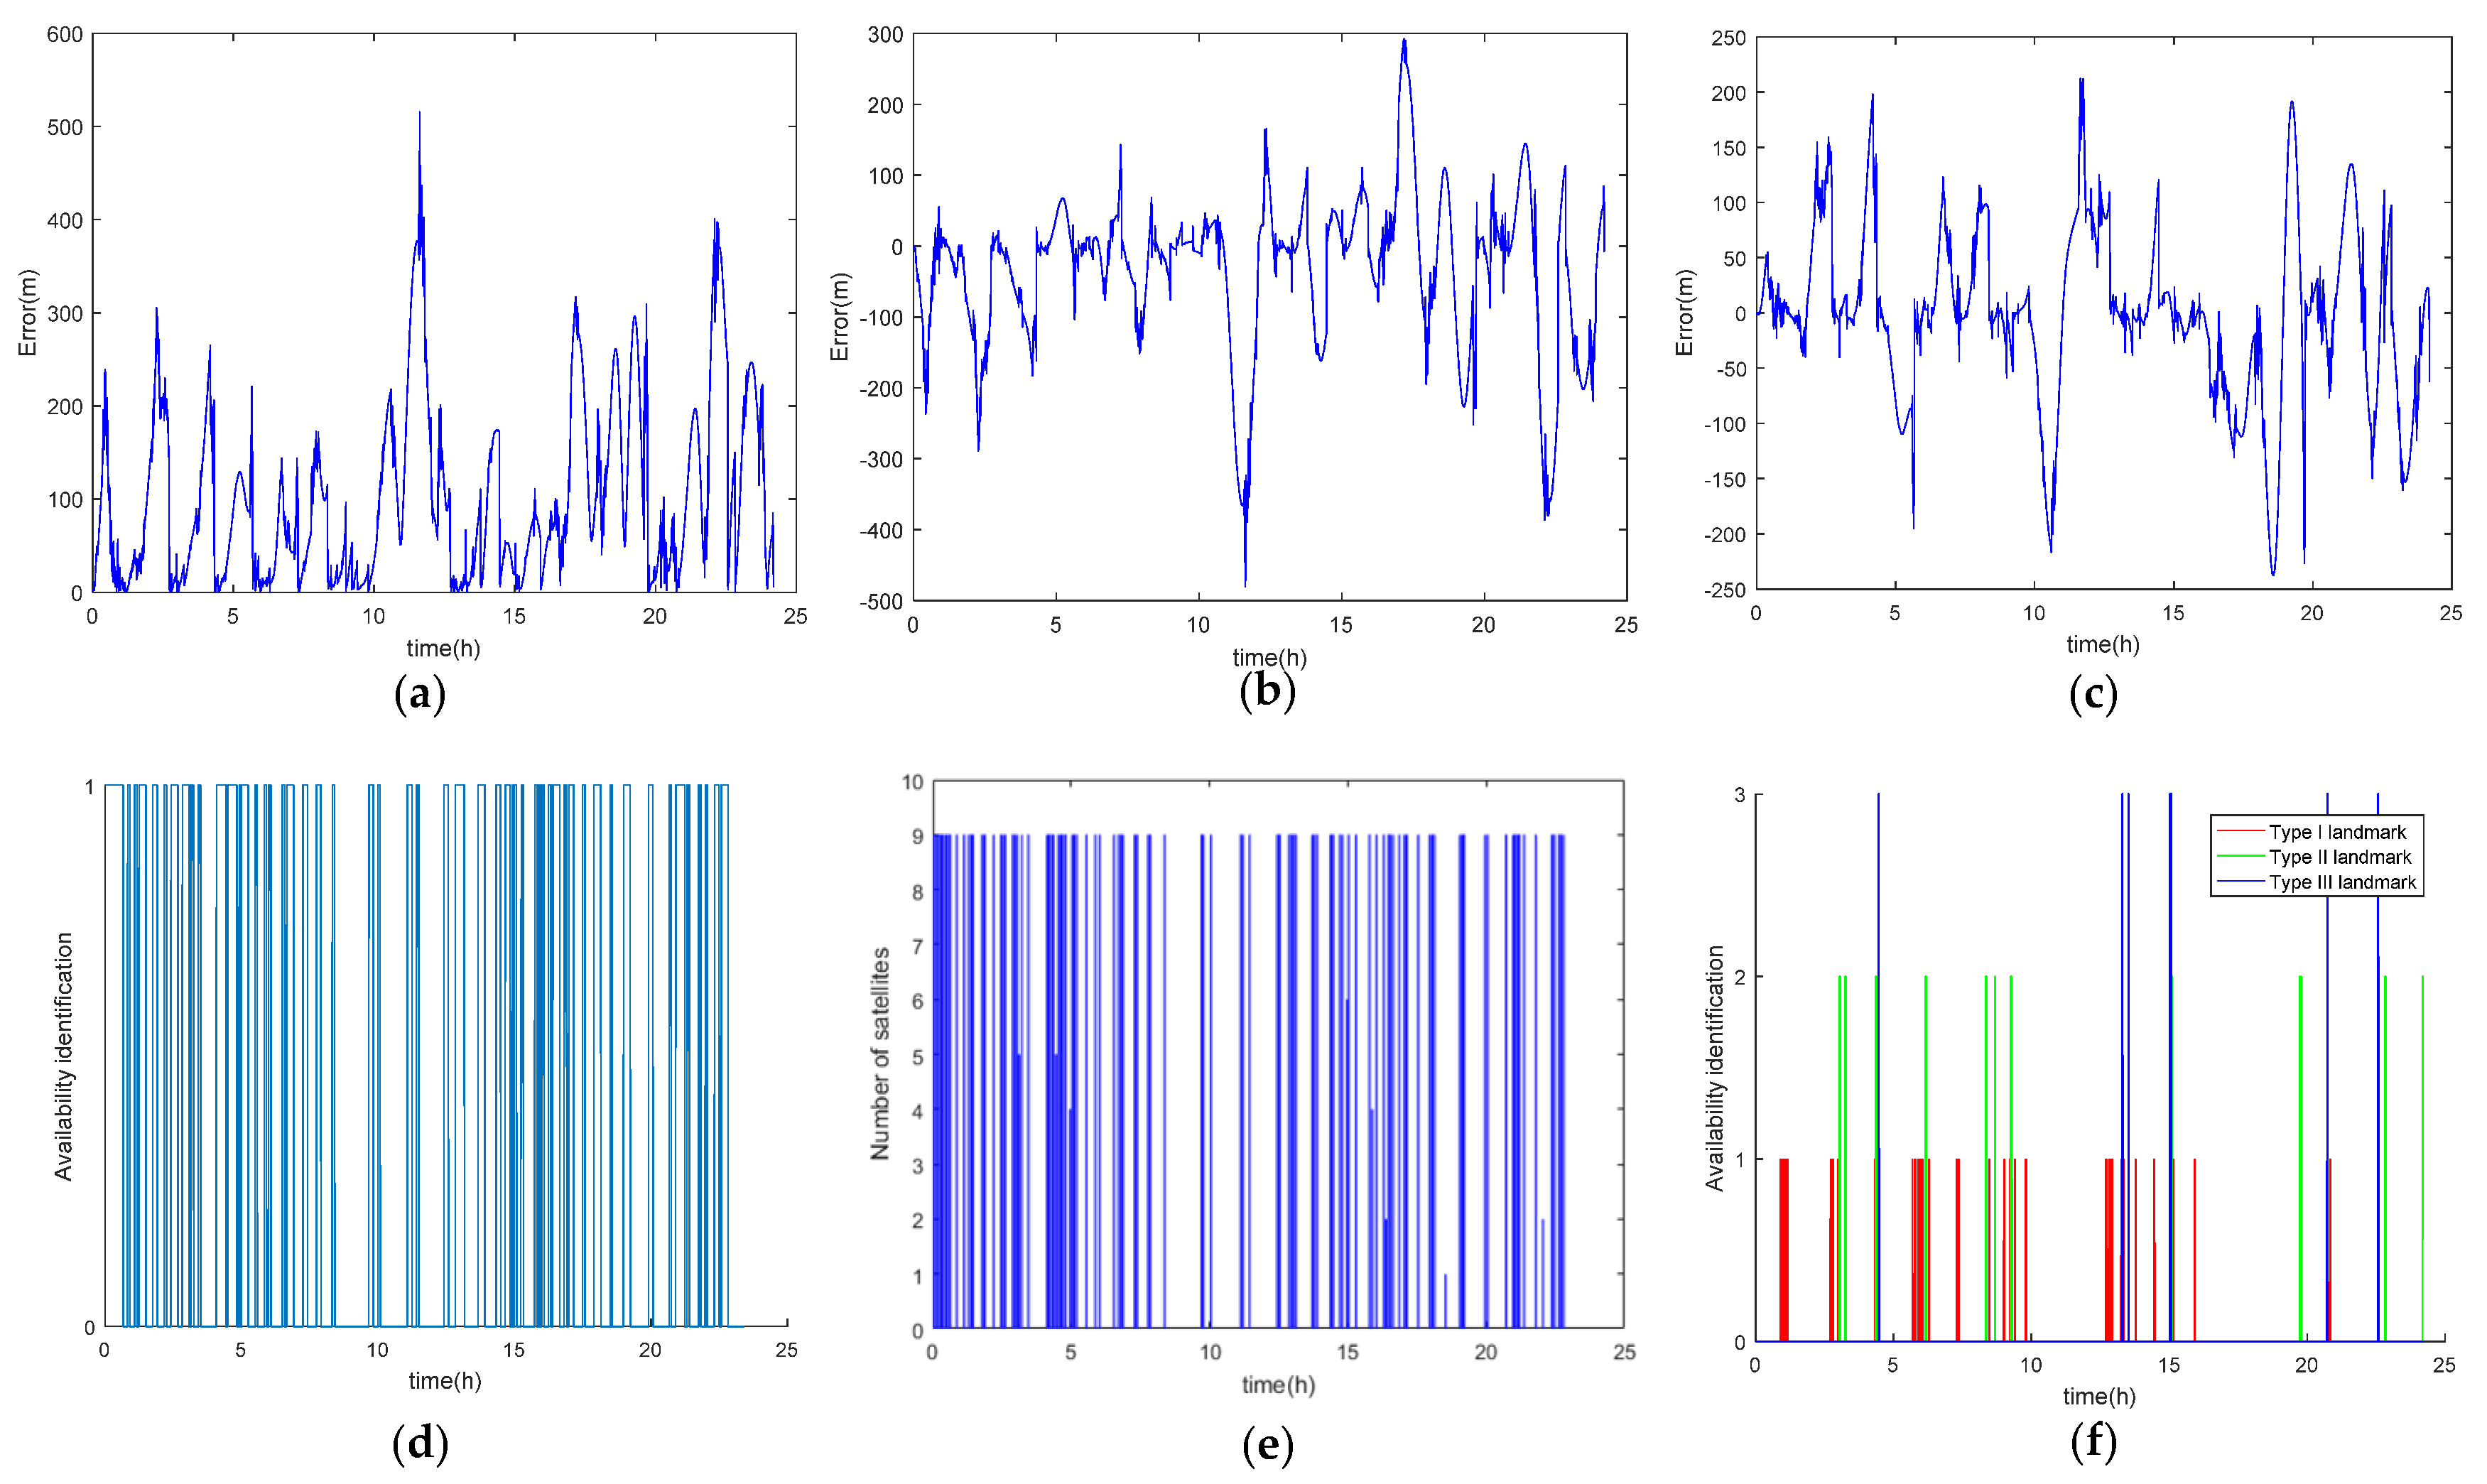
The trajectories at four distinct heights of H = 8000 m–10,000 m, H = 2000 m–5000 m, H = 5000 m–8000 m, and H = 2000 m–10,000 m are simulated in the Nanhai Sea area using Matlab. To simulate INS errors, the gyroscope constant bias is assumed to be 0.3°/h and the accelerometer constant bias is set to 50 μg. The astronomical angle observation error is defined as 5°, and the image matching error is fixed at 40 m. The Kalman filter operates with a time period of 1 s, and the simulation spans 24 h. The results of the integrated filtering process are presented in Figure 14, Figure 15, Figure 16 and Figure 17.
Figure 14, Figure 15, Figure 16 and Figure 17 present the simulation results of an INS/CNS/SMN adaptive integrated navigation system at three distinct flight altitudes. Subfigures (a) to (c) depict the radial position error, latitude error, and longitude error of the integrated navigation system, respectively. Subfigures (d) and (e) respectively illustrate CNS availability identification and the corresponding count of visible navigation satellites. In cases where the CNS is available and the number of visible navigation satellites exceeds three, the associated CNS measurement information become applicable to aid INS navigation. Subfigure (f) denotes landmark availability identification and annotates the type of available landmarks in the figure. When a landmark is accessible, SMN measurement information can be computed based on the type of observed landmarks, utilizing the corresponding matching algorithm outlined in Section 2.2.3 to aid INS navigation.
As shown in Figure 14d,e, Figure 15d,e and Figure 16d,e, it can be seen that for CNS, the higher the flight altitude, the more navigation satellites are available, resulting in elevated CNS availability. Similarly, for SMN, as shown in Figure 14f, Figure 15f and Figure 16f, an increase in flight altitude extends the observation time for landmarks, consequently enhancing landmark availability. Figure 14a, Figure 15a, Figure 16a and Figure 17a collectively demonstrate that the position error of the INS/CNS/SMN adaptive integrated navigation remains below 500 m in 24 h.

4. Discussion

In summary, this paper proposes an automatic classification and matching algorithm for sea area landmarks that leverages natural information from sea area islands, categorizing them into three types. We introduce an automatic selection model for sea area landmarks based on SVM and analyze corresponding matching methods for these three types of landmarks at different heights. The algorithm exhibits heightened robustness in sea areas compared to traditional land-based landmark selection algorithms. While initially designed for the automatic selection of landmarks in the Nanhai Sea, its applicability extends to areas with less distinct characteristics. Additionally, we present a usability evaluation algorithm for sea area landmarks, serving as a foundation for aircraft route planning in this domain. The algorithm remains applicable to any area with prominent landmarks for usability evaluation, considering the constraint of the number of available landmarks in the Nanhai Sea. Furthermore, this study delves into the size, type, moving direction, and speed of clouds and fog in the Nanhai Sea across different seasons. We construct a dynamic model for cloud and fog movement over time. Based on this, we analyze scenarios where satellites may be obscured by clouds and fog, providing a theoretical framework for evaluating CNS availability in the Nanhai Sea. This study is also applicable to the availability of CNS under the influence of cloud and fog in other areas. In comparison to currently used algorithms, the INS/CNS/SMN adaptive integrated navigation algorithm proposed in this paper, is designed based on the climatic conditions and flight scenarios specific to the Nanhai Sea area. While traditional INS/CNS/SMN integrated navigation algorithm is generally land-based. In the absence of GPS signals, it assists INS and maintains high navigation accuracy over extended navigation durations. This adaptive integrated navigation system attains high-precision, long-endurance navigation in diverse climates and flight altitudes. Furthermore, it can be applied to similar sea area flight regions.

5. Conclusions

In this paper, we propose an INS/CNS/SMN adaptive integrated navigation algorithm for the sea area. The algorithm encompasses the definition of three distinct types of sea area landmarks, the development of corresponding matching methods, and the implementation of an automatic classification model for these landmarks using support vector machines (SVM). Additionally, a database containing the geographic location information of the three types of landmarks is established. Simultaneously, the visible range of each landmark is determined based on the landmark database, aircraft flight position, flight altitude, flight speed, camera field of view angle, and INS drift error. The calculation of observable probabilities for landmarks at each position is facilitated by combining the matching probabilities of different types of landmarks at varying flight altitudes. Subsequently, probability cloud maps depicting the usability of sea landmarks at varying flight heights are presented. A dynamic cloud and fog model is constructed to monitor the visibility of satellites over time, enabling the determination of CNS availability based on this model. The main conclusions are as follows: (1) The automatic classification model for the three types of sea area landmarks achieves a precision exceeding 0.9, with matching probabilities for these landmarks at different heights consistently surpassing 0.8. (2) The usability of the three types of landmarks generally exceeds 0.5 in most areas of the Nanhai Sea, with usability higher than 0.8 in 1/5 of the Nanhai Sea. (3) The cloud and fog model serves as a foundation for determining CNS availability, exhibiting varying effectiveness probabilities at three different heights. (4) The positioning error of the INS/CNS/SMN adaptive integrated navigation system is less than 500 m within a 24 h period with specific SMN and CNS measurements. This system demonstrates a good adaptability and can provide continuous assistance to the INS when CNS and SMN are unavailable.

Author Contributions

Conceptualization, Z.T.; methodology, Z.T.; software, Z.T. and S.Y.; validation, Z.T., S.Y. and Z.L.; formal analysis, Z.T. and S.Y.; investigation, Z.T., S.Y. and Z.L.; resources, Z.T., Y.C. and S.Y.; data curation, Z.T. and Z.L.; writing—original draft, Z.T.; writing—review and editing, Z.T., Y.C. and S.Y.; visualization, Z.T.; supervision, Y.C.; project administration, Y.C.; funding acquisition, Y.C. All authors have read and agreed to the published version of the manuscript.

Funding

This work is funded by the National Key Laboratory on Blind Signal Processing, grant number 61424131903, and the National Natural Science Foundation of China, grant number U20B2067.

Data Availability Statement

The data presented in this study are available on request from the corresponding author. The data are not publicly available due to privacy.

Conflicts of Interest

The authors declare no conflicts of interest.

References

  1. Liu, J.Y. Theory and Application of Navigation System; Northwestern Polytechnic University Press: Xi’an, China, 2010. [Google Scholar]
  2. Barbour, N.; Schmidt, G. Inertial sensor technology trends. Sensors 2002, 1, 332–339. [Google Scholar] [CrossRef]
  3. Song, H.L.; Ma, Y.Q. Developing Trend of Inertial Navigation Technology and Requirement Analysis for Armament. Mod. Def. Technol. 2012, 40, 55–59. [Google Scholar]
  4. Dong, J.W.; Department, N.E. Analysis on inertial navigation technology. J. Instrum. Technol. 2017, 1, 41–43. [Google Scholar]
  5. Wang, S.Y.; Han, S.L.; Ren, X.Y. MEMS Inertial Navigation Technology and Its Application and Prospect. Control Inf. Technol. 2018, 6, 21–26. [Google Scholar]
  6. Lai, J.Z.; Yu, Y.Z.; Xiong, Z. SINS/CNS tightly integrated navigation positioning algorithm with nonlinear filter. Control Decis. 2012, 27, 1649–1653. [Google Scholar]
  7. Yang, S.J.; Yang, G.L.; Yi, H.L. Scheme design of autonomous integrated INS/CNS navigation systems for spacecraft. J. Chin. Inert. Technol. 2014, 22, 728–733. [Google Scholar]
  8. Quan, W.; Fang, J.; Li, J. INS/CNS/GNSS Integrated Navigation Technology. Syst. Eng. Electron. 2015, 33, 237–277. [Google Scholar]
  9. Qian, H.M.; Lang, X.K.; Qian, L.C. Ballistic missile SINS/CNS integrated navigation method. J. Beijing Univ. Aeronaut. Astronaut. 2017, 43, 857–864. [Google Scholar]
  10. Zhao, F.F.; Chen, C.Q.; He, W. A filtering approach based on MMAE for a SINS/CNS integrated navigation system. IEEE/CAA J. Autom. Sin. 2018, 5, 1113–1120. [Google Scholar] [CrossRef]
  11. Jia, W.B.; Wang, H.L.; Yang, J.F. Application of scene matching aided navigation in terminal guidance of ballistic missile. J. Tactical Missile Technol. 2009, 92, 62–65. [Google Scholar]
  12. Chen, F.; Xiong, Z.; Xu, Y.X. Research on the Fast Scene Matching Algorithm in the Inertial Integrated Navigation System. J. Astronaut. 2009, 30, 2308–2316. [Google Scholar]
  13. Du, Y.L. Research on Scene Matching Algorithm in the Vision-Aided Navigation System. Appl. Mech. Mater. 2011, 128, 229–232. [Google Scholar] [CrossRef]
  14. Li, Y.J.; Pan, Q.; Zhao, C.H. Natural-Landmark Scene Matching Vision Navigation Based on Dynamic Key-Frame. Phys. Procedia 2012, 24, 1701–1706. [Google Scholar] [CrossRef]
  15. Yu, Q.F.; Shang, Y.; Liu, X.C. Full-parameter vision navigation based on scene matching for aircrafts. Sci. China Inf. Sci. 2014, 57, 1–10. [Google Scholar] [CrossRef]
  16. Zhao, C.H.; Zhou, Y.H.; Lin, Z. Review of scene matching visual navigation for unmanned aerial vehicles. Sci. Sin. Inf. 2019, 49, 507–519. [Google Scholar] [CrossRef]
  17. Wang, Y.; Li, Y.; Xu, C. Map matching navigation method based on scene information fusion. Int. J. Model. Identif. Control 2022, 41, 110–119. [Google Scholar] [CrossRef]
  18. Zhao, J.; Wang, Y. Information fusion algorithm in INS/SMNS integrated navigation system. J. Beijing Univ. Aeronaut. Astronaut. 2009, 35, 292–295. [Google Scholar]
  19. Wang, Y.S.; Zeng, Q.H.; Liu, J.Y. INS/VNS integrated navigation method based on structured light sensor. In Proceedings of the 2016 China International Conference on Inertial Technology and Navigation, Beijing, China, 1 November 2016; pp. 511–516. [Google Scholar]
  20. Ning, X.; Gui, M.; Xu, Y.Z. INS/VNS/CNS integrated navigation method for planetary rovers. Aerosp. Sci. Technol. 2016, 48, 102–114. [Google Scholar] [CrossRef]
  21. Lu, J.; Lei, C.; Yang, Y. In-motion Initial Alignment and Positioning with INS/CNS/ODO Integrated Navigation System for Lunar Rovers. Adv. Space Res. 2017, 59, 3070–3079. [Google Scholar] [CrossRef]
  22. Lan, H.; Song, J.M.; Zhang, C.Y. Design and performance analysis of landmark-based INS/Vision Navigation System for UAV. Opt. Int. J. Light Electron Opt. 2018, 172, 484–493. [Google Scholar]
  23. Gou, B.; Cheng, Y.M.; de Ruiter, A.H. INS/CNS navigation system based on multi-star pseudo measurements. Aerosp. Sci. Technol. 2019, 95, 105506. [Google Scholar] [CrossRef]
  24. Shen, C.L.; Bu, Y.L.; Xu, X. Research on matching-area suitability for scene matching aided navigation. J. Aeronaut. 2010, 31, 553–563. [Google Scholar]
  25. Gong, X.P.; Cheng, Y.M.; Song, L. Automatic extraction algorithm of landmarks for scene-matching-based navigation. J. Comput. Simul. 2014, 31, 60–63. [Google Scholar]
  26. Zhu, R.; Karimi, H.A. Automatic Selection of Landmarks for Navigation Guidance. Trans. GIS 2015, 19, 247–261. [Google Scholar] [CrossRef]
  27. Yu, L.; Cheng, Y.M.; Liu, X.L. A method for reliability analysis and measurement error modeling based on machine learning in scene matching navigation (SMN). J. Northwestern Polytech. Univ. 2016, 34, 333–337. [Google Scholar]
  28. Wang, H.X.; Cheng, Y.M.; Liu, N. A Fast Selection Method of Landmarks for Terrain Matching Navigation. J. Northwestern Polytech. Univ. 2020, 38, 959–964. [Google Scholar] [CrossRef]
  29. Liu, X.C.; Wang, H.; Dan, F. An area-based position and attitude estimation for unmanned aerial vehicle navigation. Sci. China Technol. Sci. 2015, 58, 916–926. [Google Scholar] [CrossRef]
  30. Andrea, M.; Antonio, V. Improved Feature Matching for Mobile Devices with IMU. Sensors 2016, 16, 1243. [Google Scholar]
  31. Xiu, Y.; Zhu, S.; Rui, X.U. Optimal crater landmark selection based on optical navigation performance factors for planetary landing. Chin. J. Aeronaut. 2023, 36, 254–270. [Google Scholar] [CrossRef]
  32. Cortes, C.; Vapnik, V.N. Support Vector Networks. Mach. Learn. 1995, 20, 273–297. [Google Scholar] [CrossRef]
  33. Suykens, J.A.K.; Brabanter, J.D.; Lukas, L. Weighted least squares support vector machines: Robustness and sparse approximation. Neurocomputing 2002, 48, 85–105. [Google Scholar] [CrossRef]
  34. Khemchandani, R.; Chandra, S. Twin Support Vector Machines for Pattern Classification. IEEE Trans. Pattern Anal. Mach. Intell. 2007, 29, 905–910. [Google Scholar]
  35. Chen, J.; Ji, G. Weighted least squares twin support vector machines for pattern classification. In Proceedings of the 2010 the 2nd International Conference on Computer and Automation Engineering (ICCAE), Singapore, 26–28 February 2010; pp. 242–246. [Google Scholar]
  36. Dalal, N.; Triggs, B. Histograms of oriented gradients for human detection. In Proceedings of the 2005 IEEE Computer Society Conference on Computer Vision and Pattern Recognition, San Diego, CA, USA, 20–25 June 2005; pp. 886–893. [Google Scholar]
  37. Ojala, T.; Pietikainen, M.; Maenpaa, T. Multiresolution gray-scale and rotation invariant texture classification with local binary patterns. IEEE Trans. Pattern Anal. Mach. Intell. 2002, 24, 971–987. [Google Scholar] [CrossRef]
  38. Carroll, M. Hartley transform phase cross correlation (PCC) based robust dynamic image matching in nuclear medicine. J. Nucl. Med. 2015, 56, 1746. [Google Scholar]
  39. Zhang, L.; Zhou, Y.; Lin, R.F. Fast triangle star pattern recognition algorithm. J. Appl. Opt. 2018, 39, 71–75. [Google Scholar]
  40. Chen, W.J.; Shao, Y.H.; Li, C.N. MLTSVM: A novel twin support vector machine to multi-label learning. Pattern Recognit. 2015, 52, 61–74. [Google Scholar] [CrossRef]
  41. Xu, S.; An, X. ML 2 S-SVM: Multi-label least-squares support vector machine classifiers. Electron. Libr. 2019, 37, 1040–1058. [Google Scholar] [CrossRef]
  42. Feng, P.; Qin, D.Y.; Ji, P. Multi-label learning algorithm with SVM based association. High Technol. Lett. 2019, 25, 97–104. [Google Scholar]
  43. Xu, J.D. A fast Ostu image segmentation method based on least square fitting. J. Chang. Univ. (Nat. Sci. Ed.) 2021, 33, 70–76. [Google Scholar]
  44. He, Y.; Wang, H.; Feng, L. Centroid extraction algorithm based on grey-gradient for autonomous star sensor. Opt. Int. J. Light Electron Opt. 2019, 194, 162932. [Google Scholar] [CrossRef]
  45. Cui, Z.J.; Qi, W.F.; Liu, Y.X. A fast image template matching algorithm based on normalized cross correlation. In Proceedings of the 2020 Conference on Computer Information Science and Artificial Intelligence (CISAI), Inner Mongolia, China, 25–27 September 2020; p. 12163. [Google Scholar]
  46. Guo, L.; Li, B.O.; Cao, Y. Star map recognition algorithm based on triangle matching and optimization. Electron. Des. Eng. 2018, 26, 137–140. [Google Scholar]
  47. Wang, S.H.; Han, Z.G.; Yao, Z.G. Analysis on cloud vertical structure over China and its neighborhood based on CloudSat data. J. Plateau Meteorol. 2011, 30, 38–52. [Google Scholar]
  48. Liu, S.J.; Wu, S.A.; Li, W.G. Study on spatial-temporal distribution of sea fog in the South China Sea from January to March based on FY-3B sea fog retrieval data. J. Mar. Meteorol. 2017, 37, 85–90. [Google Scholar]
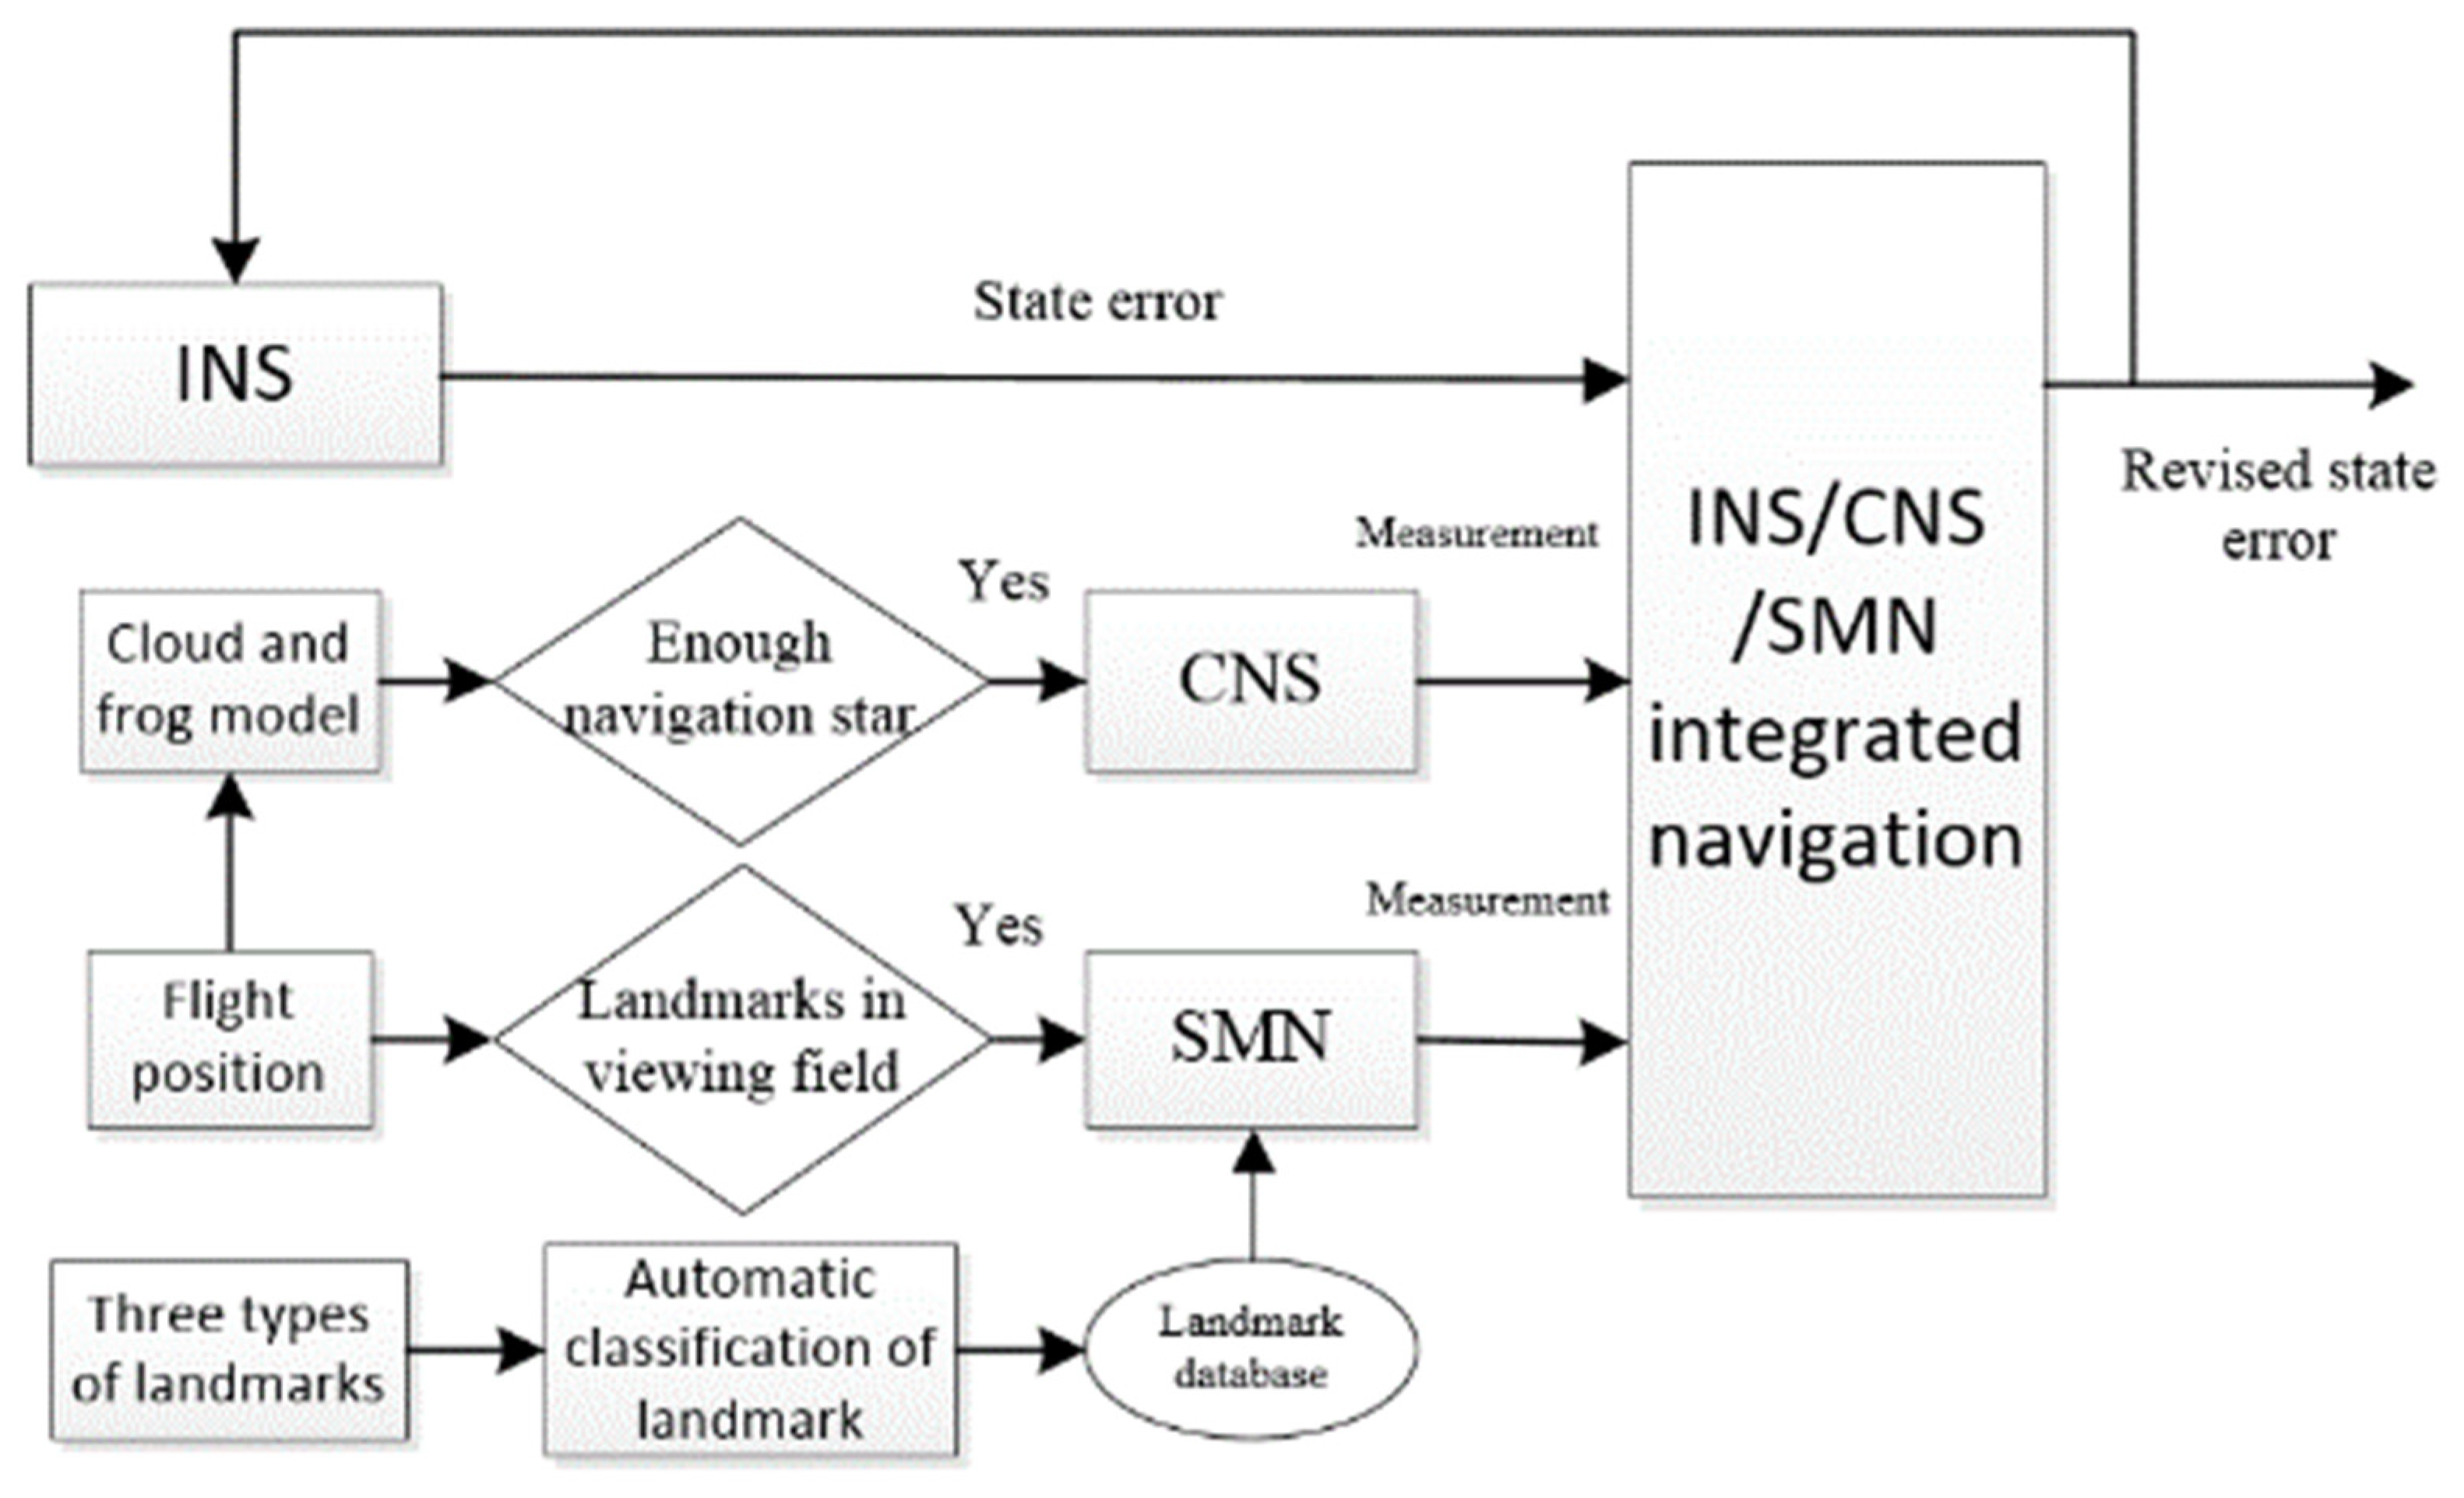
Figure 1. Structure of the INS/CNS/SMN integrated navigation.
Remotesensing 16 00612 g001
Figure 2. Typical images of the three types of landmarks. (a,d) Type I landmarks; (b,e) Type II landmarks; (c,f) Type III landmarks.
Remotesensing 16 00612 g002
Figure 3. Automatic classification model of three types of landmarks.
Remotesensing 16 00612 g003
Figure 4. Matching strategies of the three types of landmarks.
Remotesensing 16 00612 g004
Figure 5. Landmark usability evaluation algorithm framework.
Remotesensing 16 00612 g005
Figure 6. Schematic diagram of camera field of view range and parameters. (a) Camera field of view range; (b) camera parameters.
Remotesensing 16 00612 g006
Figure 7. Landmark visible range.
Remotesensing 16 00612 g007
Figure 8. Relative relationship of the landmark visible range.
Remotesensing 16 00612 g008
Figure 9. Position distribution of landmarks. (a) Type I landmarks; (b) Type II landmarks; (c) Type III landmarks; (d) All landmarks.
Remotesensing 16 00612 g009
Figure 10. Observable probability cloud map of different types of landmarks at H = 5000 m. (a) Type I landmarks. (b) Type II landmarks; (c) Type III landmarks; (d) All landmarks.
Remotesensing 16 00612 g010
Figure 11. Observable probability cloud map of different types of landmarks at H = 7500 m. (a) Type I landmarks; (b) Type II landmarks; (c) Type III landmarks; (d) All landmarks.
Remotesensing 16 00612 g011
Figure 12. Observable probability cloud map of different types of landmarks at H = 10,000 m. (a) Type I landmarks; (b) Type II landmarks; (c) Type III landmarks; (d) All landmarks.
Remotesensing 16 00612 g012
Figure 13. Simulation of the cloud and fog model and the visible satellites. (a) Cloud and fog model; (b) visible satellites (blue area denotes the field of view range and red area denotes the occlusion range of cloud and fog).
Remotesensing 16 00612 g013
Figure 14. Simulation results at the height of H = 8000–10000 m. (a) Radial error; (b) latitude error; (c) longitude error; (d) availability of CNS; (e) number of satellites; (f) landmark types.
Remotesensing 16 00612 g014
Figure 15. Simulation results at the height of H = 2000–5000 m. (a) Radial error; (b) latitude error; (c) longitude error; (d) availability of CNS; (e) number of satellites; (f) landmark types.
Remotesensing 16 00612 g015
Figure 16. Simulation results at the height of H = 5000–8000 m. (a) Radial error; (b) latitude error; (c) longitude error; (d) availability of CNS; (e) number of satellites; (f) landmark types.
Remotesensing 16 00612 g016
Figure 17. Simulation results at the height of H = 2000–10,000 m. (a) Radial error; (b) latitude error; (c) longitude error; (d) availability of CNS; (e) number of satellites; (f) landmark types.
Remotesensing 16 00612 g017
Table 1. Distribution of cloud radius in different seasons.
MonthSeasonLow Cloud
Radius (km)
Middle Cloud
Radius (km)
High Cloud
Radius (km)
3–5spring[74, 134][62, 122][65, 125]
6–8summer[60, 120][69.5, 130][93.7, 154]
9–11autumn[66, 126][67, 127][84, 144]
12–2winter[76, 136][68, 128][61, 121]
Table 2. Moving speed and direction of cloud and fog in different seasons.
MonthSeasonLow Cloud Speed (m/s)Middle Cloud Speed (m/s)High Cloud Speed (m/s)Fog Speed (m/s)Moving Directionα (∘)
3–5spring[4, 16][14, 26][24, 36][1, 7]east0
6–8summer[9, 21][14, 26][39, 51][3, 9]southwest225
9–11autumn[11.8, 23.8][31.5, 43.5][50.3, 62.3][4.5, 10.5]northeast45
12–2winter[14, 26][34, 46][34, 46][5, 11]northeast45
Table 3. Prediction results of landmark classification model.
Predict
Number
Correct
Number
Wrong
Number
Prediction
Accuracy
Type I
landmark
330100%
Type II
landmark
3029196.67%
Type III
landmark
1615193.75%
Table 4. The matching probability of three types of landmarks at different heights.
HeightMatching Probability
Type I
Landmark
Type II
Landmark
Type III
Landmark
H = 5000 m10.880.93
H = 7500 m0.990.850.89
H = 10,000 m0.960.810.83
Table 5. Simulation results of CNS effective probability in different altitude range.
Altitude Range (m)8000–10,0002000–50005000–80002000–10,000
CNS effective
probability
10.790.910.41
Disclaimer/Publisher’s Note: The statements, opinions and data contained in all publications are solely those of the individual author(s) and contributor(s) and not of MDPI and/or the editor(s). MDPI and/or the editor(s) disclaim responsibility for any injury to people or property resulting from any ideas, methods, instructions or products referred to in the content.