Abstract
Comprehending the spatiotemporal dynamics and driving factors of small and micro wetlands (SMWs) holds paramount significance in their conservation and sustainable development. This paper investigated the spatiotemporal evolution and driving mechanisms of SMWs in the Yellow River Basin, utilizing buffer zones, overlay analysis, and the Geodetector model based on Landsat satellite images and an open-surface water body dataset from 1990 to 2020. The results revealed that (1) from 1990 to 2020, SMWs in the Yellow River Basin exhibited an overall pattern of fluctuation reduction. The total area decreased by approximately 1.12 × 10⁵ hm2, with the predominant decline occurring in the 0–1 hm2 and 1–3 hm2 size categories. In terms of spatial distribution, SMWs in Qinghai and Gansu decreased significantly, while the SMWs in Inner Mongolia, Henan, and Shandong gradually increased. (2) From 1990 to 2020, SMWs were mostly converted into grassland and cropland, with some transformed into impervious water surface and barren, and only a small percentage converted into other land types in the Yellow River basin. (3) The alterations in SMWs were influenced by factors, with their interplay exhibiting nonlinear or bilinear enhancement. Among these factors, annual precipitation, elevation, and potential evapotranspiration were the primary natural factors influencing the changes in the distribution of SMWs. On the other hand, land use cover type, gross domestic product (GDP), and road distance were the main anthropogenic factors.
1. Introduction
Wetlands stand out as among the most intricate and fragile ecosystems globally, offering invaluable ecosystem services, including but not limited to water conservation, carbon sequestration, and the preservation of biodiversity [1]. As integral components of the wetland ecosystem, small and micro wetlands (SMWs) fulfill crucial ecological functions such as purifying water quality [2], regulating regional climate [3], providing habitats for certain amphibians and waterfowl [4,5], better protecting endangered and rare species, and are of great significance for biodiversity conservation [6,7]. Due to their heightened sensitivity to environmental changes, the degradation or disappearance of these wetlands can undermine the overall structure and function of an ecosystem network [8]. Recognizing this, the Ramsar Convention of the Parties (COP14) resolution titled “Enhancing the conservation and management of small wetlands” underscored the significance of safeguarding and restoring small wetlands. The adoption of this resolution indicates that more attention will be paid to SMWs in their protection, restoration, and management in the future [9]. In alignment with this global recognition, the Chinese National Forestry and Grassland Administration has taken steps by issuing standards for the ‘Specification for conservation and management of small wetlands’. Additionally, pilot projects for the protection and sustainable use of SMWs have been initiated in various regions, including Beijing, Shanghai, Hubei, Chongqing, Jiangsu, and other provinces and cities [10]. These efforts reflected a growing acknowledgment of the importance of these smaller wetlands and a commitment to their conservation and sustainable management.
In recent years, research on SMWs has gradually attracted global attention [2,11,12,13,14,15,16,17,18]. For instance, Cheng et al. [19] discovered the significant role of independent small wetlands in nutrient retention in the USA. Riley et al. [20] investigated the impact of hydrological cycle changes in small isolated wetlands on ecological functions. Atkinson et al. [5] found that seasonal small wetlands at the landscape scale play a crucial role in maintaining biodiversity, with their hydrological characteristics influencing amphibian productivity and community dynamics. Apart from investigating the functions and characteristics of SMWs, an escalating number of researchers have turned their attention to SMW monitoring, which is achieved through field surveys, unmanned aerial vehicles (UAV), and remote sensing technologies [21,22,23]. Among these methods, remote sensing technology has long timeliness and large coverage, and wetland information extraction is mainly based on medium-resolution satellite images such as Landsat and Sentinel [24,25]. Noteworthy studies include that by Mwita et al. [26], which identified 51 small wetlands in Kenya and Tanzania, producing detailed distribution maps. Geant et al. [27] evaluated the potential distribution of small wetlands in the South Kivu Province. Gxokwe et al. [28] detected and mapped semi-arid season wetlands in South Africa. These studies revealed that SMWs research primarily concentrated on relatively small spatial scales or specific time periods, especially in geographically independent SMWs. And there is a lack of monitoring and research on the distribution of SMWs at a larger regional scale, so we aim to research SMWs in a large region based on remote sensing and hydrological data. Most of the previous studies have focused on geographically independent small wetlands, but many of them were not independent units and were affected by large river systems. Therefore, monitoring SMWs at the large watershed scale could provide guidance for the protection and management of regional SMWs.
Moreover, some studies by Hu and Wang et al. [29,30] have indicated that wetlands are currently facing threats from factors such as climate change and human activities. So, understanding how these factors influence the distribution of small wetlands is critical [31,32,33]. The Geodetector model, a statistical method grounded in spatial analysis of variance, plays a pivotal role in detecting spatial heterogeneity and exploring its driving mechanisms [34]. The model effectively overcomes the inherent limitations of traditional statistical methods by accurately identifying individual factors’ contributions and interactions, while examining significant differences among populations [35,36]. The Geodetector model was widely used in urban development, risk assessment, remote sensing, vegetation dynamics, wetland changes, and other research fields to explore the spatial changes in research objects under different backgrounds and their influencing factors [37,38,39,40,41]. Therefore, our research used the Geodetector model to explore the influence of potential factors on the distribution changes in SMWs.
The Yellow River serves as the lifeline for the economic and social development of China, carrying approximately 2% of the nation’s river flow to meet 12% of the population’s and 15% of the arable land’s water demand [42]. The total area of wetlands in the Yellow River basin is estimated to be over 3.9 million hectares [42], playing a crucial role in maintaining regional and national ecological security. However, there has been no published research on SMWs in this region. So, we analyzed the spatiotemporal dynamic changes in SMWs from 1990 to 2020 in the Yellow River Basin. In addition, we quantified the contribution of both natural and anthropogenic elements to changes in SMWs. Compared with the paper our group published before [43], we focus on SMWs rather than open-surface water bodies in the Yellow River Basin. The outcomes are poised to provide substantial scientific data support and guidance for the protection, restoration, and sustainable management of SMWs in the Yellow River Basin.
2. Materials and Methods
2.1. Study Area
The Yellow River originates from the northern foothills of the Bayan Har Mountains on the Qinghai–Tibet Plateau. It traverses the Loess Plateau, the Huang–Huai-Hai Plain, and finally empties into the Bohai Sea. The geographical coordinates of the Yellow River are between 32°9′N–41°50′N and 95°53′E–119°18′E, exhibiting significant variations in terrain elevation. The total area of the basin is approximately 795,000 km2, passing through nine provinces: Qinghai, Sichuan, Gansu, Ningxia, Inner Mongolia, Shaanxi, Shanxi, Henan, and Shandong. The main stem of the river spans a total length of 5464 km [43]. Above Hekou Town are the upper reaches of the Yellow River, with a length of 3472 km and a basin area of 428,000 km2. The middle reaches from Hekou Town to Peach Blossom Valley, with a river length of 1206 km and a watershed area of 344,000 km2. Below the downstream of Peach Blossom Valley, the river stretches of 786 km, covering a basin area of only 23,000 km2 [44].
The climate types include arid, semi-arid, and semi-humid conditions in the basin. The average annual temperature in the Yellow River Basin is 9.4 °C, and precipitation is significantly influenced by the monsoon, with an average annual precipitation of 466.6 mm [45]. Precipitation exhibits noticeable spatial variations, gradually increasing from northwest to southeast, with a nearly 7-fold difference between the maximum and mini-mum values [46]. The hydrological characteristics of the Yellow River basin exhibit distinct seasonal patterns, with high temperatures and abundant rainfall in summer, and cold temperatures with limited precipitation, including ice periods and ice jams in some sections, during winter [47]. The wetlands in the basin cover 3,929,138.6 hectares, constituting 4.94% of the total area [42]. These wetlands encompass riverine, lake, marsh, estuarine delta, and coastal salt marsh types, distributed from the source to the estuary. Figure 1 shows the distribution of wetlands, elevation, and four typical regions: Hajiang Salt Lake (Figure 1d), Sand Lake (Figure 1e), Shenglihaizi, Lashanmiaohaizi et.al. lake groups (Figure 1f), and a region of Yellow River Delta (Figure 1g) in the Yellow River in 2020.
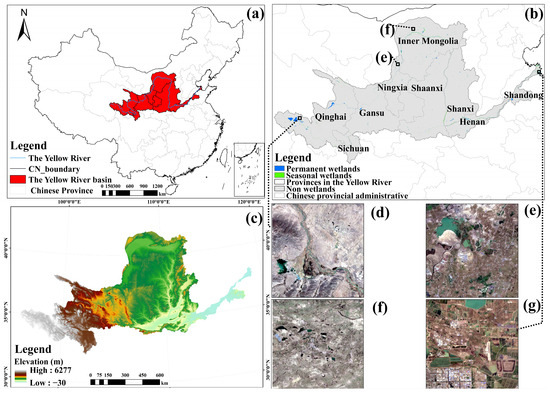
Figure 1.
The wetlands resource distribution overview (a), elevation (c), and location of four representative regions (b): Hajiang Salt Lake (d), Sand Lake (e), Shenglihaizi, Lashanmiaohaizi et al. lake groups (f), and a region of Yellow River Delta (g) in the Yellow River Basin the in 2020.
2.2. Data Sources
The open-surface water data utilized in this study were sourced from an internally developed long-term time series dataset of the Yellow River basin within our research group. The dataset was extracted with a combination of mNDWI, NDVI, and EVI methods from Landsat 4, 5, 7, and 8, with a spatial resolution of 30 × 30 m, where classification outcomes were validated using the Kappa coefficient (=0.90) and overall accuracy verification (>95%), indicating a high level of classification accuracy [48]. In this dataset, the frequency of water body was divided into 25% and 75% by the frequency of pixels, with a frequency greater than 75% being classified as a permanent water body and 25–75% as a seasonal water body. The details are shown in Table 1.

Table 1.
Description of data used in this study.
In order to extract SMWs more accurately in the Yellow River Basin, this study collected relevant water system data in the Yellow River Basin to eliminate large water bodies and supplemented them with validation: water system linear vector data of 1:100,000 Yellow River basin and 1:250,000 lake distribution. Climate elements such as temperature and precipitation were sourced from the dataset developed by Peng et al. [49]. The potential evaporation data were based on the 1 km month-by-month mean, minimum, and maximum temperature dataset for China, obtained using the Hargreaves potential evaporative dispersion calculus, with the national 1 km resolution DEM as the covariate. Anthropogenic factors such as population density, gross domestic product (GDP), night light index, and road and land use/land cover (LULC) data sources are shown in Table 1 [50]. Notably, the distance to the main roads was computed through Euclidean distance analysis based on the acquired road dataset.
2.3. Methods and Techniques
The research methodology, depicted in Figure 2, comprises two primary components. The first part involves SMWs extraction. Leveraging Landsat satellite imagery from 1990 to 2020 and our internally developed open-surface water body dataset for the Yellow River basin, we identified SMWs with an area less than 8 hectares. Buffer creation in the Yellow River basin water system vector data was employed to mitigate the influence of large rivers. The final SMWs datasets were extracted using the overlay tool in ArcGIS 10.8, followed by a comprehensive accuracy verification using a confusion matrix. The second part focuses on exploring the driving factors of SMWs. Given the diversity and complexity of these factors, our analysis was divided into quantitative and qualitative dimensions. Quantitatively, the Geodetector model was utilized to investigate the impact of climate, human activities, and other factors on the distribution changes in SMWs. A Markov transition matrix was employed to examine the relationship between SMWs and land use-type changes, particularly highlighting the impact of urbanization on these wetlands. Qualitatively, we conducted a literature review, discussing the impact of events such as tourism, dust storms, and water pollution on SMWs.
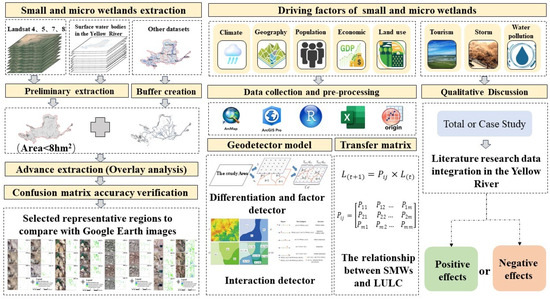
Figure 2.
A method flowchart of this study.
2.3.1. SMWs Dynamic Analysis
According to existing studies and wetland protection regulations [51,52], in this study SMWs are defined as open-surface water bodies with an area of less than 8 hectares on a permanent or seasonal basis.
First of all, we initially extracted SMWs from the developed water body dataset in the Yellow River basin based on area conditions [48]. However, larger surface water fragments, such as the main stream and major tributaries of the Yellow River, impacted the accuracy of our extraction. To address this, we utilized river vector data from the National Data Center, establishing buffers of varying widths centered on the Yellow River’s River lines. We employed water system data to create buffer zones ranging from 100 m to 1.5 km. After a thorough evaluation of extraction results across these diverse buffer zone ranges, a buffer zone of 200 m was determined to be optimal for effectively removing large water bodies. This aimed to exclude the influence of large river bodies and prevent misclassification of SMWs. Subsequently, accuracy verification of the extracted dataset was conducted, achieving satisfactory results based on the kappa coefficient and overall accuracy assessment, ensuring data accuracy and reliability. These meticulous steps collectively led to the acquisition of high-quality datasets for SMWs within the Yellow River Basin, spanning the years 1990 to 2020. Finally, we selected four representative regions for comparison with Google images and used the confusion matrix to calculate the SMWs extraction accuracy.
2.3.2. Analysis of Transition between SMWs and Land Use Types
To comprehend the transformation process of SMWs over the past 30 years, we utilized the LULC transfer matrix to analyze the transformation between SMWs and other land types.
In the aforementioned formula, and represent the type of land use at (t + 1) and (t), while denotes the transition probability matrix for land cover changes under a specific scenario. The range of values for (i, j = 1, 2, …, m) is within the interval [0, 1] [53].
2.3.3. Analysis of Driving Factors behind SMWs Changes
Factors Selection
Previous studies have indicated that both natural environmental factors and human activities exert varying degrees of influence on wetlands [54,55], suggesting that both likely drive changes in SMWs, which are also integral parts of wetland ecosystem. Combined with their ecological functions and characteristics, we speculated that these factors may also affect SMWs in the Yellow River Basin. To quantify the effects of these two factors on SMWs, we subdivided the natural climate factors into precipitation, temperature, and potential evaporation. At the same time, due to the great elevation difference between east and west of the Yellow River basin, we considered adding elevation as topographic factor. Human activity factors were subdivided into: population density, land use type, night light index, and road construction.
To investigate the driving factors of SMWs changes, this study selected five individual factors (population density (X1), average GDP (X2), nighttime light index (X3), distance to major roads (X4), and land use type (X5)). Four natural factors, namely, annual average temperature (X6), annual precipitation (X7), potential evapotranspiration (X8), and elevation (X9), were independent variables. The change of area in SMWs (Y) was the dependent variable for analyzing SMWs changes in the Yellow River Basin (Table 2 and Table 3). Due to variations in the resolution of different datasets, it became necessary to integrate various factors and the extracted SMWs to unify the data resolution size, so as to analyze the spatial differentiation of factors affecting the distribution changes in SMWs at the same location. Consequently, we employed the Fishnet tool to generate a set of elements containing a network of rectangular pixels, unifying the grid resolution for subsequent extraction of multiple variable values to the point. Thus, we obtained a dataset of independent variables (different drivers) and dependent variables (extracted SMWs) of the same resolution. Based on Creating Fishnet in ArcGIS 10.8, we selected the optimal scale of a 2 km 2 km grid with sample points generated after numerous iterations. The Geodetector model requires the input variables to be of the discrete type. Therefore, these selected factors underwent discrete transformation and were systematically regrouped into nine distinct categories by the natural breakpoint method (Figure 3). Following this, data pertaining to each variable sample point was systematically extracted. Subsequently, the Geographical Detector model was employed to rigorously quantify both the contribution and the interrelationships among the driving factors influencing SMWs.
Table 2.
Driving factors of SMWs changes.
Table 3.
Factors grading standards.
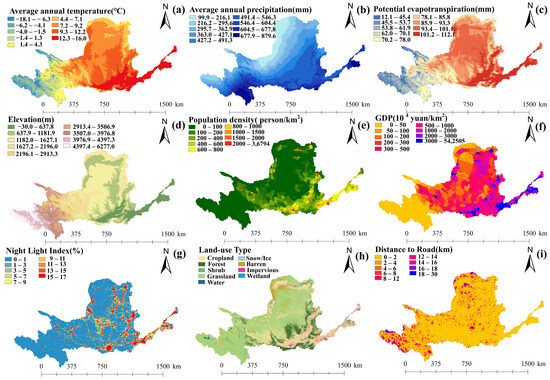
Figure 3.
Spatial distribution characteristics of average annual temperature (a), average annual precipitation (b), potential evapotranspiration (c), elevation (d), population density (e), GDP (f), night light index (g), land use and land cover (h), and distances to main roads (i).
The Geodetector Model
In this research paper, the analysis of driving factors influencing changes in SMWs primarily employed factor and interaction detectors.
- (1)
- Differentiation and factor detector
This detector was applied to ascertain the spatial heterogeneity of variable Y and the explanatory power of a factor X on the spatial heterogeneity of Y. The q statistic value, a valuable metric, was employed to quantify the explanatory power of factors driving the variation in SMWs.
The module was used to detect the spatial heterogeneity of variables and the extent to which factors explained the spatial heterogeneity of variables. The q statistic value, a valuable metric, was employed to quantitatively detect the explanatory degree of driving factors for the spatial differentiation of SMWs. The general form was as follows:
In the aforementioned formula, h = 1, …; L represents the strata of variable Y or factor X, also referred to as categories or zones; and denote the number of units in stratum h and the entire study area; and represent the variance of Y values in stratum h and the entire area, and SSW and SST represent the within sum of squares and total sum of squares, respectively [56]. The q statistic value ranges from [0, 1], with a higher value indicating a more pronounced spatial heterogeneity of Y [36]. If the strata are generated by the independent variable X, a larger q-value signifies a stronger explanatory power of the variable for attribute Y and, conversely, a weaker explanatory power if the q-value is smaller [57,58]. In this study, a higher q-value indicates a stronger explanatory power of the factor for the variation in SMWs.
- (2)
- Interaction detector
This detector was designed to assess the impact of the dependent variable Y on the explanatory power when two factors jointly influence it. The evaluation methodology involves initially computing the q-values for each factor, X1 and X2, concerning Y, denoted as q(X1) and q(X2), respectively. Subsequently, the q-value for their interaction, q(X1∩X2), was calculated. A comparative analysis was then conducted by comparing the values of q(X1), q(X2), and q(X1∩X2), as outlined in Table 4, to elucidate the relationship between the two factors [48,49].
Table 4.
The possibility of interaction detector.
3. Results
3.1. Dynamic Changes in SMWs in the Yellow River Basin
This study employed spatial analysis methods for the extraction of SMWs. To validate the accuracy of extraction, we selected four representative regions in the study area and compared them with Google Earth images. The cross-validation results, as shown in Table 5, indicate that the classification results have been verified through Kappa coefficients and overall accuracy assessments (91.5%), demonstrating a high level of classification accuracy.
Table 5.
The result of confusion matrix of the accuracy assessment for the entire study area.
As shown in Figure 4a, the area of SMWs generally showed a trend of fluctuation and decline from 1990 to 2020 in the Yellow River Basin, in which the seasonal SMWs were consistent with the overall change trend, while the permanent SMWs had no obvious overall fluctuation, and the area in 2020 was reduced compared with that in 1990. From 1990 to 2020, the total area of SMWs decreased by about 1.12 × 10⁵ hm2 (square hectometer), of which the permanent SMWs decreased by about 43% and the seasonal SMWs decreased by 54%.
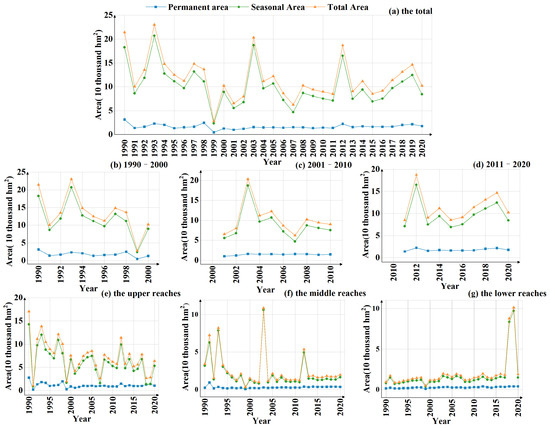
Figure 4.
Interannual variations in area in SMWs: the complete times of the SMWs in the entire study regions (a); 1990–2000 (b), 2001–2010 (c), and 2011–2020 (d); the upper (e), middle (f), and lower reaches (g).
To gain a more comprehensive understanding of the spatiotemporal dynamic changes occurring in SMWs within the Yellow River Basin, this study stratified the interannual changes in SMWs from a spatiotemporal perspective. To commence the analysis, each decade was considered as a research interval. The examination of changes in the total area of SMWs revealed a fluctuating decline across three distinct periods: 1990 to 2000 (Figure 4b), 2001 to 2010 (Figure 4c), and 2011 to 2020 (Figure 4d). Notably, the peak area of SMWs occurred in 1993, 2003, and 2012 within their respective intervals, while the smallest areas were observed in 1999, 2007, and 2015. The trends in the seasonal SMWs areas mirrored in the overall changes, but the area of permanent SMWs exhibited significant fluctuations. Specifically, there was a notable decrease in the period of 1990–1991 and 1998–1999, while an increase was observed in 2011–2012.
After the spatial stratification, the variation trend in SMWs area from 1990 to 2020 was more obvious. The changes of area in SMWs in the upper reaches were closely related to the whole basin, showing a trend in fluctuation and decline (Figure 4e), and the change trends in seasonal and permanent SMWs were consistent. The SMWs in the middle reaches also fluctuated and declined in general (Figure 4f), while the SMWs in the lower reaches did not change significantly from 1990 to 2017, showed a substantial increase in 2018, and then declined after reaching a peak in 2019 (Figure 4g). It is worth noting that the total area of wetland in the upper reaches was smaller in 1991,1999, and 2007, and the total area was larger in 1993, 2003, and 2012. In general, during the whole study period, the SMWs in the Yellow River Basin were mainly composed of seasonal SMWs, and the permanent and seasonal SMWs in 2020 declined compared with those in 1990.
Comprehending the distribution of various sizes SMWs in the upper, middle, and lower reaches of the Yellow River Basin, as well as in diverse administrative regions, proves instrumental for guiding subsequent efforts in the protection and restoration of these ecosystems. Therefore, this study divided SMWs into four levels: 0–1 hm2, 1–3 hm2, 3–5 hm2, and 5–8 hm2, and explored their spatial distribution from 1990 to 2020.
From the perspective of the interannual variation trends of the four levels of micro-wetlands from 1990 to 2020, the variation trends in seasonal SMWs and general SMWs are very similar, while the changes in permanent SMWs are significantly different from the two before. In detail, 0–1 hm2 and 1–3 hm2 permanent SMWs demonstrated a fluctuating decline, while the 3–5 hm2 and 5–8 hm2 permanent SMWs decreased slowly in the upper reaches (Figure 5a). In addition, the area of the four types of permanent SMWs fluctuated and increased, especially in the lower reaches (Figure 5b,c). However, the changes in seasonal SMWs of 0–1 hm2 and 1–3 hm2 fluctuated and decreased in the upper and middle reaches, and the other two types decreased slowly (Figure 5d,e). The four types of seasonal SMWs fluctuated and increased, among which the area of 0–1 hm2 and 1–3 hm2 seasonal SMWs in 2020 increased by about twice compared with in 1990 in the upper reaches. Moreover, we found that the total area of SMWs exhibited phased peaks in 1993, 2003, and 2013, and the total area of SMWs in 1999 and 2007 was significantly smaller, which was closely related to the changes in the four grades of SMWs, especially the smaller grades of dominated SMWs (Figure 5g–i).
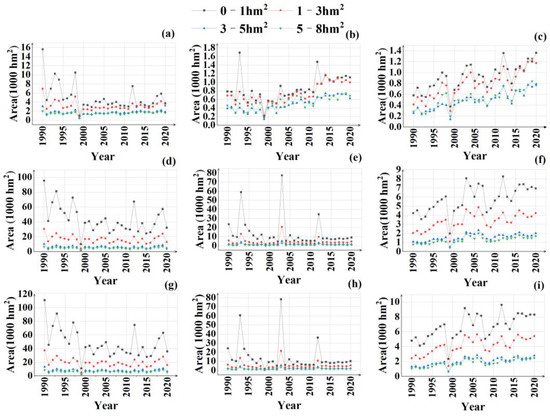
Figure 5.
Interannual changes in four levels of SMWs in the upper, middle, and lower reaches of the Yellow River Basin from 1990 to 2020: permanent SMWs in the upper (a), middle (b), and lower (c) reaches of the Yellow River; Seasonal SMWs (d–f); the total SMWs (g–i).
Figure 6 illustrates the spatial distribution and proportion of SMWs in provinces. In the Yellow River basin, SMWs were mainly distributed in Qinghai, with an average proportion of 43%. The results revealed that SMWs area in the Yellow River Basin is predominantly within the 0–1 hm2 and 1–3 hm2 categories, constituting ordinary percentages of 53% and 27%, respectively. The area of SMWs in different provinces changed, among which the SMWs in Qinghai and Gansu decreased significantly, and the SMWs in Shandong and Inner Mongolia increased significantly. In addition, the spatial composition of SMWs within each province underwent significant transformations. Notably, the proportion of 0–1 hm2 in each province decreased in 2000, averaging at 50%. Before 2000, numerous SMWs were present along the Yellow River and its surrounding water systems in Qinghai and Gansu. By 2020, the distribution of SMWs in the middle and lower reaches increased.
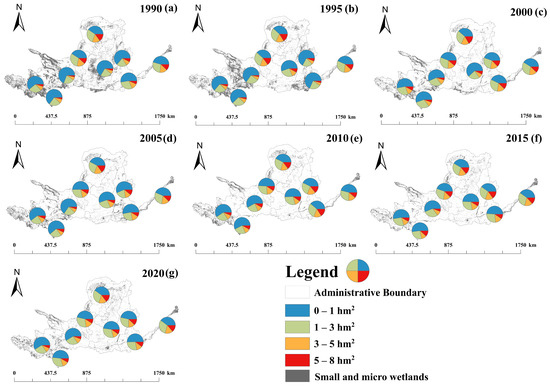
Figure 6.
SMWs changes in the Yellow River Basin from 1990 (a) to 2020 (g). (The pie chart represents area proportion of four types of SMWs in each province, every five years as a figure).
Further analysis of the changes in permanent and seasonal SMWs in the provinces showed that the permanent SMWs decreased significantly in Qinghai and Gansu and increased slightly in Shandong and Ningxia, but the changes were not obvious in other provinces (Figure 7). The seasonal SMWs decreased significantly in Qinghai and Shaanxi, but increased significantly in Shandong and Inner Mongolia, which confirmed the decrease in SMWs from 1990 to 2020.
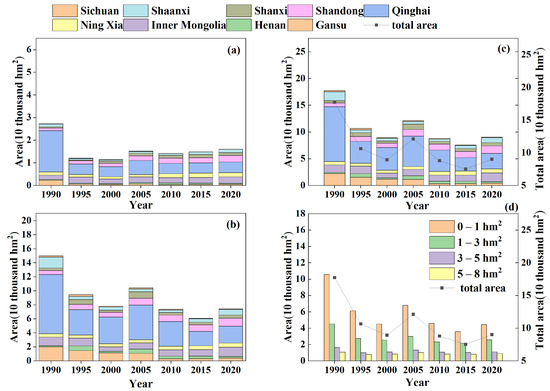
Figure 7.
SMWs changes in nine provinces in the Yellow River Basin: permanent (a), seasonal (b) total area of small and wetlands (c), and four types SMWs from 1990 to 2020 (d).
3.2. Relationship between SMWs and Land Use in the Yellow River Basin
Wetlands constitute a significant component of land use types. Investigating the transformation of SMWs and their interrelations with other land use categories is instrumental in comprehending both the intrinsic and extrinsic evolution of wetlands, offering valuable insights into the patterns governing wetland transformations and aiding in the formulation of enhanced strategies for wetland preservation and conservation.
A Markov matrix was used to analyze the transformation relationships among sea-sonal SMWs, permanent SMWs, and non-wetlands (Figure 8). During the whole study period from 1990 to 2020, the transition between different types of SMWs was mainly manifested as the change from permanent SMWs to seasonal SMWs, the proportion of seasonal to permanent SMWs was small, and the proportion of non-wetlands to SMWs was less than 5%. From 1990 to 1995, the changes in wetland types were similar: about 35% of permanent SMWs were transformed into seasonal SMWs, 10% of seasonal SMWs were transformed into permanent SMWs, and less than 5% of non-wetlands were transformed into permanent SMWs. During 1995–2000 and 2005–2010, about 25% of permanent SMWs changed to seasonal SMWs, and about 17% of seasonal SMWs changed to permanent SMWs. The net loss of permanent SMWs was the largest. In the study intervals of 2000–2005, 2010–2015, and 2015–2020, the transition between seasonal and permanent micro wetlands remained relatively stable, and the transition from seasonal SMWs to non-wetlands was more than that of permanent SMWs.
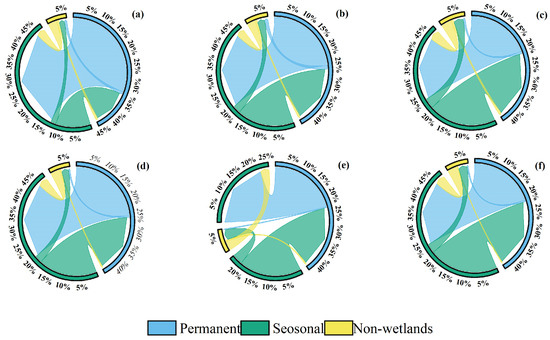
Figure 8.
Choral map of transfer of SMWs types: 1990–1995 (a), 1995–2000 (b), 2000–2005 (c), 2005–2010 (d), 2010–2015 (e), 2015–2020 (f).
To further explore the relationship between the changes in seasonal SMWs, permanent SMWs, and changes in land use types, this study analyzed the land use transition matrix between 1990 and 2020 (Figure 9). All land use types changed, and impervious water surface had expanded nearly three times, from 1.2% to 3.1%. The main source of impervious water in 2020 was cultivated land, followed by grassland and unused land. From 2015 to 2020, among all land use types, the area transferred from grassland was the largest, and the main type of transformation was cropland, accounting for 36.1% of the area of grassland outflow. In addition, the water body changed obviously, and the transformation types were mainly cropland and grassland. In the past 30 years, the transformation of SMWs has been obvious, with grassland and farmland accounting for 19.0% and 13.2%, impervious surface accounting for 11.4%, and barren accounting for 13.1%. The conversion rates of seasonal and permanent SMWs to wetland types were negligible.
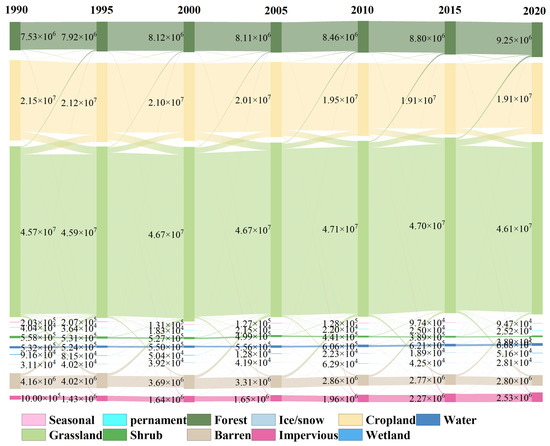
Figure 9.
Sankey map of SMWs and other land use types from 1990 to 2020.
In summary, the reduction in SMWs mainly turned into grassland and cropland, with some transformed into impervious water surface and barren and a very little portion transformed into other land types from 1990 to 2020.
3.3. Analysis of Driving Factors in SMWs Distribution Changes
The analysis of the driving factors influencing changes in SMWs involved a comprehensive examination using factor detector, determined through the calculation of their q values, as illustrated in Figure 10. The q-value serves as a statistical metric quantifying the impact of these factors on the spatial distribution of SMWs, with a range from 0 to 1. Within the context of factor differentiation detection, a higher q-value associated with a particular factor signifies a more pronounced impact on the spatial distribution, while a lower q-value indicates a diminished effect. In extreme cases, a q-value of 1 denotes complete control of the spatial distribution of SMWs by the factor in question, whereas a q-value of 0 signifies a lack of any discernible relationship between the factor and the distribution of SMWs. Over the period from 2000 to 2020, the impact of influencing factors on SMWs displayed some fluctuations. While the influence of annual mean temperature and land use coverage factors increased, other factors such as elevation, potential evapotranspiration, annual average precipitation, distance from main roads, night light index, GDP, and population density showed a declining fluctuation tendency.
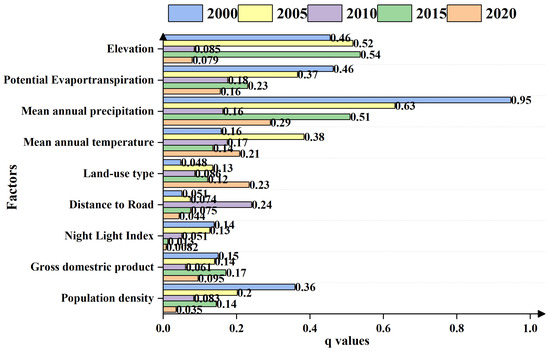
Figure 10.
The factors’ q-value for the spatial differentiation of SMWs from 2000 to 2020.
In 2000, the hierarchical ranking of the explanatory efficacy of individual driving factors contributing to the alterations in SMWs was delineated from the most impactful to the least influential: Mean annal precipitation (PRE) > potential evapotranspiration (EVA) > elevation (ELE) > population density (POP) > mean annal temperature (TEM) > gross domestic product (GDP) > night light index (NLI) > distance from main roads (RD) > land use and land cover (LULC). In 2005, the ranking was as follows: PRE > ELE > TEM > EVA > POP > GDP > LULC > NLI > RD. In 2010, RD > EVA > TEM > PRE > LULC > ELE > POP > GDP > NLI. In 2015, ELE > PRE > EVA > GDP > POP > TEM > LULC > RD > NLI. And by 2020, PRE > LULC > TEM > EVA > GDP > ELE > RD > POP > NLI.
This analysis indicated that before 2010, natural factors contributed significantly to SMWs changes, with annual average precipitation having the most significant explanatory power (q(2000) = 0.95, q(2005) = 0.63, p < 0.01). Commencing from the year 2010, there was an observable augmentation in the explanatory capacity of socio-economic factors. In 2010, RD, POP, and GDP all had explanatory powers exceeding 5%, with the distance from major roads having the highest explanatory power regarding SMWs changes. In 2020, PRE and LULC were the most significant explanatory factors, followed by TEM and EVA. On the contrary, the night light index exhibited the lowest q-value (q < 0.01), indicating a marginal impact on the alterations observed in SMWs. On average, the driving factors’ explanatory powers for SMWs changes rank as PRE > ELE > EVA > TEM > LULC > GDP > RD > NLI. The factor detector results suggest that SMWs changes were primarily influenced by annual average temperature and changes in land use types driven by both natural and anthropogenic activities.
The outcomes of the interaction analysis, as illustrated in Figure 11, unveiled the presence of solely two discernible types of interactions among the driving factors: bilinear enhancement and nonlinear enhancement. This signified that, within the nine selected factors analyzed in this study, the interactions between any two factors were more robust than those involving any single factor. Remarkably, there were no indications of weakening effects. These findings implied that the collective influences of diverse factors exerted a more potent explanatory influence on alterations in SMWs compared to the impact of individual factors. Moreover, they manifested more proactive driving roles in shaping the dynamics of these wetlands.
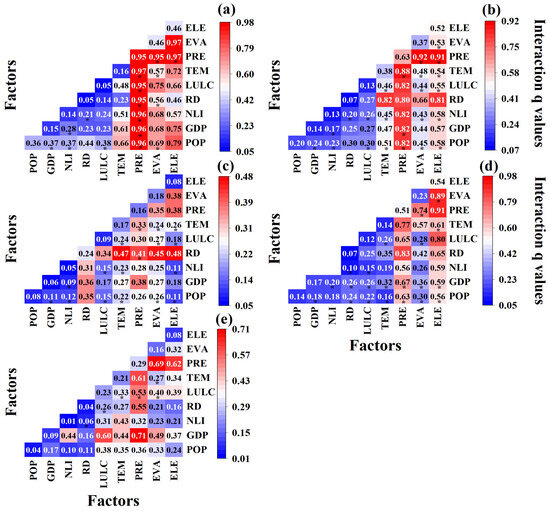
Figure 11.
The q values of factors interactions from 2000–2020: 2000 (a), 2005 (b), 2010 (c), 2015 (d), 2020 (e). Note: * represents bilinear enhancement.
In 2000, the Geodetector model was used to identify significant interactions influencing the distribution of SMWs. Average annual precipitation exhibited the strongest impact, particularly when interacting with average annual temperature and elevation (interaction degree: 0.97). Natural factors like potential evapotranspiration and elevation also played a role. This trend persisted in 2005, emphasizing the substantial influence of average annual precipitation, especially in conjunction with potential evapotranspiration. By 2010, road distance emerged as a prominent factor, particularly when interacting with elevation, indicating heightened distribution changes in higher-altitude areas due to road development. In 2015, various factors, including annual average precipitation, potential evapotranspiration, gross domestic product, and population density collectively influenced SMWs distribution. Precipitation and elevation stood out among natural factors, while road distance and land cover type were significant anthropogenic influences. In 2020, the joint impact of average annual precipitation and gross domestic product exhibited the highest influence on SMWs distribution (interaction degree: 0.71).
In summary, annual average precipitation stands out as the pivotal factor influencing the distribution of SMWs. Its interactions with other factors exhibited the strongest combined effect, yielding substantial explanatory power. Beyond precipitation, elevation and potential evapotranspiration emerged as primary natural determinants shaping the variability in SMWs distribution. Concurrently, road distance, land use/cover types, and gross domestic product surfaced as key anthropogenic influencers affecting the distribution dynamics of these wetlands. Any shifts in driving factors within the study area affected the SMWs distribution, albeit with varying degrees of influence across different years. Nonetheless, the impact of anthropogenic factors was gradually strengthening, while the influence of natural factors was diminishing. By 2020, the main factors affecting the distribution of SMWs were average annual precipitation and gross domestic product.
4. Discussion
4.1. Accuracy of SMWs Extraction
Utilizing high-precision surface water data, this study employed spatial analysis techniques, including area screening and buffer establishment, to extract SMWs in the Yellow River Basin spanning the period from 1990 to 2020. Furthermore, accuracy verification was conducted in four representative regions in the Yellow River Basin. True surface values were obtained through visual interpretation of Google Earth remote sensing images, and the confusion matrix yielded accuracy evaluation results. Overall, the extracted data pertaining to SMWs demonstrated a commendable level, boasting an average accuracy rate of 91.5%. This was substantiated by successful validation through the kappa coefficient, which averaged approximately 0.84. The robust results affirm the precision and reliability of the SMWs dataset extracted in this study.
Nevertheless, the data accuracy in specific regions for individual years exhibits a slight deviation from the overall trend, and potential explanations for these variations are delineated below. Referring to Figure 12I(e), the precision of SMWs extraction in the Hajiang Salt Lake region was notably lower in 2010. This could be attributed to the limited clarity of the Google image reference captured on 12.31 in that year, potentially affected by water icing, thereby influencing the interpretation. In 2005, the accuracy of SMWs in the Sand Lake area was comparatively lower than other years (Figure 12II(d)), potentially due to the close association between SMWs and larger wetlands during that year, resulting in misclassification. Similarly, in 2015, the extraction accuracy of the Shenglihaizi and Lashanmiaohaizi et al. lake groups were marginally reduced (Figure 12III(f)), possibly influenced by the quality of the reference image impacting the translation accuracy. Additionally, the average precision of the permanent SMWS extracted from the four regions was higher than that of the seasonal SMWS. We examined the potential reasons as follows. Firstly, the occurrence frequency of permanent SMWs was higher than that of seasonal SMWs in the annual images, indicating better stability for permanent SMWs. Secondly, the distribution of seasonal SMWs was significantly affected by seasonal changes, such as the reduction in seasonal SMWs due to water evaporation or the drying up of rivers and lakes during the dry season, enhancing the accuracy of visual interpretation for permanent SMWs.
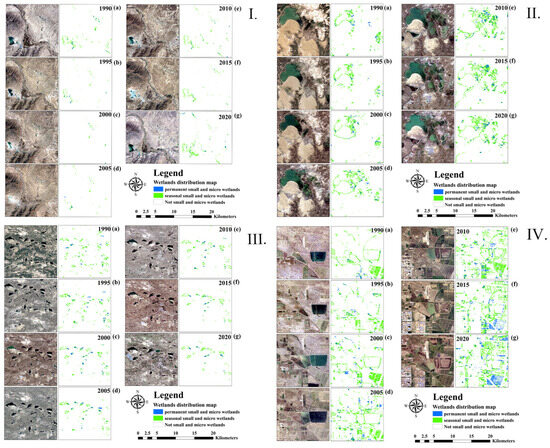
Figure 12.
SMWs in Four regions of the Yellow River Basin in 1990 (a), 1995 (b), 2000 (c), 2005 (d), 2010 (e), 2015 (f), and 2020 (g). (I). Hajiang Salt Lake, (II). Sand Lake, (III). Shenglihaizi, Lashanmiaohaizi et.al. lake groups, and (IV). Yellow River Delta of the Yellow River Basin.
4.2. Drivers of SMWs Changes
This study employed the Geodetector model to quantify the impact of various factors on the distribution changes in SMWs. The results indicated that both natural and human factors jointly drive the distribution changes in SMWs. Notably, annual precipitation emerges as the pre-eminent determinant shaping the spatial patterns of small wetlands. Concurrently, the discernible impact of anthropogenic factors, including road construction, land use classification, and gross domestic product (GDP), progressively manifested itself after 2010. Figure 13 elucidates a coherent correlation between the area of SMWs and average annual precipitation in the Yellow River Basin. In years with increased annual precipitation (2003 and 2012), the area of small wetlands also increased, while periods of reduced precipitation (notably in 1999 and 2015) coincide with a corresponding diminution in the area of SMWs.
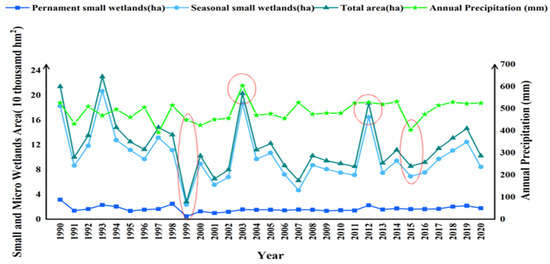
Figure 13.
The interannual variation in SMWs with average annual precipitation changes. Notes: The red circles indicate the peak of the increase or the trough of the decrease in the precipitation of SMWs area and average annual precipitation during the study period.
In some regions, such as the Amu Darya Delta in Central Asia [59], the Inner Mongolia Plateau [60], and Henan Province [61], the changes caused by human activities accounted for a large proportion of wetland changes. Therefore, we also analyzed the relationship between micro-wetland and land cover type in order to explore the impact of urbanization on SMWs. We found that from 1990 to 2020, the net loss area of seasonal wetlands was larger than that of permanent wetlands, and the reduced SMWs were mainly transformed into grassland and cultivated land, indicating that the land use change had a greater impact on the distribution of SMWs. As components of the wetland ecosystem, the distribution of SMWs was also affected by large wetlands. Human activities lead to the fragmentation of large-scale wetlands and the expansion of cultivated land from the edge of wetlands into the core area, affecting the core and edge morphology of wetlands, resulting in wetland erosion [62,63,64,65,66,67], and destroying the connectivity between wetlands [68]. Mao et al. [69] have proved that about 60% of China’s lost natural wetlands were due to agricultural encroachment, and the phenomenon also occurred in other countries and regions of the world [70,71,72]. This explains the conversion of SMWs into agricultural land, which is cultivated by humans to meet the food supply, gradually transformed into small wetlands after human disturbance and fragmentation, and then artificially converted into cultivated land or paddy field for agricultural production.
However, sometimes the increase in SMWs cannot be achieved without the construction of constructed wetlands [73]. Especially in the Yellow River Delta, Yan et al. [74] found that the total area of wetlands in 2020 increased by about 516 km2 compared with 1990, while the natural wetlands decreased by 391.6 km2, which mainly transformed into constructed wetlands such as aquaculture facilities and ponds. Assefa et al. [70] found that the acceleration of urbanization and the enhancement of environmental awareness of human-constructed wetlands such as wetland parks and sewage treatment plants have alleviated the loss of natural wetlands to some extent. In addition, the construction of reservoirs also affects the distribution of SMWs. For example, Yang et al. [75] found that the area of wetlands around Sanmenxia Reservoir decreased significantly from 2001 to 2013, where landscape heterogeneity and biodiversity declined. Zhao et al. [76] found that the seasonal dynamic changes in wetland in Huayuankou Station were mainly caused by the operation of large dams and reservoirs. Furthermore, Albat et al. [77] confirmed that the flood plain wetlands in arid and semi-arid areas of the Yellow River Basin were highly threatened by complex environmental changes, and dam operation intensified the impact on wetland hydrology. Based on the results of this study, it is inferred that the changes in SMWs are inseparable from the stormwater regulation of reservoirs, changes in river runoff, and other factors in the Yellow River.
In order to discuss the possible effects of tourism, water pollution, storms, and extreme weather events on SMWs, we made efforts to gather information on these elements that occurred in the Yellow River basin. Through the integration of relevant literature information (Table 6), we found that tourism caused a further destruction of wetlands in the north of Zhengzhou City [78], while causing lighter harm in the Zhengzhou Yellow River Wetland Nature Reserve [79]. In addition, the negative impact of tourism development on the ecological environment quality of the Yellow River estuary wetland from 2017 to 2021 first increased and then decreased [80]. Through these studies [81,82,83], we learned about the negative impact of water pollution on the Yellow River Delta wetlands posing a threat to their ecological functions. Storms and extreme weather also had negative impacts on wetlands, especially the storm surges in the Yellow River Delta causing erosion in coastal wetlands [84,85]. Extreme precipitation can trigger frequent natural disasters in the Yellow River Basin, and heavy rainfall can also lead to the erosion of wetlands. Due to the high sensitivity of SMWs to environmental conditions, we speculate that these factors may also have a negative impact on SMWs [86,87].
Table 6.
Specific events research in the Yellow River Basin.
4.3. Limitations in this Study
This study relies on remote sensing data for the extraction and analysis of SMWs, recognizing inherent limitations in image quality and methods selection that may bring certain errors to the research results. In the course of future investigations, we intend to elevate detection accuracy by integrating higher-resolution remote sensing imagery and incorporating field surveys. Additionally, owing to constraints in the available data, quantifying the precise impact of factors such as tourism, water pollution, storms, and extreme weather on SMWs dynamics remains a complex challenge. Subsequent research endeavors will delve into a nuanced understanding of these influences, thereby advancing our comprehension of SMWs in the Yellow River Basin. This pursuit is crucial for fostering enhanced protective measures, promoting restoration initiatives, and facilitating the sustainable development of these vital ecosystems.
5. Conclusions
Based on remote sensing data and the Geodetector model, this study extracted the SMWs in the Yellow River Basin from 1990 to 2020, elucidating their spatiotemporal dynamic trends and exploring the driving factors influencing the distribution changes in SMWs. Through the cross-validation of the confusion matrix, the extracted SMWs dataset has high precision, accuracy, and reliability. Over the study period, a discernible decline in SWMs in the Yellow River Basin was observed, particularly in seasonal and smaller-sized area wetlands. The compounding influences of climate change and human activities pose significant threats to these wetland resources, with some regions facing imminent disappearance. Consequently, this study quantified the spatiotemporal impact of variables such as precipitation, temperature, elevation, land use type, and population density on the distribution of SMWs. Notably, annual precipitation emerged as the predominant factor influencing their distribution, while the effects of anthropogenic factors, including road construction, land use type, and gross domestic product (GDP), manifested progressively. Moreover, the research qualitatively discussed the potential repercussions of tourism, storms, water pollution, and extreme weather events on SMWs, offering valuable insights for future investigations in related domains.
Overall, this study advances the comprehension of the spatiotemporal dynamics and driving factors influencing SMWs in the Yellow River basin. Furthermore, the distinctive roles of SMWs in preserving biodiversity, regulating water resources, and mitigating climate change underscore the imperative for precise assessment and conservation strategies. These findings serve as a foundational platform for future initiatives focused on the protection, restoration, and management of these wetlands within the region.
Author Contributions
Conceptualization, J.D. and G.Z.; methodology, G.Z.; software, G.Z.; validation, G.Z., L.L. and X.Z.; formal analysis, G.Z.; investigation, F.C. and X.C.; resources, G.Z. and J.D.; data curation, G.Z., Z.S. and L.W.; writing—original draft preparation, G.Z.; writing—review and editing, G.Z. and J.D.; visualization, G.Z.; supervision, J.D.; project administration, X.Z.; funding acquisition, J.D. All authors have read and agreed to the published version of the manuscript.
Funding
This study was supported by the Special Fund of Basic Scientific Research Business of Central Public Research Institutes (Grant No. 2022YSKY-17 and No. 2019YSKY-017) and the National Natural Science Foundation of China (Grant No. 41001055).
Data Availability Statement
The data presented in this study are available on request from the corresponding author. The data are not publicly available due to privacy.
Acknowledgments
We would like to thank the National Earth System Science Data Center (NESSDC) for providing valuable climate datasets and the Resource and Environment Science and Data Center (RESDC) for providing valuable social-economic data and the Geographic Data Sharing Infrastructure, College of Urban and Environmental Science, Peking University.
Conflicts of Interest
The authors declare no conflicts of interest.
References
- Fluet-Chouinard, E.; Stocker, B.D.; Zhang, Z.; Malhotra, A.; Melton, J.R.; Poulter, B.; Kaplan, J.O.; Goldewijk, K.K.; Siebert, S.; Minayeva, T.; et al. Extensive Global Wetland Loss over the Past Three Centuries. Nature 2023, 614, 281–286. [Google Scholar] [CrossRef] [PubMed]
- Gordon, B.; Lenhart, C.; Peterson, H.; Gamble, J.; Nieber, J.; Current, D.; Brenke, A. Reduction of Nutrient Loads from Agricultural Subsurface Drainage Water in a Small, Edge-of-Field Constructed Treatment Wetland. Ecol. Eng. 2021, 160, 106128. [Google Scholar] [CrossRef]
- Nagel, L.; McNulty, S.; Schlesinger, M.; Gibbs, J. Breeding Effort and Hydroperiod Indicate Habitat Quality of Small, Isolated Wetlands for Amphibians Under Climate Extremes. Wetlands 2021, 41, 22. [Google Scholar] [CrossRef]
- Brambilla, M.; Rizzolli, F.; Franzoi, A.; Caldonazzi, M.; Zanghellini, S.; Pedrini, P. A Network of Small Protected Areas Favoured Generalist but Not Specialized Wetland Birds in a 30-Year Period. Biol. Conserv. 2020, 248, 108699. [Google Scholar] [CrossRef]
- Atkinson, C.; Knapp, D.; Smith, L. Long-Term Patterns of Amphibian Diversity, Abundance and Nutrient Export from Small, Isolated Wetlands. Diversity 2021, 13, 598. [Google Scholar] [CrossRef]
- Paredes, M.; Aponte, H.; Apeno, A. High bird diversity in small coastal wetlands: The case of a neotropic hotspot. Ornitol. Neotrop. 2021, 33, 170–176. [Google Scholar]
- Draidi, K.; Djemadi, I.; Bakhouche, B.; Narsis, S.; Bouslama, Z.; Moussouni, A.; Tiar, G. A Multi-Year Survey on Aquatic Avifauna Consolidates the Eligibility of a Small Significant Peri-Urban Wetland in Northeast Algeria (Boussedra Marsh) to Be Included on the Important Bird Areas Network. Wetl. Ecol. Manag. 2023, 31, 629–648. [Google Scholar] [CrossRef]
- Kim, B.; Lee, J.; Park, J. Role of Small Wetlands on the Regime Shift of Ecological Network in a Wetlandscape. Environ. Res. Commun. 2022, 4, 041006. [Google Scholar] [CrossRef]
- COP14 Resolutions|The Convention on Wetlands, The Convention on Wetlands. Available online: https://www.ramsar.org/cop14-resolutions (accessed on 24 November 2023).
- GB/T 42481-2023; Specifications for Conservation and Management of Small Wetlands. Standardization Administration of the People’s Republic of China: Beijing, China, 2023. Available online: https://openstd.samr.gov.cn/bzgk/gb/newGbInfo?hcno=8EC173BEC261FA368FB8D53D01776A5D (accessed on 30 November 2023).
- Gxokwe, S.; Dube, T.; Mazvimavi, D. Leveraging Google Earth Engine Platform to Characterize and Map Small Seasonal Wetlands in the Semi-Arid Environments of South Africa. Sci. Total Environ. 2022, 803, 150139. [Google Scholar] [CrossRef]
- Gxokwe, S.; Dube, T.; Mazvimavi, D.; Grenfell, M. Using Cloud Computing Techniques to Monitor Long-Term Variations in Ecohydrological Dynamics of Small Seasonally-Flooded Wetlands in Semi-Arid South Africa. J. Hydrol. 2022, 612, 128080. [Google Scholar] [CrossRef]
- Leonard, P.; Baldwin, R.; Homyack, J.; Wigley, T. Remote Detection of Small Wetlands in the Atlantic Coastal Plain of North America: Local Relief Models, Ground Validation, and High-Throughput Computing. For. Ecol. Manag. 2012, 284, 107–115. [Google Scholar] [CrossRef]
- Krzeminska, D.; Blankenberg, A.; Bechmann, M.; Deelstra, J. The Effectiveness of Sediment and Phosphorus Removal by a Small Constructed Wetland in Norway: 18 Years of Monitoring and Perspectives for the Future. Catena 2023, 223, 106962. [Google Scholar] [CrossRef]
- Muresan, A.; Gaglio, M.; Aschonitis, V.; Nobili, G.; Castaldelli, G.; Fano, E. Structural and Functional Responses of Macroinvertebrate Communities in Small Wetlands of the Po Delta with Different and Variable Salinity Levels. Estuar. Coast. Shelf Sci. 2020, 238, 106726. [Google Scholar] [CrossRef]
- Russell, K.; Guynn, D.; Hanlin, H. Importance of Small Isolated Wetlands for Herpetofaunal Diversity in Managed, Young Growth Forests in the Coastal Plain of South Carolina. For. Ecol. Manag. 2002, 163, 43–59. [Google Scholar] [CrossRef]
- Janisch, J.E.; Foster, A.D.; Ehinger, W.J. Characteristics of Small Headwater Wetlands in Second-Growth Forests of Washington, USA. For. Ecol. Manag. 2011, 261, 1265–1274. [Google Scholar] [CrossRef]
- Yu, X.; Hawley-Howard, J.; Pitt, A.; Wang, J.; Baldwin, R.; Chow, A. Water Quality of Small Seasonal Wetlands in the Piedmont Ecoregion, South Carolina, USA: Effects of Land Use and Hydrological Connectivity. Water Res. 2015, 73, 98–108. [Google Scholar] [CrossRef]
- Cheng, F.; Park, J.; Kumar, M.; Basu, N. Disconnectivity Matters: The Outsized Role of Small Ephemeral Wetlands in Landscape-Scale Nutrient Retention. Environ. Res. Lett. 2023, 18, 024018. [Google Scholar] [CrossRef]
- Riley, J.; Stillwell, C. Predicting Inundation Dynamics and Hydroperiods of Small, Isolated Wetlands Using a Machine Learning Approach. Wetlands 2023, 43, 63. [Google Scholar] [CrossRef]
- Jeffries, M. Flood, Drought and the Inter-Annual Variation to the Number and Size of Ponds and Small Wetlands in an English Lowland Landscape over Three Years of Weather Extremes. Hydrobiologia 2016, 768, 255–272. [Google Scholar] [CrossRef]
- Samiappan, S.; Turnage, G.; Hathcock, L.; Moorhead, R. Mapping of Invasive Phragmites (Common Reed) in Gulf of Mexico Coastal Wetlands Using Multispectral Imagery and Small Unmanned Aerial Systems. Int. J. Remote Sens. 2017, 38, 2861–2882. [Google Scholar] [CrossRef]
- Liu, T.; Abd-Elrahman, A.; Dewitt, B.; Smith, S.; Morton, J.; Wilhelm, V. Evaluating the Potential of Multi-View Data Extraction from Small Unmanned Aerial Systems (UASs) for Object-Based Classification for Wetland Land Covers. GISci. Remote Sens. 2019, 56, 130–159. [Google Scholar] [CrossRef]
- Wang, X.; Xiao, X.; Zou, Z.; Hou, L.; Qin, Y.; Dong, J.; Doughty, R.B.; Chen, B.; Zhang, X.; Cheng, Y.; et al. Mapping Coastal Wetlands of China Using Time Series Landsat Images in 2018 and Google Earth Engine. ISPRS J. Photogramm. Remote Sens. 2020, 163, 312–326. [Google Scholar] [CrossRef]
- Pena-Regueiro, J.; Sebastia-Frasquet, M.-T.; Estornell, J.; Antonio Aguilar-Maldonado, J. Sentinel-2 Application to the Surface Characterization of Small Water Bodies in Wetlands. Water 2020, 12, 1487. [Google Scholar] [CrossRef]
- Mwita, E.; Menz, G.; Misana, S.; Becker, M.; Kisanga, D.; Boehme, B. Mapping Small Wetlands of Kenya and Tanzania Using Remote Sensing Techniques. Int. J. Appl. Earth Obs. Geoinf. 2013, 21, 173–183. [Google Scholar] [CrossRef]
- Géant, C.B.; Gustave, M.N.; Schmitz, S. Mapping Small Inland Wetlands in the South-Kivu Province by Integrating Optical and SAR Data with Statistical Models for Accurate Distribution Assessment. Sci. Rep. 2023, 13, 17626. [Google Scholar] [CrossRef] [PubMed]
- Gxokwe, S.; Dube, T.; Mazvimavi, D. Available Satellite Data for Monitoring Small and Seasonally Flooded Wetlands in Semi-Arid Environments of Southern Africa. Ecohydrology 2023, 17, e2605. [Google Scholar] [CrossRef]
- Hu, W.; Li, G.; Li, Z. Spatial and Temporal Evolution Characteristics of the Water Conservation Function and Its Driving Factors in Regional Lake Wetlands-Two Types of Homogeneous Lakes as Examples. Ecol. Indic. 2021, 130, 108069. [Google Scholar] [CrossRef]
- Wang, C.; Ma, L.; Zhang, Y.; Chen, N.; Wang, W. Spatiotemporal Dynamics of Wetlands and Their Driving Factors Based on PLS-SEM: A Case Study in Wuhan. Sci. Total Environ. 2022, 806, 151310. [Google Scholar] [CrossRef]
- Li, Y.; Hou, Z.; Zhang, L.; Qu, Y.; Zhou, G.; Lin, J.; Li, J.; Huang, K. Long-Term Spatio-Temporal Changes of Wetlands in Tibetan Plateau and Their Response to Climate Change. Int. J. Appl. Earth Obs. Geoinf. 2023, 121, 103351. [Google Scholar] [CrossRef]
- Dou, X.; Guo, H.; Zhang, L.; Liang, D.; Zhu, Q.; Liu, X.; Zhou, H.; Lv, Z.; Liu, Y.; Gou, Y.; et al. Dynamic Landscapes and the Influence of Human Activities in the Yellow River Delta Wetland Region. Sci. Total Environ. 2023, 899, 166239. [Google Scholar] [CrossRef] [PubMed]
- Tian, A.; Xu, T.; Gao, J.; Liu, C.; Han, L. Multi-Scale Spatiotemporal Wetland Loss and Its Critical Influencing Factors in China Determined Using Innovative Grid-Based GWR. Ecol. Indic. 2023, 149, 110144. [Google Scholar] [CrossRef]
- Welcome to Visit GeoDetector Website. Available online: http://geodetector.cn/ (accessed on 24 November 2023).
- Wang, J.; Li, X.; Christakos, G.; Liao, Y.; Zhang, T.; Gu, X.; Zheng, X. Geographical Detectors-Based Health Risk Assessment and Its Application in the Neural Tube Defects Study of the Heshun Region, China. Int. J. Geogr. Inf. Sci. 2010, 24, 107–127. [Google Scholar] [CrossRef]
- Wang, J.; Zhang, T.; Fu, B. A Measure of Spatial Stratified Heterogeneity. Ecol. Indic. 2016, 67, 250–256. [Google Scholar] [CrossRef]
- Feng, R.; Wang, F.; Wang, K.; Wang, H.; Li, L. Urban Ecological Land and Natural-Anthropogenic Environment Interactively Drive Surface Urban Heat Island: An Urban Agglomeration-Level Study in China. Environ. Int. 2021, 157, 106857. [Google Scholar] [CrossRef] [PubMed]
- Cao, F.; Ge, Y.; Wang, J. Optimal Discretization for Geographical Detectors-Based Risk Assessment. GISci. Remote Sens. 2013, 50, 78–92. [Google Scholar] [CrossRef]
- Guo, J.; Xu, Q.; Zeng, Y.; Liu, Z.; Zhu, X. Nationwide Urban Tree Canopy Mapping and Coverage Assessment in Brazil from High-Resolution Remote Sensing Images Using Deep Learning. ISPRS J. Photogramm. Remote Sens. 2023, 198, 1–15. [Google Scholar] [CrossRef]
- Wang, H.; Wigneron, J.; Ciais, P.; Yao, Y.; Fan, L.; Liu, X.; Li, X.; Green, J.; Tian, F.; Tao, S.; et al. Seasonal Variations in Vegetation Water Content Retrieved from Microwave Remote Sensing over Amazon Intact Forests. Remote Sens. Environ. 2023, 285, 113409. [Google Scholar] [CrossRef]
- Liu, Q.; Liu, L.; Zhang, Y.; Wang, Z.; Guo, R. Seasonal Fluctuations of Marsh Wetlands in the Headwaters of the Brahmaputra, Ganges, and Indus Rivers, Tibetan Plateau Based on the Adapted LandTrendr Model. Ecol. Indic. 2023, 152, 110360. [Google Scholar] [CrossRef]
- Zhang, M.; Zhang, Z.; Dong, P.; Ma, Z. Report on Wetland Development in the Yellow River Basin, China, 2020–2021; Report on the Development of Ecological Civilization in the Yellow River Basin (2020); Social Sciences Academic Press: Beijing, China, 2021; pp. 99–119. [Google Scholar]
- Zhang, Y.; Du, J.; Guo, L.; Fang, S.; Zhang, J.; Sun, B.; Mao, J.; Sheng, Z.; Li, L. Long-Term Detection and Spatiotemporal Variation Analysis of Open-Surface Water Bodies in the Yellow River Basin from 1986 to 2020. Sci. Total Environ. 2022, 845, 157152. [Google Scholar] [CrossRef]
- Yang, M.; Liu, H.; Han, Y.; Zeng, Q.; Wang, J.; Hu, P. Temporal and Spatial Changes of Runoff Regime in the Yellow River Basin from 1956 to 2017. Water 2021, 13, 3298. [Google Scholar] [CrossRef]
- Yellow River Conservancy Commission of the Ministry of Water Resources. Available online: http://www.yrcc.gov.cn/hhyl/hhgk/hd/lyfw/201108/t20110814_103452.html (accessed on 15 January 2024).
- Wang, Y.; Tan, D.; Han, L.; Li, D.; Wang, X.; Lu, G.; Lin, J. Review of Climate Change in the Yellow River Basin. J. Desert Res. 2021, 41, 235–246. [Google Scholar]
- Xu, M.; Wang, G.; Wang, Z.; Hu, H.; Kumar Singh, D.; Tian, S. Temporal and Spatial Hydrological Variations of the Yellow River in the Past 60 Years. J. Hydrol. 2022, 609, 127750. [Google Scholar] [CrossRef]
- Yellow River|Location, Map, & Facts|Britannica. Available online: https://www.britannica.com/place/Yellow-River (accessed on 15 January 2024).
- Peng, S.; Ding, Y.; Liu, W.; Li, Z. 1 Km Monthly Temperature and Precipitation Dataset for China from 1901 to 2017. Earth Syst. Sci. Data 2019, 11, 1931–1946. [Google Scholar] [CrossRef]
- Yang, J.; Huang, X. The 30 m Annual Land Cover Dataset and Its Dynamics in China from 1990 to 2019. Earth Syst. Sci. Data 2021, 13, 3907–3925. [Google Scholar] [CrossRef]
- Local Standard Information Service Platform. Available online: https://dbba.sacinfo.org.cn/stdList?key=%E5%B0%8F%E5%BE%AE%E6%B9%BF%E5%9C%B0 (accessed on 19 January 2024).
- Huaibei Forestry Bureau. Available online: https://lyj.huaibei.gov.cn/zwgk/public/62/63083208.html (accessed on 19 January 2024).
- Zhang, J.; Chu, L.; Zhang, Z.; Zhu, B.; Liu, X.; Yang, Q. Evolution of Small and Micro Wetlands and Their Driving Factors in the Yangtze River Delta-A Case Study of Wuxi Area. Remote Sens. 2023, 15, 1152. [Google Scholar] [CrossRef]
- Liu, H.; Lin, N.; Zhang, H.; Liu, Y.; Bai, C.; Sun, D.; Feng, J. Driving Force Analysis of Natural Wetland in Northeast Plain Based on SSA-XGBoost Model. Sensors 2023, 23, 7513. [Google Scholar] [CrossRef] [PubMed]
- Zhang, Y.; Huang, D.; Jin, X.; Li, L.; Wang, C.; Wang, Y.; Pellissier, L.; Johnson, A.C.; Wu, F.; Zhang, X. Long-Term Wetland Biomonitoring Highlights the Differential Impact of Land Use on Macroinvertebrate Diversity in Dongting Lake in China. Commun Earth Env. 2024, 5, 32. [Google Scholar] [CrossRef]
- Song, Y.; Wang, J.; Ge, Y.; Xu, C. An Optimal Parameters-Based Geographical Detector Model Enhances Geographic Characteristics of Explanatory Variables for Spatial Heterogeneity Analysis: Cases with Different Types of Spatial Data. GISci. Remote Sens. 2020, 57, 593–610. [Google Scholar] [CrossRef]
- Ren, D.; Cao, A. Analysis of the Heterogeneity of Landscape Risk Evolution and Driving Factors Based on a Combined GeoDa and Geodetector Model. Ecol. Indic. 2022, 144, 109568. [Google Scholar] [CrossRef]
- Ji, B.; Qin, Y.; Zhang, T.; Zhou, X.; Yi, G.; Zhang, M.; Li, M. Analyzing Driving Factors of Drought in Growing Season in the Inner Mongolia Based on Geodetector and GWR Models. Remote Sens. 2022, 14, 6007. [Google Scholar] [CrossRef]
- Zan, C.; Liu, T.; Huang, Y.; Bao, A.; Yan, Y.; Ling, Y.; Wang, Z.; Duan, Y. Spatial and Temporal Variation and Driving Factors of Wetland in the Amu Darya River Delta, Central Asia. Ecol. Indic. 2022, 139, 108898. [Google Scholar] [CrossRef]
- Zheng, Y.; Liu, H.; Zhuo, Y.; Li, Z.; Liang, C.; Wang, L. Dynamic Changes and Driving Factors of Wetlands in Inner Mongolia Plateau, China. PLoS ONE 2019, 14, e022117. [Google Scholar] [CrossRef]
- Li, H.; Wang, J.; Zhang, J.; Qin, F.; Hu, J.; Zhou, Z. Analysis of Characteristics and Driving Factors of Wetland Landscape Pattern Change in Henan Province from 1980 to 2015. Land 2021, 10, 564. [Google Scholar] [CrossRef]
- Mao, D.; He, X.; Wang, Z.; Tian, Y.; Xiang, H.; Yu, H.; Man, W.; Jia, M.; Ren, C.; Zheng, H. Diverse Policies Leading to Contrasting Impacts on Land Cover and Ecosystem Services in Northeast China. J. Clean. Prod. 2019, 240, 117961. [Google Scholar] [CrossRef]
- Johnston, C.; McIntyre, N. Effects of Cropland Encroachment on Prairie Pothole Wetlands: Numbers, Density, Size, Shape, and Structural Connectivity. Landsc. Ecol. 2019, 34, 827–841. [Google Scholar] [CrossRef]
- Jouma, N.; Dadaser-Celik, F. Landscape Transformation after Irrigation Development in and around a Semi-Arid Wetland Ecosystem. Landsc. Ecol. Eng. 2021, 17, 439–457. [Google Scholar] [CrossRef]
- Jiang, L.; Wang, H.; Wang, S.; Zhang, W. Process Analysis and Mitigation Strategies for Wetland Degradation Caused by Increasing Agricultural Water Demand: An Ecology-Economy Nexus Perspective. Ecol. Process. 2023, 12, 40. [Google Scholar] [CrossRef]
- Li, Y.; Tan, M.; Hao, H. The Impact of Global Cropland Changes on Terrestrial Ecosystem Services Value, 1992–2015. J. Geogr. Sci. 2019, 29, 323–333. [Google Scholar] [CrossRef]
- Mao, D.; Tian, Y.; Wang, Z.; Jia, M.; Du, J.; Song, C. Wetland Changes in the Amur River Basin: Differing Trends and Proximate Causes on the Chinese and Russian Sides. J. Environ. Manag. 2021, 280, 111670. [Google Scholar] [CrossRef] [PubMed]
- Zhou, K. Wetland Landscape Pattern Evolution and Prediction in the Yellow River Delta. Appl. Water Sci. 2022, 12, 190. [Google Scholar] [CrossRef]
- Mao, D.; Luo, L.; Wang, Z.; Wilson, M.C.; Zeng, Y.; Wu, B.; Wu, J. Conversions between Natural Wetlands and Farmland in China: A Multiscale Geospatial Analysis. Sci. Total Environ. 2018, 634, 550–560. [Google Scholar] [CrossRef]
- Assefa, W.W.; Eneyew, B.G.; Wondie, A. The Impacts of Land-Use and Land-Cover Change on Wetland Ecosystem Service Values in Peri-Urban and Urban Area of Bahir Dar City, Upper Blue Nile Basin, Northwestern Ethiopia. Ecol. Process. 2021, 10, 39. [Google Scholar] [CrossRef]
- Alavaisha, E.; Mbande, V.; Börjeson, L.; Lindborg, R. Effects of Land Use Change Related to Small-Scale Irrigation Schemes in Kilombero Wetland, Tanzania. Front. Environ. Sci. 2021, 9, 611686. [Google Scholar] [CrossRef]
- Hasan, S.S.; Zhen, L.; Miah, M.G.; Ahamed, T.; Samie, A. Impact of Land Use Change on Ecosystem Services: A Review. Environ. Dev. 2020, 34, 100527. [Google Scholar] [CrossRef]
- Zhang, H.; Wang, F.; Zhao, H.; Kang, P.; Tang, L. Evolution of Habitat Quality and Analysis of Influencing Factors in the Yellow River Delta Wetland from 1986 to 2020. Front. Ecol. Evol. 2022, 10, 1075914. [Google Scholar] [CrossRef]
- Yan, J.; Zhu, J.; Zhao, S.; Su, F. Coastal Wetland Degradation and Ecosystem Service Value Change in the Yellow River Delta, China. Glob. Ecol. Conserv. 2023, 44, e02501. [Google Scholar] [CrossRef]
- Yang, H.; Wang, J.; Xiao, W.; Lu, F.; Wang, Y.; Jarsjo, J. Relationship between Hydroclimatic Variables and Reservoir Wetland Landscape Pattern Indices: A Case Study of the Sanmenxia Reservoir Wetland on the Yellow River, China. J. Earth Syst. Sci. 2020, 129, 83. [Google Scholar] [CrossRef]
- Zhao, G.; Tian, P.; Mu, X.; Jiao, J.; Wang, F.; Gao, P. Quantifying the Impact of Climate Variability and Human Activities on Streamflow in the Middle Reaches of the Yellow River Basin, China. J. Hydrol. 2014, 519, 387–398. [Google Scholar] [CrossRef]
- Ablat, X.; Wang, Q.; Arkin, N.; Guoping, T.; Sawut, R. Spatiotemporal Variations and Underlying Mechanism of the Floodplain Wetlands in the Meandering Yellow River in Arid and Semi-Arid Regions. Ecol. Indic. 2022, 136, 108709. [Google Scholar] [CrossRef]
- He, X.; Hörmann, G.; Strehmel, A.; Guo, H.; Fohrer, N. Natural and Anthropogenic Causes of Vegetation Changes in Riparian Wetlands Along the Lower Reaches of the Yellow River, China. Wetlands 2015, 35, 391–399. [Google Scholar] [CrossRef]
- Research of the Distribution of Natural Vegetation under Different Disturbances in Wetland of Lower Yellow River. Procedia Environ. Sci. 2011, 10, 2176–2181. [CrossRef][Green Version]
- Assessment of Environmental Carrying Capacity of Ecotourism in the Yellow River Estuary-3Ciencias. Available online: https://libyw.ucas.ac.cn/https/9S3MjcxYtHihnnamkZXJbAnIWay9hmkwDmC/articulos/articulo/assessment-of-environmental-carrying-capacity-of-ecotourism-in-the-yellow-river-estuary/ (accessed on 19 January 2024).
- Tan, K.; Sun, D.; Dou, W.; Wang, B.; Sun, Q.; Liu, X.; Zhang, H.; Lan, Y.; Lun, F. Mapping Coastal Wetlands and Their Dynamics in the Yellow River Delta over Last Three Decades: Based on a Spectral Endmember Space. Remote Sens. 2023, 15, 5003. [Google Scholar] [CrossRef]
- Hong, Z.; Zhao, Q.; Chang, J.; Peng, L.; Wang, S.; Hong, Y.; Liu, G.; Ding, S. Evaluation of Water Quality and Heavy Metals in Wetlands along the Yellow River in Henan Province. Sustainability 2020, 12, 1300. [Google Scholar] [CrossRef]
- Ren, C.; Wang, Z.; Zhang, B.; Li, L.; Chen, L.; Song, K.; Jia, M. Remote Monitoring of Expansion of Aquaculture Ponds Along Coastal Region of the Yellow River Delta from 1983 to 2015. Chin. Geogr. Sci. 2018, 28, 430–442. [Google Scholar] [CrossRef]
- Gao, M.; Liu, S.; Zhao, G.; Yuan, H.; Wei, C.; Wu, Y.; Tang, J. Vulnerability of Eco-Hydrological Environment in the Yellow River Delta Wetland. Coas 2014, 30, 344–350. [Google Scholar] [CrossRef]
- Impacts of a Storm on the Erosion Process of a Tidal Wetland in the Yellow River Delta. Catena 2021, 205, 105461. [CrossRef]
- Li, W.; Chen, R.; Sun, S.; Yu, D.; Wang, M.; Liu, C.; Qi, M. Characteristics of Rainstorm Intensity and Its Future Risk Estimation in the Upstream of Yellow River Basin. Atmosphere 2022, 13, 2082. [Google Scholar] [CrossRef]
- Xu, X.; Lyu, D.; Lei, X.; Huang, T.; Li, Y.; Yi, H.; Guo, J.; He, L.; He, J.; Yang, X.; et al. Variability of Extreme Precipitation and Rainfall Erosivity and Their Attenuated Effects on Sediment Delivery from 1957 to 2018 on the Chinese Loess Plateau. J. Soils Sediments 2021, 21, 3933–3947. [Google Scholar] [CrossRef]


Disclaimer/Publisher’s Note: The statements, opinions and data contained in all publications are solely those of the individual author(s) and contributor(s) and not of MDPI and/or the editor(s). MDPI and/or the editor(s) disclaim responsibility for any injury to people or property resulting from any ideas, methods, instructions or products referred to in the content. |
© 2024 by the authors. Licensee MDPI, Basel, Switzerland. This article is an open access article distributed under the terms and conditions of the Creative Commons Attribution (CC BY) license (https://creativecommons.org/licenses/by/4.0/).