Article

The Relationship of Gross Primary Productivity with NDVI Rather than Solar-Induced Chlorophyll Fluorescence Is Weakened under the Stress of Drought

College of Grassland Science and Technology, China Agricultural University, Beijing 100193, China
*
Author to whom correspondence should be addressed.
Remote Sens. 2024, 16(3), 555; https://doi.org/10.3390/rs16030555
Submission received: 25 November 2023 / Revised: 17 January 2024 / Accepted: 27 January 2024 / Published: 31 January 2024

Abstract

:
Grasslands cover approximately one-fourth of the land in the world and play a crucial role in the carbon cycle. Therefore, quantifying the gross primary productivity (GPP) of grasslands is crucial to assess the sustainable development of terrestrial ecosystems. Drought is a widespread and damaging natural disaster worldwide, which introduces uncertainties in estimating GPP. Solar-induced chlorophyll fluorescence (SIF) is considered as an effective indicator of vegetation photosynthesis and provides new opportunities for monitoring vegetation growth under drought conditions. In this study, using downscaled GOME-2 SIF satellite products and focusing on the drought event in the Xilingol grasslands in 2009, the ability of SIF to evaluate the variations in GPP due to drought was explored. The results showed that the anomalies of SIF in July–August exhibited spatiotemporal characteristics similar to drought indicators, indicating the capability of SIF in monitoring drought. Moreover, the determination coefficient (R2) between SIF and GPP reached 0.95, indicating that SIF is a good indicator for estimating GPP. Particularly under drought conditions, the relationship between SIF and GPP (R2 = 0.90) was significantly higher than NDVI and GPP (R2 = 0.62), demonstrating the superior capability of SIF in tracking changes in grassland photosynthesis caused by drought compared to NDVI. Drought reduces the ability of NDVI to monitor GPP but does not affect that of SIF to monitor GPP. Our study provides a new approach for accurately estimating changes in GPP under drought conditions and is of significant importance for assessing the carbon dynamics of ecosystems.

1. Introduction

Grassland covers approximately one-fourth of the world’s total land area, making it one of the most widely distributed ecosystems on earth [1]. The grassland ecosystem serves as a habitat for numerous species, and preserving grasslands contributes to maintaining biodiversity and ecological balance [2]. Grassland plants absorb a significant amount of carbon dioxide through photosynthesis and store it in their bodies and the soil [3]. Grassland ecosystems are important carbon sinks, accounting for approximately 20% of global carbon storage [4]. Grasslands help reduce greenhouse gas levels in the atmosphere and mitigate global climate change [5]. Protecting and restoring grasslands contributes to increased carbon storage and reduced carbon emissions. In conclusion, grassland ecosystems play a crucial role in regulating carbon cycling, preserving biodiversity, and promoting socioeconomic development.
Grassland is one of the most fragile ecosystems, highly susceptible to climate change and human disturbances [6]. Climate change, including temperature and precipitation variations, significantly affects grass growth and the development of livestock farming [7]. In the last few decades, changes in the water cycle caused by global warming have led to increasing water scarcity pressures worldwide [8]. Water scarcity results in more drought, and more severe droughts may occur in the future. As we all know, drought is a relatively common disaster that causes large economic losses every year. Drought has a significant impact on grassland ecosystems, causing changes in vegetation structure and function [9]. When soil moisture deficit leads to drought, it affects plant growth in the water and vapor transport processes between the soil, plants, and atmosphere [10,11]. Soil moisture deficit reduces the water potential difference between the soil and plant roots, leading to a decrease in plant water uptake [12]. At the plant level, drought reduces plant water content, inhibits plant translocation from the root zone to the atmosphere, induces stomatal closure, alters assimilation rates, and reduces photosynthesis [10,13]. Therefore, monitoring meteorological, hydrological, and agricultural drought and their impacts on grassland ecosystems is essential. The relationship between drought and grassland ecosystems has gained strong interest among scientists and managers and has gradually become a research hotspot. Among them, grassland gross primary production (GPP) has received extensive attention in recent decades due to its importance in understanding ecosystem carbon cycling and the simplicity of satellite-based GPP models.
GPP of terrestrial ecosystems is the carbon fixed by plants and is important for the global carbon cycle [14,15]. The traditional method for monitoring ecosystem GPP is the eddy covariance (EC) flux technique [16]. However, the small number of EC flux sites makes it challenging to monitor GPP at the regional scale. Remote sensing (RS) techniques are uniquely positioned to monitor GPP at a wide spatial scale [17]. Many studies have shown that vegetation indices (VIs) such as Normalized Difference Vegetation Index (NDVI) can accurately estimate terrestrial ecosystem GPP [18,19,20]. However, during drought events, vegetation photosynthesis or productivity typically declines [21]. VIs often represent the greenness of vegetation, which cannot promptly capture the changes in photosynthesis caused by drought, resulting in a lag effect and affecting the accuracy of GPP estimation using VIs [22]. Therefore, accurately monitoring changes in vegetation GPP under drought conditions remains a challenge.
Solar-induced fluorescence (SIF) is a new indicator for monitoring vegetation growth and environmental changes [23]. Unlike traditional reflectance-based VIs, SIF is the optical signal emitted by chlorophyll-a after absorbing sunlight, lasting for a few nanoseconds [24]. Light absorbed by vegetation has three pathways of consumption: SIF, photochemical reactions, and thermal dissipation [25]. The direct connection between SIF and photosynthesis has been validated at different spatial scales. SIF products from various sensors (GOME-2, GOSAT, and OCO-2) have shown strong correlations with GPP [26,27]. Some researchers have found that GOSAT SIF and GPP were strongly correlated [26,28]. Other studies utilizing SIF have discovered a consistently significant relationship of GPP with SIF in terrestrial ecosystems across different temporal scales [29,30]. SIF has also demonstrated good performance in estimating GPP under drought conditions. Chen et al. (2019) investigated the potential of SIF in monitoring summer maize GPP under drought conditions and found that SIF was able to track spatiotemporal variations in GPP due to drought more effectively than NDVI [31]. Shen et al. (2022) explored the capability of SIF in estimating the impact of drought on winter wheat GPP, demonstrating that SIF can accurately quantify GPP losses caused by drought [32]. However, research on the potential of SIF monitoring for grassland ecosystem GPP changes induced by drought is still relatively scarce.
Numerous studies have demonstrated a strong correlation of SIF retrieved from various satellites with EC flux towers or GPP satellite products [33,34]. However, uncertainties in SIF and GPP may blur the relationship of SIF with GPP. Variations in SIF caused by different sensors, retrieval algorithms, and other factors can change the SIF–GPP relationship [35]. Existing SIF products suffer from low spatial resolutions and limited coverage, which hinder the true SIF–GPP relationship [36]. In fact, due to the large footprint and spatial discontinuity of measurements from most satellite platforms, the spatial resolution of current satellite SIF datasets is relatively coarse, typically ranging from 0.5° to 2° [37]. Although the spatial resolution has improved, the data have only become available since 2017, limiting the analysis of drought impacts on grassland ecosystem productivity [38]. Few SIF products are applicable for drought monitoring and productivity assessment in grasslands. In recent years, several spatial downscaling SIF products have emerged, offering more fine-grained SIF data with longer time series, providing new data for accurately estimating GPP. There is currently no research available on spatial downscaling SIF products to monitor the impact of drought on grassland GPP.
Therefore, this study considers the drought in the Xilingol grassland in 2009 as an example and explores the potential of downscaled satellite GOME-2 SIF (0.05°) to investigate the spatiotemporal variations in SIF in monitoring GPP due to drought. Specifically, our objectives are as follows: (1) to analyze the response mechanisms of SIF to drought stress; (2) to investigate the potential of SIF in estimating GPP; (3) to investigate the ability of SIF to estimate GPP changes under drought conditions.

2. Materials and Methods
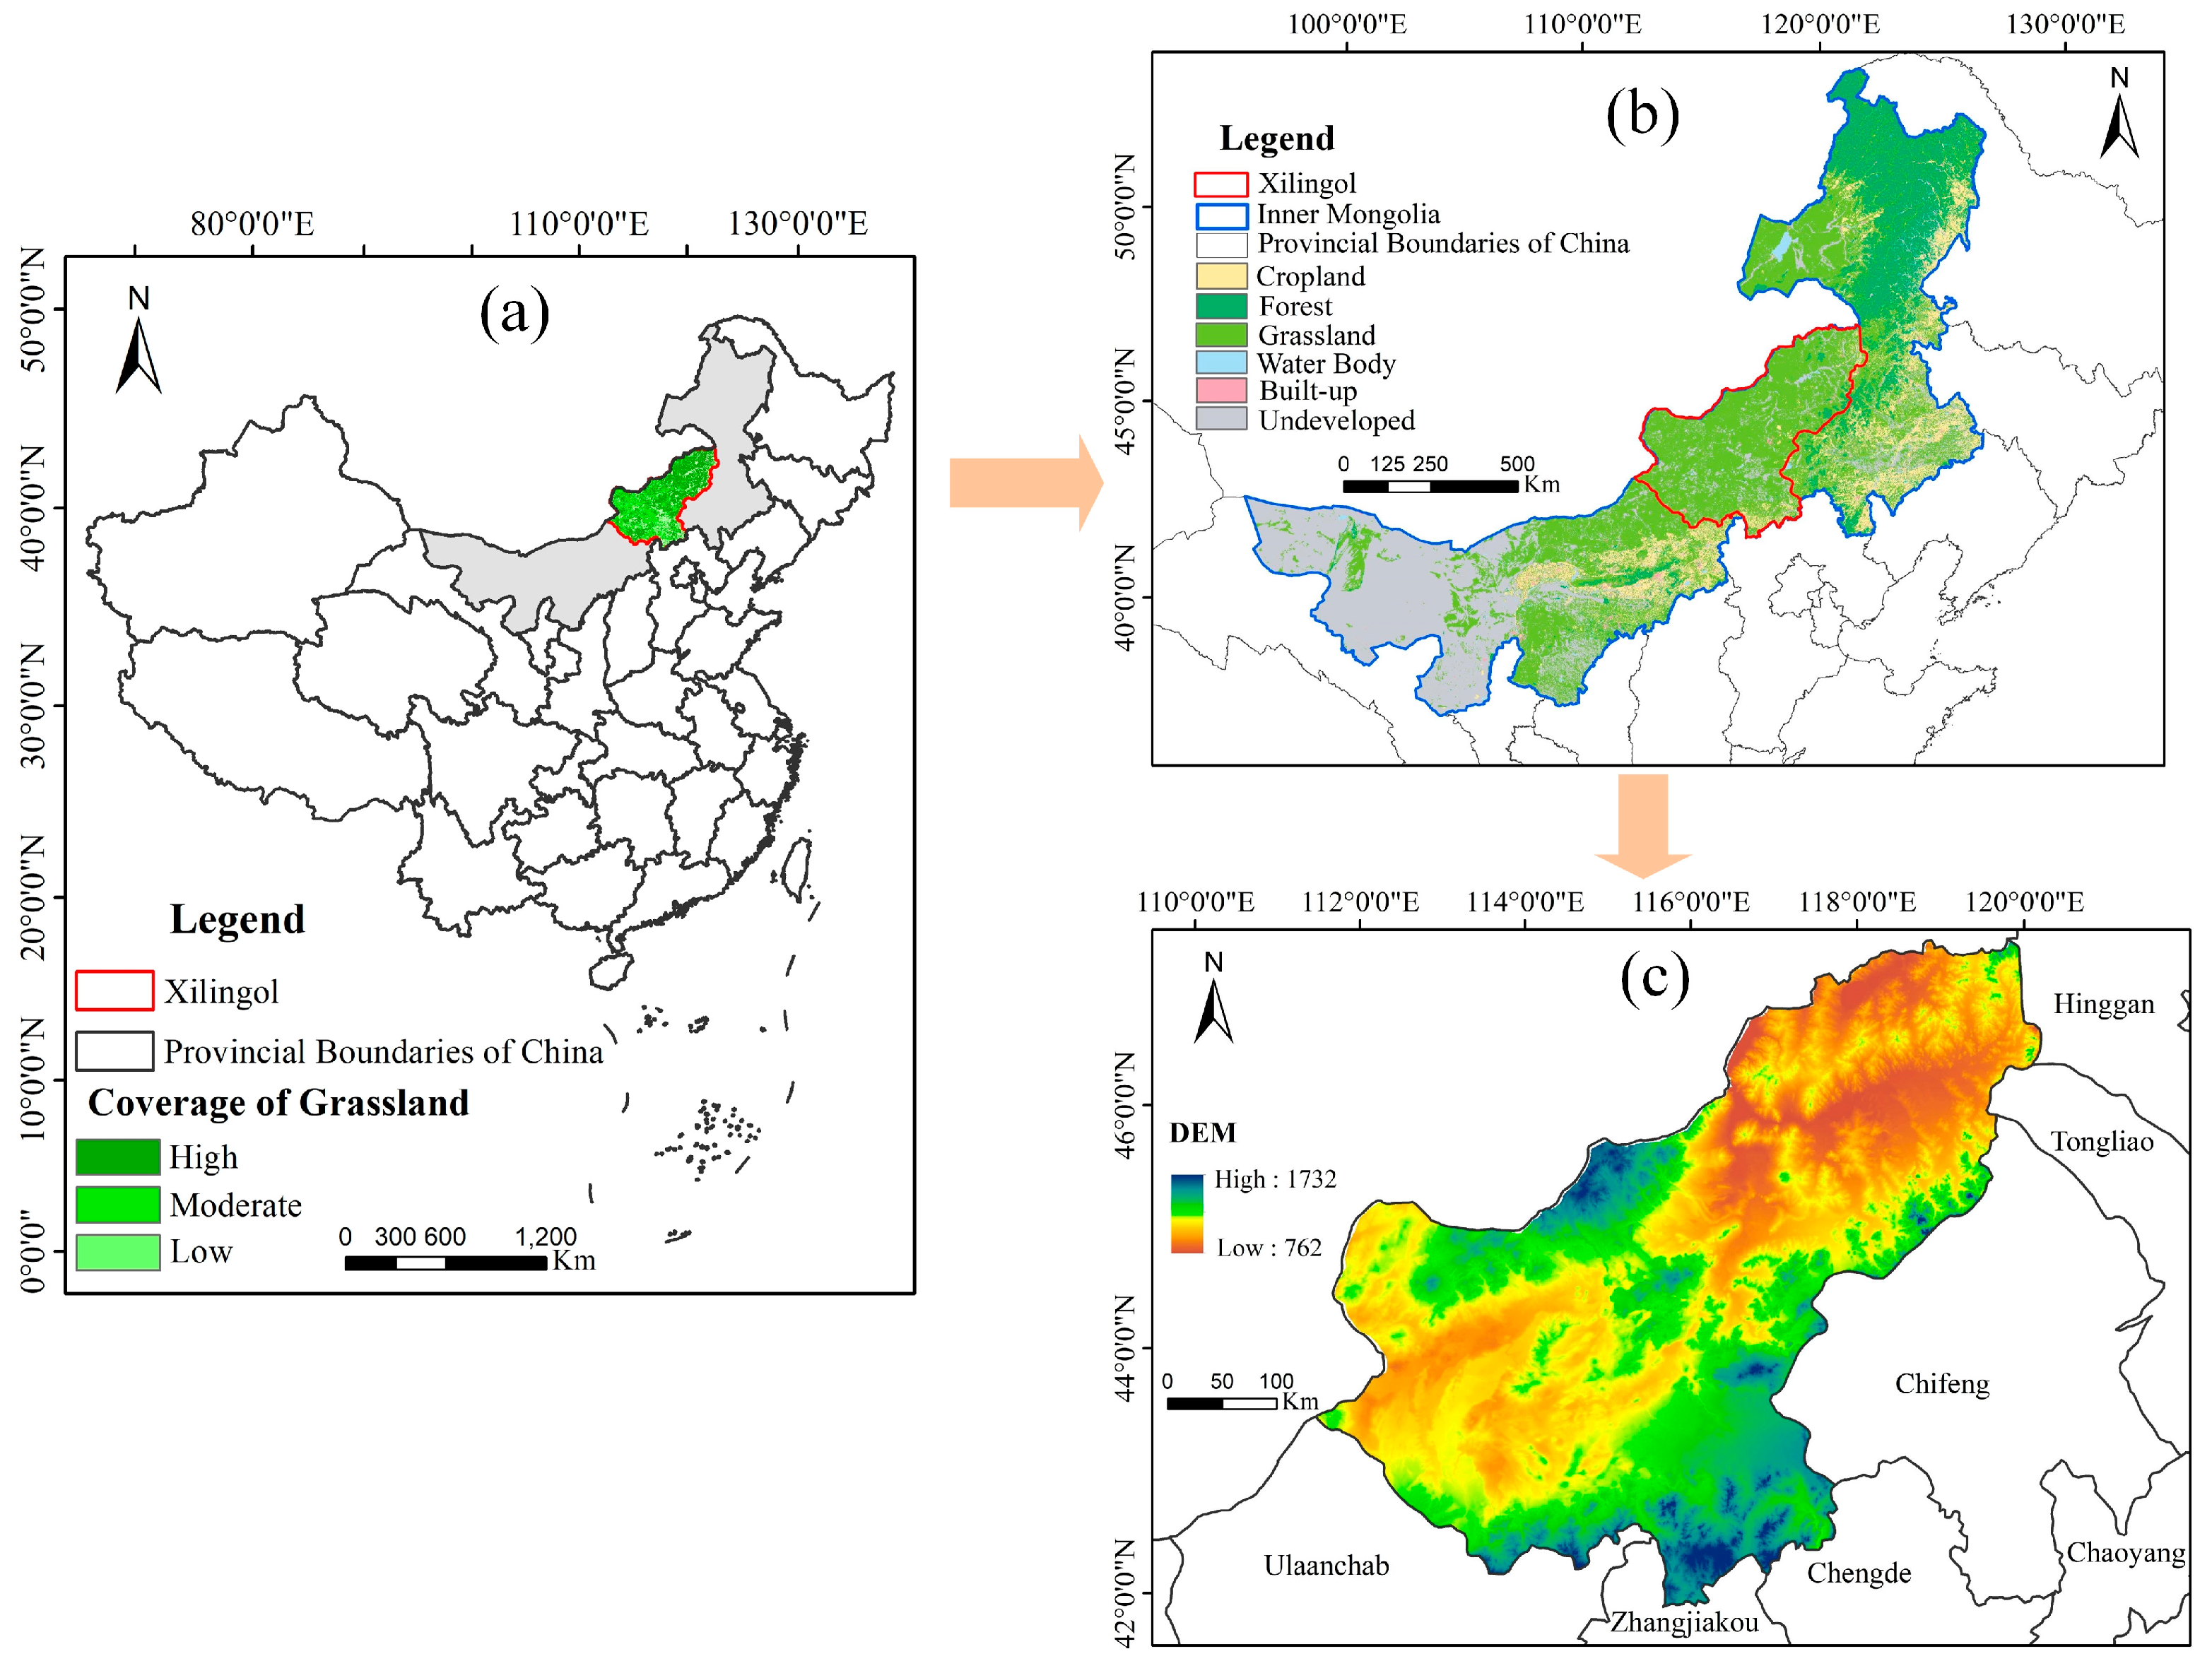
2.1. Study Area

The Xilingol grassland is located in the Xilingol League of Inner Mongolia Autonomous Region, China, spanning from approximately 41°34′ to 46°47′N and 111°09′ to 119°54′E (Figure 1a), which covers over 200,000 km2 [39]. The annual precipitation ranges from 200 to 400 mm, gradually decreasing from southeast to northwest. Overall, the region has low precipitation and frequent occurrences of drought, making drought the main hazard in the area. The topography consists mainly of high plateaus, with elevations ranging from 800 to 1800 m. The terrain slopes from south to north, with low mountains and hills in the east and south, which are extensions of the Greater Khingan Mountains to the west and Yin Mountains to the east (Figure 1c). The western and northern parts of the region are flat, forming high-altitude grasslands. The growing season for perennial plants in the Xilingol grassland extends from early April to the end of September, while annual plants typically germinate in early July with increased precipitation [40].

2.2. Data Availability

2.2.1. Downscaled GOME-2 SIF

Duveiller et al. (2020) employed a semi-empirical approach based on GOME-2 to generate a new SIF product whose resolution is 0.05° and 8 days [41]. The explanatory variables for SIF were divided into three categories: vegetation parameters (including NDVI and EVI), moisture parameters (evapotranspiration and NDWI), and temperature parameters. Two sets of datasets (JJ and PK) were produced using the SIF inversions [42,43]. Both sets of data were calibrated using daily correction factors to account for diurnal variations in GOME-2 instantaneous SIF. This study utilized the PK dataset.
To eliminate the effect of APAR on SIF, the SIFyield was further calculated on the basis of fPAR and PAR data. The GLASS PAR product was obtained from the global shortwave radiation product produced by the GLASS albedo product and the conversion factor production. Eight days of the MOD15A2H product with a 500 m resolution were used for fPAR. SIFyield was calculated as follows [44]:
SIFyield = SIF/(fPAR × PAR),
where PAR is photosynthetically active radiation and fPAR is a fraction of PAR.

2.2.2. Fluxcom GPP

The FLUXCOM GPP product is derived by training three machine learning algorithms using meteorological observations and satellite data as inputs, with daily carbon flux measurements from ground flux tower sites [45]. This product transforms the flux tower observations into a globally explicit distribution. It has been widely applied in various studies [46,47]. In this research, the FLUXCOM GPP data for the period 2007–2015 with a resolution of 0.05° and an interval of months were utilized. The data download link is http://fluxcom.org/EF-Download/ (accessed on 18 May 2022).

2.2.3. Meteorological Data, Soil Moisture, and SPEI

The MOD11C3 dataset provides monthly land surface temperature (LST) data at a resolution of 0.05° (http://ladsweb.nascom.nasa.gov/, accessed on 25 January 2021). Rainfall is sourced from the CHIRPS satellite precipitation (PPT) product. CHIRPS is a precipitation climate database limited to land areas, which combines satellite precipitation with ground-based meteorological station data to provide daily and monthly precipitation products with a resolution of 0.05° (https://data.chc.ucsb.edu/products/CHIRPS-2.0/, accessed on 5 July 2020). Soil moisture (SM) data are obtained from the GLDAS product whose resolution is 0.25° and provided on a daily basis (https://disc.sci.gsfc.nasa.gov, accessed on 16 October 2021). This study utilizes mean synthesis to accumulate daily meteorological and hydrological data into monthly scales.
SPEI is a multiscalar drought index used to explain the influence of temperature on drought and has been utilized in many studies [48,49]. The SPEI data were obtained from the SPEI Global Drought Monitor (http://spei.csic.es/, accessed on 22 May 2022) with a spatial and temporal resolution of 0.05° and monthly. SPEI has various time scales (1, 3, 6, 12 months, etc.), and different scales of SPEI can realize the monitoring and assessment of different types of droughts. In this research, the SPEI dataset at a 3-month scale was used to identify typical drought events. For simplicity, SPEI, SM, PPT, and LST are collectively referred to as drought indicators.
To directly analyze the relationship of SIF, SIFyield, and NDVI with GPP under drought conditions, we divided the period from 2007 to 2015 into drought and no-drought months based on the magnitude of SPEI. As shown in Table 1, SPEI > −0.5 indicates no-drought conditions, while SPEI ≤ −0.5 defines drought conditions [50].

2.2.4. MODIS NDVI

NDVI is a commonly used vegetation index for assessing vegetation growth status. It is significantly linearly correlated with vegetation density and serves as an important parameter for studying vegetation coverage. NDVI is also the most widely applied quantitative monitoring indicator for vegetation. MOD13C2 products were used for NDVI in the study with a spatial and temporal resolution of 0.05° and 8 days (Table 2). The data product can be downloaded at https://lpdaac.usgs.gov/products/mod13c2v006 (accessed on 7 April 2021). An overview of the data used in this paper can be seen in Table 2.

2.3. Calculation of Anomalies

To avoid the influence of seasonal cycles, Equation (2) was used to calculate the anomalies of SPEI, SM, PPT, LST, GPP, SIF, SIFyield, and NDVI. The anomalies for all parameters were computed pixel-by-pixel from 2007 to 2015 for all datasets.
Y ( i , j , t )   =   Y ( i , j , t )     Y ¯ ( i , j ) ,
where Y(i,j,t)′ represents the anomalies of the SPEI, SM, PPT, LST, GPP, SIF, SIFyield, and NDVI of pixel (i,j) and time t, denoted as SPEI_anm, SM_anm, PPT_anm, LST_anm, GPP_anm, SIF_anm, SIFyield_anm, and NDVI_anm, respectively; Y(i,j,t) is the original value of the pixel (i,j) at time t; Y ¯ (i,j) is the average value of the pixel (i,j) over the period 2007–2015.

2.4. Analysis

Since the spatial and temporal resolutions of NDVI, SM, PAR, and fPAR are not 0.05° and monthly. Firstly, the spatial resolution of these parameters was resampled to 0.05° using nearest neighbor interpolation, and the temporal resolution was integrated monthly. Subsequently, SPEI was utilized to identify drought events in the Xilingol grasslands. The monthly anomalies of SPEI, SM, PPT, LST, GPP, SIF, SIFyield, and NDVI were calculated pixel-by-pixel for the 2007–2015 period. The relationships between SIF, SIFyield, NDVI, and GPP under drought and no_drought conditions were analyzed using Pearson’s correlation method, and it was assessed whether SIF has the ability to capture the variations in GPP due to drought.

3. Results

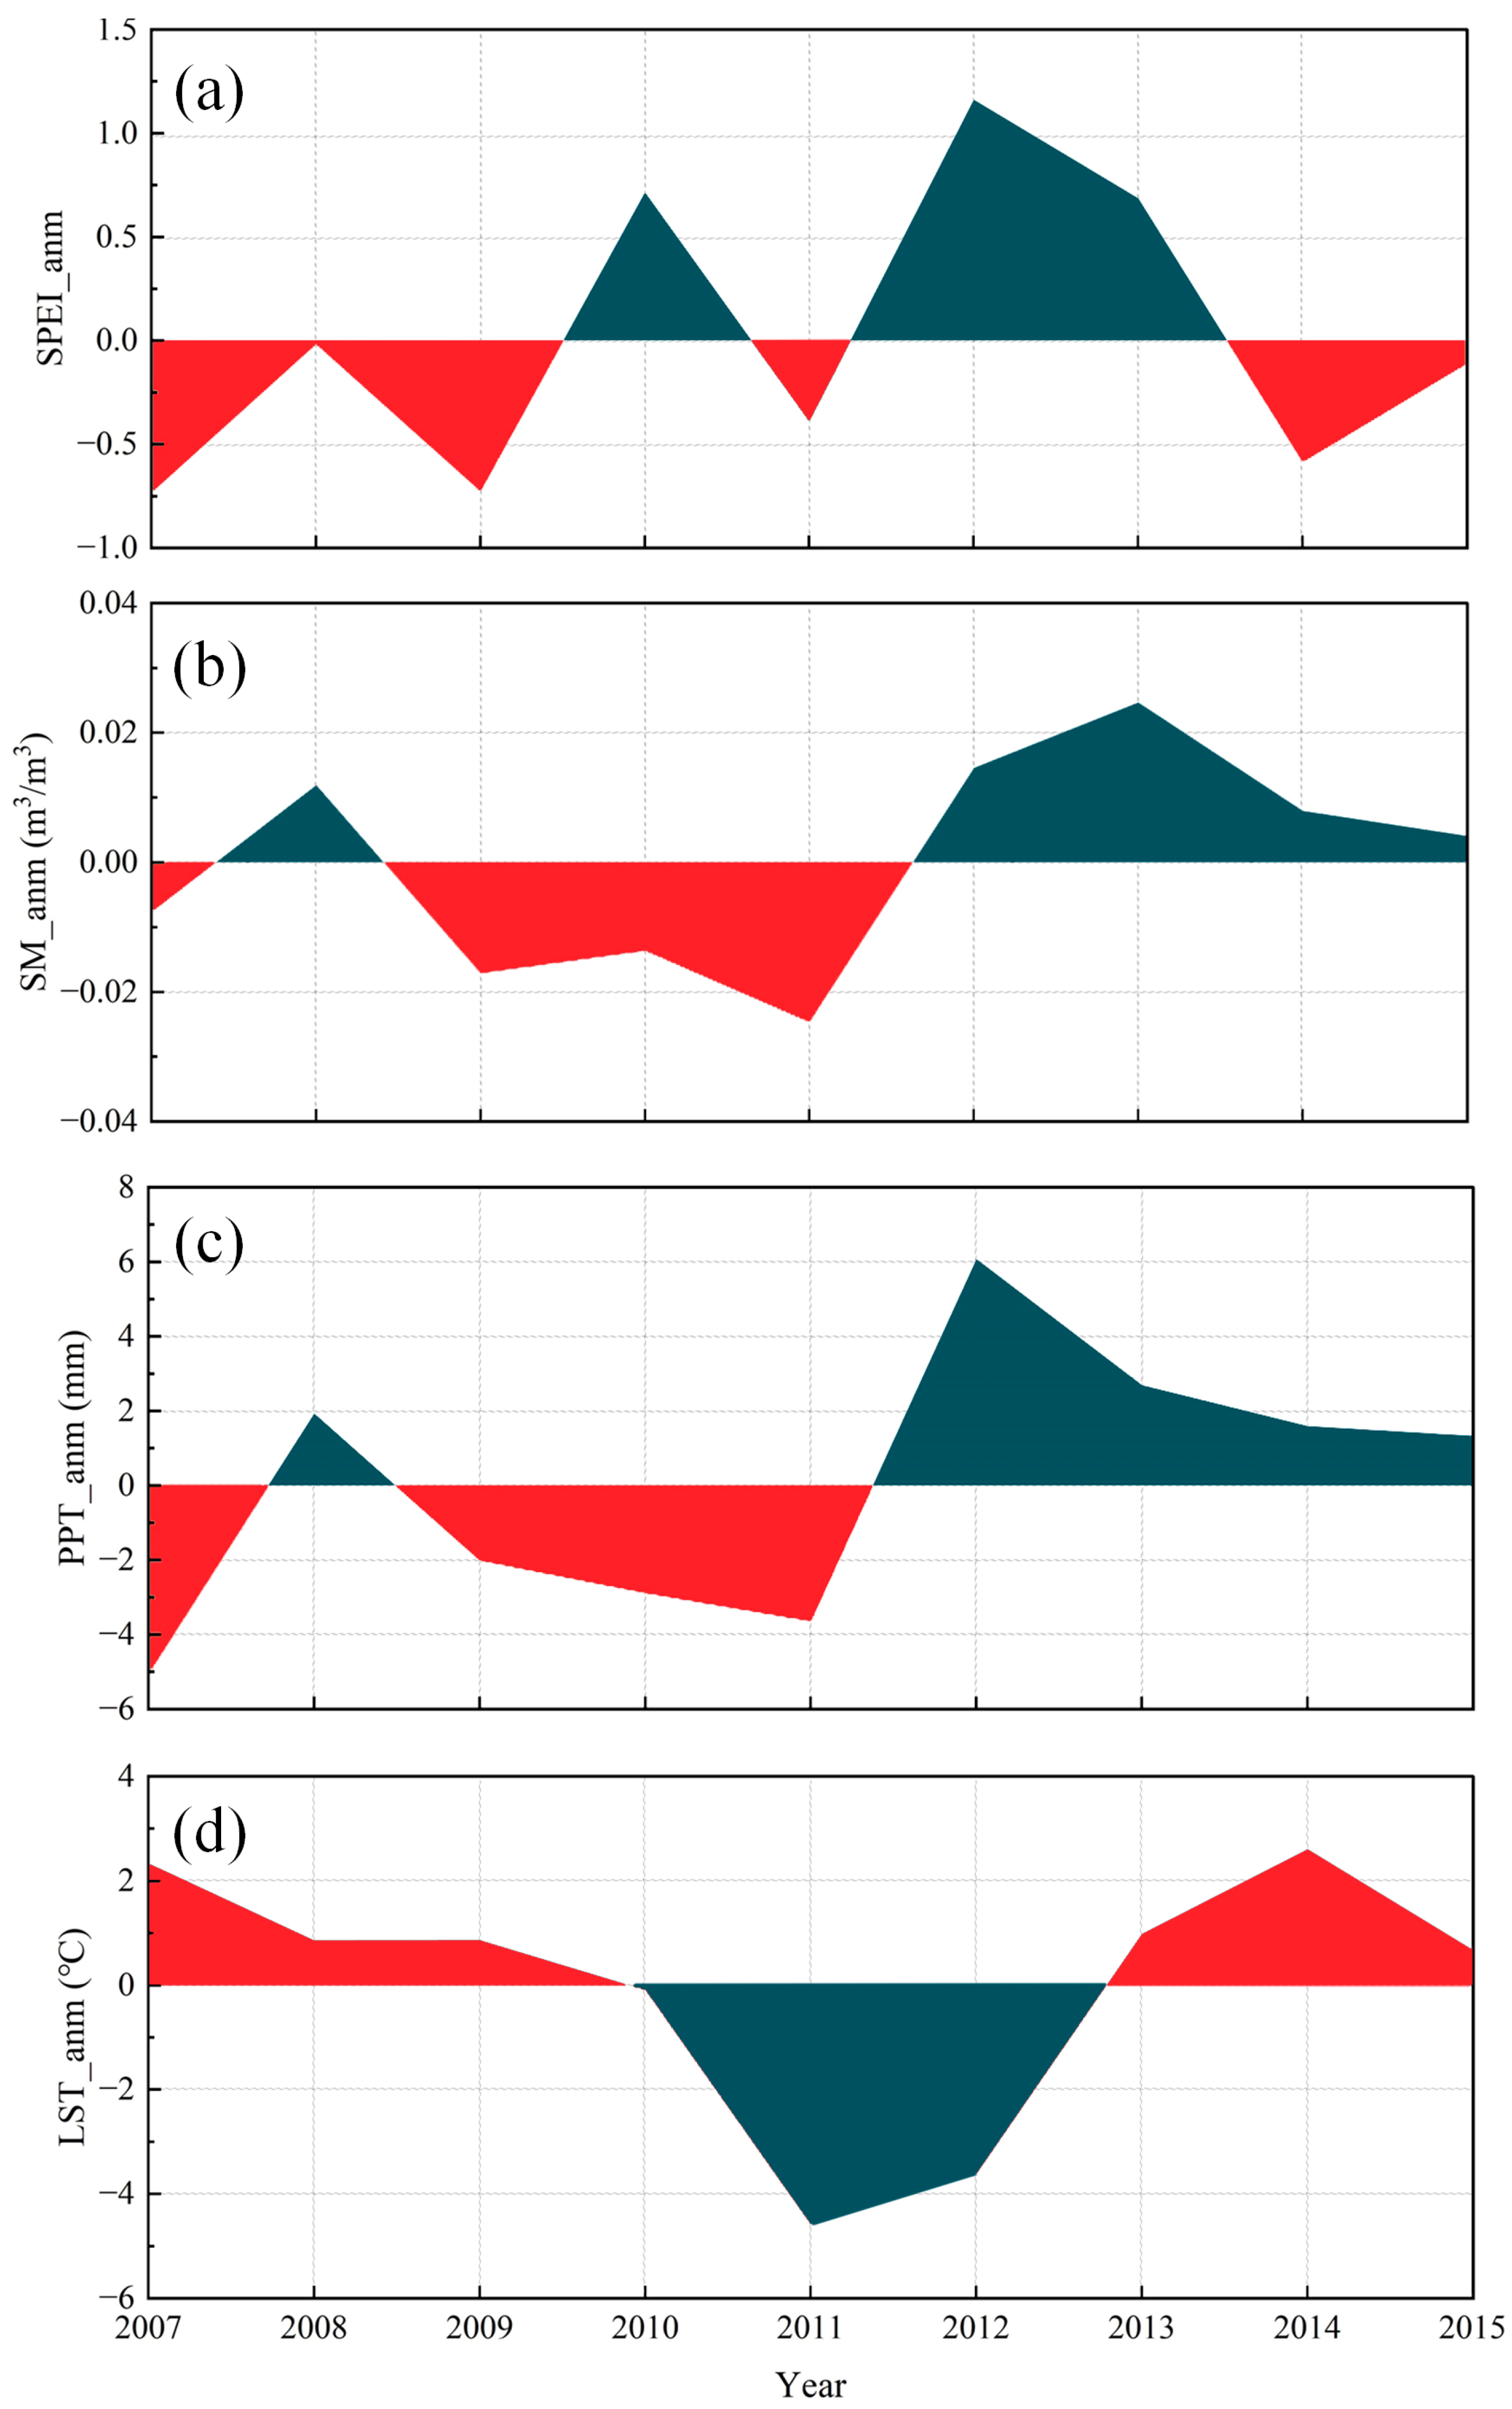
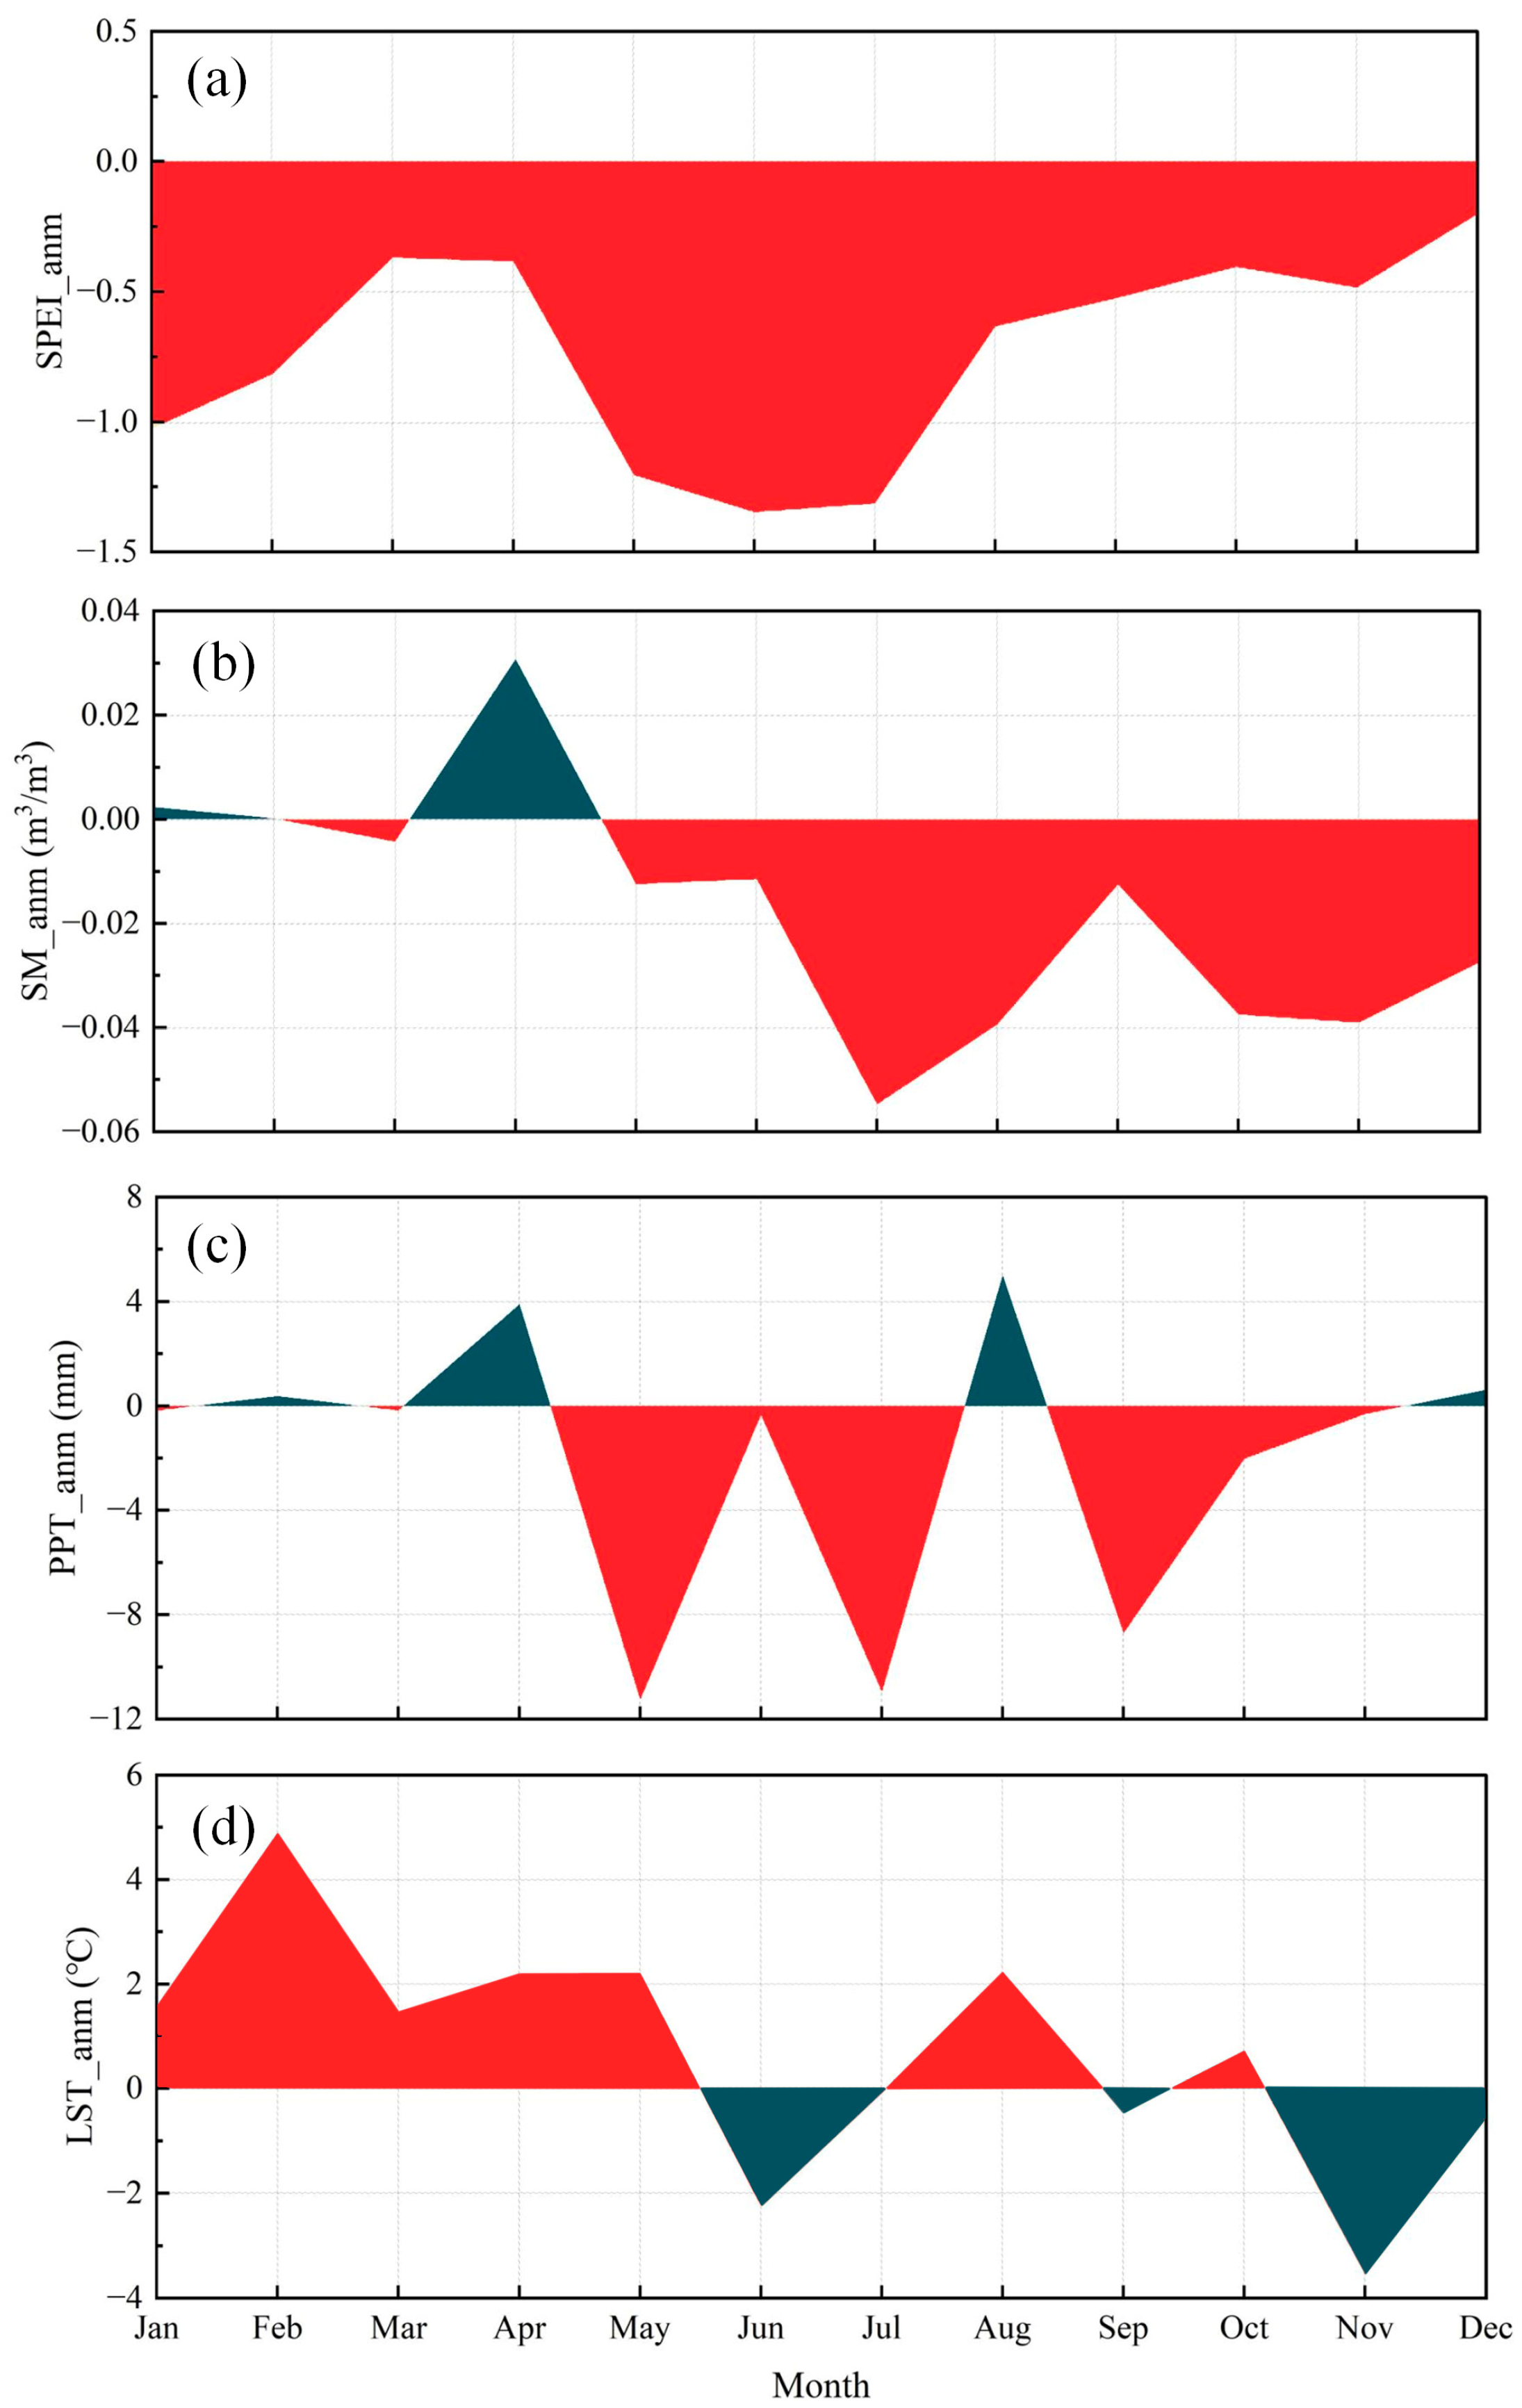
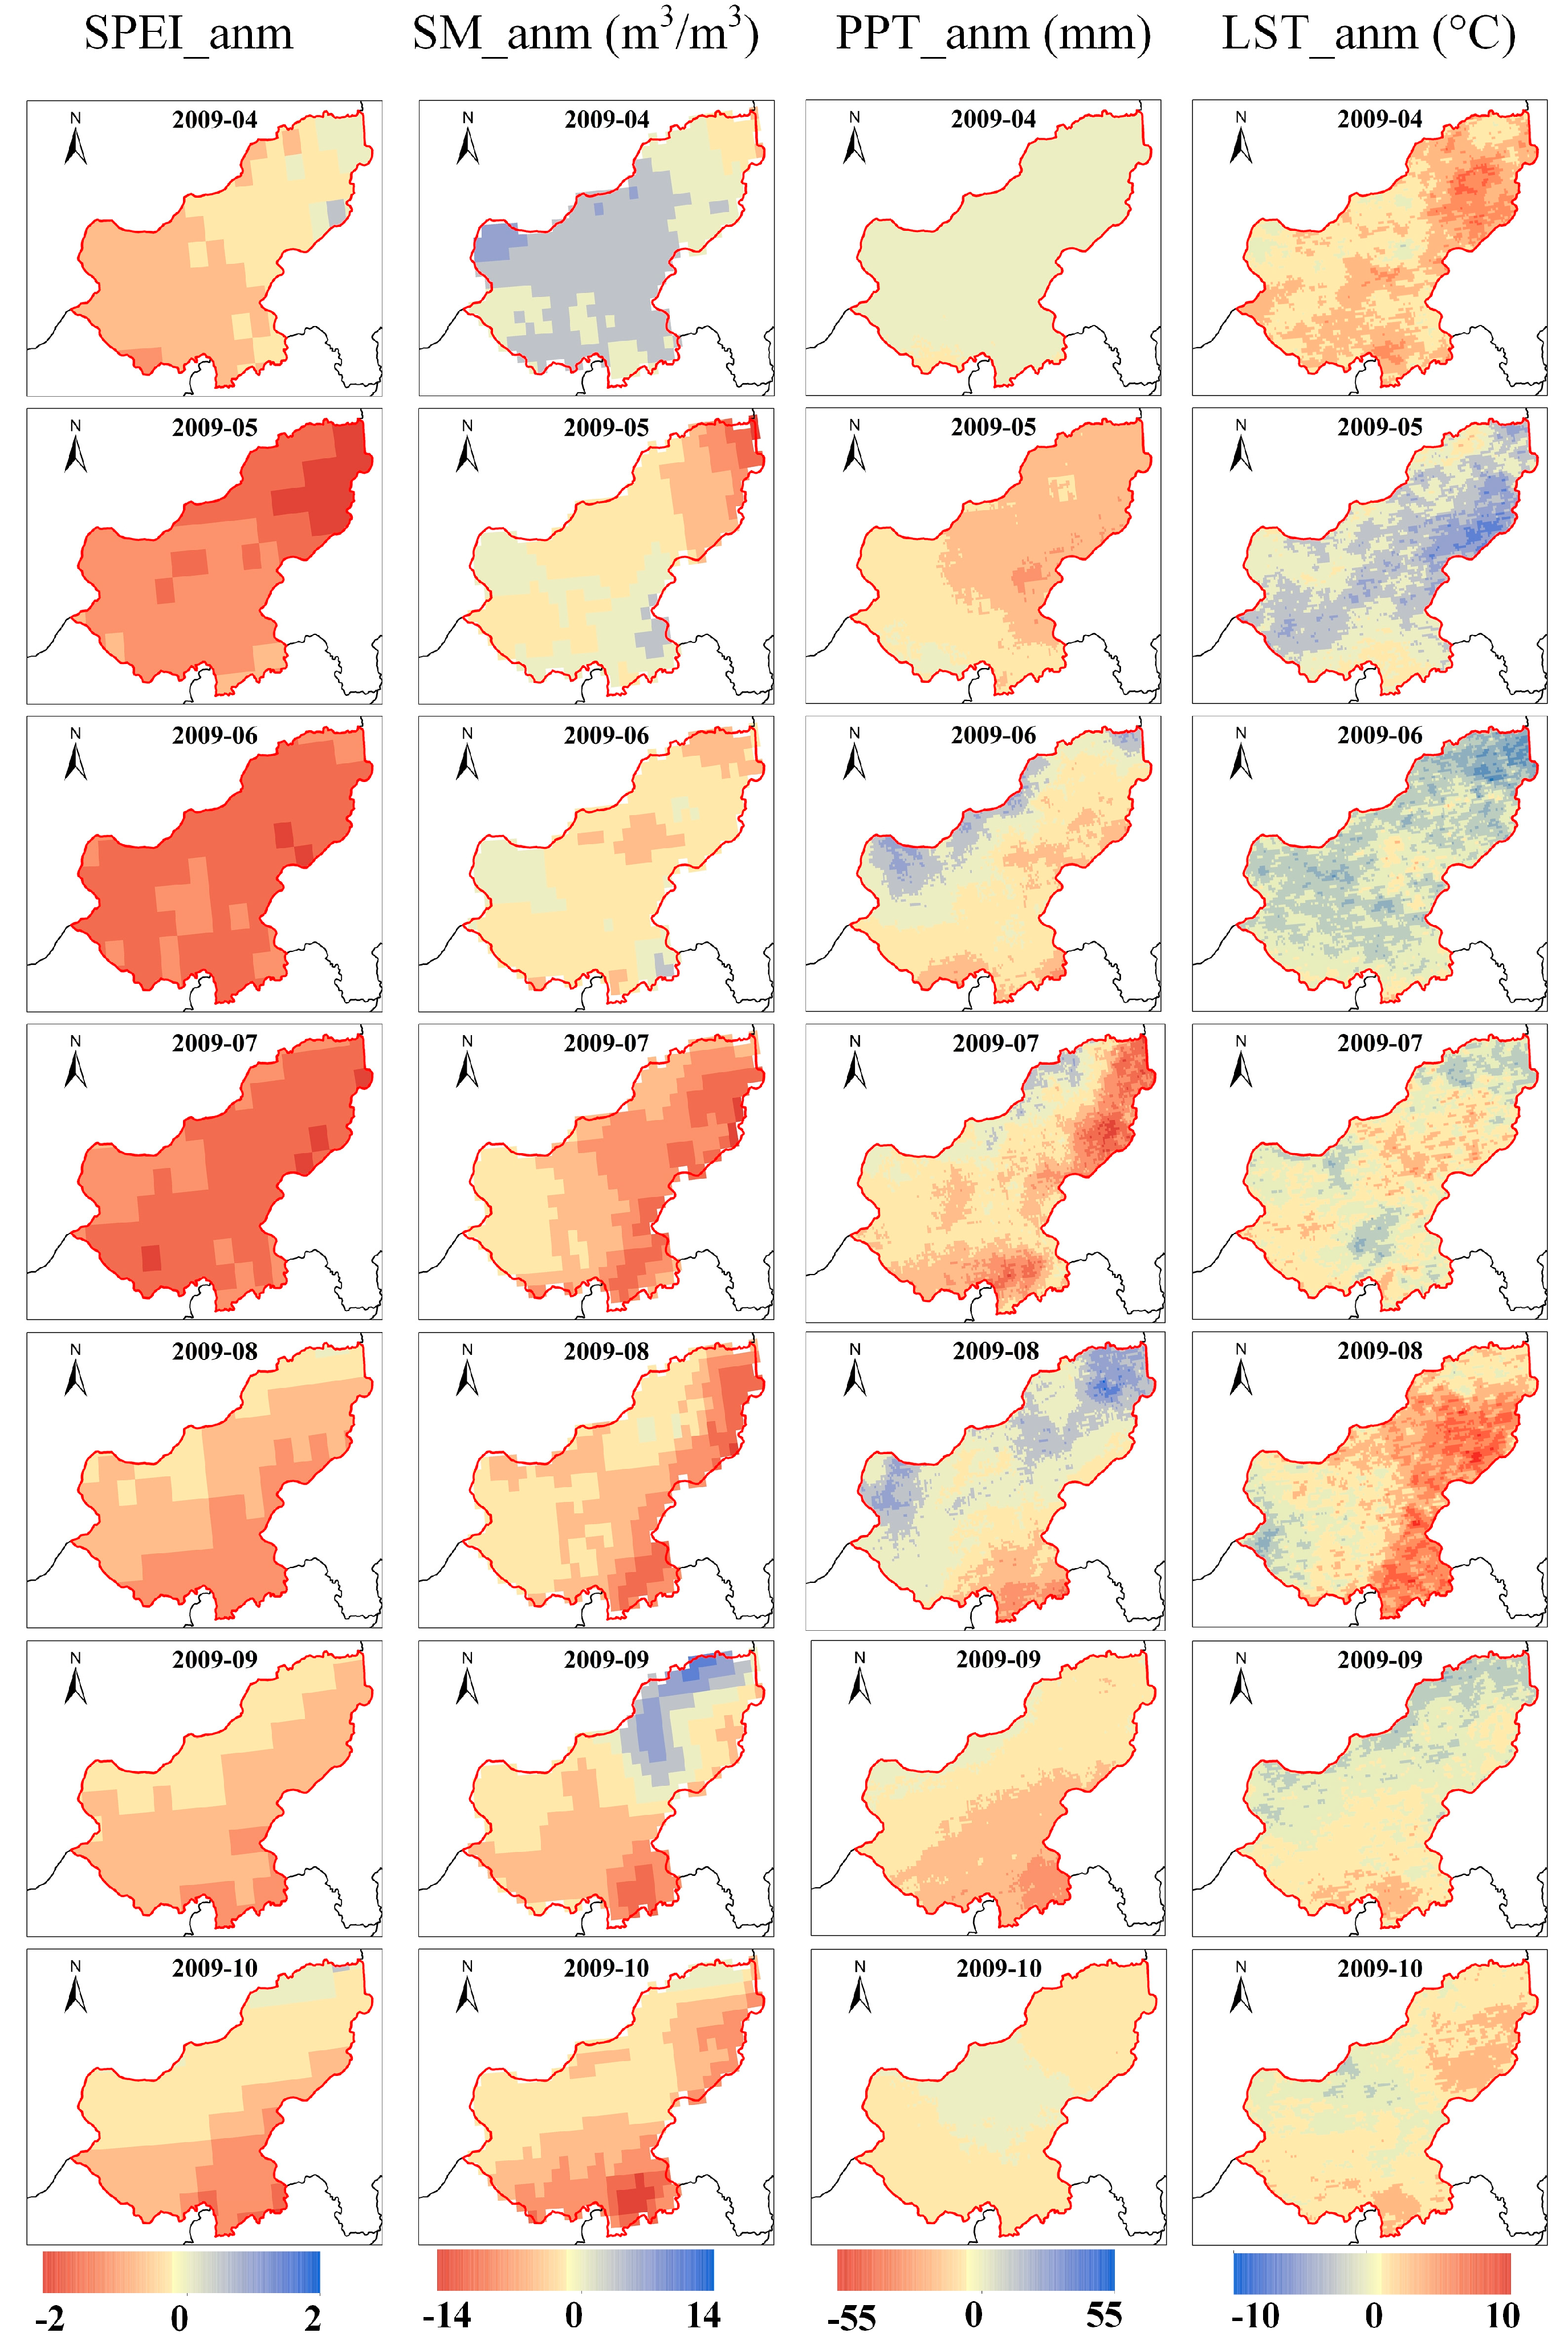
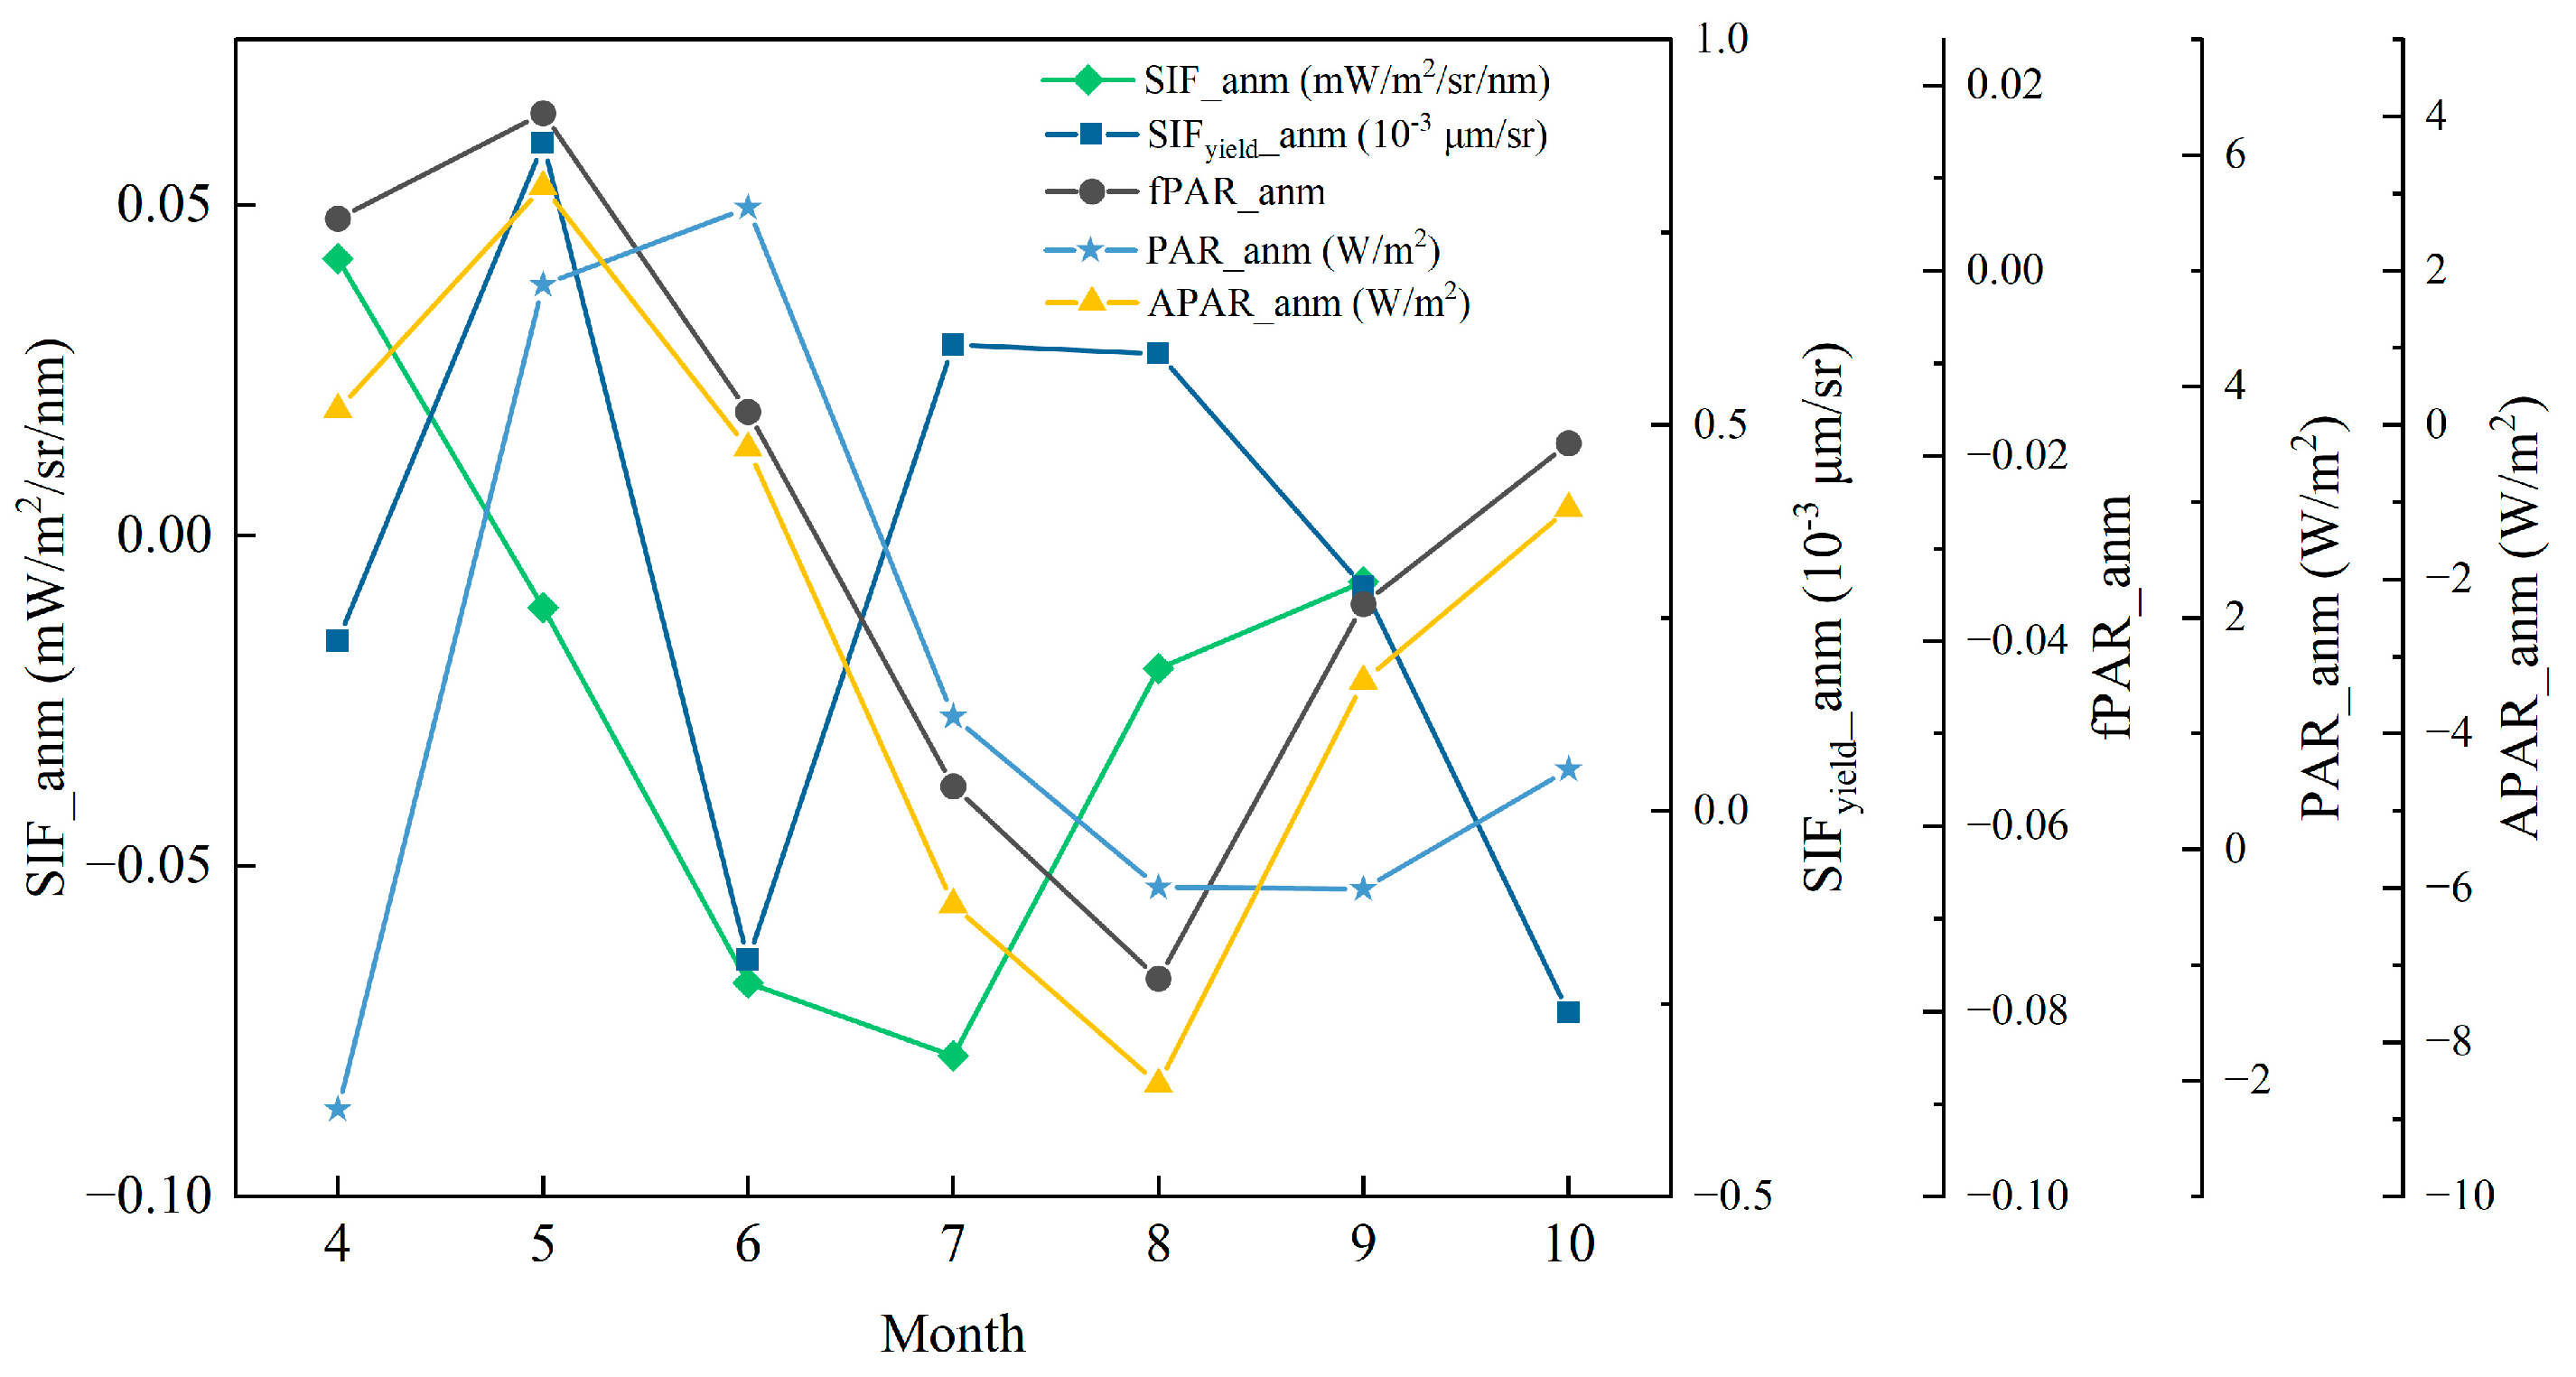
3.1. The Anomalies of Meteorological Indicators during Grassland Growth Period

Firstly, we need to use SPEI, PPT, SM, and LST data to determine drought events in the Xilingol Great Grassland. The drought conditions in the Xilingol grasslands were analyzed based on the annual anomalies of SPEI, PPT, SM, and LST from 2007 to 2015 using the averages of all pixels of the study area. From the results, it can be observed that the SPEI values in 2007, 2009, 2011, and 2014 were all below the annual average (Figure 2). The annual anomalies of PPT and SM showed similar trends, being below the annual average in 2007, 2009, 2010, and 2011. However, the annual anomalies of LST did not show significant changes compared to the average in 2008, 2009, and 2010. Due to the small annual anomaly of SM in 2007 (−0.008 m3/m3) and to eliminate the influence of LST anomalies, we ultimately selected 2009 as the drought year.
Subsequently, we analyzed the monthly anomalies of drought indicators in 2009 by subtracting the monthly value of indicators from the average of each particular month through the 2007–2015 period. As shown in Figure 3, the SPEI anomalies were consistently below the monthly average throughout the year, especially in May, June, and July. Significant decreases in PPT were observed in May, July, and September, resulting in SM anomalies below the monthly average after May. The LST anomalies were only below the monthly average in June, September, and November, while in other months, they were higher than the monthly average.
Next, we further investigated the spatial distribution of anomalies of drought indicators in 2009 (Figure 4). The SPEI anomalies revealed that the entire Xilingol grassland experienced drought in May, June, and July, with the northeastern part being particularly severe. Drought conditions in the northern region eased after August, and by October, only the southern part of the Xilingol grassland remained affected by drought. In May, the entire grassland experienced scarce precipitation, especially in the eastern region. In June, positive PPT anomalies were observed in the western and northern regions, alleviating the drought conditions in those areas. In July, precipitation further decreased in the northeastern part of the Xilingol grassland, intensifying the drought. The occurrence of precipitation in August improved the drought situation. From May to October, most of the Xilingol grassland experienced insufficient soil moisture, particularly in July and August, with severe soil moisture deficits in the northeastern and southern parts. Drought sometimes coincided with high temperatures. As shown in Figure 4, in May, the positive anomalies in LST spatial distribution in most areas of the Xilingol grassland were consistent with the negative anomalies in the other three drought indicators. In August, the positive anomalies in LST spatial distribution in the northeast and southeast of the Xilingol grassland were consistent with the negative anomalies in SPEI and SM.

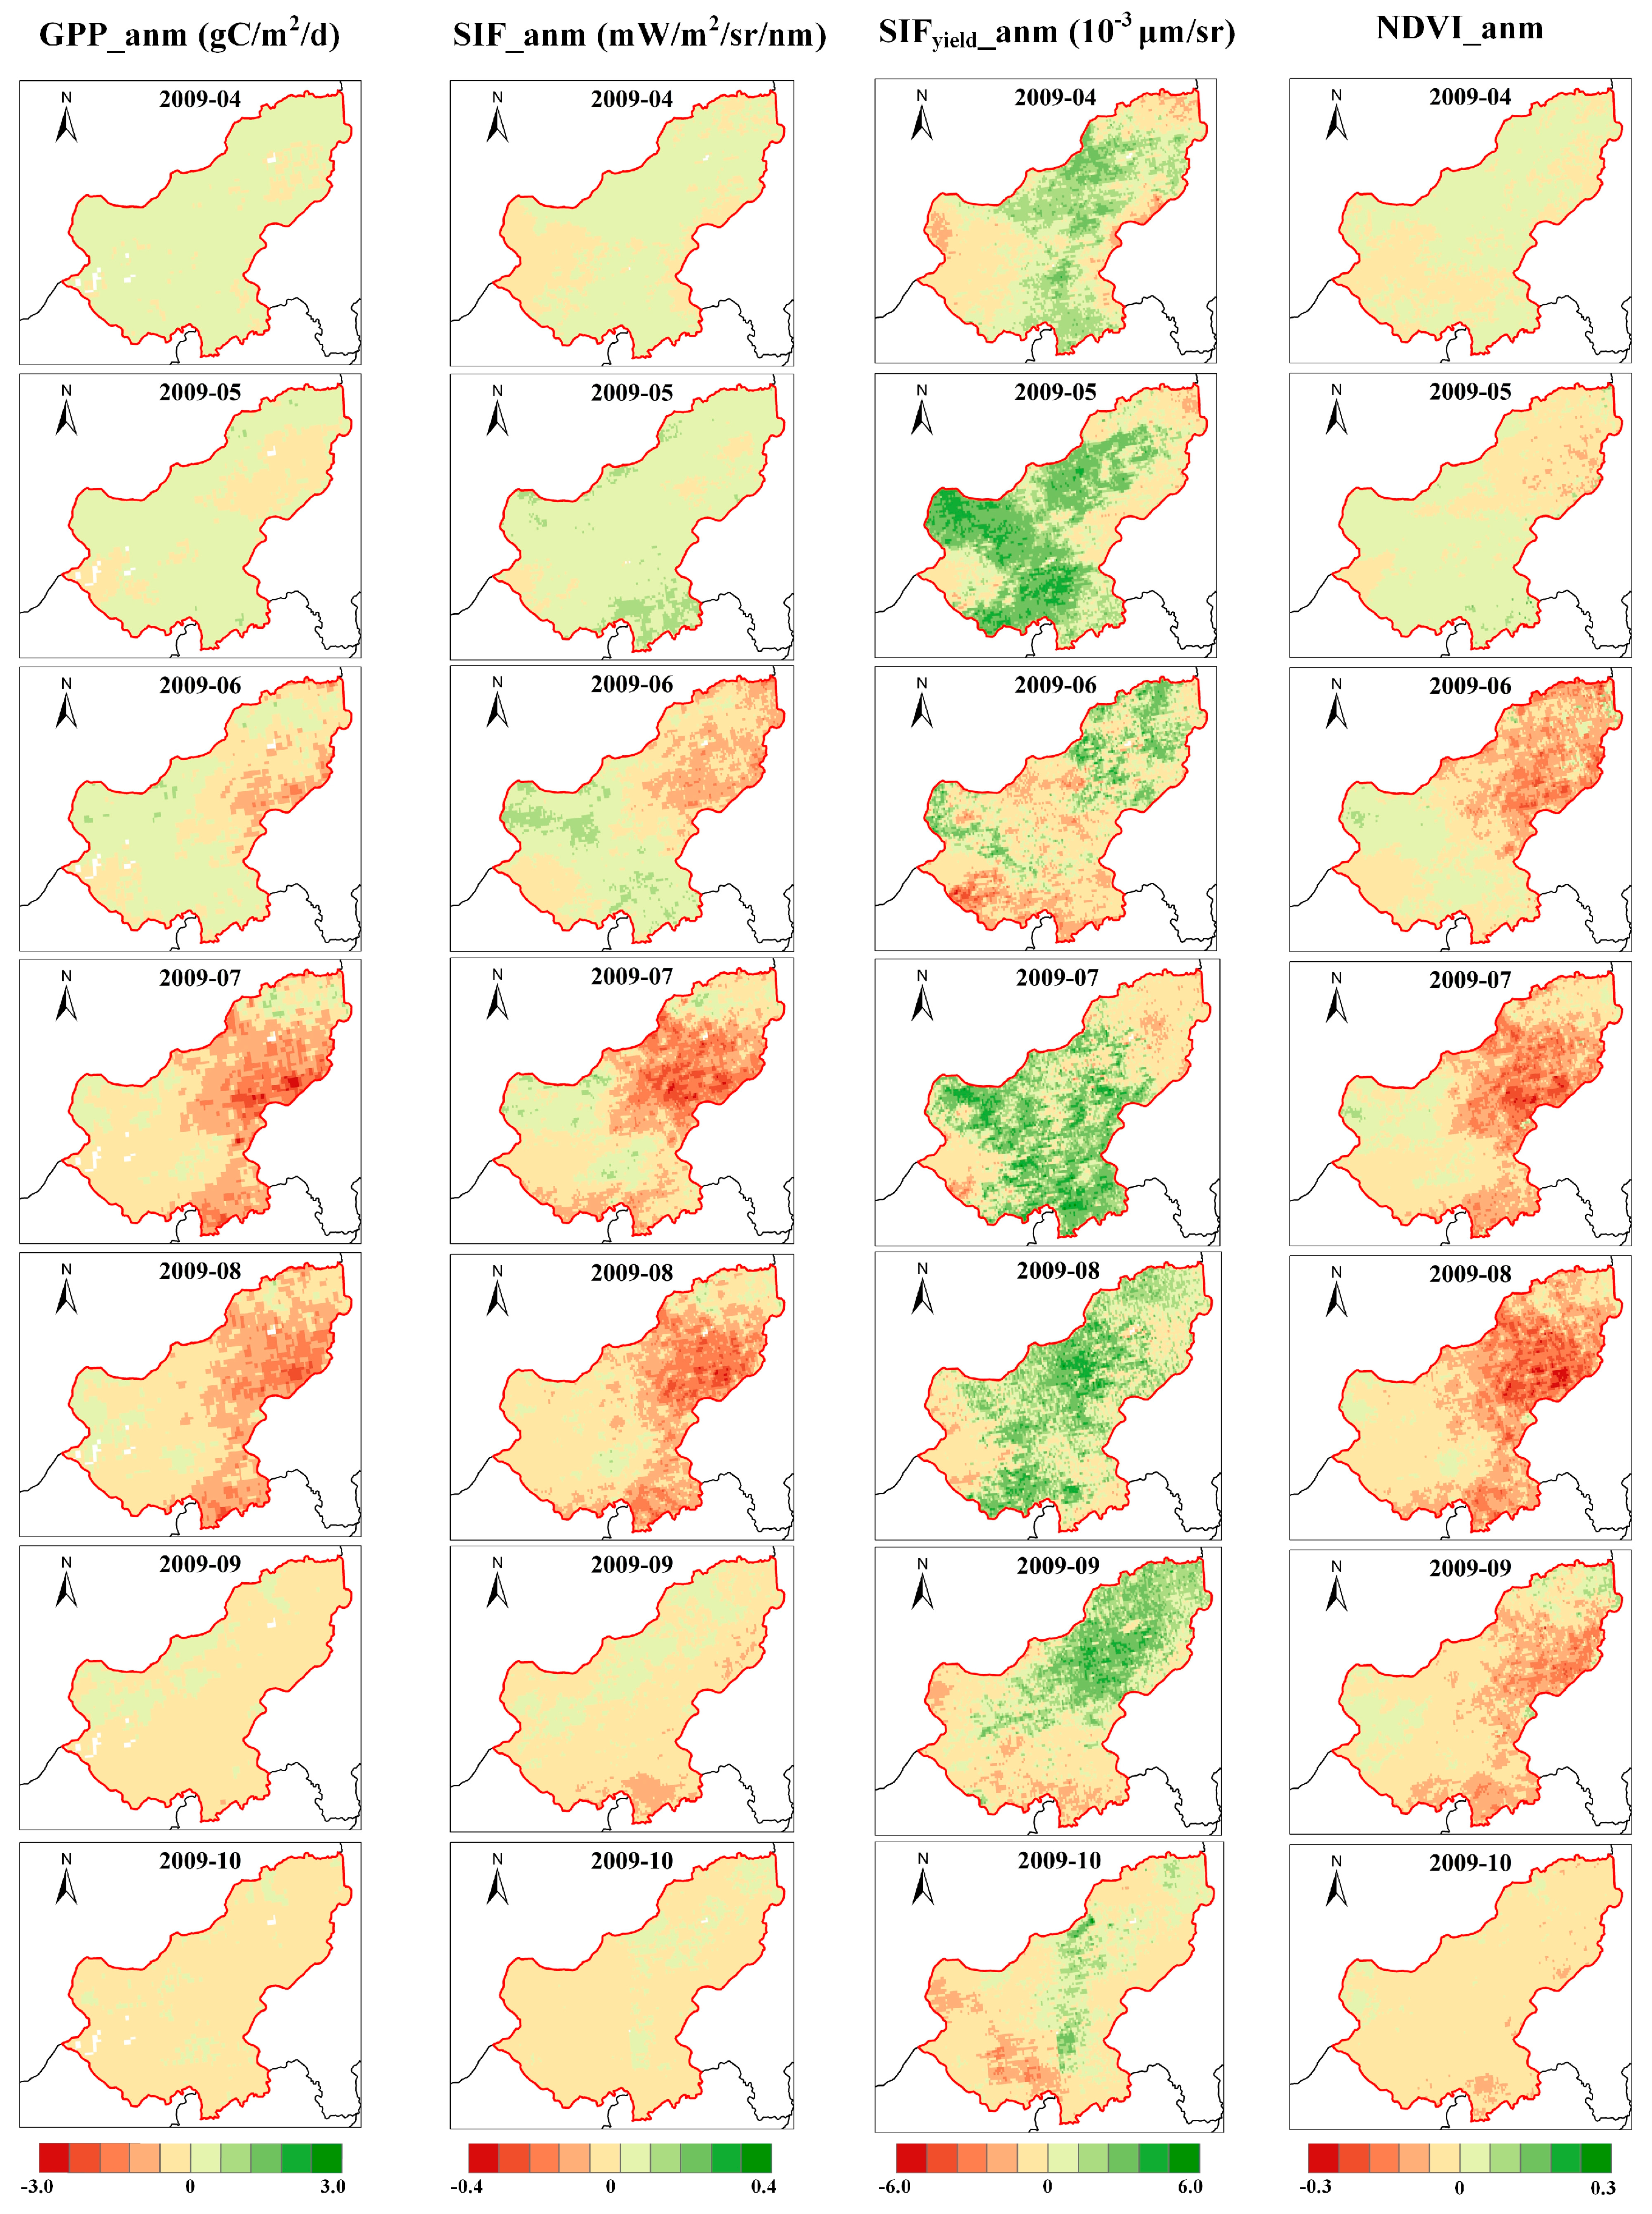
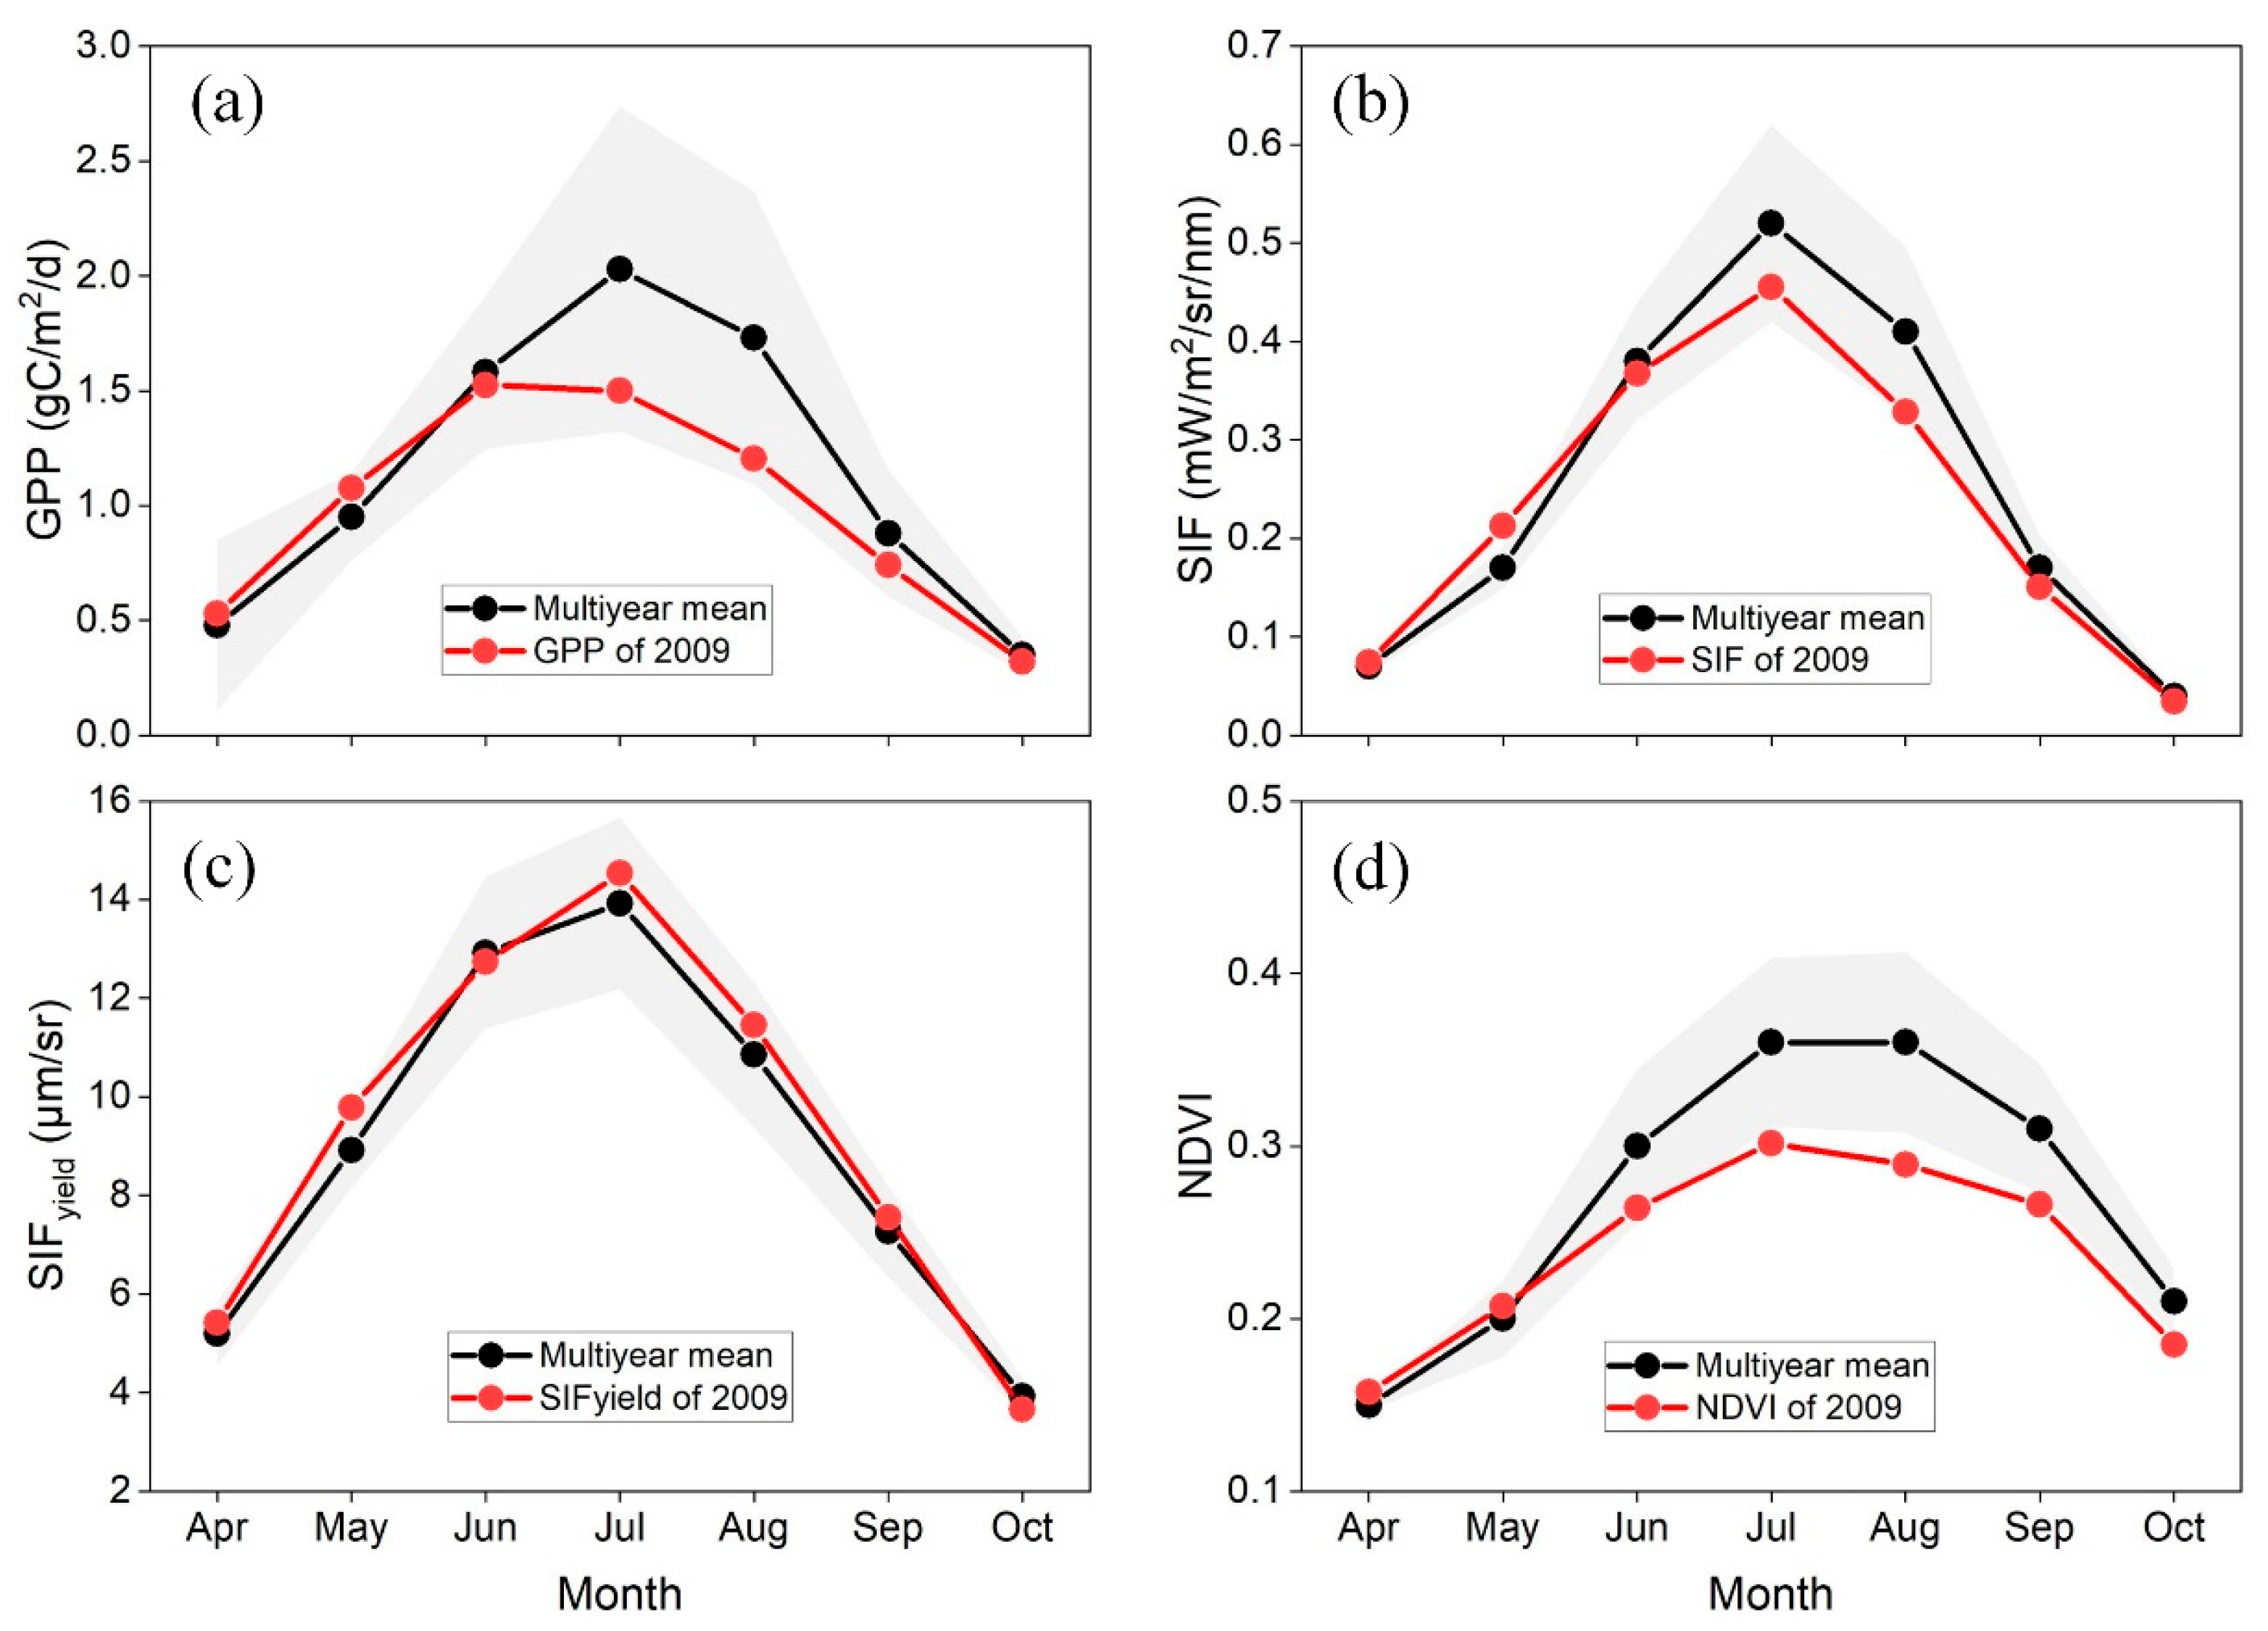
3.2. Temporal and Spatial Characteristics of GPP, SIF, and VIs

We analyzed the spatial patterns of GPP, SIF, SIFyield, and NDVI anomalies during the drought period in 2009 (Figure 5). From Figure 5, it can be observed that GPP and SIF anomalies exhibit similar spatial patterns, indicating that SIF captures the variations in GPP. Negative anomalies in GPP and SIF are mainly distributed in the central and eastern parts of the Xilingol grassland in July and August, while most areas of the grassland show positive anomalies in September. Negative anomalies in SIFyield are mainly observed in the northeast and western regions of the grassland from April to August. Negative anomalies in NDVI are mainly observed in the northeast, central, and southern parts of the Xilingol grassland in June, July, and August, with a larger extent and severity compared to GPP and SIF. However, the anomalies of SIFyield show inconsistency towards SIF and GPP at most of the times and regions.
To explain the inconsistency of SIF and SIFyield, the monthly anomalies of SIF, SIFyield, fPAR, PAR, and APAR were calculated by subtracting the monthly value of indicators from the average of each particular month through the 2007–2015 period. According to Equation (1), we know that SIF and SIFyield are directly proportional to each other but are affected by APAR. When SIF increases, SIFyield and SIF have the same trend only when APAR remains the same or increases less than the increase in SIF. As can be seen from Figure 6, SIF decreased by 126.04% in May compared to April, while APAR increased by 1427.75%, which leads to different trends in SIF and SIFyield. Also, in June, July, and August, the trend of APAR is either different from SIF or higher than that of SIF. This phenomenon causes the inconsistency between SIF and SIFyield.
Overall, GPP, SIF, and NDVI exhibit similar spatiotemporal patterns during the drought (Figure 5), with GPP and SIF showing closer spatiotemporal variations. These results suggest that satellite-based SIF can effectively monitor the dynamic progression of drought and accurately track the spatiotemporal changes in GPP under drought conditions.
To further evaluate whether SIF can serve as an effective indicator for monitoring GPP, we conducted a statistical analysis by comparing the downscaled GOME-2 SIF values with the FLUXCOM GPP product. From Figure 7, it can be observed that SIF and GPP showed a significant correlation with R2 of 0.95 (p < 0.001). However, the correlations between NDVI, SIFyield, and GPP were significantly lower, with R2 values of 0.78 and 0.66, respectively. The decrease in the correlation between NDVI and GPP might be due to NDVI saturation when grass growth rate and coverage are high. The relationship between SIFyield and GPP was reduced because of the lack of information on vegetation canopy structure as SIFyield removed the information on fPAR, which represents the vegetation canopy structure information.
Furthermore, the relationship of the anomalies of SIF, SIFyield, and NDVI with GPP exhibited a similar pattern to the relationship between the measured values of these variables. From Figure 7, it can be seen that there was a substantial linear association between the anomalies of SIF and GPP, with an R2 value of 0.78 (p < 0.001), while the R2 value between the anomalies of NDVI and GPP is only 0.64 (p < 0.001), and there was no significant correlation between the anomalies of SIFyield and GPP. These results further confirmed that SIF can serve as an effective indicator of plant photosynthesis, accurately capturing the spatiotemporal changes in GPP, which was consistent with previous studies [51,52]. However, whether SIF can quantify the spatiotemporal variations in GPP induced by drought still requires further evaluation.

3.3. The Impact of Drought on GPP, SIF, and VIs

To assess the impact of drought indicators (SPEI, SM, PPT, and LST) on VIs (GPP, SIF, SIFyield, and NDVI), we employed Pearson to examine the relationships of VIs with drought indicators. As shown in Table 3, GPP, SIF, SIFyield, and NDVI exhibited the highest correlations with PPT, with correlation coefficients (r) of 0.91, 0.91, 0.82, and 0.85, respectively. There were significant correlations between GPP, SIF, SIFyield, NDVI, and PPT. Except for SIFyield, GPP, SIF, and NDVI also demonstrated strong correlations with SM, with r of 0.46, 0.41, and 0.53, respectively. However, apart from GPP, there was no significant correlation between SIF, SIFyield, NDVI, and SPEI. These findings are generally consistent with our expectations. The significant correlations between VIs (GPP, SIF, SIFyield, and NDVI) and PPT, LST, and SM can be attributed to the fact that during drought periods, reduced precipitation leads to soil moisture deficit. SM directly supports water consumption in the plant growth process, and drought events are often accompanied by increased temperatures. On the other hand, the relatively low correlation between VIs (GPP, SIF, SIFyield, and NDVI) and SPEI is because meteorological drought indices do not have a direct relationship with vegetation physiology.

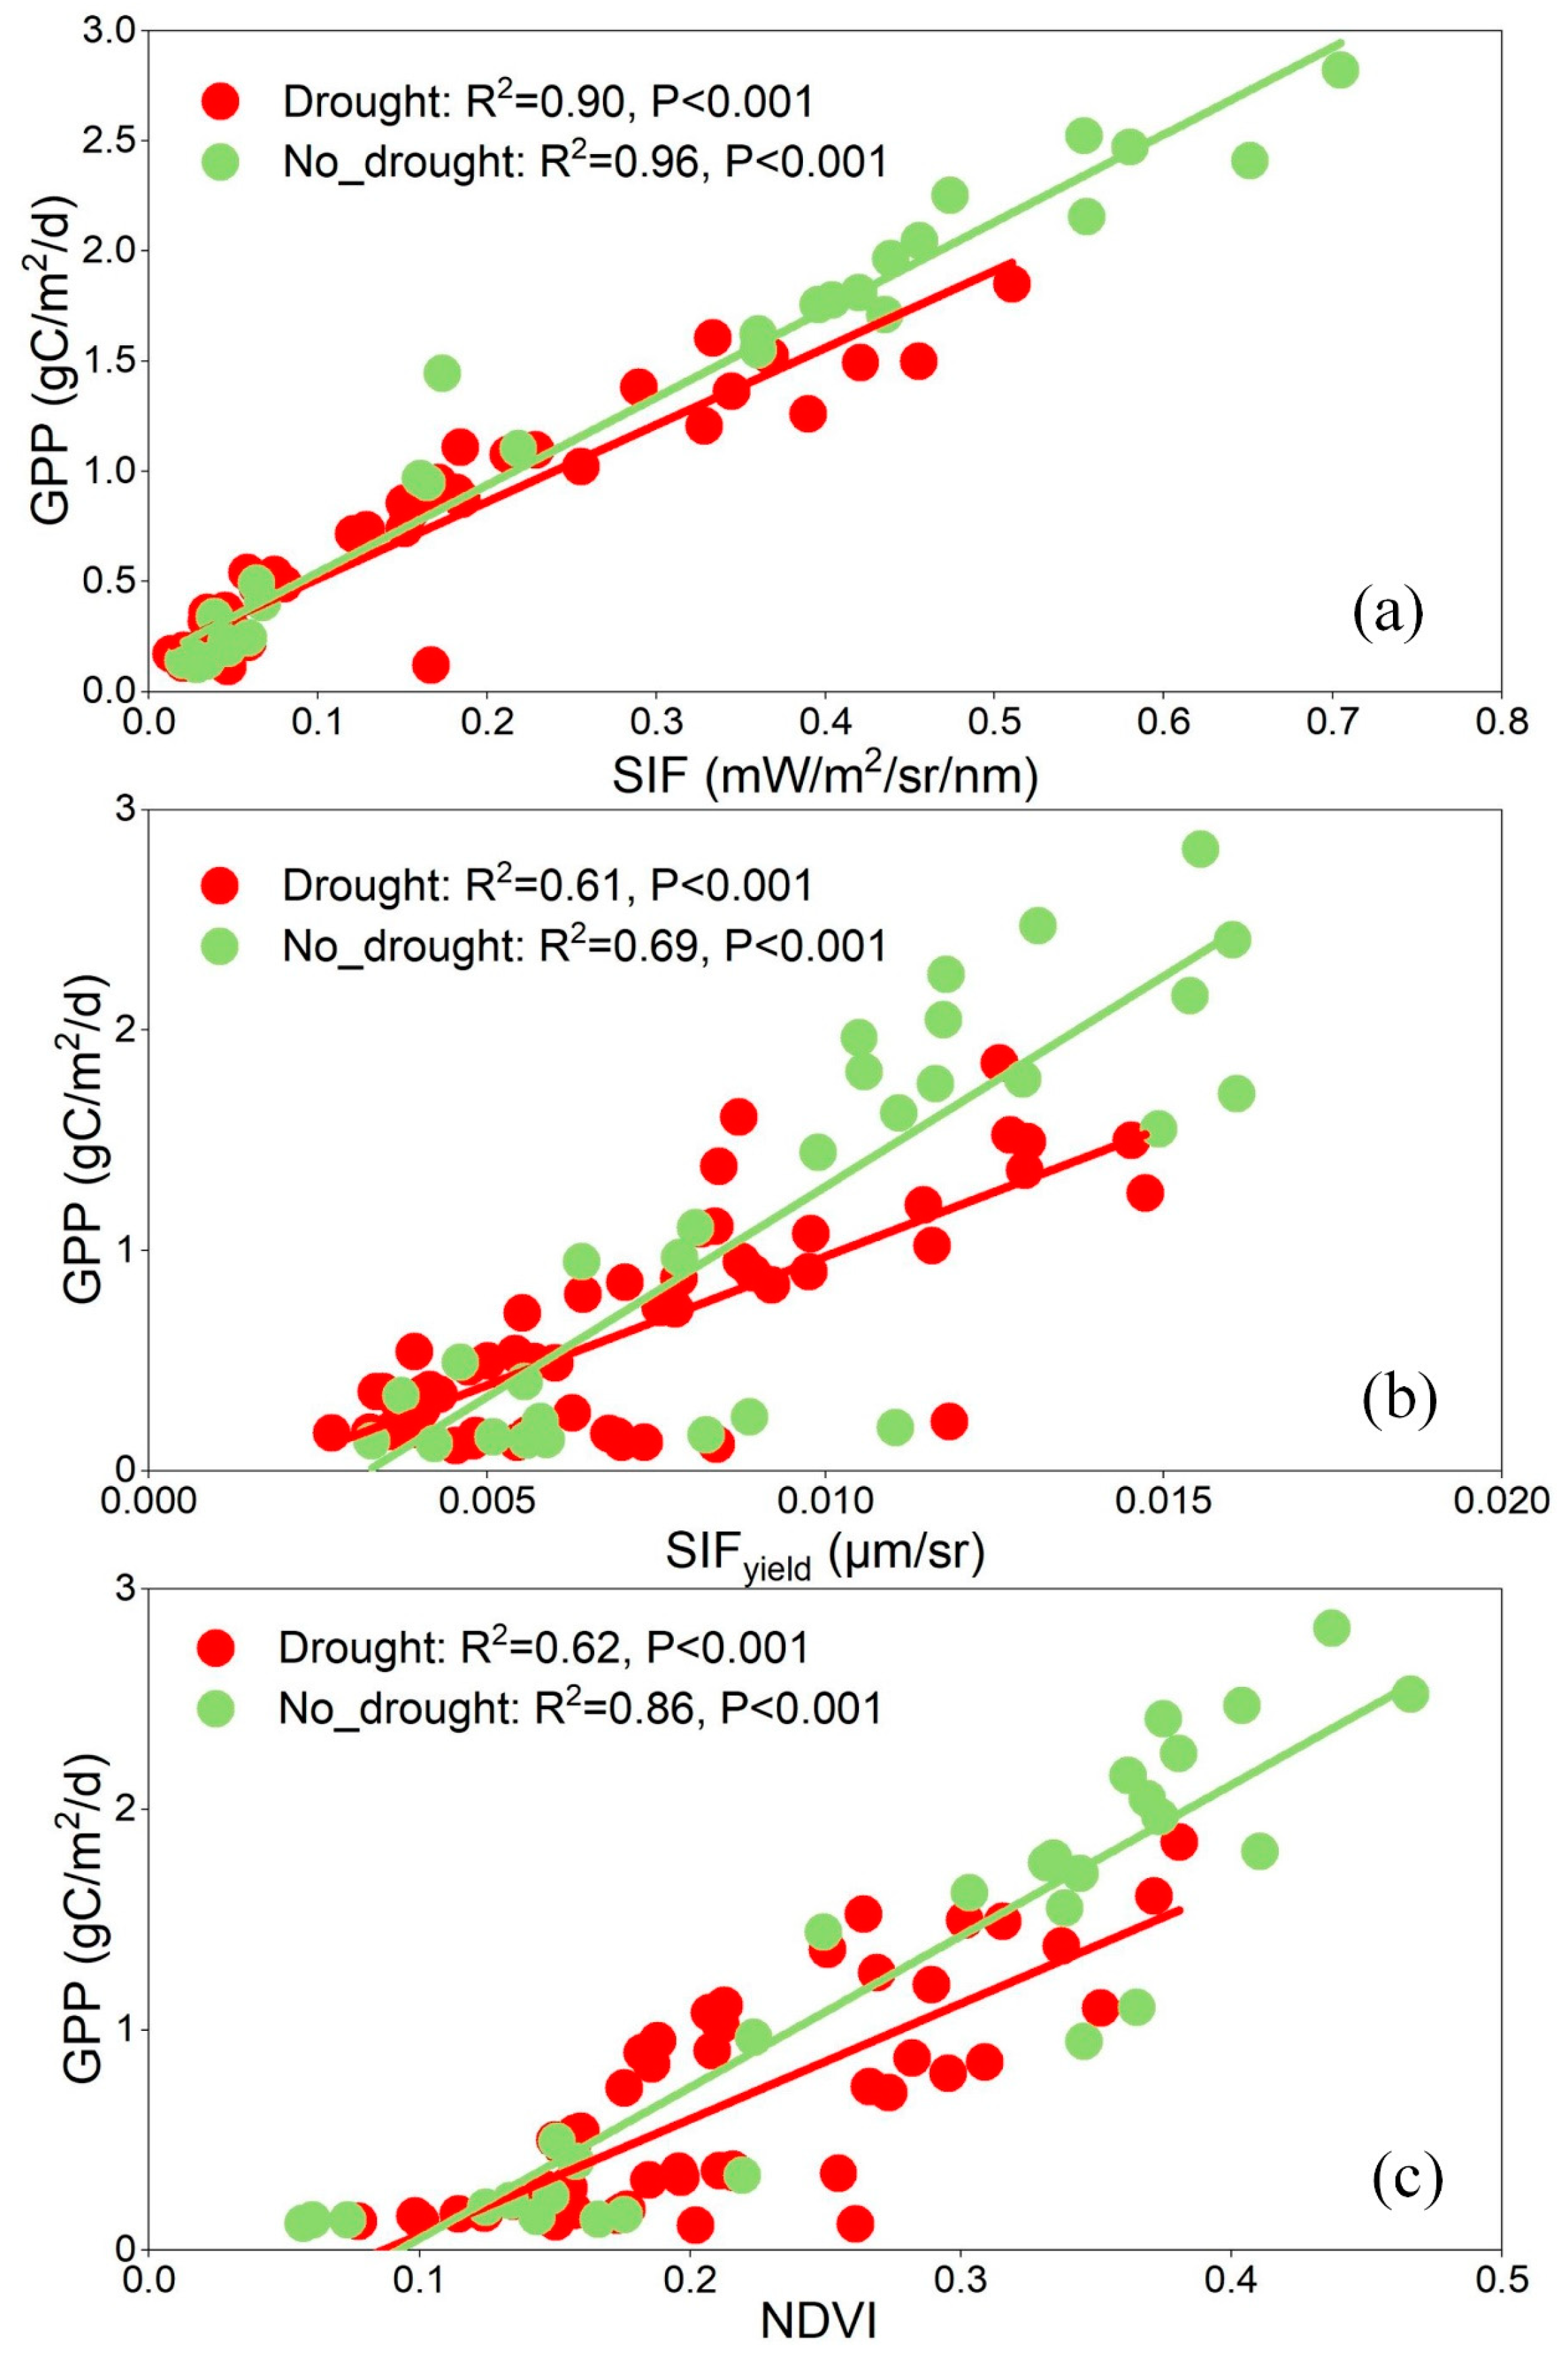
3.4. Performances of SIF in Grassland GPP Monitoring under Drought Conditions

To visually demonstrate the ability of SIF to monitor GPP under drought conditions, we compared and analyzed the characteristics of GPP, SIF, SIFyield, and NDVI during the 2009 drought. Figure 8 shows the seasonal variations in GPP, SIF, SIFyield, and NDVI in 2009 compared to the multi-year averages. The multi-year averages and the values for 2009 exhibited similar changing patterns, with an initial increase followed by a decrease. In July 2009, compared to the multi-year averages, GPP, SIF, and NDVI declined 26.18%, 12.43%, and 16.26%, respectively. In August, GPP, SIF, and NDVI declined 30.33%, 19.89%, and 19.65% compared to the multi-year averages, respectively (Figure 8). However, the difference between SIFyield in 2009 and the multi-year average was relatively small.
During a drought event, reduced rainfall leads to soil moisture deficit, ultimately affecting vegetation growth. In 2009, GPP reached its peak in June and then started to decline, while SIF, SIFyield, and NDVI continued to increase until July before decreasing. This indicated a lag in the response of SIF and NDVI to vegetation growth changes. All indices declined not only during 2009 but in the multi-year data after July. However, after July, both GPP and SIF rapidly decreased due to worsening drought conditions, while NDVI exhibited a slower decline. As can be seen from Figure 8, GPP decreased by 19.57% and 24.33% in August and September 2009, respectively. Similarly, SIF decreased by 27.87% and 54.03% in August and September, respectively. However, NDVI decreased by only 4.05% and 7.92% in August and September, respectively. SIF, although it did not capture the downward trend of GPP in July, decreased by a similar amount in August and September. This also indirectly proves that SIF is better than NDVI in monitoring the changes of GPP. In order to reveal the relationship between SIF, SIFyield, NDVI, and GPP more intuitively, it is necessary to carry out a correlation analysis of SIF, SIFyield, NDVI, and GPP.
Subsequently, we analyzed the correlations between SIF, SIFyield, NDVI, and GPP separately for all drought and non-drought months. Figure 9 revealed that drought reduced the ability of NDVI to monitor GPP, with R2 values of 0.86 (no_drought) and 0.62 (drought), but drought did not affect that of SIF to monitor GPP. Under drought, the R2 between SIF and GPP reached 0.90, representing a 47.54% increase compared to SIFyield and a 45.16% increase compared to NDVI. This further confirmed the strong capability of SIF to track and monitor GPP variations under drought conditions.

4. Discussion

With the influence of global climate change, droughts are gradually increasing. Therefore, real-time and accurate monitoring of vegetation drought using satellite-based SIF at a regional scale is of great significance. Firstly, large-scale monitoring of vegetation drought using SIF can provide help for forestry, grassland, and agricultural management. Early detection of drought using SIF can help stakeholders such as herders and farmers in implementing measures to mitigate the impacts appropriately. Moreover, SIF can quantify GPP losses caused by drought and assess the effects of drought on forestry, grassland, and agriculture, which is crucial for food security.

4.1. The Ability of SIF to Monitor Drought

Our research has demonstrated that SIF can capture the spatiotemporal variations of drought (Figure 5). It was discovered that SIF is susceptible to variations in water availability and strongly correlated with precipitation (Table 3). SIF can track the physiological and structural changes in vegetation caused by drought [53,54,55]. During mild or short-term drought events, the chlorophyll content of vegetation does not significantly decrease, and the vegetation canopy does not exhibit noticeable changes. VIs based on greenness remain relatively stable, but fluorescence emissions may decrease immediately. This is because changes in VIs based on greenness lag behind and cannot promptly detect changes in vegetation physiological status. They can only capture long-term droughts, which lead to wilting of plant leaves. Chen et al. (2019) found that VIs lag behind changes in moisture conditions, while the relationship of precipitation with VIs is more significant [31]. Liu et al. (2018) found that the seasonal mean of SIF significantly decreases under severe drought and extreme drought conditions, while NDVI only significantly decreases under extreme drought conditions [56]. Moreover, SIF is more sensitive to the occurrence of drought, while NDVI is suitable for monitoring drought on longer time scales. Therefore, NDVI cannot timely monitor early-stage drought, while SIF possesses the ability to monitor drought in real time, making it an effective indicator for agricultural disaster monitoring.

4.2. Capacity of SIF in Monitoring GPP under Drought Conditions

Because of the lack of direct large-scale GPP observation data, it is challenging to accurately monitor the spatiotemporal variations of GPP caused by drought. FLUXCOM-GPP, which is based on process-based modeling, can successfully represent the spatiotemporal variations of GPP [57]. GPP is dependent on the input of historical data. However, these data are difficult to access resulting in GPP data not being available in a timely manner. So, there is an urgent need for a simple, direct, and accurate method to estimate GPP. SIF is considered as a good indicator for estimating GPP due to its close correlation with vegetation photosynthesis. Therefore, it offers a new opportunity for assessing GPP losses caused by drought. Our research demonstrates that SIF can accurately track the temporal and spatial variations in GPP due to drought (Figure 5). Furthermore, the strong linear relationship of SIF with GPP enables SIF to be an applicable new indicator for evaluating drought-induced GPP losses (Figure 7a,d).
Previous studies have shown strong correlations of SIF with GPP in different ecosystems. Damm et al. (2015) comprehensively evaluated the relationship of SIF with GPP in different ecologically distinct systems (cropland and temperate mixed forest) using SIF and EC flux data [14]. The results revealed a strong correlation between SIF and GPP across different ecosystems. The high correlation of SIF with GPP makes SIF a promising indicator for assessing GPP losses due to drought (Figure 9). Traditional drought indices are calculated using meteorological data or coupled remote sensing data and primarily evaluate the effect of drought on vegetation by analyzing the statistical relationship between drought indices and GPP. Compared to traditional drought indices, there are notable benefits for SIF to assess drought losses because it can be directly used for evaluating GPP losses without the need for additional auxiliary data.
Our results also revealed that the relationship of SIF with GPP (R2 = 0.95) is more significant than the relationship of NDVI with GPP (R2 = 0.78) (Figure 9). The traditional, green-based vegetation index NDVI has limitations in drought monitoring because it only interprets potential photosynthesis and lacks a direct connection to the actual photosynthetic process. Additionally, NDVI is significantly influenced by factors such as soil background and shadows. In contrast, the positive relationship of SIF with GPP indicates that SIF is more sensitive to photosynthesis and does not exhibit saturation effects. This advantage of using SIF to estimate vegetation GPP demonstrates that SIF serves as a reliable indicator of vegetation productivity, consistent with previous research [46].

4.3. Reasons for the Different Performances of SIF and VIs in GPP Monitoring under Drought Conditions

Although SIF and NDVI generally show consistent responses to drought, there are also some differences between them (Figure 5). Compared to NDVI, SIF exhibits better correlations with temperature and precipitation, which means that SIF is more sensitive to the variation in temperature and precipitation. In other words, SIF contains more environmental information than NDVI. This is because environmental factors, such as temperature and vapor pressure deficit (VPD), are closely related to light use efficiency (LUE) and ecosystem productivity, resulting in a stronger relationship between GPP and SIF than that between GPP and NDVI [58]. Studies have shown that both SIF and NDVI can effectively track changes in SM, and this high sensitivity is due to the higher biomass turnover rate in drier grassland. Long-term or severe drought not only inhibits grassland photosynthesis but also affects stomatal conductance, photosynthetic enzyme activity, and so on. During drought, physiological and canopy structure parameters such as chlorophyll content, leaf area index, and fPAR show significant changes. SIF exhibits a stronger response to water stress compared to NDVI, which is consistent with previous research. Yoshida et al. (2015) found that in agricultural or predominantly grassland areas, SIF is more sensitive to drought than NDVI [59].
This study elucidates the differences in the potential of SIF and NDVI in grassland ecosystems to capture GPP loss under drought conditions. By exploring the relationship of SIF and NDVI with GPP, we found that SIF captures GPP variations better than NDVI (Figure 7). At a reduced scale, SIF outperforms traditional VIs in monitoring grassland productivity in response to drought, primarily because SIF also contains information about VPD or soil moisture effectiveness [60]. Due to its close association with vegetation photosynthesis, SIF is capable of revealing the impact of environmental stress on vegetation photosynthesis. As an indicator of vegetation photosynthesis, SIF provides a more intuitive and accurate reflection of vegetation growth status compared to reflectance-based traditional VIs, while NDVI primarily indicates vegetation coverage and chlorophyll content, without a direct relationship to vegetation photosynthesis [61]. Since SIF incorporates environmental information, it can help monitor variations in photosynthesis under extreme climatic conditions. We attribute the superior capability of SIF in monitoring ecosystem productivity compared to NDVI to its stronger sensitivity to environmental factors. Future research should reconsider the limitations of GPP estimation based solely on VIs.
Furthermore, downscaled SIF with finer spatial resolution than GOME-2 SIF can reveal detailed variations in photosynthesis. The low resolutions of GOME-2 SIF limit the accuracy of estimating vegetation productivity under drought conditions. In contrast, downscaled SIF products have a better spatial resolution (0.05°), allowing for better differentiation between grassland and other land use types. Downscaled SIF also has a shorter temporal resolution (8 days), capturing the changes in vegetation due to drought better than other SIF data [32]. Our study area is mainly grassland in the Xilingol League, which is relatively homogeneous and meets the research requirements. Exciting, FLEX (300 m) SIF will play an even more important role in monitoring vegetation photosynthesis under the backdrop of climate change.

4.4. Uncertainties of SIF and GPP Relationship under Stressful Conditions

The relationship between SIF and photosynthesis is complex, especially when vegetation is under stress, making it challenging to estimate GPP using SIF. Therefore, a better understanding of the relationships between vegetation photosynthesis, fluorescence, and non-photochemical quenching (NPQ) under stress conditions is necessary for a more accurate estimation of GPP using SIF. In this study, using the 2009 drought event in the Xilingol grasslands as an example, the ability of SIF to monitor GPP changes caused by drought was investigated.
According to the light use efficiency (LUE) model, GPP can be expressed as follows:
GPP = fPAR × PAR× LUEp = APAR× LUEp,
where LUEp is photosynthetic light use efficiency.
Similarly, SIF can be expressed as follows:
SIF = fPAR × PAR × LUEf × fesc = APAR × LUEf × fesc,
where LUEf denotes the light use efficiency of SIF, and fesc is the fraction of SIF photons escaping the canopy.
Using Equations (3) and (4), the SIF and GPP relationship can be shown as follows:
GPP = LUEp/(LUEf × fesc) × SIF,
The relationship between SIF and GPP depends on factors such as the LUEf (light use efficiency of SIF), LUEp (the efficiency of light utilization for photosynthesis), and the fraction of SIF photons escaping the canopy. Major factors influencing LUE and fluorescence quantum yield include canopy structure, leaf morphology, photosynthetic pathway (C3 or C4), and environmental conditions, while the escape coefficient is sensitive to changes in canopy structure and Leaf Area Index (LAI) [51]. These factors collectively influence the SIF and GPP relationship. However, relationships observed at the leaf, canopy, and short-time scales may not necessarily apply at larger scales or over longer time scales. Interactions among these factors during the upscaling process introduce uncertainties in the impact of these factors on the SIF and GPP relationship.
Considerable research has been conducted on the ability of SIF to estimate GPP under different stress conditions. Results indicate that under non-stress conditions, SIF and GPP exhibit a strong linear correlation, while under stress conditions (drought, heat, herbicide application, etc.) [62,63,64], the ability of SIF to track GPP changes varies. Our results show a significant linear correlation between SIF and GPP under non-drought stress conditions (R2 = 0.95), with a slight decrease in correlation under drought conditions (R2 = 0.90). In summary, both under non-drought and drought conditions, a strong correlation exists between SIF and GPP, consistent with many large-scale studies. However, our study differs from some experimental sites. For instance, the relationship between SIF and GPP at different stages after herbicide treatment differs. In the early stages following herbicide treatment, SIF is negatively correlated with GPP, while with time, a significant positive correlation between SIF and GPP emerges. Under drought conditions, the correlation between SIF and GPP significantly decreases. Under heat stress, the linear relationship between SIF and GPP breaks down, exhibiting a non-linear relationship. This is because drought, heat, or herbicide stress can slowly impact vegetation photosynthesis by inducing stomatal closure and reducing carbon assimilation rates. Therefore, drought, heat, or herbicide stress does not necessarily cause a significant or abrupt decrease in SIF. However, drought, heat, or herbicide stress often leads to a reduction in vegetation photosynthesis, resulting in an increase in NPQ [65]. This suggests that when environmental factors have different impacts on vegetation SIF and photosynthesis, the magnitudes of the decrease in SIF and GPP may differ, and SIF may not effectively capture the influence of environmental factors on GPP.
In conclusion, the response of SIF to different stress factors is not uniform, and the mechanisms are complex due to the coexistence of photochemical quenching (PQ) and NPQ. Therefore, the relationship between SIF and photosynthesis under different stress conditions is varied. Hence, when studying the relationship between SIF and photosynthesis, it is essential to consider whether vegetation is under stress and the type of stress. Generally, at smaller spatial (leaf or canopy) and shorter-time (instantaneous) scales, the decoupling phenomenon between SIF and vegetation photosynthesis is more apparent. As spatial and temporal scales increase, the different responses of SIF and photosynthesis to environmental factors may be masked or weakened. Therefore, in stress conditions, careful consideration is necessary when using SIF to estimate GPP at different spatial and temporal scales and for different plant types.

4.5. Limitations of This Study

Most downscaled SIF products rely on various explanatory variables from high spatial resolution remote sensing, such as meteorological information. Because these explanatory variables cannot reflect changes in vegetation, downscaled SIF inevitably loses the physiological information contained in the original SIF data. Therefore, what is provided is an estimation of SIF rather than observed SIF values. There are several uncertainties in downscaled SIF. One significant factor is the uncertainty introduced by meteorological reanalysis data (i.e., PAR, temperature, VPD (vapor pressure deficit)). Another influencing factor is that modeling methods may not be entirely suitable (i.e., data-driven or machine learning approaches). While downscaled SIF may lose some information present in real SIF data, it extends the application of SIF in monitoring GPP. Furthermore, the GOME-2 sensor has experienced noticeable degradation during its operational lifespan, which could lead to potential errors. In this study, spatially downscaled SIF products have been calibrated with parameter adjustments to preserve the original information of the SIF signal as much as possible. Therefore, before using downscaled SIF products for long-term trend analysis, it is essential to consider the impact of instrument degradation on the original SIF values.
Although SIF has significant advantages over traditional VIs in areas such as drought monitoring and productivity assessment, existing SIF products generally suffer from coarse spatiotemporal resolution issues. Despite the higher spatial resolution of downscaled SIF data, it remains coarse for regions with different vegetation types. Therefore, there is an urgent need for SIF data with higher spatial resolution for scientific research. In recent years, satellites such as OCO-2, OCO-3, and TanSat have provided finer spatial resolution for SIF, but their application is limited due to poor spatiotemporal continuity. Fortunately, new satellites including the Sentinel series, FLEX, and GeoCARB have been launched or planned for launch in the coming years. It is believed that in the near future, we will obtain SIF data with high spatiotemporal resolution. This will play a significant role in early drought detection, accurate monitoring of vegetation productivity, and global carbon cycle monitoring.
Another limitation of our research results is the lack of differentiation between different vegetation types and different climatic environments. However, drought stress can have different effects on various ecosystem communities and plants in different climatic environments. Therefore, the SIF of vegetation in different ecosystem communities may respond differently to drought. Additionally, although SIF can track changes in GPP under drought conditions, how to use SIF to accurately estimate GPP remains unclear. This often requires the establishment of empirical models relating SIF to flux station GPP. However, the empirical models for SIF and GPP lack universality under different environmental conditions and vegetation types. Our study only used simple correlation analysis to study the relationship between SIF and GPP. To more accurately estimate GPP at different spatial and temporal scales, in different environmental conditions and vegetation types, a comprehensive understanding of the mechanisms of SIF estimating GPP is needed, along with the development of mechanistic models for estimating GPP based on SIF.

5. Conclusions

This study took the 2009 drought event in the Xilingol grassland as an example and utilized downscaled GOME-2 SIF satellite products to analyze the potential of SIF in assessing the changes in grassland GPP caused by drought. Negative anomalies of SPEI, SM, and PPT indicated severe drought occurrence in the Xilingol grassland in 2009, and SIF was responsive to the spatiotemporal variations of drought indicators. These results demonstrated that downscaled SIF has the capability to track the temporal dynamics of drought, depict its spatial distribution, and monitor its occurrence. There was a significant correlation between SIF and GPP, with an R2 of 0.95, while the correlation between NDVI and GPP was significantly lower, with an R2 of 0.78, confirming that SIF can serve as an effective indicator of plant photosynthesis and accurately track the spatiotemporal changes in GPP. Under drought conditions, the relationship between SIF and GPP (R2 = 0.90) was significantly higher than NDVI and GPP (R2 = 0.62), demonstrating the superior ability of SIF to track and monitor GPP changes under drought conditions compared to NDVI. Drought reduces the ability of NDVI to monitor GPP but does not affect that of SIF to monitor GPP.
This study highlights the strong capability of downscaled satellite SIF products in estimating grassland GPP changes caused by drought, providing a theoretical basis for quantifying GPP losses in grasslands due to drought in the future.

Author Contributions

Conceptualization, W.Z.; methodology, W.Z.; software, W.Z.; validation, W.Z. and Y.Z. (Yangzhen Zhou); formal analysis, W.Z.; investigation, W.Z., Y.Z. (Yanrong Zhang) and S.L.; resources, L.L.; data curation, W.Z.; writing—original draft preparation, W.Z.; writing—review and editing, W.Z.; visualization, W.Z.; supervision, Y.R. and L.L.; project administration, L.L.; and funding acquisition, L.L. All authors have read and agreed to the published version of the manuscript.

Funding

This work was supported by the National Natural Science Foundation of China (Grant No. 42101081) and the National Key R&D Program of China (Grant No. 2021YFD1300503).

Data Availability Statement

The data presented in this study are available on request from the corresponding author.

Conflicts of Interest

The authors declare no conflicts of interest.

References

  1. Guanter, L.; Zhang, Y.; Jung, M.; Joiner, J.; Voigt, M.; Berry, J.A.; Frankenberg, C.; Huete, A.R.; Zarco-Tejada, P.; Lee, J.E.; et al. Global and time-resolved monitoring of crop photosynthesis with chlorophyll fluorescence. Proc. Natl. Acad. Sci. USA 2014, 111, E1327–E1333. [Google Scholar] [CrossRef] [PubMed]
  2. Wilcox, K.R.; Shi, Z.; Gherardi, L.A.; Lemoine, N.P.; Koerner, S.E.; Hoover, D.L.; Bork, E.; Byrne, K.M.; Cahill, J., Jr.; Collins, S.L.; et al. Asymmetric responses of primary productivity to precipitation extremes: A synthesis of grassland precipitation manipulation experiments. Glob. Chang. Biol. 2017, 23, 4376–4385. [Google Scholar] [CrossRef] [PubMed]
  3. Sun, Y.; Feng, Y.; Wang, Y.; Zhao, X.; Yang, Y.; Tang, Z.; Wang, S.; Su, H.; Zhu, J.; Chang, J.; et al. Field-Based Estimation of Net Primary Productivity and Its Above-and Belowground Partitioning in Global Grasslands. J. Geophys. Res. Biogeosci. 2021, 126, e2021JG006472. [Google Scholar] [CrossRef]
  4. Hoover, D.L.; Hajek, O.L.; Smith, M.D.; Wilkins, K.; Slette, I.J.; Knapp, A.K. Compound hydroclimatic extremes in a semi-arid grassland: Drought, deluge, and the carbon cycle. Glob. Chang. Biol. 2022, 28, 2611–2621. [Google Scholar] [CrossRef]
  5. Mu, S.; Zhou, S.; Chen, Y.; Li, J.; Ju, W.; Odeh, I.O.A. Assessing the impact of restoration-induced land conversion and management alternatives on net primary productivity in Inner Mongolian grassland, China. Glob. Planet Chang. 2013, 108, 29–41. [Google Scholar] [CrossRef]
  6. Liu, Y.; You, C.; Zhang, Y.; Chen, S.; Zhang, Z.; Li, J.; Wu, Y. Resistance and resilience of grasslands to drought detected by SIF in inner Mongolia, China. Agric. For. Meteorol. 2021, 308, 108567. [Google Scholar] [CrossRef]
  7. Wang, X.; Pan, S.; Pan, N.; Pan, P. Grassland productivity response to droughts in northern China monitored by satellite-based solar-induced chlorophyll fluorescence. Sci. Total Environ. 2022, 830, 154550. [Google Scholar] [CrossRef]
  8. Wang, Y.; Yue, H.; Peng, Q.; He, C.; Hong, S.; Bryan, B.A. Recent responses of grassland net primary productivity to climatic and anthropogenic factors in Kyrgyzstan. Land. Degrad. Dev. 2020, 31, 2490–2506. [Google Scholar] [CrossRef]
  9. Chen, N.; Zhang, Y.; Zu, J.; Zhu, J.; Zhang, T.; Huang, K.; Cong, N.; Wang, Z.; Li, J.; Zheng, Z.; et al. The compensation effects of post-drought regrowth on earlier drought loss across the tibetan plateau grasslands. Agric. For. Meteorol. 2020, 281, 107822. [Google Scholar] [CrossRef]
  10. Guo, D.; Song, X.; Hu, R.; Cai, S.; Zhu, X.; Hao, Y. Grassland type-dependent spatiotemporal characteristics of productivity in Inner Mongolia and its response to climate factors. Sci. Total Environ. 2021, 775, 145644. [Google Scholar] [CrossRef]
  11. Zhao, W.; Liu, L.; Shen, Q.; Yang, J.; Han, X.; Tian, F.; Wu, J. Effects of Water Stress on Photosynthesis, Yield, and Water Use Efficiency in Winter Wheat. Water 2020, 12, 2127. [Google Scholar] [CrossRef]
  12. Robertson, T.R.; Bell, C.W.; Zak, J.C.; Tissue, D.T. Precipitation timing and magnitude differentially affect aboveground annual net primary productivity in three perennial species in a Chihuahuan Desert grassland. New Phytol. 2009, 181, 230–242. [Google Scholar] [CrossRef] [PubMed]
  13. Zhang, M.; Lal, R.; Zhao, Y.; Jiang, W.; Chen, Q. Spatial and temporal variability in the net primary production of grassland in China and its relation to climate factors. Plant Ecol. 2017, 218, 1117–1133. [Google Scholar] [CrossRef]
  14. Damm, A.; Elbers, J.A.N.; Erler, A.; Gioli, B.; Hamdi, K.; Hutjes, R.; Kosvancova, M.; Meroni, M.; Miglietta, F.; Moersch, A.; et al. Remote sensing of sun-induced fluorescence to improve modeling of diurnal courses of gross primary production (GPP). Glob. Chang. Biol. 2010, 16, 171–186. [Google Scholar] [CrossRef]
  15. Duveiller, G.; Cescatti, A. Spatially downscaling sun-induced chlorophyll fluorescence leads to an improved temporal correlation with gross primary productivity. Remote Sens. Environ. 2016, 182, 72–89. [Google Scholar] [CrossRef]
  16. Frankenberg, C.; O’Dell, C.; Berry, J.; Guanter, L.; Joiner, J.; Köhler, P.; Taylor, T.E. Prospects for chlorophyll fluorescence remote sensing from the Orbiting Carbon Observatory-2. Remote Sens. Environ. 2014, 147, 1–12. [Google Scholar] [CrossRef]
  17. Damm, A.; Guanter, L.; Paul-Limoges, E.; van der Tol, C.; Hueni, A.; Buchmann, N.; Eugster, W.; Ammann, C.; Schaepman, M.E. Far-red sun-induced chlorophyll fluorescence shows ecosystem-specific relationships to gross primary production: An assessment based on observational and modeling approaches. Remote Sens. Environ. 2015, 166, 91–105. [Google Scholar] [CrossRef]
  18. Chen, T.; de Jeu, R.A.M.; Liu, Y.Y.; van der Werf, G.R.; Dolman, A.J. Using satellite based soil moisture to quantify the water driven variability in NDVI: A case study over mainland Australia. Remote Sens. Environ. 2014, 140, 330–338. [Google Scholar] [CrossRef]
  19. Gu, Y.; Hunt, E.; Wardlow, B.; Basara, J.B.; Brown, J.F.; Verdin, J.P. Evaluation of MODIS NDVI and NDWI for vegetation drought monitoring using Oklahoma Mesonet soil moisture data. Geophys. Res. Lett. 2008, 35, 22401. [Google Scholar] [CrossRef]
  20. Sjöström, M.; Ardö, J.; Arneth, A.; Boulain, N.; Cappelaere, B.; Eklundh, L.; de Grandcourt, A.; Kutsch, W.L.; Merbold, L.; Nouvellon, Y. Exploring the potential of MODIS EVI for modeling gross primary production across African ecosystems. Remote Sens. Environ. 2011, 115, 1081–1089. [Google Scholar] [CrossRef]
  21. Poulter, B.; Heyder, U.; Cramer, W. Modeling the Sensitivity of the Seasonal Cycle of GPP to Dynamic LAI and Soil Depths in Tropical Rainforests. Ecosystems 2009, 12, 517–533. [Google Scholar] [CrossRef]
  22. Qiu, R.; Li, X.; Han, G.; Xiao, J.; Ma, X.; Gong, W. Monitoring drought impacts on crop productivity of the U.S. Midwest with solar-induced fluorescence: GOSIF outperforms GOME-2 SIF and MODIS NDVI, EVI, and NIRv. Agric. For. Meteorol. 2022, 323, 109038. [Google Scholar] [CrossRef]
  23. Grossmann, K.; Frankenberg, C.; Magney, T.S.; Hurlock, S.C.; Seibt, U.; Stutz, J. PhotoSpec: A new instrument to measure spatially distributed red and far-red Solar-Induced Chlorophyll Fluorescence. Remote Sens. Environ. 2018, 216, 311–327. [Google Scholar] [CrossRef]
  24. Guanter, L.; Rossini, M.; Colombo, R.; Meroni, M.; Frankenberg, C.; Lee, J.-E.; Joiner, J. Using field spectroscopy to assess the potential of statistical approaches for the retrieval of sun-induced chlorophyll fluorescence from ground and space. Remote Sens. Environ. 2013, 133, 52–61. [Google Scholar] [CrossRef]
  25. Lee, J.E.; Berry, J.A.; van der Tol, C.; Yang, X.; Guanter, L.; Damm, A.; Baker, I.; Frankenberg, C. Simulations of chlorophyll fluorescence incorporated into the Community Land Model version 4. Glob. Chang. Biol. 2015, 21, 3469–3477. [Google Scholar] [CrossRef] [PubMed]
  26. Frankenberg, C.; Fisher, J.B.; Worden, J.; Badgley, G.; Saatchi, S.S.; Lee, J.E.; Toon, G.C.; Butz, A.; Jung, M.; Kuze, A.J.G.R.L. New global observations of the terrestrial carbon cycle from GOSAT: Patterns of plant fluorescence with gross primary productivity. Geophys. Res. Lett. 2011, 38, 17706. [Google Scholar] [CrossRef]
  27. Li, X.; Xiao, J.; Kimball, J.S.; Reichle, R.H.; Scott, R.L.; Litvak, M.E.; Bohrer, G.; Frankenberg, C. Synergistic use of SMAP and OCO-2 data in assessing the responses of ecosystem productivity to the 2018 U.S. drought. Remote Sens. Environ. 2020, 251, 112062. [Google Scholar] [CrossRef]
  28. Lee, J.E.; Frankenberg, C.; van der Tol, C.; Berry, J.A.; Guanter, L.; Boyce, C.K.; Fisher, J.B.; Morrow, E.; Worden, J.R.; Asefi, S.; et al. Forest productivity and water stress in Amazonia: Observations from GOSAT chlorophyll fluorescence. Proc. Biol. Sci. 2013, 280, 20130171. [Google Scholar] [CrossRef] [PubMed]
  29. Li, X.; Xiao, J.; He, B.; Altaf Arain, M.; Beringer, J.; Desai, A.R.; Emmel, C.; Hollinger, D.Y.; Krasnova, A.; Mammarella, I.; et al. Solar-induced chlorophyll fluorescence is strongly correlated with terrestrial photosynthesis for a wide variety of biomes: First global analysis based on OCO-2 and flux tower observations. Glob. Chang. Biol. 2018, 24, 3990–4008. [Google Scholar] [CrossRef]
  30. Wang, H.; Xiao, J. Improving the Capability of the SCOPE Model for Simulating Solar-Induced Fluorescence and Gross Primary Production Using Data from OCO-2 and Flux Towers. Remote Sens. 2021, 13, 794. [Google Scholar] [CrossRef]
  31. Chen, X.; Mo, X.; Zhang, Y.; Sun, Z.; Liu, Y.; Hu, S.; Liu, S. Drought detection and assessment with solar-induced chlorophyll fluorescence in summer maize growth period over North China Plain. Ecol. Indic. 2019, 104, 347–356. [Google Scholar] [CrossRef]
  32. Shen, Q.; Lin, J.; Yang, J.; Zhao, W.; Wu, J. Exploring the Potential of Spatially Downscaled Solar-Induced Chlorophyll Fluorescence to Monitor Drought Effects on Gross Primary Production in Winter Wheat. IEEE J. Sel. Top. Appl. Earth Obs. Remote Sens. 2022, 15, 2012–2022. [Google Scholar] [CrossRef]
  33. Guan, K.; Berry, J.A.; Zhang, Y.; Joiner, J.; Guanter, L.; Badgley, G.; Lobell, D.B. Improving the monitoring of crop productivity using spaceborne solar-induced fluorescence. Glob. Chang. Biol. 2016, 22, 716–726. [Google Scholar] [CrossRef]
  34. Houborg, R.; Cescatti, A.; Migliavacca, M.; Kustas, W.P. Satellite retrievals of leaf chlorophyll and photosynthetic capacity for improved modeling of GPP. Agric. For. Meteorol. 2013, 177, 10–23. [Google Scholar] [CrossRef]
  35. Sun, Y.; Frankenberg, C.; Jung, M.; Joiner, J.; Guanter, L.; Köhler, P.; Magney, T. Overview of Solar-Induced chlorophyll Fluorescence (SIF) from the Orbiting Carbon Observatory-2: Retrieval, cross-mission comparison, and global monitoring for GPP. Remote Sens. Environ. 2018, 209, 808–823. [Google Scholar] [CrossRef]
  36. Zhang, Z.; Zhang, Y.; Porcar-Castell, A.; Joiner, J.; Guanter, L.; Yang, X.; Migliavacca, M.; Ju, W.; Sun, Z.; Chen, S.; et al. Reduction of structural impacts and distinction of photosynthetic pathways in a global estimation of GPP from space-borne solar-induced chlorophyll fluorescence. Remote Sens. Environ. 2020, 240, 111722. [Google Scholar] [CrossRef]
  37. Sun, Y.; Fu, R.; Dickinson, R.; Joiner, J.; Frankenberg, C.; Gu, L.; Xia, Y.; Fernando, N. Drought onset mechanisms revealed by satellite solar-induced chlorophyll fluorescence: Insights from two contrasting extreme events. J. Geophys. Res. Biogeosci. 2015, 120, 2427–2440. [Google Scholar] [CrossRef]
  38. Liu, X.; Liu, L.; Bacour, C.; Guanter, L.; Chen, J.; Ma, Y.; Chen, R.; Du, S. A simple approach to enhance the TROPOMI solar-induced chlorophyll fluorescence product by combining with canopy reflected radiation at near-infrared band. Remote Sens. Environ. 2023, 284, 113341. [Google Scholar] [CrossRef]
  39. Dong, Z.; Zhang, J.; Tong, Z.; Han, A.; Zhi, F. Ecological security assessment of Xilingol grassland in China using DPSIRM model. Ecol. Indic. 2022, 143, 109336. [Google Scholar] [CrossRef]
  40. Zhao, F.; Xu, B.; Yang, X.; Jin, Y.; Li, J.; Xia, L.; Chen, S.; Ma, H. Remote Sensing Estimates of Grassland Aboveground Biomass Based on MODIS Net Primary Productivity (NPP): A Case Study in the Xilingol Grassland of Northern China. Remote Sens. 2014, 6, 5368–5386. [Google Scholar] [CrossRef]
  41. Duveiller, G.; Filipponi, F.; Walther, S.; Köhler, P.; Frankenberg, C.; Guanter, L.; Cescatti, A.J.E.S.S.D. A spatially downscaled sun-induced fluorescence global product for enhanced monitoring of vegetation productivity. Earth Syst. Sci. Data 2020, 12, 1101–1116. [Google Scholar] [CrossRef]
  42. Joiner, J.; Guanter, L.; Lindstrot, R.; Voigt, M.; Vasilkov, A.P.; Middleton, E.M.; Huemmrich, K.F.; Yoshida, Y.; Frankenberg, C. Global monitoring of terrestrial chlorophyll fluorescence from moderate-spectral-resolution near-infrared satellite measurements: Methodology, simulations, and application to GOME-2. Atmos. Meas. Tech. 2013, 6, 2803–2823. [Google Scholar] [CrossRef]
  43. Köhler, P.; Guanter, L.; Joiner, J. A linear method for the retrieval of sun-induced chlorophyll fluorescence from GOME-2 and SCIAMACHY data. Atmos. Meas. Tech. 2015, 8, 2589–2608. [Google Scholar] [CrossRef]
  44. Wang, C.; Guan, K.; Peng, B.; Chen, M.; Jiang, C.; Zeng, Y.; Wu, G.; Wang, S.; Wu, J.; Yang, X.J.R.S.o.E. Satellite footprint data from OCO-2 and TROPOMI reveal significant spatio-temporal and inter-vegetation type variabilities of solar-induced fluorescence yield in the US Midwest. Remote Sens. Environ. 2020, 241, 111728. [Google Scholar] [CrossRef]
  45. Chen, A.; Mao, J.; Ricciuto, D.; Lu, D.; Xiao, J.; Li, X.; Thornton, P.E.; Knapp, A.K.J.G.C.B. Seasonal changes in GPP/SIF ratios and their climatic determinants across the Northern Hemisphere. Glob. Chang. Biol. 2021, 27, 5186–5197. [Google Scholar] [CrossRef] [PubMed]
  46. Chen, S.; Huang, Y.; Wang, G. Detecting drought-induced GPP spatiotemporal variabilities with sun-induced chlorophyll fluorescence during the 2009/2010 droughts in China. Ecol. Indic. 2021, 121, 107092. [Google Scholar] [CrossRef]
  47. Tramontana, G.; Jung, M.; Schwalm, C.R.; Ichii, K.; Camps-Valls, G.; Ráduly, B.; Reichstein, M.; Arain, M.A.; Cescatti, A.; Kiely, G.; et al. Predicting carbon dioxide and energy fluxes across global FLUXNET sites with regression algorithms. Biogeosciences 2016, 13, 4291–4313. [Google Scholar] [CrossRef]
  48. Tong, S.; Lai, Q.; Zhang, J.; Bao, Y.; Lusi, A.; Ma, Q.; Li, X.; Zhang, F. Spatiotemporal drought variability on the Mongolian Plateau from 1980-2014 based on the SPEI-PM, intensity analysis and Hurst exponent. Sci. Total Environ. 2018, 615, 1557–1565. [Google Scholar] [CrossRef] [PubMed]
  49. Wang, W.; Zhu, Y.; Xu, R.; Liu, J.J.N.H. Drought severity change in China during 1961–2012 indicated by SPI and SPEI. Nat. Hazards. 2015, 75, 2437–2451. [Google Scholar] [CrossRef]
  50. Li, X.; He, B.; Quan, X.; Liao, Z.; Bai, X.J.R.S. Use of the standardized precipitation evapotranspiration index (SPEI) to characterize the drying trend in southwest China from 1982–2012. Remote Sens. 2015, 7, 10917–10937. [Google Scholar] [CrossRef]
  51. Köhler, P.; Guanter, L.; Kobayashi, H.; Walther, S.; Yang, W. Assessing the potential of sun-induced fluorescence and the canopy scattering coefficient to track large-scale vegetation dynamics in Amazon forests. Remote Sens. Environ. 2018, 204, 769–785. [Google Scholar] [CrossRef]
  52. Wieneke, S.; Ahrends, H.; Damm, A.; Pinto, F.; Stadler, A.; Rossini, M.; Rascher, U. Airborne based spectroscopy of red and far-red sun-induced chlorophyll fluorescence: Implications for improved estimates of gross primary productivity. Remote Sens. Environ. 2016, 184, 654–667. [Google Scholar] [CrossRef]
  53. Zeng, Y.; Badgley, G.; Dechant, B.; Ryu, Y.; Chen, M.; Berry, J.A. A practical approach for estimating the escape ratio of near-infrared solar-induced chlorophyll fluorescence. Remote Sens. Environ. 2019, 232, 111209. [Google Scholar] [CrossRef]
  54. Xu, S.; Atherton, J.; Riikonen, A.; Zhang, C.; Oivukkamäki, J.; MacArthur, A.; Honkavaara, E.; Hakala, T.; Koivumäki, N.; Liu, Z.; et al. Structural and photosynthetic dynamics mediate the response of SIF to water stress in a potato crop. Remote Sens. Environ. 2021, 263, 112555. [Google Scholar] [CrossRef]
  55. Zeng, Y.; Chen, M.; Hao, D.; Damm, A.; Badgley, G.; Rascher, U.; Johnson, J.E.; Dechant, B.; Siegmann, B.; Ryu, Y.; et al. Combining near-infrared radiance of vegetation and fluorescence spectroscopy to detect effects of abiotic changes and stresses. Remote Sens. Environ. 2022, 270, 112856. [Google Scholar] [CrossRef]
  56. Liu, L.; Yang, X.; Zhou, H.; Liu, S.; Zhou, L.; Li, X.; Yang, J.; Han, X.; Wu, J. Evaluating the utility of solar-induced chlorophyll fluorescence for drought monitoring by comparison with NDVI derived from wheat canopy. Sci. Total Environ. 2018, 625, 1208–1217. [Google Scholar] [CrossRef]
  57. Pickering, M.; Cescatti, A.; Duveiller, G.J.B. Sun-induced fluorescence as a proxy for primary productivity across vegetation types and climates. Biogeosciences 2022, 19, 4833–4864. [Google Scholar] [CrossRef]
  58. Li, X.; Xiao, J. Global climatic controls on interannual variability of ecosystem productivity: Similarities and differences inferred from solar-induced chlorophyll fluorescence and enhanced vegetation index. Agric. For. Meteorol. 2020, 288, 108018. [Google Scholar] [CrossRef]
  59. Yoshida, Y.; Joiner, J.; Tucker, C.; Berry, J.; Lee, J.-E.; Walker, G.; Reichle, R.; Koster, R.; Lyapustin, A.; Wang, Y.J.R.S.o.E. The 2010 Russian drought impact on satellite measurements of solar-induced chlorophyll fluorescence: Insights from modeling and comparisons with parameters derived from satellite reflectances. Remote Sens. Environ. 2015, 166, 163–177. [Google Scholar] [CrossRef]
  60. Wang, R.; Gamon, J.A.; Emmerton, C.A.; Springer, K.R.; Yu, R.; Hmimina, G. Detecting intra- and inter-annual variability in gross primary productivity of a North American grassland using MODIS MAIAC data. Agric. For. Meteorol. 2020, 281, 107859. [Google Scholar] [CrossRef]
  61. Smith, W.K.; Biederman, J.A.; Scott, R.L.; Moore, D.J.P.; He, M.; Kimball, J.S.; Yan, D.; Hudson, A.; Barnes, M.L.; MacBean, N.; et al. Chlorophyll Fluorescence Better Captures Seasonal and Interannual Gross Primary Productivity Dynamics Across Dryland Ecosystems of Southwestern North America. Geophys. Res. Lett. 2018, 45, 748–757. [Google Scholar] [CrossRef]
  62. Wu, L.; Zhang, X.; Rossini, M.; Wu, Y.; Zhang, Z.; Zhang, Y. Physiological dynamics dominate the response of canopy far-red solar-induced fluorescence to herbicide treatment. Agric. For. Meteorol. 2022, 323, 109063. [Google Scholar] [CrossRef]
  63. Martini, D.; Sakowska, K.; Wohlfahrt, G.; Pacheco-Labrador, J.; van der Tol, C.; Porcar-Castell, A.; Magney, T.S.; Carrara, A.; Colombo, R.; El-Madany, T.S.; et al. Heatwave breaks down the linearity between sun-induced fluorescence and gross primary production. New Phytol. 2022, 233, 2415–2428. [Google Scholar] [CrossRef] [PubMed]
  64. Zhao, W.; Wu, J.; Shen, Q.; Yang, J.; Han, X. Exploring the Ability of Solar-Induced Chlorophyll Fluorescence for Drought Monitoring Based on an Intelligent Irrigation Control System. Remote Sens. 2022, 14, 6157. [Google Scholar] [CrossRef]
  65. Schickling, A.; Matveeva, M.; Damm, A.; Schween, J.; Wahner, A.; Graf, A.; Crewell, S.; Rascher, U. Combining Sun-Induced Chlorophyll Fluorescence and Photochemical Reflectance Index Improves Diurnal Modeling of Gross Primary Productivity. Remote Sens. 2016, 8, 574. [Google Scholar] [CrossRef]
Figure 1. Overview of the study area: (a) location and vegetation cover levels of the Xilingol grassland; (b) land-use types in Inner Mongolia at a 1 km resolution in 2020; (c) 10 m resolution digital elevation model (DEM) of the Xilingol grassland in 2020.
Remotesensing 16 00555 g001
Figure 2. Annual anomalies of drought indicators: (a) SPEI, (b) SM, (c) PPT, and (d) LST in the Xilingol grassland from 2007 to 2015.
Remotesensing 16 00555 g002
Figure 3. Monthly anomalies of (a) SPEI, (b) SM, (c) PPT, and (d) LST in the Xilingol grassland for January to December in 2009.
Remotesensing 16 00555 g003
Figure 4. Spatial distribution characteristics of anomalies of SPEI, SM, PPT, and LST in the Xilingol grassland from April to October 2009. The anomalies SPEI, SM, PPT, and LST were calculated by subtracting the pixel’s monthly value from the pixel’s average monthly value for 2007–2015.
Remotesensing 16 00555 g004
Figure 5. Spatial distribution characteristics of anomalies of GPP, SIF, SIF yield, and NDVI in the Xilingol grassland from April to October 2009. The monthly anomalies were calculated by subtracting the monthly value of indicators from the average of each particular month through the 2007–2015 period.
Remotesensing 16 00555 g005
Figure 6. Monthly anomalies of SIF, SIFyield, fPAR, PAR, and APAR in the Xilingol grassland for April to October 2009.
Remotesensing 16 00555 g006
Figure 7. (ac) The relationships between the measured values of monthly solar-induced fluorescence (SIF), SIFyield, NDVI, and the measured values of gross primary productivity (GPP) in the Xilingol grassland. (df) The relationships between the monthly anomalies of SIF, SIFyield, and NDVI and the monthly anomalies of GPP. Each point represents a monthly average value for the entire study area. There are 12 (months/year) ×9 (years) = 108 points from 2007 to 2015.
Remotesensing 16 00555 g007
Figure 8. Seasonal variations of (a) GPP, (b) SIF, (c) SIF yield, and (d) NDVI in the Xilingol grassland from April to October. The red point represents the average monthly values for all pixels of the study area in 2009, while the black point indicates the monthly average for all pixels of the study area from 2007 to 2015. The red curve represents the variations in each parameter from April to October 2009, while the black curve indicates the monthly average from 2007 to 2015. The gray shading represents the standard deviation of the monthly average values from 2007 to 2015.
Remotesensing 16 00555 g008
Figure 9. Relationships of (a) SIF, (b) SIF yield, and (c) NDVI with GPP under drought and no-drought scenarios in the Xilingol grassland. Each point represents a monthly average value for the entire study area. There are 12 (months/year) × 9 (years) = 108 points from 2007 to 2015. The red dots represent the monthly values under drought conditions, while the green dots represent the monthly values under non-drought conditions.
Remotesensing 16 00555 g009
Table 1. Classification of SPEI.
ValueSPEI ≤ −0.5SPEI > −0.5
ClassificationDroughtNo_drought
Table 2. Data source.
TypeData NameSpatial ResolutionTemporal ResolutionTime AcquiredSource
Downscaled SIFGOME-20.05°8 Days2007–2015https://doi.org/10.2905/21935FFC-B797-4BEE-94DA-8FEC85B3F9E1 (accessed on 7 April 2021)
GPPFluxcom0.05°Monthly2007–2015http://fluxcom.org/EF-Download/ (accessed on 7 April 2021)
LSTMOD11C30.05°Monthly2007–2015http://ladsweb.nascom.nasa.gov/ (accessed on 7 April 2021)
PPTCHIRPS0.05°Monthly2007–2015https://data.chc.ucsb.edu/products/CHIRPS-2.0/ (accessed on 7 April 2021)
SPEISPEI-30.05°Monthly2007–2015http://spei.csic.es/ (accessed on 7 April 2021)
SMGLDAS0.25°Daily2007–2015https://disc.sci.gsfc.nasa.gov (accessed on 7 April 2021)
NDVIMOD13C20.05°16 Days2007–2015https://lpdaac.usgs.gov/products/mod13c2v006 (accessed on 7 April 2021)
PARCERES10 kmDaily2007–2015https://data.tpdc.ac.cn/ (accessed on 7 April 2021)
fPARMOD15A2H500 m8 Days2007–2015https://ladsweb.modaps.eosdis.nasa.gov/missions-and-measurements/products/MOD15A2H (accessed on 7 April 2021)
Table 3. Correlation coefficients (r) between drought indices (SPEI, SM, PPT, and LST) and vegetation indices (GPP, SIF, SIFyield, and NDVI).
Drought IndicatorsSPEISMPPTLST
Vegetation Indicators
GPP0.42 **0.46 **0.91 ***0.73 ***
SIF0.360.41 **0.91 ***0.71 ***
SIFyield0.360.280.82 ***0.66 ***
NDVI0.320.53 **0.85 ***0.64 ***
*** Significance at the 0.001; ** Significance at the 0.01. Linear relationships between drought indices (SPEI, SM, PPT, and LST) and vegetation indices (GPP, SIF, SIFyield, and NDVI) with the monthly average value for the entire study area. Each point represents a monthly average value for the entire study area. There are 12 (months/year) ×9 (years) = 108 points from 2007 to 2015.
Disclaimer/Publisher’s Note: The statements, opinions and data contained in all publications are solely those of the individual author(s) and contributor(s) and not of MDPI and/or the editor(s). MDPI and/or the editor(s) disclaim responsibility for any injury to people or property resulting from any ideas, methods, instructions or products referred to in the content.

