Article

Evaluating Ecosystem Service Value Changes in Mangrove Forests in Guangxi, China, from 2016 to 2020

1
School of Geomatics and Prospecting Engineering, Jilin Jianzhu University, Changchun 130118, China
2
Key Laboratory of Wetland Ecology and Environment, Northeast Institute of Geography and Agroecology, Chinese Academy of Sciences, Changchun 130102, China
3
Haikou Marine Geological Survey Center, China Geological Survey, Haikou 571127, China
*
Author to whom correspondence should be addressed.
Remote Sens. 2024, 16(3), 494; https://doi.org/10.3390/rs16030494
Submission received: 18 October 2023 / Revised: 8 January 2024 / Accepted: 25 January 2024 / Published: 27 January 2024
(This article belongs to the Special Issue Artificial Intelligence for Ocean Remote Sensing)

Abstract

:
Mangrove forests play a vital role in maintaining ecological balance in coastal regions. Accurately assessing changes in the ecosystem service value (ESV) of these mangrove forests requires more precise distribution data and an appropriate set of evaluation methods. In this study, we accurately mapped the spatial distribution data and patterns of mangrove forests in Guangxi province in 2016 and 2020, using 10 m spatial resolution Sentinel-2 imagery, and conducted a comprehensive evaluation of ESV provided by mangrove forests. The results showed that (1) from 2016 to 2020, mangrove forests in Guangxi demonstrated a positive development trend and were undergoing a process of recovery. The area of mangrove forests in Guangxi increased from 6245.15 ha in 2016 to 6750.01 ha in 2020, with a net increase of 504.81 ha, which was mainly concentrated in Lianzhou Bay, Tieshan Harbour, and Dandou Bay; (2) the ESV of mangrove forests was USD 363.78 million in 2016 and USD 390.74 million in 2020; (3) the value of fishery, soil conservation, wave absorption, and pollution purification comprises the largest proportions of the ESV of mangrove forests. This study provides valuable insights and information to enhance our understanding of the relationship between the spatial pattern of mangrove forests and their ecosystem service value.

1. Introduction

Mangrove forests, which are found in intertidal zones in tropical and subtropical regions, are among the most valuable and productive ecosystems on the earth [1]. They provide unique ecosystem services such as wave energy reduction, coastal erosion prevention, water purification, and biodiversity protection [2,3]. Mangrove forests also contribute to poverty alleviation and food security, including the provision of food and raw material provision, offering recreation and tourism opportunities, and moderating extreme events [4]. Thus, they are enormously relevant to sustainable development goals [5]. To better understand the services and benefits mangrove forests provide to people and how their services change under different scenarios, it is necessary to assess the economic value of mangrove forests as natural capital [6]. The valuation of the forests’ ecosystem services is also a quantitative tool for decision-makers and conservation advocates in assessing the extent of recovery or degeneration [2].
Ecosystem valuation is an approach to assign monetary values to an ecosystem according to its key ecosystem goods and services, generally referred to as its Ecosystem Service Value (ESV) [7]. This approach can improve knowledge for informed decision-making to raise awareness of blue forest ecosystems and foster cooperation among blue forest stakeholders [8]. There are numerous studies on the ESV of coastal ecosystems [9,10,11]. In analyzing gains and losses in ecosystem services values (ESVs) in the coastal zones of Zhejiang Province during rapid urbanization, Cao et al. [9] found that changes in land use patterns, specifically disordered land-use changes from forestland and farmland to urban construction land, were a major cause of ESV loss. Ligate et al. [10] assessed temporal land cover and land-use changes, underlying socioeconomic drivers, and dynamics of ESV in the coastal zone of Tanzania, and identified population pressure and socioeconomic activities as key factors contributing to the degradation of coastal ecosystems. Yang et al. [11] proposed a detailed “donor-side” accounting approach based on the energy method, providing a “supply-side” evaluation of coastal and marine ecosystem services values (ESVs) that captures dynamic ecological processes and applies unified metrics.
However, three reasons make it challenging to accurately measure mangrove forests’ ESV. The obstacles limiting mangrove measurements include deficiencies in global-scale assessment methods, previous studies focusing on case studies in specific regions, and a lack of attention to the spatial pattern of forests. Firstly, while global-scale assessment methodologies [12,13] can provide useful insights into the overall trends and patterns of ecosystem services, they may cause variability and inconsistencies in local-scale assessment due to differences in the ecological and socioeconomic contexts of each individual region. It is important to note that global-scale ESV assessment methods and results may not always be suitable for those at a local scale [14]. By considering the specific characteristics of the ecosystem, local-scale assessments can provide more accurate and comprehensive evaluations of ecosystem services. Secondly, previous studies on ESV in mangrove forests primarily focused on a nature reserve [15]. They provided a comprehensive valuation of ecosystem services of mangroves in a natural reserve. However, they tended to emphasize the linkages between land use/land cover and ESV change in a natural reserve [7,16], rather than focus specifically on the mangrove forests. Thirdly, the spatial pattern of these forests was often overlooked in previous studies. The ESV may be underestimated when their spatial structure and pattern are neglected [17]. According to Luke M. Brander [13], an increase in the abundance of mangroves within a region can lead to higher unit productivity. Furthermore, it is worth noting that most ecosystem services require certain minimum area thresholds to be achieved. Even if two habitats have similar total areas, the distribution and fragmentation of the patches can lead to significant differences in their ecological value [18]. As such, the importance of mangrove forests as ecosystem service providers is highly dependent on their spatial patterns.
Spatial distribution and landscape pattern are essential for accurately assessing the ESV of mangrove forests [13,18,19]. Conducting traditional surveys of mangroves can be a highly challenging and time-consuming task due to their muddy intertidal zone environment [20]. Remote sensing has been widely used to acquire spatial information about mangrove forests due to its unparalleled advantages in terms of multiscale capabilities [21,22]. To date, the Landsat series imagery is a widely used dataset for assessing the ESV in mangrove forests [7], since the images have a 30 m resolution and have been consistently available every 16 days since 1984 [23]. However, there are several shortcomings in the studies that have generated mangrove maps. First, it is difficult to obtain images during the low tide period due to the coarse temporal resolution (over 16 days). Second, landscape patterns of smaller mangrove forest patches might not be accurately discriminated with a 30 m spatial resolution. Thus, Sentinel-2 imagery, with its free access, 10 m resolution bands (Bands 2, 3, 4, and 8), and dense temporal resolution (2–5 days), is a better choice [24]. Particularly when combined with the computing capability provided by Google Earth Engine, a high-quality Sentinel image with more details can be obtained [25]. However, no mangrove forest ESV assessment has been conducted based on Sentinel-2 derived spatial data.
To address the above-mentioned issues, we assessed the ESV of mangrove forests based on the criterion of the MA and the precise spatial distribution of mangrove forests in Guangxi province derived from high spatial resolution Sentinel-2 imagery. The objectives of this study are to (1) obtain the spatial distribution and pattern of mangrove forests from 2016 to 2020 based on Sentinel-2 imagery; (2) construct a comprehensive evaluation system by drawing on the Millennium Ecosystem Assessment (MA) to estimate the ESV of mangrove forests based on their spatial patterns; and (3) analyze the ESV changes from 2016 to 2020 along the coasts of Guangxi, China.

2. Materials and Methods
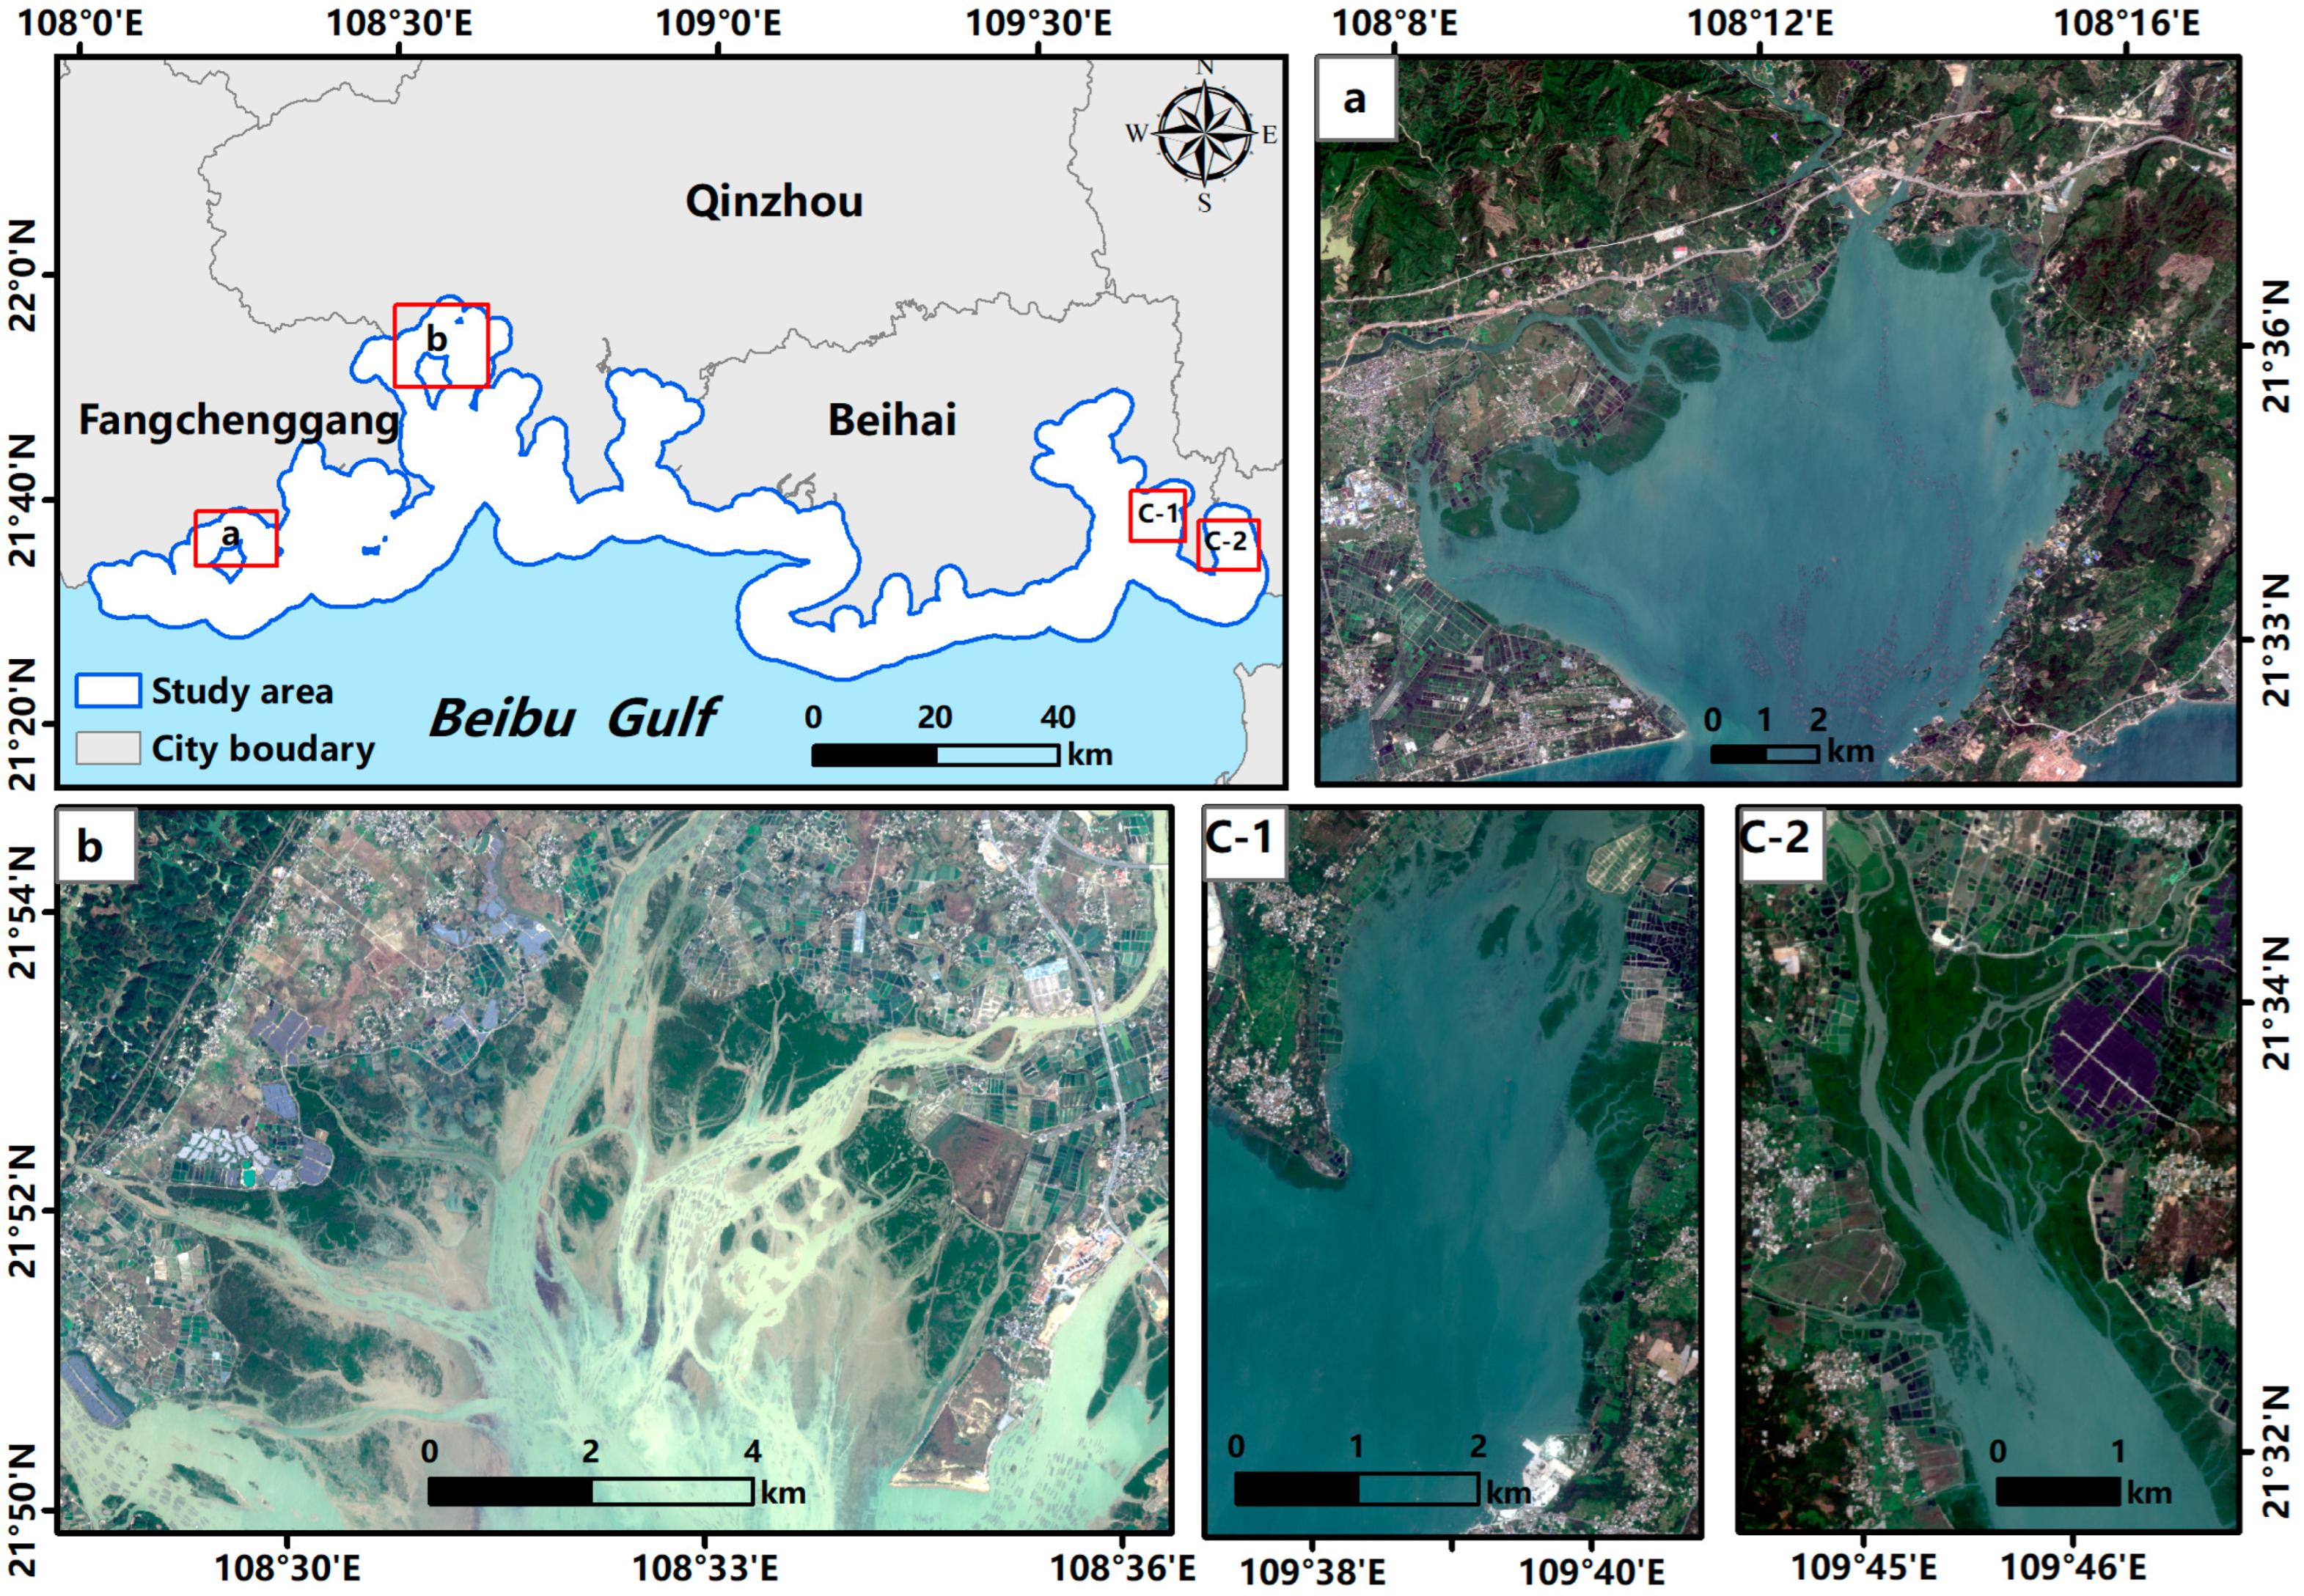
2.1. Study Area

As illustrated in Figure 1, the study area is located in the southwest portion of mainland China and the northern region of the Beibu Gulf (21°24′–22°01′N and 107°56′–109°47′E). The mean annual temperature and precipitation vary from 22 °C to 23 °C and from 1500 mm to 2000 mm, respectively. It belongs to the tropical monsoon oceanic climate zone with high temperatures and rainy conditions. Tides across the study area are diurnal, with an average range of 2.24 m [26].
Along the coasts of Guangxi, there are two national mangrove reserves (Shankou National Mangrove Nature Reserve and Beilun Estuary National Mangrove Nature Reserve) and one provincial mangrove reserve (Maowei Sea Mangrove Reserve). Seven species of mangrove forests live along the coasts, among which Aegiceras comiculatum, Avicennia marina, Kandelia candel, and Aegiceras comiculatum occupy over 90% of the total area of mangrove forests [27]. Other species, such as Rhizophora stylosa and Bruguiear gymnorrhza, are sparsely distributed [28]. Mangrove forests distributed in Lianzhou Bay, Maowei Bay, and Zhenzhu Bay are typical estuary mangrove forests, which are found in the intertidal zone of estuaries where freshwater and seawater mix and create conditions with varying salinity levels. Qinzhou Bay has a unique island group of mangroves. The largest urban mangroves and sandy mangroves of China are distributing along the coasts of Beihai.

2.2. Sentinel-2 Data Acquisition and Pre-Processing

In this study, Sentinel-2 images were chosen to obtain information on mangrove forest distribution in Guangxi from 2016 to 2020. The Sentinel-2 mission has two polar-orbiting satellites (Sentinel-2A and Sentinel-2B) that provide high-resolution optical imagery. These satellites revisit the same place every 2–5 days. They both carry a MultiSpectral Instrument (MSI) sensor that offers 13 spectral bands. Only four bands (Bands 2, 3, 4, and 8) with a 10 m spatial resolution were employed, identifying, in particular, mangrove forest patches with small areas or narrow shapes [26].
In high-tide images, some low-lying mangroves may be submerged by water bodies, making mangrove forests difficult to identify and extract. To facilitate the extraction of accurate information on the regional extent and spatial pattern of mangroves, low-tide period and cloud-cover images were acquired in November and December of 2016 and 2020. The Level-2A product of the Sentine-2 Multispectral Instrument (MSI) images was downloaded from the Copernicus Open Access Hub (https://scihub.copernicus.eu/dhus (accessed on 13 June 2022)). The Level-2A product underwent radiometric, geometric, orthorectified, and atmospheric corrections. It can provide per-pixel radiometric measurements of surface reflectance [29]. In order to ensure consistency throughout the study and obtain accurate mangrove extraction ranges, we manually drew coastline data from 2016 to 2020 using Google Earth Pro software (version 7.3.6), using artificial embankments as reference points. Lastly, each image was clipped using a 5 km buffer zone along the coastline.

2.3. Field Investigation and Other Data

Three field investigations were conducted during the periods of 1–15 November 2016, 13–25 September 2019, and 17–27 December 2020. The ground survey work was conducted along designated walkways, and each field point’s location was established by Real-Time Kinematic (IRTK5) with a global positioning system accurate to within 1 m, which can be affected by the number of available satellites and prevailing weather conditions. Aerial photographs were also taken with unmanned aerial vehicles during low tide. Given that much of the mudflat areas where the mangrove forests were located were inaccessible, some sample points were selected using Google Earth and unmanned aerial vehicles.
We collected 961 sample points in each of the years 2016 and 2020. Out of these, 200 mangrove and 200 non-mangrove points, respectively, were collected as training samples during the classification process. The remaining 224 mangrove points and 337 non-mangrove points were used for image validation in 2016 and 2020.

2.4. Classification Methods and Accuracy Assessment

In this study, object-based image analysis and the Random Forest classification method were applied, in conjunction with visual modification, to classify the mangrove and non-mangrove in 2016 and 2020, respectively.
Object-based image analysis involves setting certain homogeneous standard parameters according to the spectral information and shape information of the image [30]. It also segments the remote sensing image to form an image object. Image segmentation can directly influence the efficiency and accuracy of classification results [31]. The classification results avoid salt-and-pepper noise, have good integrity, and have a high classification accuracy [32].
In this study, multi-scale segmentation, which is one of the most useful segmentation algorithms, was selected, and the eCognition software (version 9.0) was used as the operating platform [33]. Through visual judgement and by systematically adjusting different segmentation scales and segmentation parameters until the mangrove forests regions were separated from water [24,30], the segmentation scale, segmentation shape, and tightness parameters were established as 20, 0.2, and 0.8, respectively.
Random Forest is an ensemble learning algorithm based on decision trees, that has demonstrated its usefulness and robustness in image classification [34]. It includes two critical parameters: the number of decision trees (ntree), which is established by randomly selecting samples from the training dataset, and the number of predictive variables (mtry), which defines the best partition in each node of decision trees and is determined as the square root of the number of input features [35].
When using a Random Forest classifier model, a wide range of features can be used as input variables. Compared to pixel-based methods, object-based image analysis can provide more spatial features. In this study, 15 spectral, spatial, and vegetation index features were used as input variables. A detailed list of these features is presented in Table 1.
In this study, Random Forest was also run in eCognition (version 9.0). After segmenting the image into multi-scale segmentation, we set the parameter ntree to 150 and the parameter mtry to 4. After obtaining the initial interpretation results, we inspected the results and adjusted the omitted or incorrect mangrove forest objects via visual modification.
To validate mapping accuracies, the accuracy of the classification results of 2016 and 2020 was assessed by the sample points (described in Section 2.3). The overall accuracy represents the proportion of correctly mapped points compared to ground points. The Kappa coefficient, a harmonic mean of user’s accuracy and producer’s accuracy, represents the classification performance of a single class.

2.5. Spatial Pattern of Mangrove Forests

In this study, combined with the spatial pattern of mangrove forest distribution in Guangxi [36], the indices shown in Table 2 were used to describe the spatial pattern of mangrove forests. On a landscape scale, the spatial pattern of mangrove forests refers to their spatial distribution pattern within regions (such as bays, etc.), including the spatial distribution and combination of mangrove forest patches with different sizes, shapes, and attributes. Cultivating a good spatial pattern and realizing its maximum comprehensive value is the goal of mangrove forest protection, management, and development. Abundance of mangrove refers to the area of mangroves per unit length of coastline in a bay or region. The number of patches is positively correlated with landscape fragmentation. Mangrove shoreline refers to the coastline effectively protected by mangroves. Finally, the relatively ideal distribution of mangroves highlights the contribution of mangroves to ecosystem services.

2.6. Assessment of Ecosystem Service Value

In this study, the ecosystem services of Guangxi’s mangrove forests were organized into four categories and 10 types based on the criterion of the MA, as shown in Table 3. To ensure the accuracy of the ESV assessments for 2016 and 2020, the reference values of the evaluation indices and results were standardized to a common metric of 2016 USD per ha per year. Given that the reference values for the selected indicators came from different years, we used the GDP deflators to adjust them to 2016 [37], and then converted them to 2016 USD. This approach ensured that the reference values were comparable and consistent, which was necessary for accurate and meaningful ESV assessments.
To analyze and compare the ecological values and services provided by mangrove forests, we divided them into two categories: ideally distributed mangroves and remaining mangroves. We assigned weight values of 0.7 and 1 to the remaining mangroves and ideally distributed mangrove categories, respectively [38,39], which enabled us to conduct a more comprehensive analysis of their respective ecosystem service values. The following is a description of the 10 types of ESV that were selected for evaluation. Note that all the reference values provided in the description below have been adjusted to reflect the 2016 values using GDP deflators.
(1) Material production value
The material production function refers to the various products that can obtained from the ecosystem, including fresh water, food fuel, medical supplies, and so on. The material production function is closely related to human activity, and the shortage of these products can have direct or indirect adverse effects on human well-being. This study mainly considers the wood production value and natural aquatic product output value of mangrove forests.
① Wood production
In Guangxi, logging of mangroves is not allowed in mangrove reserves, and it is subject to strict supervision and restrictions in other areas. Therefore, the value of wood production is calculated based on the growth of living standing trees, and the market value method is used to calculate the value of wood production. The value of the growth of mangrove forests’ living trees can be expressed as follows [40,41]:
V w o o d = G × P × ( A 1 × d 1 + A 2 × d 2 )
where Vwood is the value of the wood production service, A1 is the area of ideally distributed mangroves, A2 is the area of the remaining mangroves; di is the weighting factor (0.7–1.0) (here, we define the values of d1 and d2 as 1.0 and 0.7, respectively), G is the annual volume growth of standing trees (4.98 m3/(ha*a)), and P is the market price (USD 110.52/(ha*a) in 2016 and USD 92.22/(ha*a) in 2020).
② Fishery
Mangrove forests can provide a wealth of aquatic products, mainly including Sipunculus, Phascolosma esculenta, Ostrea rivularis, Meretrix meretrix, and other fishes. Aquaculture is generally widely distributed on tidal flats. Considering the availability of data, we used the fishery output value per unit area to calculate the fishery value provided by mangrove forests. The equation for calculating the fishery value is as follows [42]:
V F i s h e r y = P f × ( A 1 × d 1 + A 2 × d 2 )
where VFishery is the fishery value, and Pf is the value of mangrove fishery per unit area (USD 19,945.15/(ha*a)).
(2) Soil conservation value
Soil conservation has the most directly positive effect on the growth and development of trees and the control of soil erosion. It mainly refers to reducing soil erosion and maintaining soil. The value of soil consolidation can be calculated based on the alternative engineering method. Fertilizer conservation mainly refers to protecting the soil from the fertility loss caused by soil erosion. It can be measured by multiplying the sum of the total amount of N, P, and K in the topsoil (0–31 cm). The conservation value of the soil can be expressed as follows [38,39]:
V S o i l = ( A 1 × d 1 + A 2 × d 2 ) × ( X 1 X 2 ) × P 1 / P b
V F e r t i l i z a t i o n = ( A 1 × d 1 + A 2 × d 2 ) × S N P K × d × P b × P
where VSoil and VFertilization are the values of the soil consolidation and fertilizer conservation, X1 is the erosion index of bare soil (74.06 t/ha), X2 is the erosion index of woodland (47.69 t/ha), P1 is the cost of excavating earthwork (USD 0.57/m2), Pb is the density of the topsoil (0.77 t/m3), SNPK is the contents of N, P, and K (1.39%), d is the topsoil thickness (0.31 m), and P is the price of the fertilizer (USD 391.43/t).
(3) Wave absorbing revetment
Mangrove forests can absorb a large amount of tidal energy and significantly slow down water flow. They have unique morphological characteristics and develop root systems that form a stable network system, which enables mangrove forests to grow more firmly on the tidal flat and form a tight fence on the beach. The value of wave-absorbing revetment can be estimated by applying the shadow engineering method. The equation for calculating the value of wave-absorbing revetment is as follows [28,39]:
V w a v e = ( L 1 × d 1 + L 2 × d 2 ) × ( C 1 + C 2 )
where Vwave is the total value of the wave-absorbing revetment, L1 is the length of the ideally distributed mangrove shoreline, L2 is the length of the two remaining mangrove shorelines, C1 is the ecological benefits provided by mangrove forests per unit distance per year (USD 13,300/km), and C2 is the cost of repairing the dam.
(4) Climate regulation
The climate regulation of mangrove forests has both positive and negative effects. The positive effect mainly refers to their carbon fixation and oxygen release function, that is, the function of absorbing CO2 in the atmosphere through photosynthesis and releasing O2. Additionally, the negative effect mainly refers to their emission of greenhouse gas CH4. In this study, the afforestation cost and carbon tax method were used to evaluate the value of climate regulation. The equation is as follows [42,43]:
V C O 2 = ( A 1 × d 1 + A 2 × d 2 ) × T × C
V O 2 = ( A 1 × d 1 + A 2 × d 2 ) × M × P 0
V C H 4 = ( A 1 × d 1 + A 2 × d 2 ) × Q × 21 × T
V C l i m a t e = V C O 2 + V O 2 V C H 4
where T is the carbon tax (USD 182.82/t in 2016 and USD 195.58/t in 2020), C is the average annual carbon sequestration in mangrove forests (14.139 t/(ha*a)), M is the average annual oxygen release from mangrove forests (30.31 t/(ha*a)), Po is the industrial oxygen price (USD 63.27/t in 2016 and USD 91.23/t in 2020), Q is the annual emission flux of mangrove methane per unit area (USD 0.0077/t), and 21 is the warming potential value of methane.
(5) Pollution purification
The pollution purification value service refers to the value generated by the decomposition of and reduction in various invasive harmful substances in mangrove forests. Mangrove forests and understory soil have the ability to absorb and purify various pollutants, purify water quality, and reduce red tides [34]. The pollution prevention cost method was used to evaluate the value of pollution purification. The equation is as follows [41,42]:
V P u r i f i c a t i o n = ( A 1 × d 1 + A 2 × d 2 ) × S
where VPurification is the value of the pollution purification, and S is the purification value of mangrove forest pollution per unit area (USD 6151.66/ha).
(6) Water conservation
Mangrove forests can accumulate excess precipitation and release it slowly, so that precipitation can be redistributed in time and space. The water conservation of mangrove forests provides water for residents in the form of shallow groundwater, so its value can be calculated by storing the same amount of water in the reservoir. The shadow price method was chosen to calculate the value of surface water resources. The equation is as follows [44,45]:
V W a t e r = A × R × P w
where VWater is the water conservation value, A is the area of mangrove forests, R is the water storage capacity of mangrove forests per unit area (8100 m3/ha), and Pw is the cost of unit water storage capacity (USD 0.39/t).
(7) Habitat
Mangrove forests provide ideal living environments for various marine organisms, benthos, and seabirds. They are rich in biological species, playing an important role in ecosystem succession and biological evolution. Therefore, the protection value of biodiversity is crucial and cannot be ignored. The outcome reference method was used in this paper to calculate the value of the habitat. The equation is as follows [45,46]:
V H a b i t a t = ( A 1 × d 1 + A 2 × d 2 ) × P h
where VHabitat is the value of the habitat, and Ph is the value of biodiversity per unit area (USD 1791.44/ha).
(8) Nutrient accumulation
Mangrove forests are characterized by their strong ability to cycle and recycle nutrients within the ecosystem. This high productivity is an essential feature of mangrove forests that supports their ecological functions and ESV. The accumulation of nutrients is mainly the accumulation of N, P, and K, so their value can be calculated with the same amount of fertilizer. The value of nutrient accumulation can be expressed as follows [40]:
V N u t r i e n t = ( A 1 × d 1 + A 2 × d 2 ) × S t × P
where VNutrient is the value of the nutrient accumulation, St is the total nutrient retention in mangrove forests (0.291 t/ha), and P is the price of the fertilizer (USD 91.43/t).
(9) Scientific research and education
Mangrove forests have attracted experts and scholars from different fields to conduct research due to their viviparous phenomena, rich species diversity, high biomass, and productivity. However, the necessary research funds and time investments are difficult to obtain, and their values are difficult to quantify. Therefore, the outcome reference method was used in this paper to calculate the scientific research and education value. The equation is as follows [47]:
V S c i e n c e = A × P s
where VScience is the scientific research and education value, A is the area of the mangroves, and Ps is the scientific and educational value of mangrove forests per unit area (USD 474.90/ha).
(10) Recreation
The rich animal and plant resources of the mangrove forests provide good conditions for the development of tourism activities. Calculating the tourism value of mangrove forests is challenging due to various factors. In Guangxi, most of the scenic spots are located within nature reserves, and access is free to the public. Therefore, we took research results from previous studies as a reference to calculate the value generated by recreation. The calculation equation is as follows [46]:
V R e c r e a t i o n = A × P r
where VRecreation is the recreation value, A is the area of the mangrove forests, and Pr is the recreation value per unit of wetland area in Guangxi (USD 1076.68/ha in 2016 and USD 1118.08/ha in 2020).

3. Results

3.1. Accuracy Assessment of Mangrove Forests Map

Based on the verification points, two confusion matrices were generated to assess the accuracy of the 2016 and 2020 mangrove forest classification results (Table 4). The overall accuracies all exceeded 90%, and the Kappa coefficients all exceeded 0.8. In 2016, the mangrove forests map had a user accuracy and producer accuracy of 94% and 89%, respectively. In 2020, the mangrove forests map had a user accuracy and producer accuracy of 96% and 93%, respectively. The accuracy assessment results indicated that the classification results and the verification data have good consistency.

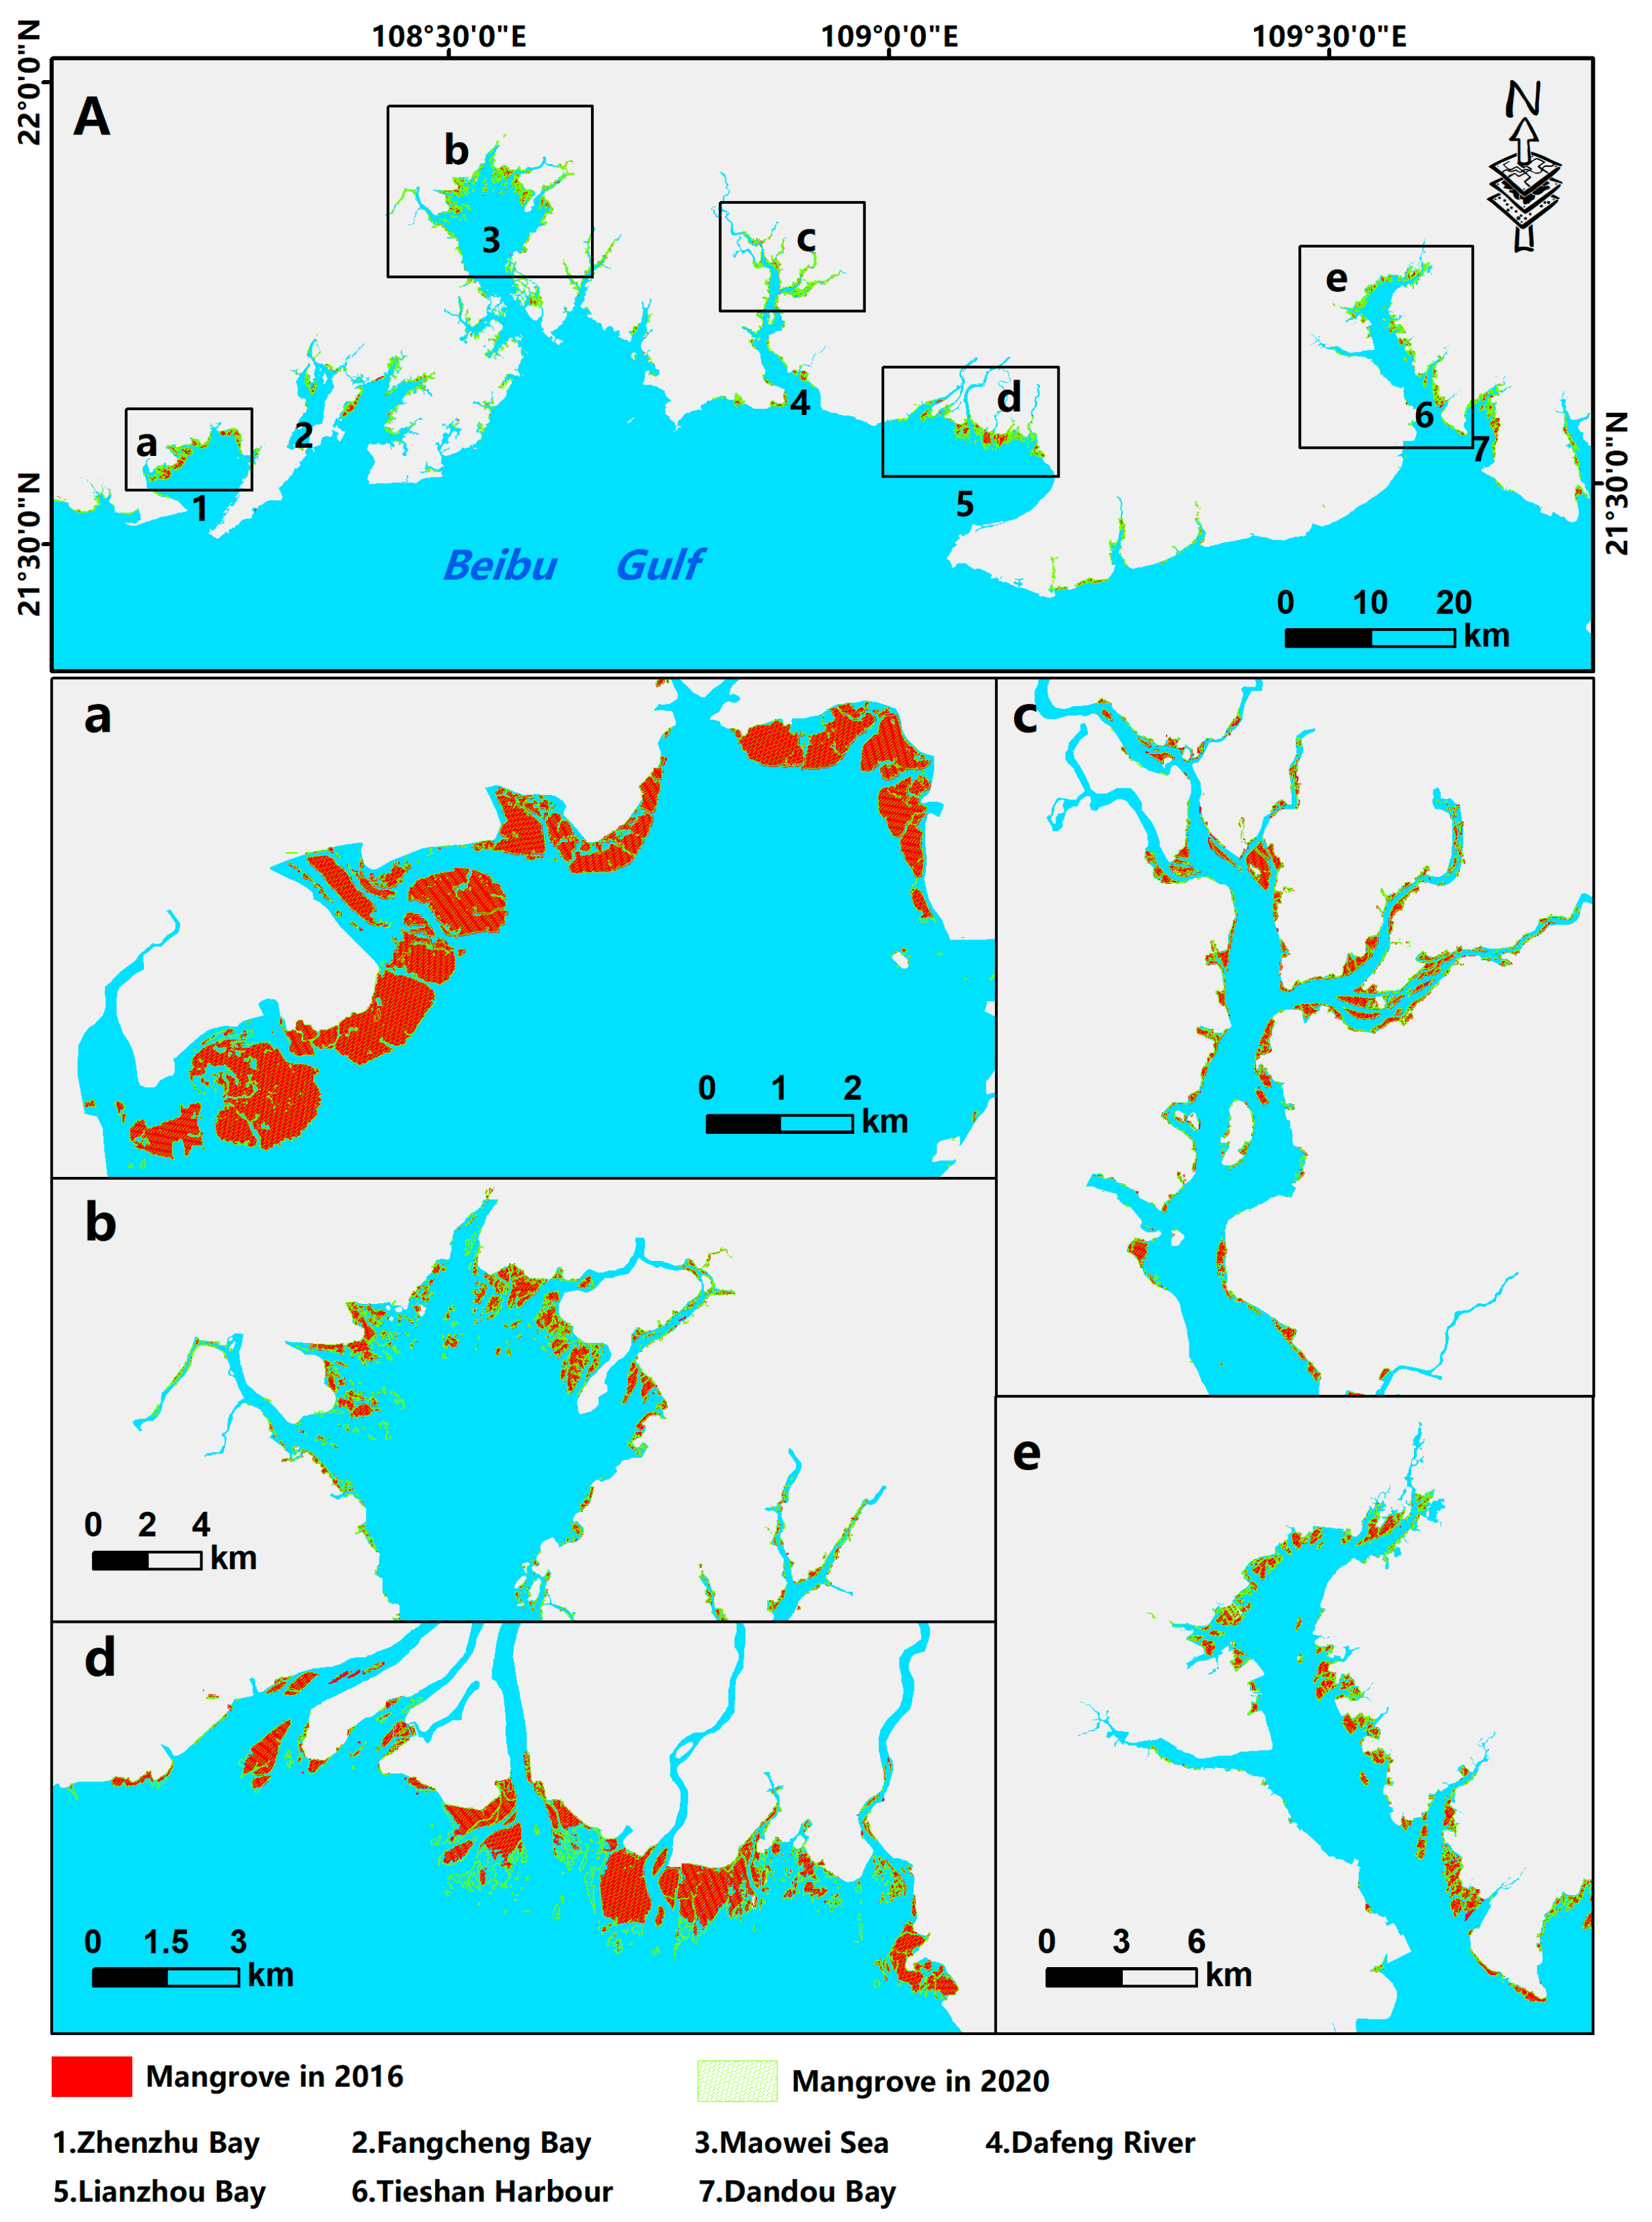
3.2. Spatial Distribution and Pattern of Guangxi’s Mangrove Forests

We obtained the spatial distribution and pattern of mangrove forests from 2016 to 2020 based on Sentinel-2 imagery. The spatial distribution of mangrove forests in Guangxi is shown in Figure 2. The mangrove forests are mainly concentrated in Zhenzhu Harbour, Fangcheng Bay, Maowei Sea, the Dafeng River, Lianzhou Bay, Tieshan Harbour, and Dandou Bay. Additionally, the area of mangrove forests has increased by 8% from 6245.15 ha in 2016 to 6750.01 ha in 2020. This increase was mainly concentrated in Lianzhou Bay, Tieshan Harbour, and Dandou Bay. In addition, we compared our mangrove forests map with the Guangxi mangrove forests maps created by Zhang et al. [24] and Hu et al. [48]. Our result was close to the result of Hu et al. (7089 ha) and much lower than the area of Zhang et al. (7528 ha). Hu used 30 m spatial resolution Landsat images, which led to mixed pixels in the mangrove forests and reduced the precision of the analysis. Zhang used one-meter spatial resolution Gaofen-2 imagery, which allowed for the identification of numerous small mangrove forests.
The spatial patterns of mangrove forests in Guangxi from 2016 to 2020 are presented in Table 5. From 2016 to 2020, based on the changes in coastlines and mangrove forests, the corresponding mangrove shorelines and coastward mangroves increased by 3.19% and 4.69%, respectively. The abundance of mangroves increased by 5.71%, and the number of patches increased by 4.13%. The average area of mangrove patches increased by 3.8%, and ideally distributed mangroves increased by 4.20%. The Guangxi coastline increased slightly from 1686.66 km to 1724.48 km from 2016 to 2020.

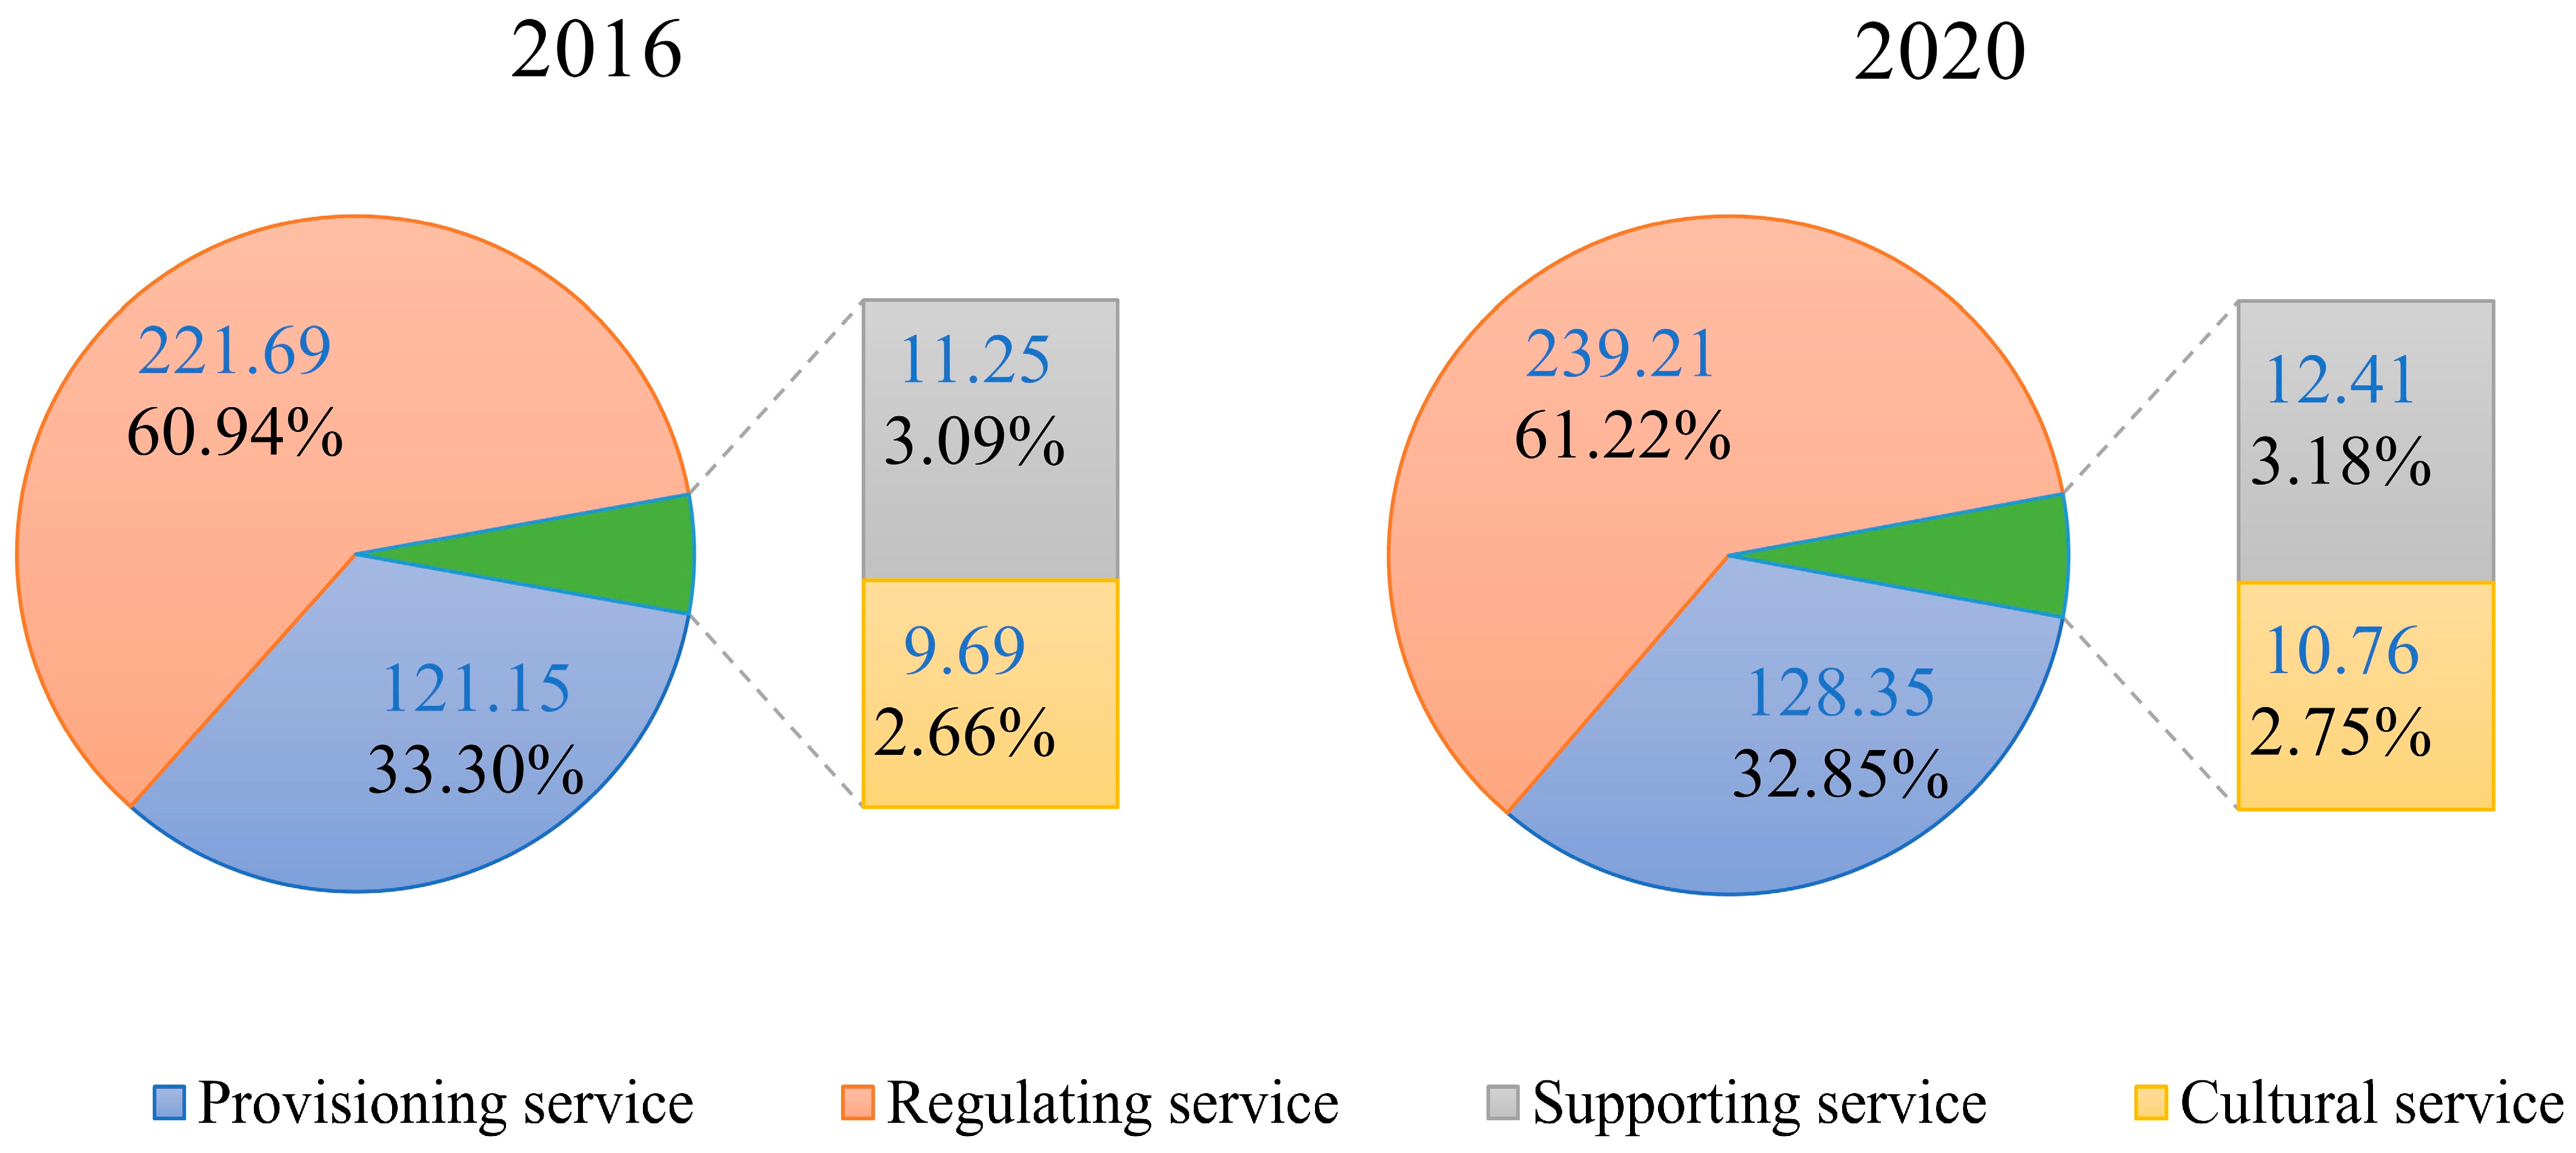
3.3. Variations in ESV

Table 6 shows the value changes for different ecosystem services. The total service value of mangrove forests changed from USD 363.78 million in 2016 to USD 390.74 million in 2020. The proportion of each service is obtained by dividing its own value by the total service value. This allows us to determine the relative contribution of each ecosystem service to the overall value of mangrove forests. As illustrated in Figure 3, the provisioning service value accounted for more than 33% of the total value, which proportionately constituted a decrease. The value of fishery remained at about 32.1%, but the value of wood decreased. The main reason is that the decline in the market price of logs in Guangxi has exceeded the increase in the areas of mangrove forests. Provisioning services accounted for 33.30% of the total value in 2016, and their proportion in 2020 decreased by 0.45% in comparison.
The proportion of regulating services remained at 60%, only slightly increasing from 2016 to 2020. Among the regulating services, fertilizer conservation and wave-absorbing revetment remained the main service functions, which indicates that mangrove forests have unique ecosystem services. The reason for the increase in oxygen release is that the average price of the Chinese oxygen market in 2020 (USD 91.23) increased significantly, compared with 2016 (USD 63.27), reaching 44.2%. In 2016, the value of regulating services accounted for 60.94% of the total services value; in 2020, it increased to 61.22%.
The cultural service and supporting service values accounted for only 2.7% and 3.1% of the total value, respectively. The reason for the increase in habitat and recreation is that the value of ecosystem services per unit area in China in 2020 (USD 236.38) increased, compared with 2016 (USD 227.63), by up to 3.9%. Due to the significant increase in the area of mangrove forests, the net change in the ESV was found to be positive. However, the annual ESV changed slightly, decreasing from USD 58,250 to 57,886.

4. Discussion

4.1. Factors Driving Changes in Spatial Pattern

To improve the protection and management of mangroves, optimize their spatial layout, and realize their ecological and environmental value, in-depth research on their spatial pattern on a landscape scale is essential [49]. In addition to the three basic landscape pattern indices—mangrove area, patch number, and patch area—this study also analyzes shoreline mangroves, ideally distributed mangroves, and mangrove abundance.
Table 5 illustrates that, over the five-year period from 2016 to 2020, the mangrove area was widely used as the most basic spatial indicator in spatial structure analysis. Due to the joint efforts of local governments and the Chinese government, a series of laws and regulations have been formulated and implemented. The mangroves have shown a steady increasing trend, indicating a positive condition between development and recovery. Additionally, the average patch area of mangroves has increased, which further supports our observations of positive growth and recovery in mangrove forests.
The change in the abundance of mangroves can be attributed to two main reasons. Firstly, the continued increase in mangrove area, and, secondly, the construction of various infrastructures, such as reclamation projects, salt pans and breeding ponds, seawalls, urban development, and port and terminal construction, has extended the length of the coastline. The increase in abundance provides a more intuitive indicator of mangrove growth in comparison to measuring their number by area, which can lead to vague and incomparable results at the scale of bays or protected areas. The relative abundance not only facilitates the comparison of mangroves in different regions during the same period but also of mangroves in the same region with significant differences in different periods.
Since mangroves are often distributed along the coastline, the length of the coastline can serve as an indicator of mangrove distribution. The reasons for the increase in mangrove shorelines are multifaceted and can be attributed to several factors. One of the primary reasons is the construction of many breeding ponds on the tidal flats between the original natural shorelines and mangroves. This has brought the mangroves closer to the shoreline. Additionally, other factors, such as the artificial afforestation of new areas and the destruction of existing mangroves, can lead to changes in the extent of mangrove shorelines.
In addition to an increase in mangrove area, the number of shoreline mangroves has also increased. The proportion of shoreline mangroves to total mangrove area has remained at 85%, indicating that the vast majority of mangroves are located close to the shore and have good wave dissipation and shoreline protection characteristics. Furthermore, the ratio of ideally distributed mangrove areas to total mangrove area remains at 80%. This suggests that the mangroves are primarily clustered rather than evenly distributed across the area. The causes of changes in mangrove patch patterns are similar to those of mangrove shorelines. These include a large shift in the spatial location of the coastline, the expansion of mangrove patches, and damage to mangroves caused by natural evolution.
The measurement of coastwards mangroves and ideally distributed mangroves provides a more intuitive depiction of the spatial scale and ecological value of mangroves. For instance, the efficacy of mangroves in wave-absorbing revetment is related to characteristics such as the stand structure, the distance from the embankment, and the patch width [36]. From this perspective, it is easy to understand why certain indicators were selected to indicate a more ideal spatial distribution of mangroves and how the spatial structure impacts the ecological value of mangroves.

4.2. The Rationality and Existing Problems of Selecting Evaluation Index

In our study, we built an evaluation system for mangrove forest ESV by incorporating spatial pattern analysis and the Millennium Ecosystem Assessment framework. Our approach involved categorizing ecosystem services into four main types: provisioning services, regulating services, supporting services, and cultural services. Following the principles of scientific, representative, comprehensive, concise, and operational criteria, we selected 10 indicators for the quantitative evaluation of ecosystem services. Each of these 10 indicators was chosen to fulfill the evaluation objectives while also being appropriate and relevant to the evaluation of mangrove ecosystems [50]. Moreover, each indicator is independent from the others to prevent any double-counting of data caused by information overlap.
Due to significant differences in regional and local contexts, environmental factors, and social dynamics that can affect the provision and valuation of ecosystem services in different locations, local-scale reference values can provide a more accurate and suitable basis for estimating mangrove ESV and informing management and policy decisions. To account for the challenges related to data collection and time constraints in the evaluation process, the result–reference method has been used for some parameters (fisheries, pollution purification, habitat, recreation, scientific research, and education) in this study. This method considers the similarity between the evaluated object and the reference object. The higher the similarity, the better the result. However, according to Lautenbach et al. [51], errors in the valuation of ecosystems can arise due to their diversity and spatial heterogeneity. For instance, the coastal area of Guangxi has a significant number of aquaculture ponds, making it challenging to assess the value of mangroves in terms of their contribution to fisheries in the corresponding area. Despite the inclusion of fishery as an indicator of mangrove ecosystem service value, the direct impact of mangroves on aquaculture cannot be fully measured [52]. Research has shown that the presence of mangroves in coastal areas may increase the survival rate of coastal shrimp farming by 15–35% compared to areas without mangroves [53]. Thus, the calculated results in this regard are most likely lower than the actual value.
The relationship between the size of mangroves and their value per unit area is complex. On the one hand, increasing the area of mangroves may lead to reduced marginal returns, while, on the other hand, most ecosystem services require a threshold area for good functioning, implying that value increases with size [13]. These factors must be considered in more detailed research in the future. Furthermore, there is a general trend that larger mangrove patches can provide a greater ecosystem service supply compared to smaller fragmented patches. Future research using appropriate methods and parameters will be necessary in order to further assess the practical value of mangrove ecosystems.

4.3. Threatened Situations

The protection, management, and restoration of wetlands have become important global issues to be addressed. The issues surrounding wetlands’ protection, management, and restoration are still evident [54]. These include disease and insect pest risks from single-community structures, as well as biological hazards such as barnacles. Additionally, invasive alien species like non-native plants can pose threats to wetlands. Furthermore, human factors such as coastal development, excessive pollution, overuse, and seawall construction also contribute to the challenges currently facing wetlands.
Over the time scale of this study, the impact of human socioeconomic activities on the land use types and landscape structures of mangrove wetland ecosystems in Guangxi was evident. In China, during the early 1990s, the ecological and economic values of mangrove ecosystems began to gain widespread recognition and public acknowledgement. As a result, a series of relevant laws and regulations were formulated during this period to protect mangrove resources. In 1982, the “Marine Environmental Protection Law of the People’s Republic of China” was adopted [55], which clearly stated that “destroying coastal protection forests, mangroves, and coral reefs is prohibited”. Since 2002, the State Forestry Administration has launched a series of mangrove protection and restoration projects. Most recently, in 2020, the Chinese government launched the “Special Action Plan for Red Forest Protection and Restoration (2020–2025)”.
The protective measures have played a positive role in the conservation of mangroves in China, and according to Jia et al. [30], the area of mangroves in China has increased from 22,674.22 ha in 2016 to 23,420.34 ha in 2020. With the findings of this study, we have reason to believe that the ESV of mangroves in China is continuously rising. However, on a global scale, the situation is still not optimistic. According to the Global Mangrove Watch, the area of global mangroves decreased from 802,419 ha in 2016 to 775,337 ha in 2020. This once again reminds us of the need to strengthen the protection of mangroves globally to ensure the sustainable growth of the area and the effective protection of the ecosystem.

5. Conclusions

During the period from 2016 to 2020, the mangrove area in Guangxi increased from 6245.15 ha to 6750.01 ha, with a net increase of 504.81 ha, which was mainly concentrated in Lianzhou Bay, Tieshan Harbour, and Dandou Bay. This study aims to explore the spatial distribution and structural changes in mangroves in Guangxi from the perspectives of mangrove abundance, mangrove coastline, ideally distributed mangroves, and other related factors. The results indicate that the average area of mangroves, ideally distributed mangroves, mangrove coastline, and mangrove abundance in Guangxi all increased, suggesting that the mangrove ecosystem in Guangxi is developing well and undergoing a process of recovery. Moreover, the fragmentation degree of the mangrove ecosystem has reduced.
In this study, the ESV of Guangxi mangrove forests were evaluated for the period from 2016 to 2020. The total ESV of mangroves increased from USD 363.78 million to USD 390.74 million. The fishery value, soil conservation value, wave-absorbing revetment, and pollution purification occupy the largest proportion; in addition to the increase in the area of mangrove forests, people’s awareness of its ecological value is also an important reason for these changes and trends. The proposed approach and present results of this study could contribute significantly to a better understanding of the relationship between the spatial pattern and distribution of mangroves in Guangxi and their ecological value.

Author Contributions

Conceptualization, X.Z.; data curation, R.Z.; formal analysis, R.Z.; investigation, K.W., C.Z. and R.Z.; methodology, K.W.; project administration, X.Z. and C.Z.; resources, X.Z., Z.W. and M.J.; software, M.J.; supervision, X.Z., Z.W. and M.J.; validation, C.Z. and Z.W.; visualization, C.Z. and M.J.; writing—original draft, K.W.; writing—review and editing, K.W. and X.Z. All authors have read and agreed to the published version of the manuscript.

Funding

This research was funded by the National Natural Science Foundation of China (42171379, 42201422), the China Postdoctoral Science Foundation (No. 2022M713132), and the National Earth System Science Data Center (www.geodata.cn (accessed on 12 June 2023)).

Data Availability Statement

Sentinel-2 satellite data are sourced from European Space Agency (https://scihub.copernicus.eu/dhus (accessed on 13 June 2022)). The data presented in this study are available upon request from the corresponding author.

Acknowledgments

The authors would like to acknowledge the comments of the reviewers and the Editorial Board. They also would like to thank Mingming Jia from the Northeast Institute of Geography and Agroecology for generously providing the field data used in this study.

Conflicts of Interest

The authors declare no conflicts of interest.

References

  1. Myint, S.W.; Giri, C.P.; Wang, L.; Zhu, Z.; Gillette, S.C. Identifying Mangrove Species and Their Surrounding Land Use and Land Cover Classes Using an Object-Oriented Approach with a Lacunarity Spatial Measure. GIScience Remote Sens. 2008, 45, 188–208. [Google Scholar] [CrossRef]
  2. Mukherjee, N.; Sutherland, W.J.; Dicks, L.; Hugé, J.; Koedam, N.; Dahdouh-Guebas, F. Ecosystem Service Valuations of Mangrove Ecosystems to Inform Decision Making and Future Valuation Exercises. PLoS ONE 2014, 9, e107706. [Google Scholar] [CrossRef] [PubMed]
  3. Zeng, H.; Jia, M.; Zhang, R.; Wang, Z.; Mao, D.; Ren, C.; Zhao, C. Monitoring the Light Pollution Changes of China’s Mangrove Forests from 1992–2020 Using Nighttime Light Data. Front. Mar. Sci. 2023, 10, 1187702. [Google Scholar] [CrossRef]
  4. Cherrington, E.A.; Griffin, R.E.; Anderson, E.R.; Hernandez Sandoval, B.E.; Flores-Anderson, A.I.; Muench, R.E.; Markert, K.N.; Adams, E.C.; Limaye, A.S.; Irwin, D.E. Use of Public Earth Observation Data for Tracking Progress in Sustainable Management of Coastal Forest Ecosystems in Belize, Central America. Remote Sens. Environ. 2020, 245, 111798. [Google Scholar] [CrossRef]
  5. Lovelock, C.E.; Barbier, E.; Duarte, C.M. Tackling the Mangrove Restoration Challenge. PLoS Biol. 2022, 20, e3001836. [Google Scholar] [CrossRef] [PubMed]
  6. Pendleton, L.; Mongruel, R.; Beaumont, N.; Hooper, T.; Charles, M. A Triage Approach to Improve the Relevance of Marine Ecosystem Services Assessments. Mar. Ecol. Prog. Ser. 2015, 530, 183–193. [Google Scholar] [CrossRef]
  7. Sannigrahi, S.; Chakraborti, S.; Joshi, P.K.; Keesstra, S.; Sen, S.; Paul, S.K.; Kreuter, U.; Sutton, P.C.; Jha, S.; Dang, K.B. Ecosystem Service Value Assessment of a Natural Reserve Region for Strengthening Protection and Conservation. J. Environ. Manag. 2019, 244, 208–227. [Google Scholar] [CrossRef] [PubMed]
  8. Himes-Cornell, A.; Grose, S.O.; Pendleton, L. Mangrove Ecosystem Service Values and Methodological Approaches to Valuation: Where Do We Stand? Front. Mar. Sci. 2018, 5, 376. [Google Scholar] [CrossRef]
  9. Cao, L.; Li, J.; Ye, M.; Pu, R.; Liu, Y.; Guo, Q.; Feng, B.; Song, X. Changes of Ecosystem Service Value in a Coastal Zone of Zhejiang Province, China, during Rapid Urbanization. Int. J. Environ. Res. Public Health 2018, 15, 1301. [Google Scholar] [CrossRef]
  10. Ligate, E.J.; Chen, C.; Wu, C. Evaluation of Tropical Coastal Land Cover and Land Use Changes and Their Impacts on Ecosystem Service Values. Ecosyst. Health Sustain. 2018, 4, 188–204. [Google Scholar] [CrossRef]
  11. Yang, Q.; Liu, G.; Hao, Y.; Zhang, L.; Giannetti, B.F.; Wang, J.; Casazza, M. Donor-Side Evaluation of Coastal and Marine Ecosystem Services. Water Res. 2019, 166, 115028. [Google Scholar] [CrossRef]
  12. De Groot, R.; Brander, L.; Van Der Ploeg, S.; Costanza, R.; Bernard, F.; Braat, L.; Christie, M.; Crossman, N.; Ghermandi, A.; Hein, L.; et al. Global Estimates of the Value of Ecosystems and Their Services in Monetary Units. Ecosyst. Serv. 2012, 1, 50–61. [Google Scholar] [CrossRef]
  13. Brander, L.M.; Wagtendonk, A.J.; Hussain, S.S.; McVittie, A.; Verburg, P.H.; De Groot, R.S.; Van Der Ploeg, S. Ecosystem Service Values for Mangroves in Southeast Asia: A Meta-Analysis and Value Transfer Application. Ecosyst. Serv. 2012, 1, 62–69. [Google Scholar] [CrossRef]
  14. Gaodi, X.; Lin, Z.; Chunxia, L.; Yu, X.; Wenhua, L. Applying Value Transfer Method for Eco-Service Valuation in China. J. Resour. Ecol. 2010, 1, 51–59. [Google Scholar] [CrossRef]
  15. Camacho-Valdez, V.; Ruiz-Luna, A.; Ghermandi, A.; Berlanga-Robles, C.A.; Nunes, P.A.L.D. Effects of Land Use Changes on the Ecosystem Service Values of Coastal Wetlands. Environ. Manag. 2014, 54, 852–864. [Google Scholar] [CrossRef] [PubMed]
  16. Yushanjiang, A.; Zhang, F.; Kung, H.; Li, Z. Spatial–Temporal Variation of Ecosystem Service Values in Ebinur Lake Wetland National Natural Reserve from 1972 to 2016, Xinjiang, Arid Region of China. Environ. Earth Sci. 2018, 77, 586. [Google Scholar] [CrossRef]
  17. Zhang, H.; Chen, C.; Zhang, H.; Zhang, L.; Jia, G. Evaluation of Value of Wetland Ecosystem Services of Zhangjiang Estuary Mangrove National Nature Reserve. Wetl. Sci. 2013, 11, 108–113. [Google Scholar] [CrossRef]
  18. Harborne, A.R.; Mumby, P.J.; Micheli, F.; Perry, C.T.; Dahlgren, C.P.; Holmes, K.E.; Brumbaugh, D.R. The Functional Value of Caribbean Coral Reef, Seagrass and Mangrove Habitats to Ecosystem Processes. In Advances in Marine Biology; Elsevier: Amsterdam, The Netherlands, 2006; Volume 50, pp. 57–189. ISBN 978-0-12-026151-2. [Google Scholar]
  19. Li, Y.; Wen, H.; Wang, F. Analysis of the Evolution of Mangrove Landscape Patterns and Their Drivers in Hainan Island from 2000 to 2020. Sustainability 2022, 15, 759. [Google Scholar] [CrossRef]
  20. Pham, T.; Yokoya, N.; Bui, D.; Yoshino, K.; Friess, D. Remote Sensing Approaches for Monitoring Mangrove Species, Structure, and Biomass: Opportunities and Challenges. Remote Sens. 2019, 11, 230. [Google Scholar] [CrossRef]
  21. Tian, J.; Wang, L.; Li, X.; Gong, H.; Shi, C.; Zhong, R.; Liu, X. Comparison of UAV and WorldView-2 Imagery for Mapping Leaf Area Index of Mangrove Forest. Int. J. Appl. Earth Obs. Geoinf. 2017, 61, 22–31. [Google Scholar] [CrossRef]
  22. Jia, M.; Wang, Z.; Zhang, Y.; Mao, D.; Wang, C. Monitoring Loss and Recovery of Mangrove Forests during 42 Years: The Achievements of Mangrove Conservation in China. Int. J. Appl. Earth Obs. Geoinf. 2018, 73, 535–545. [Google Scholar] [CrossRef]
  23. Matejicek, L.; Kopackova, V. Changes in Croplands as a Result of Large Scale Mining and the Associated Impact on Food Security Studied Using Time-Series Landsat Images. Remote Sens. 2010, 2, 1463–1480. [Google Scholar] [CrossRef]
  24. Zhang, R.; Jia, M.; Wang, Z.; Zhou, Y.; Wen, X.; Tan, Y.; Cheng, L. A Comparison of Gaofen-2 and Sentinel-2 Imagery for Mapping Mangrove Forests Using Object-Oriented Analysis and Random Forest. IEEE J. Sel. Top. Appl. Earth Obs. Remote Sens. 2021, 14, 4185–4193. [Google Scholar] [CrossRef]
  25. Zhao, C.; Jia, M.; Wang, Z.; Mao, D.; Wang, Y. Toward a Better Understanding of Coastal Salt Marsh Mapping: A Case from China Using Dual-Temporal Images. Remote Sens. Environ. 2023, 295, 113664. [Google Scholar] [CrossRef]
  26. Ghorbanian, A.; Zaghian, S.; Asiyabi, R.M.; Amani, M.; Mohammadzadeh, A.; Jamali, S. Mangrove Ecosystem Mapping Using Sentinel-1 and Sentinel-2 Satellite Images and Random Forest Algorithm in Google Earth Engine. Remote Sens. 2021, 13, 2565. [Google Scholar] [CrossRef]
  27. Zhang, L.; Xu, S. Discussion about the Eco-function of Mangrove Wetlands of Beibu gulf of Guangxi Zhuang Nationality Autonomous Region. Anhui Agri. Sci. Bull. 2010, 16, 134–136. [Google Scholar] [CrossRef]
  28. Li, C. Quantitative distribution of mangroves in Guangxi Zhuang Autonmous Region. J. Beijing For. Univ. 2004, 26, 47–52. [Google Scholar] [CrossRef]
  29. Jia, M.; Wang, Z.; Mao, D.; Ren, C.; Wang, C.; Wang, Y. Rapid, Robust, and Automated Mapping of Tidal Flats in China Using Time Series Sentinel-2 Images and Google Earth Engine. Remote Sens. Environ. 2021, 255, 112285. [Google Scholar] [CrossRef]
  30. Jia, M.; Wang, Z.; Mao, D.; Ren, C.; Song, K.; Zhao, C.; Wang, C.; Xiao, X.; Wang, Y. Mapping Global Distribution of Mangrove Forests at 10-m Resolution. Sci. Bull. 2023, 68, 1306–1316. [Google Scholar] [CrossRef]
  31. Powers, R.P.; Hay, G.J.; Chen, G. How Wetland Type and Area Differ through Scale: A GEOBIA Case Study in Alberta’s Boreal Plains. Remote Sens. Environ. 2012, 117, 135–145. [Google Scholar] [CrossRef]
  32. Guo, X.; Zhang, C.; Luo, W.; Yang, J.; Yang, M. Urban Impervious Surface Extraction Based on Multi-Features and Random Forest. IEEE Access 2020, 8, 226609–226623. [Google Scholar] [CrossRef]
  33. Liu, M.; Mao, D.; Wang, Z.; Li, L.; Man, W.; Jia, M.; Ren, C.; Zhang, Y. Rapid Invasion of Spartina Alterniflora in the Coastal Zone of Mainland China: New Observations from Landsat OLI Images. Remote Sens. 2018, 10, 1933. [Google Scholar] [CrossRef]
  34. Belgiu, M.; Drăguţ, L. Random Forest in Remote Sensing: A Review of Applications and Future Directions. ISPRS J. Photogramm. Remote Sens. 2016, 114, 24–31. [Google Scholar] [CrossRef]
  35. Vuolo, F.; Neuwirth, M.; Immitzer, M.; Atzberger, C.; Ng, W.-T. How Much Does Multi-Temporal Sentinel-2 Data Improve Crop Type Classification? Int. J. Appl. Earth Obs. Geoinf. 2018, 72, 122–130. [Google Scholar] [CrossRef]
  36. Li, C.; Xia, Y.; Dai, H. Temporal Analysis on Spatial Structure of Mangrove Distribution in Guangxi, China from 1960 to 2010. Wetl. Sci. 2015, 13, 265–275. [Google Scholar] [CrossRef]
  37. Kang, N.; Hou, L.; Huang, J.; Liu, H. Ecosystem Services Valuation in China: A Meta-Analysis. Sci. Total Environ. 2022, 809, 151122. [Google Scholar] [CrossRef] [PubMed]
  38. Zhang, Q. Research on the Biologic Seashore of South China Sea; Guangdong Economic Press: Guangzhou, China, 2008. [Google Scholar]
  39. Yanagisawa, H.; Koshimura, S.; Goto, K.; Miyagi, T.; Imamura, F.; Ruangrassamee, A.; Tanavud, C. The Reduction Effects of Mangrove Forest on a Tsunami Based on Field Surveys at Pakarang Cape, Thailand and Numerical Analysis. Estuar. Coast. Shelf Sci. 2009, 81, 27–37. [Google Scholar] [CrossRef]
  40. Han, W.; Gao, X.; Lu, C.; Lin, P. The Ecological Values of Mangrove Ecosystems in China. Ecol. Sci. 2000, 19, 40–45. [Google Scholar]
  41. China Forestry and Grassland Statistical Yearbook; China Forestry Publishing House: Beijing, China, 2020.
  42. Fan, H.; Zhang, Y.; Zou, L.; Pan, L. A study on the baseline value of the Chinese mangrove services and allocation of the value to individual tree. Acta Ecol. Sin. 2022, 42, 1262–1275. [Google Scholar] [CrossRef]
  43. Chen, S.; Wen, Z. Estimating Forest Ecosystem Service Function of Carbon Sequestration and Oxygen Release in Guangxi Province. J. Agro-For. Econ. Manag. 2016, 15, 557–563. [Google Scholar] [CrossRef]
  44. Lu, X. Wetland Protection and Management; Chemical Industry Press: Beijing, China, 2004. [Google Scholar]
  45. Guangxi Statistical Yearbook; China Statistics Press: Beijing, China, 2020.
  46. Xie, G.; Zhang, C.; Lei, M.; Chen, W.; Li, S. Improvement of the Evaluation Method for Ecosystem Service Value Based on Per Unit Area. J. Nat. Resour. 2015, 30, 1243–1252. [Google Scholar] [CrossRef]
  47. Chen, Z.; Zhang, X. Value of Ecosystem Services in China. Chin. Sci. Bull. 2000, 45, 870–876. [Google Scholar] [CrossRef]
  48. Hu, L.; Li, W.; Xu, B. Monitoring Mangrove Forest Change in China from 1990 to 2015 Using Landsat-Derived Spectral-Temporal Variability Metrics. Int. J. Appl. Earth Obs. Geoinf. 2018, 73, 88–98. [Google Scholar] [CrossRef]
  49. Ellison, A.M.; Felson, A.J.; Friess, D.A. Mangrove Rehabilitation and Restoration as Experimental Adaptive Management. Front. Mar. Sci. 2020, 7, 327. [Google Scholar] [CrossRef]
  50. Costanza, R.; d’Arge, R.; de Groot, R.; Stephen, F.; Monica, G. The Value of the World Ecosystem Services and Natural Capital. Nature 1997, 387, 253–260. [Google Scholar] [CrossRef]
  51. Lautenbach, S.; Kugel, C.; Lausch, A.; Seppelt, R. Analysis of Historic Changes in Regional Ecosystem Service Provisioning Using Land Use Data. Ecol. Indic. 2011, 11, 676–687. [Google Scholar] [CrossRef]
  52. Kelleway, J.J.; Cavanaugh, K.; Rogers, K.; Feller, I.C.; Ens, E.; Doughty, C.; Saintilan, N. Review of the Ecosystem Service Implications of Mangrove Encroachment into Salt Marshes. Glob. Chang. Biol. 2017, 23, 3967–3983. [Google Scholar] [CrossRef] [PubMed]
  53. Anneboina, L.R.; Kavi Kumar, K.S. Economic Analysis of Mangrove and Marine Fishery Linkages in India. Ecosyst. Serv. 2017, 24, 114–123. [Google Scholar] [CrossRef]
  54. Wang, X.; Xiao, X.; Xu, X.; Zou, Z.; Chen, B.; Qin, Y.; Zhang, X.; Dong, J.; Liu, D.; Pan, L.; et al. Rebound in China’s Coastal Wetlands Following Conservation and Restoration. Nat. Sustain. 2021, 4, 1076–1083. [Google Scholar] [CrossRef]
  55. Jia, M.; Wang, Z.; Mao, D.; Huang, C.; Lu, C. Spatial-temporal changes of China’s mangrove forests over the past 50 years: An analysis towards the Sustainable Development Goals (SDGs). Chin. Sci. Bull. 2021, 66, 3886–3901. [Google Scholar] [CrossRef]
Figure 1. Location of the study area. (a) Beilun Eastuary National Mangrove Nature Reserve; (b) Maowei Sea Mangrove Reserve; (c) Shankou National Mangrove Nature Reserve (including C-1 and C-2).
Remotesensing 16 00494 g001
Figure 2. (A) Spatial dynamics of mangrove forests along the coasts of Guangxi in 2016 and 2020. (The data from 2020 for mangrove forests were superimposed on the data from 2016 and subfigures (ae) show the areas of concentrated or highly dynamic changes).
Remotesensing 16 00494 g002
Figure 3. Spatial dynamics of ecosystem ESV in Guangxi, 2016–2020 (in blue color, USD million).
Remotesensing 16 00494 g003
Table 1. Features used in Random Forest classification.
Feature TypeClassification Feature
Spectral featureMean value of band 2 3 4 8, Standard deviation of band 2 3 4 8
Spatial featureShape index, Compactness index, Border index, Homogeneity, Contrast
Vegetation indexNormalized Difference Vegetation Index, Normalized Difference Water Index
Table 2. Spatial pattern of mangrove.
IndicesDescription
Abundance of mangroveThe area of mangroves per unit length of coastline (ha/km).
Number of patchesThe number of mangrove patches.
Average patch areaThe average area of all mangrove patches (ha).
Mangrove shorelineShoreline with mangroves (km)
Coastwards mangroveMangroves with a minimum distance between the landward boundary and the coastline less than 30 m.
Ideally distributed mangroveShoreline mangrove with a patch width ≥ 100 m and coverage ≥ 0.4
Table 3. Indicators, calculation criterion, and data source for evaluating ESV of mangrove.
CategoryTypeEvaluation IndexEquation
Provisioning
service
Material
production value
Wood
production
V w o o d = G × P × ( A 1 × d 1 + A 2 × d 2 )
Fishery V F i s h e r y = P f × ( A 1 × d 1 + A 2 × d 2 )
Regulating serviceSoil
conservation value
Soil
conservation
V S o i l = ( A 1 × d 1 + A 2 × d 2 ) × ( X 1 X 2 ) × P 1 / P b
Fertilizer
conservation
V F = ( A 1 × d 1 + A 2 × d 2 ) × S N P K × d × P b × P
wave
absorbing revetment
Mangrove
shoreline
V w a v e = ( L 1 × d 1 + L 2 × d 2 ) × ( C 1 + C 2 )
Climate
regulation
CO2 V C O 2 = ( A 1 × d 1 + A 2 × d 2 ) × T × C
O2 V O 2 = ( A 1 × d 1 + A 2 × d 2 ) × M × P 0
CH4 V C H 4 = ( A 1 × d 1 + A 2 × d 2 ) × Q × 21 × T
Pollution
purification
Degrade
pollutants
V P u r i f i c a t i o n = ( A 1 × d 1 + A 2 × d 2 ) × S
Water
conservation
Water V W a t e r = A × R × P w
Supporting
service
Biodiversity ConservationHabitat V H a b i t a t = ( A 1 × d 1 + A 2 × d 2 ) × P h
Nutrient
accumulation
Nutrient V N u t r i e n t = ( A 1 × d 1 + A 2 × d 2 ) × S t × P
Cultural
service
CulturalScientific
Research
and education
V S c i e n c e = A × P s
RecreationRecreation V R e c r e a t i o n = A × P r
Table 4. Confusion matrix of mangrove classification results.
YearActual TypeMangroveNon-
Mangrove
TotalUser’s
Accuracy
Producer’s
Accuracy
Overall
Accuracy
Kappa
Coefficient
2016mangrove2101422493.75%89.36%93.05%0.86
non-mangrove2531233792.58%95.71%
2020mangrove215922495.98%92.67%95.37%0.90
non-mangrove1732033794.96%97.26%
Table 5. Changes in spatial pattern during 2016–2020.
Spatial IndicesYear of 2016Year of 2020Proportion of Changes
Abundance of mangrove (ha/km)3.703.915.71%
Number of patches (pcs)101810604.13%
Average patch area (ha)6.146.373.80%
Mangrove shoreline (km)578.90597.373.19%
Coastwards mangrove (ha)5436.975692.194.69%
Ideally distributed mangrove (ha)5114.9725201.3984.20%
Table 6. Changes in ESV during 2016–2020 (unit: million USD).
Service20162020
ValueProportionValueProportion
Wood3.250.89%2.890.74%
Fishery117.8932.41%125.4732.11%
Soil consolidation0.110.03%0.120.03%
Fertilizer conservation76.7121.09%81.6320.89%
Wave absorbing revetment54.2014.90%55.6014.23%
Carbon fixation24.456.72%25.756.59%
Oxygen release11.333.11%17.384.45%
Methane release−1.24−0.34%−1.32−0.34%
Pollution purification36.339.99%38.669.89%
Water conservation19.805.44%21.405.48%
Habitat10.582.91%11.702.99%
Nutrient accumulation0.670.18%0.720.18%
Scientific research2.970.82%3.210.82%
Recreation6.721.85%7.551.93%
Total363.78390.74
Disclaimer/Publisher’s Note: The statements, opinions and data contained in all publications are solely those of the individual author(s) and contributor(s) and not of MDPI and/or the editor(s). MDPI and/or the editor(s) disclaim responsibility for any injury to people or property resulting from any ideas, methods, instructions or products referred to in the content.

