Article

IMERG V07B and V06B: A Comparative Study of Precipitation Estimates Across South America with a Detailed Evaluation of Brazilian Rainfall Patterns

by
José Roberto Rozante
1,* and
Gabriela Rozante
2
1
Center for Weather Forecast and Climate Studies, National Institute for Space Research, Rodovia Presidente Dutra, Km 40, SP-RJ-CEP, Cachoeira Paulista 12630-000, SP, Brazil
2
Faculty of Architecture, Arts, Communication, and Design, Sao Paulo State University (UNESP), Bauru 17000-000, SP, Brazil
*
Author to whom correspondence should be addressed.
Remote Sens. 2024, 16(24), 4722; https://doi.org/10.3390/rs16244722
Submission received: 18 September 2024 / Revised: 10 December 2024 / Accepted: 11 December 2024 / Published: 17 December 2024

Abstract

:
Satellite-based precipitation products (SPPs) are essential for climate monitoring, especially in regions with sparse observational data. This study compares the performance of the latest version (V07B) and its predecessor (V06B) of the Integrated Multi-satellitE Retrievals for GPM (IMERG) across South America and the adjacent oceans. It focuses on evaluating their accuracy under different precipitation regimes in Brazil using 22 years of IMERG Final data (2000–2021), aggregated into seasonal totals (summer, autumn, winter, and spring). The observations used for the evaluation were organized into 0.1° × 0.1° grid points to match IMERG’s spatial resolution. The analysis was restricted to grid points containing at least one rain gauge, and in cases where multiple gauges were present within a grid point the average value was used. The evaluation metrics included the Root Mean Square Error (RMSE) and categorical indices. The results reveal that while both versions effectively capture major precipitation systems such as the mesoscale convective system (MCS), South Atlantic Convergence Zone (SACZ), and Intertropical Convergence Zone (ITCZ), significant discrepancies emerge in high-rainfall areas, particularly over oceans and tropical zones. Over the continent, however, these discrepancies are reduced due to the correction of observations in the final version of IMERG. A comprehensive analysis of the RMSE across Brazil, both as a whole and within the five analyzed regions, without differentiating precipitation classes, demonstrates that version V07B effectively reduces errors compared to version V06B. The analysis of statistical indices across Brazil’s five regions highlights distinct performance patterns between IMERG versions V06B and V07B, driven by regional and seasonal precipitation characteristics. V07B demonstrates a superior performance, particularly in regions with intense rainfall (R1, R2, and R5), showing a reduced RMSE and improved categorical indices. These advancements are linked to V07B’s reduced overestimation in cold-top cloud regions, although both versions consistently overestimate at rain/no-rain thresholds and for light rainfall. However, in regions prone to underestimation, such as the interior of the Northeastern region (R3) during winter, and the northeastern coast (R4) during winter and spring, V07B exacerbates these issues, highlighting challenges in accurately estimating precipitation from warm-top cloud systems. This study concludes that while V07B exhibits notable advancements, further enhancements are needed to improve accuracy in underperforming regions, specifically those influenced by warm-cloud precipitation systems.

1. Introduction

Precipitation plays a fundamental role in the hydrological cycle and in sustaining life on planet Earth. It constitutes the primary means of replenishing water resources, nourishing rivers, lakes, and aquifers essential for terrestrial and aquatic ecosystems, as well as for agriculture, industry, and human consumption [1]. Furthermore, precipitation regulates the surface temperature and directly influences global climate [2,3]. However, despite its vital importance, there is a significant lack of precipitation measurements in critical regions such as deserts [4,5], dense tropical forests [6], and vast oceanic areas [7]. This data gap limits our understanding of global precipitation patterns and hinders the development of more accurate climate models.
The scarcity of in situ measurements in these challenging environments is attributed to various factors, including logistical difficulties, high costs of maintaining equipment in remote areas, and extreme conditions that can damage measuring instruments [8]. Given these limitations, satellite precipitation estimates emerge as a promising solution to fill these observational gaps [9,10,11]. Advanced remote sensing technologies have been developed to monitor precipitation on a global scale, providing valuable data that complement ground-based measurements. Satellites offer the advantage of covering vast, hard-to-reach areas and providing continuous, high-temporal-resolution information [12,13,14,15]. This approach not only enhances our ability to monitor and predict extreme weather events but also contributes to the development of more efficient, sustainable water resource management policies [16,17].
Currently, several satellite precipitation products (SPPs) are available. Each utilizes different methodologies and combinations of data to provide accurate and real-time global precipitation estimates. Some of the main products available are as follows. Integrated Multi-satellitE Retrievals for Global Precipitation Measurements (GPM-IMERG), available by the National Oceanic and Atmospheric Administration (NOAA): This product, operational since 2014, combines data from multiple satellites to provide global precipitation estimates with a high temporal (30 min) and spatial (0.1 degrees) resolution. GPM-IMERG covers data from 2014 to the present [18]. Global Satellite Mapping of Precipitation (GSMaP), developed by the Japan Aerospace Exploration Agency (JAXA), has been operational since 2003. GSMaP offers global precipitation estimates with a high spatial resolution of 10 km and a temporal resolution of 1 h, covering data from 2000 to the present [10,19]. CPC MORPHing technique (CMORPH): This product, developed by the Climate Prediction Center (CPC) of NOAA, has been available since 2002. It uses microwave data from polar-orbiting satellites combined with infrared data from geostationary satellites to provide near-real-time global precipitation estimates with a temporal resolution of 30 min and a spatial resolution of 0.07277 degrees. CMORPH covers data from 2002 to the present [20]. Precipitation estimation from Remotely Sensed Information using Artificial Neural Networks (PERSIANN): This system, operational since the early 2000s, uses machine-learning techniques to combine data from geostationary and polar-orbiting satellites, providing global precipitation estimates with a temporal resolution of 3 h and a spatial resolution of 0.25 degrees. PERSIANN covers data from 2000 to the present [21]. Tropical Rainfall Measuring Mission Multi-satellite Precipitation Analysis (TRMM-TMPA): Although the TRMM mission, which began in 1997, ended in 2015, TMPA data continue to be used and analyzed for historical tropical precipitation studies. TMPA provides precipitation estimates with a temporal resolution of 3 h, a spatial resolution of 0.25 degrees, and covers data from 1998 to 2019 [22]. Climate Hazards Group InfraRed Precipitation with Station data (CHIRPS): This product, operational since 1981, combines satellite data with station data to provide a high-resolution (0.05 degrees) precipitation time series. CHIRPS covers data from 1981 to the present [23]. Global Precipitation Climatology Project (GPCP): The GPCP, available since 1979, provides long-term global precipitation data by combining satellite and surface observations with a monthly temporal resolution and a spatial resolution of 2.5 degrees. The GPCP covers data from 1979 to the present [24]. These products are essential for a wide range of applications, including disaster forecasting, water resource management, agriculture, climate modeling, and hydrological studies.
Among the existing global SPPs, IMERG is one of the most widely used, both in research and operational applications [25]. This extensive use is due to the product being generated in three distinct stages, each catering to different needs. The first stage, called “early run” has a 4-h delay and is intended for immediate operational use. The second stage, known as “late run”, has a 14-h delay, offering a balance between speed and accuracy. The third and final stage, called “final run”, is the most used in research due to its high precision, although it has a delay of several months. This final stage incorporates rain gauge data in its formulation, further enhancing the accuracy of precipitation estimates [18]. This flexible structure allows IMERG to serve a wide range of applications, from real-time monitoring to detailed climate studies.
Although SPPs are indispensable tools in various geoscience fields, they frequently exhibit errors, particularly in mountainous regions [8,26,27]. Therefore, they must be carefully evaluated and corrected [28]. Evaluating the performance of SPPs is crucial to infer the reliability of such estimates and to use them effectively in water resource management, extreme event characterization, or weather forecasting [29]. Evaluations are generally conducted by comparing the estimates with rain gauge data, while corrections can be made using various bias removal techniques, such as statistical calibration [30,31,32], observational data fusion [33,34,35], and machine learning [36,37,38].
Recently, in mid-2023, the IMERG SSP was updated from version V06 [39] to version V07 [40]. The significant updates encompass several key improvements: an enhanced inter-calibration process to address known biases, a corrected gridding process to resolve spatial offsets, an upgraded IR precipitation retrieval scheme utilizing a modern algorithm, the integration of passive microwave (PMW) retrievals into the Kalman filter to enhance consistency, and the elimination of PMW retrieval masking over frozen surfaces. The IMERG V06 version has been widely used and evaluated by numerous studies, both globally [41,42] and regionally [43,44,45], demonstrating well-understood and accepted behavior by the scientific community. However, the new V07 version, although already the subject of some preliminary studies [46,47], still requires additional evaluations to validate its improvements and adjustments. Given this scenario, the objective of this work is to evaluate and compare the performance of both versions (V06B and V07B) of IMERG Final in Brazil, considering the different precipitation regimes present in the country. This analysis is crucial to validate the accuracy and reliability of the estimates provided by the new version, ensuring its applicability across various climatic regions of Brazil. This paper is organized into five sections. Following this introduction in Section 1, Section 2 describes the study area, precipitation regimes, observed data, SPPs, and statistical metrics. Section 3 presents the results of product comparisons over South America and the evaluation/validation specific to Brazil. Finally, the discussions and main conclusions are summarized in Section 4 and Section 5.

2. Materials and Methods

The precipitation from two versions of IMERG Final (V06B and V07B) was compared on a seasonal scale over South America and the adjacent oceans, and evaluated under different precipitation regimes in Brazil. The study period spanned from 2 June 2000 to 30 September 2021. Daily data (accumulated from 12Z of the previous day to 12Z of the current day) were considered for both observed and estimated values, which were subsequently converted to summer (DJF), autumn (MAM), winter (JJA), and spring (SON).

2.1. Study Area and Characterization of Precipitation Regimes

Brazil’s vast territorial (8,515,759 km2) extent and climatic diversity give rise to highly heterogeneous precipitation regimes, characterized by distinct patterns of seasonality, intensity, and frequency across its regions. To effectively evaluate the performance of SPPs, it is crucial to classify these regimes, as analyzing the country as a whole risks obscuring critical regional variations and hindering the identification of errors or inconsistencies. By accounting for regional specificities, such as the prolonged dry periods in the semi-arid Northeast, the intense rainfall in the Amazon, and the more evenly distributed precipitation in the subtropical South, this approach enables more accurate assessments of SPP performance and ensures regionally tailored analyses. In this context, this study adopts the precipitation regimes classified into five regions as presented by Rozante et al. [48]. According to the authors, this classification is based on the analysis of histograms representing the distribution of average monthly precipitation for each 2-degree grid box, derived from the MERGE product [33]. This product, operationally integrated at Instituto Nacional de Pesquisas Espaciais (INPE), combines satellite precipitation estimates with surface observations, currently covering all of South America and the adjacent oceans. With a spatial resolution of 10 km, it provides a continuous data record from June 2000 to the present.
Figure 1 depicts the spatial distribution of precipitation climatology over Brazil based on MERGE data. Region R1 (blue): Located in Southern Brazil, it experiences well-distributed precipitation all year round. Influencing systems include cold fronts, the mesoscale convective system (MCS), the South Atlantic Convergence Zone (SACZ), and the low-level jet stream. Region R2 (green): Covering most of Brazil, this region has a clear monsoon regime, with higher precipitation in summer (DJF) and lower precipitation in winter (JJA). Region R3 (black): The driest region, located inland in Northeastern Brazil, has a summer precipitation maximum and a winter precipitation minimum. Key systems are the Intertropical Convergence Zone (ITCZ) and upper-level cyclonic vortices. Region R4 (orange): On the northeastern coast, this region sees maximum precipitation in winter and minimum precipitation in summer. Influencing systems include the ITCZ, tropical MCS, Trade Winds, upper-level cyclonic vortices, easterly waves, and sea breeze circulation. Region R5 (red): Located in Northern Amazonia, this region is influenced by the ITCZ, tropical squall lines, and Trade Winds.

2.2. Ground-Based Observations

The observation database includes data from conventional rain gauges (daily) and automatic data collection platforms (PCDs) (hourly). This database belongs to the INPE and was obtained from various sources, including the Regional Meteorology Centers, National Water and Sanitation Agency (ANA), Department of Water and Electricity (DAEE), Paraná Meteorological System (SIMEPAR), Natural Disaster Monitoring Networks operation (CEMADEN), Institute of the Environment and Water Resources (INEMA), Integrated Center for Agrometeorological Information (CIIAGRO), and Company of Agricultural Research and Rural Extension of Santa Catarina (EPAGRI). For this study, hourly frequency data were aggregated into 24-h intervals, as recommended by the World Meteorological Organization. This corresponds to the period from 12Z of the previous day to 12Z of the current day.
The observed data used in this study underwent INPE’s operational quality control system, which consists of two stages, as described in Rozante et al. (2018) [48]. The first stage involves real-time verification at the data storage point, including checks for validity, internal and spatial consistency, and temporal and climatological control. Validity checks ensure data fall within acceptable tolerance ranges, while internal consistency checks verify the relationships between variables at a single station. Spatial consistency is assessed by comparing data across stations within a specified radius, and temporal control evaluates changes in data over time. After this objective analysis, data are classified with quality descriptors such as “suspect” or “correct”. In the subjective stage, a meteorologist conducts a detailed review of flagged data to determine their final validity, enabling a nuanced quality assessment.
The observations were organized into grid points of 0.1° × 0.1° to match the spatial resolution of IMERG products. The evaluation was restricted to grid points that contained at least one rain gauge. In cases where a grid point contained multiple rain gauges, the average value was used for analysis. Figure 2 shows the result of this procedure, allowing for the simultaneous analysis of the spatial distribution of rain gauges and the number of measurements taken over the study period in Brazil. A higher density of observations and a greater number of records are observed in the Southern, Southeastern, and Northeastern regions of the country. These areas show a high concentration of points, indicating denser rain gauge monitoring. As one moves towards the interior of the country, a reduction in both the density and the number of measurements is noted. This decrease can be attributed to various factors, including a lower monitoring infrastructure in these regions and potential logistical challenges. The distribution pattern presented in the figure reflects the spatial variation in rain gauge coverage across Brazil, highlighting the need for the expansion and better distribution of the monitoring network to achieve a more homogeneous and representative coverage throughout the entire country.
Figure 3 shows the temporal evolution of the number of grid points with rain gauges throughout the entire study period. In general, all regions, except R3, indicate an increase in the number of grid points with observations over the years. This partial behavior is more evident from 2014 onwards due to the installation of automatic data collection platforms. Starting in 2020, a decrease in the number of grid points is observed in regions R2, R3, and R4. This decline may be associated with various factors, such as (a) disruptions in data collection systems, (b) changes in the observation network, (c) the impact of the COVID-19 pandemic (where many field measurements were not conducted and maintenance of automatic stations was disrupted), or (d) even a combination of these factors.

2.3. IMERG Satellite Data

IMERG is an algorithm that combines data from the GPM satellite constellation to estimate precipitation across most of the Earth’s surface. It provides a spatial resolution of 0.1° (~10 km) and a temporal resolution of 30 min. The results of this algorithm are available in three runs—Early (~4 h after observation time), Late (~14 h after observation time), and Final (~3.5 months after observation time)—each designed to meet different user needs (Tan et al., 2019). The Final run, post-real-time, utilizes the monthly rain gauge analysis from the Global Precipitation Climatology Center (GPCC) and ancillary data from the European Centre for Medium-Range Weather Forecasts (ECMWF) for calibration. The IMERG system has undergone five significant updates since its inception, reflecting continuous advancements in satellite precipitation estimation technology. The first version, IMERG V03, laid the foundation of the system, combining data from various satellites to provide global precipitation estimates. Subsequent updates, culminating in IMERG V07 (released in July 2023), incorporated algorithm improvements, enhanced data accuracy, and new information sources. In this study, the performances of the IMERG V06B [39] and V07B [40] versions were evaluated, both of which can be found at https://disc.gsfc.nasa.gov/datasets (accessed on 10 December 2024). IMERG data, recorded at 30 min intervals, were aggregated into 24-h periods, using the same criteria as the observational data.

2.4. Statistical and Categorical Indices

To evaluate the performance of the SPPs, the Root Mean Square Error (RMSE) was used. Although the RMSE (Table 1) is most commonly applied to continuous variables, such as temperature, humidity, and atmospheric pressure, it can also be useful for identifying and quantifying errors in discrete variables such as precipitation. Additionally, other categorical indices, which are more commonly used in precipitation evaluation studies, were employed. Among these indices, this study utilized the Probability of Detection (POD), False Alarm Ratio (FAR), Relative Bias (BIAS), and Critical Success Index (CSI). All the values of these categorical indices are obtained from a contingency table (Table 2), and their equations and optimal values are summarized in Table 3. These indices were calculated and analyzed for eight precipitation thresholds (0.5, 2.0, 5.0, 10.0, 15.0, 20.0, 35.0, and 50.0 mm). For further analysis, these thresholds were consolidated into broader categories—no rain/rain, light, moderate, and heavy rain—as shown in Table 4.
To facilitate the interpretation of the results, Roebber’s performance diagram [49] was employed. This diagram allows for the exploration of the geometric relationship among four performance metrics in dichotomous forecasts: POD, FAR, BIAS, and CSI. The best performances are indicated by indices approaching 1, with a perfect performance located in the upper right corner of the diagram. In the chart, BIAS is represented by dashed lines, where BIAS > 1 indicates overestimations, and BIAS < 1 indicates underestimations. Another index analyzed was the adjusted equitable threat score (ETSa) (Table 3). The ETSa [50] is a modified version of the equitable threat score (ETS), designed to mitigate the impact of BIAS, thereby enabling a more equitable comparison between different models or versions of the same model. This adjustment ensures that the final score is not influenced by BIAS, leading to a more accurate evaluation of the model’s true predictive capability, independent of any systematic tendencies.

3. Results

The results of this study are initially presented through a comparison between the IMERG V06B and V07B versions over South America and the adjacent oceans, followed by an in-depth assessment of these versions specifically over Brazil. This assessment encompasses both spatial and temporal errors, as well as categorical evaluations across the five previously mentioned regions.

3.1. Comparison of IMERG V06B and V07B over South America

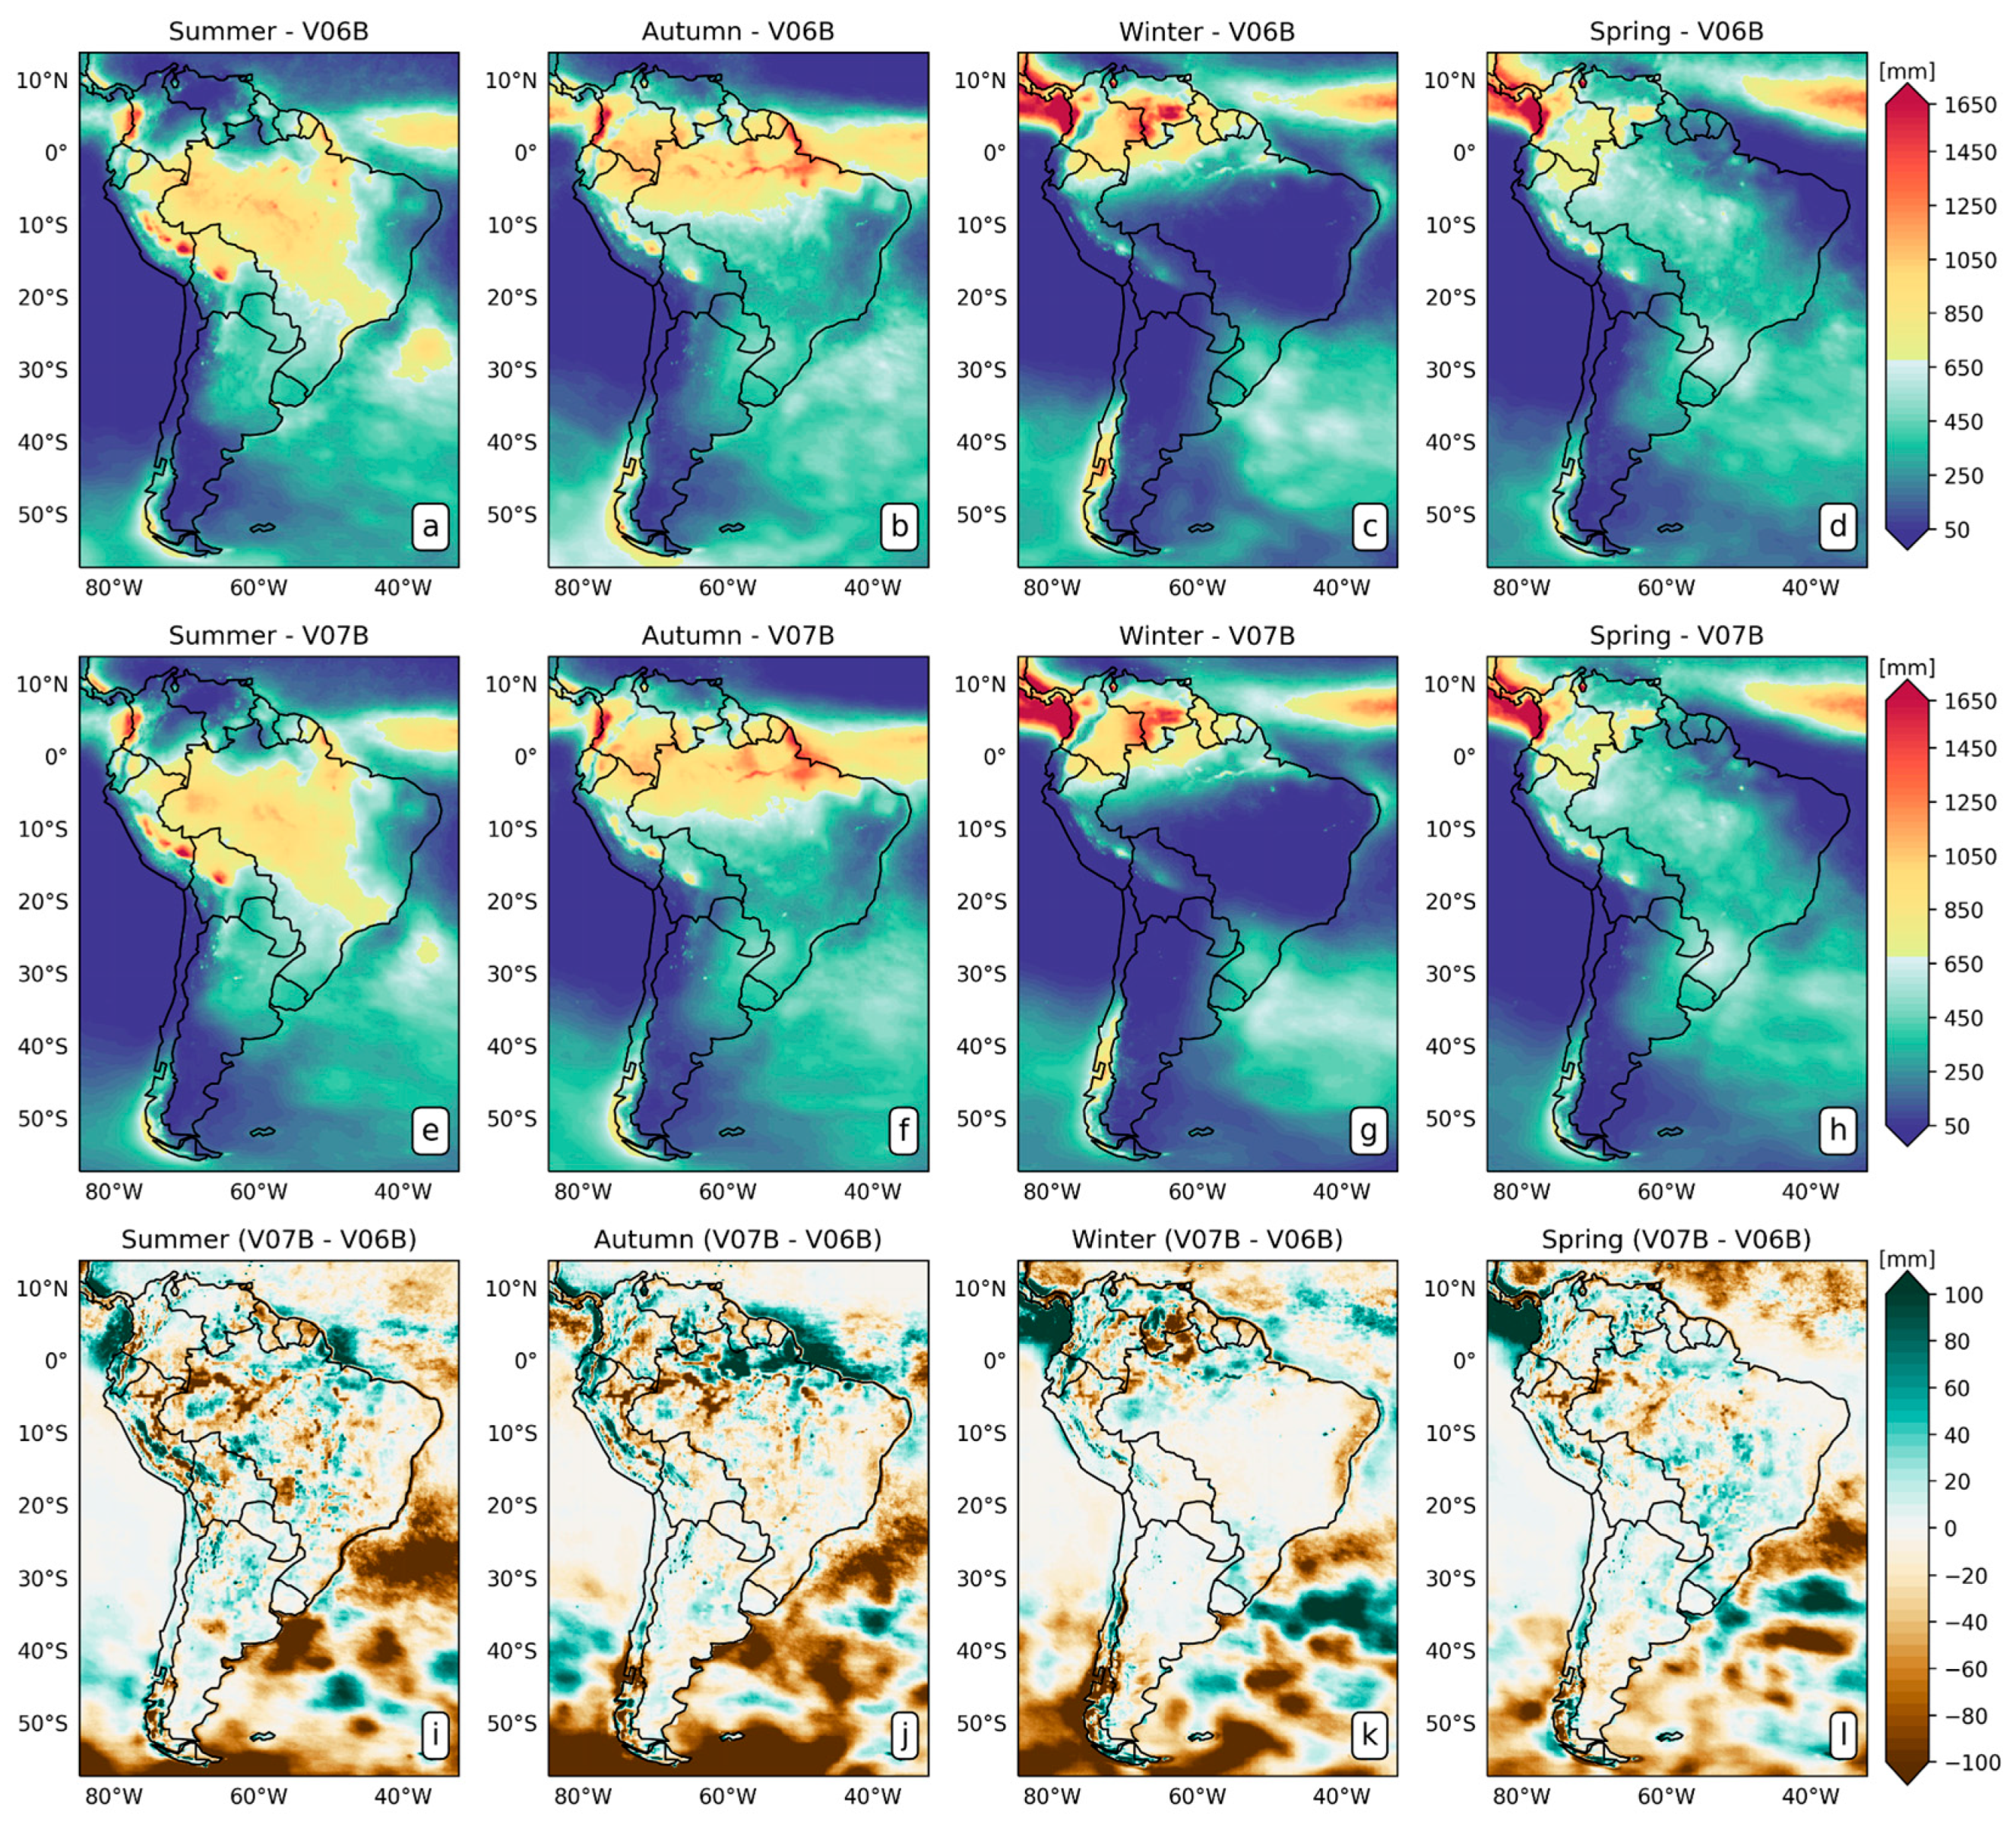
Figure 4 shows the spatial distribution of the seasonal accumulated precipitation average over the entire study period for the V06B (Figure 4a–d) and V07B (Figure 4e–h) versions, along with their differences (Figure 4i–l). This figure indicates that in both versions the positioning of the main precipitating systems, such as the SACZ, ITCZ, and MCS, is consistent when compared with climatological studies based on observations, such as those conducted by Ferreira et al. (2023) and Córdoba et al. (2022) [49,50]. However, a notable exception is observed during the winter months (Figure 4c,g,k) over the eastern region of Northeast Brazil. In this area, precipitation during these months is linked to warm-top clouds formed by easterly waves. In such cases, satellites are often unable to fully detect rain, as the temperature surpasses infrared detection thresholds and the limited ice content in the atmosphere hinders passive microwave sensor detection. Consequently, satellite products only partially capture precipitation [51].
By analyzing the differences between the versions (Figure 4i–l), it can be observed that the most significant discrepancies generally occur in regions with high rainfall rates, such as the equatorial zone over the Atlantic and Pacific Oceans, and areas with a low observation density, including the Northern region of Brazil. Over the continent, the differences are smaller, likely due to the correction of the final IMERG products using rain gauge data. Notably, with the exception of the equatorial belt and some areas of the Atlantic, version V06 generally provides higher precipitation estimates compared to version V07, a pattern also identified in similar studies by Wang et al. (2023) [46]. In the eastern portion of Northeast Brazil (Figure 4k), where precipitation estimates have the greatest uncertainties, version V07 slightly reduces the magnitude of precipitation during the winter months, which may suggest an even greater underestimation of precipitation rates in this region.
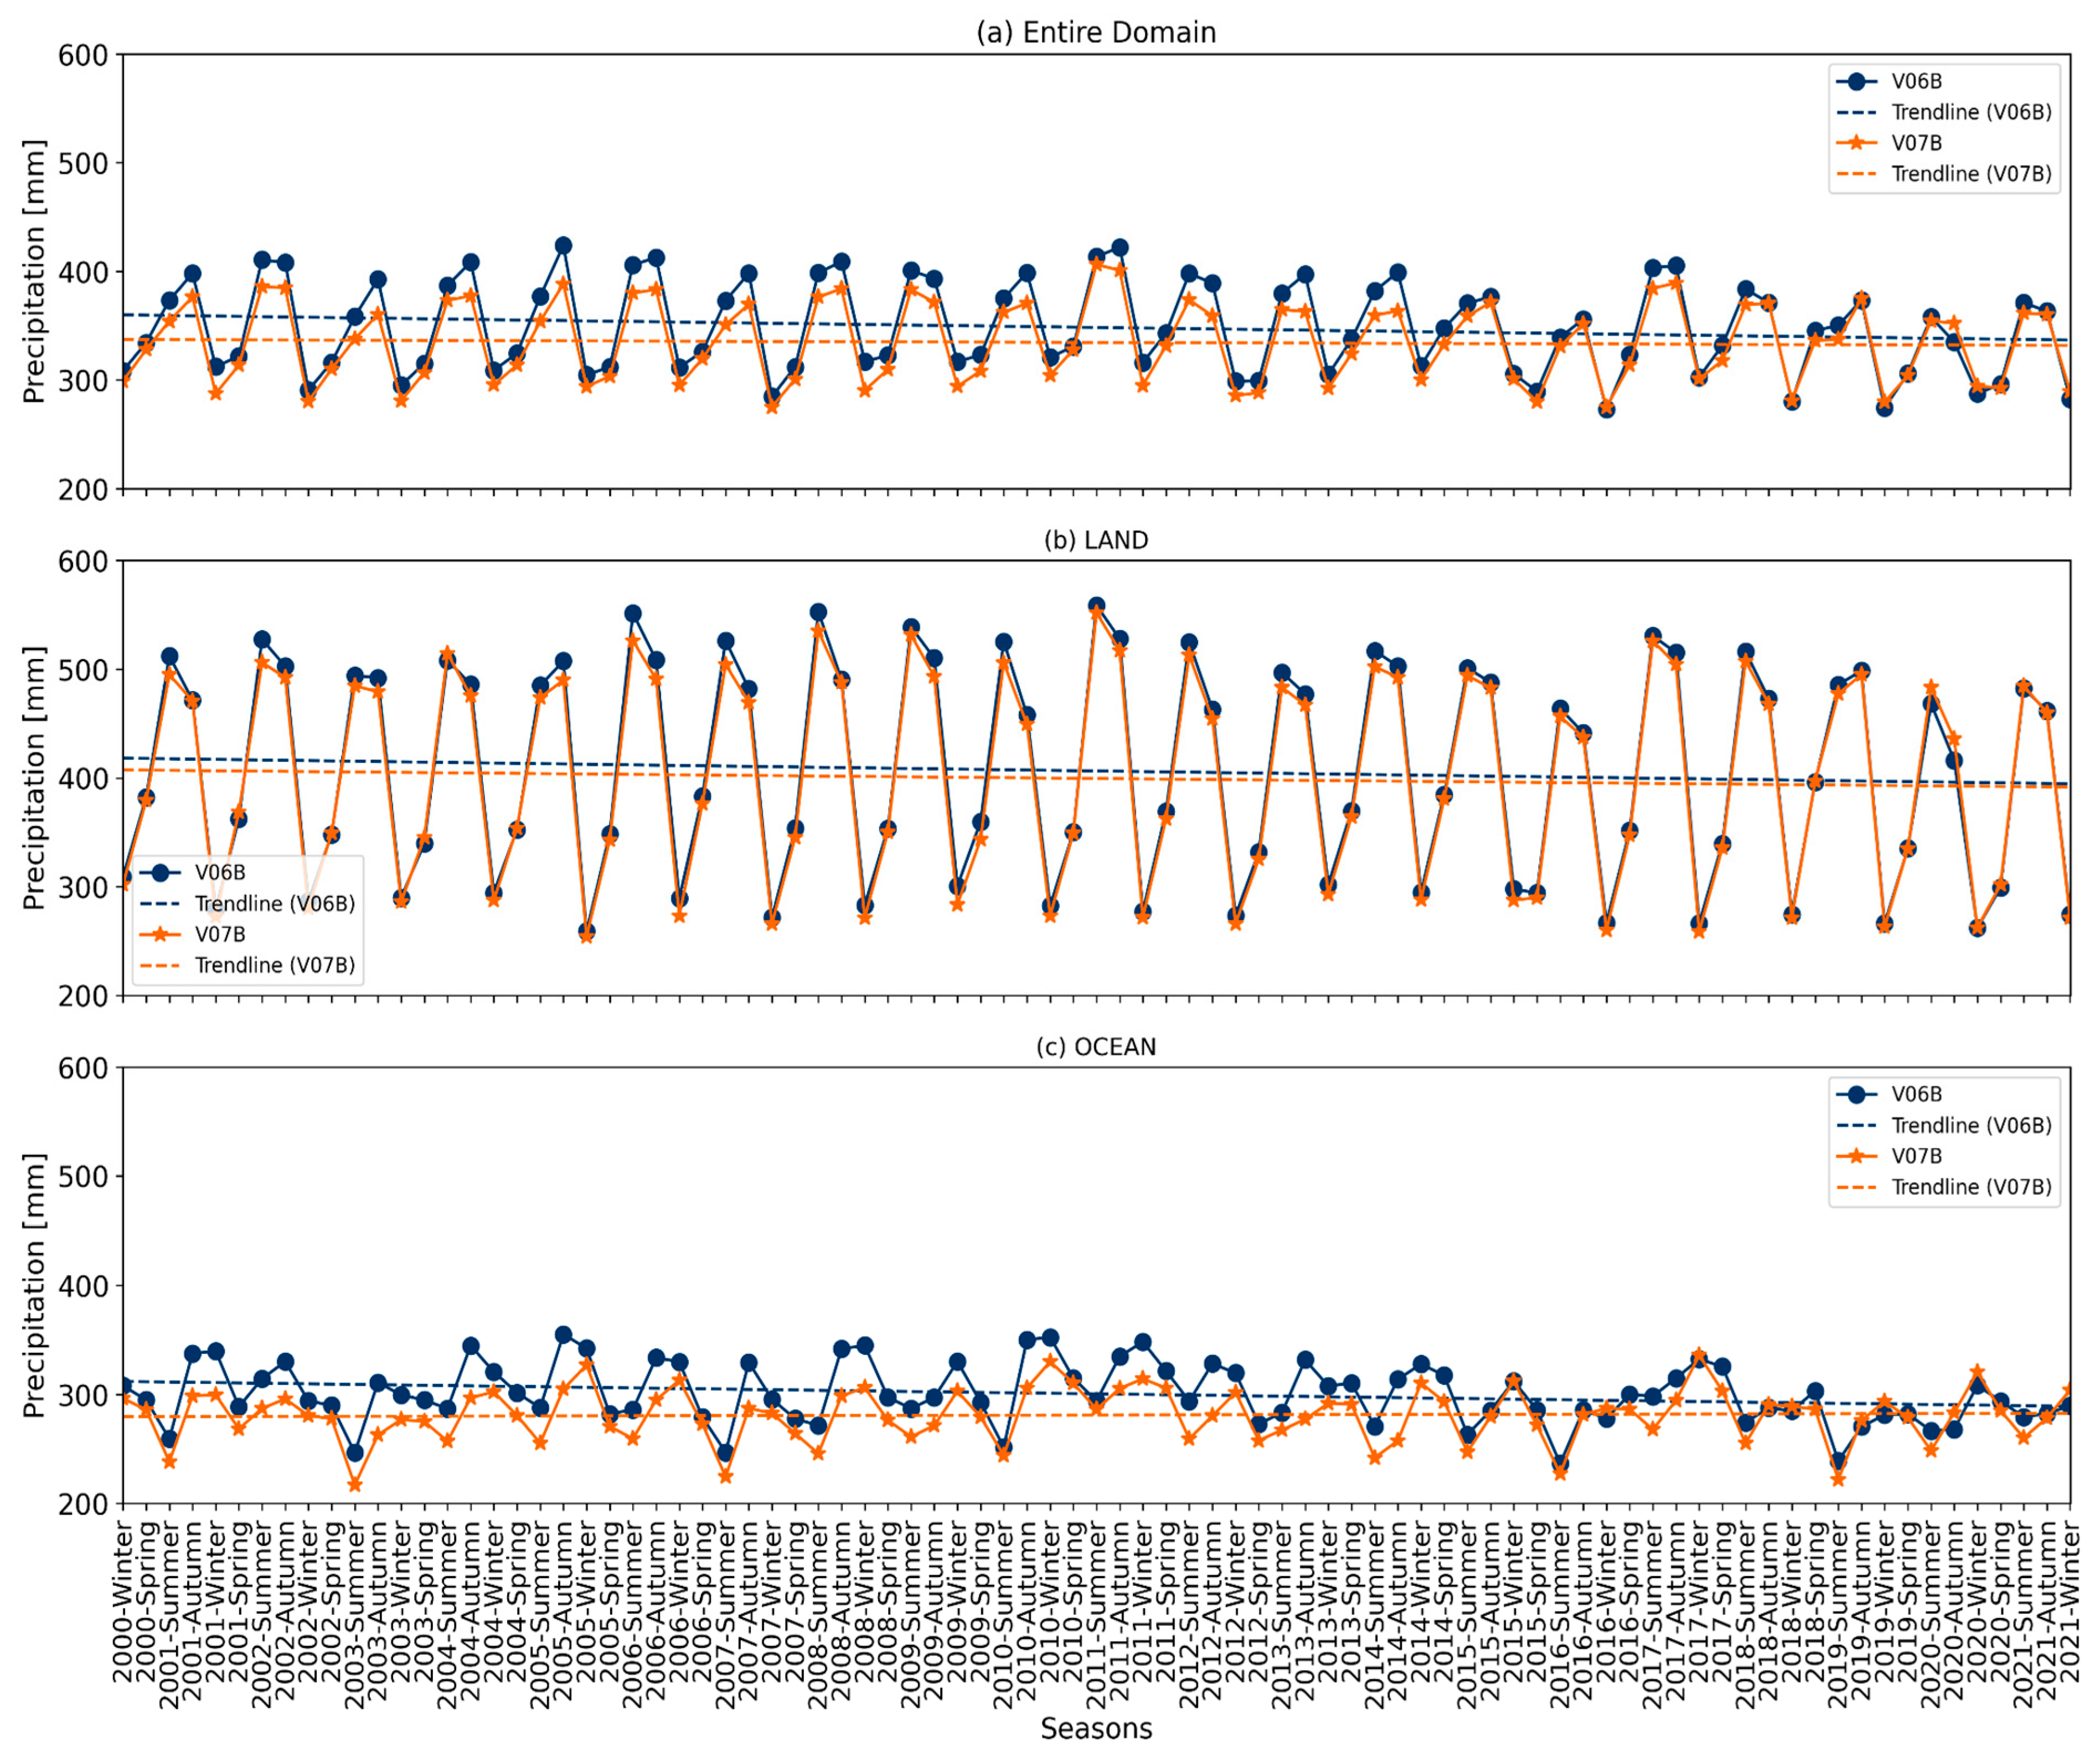
The temporal evolution of the spatial mean of accumulated seasonal precipitation, along with the trend lines for versions V06B and V07B, is shown in Figure 5. When analyzing the average over the entire domain (Figure 5a), version V06B consistently displays more intense precipitation, with an average difference of 14 mm, particularly during the summer and autumn seasons. Additionally, version V06B demonstrates a slight downward trend in precipitation over the years, a pattern not observed in version V07B. From the winter of 2014 onward, the discrepancies between the two versions diminish significantly. Over the continent (Figure 5b), the differences between the versions are markedly smaller, averaging approximately 7 mm. This reduction in discrepancies is likely due to the integration of rain gauge data in the final product. The trend lines for the continent reveal a slight decrease in precipitation over the period for both versions. The largest differences are found over the oceans (Figure 5c), where they average 20 mm and occasionally exceed 50 mm during the autumn seasons. The trend line indicates a decrease in precipitation over the years exclusively in version V06B.

3.2. Assessment of the Performance of IMERG V06B and V07B Versions over Brazil

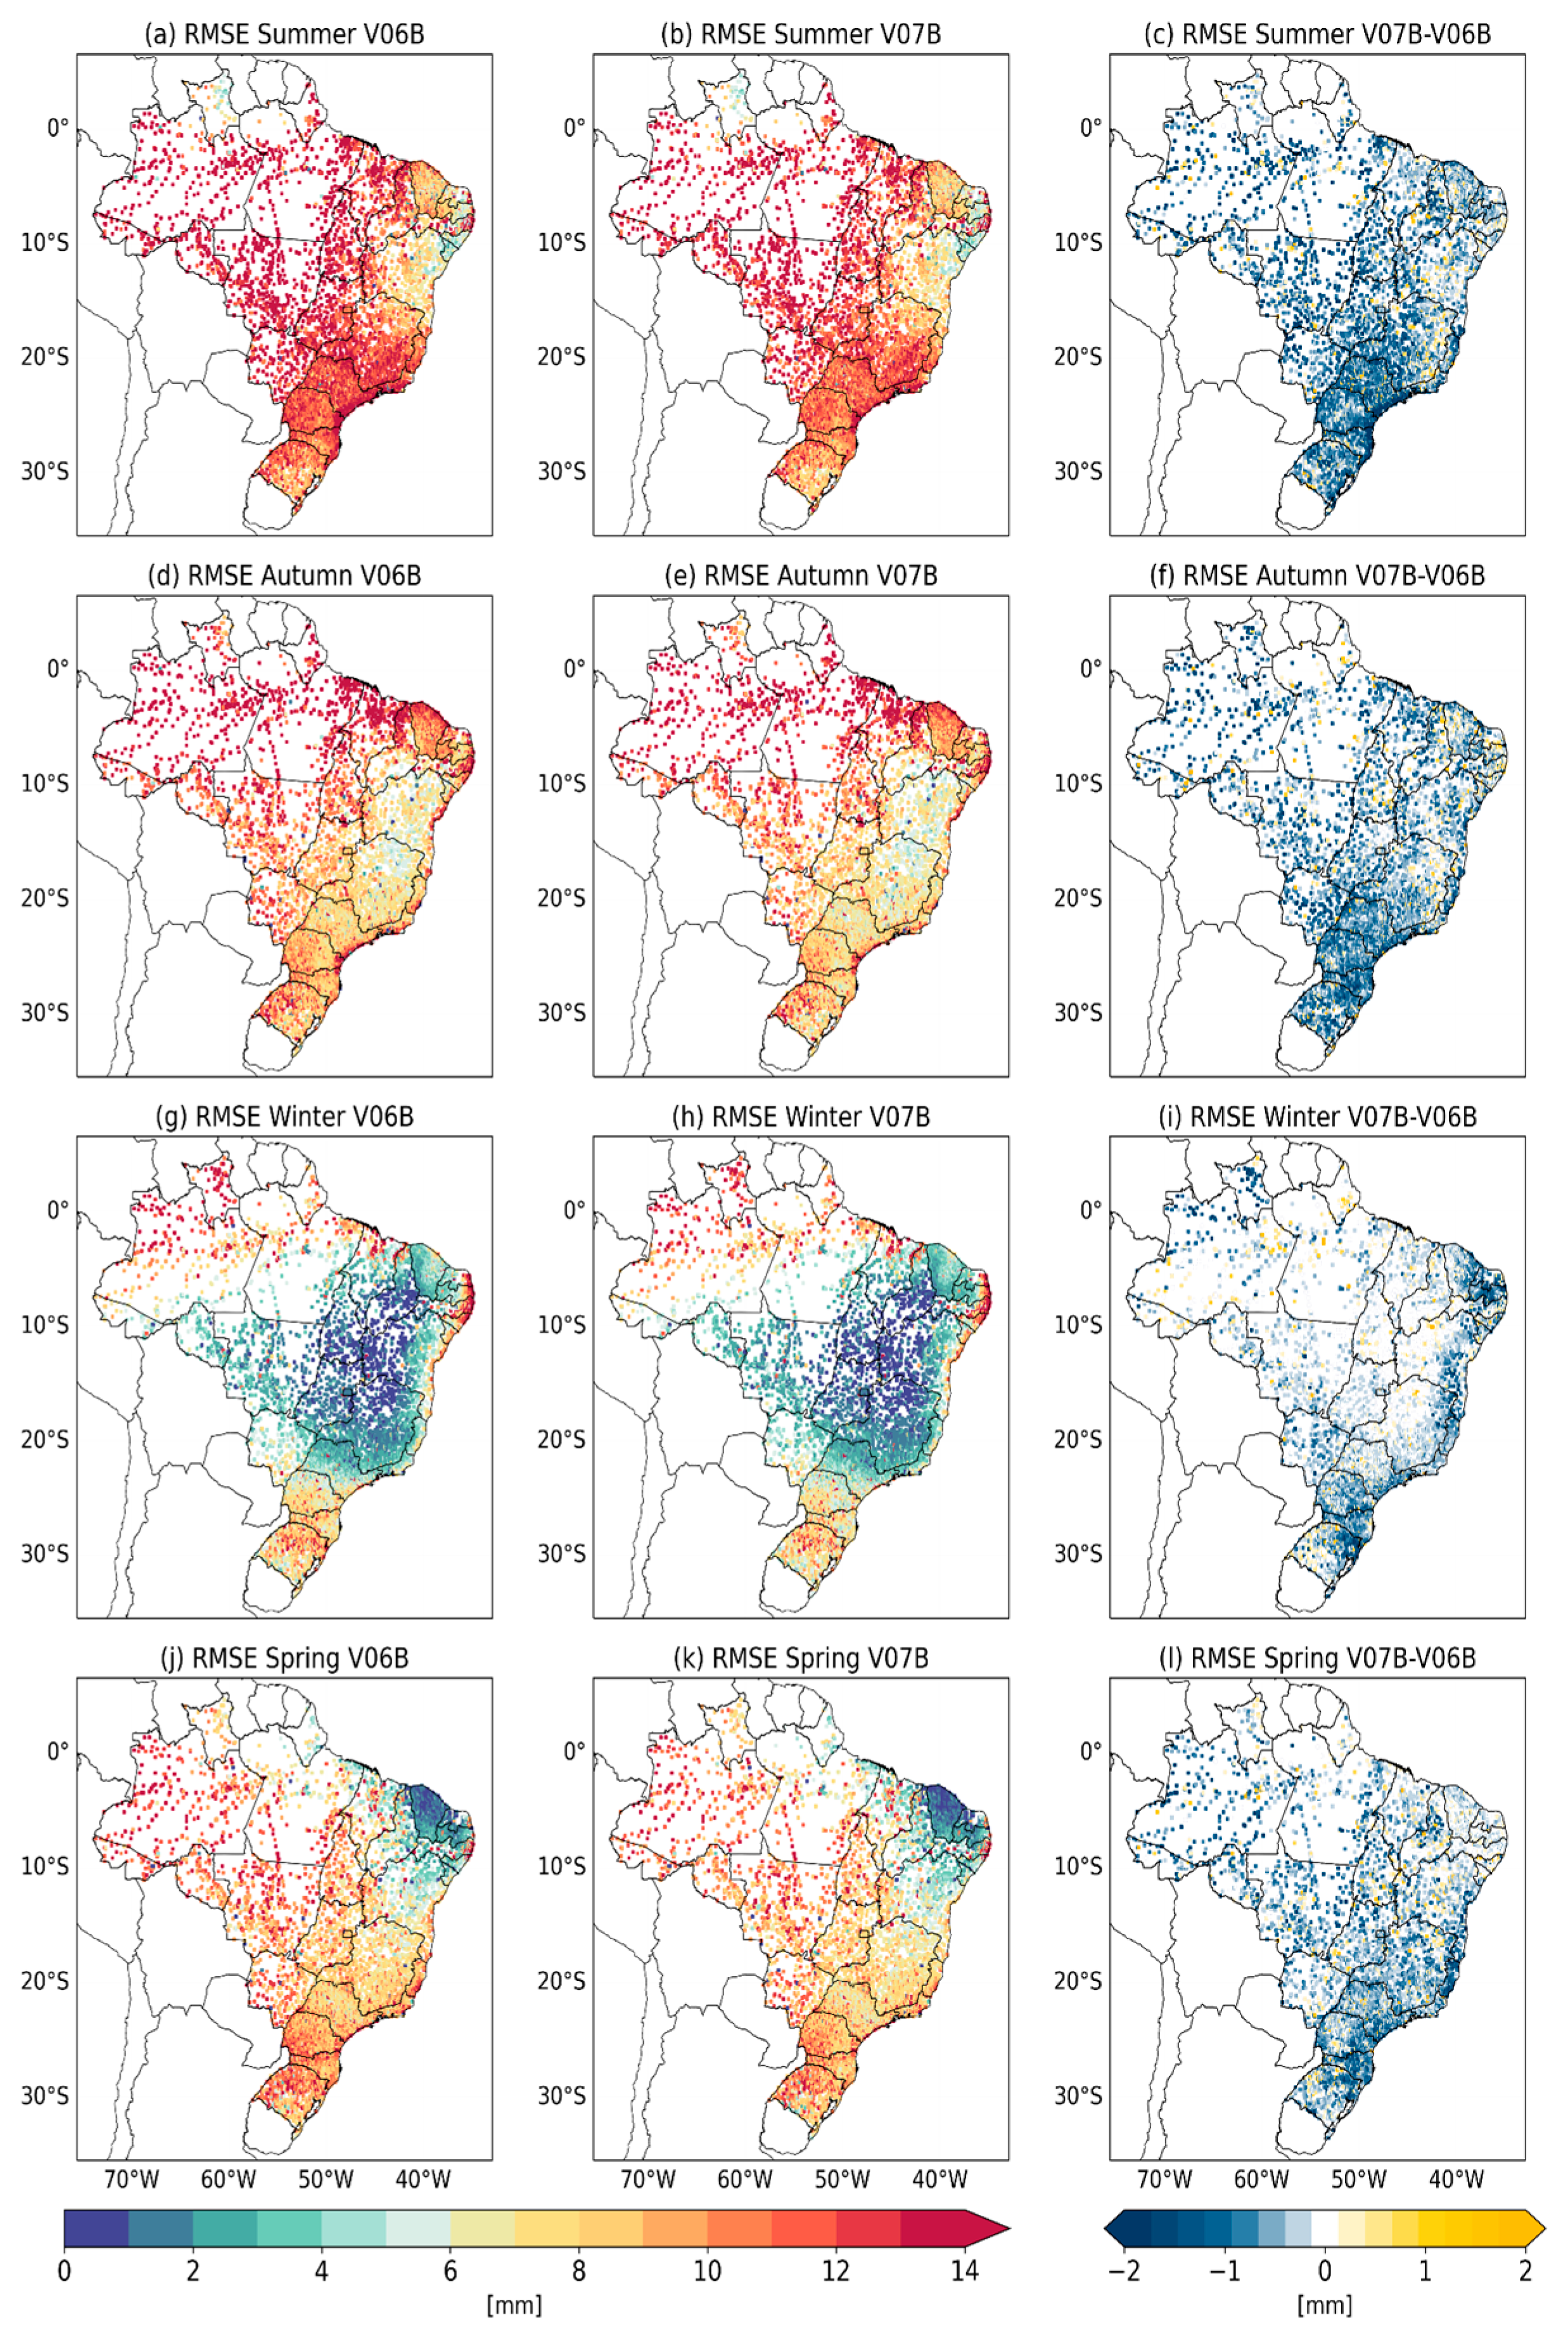
The spatial distributions of the seasonal precipitation RMSE for versions V06B and V07B, along with their differences, are shown in Figure 6. During summer (Figure 6a–c), a season characterized by the highest precipitation rates over Brazil (Figure 4a,e), the largest RMSE values (exceeding 13 mm/day) are observed, particularly in regions influenced by the South Atlantic Convergence Zone (SACZ). This pattern is evident in both versions (Figure 6a,b). The differences between the products (Figure 6c) reveal a significant improvement in version V07B compared to V06B, with RMSE reductions of up to 2 mm/day across various parts of the country, especially in the Southeast and parts of the North.
In autumn (Figure 6d–f), a reduction in RMSE magnitude is observed compared to the summer months, reflecting the decrease in rainfall volume in the Southern and Southeastern regions of Brazil. Similar to summer, the differences between the versions (Figure 6f) reveal a reduction in the RMSE in version V07B. During winter (Figure 6g–i), both versions exhibit the lowest RMSE values across Brazil, except in the eastern strip of the Northeast and the far Northern regions, where RMSE values can exceed 14 mm/day. In the eastern Northeast, satellite-based precipitation products (SPPs) tend to underestimate rainfall associated with warm-top clouds, whereas in the Northern regions they tend to overestimate precipitation linked to cold-top clouds. This behavior has been documented in several studies [33,48,52]. During this season, version V07B also demonstrates improvements over V06B.
During spring (Figure 6j–l), as rainfall activity resumes across the country, particularly in the Southern and Northern regions, RMSE values increase in these areas for both versions, with the lowest errors observed in version V07B. Overall, both versions exhibit similar spatial patterns of error distribution; however, version V07B demonstrates notable improvements over V06B across all seasons in Brazil. High RMSE values are primarily associated with overestimations caused by cold-top cloud precipitating systems, which are widespread across much of Brazil, and underestimations related to warm-top clouds, which are typically observed in the eastern portion of the Northeast, particularly during the winter months.

3.3. Region R1

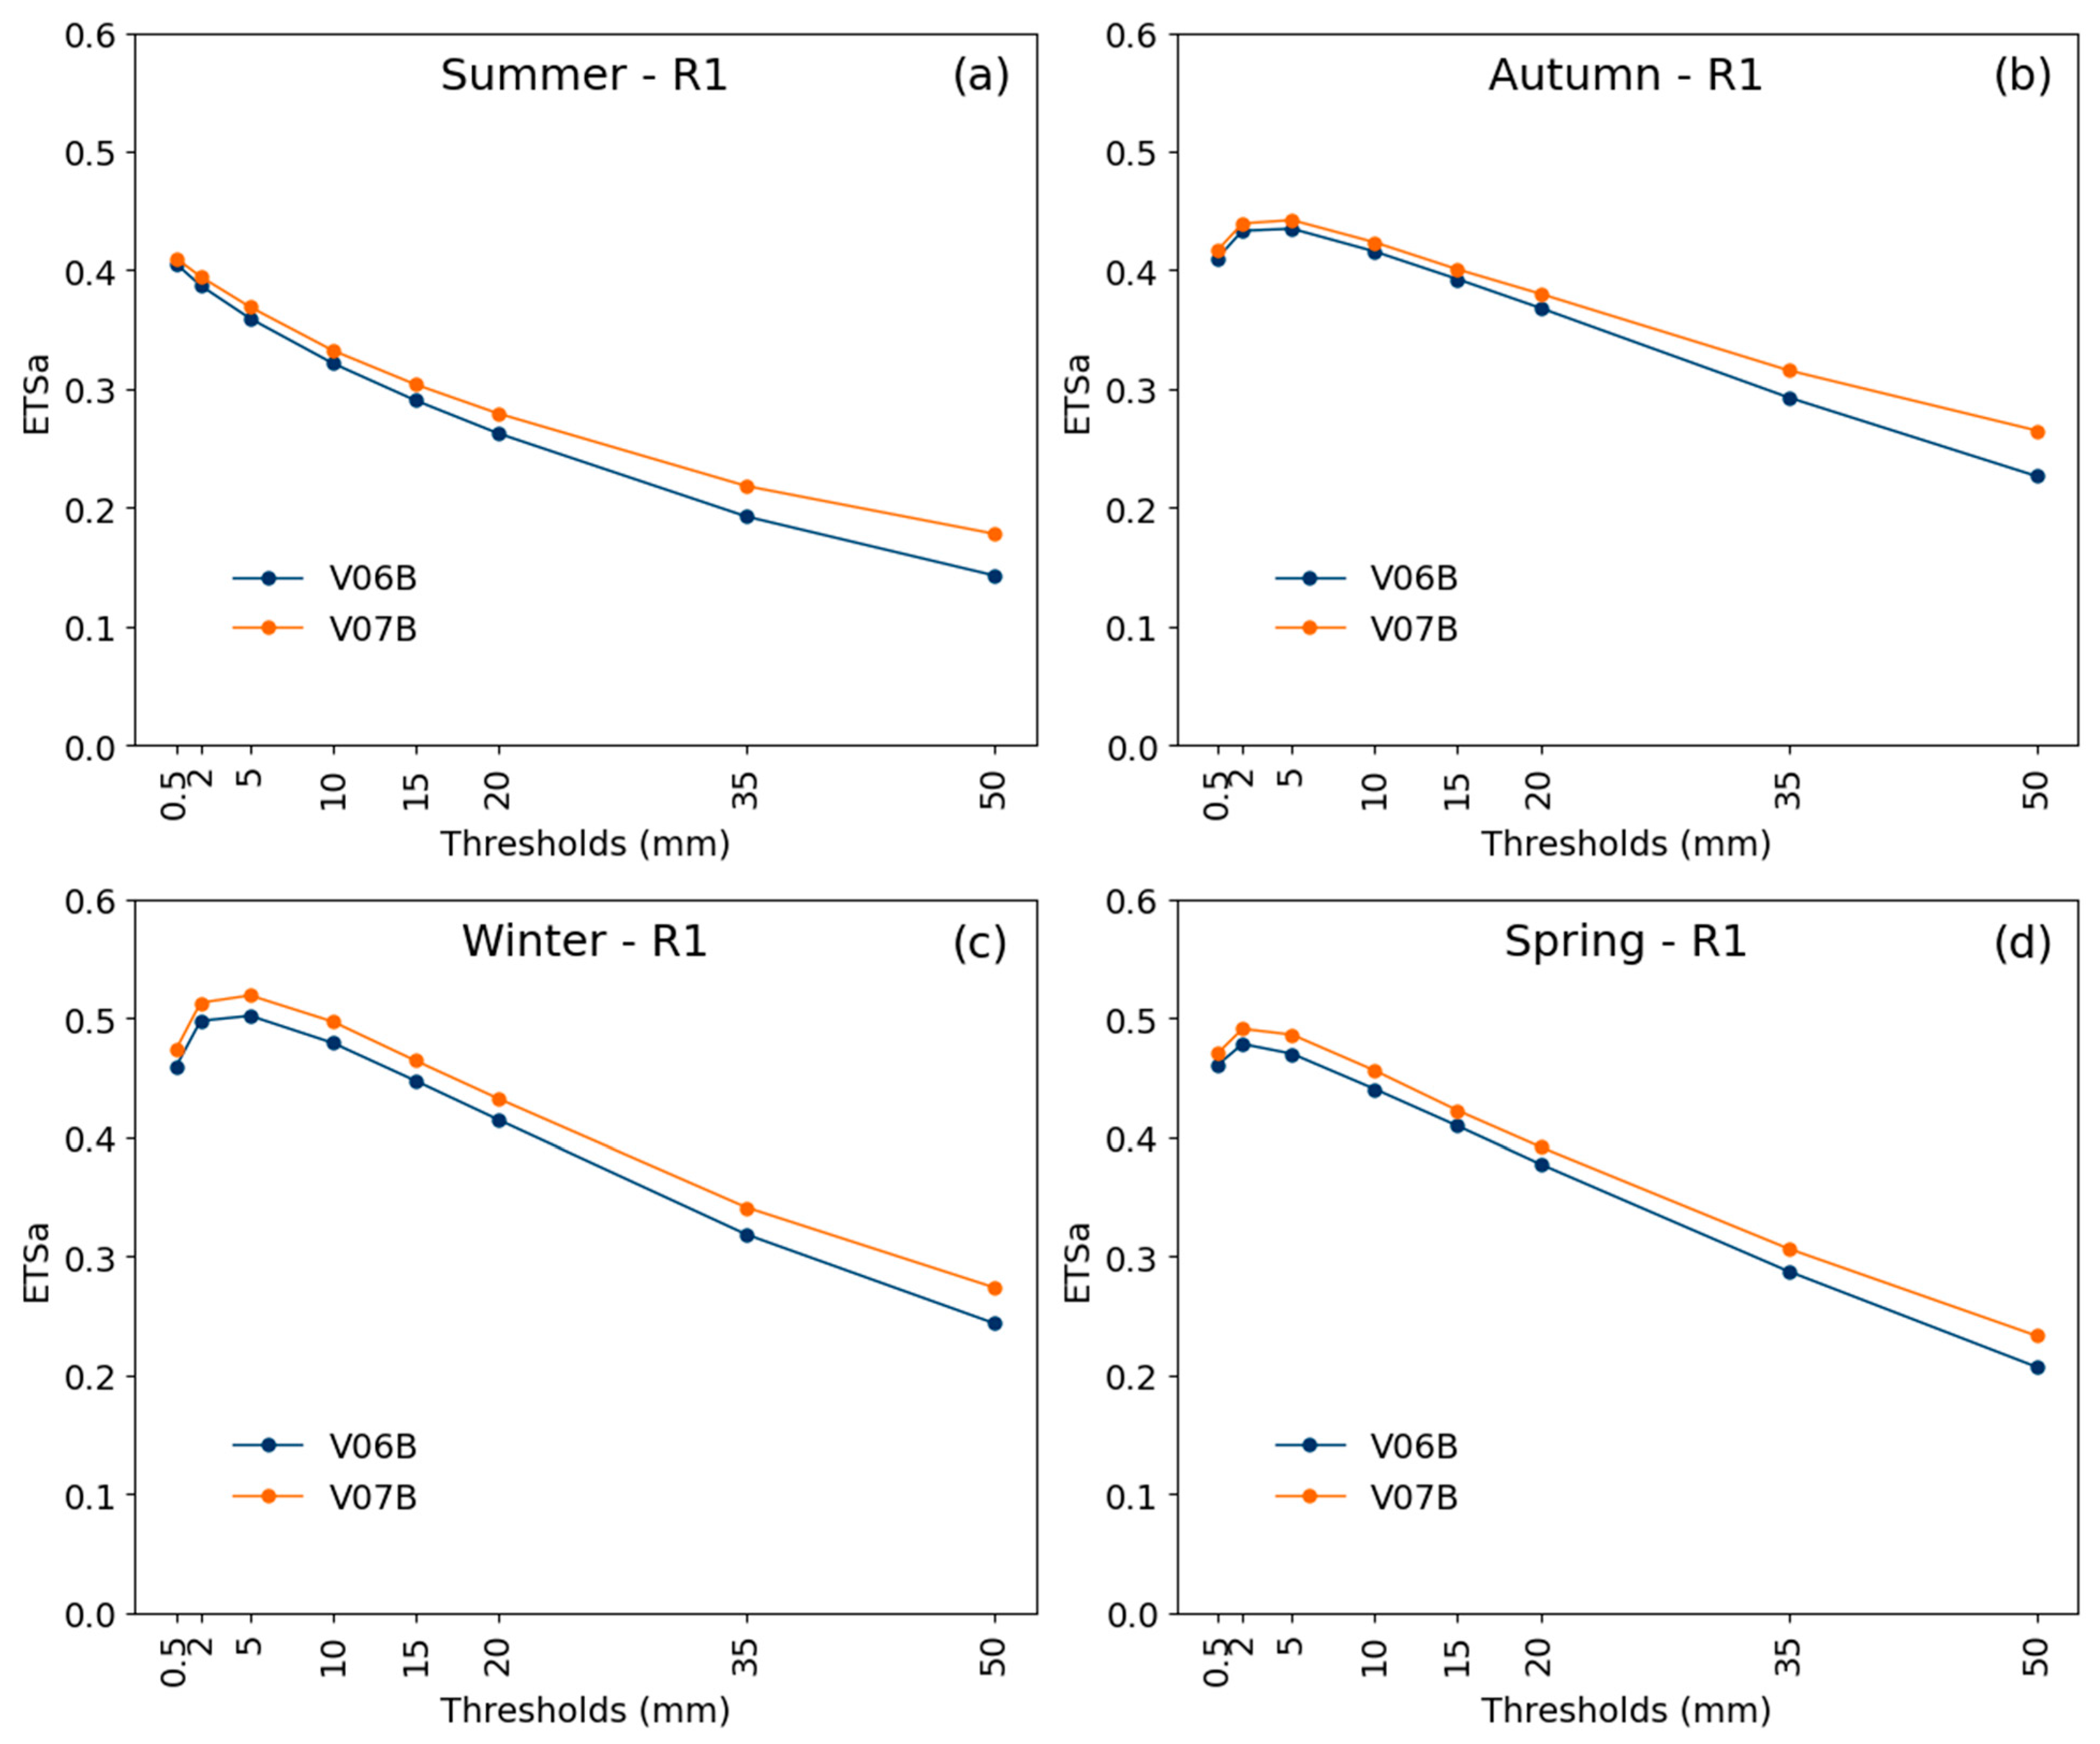
The temporal evolution of the seasonal precipitation RMSE for the IMERG V06B and V07B versions across Brazil’s five regions is illustrated in Figure 7. In the R1 region (Figure 7a), RMSE values remain relatively stable over time, with version V07B consistently outperforming V06B. Although some fluctuations are observed, the RMSE generally stays below 12 mm/day in both versions, with V07B frequently achieving reductions of 1-to-2 mm/day. According to the performance diagram (Figure 8), both versions tend to overestimate precipitation in approximately 30% of events for the no-rain/light rain categories. For moderate rain, the BIAS is nearly perfect (BIAS = 1), a pattern consistent across all seasons. Overestimations are also observed for heavy rainfall thresholds, particularly during winter, where up to 46% of events are affected. The most significant differences between the V06B and V07B versions occur during intense rainfall events, with V07B showing discrete improvements in performance indices, particularly in the Critical Success Index (CSI) and False Alarm Ratio (FAR). These findings are further supported by the adjusted equitable threat score (ETSa) analysis (Figure 9), which shows that V07B consistently outperforms V06B across all seasons and precipitation thresholds, with more pronounced gains for intense rainfall events.

3.4. Region R2

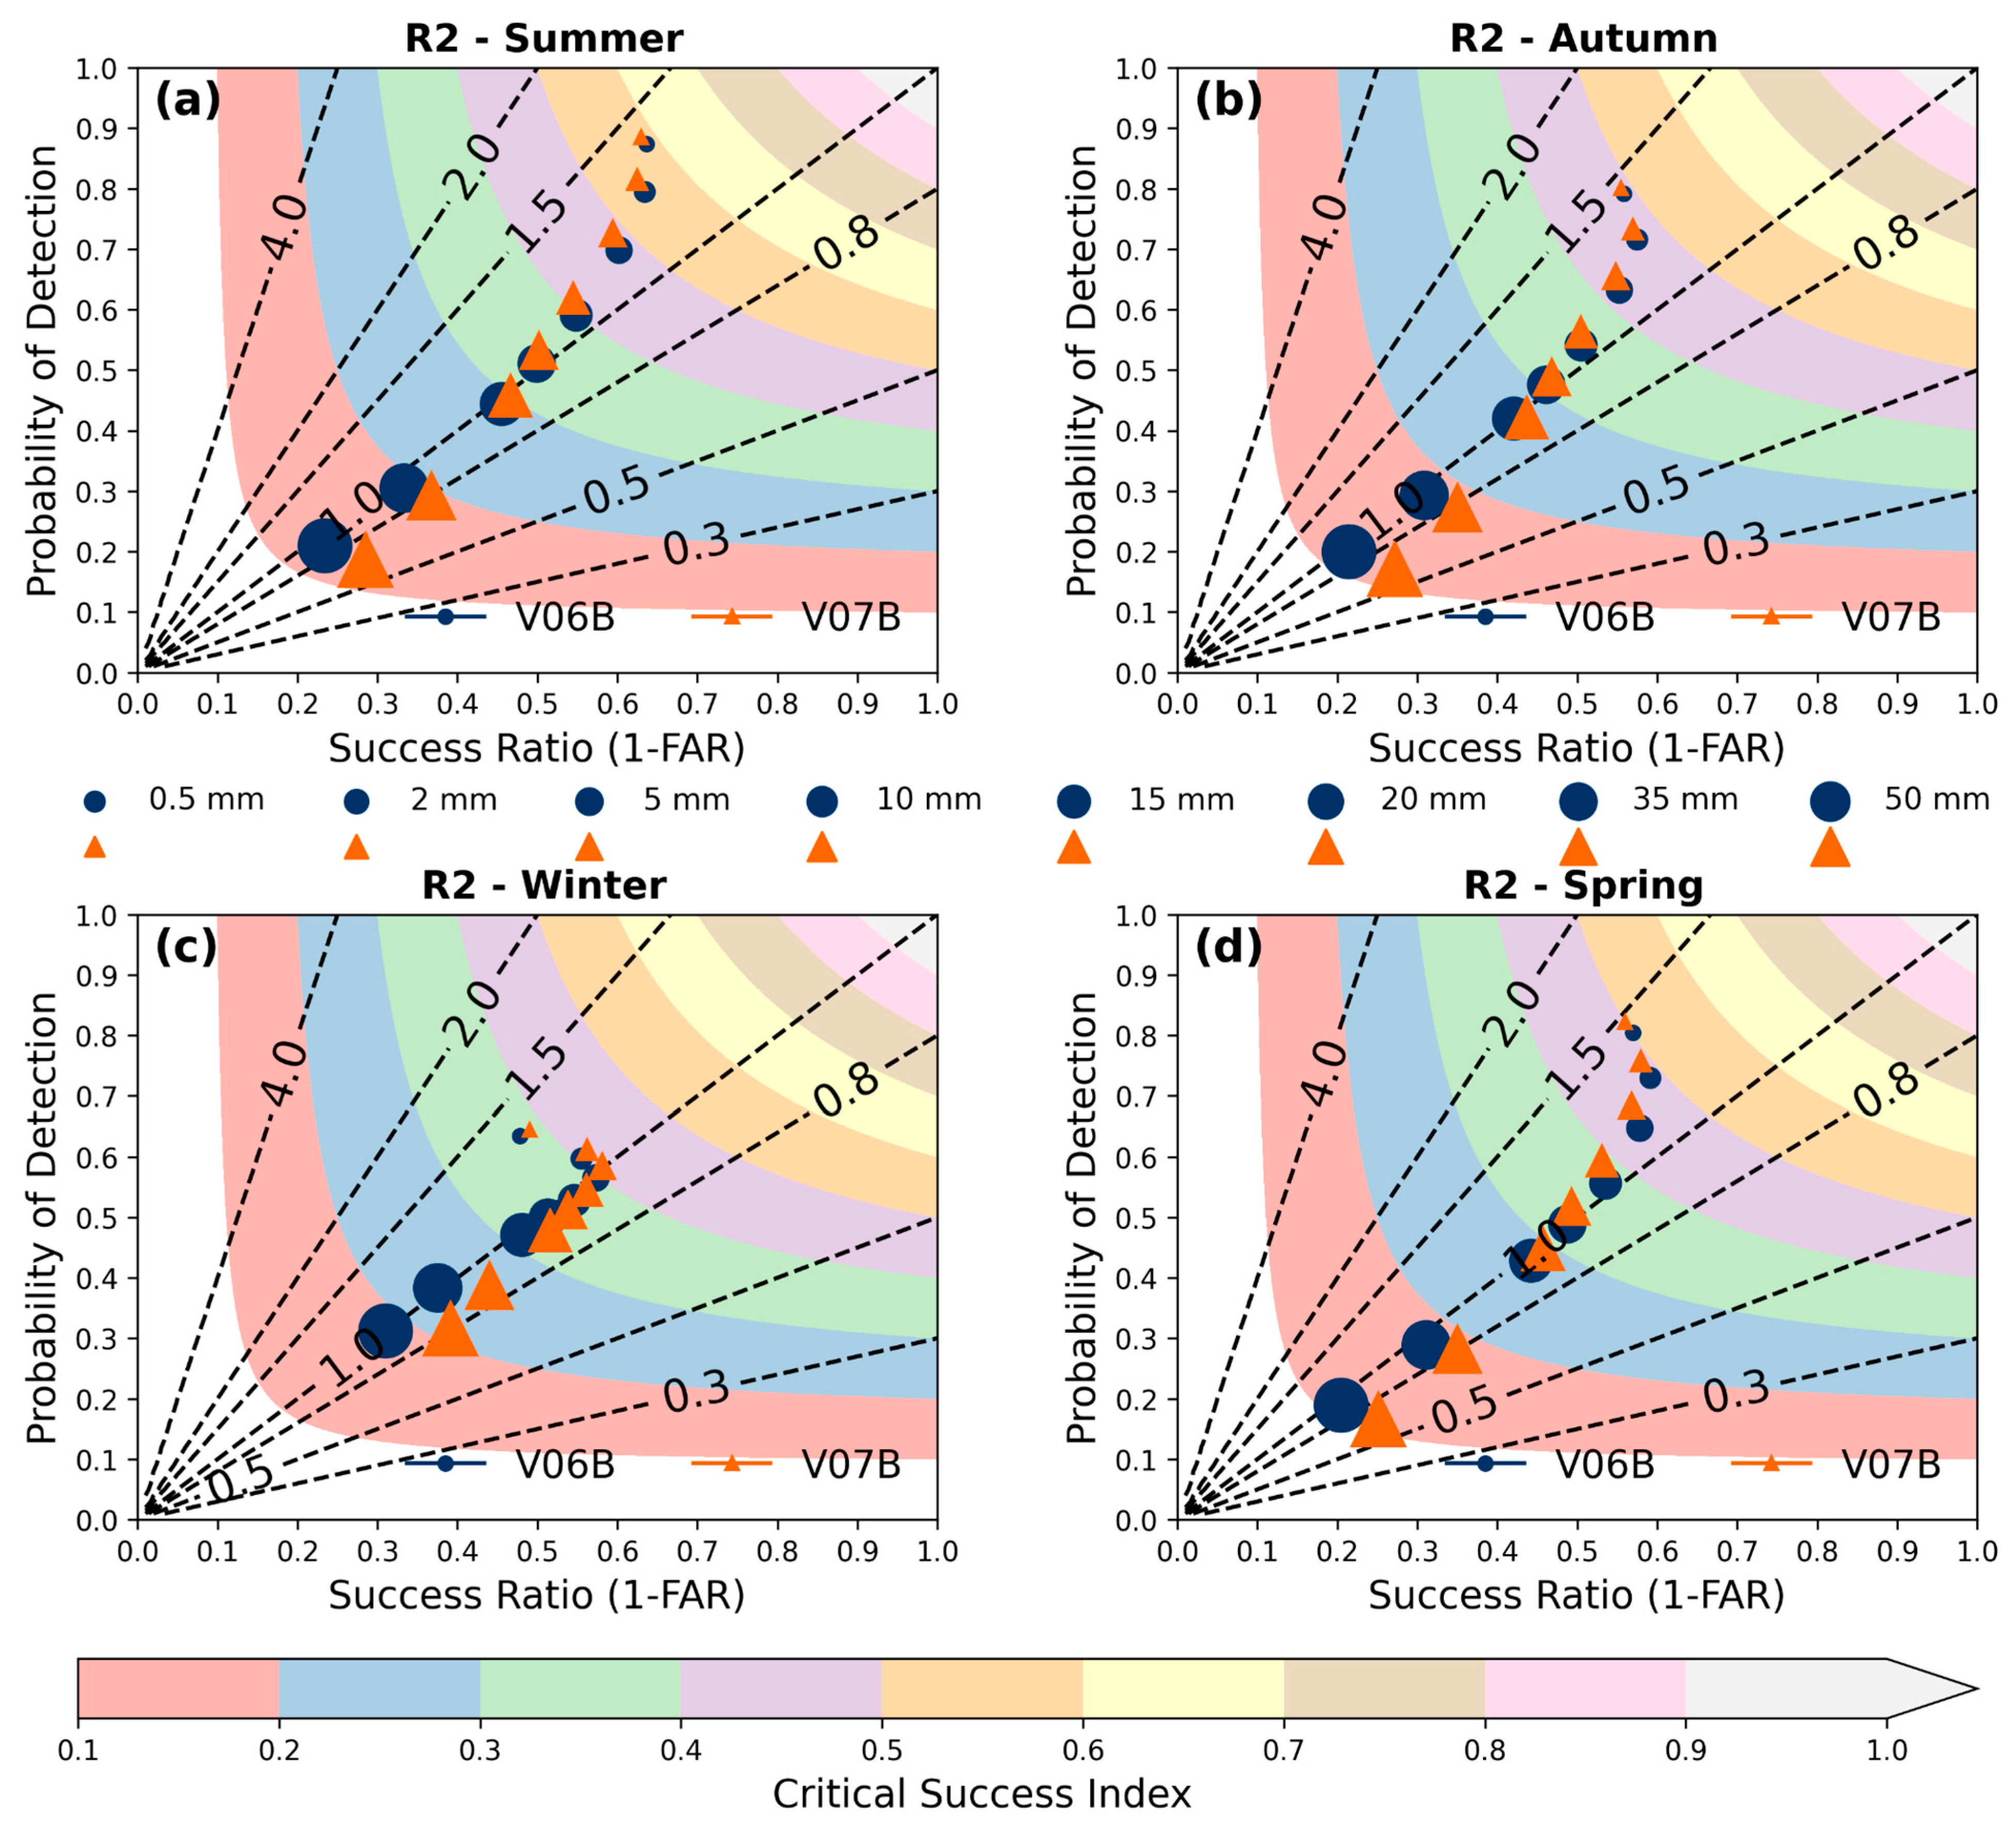
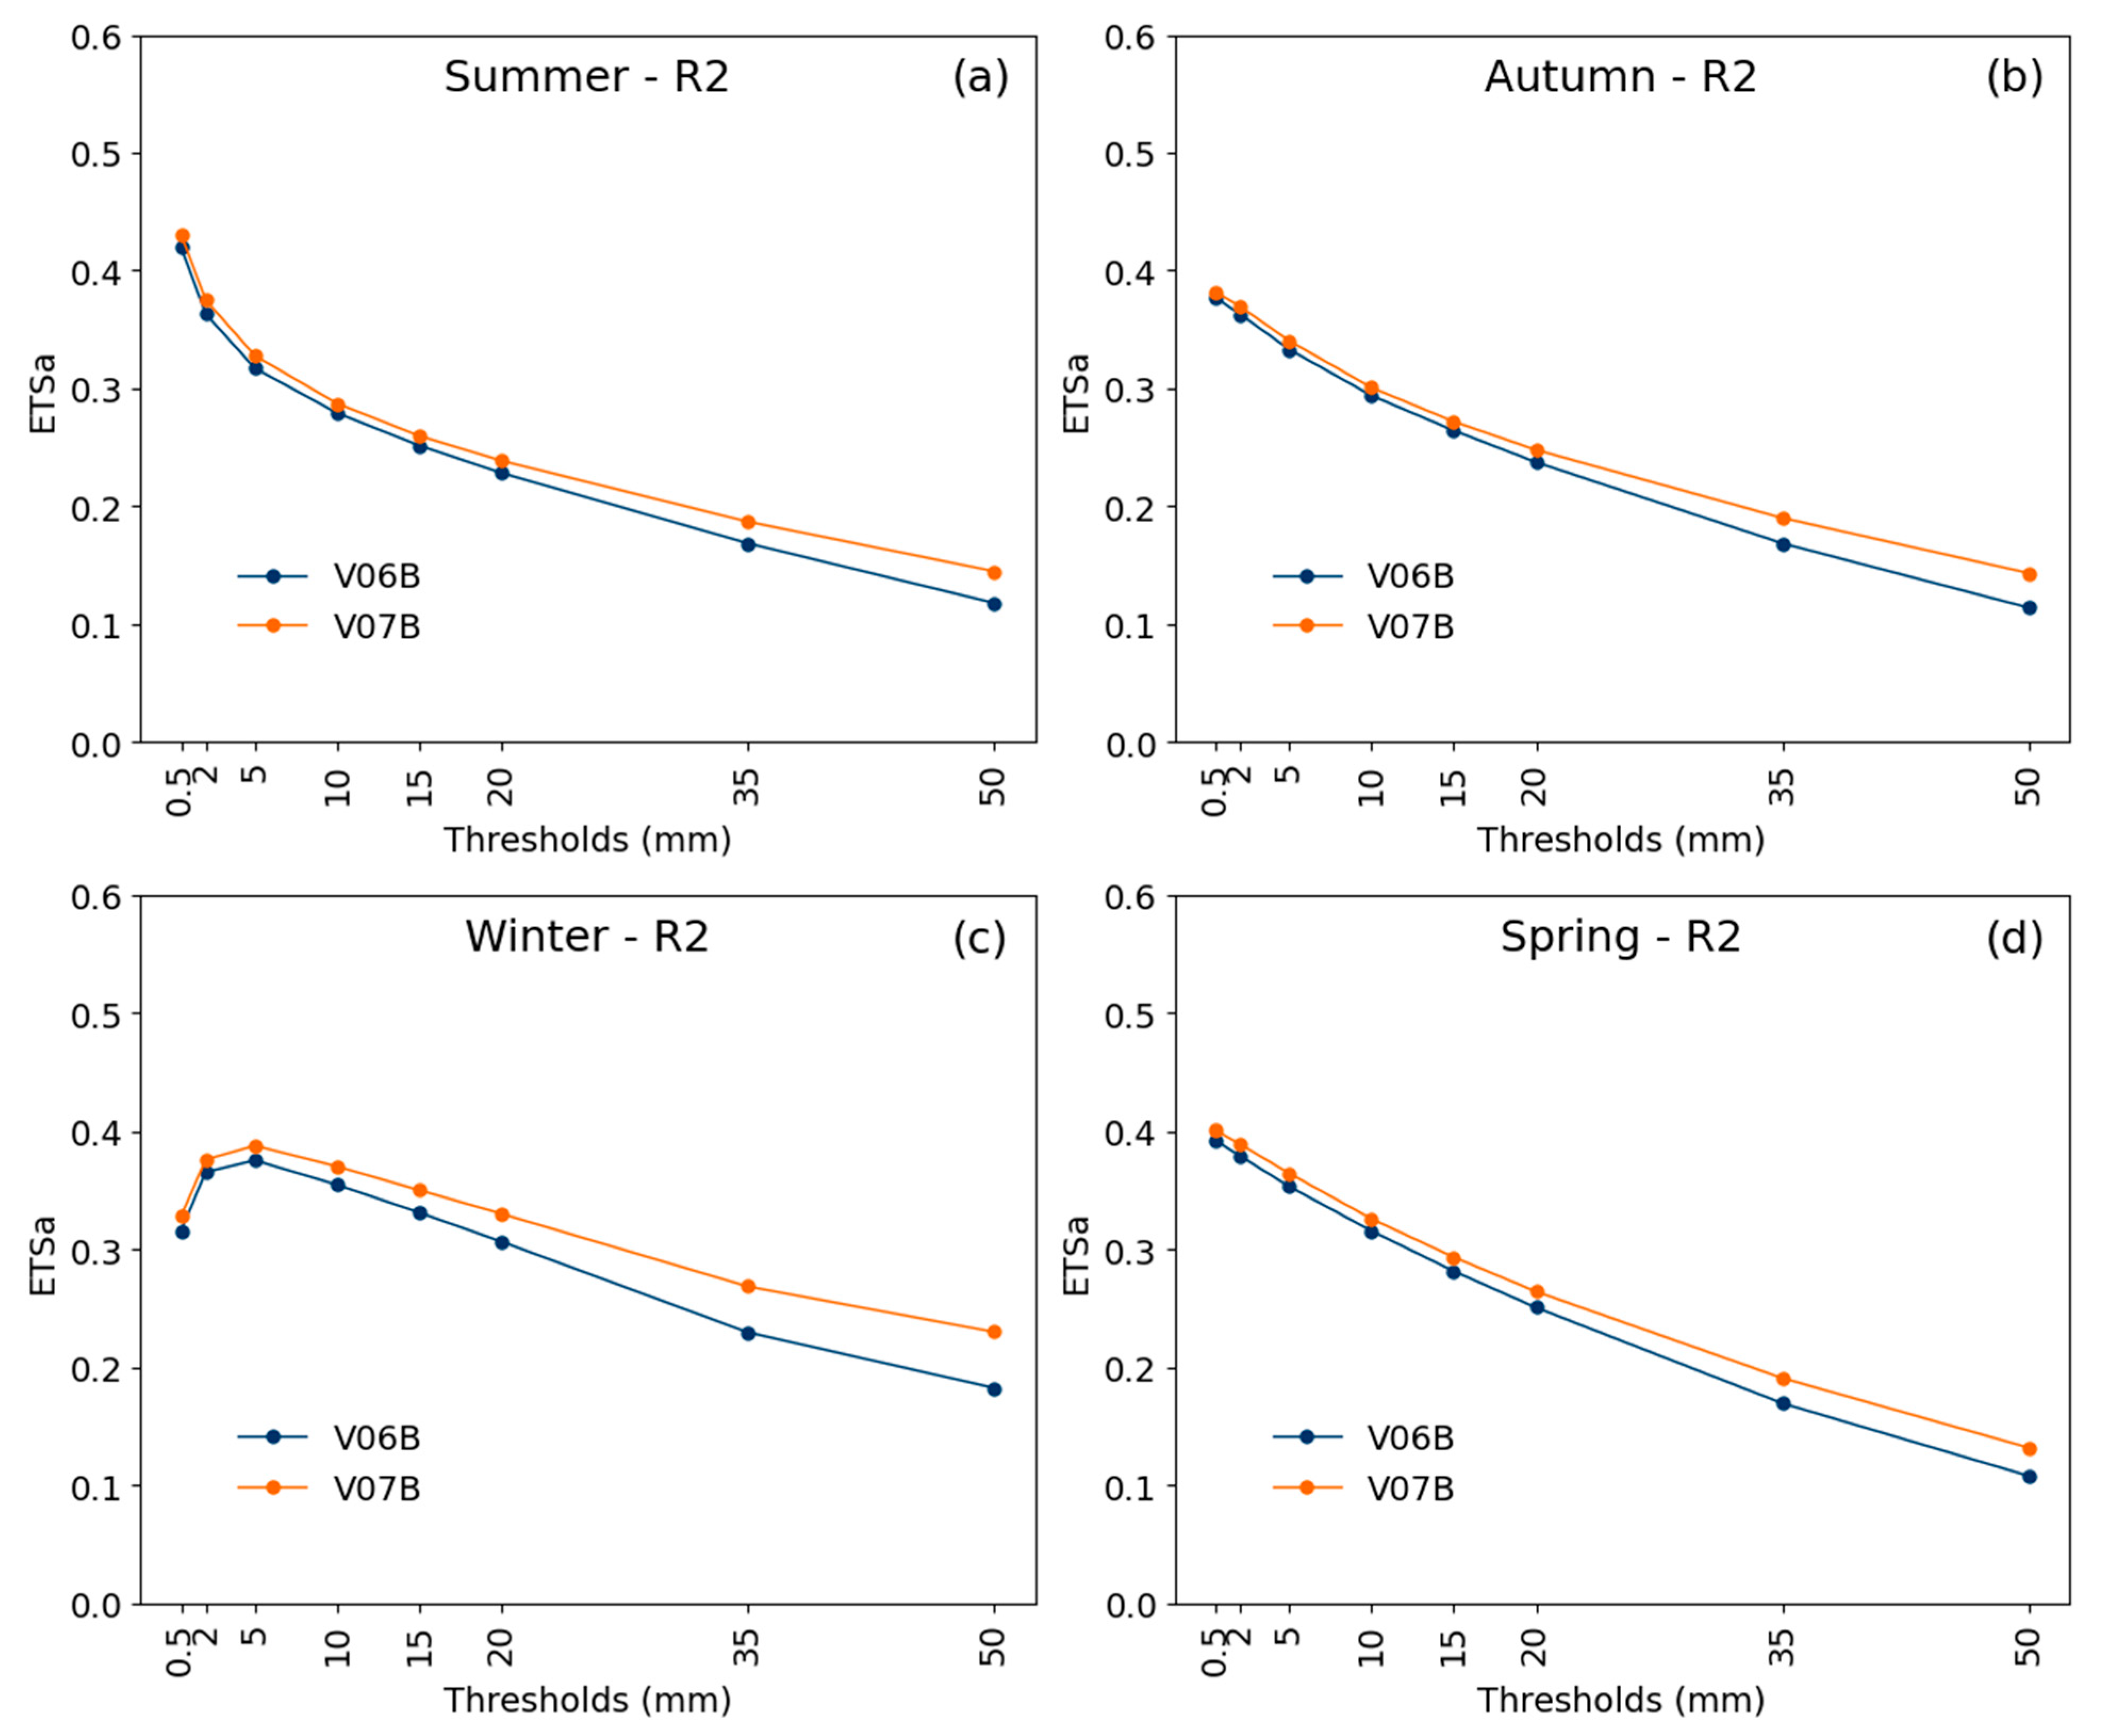
In the R2 region (Figure 7b), greater seasonal variability is observed, with RMSE peaks occurring regularly, particularly during the summer months. The V07B version generally reduces the RMSE, especially during peak periods, with reductions of up to 1.0 mm/day compared to V06B. However, the high RMSE values during these periods suggest challenges in accurately estimating precipitation in this region, likely due to complex meteorological phenomena. According to the performance diagram (Figure 10), both versions display overestimations for the rain/no-rain threshold and light rainfall during summer (Figure 10a), autumn (Figure 10b), and spring (Figure 10d). These overestimations can reach up to 46% of total events at the 0.5 mm threshold (Figure 7d). For moderate-to-heavy rainfall, the BIAS approaches 1, indicating more accurate predictions. However, at higher rainfall thresholds, the V07B version consistently underestimates across all seasons, with the highest frequency of underestimations occurring in summer (Figure 7a), where approximately 35% of events are underestimated at the 50.0 mm threshold. During summer (Figure 10a) and autumn (Figure 10b), the performance of both versions is similar for thresholds ranging from 0.5 to 20 mm. Nevertheless, for thresholds exceeding this range, the V07B version shows improvements in terms of the False Alarm Ratio (FAR) and Critical Success Index (CSI) compared to V06B. Regarding the adjusted equitable threat score (ETSa), for rain thresholds from 0.5 to 20.0 mm, the V07B performance is slightly higher during summer (Figure 11a), autumn (Figure 11b), and spring (Figure 11d), with more evident improvements for thresholds above this range. In winter (Figure 11c), these improvements are already noticeable for moderate-to-heavy rainfall.

3.5. Region R3

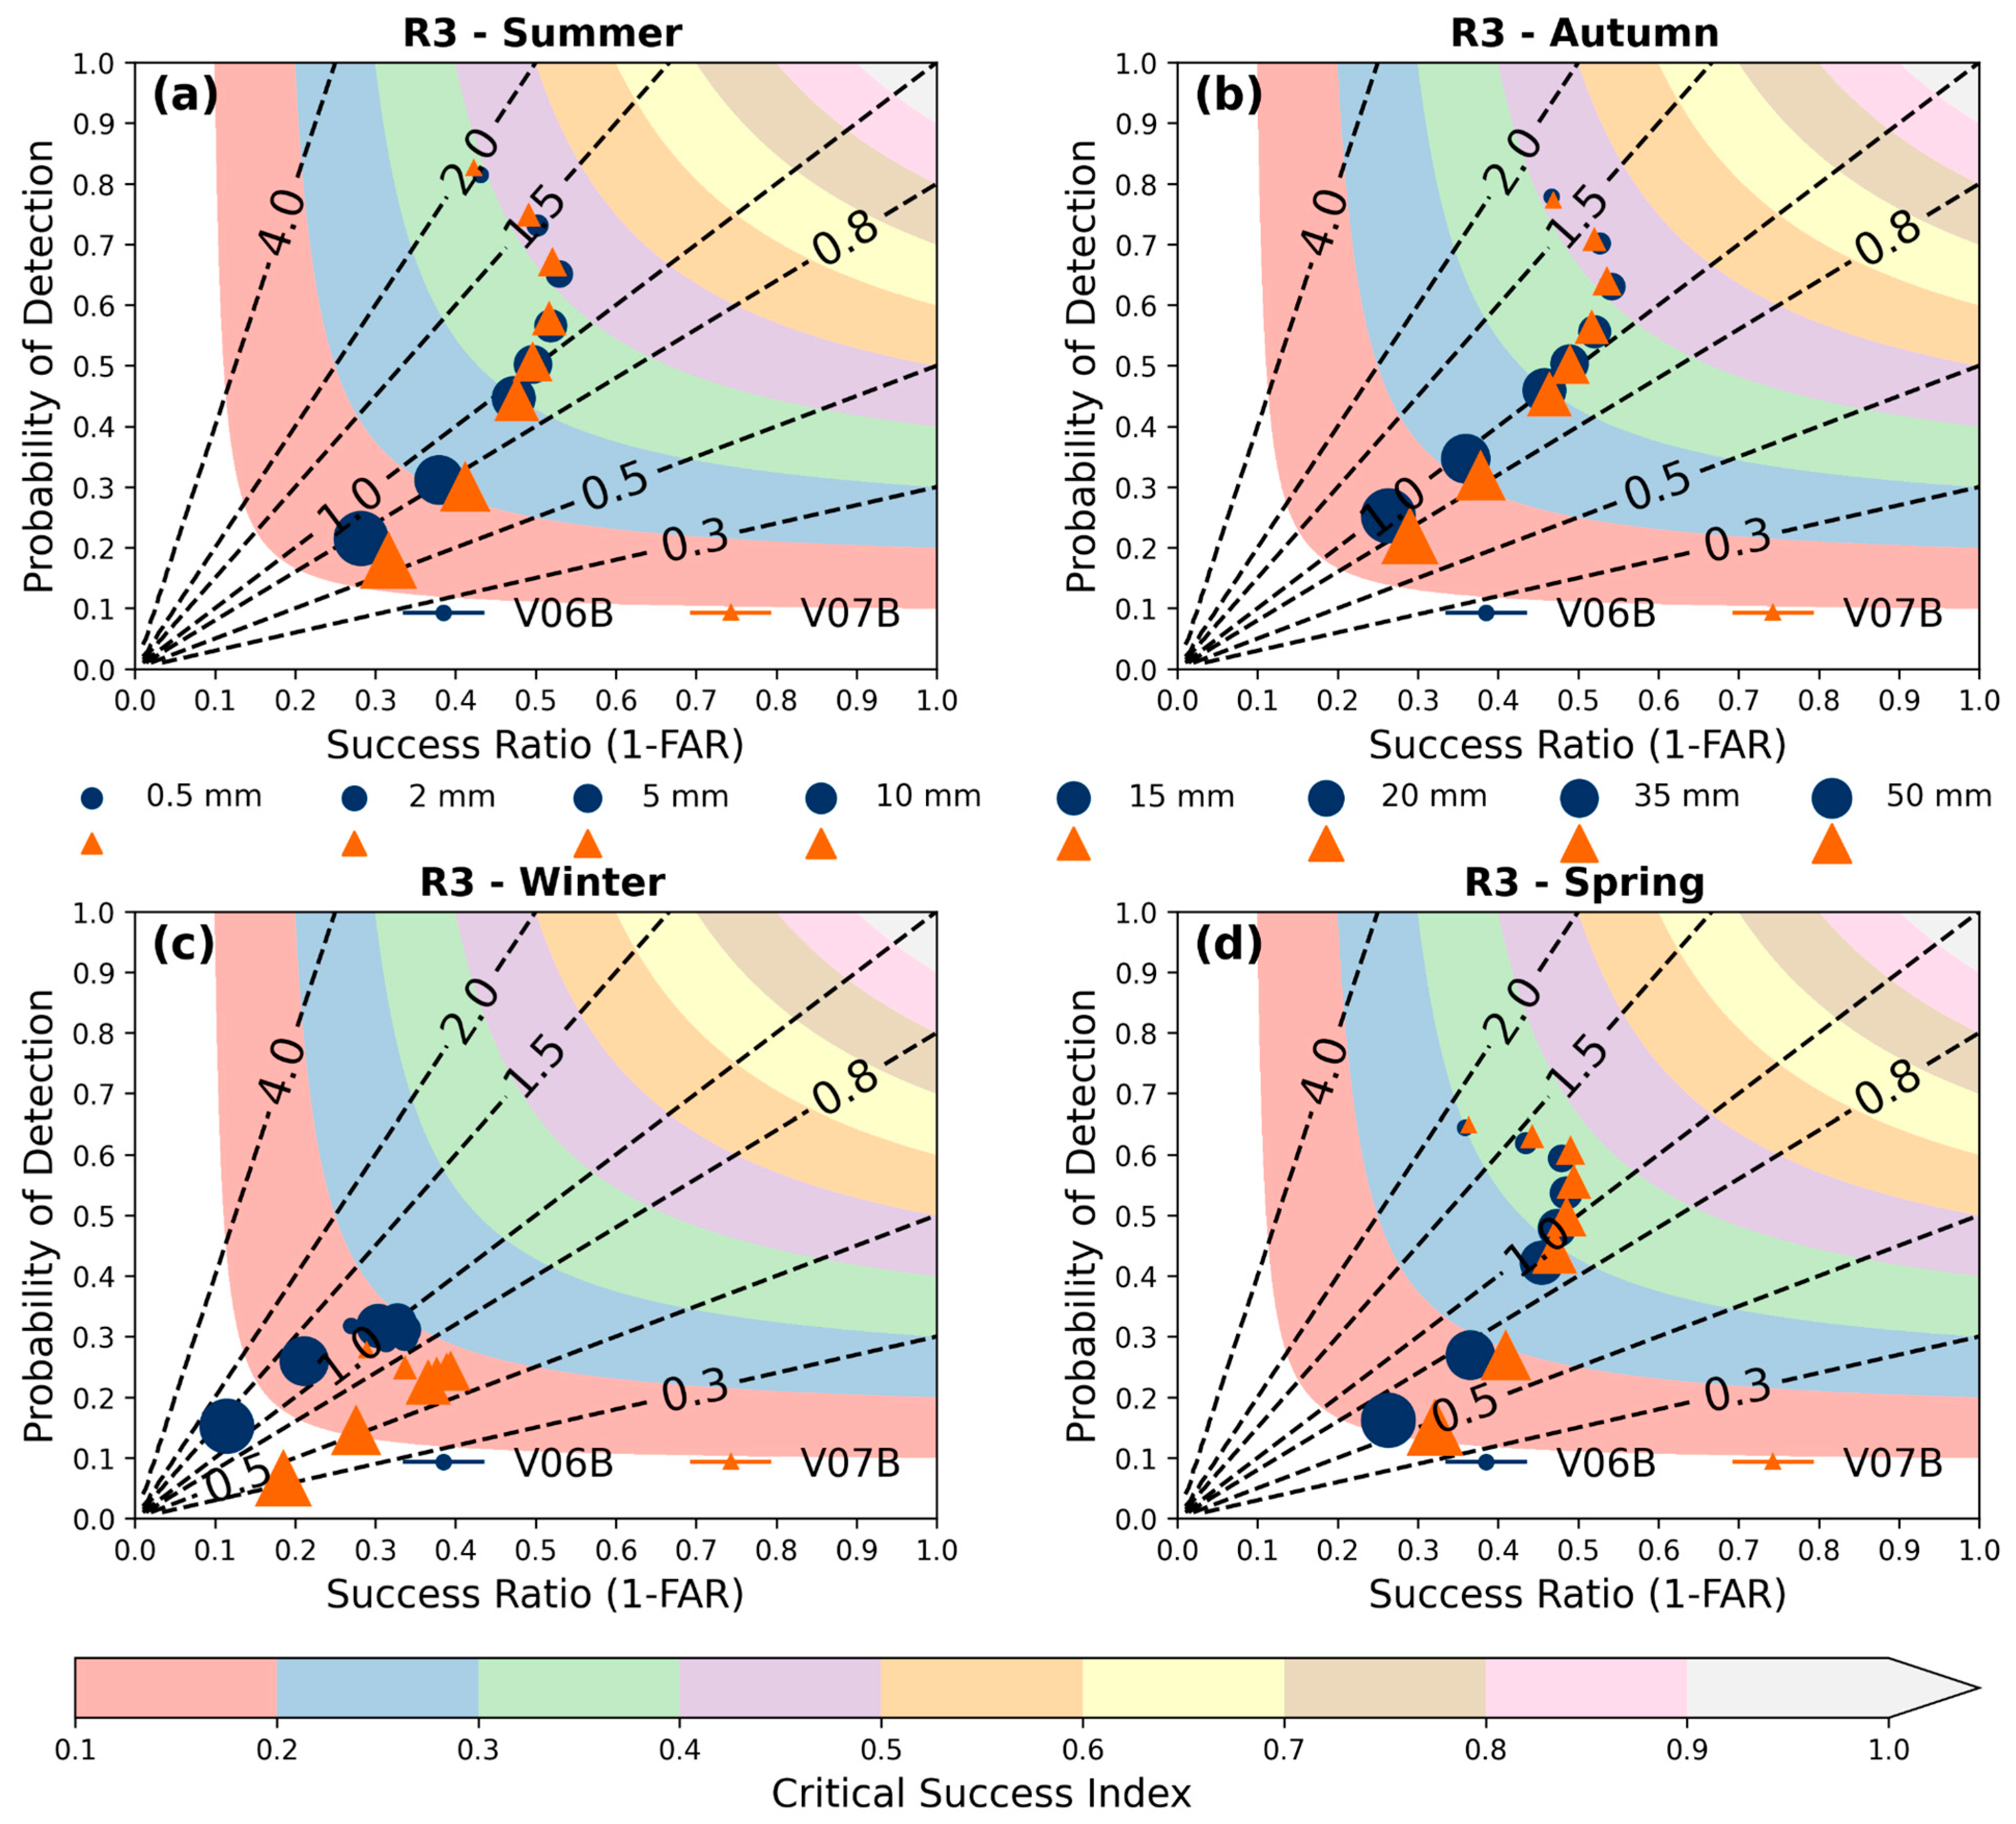
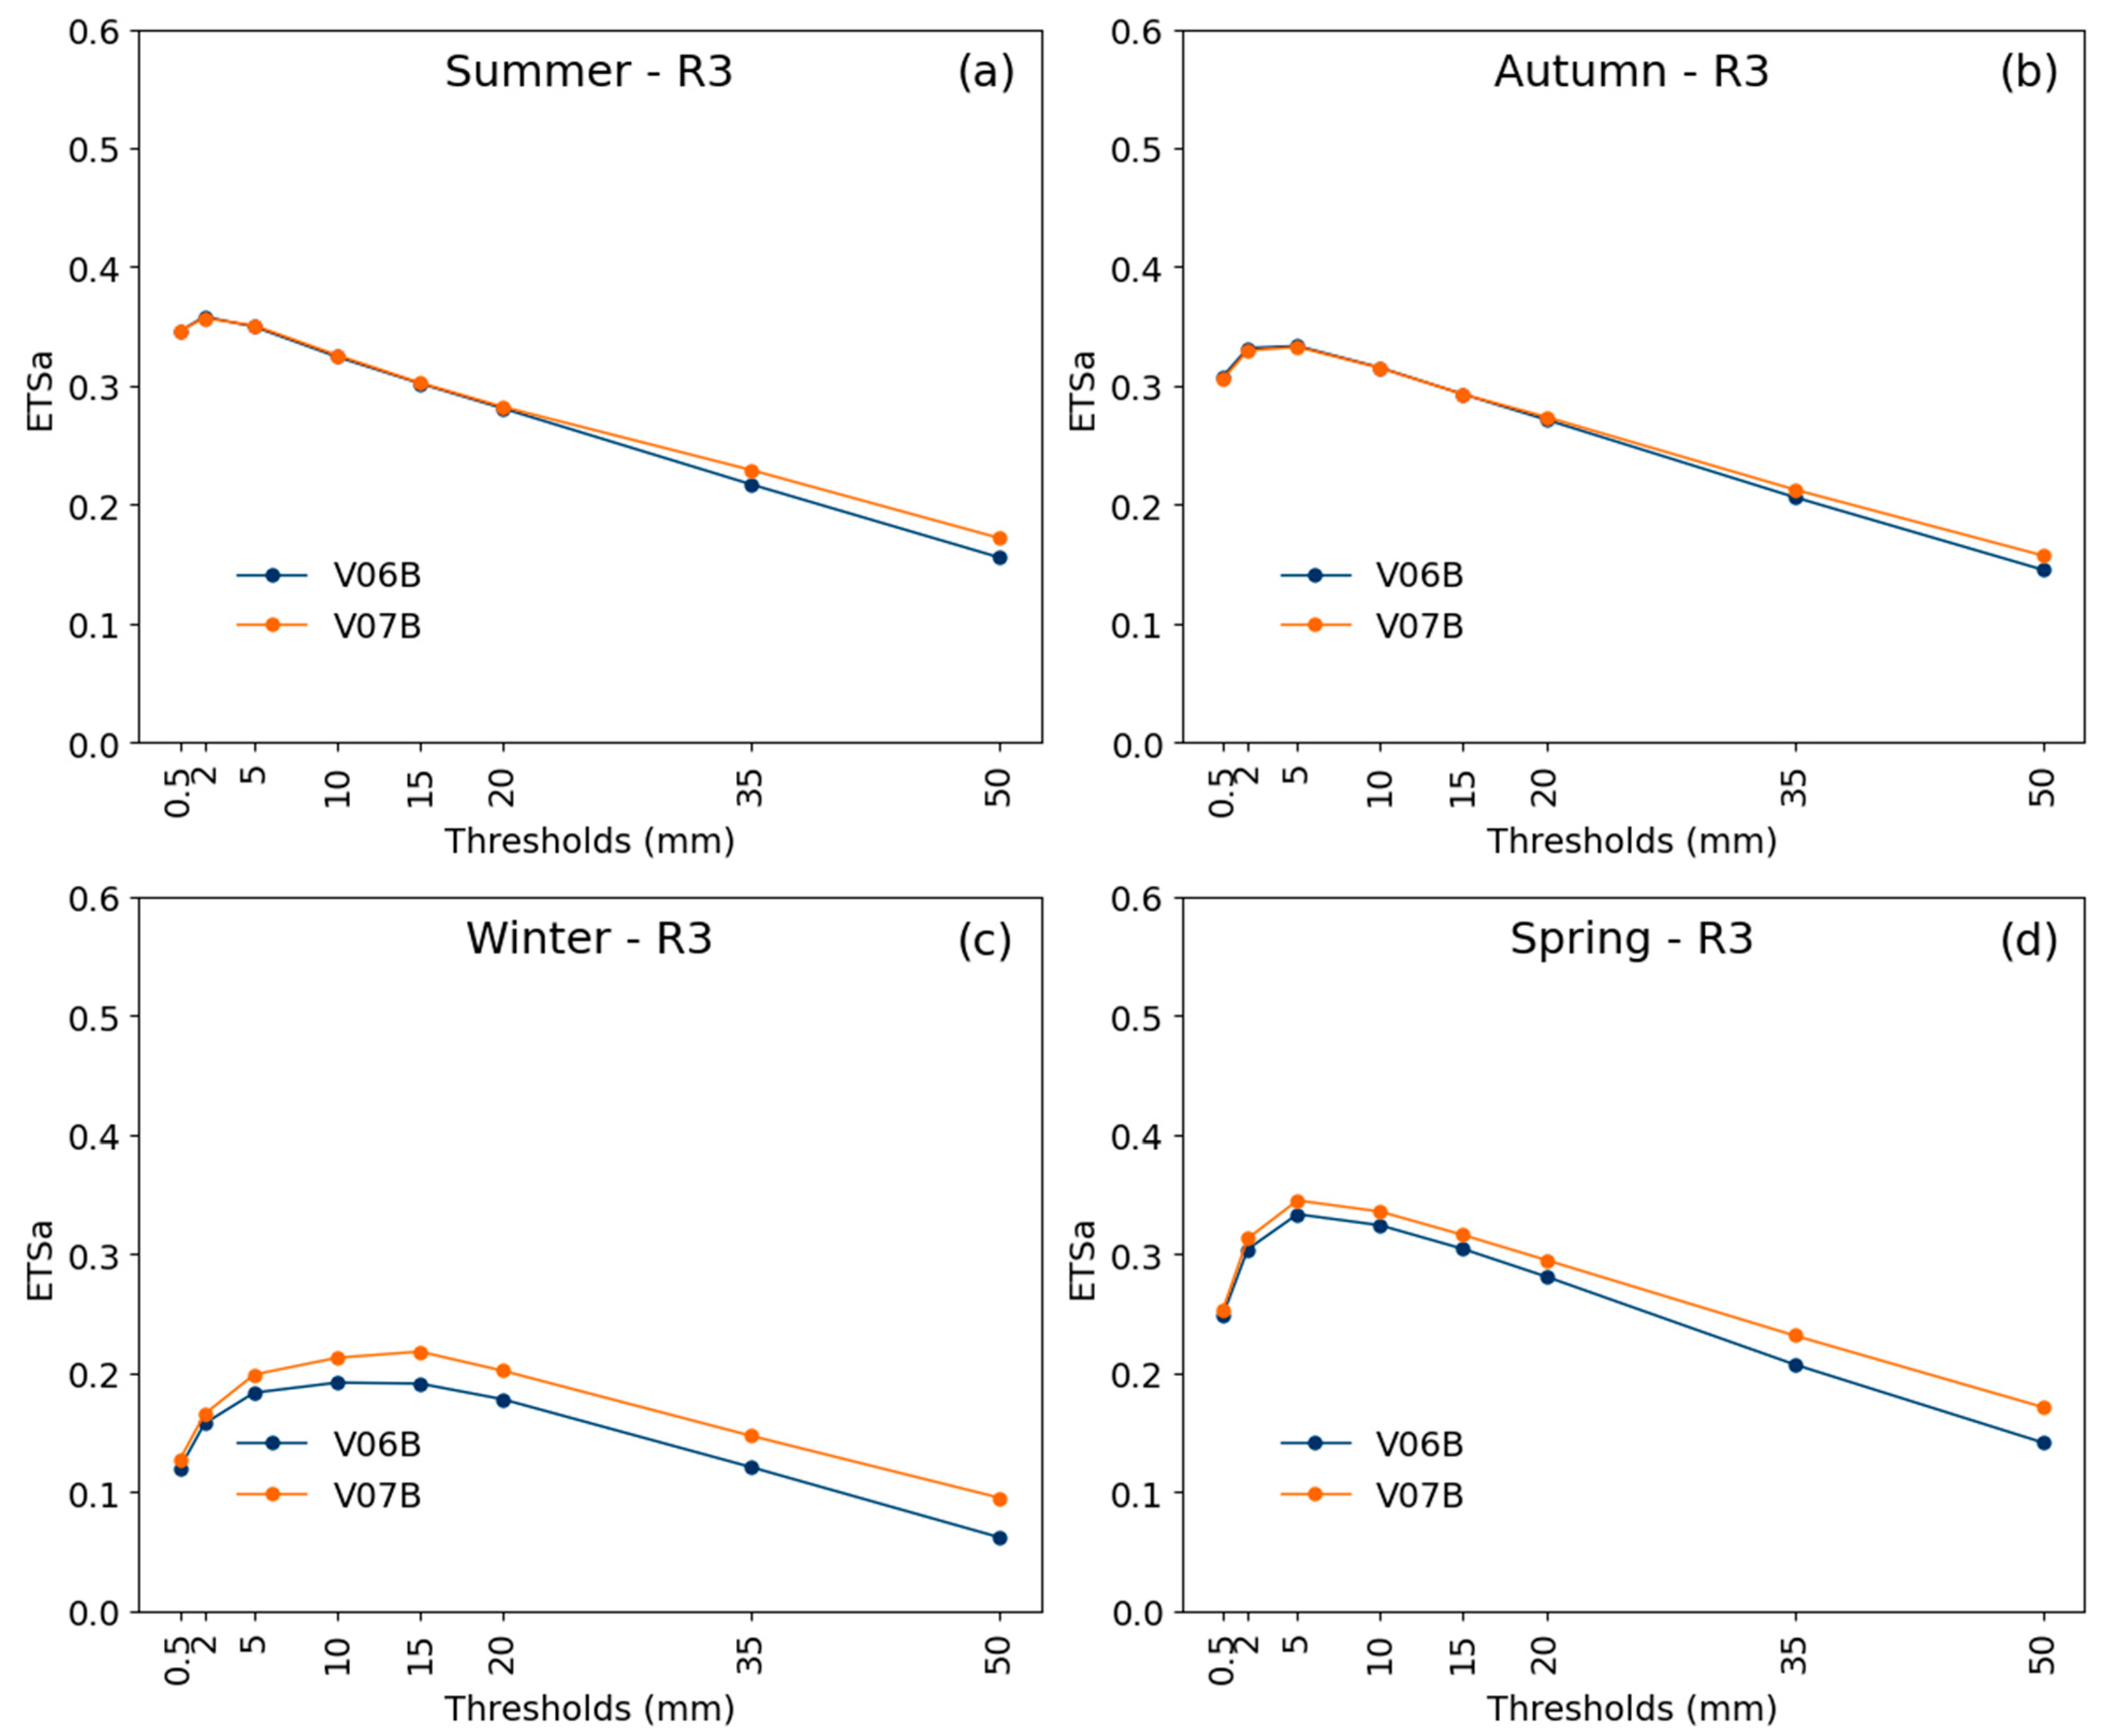
In the R3 region (Figure 7c), the differences between V06B and V07B are subtle, with V06B presenting slightly higher RMSE values (not exceeding 1.0 mm/day) during the summer months. From the performance diagram (Figure 12), it is evident that in summer (Figure 12a), autumn (Figure 12b), and spring (Figure 12d) both versions exhibit comparable behavior across rain/no-rain, light rain, and moderate rain categories. Notably, for the 0.5 mm threshold during summer V06B overestimates precipitation in approximately 90% of events. For amounts exceeding 35 mm, a slight underestimation is observed, except in autumn, where the BIAS approaches 1. In winter (Figure 12c), V07B demonstrates a poorer performance relative to V06B, with substantial underestimation, particularly for the 50.0 mm threshold, affecting nearly 65% of events. Although V06B exhibits a BIAS closer to 1, its CSI and POD values remain relatively low, accompanied by a high FAR, indicating that despite the balanced BIAS, V06B’s hit rate is limited. The adjusted equitable threat score (ETSa) analysis (Figure 13) reveals that during summer (Figure 13a) and autumn (Figure 13b) both versions perform similarly across most thresholds, except for intense rainfall, where V07B demonstrates a slight superiority. The most pronounced differences occur during winter (Figure 13c), where V07B generally outperforms V06B, particularly for thresholds between 10 mm and 20 mm, where ETSa peaks. In both winter and spring (Figure 13d) V07B provides better estimates for intense rainfall events.

3.6. Region R4

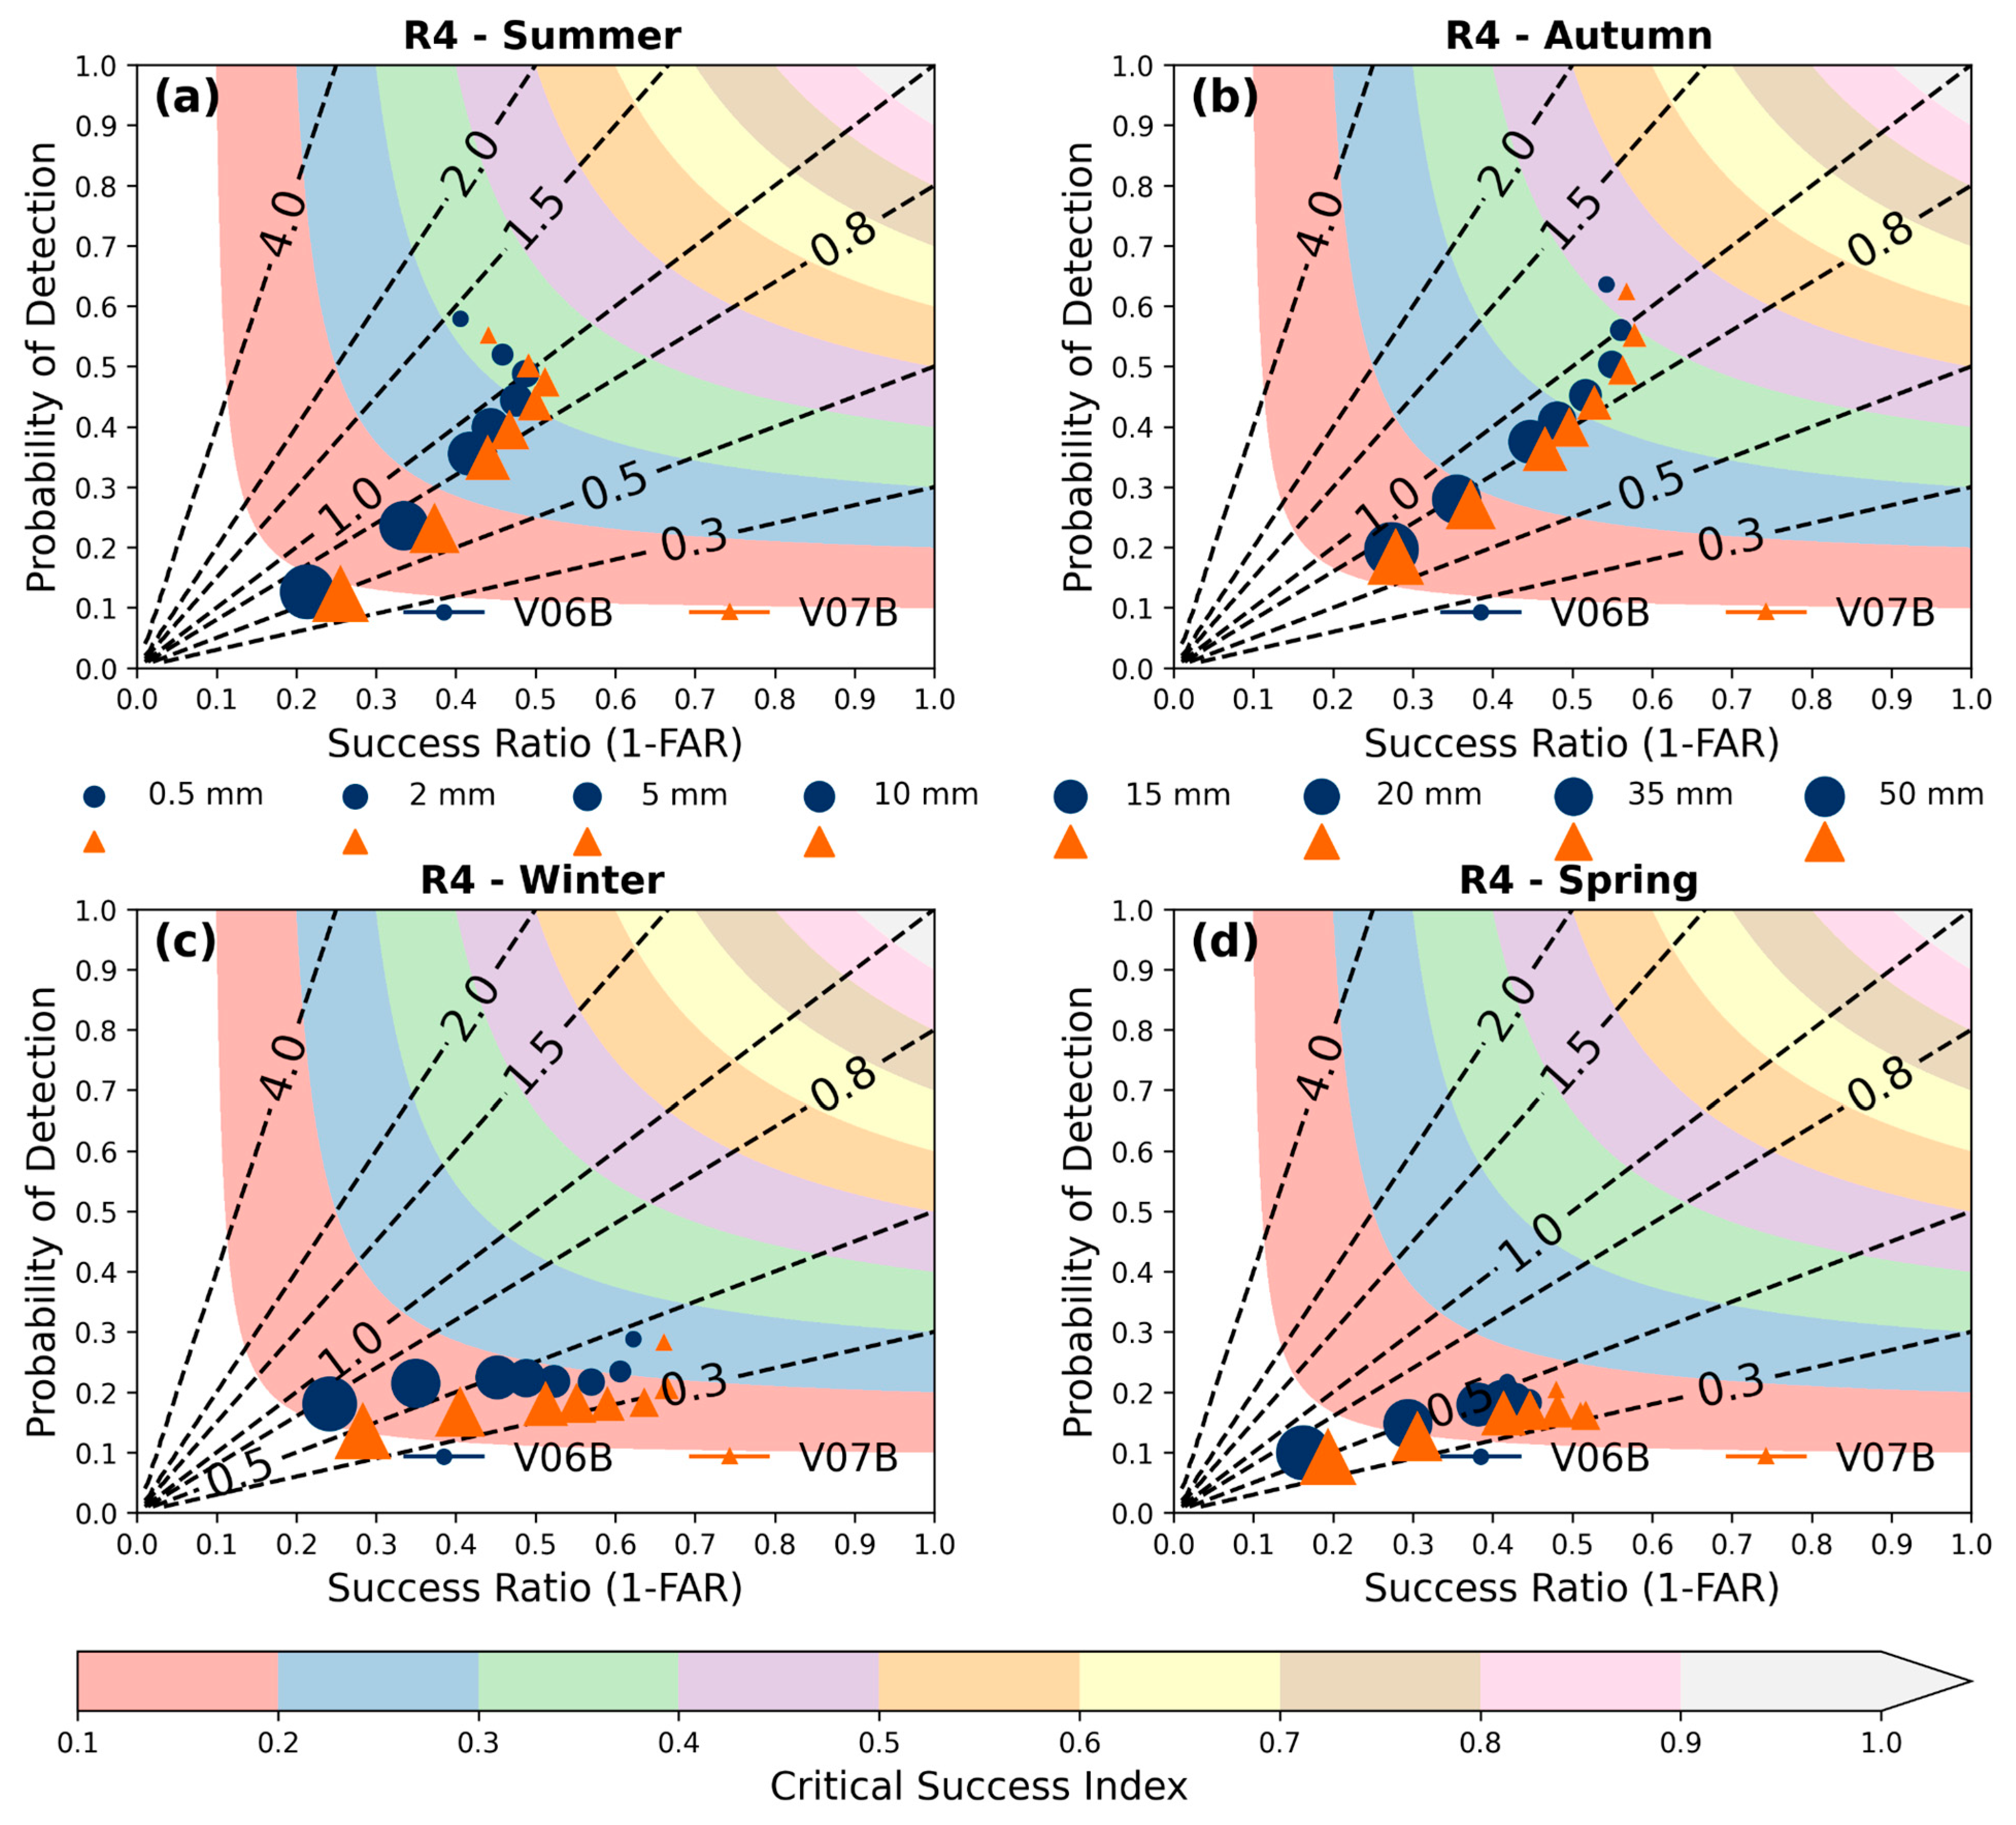
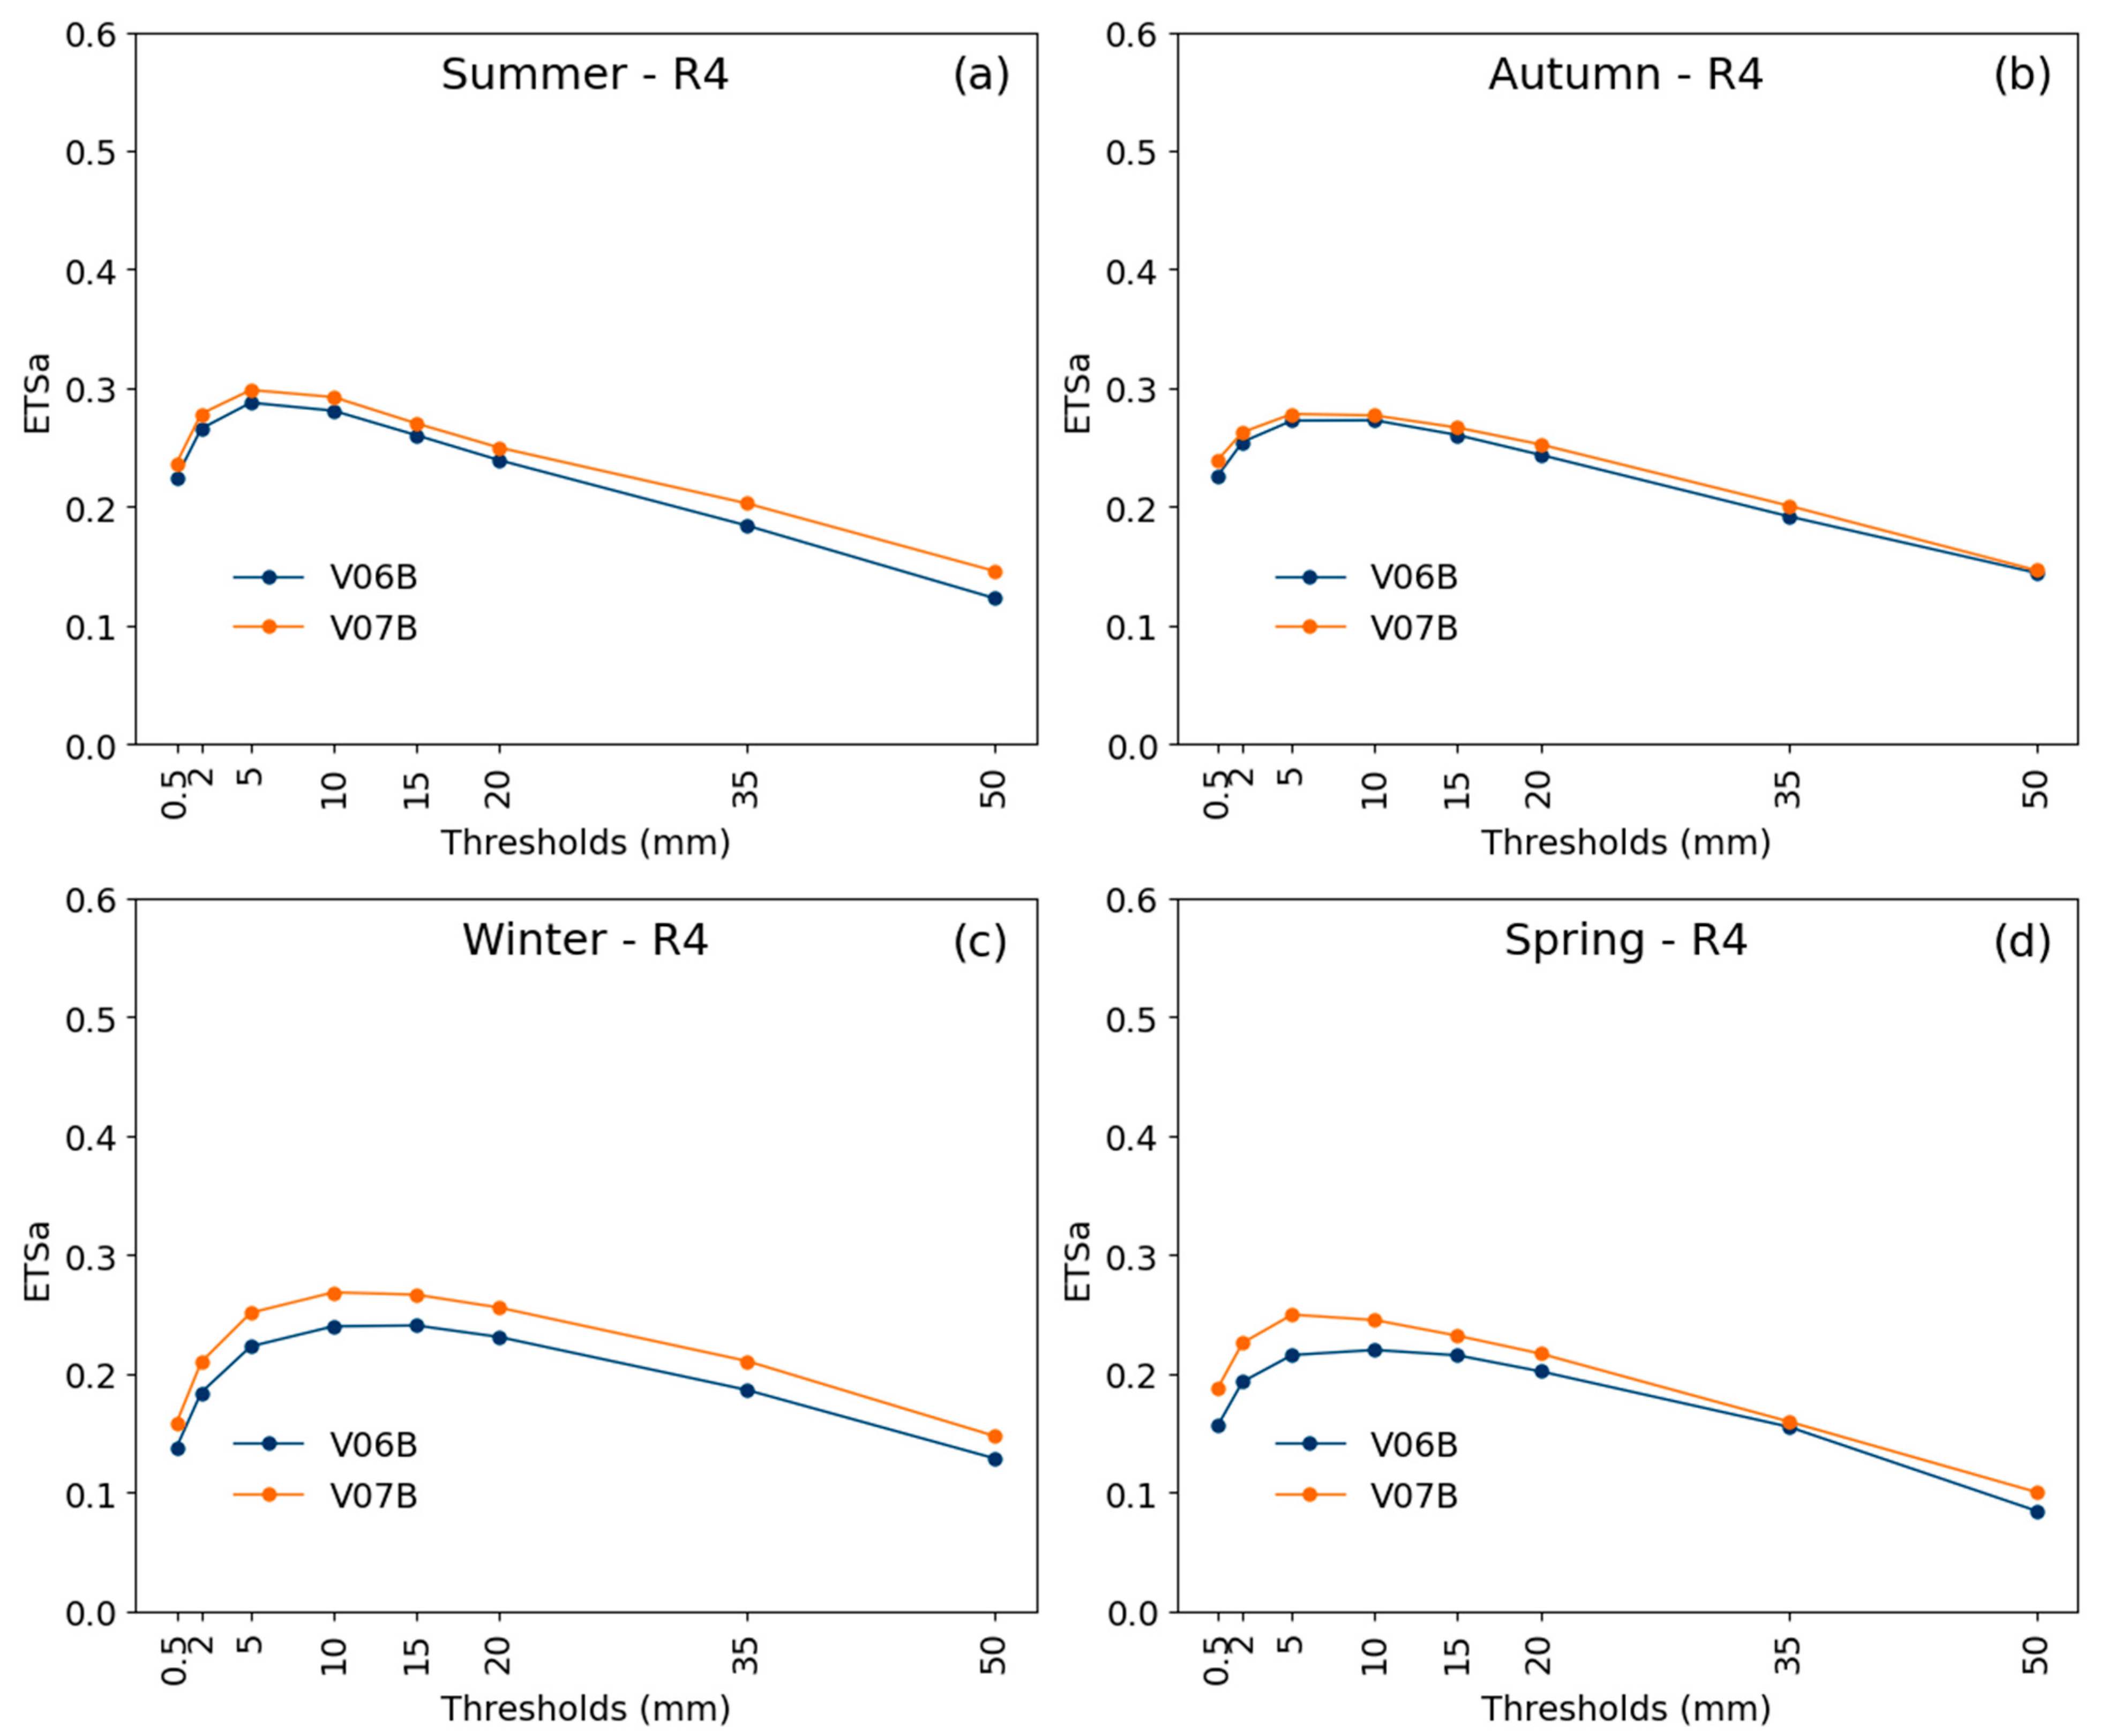
In the eastern region of Northeast Brazil (Region R4), the RMSE values (Figure 7d) indicate higher errors for version V06B, particularly during the winter months, with values reaching approximately 2.0 mm/day in the years 2002, 2006, and 2010. The performance diagram (Figure 14) highlights underestimation as the predominant characteristic across all seasons and precipitation thresholds, except for light rain thresholds during summer and autumn (Figure 14a,b). Specifically, for the 0.5 mm threshold in summer version V06B overestimates nearly 43% of the events. In winter and spring (Figure 14c,d), underestimations become more pronounced, affecting all precipitation thresholds. Notably, in winter (Figure 14c) both versions exhibit significant underestimation, with the majority of cases reaching 60% and peaking at nearly 72% of events for the 5.0 mm threshold in version V07B. During these seasons, version V07B shows more pronounced underestimations than V06B and registers a lower Probability of Detection (POD). However, despite the lower POD, version V07B demonstrates higher Critical Success Index (CSI) values. An analysis of the adjusted equitable threat score (ETSa) (Figure 15), which accounts for bias, reveals more satisfactory results for version V07B, particularly during winter (Figure 15c) and spring (Figure 15d).

3.7. Region R5

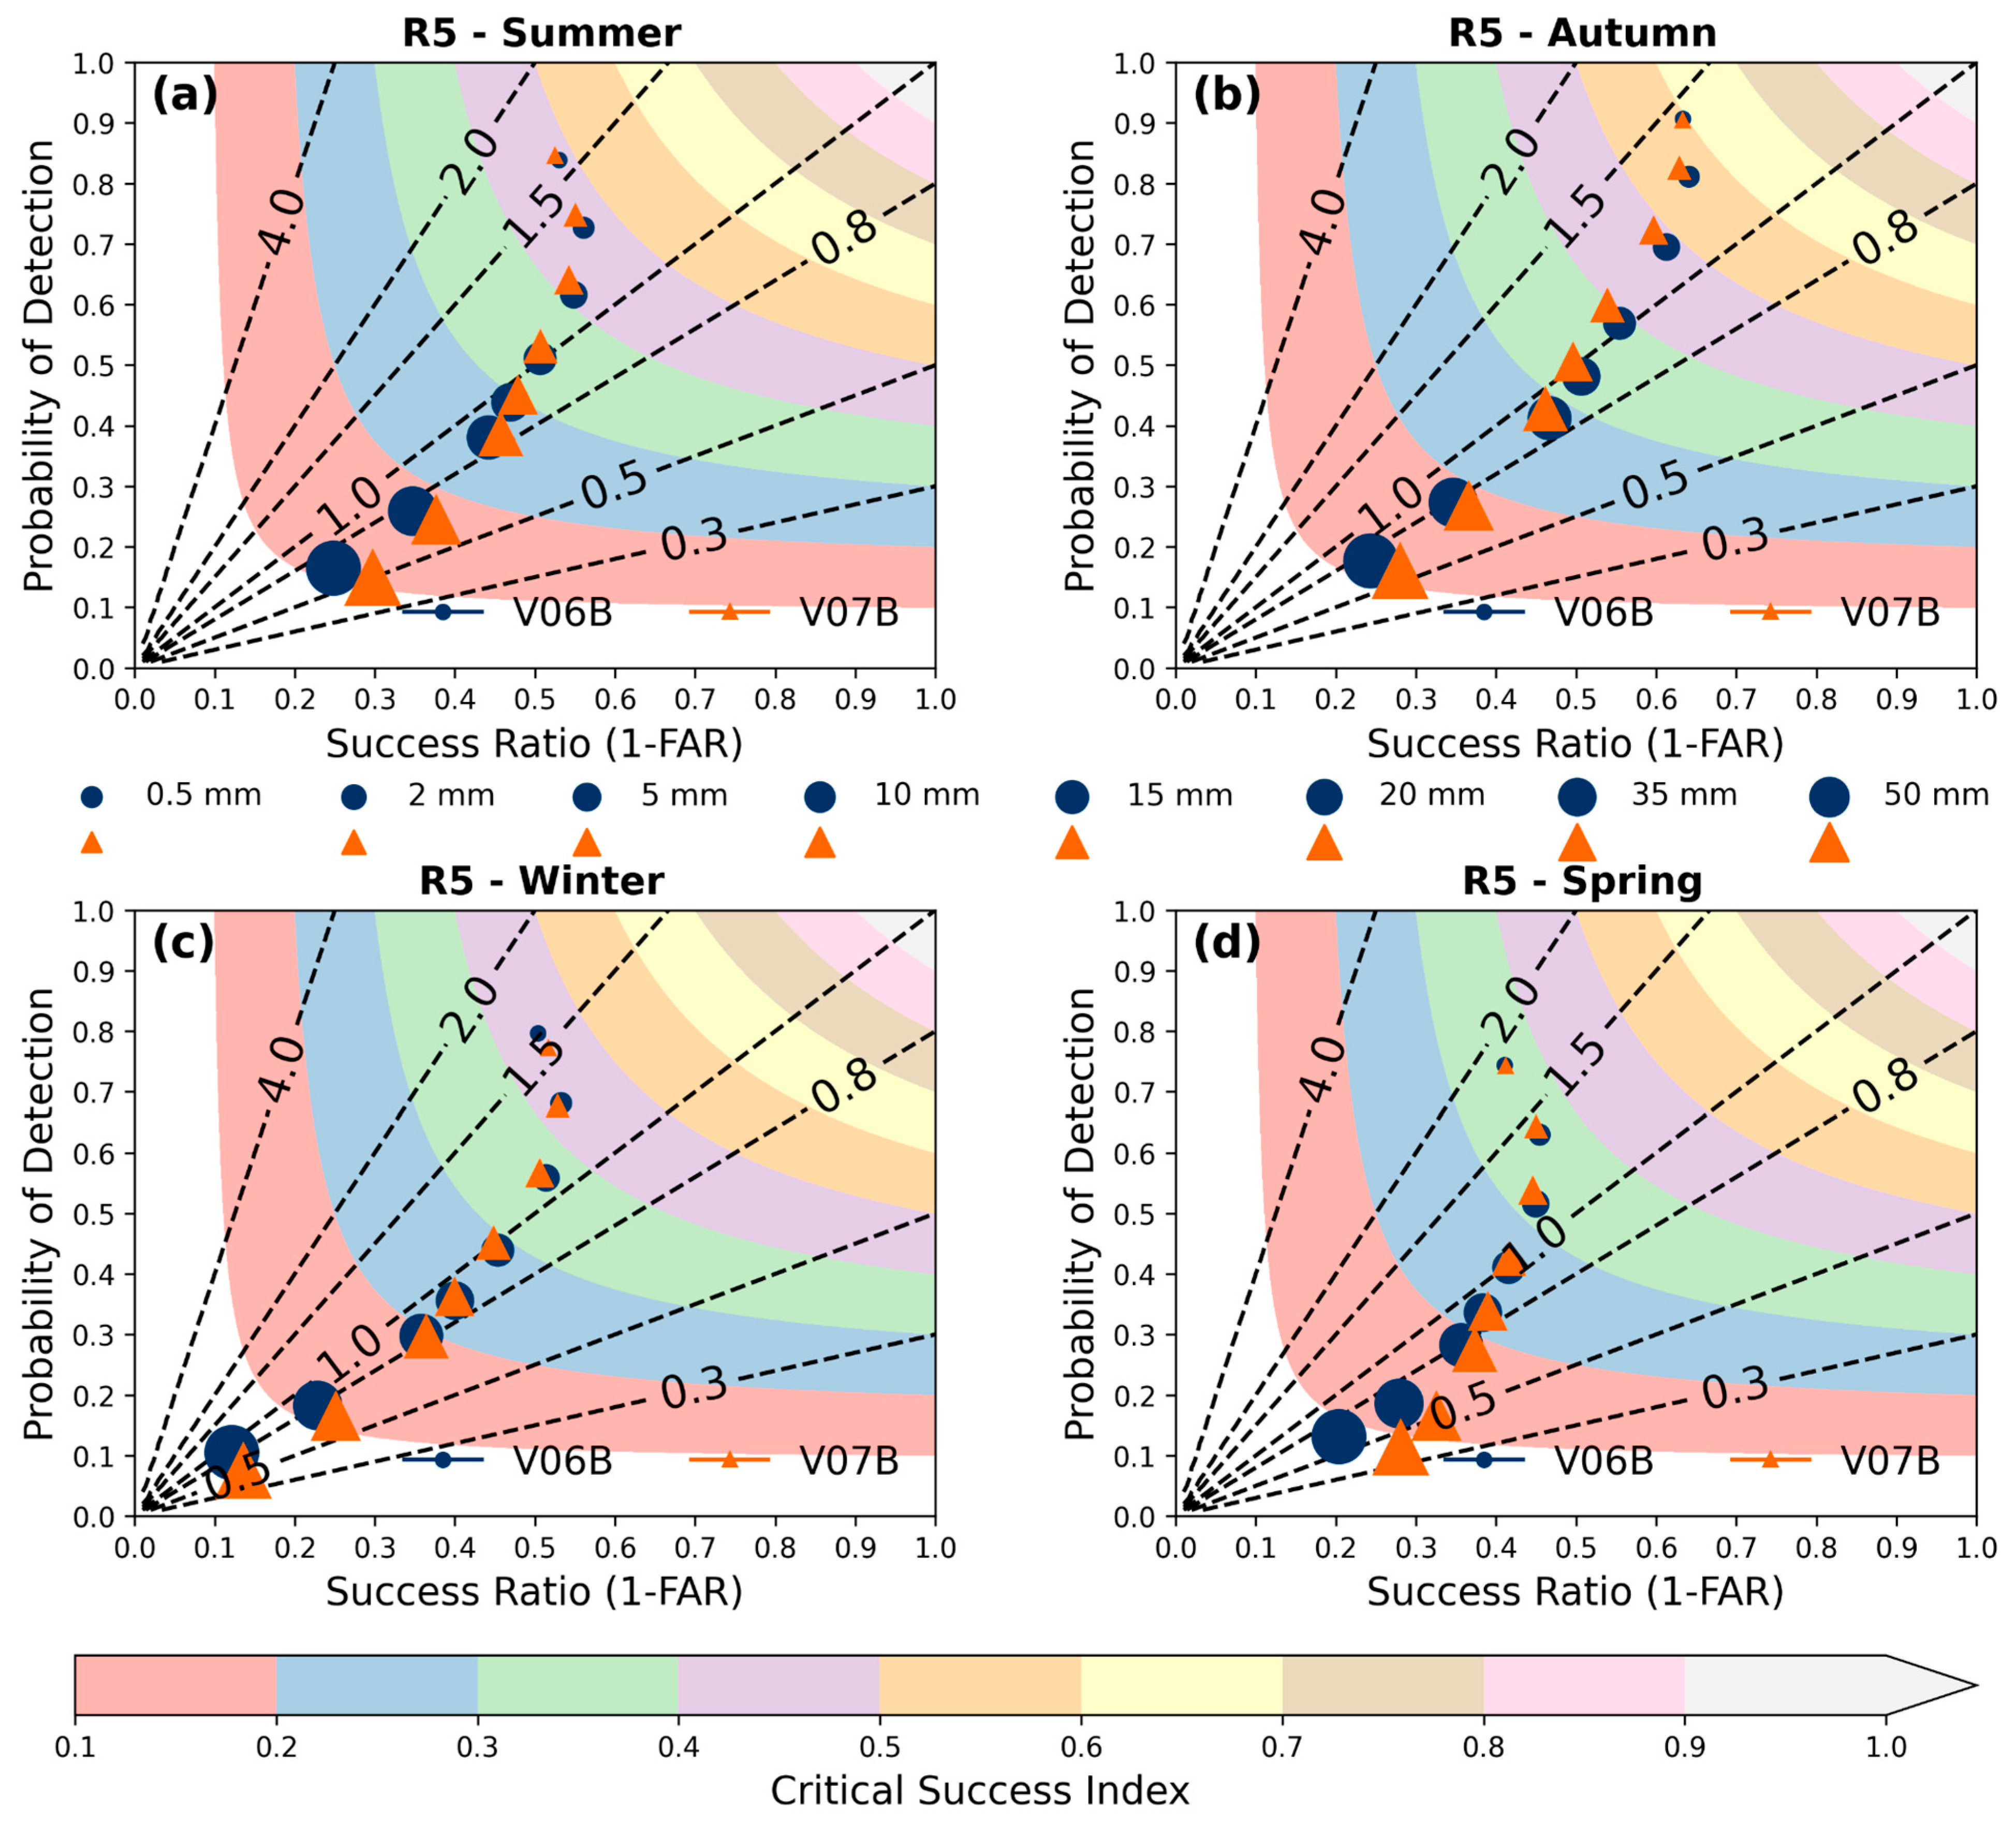
Region R5 (Figure 7e) exhibits the highest variability in RMSE values, with both versions showing pronounced peaks, particularly in recent years. During the autumn months, both versions record the largest errors, reaching up to 18.0 mm/day in 2019. However, these errors decrease substantially during the spring. On average, the RMSE values for version V06B are approximately 0.5 mm/day higher than those for version V07B. The performance diagram (Figure 16) reveals that both no-rain/rain categories and light rain events are strongly overestimated in both versions, while heavy rainfall tends to be underestimated, albeit to a lesser degree. This pattern is consistent across all four seasons. Specifically, for the 0.5 mm threshold in spring both versions overestimate approximately 80% of the events. Conversely, the most significant underestimations occur at the 50.0 mm threshold in version V07B during spring, affecting nearly 60% of the events. The most notable differences between the versions are observed for heavy rainfall, particularly in summer (Figure 16a) and spring (Figure 16d). This behavior is further supported by the ETSa results (Figure 17), which show that the performance of version V07B aligns closely with V06B for no-rain/rain categories, as well as for light and moderate rainfall. However, for heavy rainfall version V07B delivers more satisfactory results.

4. Discussion

4.1. Comparative Analysis of IMERG Versions V06B and V07B

Consistent with studies conducted in China [53], both versions of IMERG demonstrate a robust ability to capture major precipitation systems. In this study, these systems include the South Atlantic Convergence Zone (SACZ), the Intertropical Convergence Zone (ITCZ), and the mesoscale convective system (MCS), underscoring IMERG’s effectiveness in detecting primary precipitation sources at a regional scale. However, this effectiveness is limited in certain areas, such as the eastern region of Northeast Brazil, where detecting precipitation associated with warm-top clouds during winter remains challenging [48,54]. In this region, both versions, V06B and V07B, encounter difficulties due to the nature of warm-top clouds, which often exceed infrared thresholds and contain lower concentrations of suspended ice, reducing the sensitivity of passive microwave sensors [55,56]. As a result, satellite-based precipitation estimates frequently underestimate rainfall, representing a significant limitation for data accuracy in this area. Notably, the V07B version exhibits a slight reduction in estimated precipitation magnitude compared to V06B, potentially indicating an even greater underestimation and increasing uncertainties in data reliability for the region. To address these challenges, integrating multiple data sources, such as ground-based radar and rain gauges, can complement satellite observations and improve accuracy. Further advancements in algorithmic models, including the incorporation of parameters that account for warm-cloud characteristics, may enhance detection capabilities. Additionally, applying advanced machine-learning techniques for pattern recognition specific to warm-top cloud systems could improve estimations. Regional calibrations using high-resolution local observational data, as well as the development of sensors with increased sensitivity to subtle variations in cloud properties, offer promising pathways for mitigating errors and enhancing precipitation detection in these complex environments.
The comparison between precipitation estimates from versions V06B and V07B reveals that the most significant discrepancies occur in high-rainfall regions, such as the equatorial belt and the Atlantic and Pacific Oceans. These differences are primarily attributed to the reduced precipitation volume in version V07B, which, according to preliminary assessments by Huffman et al. [40], exhibits improved performance, particularly in areas with sparse or no gauge data, with notable enhancements in oceanic regions. Over land, the differences are less pronounced, likely due to the correction of precipitation estimates using the GPCC dataset in version V06B. However, as noted by Huffman et al. [40], this adjustment was not implemented in version V07B due to an unrealistic increase in precipitation observed during winter months over the continent. Discrepancies between the versions diminish from the winter of 2014 onward, indicating a convergence in more recent estimates, possibly resulting from algorithmic improvements or sensor recalibrations. Overall, version V06B tends to provide higher precipitation estimates than version V07B, particularly during the summer and fall seasons. These findings are consistent with those reported by Wang et al. [46].

4.2. Performance of IMERG Versions V06B and V07B in Different Precipitation Regimes

The analysis of continuous and dichotomous statistical indices across the five regions of Brazil reveals distinct performance patterns between the V06B and V07B versions of IMERG. These differences are influenced by the regional and seasonal variability of precipitation characteristics [57], as well as the methodological enhancements incorporated in the V07B version [58]. Overall, V07B outperforms V06B, particularly in regions and periods associated with intense rainfall, such as R1, R2, and R5. In these areas, V07B demonstrates notable reductions in the RMSE and improvements in quantitative precipitation indices, including ETSa, CSI, BIAS, FAR, and POD. These enhancements are primarily attributed to V07B’s capacity to mitigate overestimations in precipitation estimates, especially in regions dominated by cold-top cloud systems. A shared limitation of both versions is the tendency to overestimate precipitation at rain/no-rain thresholds and for light rainfall across all seasons.
Despite being the latest and most advanced version, V07B does not consistently outperform V06B across all aspects or regions. For example, in region R3 the differences between the two versions are less pronounced. In some cases, such as during the winter, V06B demonstrates better performance in terms of BIAS, albeit with a lower hit rate. Conversely, in region R4 V07B shows more pronounced underestimations, particularly during the winter and spring, underscoring its limitations in addressing the specific climatic conditions of this area. These underestimations are likely linked to the predominance of warm-cloud precipitation systems in the region, which rely primarily on the coalescence process for raindrop formation [59]. This process lacks the ice-phase dynamics typically detected by satellite sensors. Moreover, the relatively warm cloud tops produce weaker thermal contrasts in infrared measurements and diminished signals at microwave frequencies, further complicating the accurate detection and quantification of precipitation [60]. Nonetheless, when the effect of BIAS is removed through the ETSa index, V07B demonstrates superior performance in these regions.

5. Conclusions

In this study, precipitation estimates from the IMERG Final versions V07B and V06B were compared over South America and the adjacent oceans, and evaluated against surface observations under different precipitation regimes in Brazil across all four seasons. The main conclusions of this study are as follows:
(1)
Both IMERG versions effectively capture the seasonal precipitation patterns associated with key precipitation systems active in South America, including the SACZ, ITCZ, and MCS;
(2)
The most significant discrepancies between the two versions are observed over oceanic regions and continental areas lacking gauge data, with V06B consistently estimating higher rainfall volumes than V07B. In contrast, these differences are less pronounced over land;
(3)
During the winter months in the eastern region of Northeast Brazil, where SPPs face challenges in estimating precipitation associated with warm cloud tops, version V07B tends to further underestimate precipitation volumes;
(4)
Over the years, particularly over oceanic regions, V06B has shown a trend of decreasing precipitation volume, a pattern not observed in V07B;
(5)
In general, RMSE values for version V07B are lower than those for version V06B in all analyzed regions;
(6)
In regions R1, R2, and R5, both versions tend to overestimate the rain/no-rain and light rainfall classes, while for moderate rainfall the BIAS approaches 1.0. Other dichotomous indices, such as POD, FAR, and CSI, indicate a superior performance by V07B;
(7)
Regions R3 (winter) and R4 (winter and spring) exhibited the most unfavorable results for both versions, with extremely low POD and CSI values, high FAR indices, and pronounced underestimation across all precipitation classes. In these regions and seasons, version V07B performs worse than V06B, further intensifying the underestimations;
(8)
From the perspective of ETSa, which eliminates the effect of BIAS, version V07B demonstrated a superior performance to V06B in most situations, was equivalent in some, but was never inferior.

Author Contributions

Acquisition and processing of data, J.R.R.; statistical calculations, J.R.R.; preparation of the graphical abstract and figures, G.R.; writing of the manuscript, J.R.R.; language revision: G.R. All authors have read and agreed to the published version of the manuscript.

Funding

This research received no external funding.

Data Availability Statement

The raw data supporting the conclusions of this article will be made available by the authors upon request, as we do not have a data repository website.

Acknowledgments

The authors would like to extend their sincere gratitude to the anonymous reviewers and editorial staff for their valuable comments and suggestions, which greatly improved the quality of this paper. We are also deeply thankful to the National Institute for Space Research (INPE) for financial support and to the National Aeronautics and Space Administration (NASA) for providing the IMERG Final precipitation estimates (versions V06 and V07), which were fundamental to the success of this study. The collaboration and resources from both INPE and NASA have been invaluable in advancing our research and contributing to the field of satellite-based precipitation analysis.

Conflicts of Interest

The authors declare no conflicts of interest.

References

  1. Trenberth, K.E.; Dai, A.; Rasmussen, R.M.; Parsons, D.B. The Changing Character of Precipitation. Bull. Am. Meteorol. Soc. 2003, 84, 1205–1218. [Google Scholar] [CrossRef]
  2. Mitchell, J.F.B.; Wilson, C.A.; Cunnington, W.M. On Co2 Climate Sensitivity and Model Dependence of Results. Q. J. R. Meteorol. Soc. 1987, 113, 293–322. [Google Scholar] [CrossRef]
  3. Sherwood, S.; Fu, Q. A Drier Future? Science 2014, 343, 737–739. [Google Scholar] [CrossRef] [PubMed]
  4. Kelley, O.A. Where the Least Rainfall Occurs in the Sahara Desert, the TRMM Radar Reveals a Different Pattern of Rainfall Each Season. J. Clim. 2014, 27, 6919–6939. [Google Scholar] [CrossRef]
  5. Schween, J.H.; Hoffmeister, D.; Löhnert, U. Filling the Observational Gap in the Atacama Desert with a New Network of Climate Stations. Glob. Planet. Chang. 2020, 184, 103034. [Google Scholar] [CrossRef]
  6. Knox, R.; Bisht, G.; Wang, J.; Bras, R. Precipitation Variability over the Forest-to-Nonforest Transition in Southwestern Amazonia. J. Clim. 2011, 24, 2368–2377. [Google Scholar] [CrossRef]
  7. New, M.; Todd, M.; Hulme, M.; Jones, P. Precipitation Measurements and Trends in the Twentieth Century. Int. J. Climatol. 2001, 21, 1889–1922. [Google Scholar] [CrossRef]
  8. Xu, L.; Chen, N.; Moradkhani, H.; Zhang, X.; Hu, C. Improving Global Monthly and Daily Precipitation Estimation by Fusing Gauge Observations, Remote Sensing, and Reanalysis Data Sets. Water Resour. Res. 2020, 56, e2019WR026444. [Google Scholar] [CrossRef]
  9. Kummerow, C.; Barnes, W.; Kozu, T.; Shiue, J.; Simpson, J. The Tropical Rainfall Measuring Mission (TRMM) Sensor Package. J. Atmos. Ocean. Technol. 1998, 15, 809–817. [Google Scholar] [CrossRef]
  10. Kubota, T.; Shige, S.; Hashizume, H.; Aonashi, K.; Takahashi, N.; Seto, S.; Hirose, M.; Takayabu, Y.N.; Ushio, T.; Nakagawa, K.; et al. Global Precipitation Map Using Satellite-Borne Microwave Radiometers by the GSMaP Project: Production and Validation. IEEE Trans. Geosci. Remote Sens. 2007, 45, 2259–2275. [Google Scholar] [CrossRef]
  11. Hou, A.Y.; Kakar, R.K.; Neeck, S.; Azarbarzin, A.A.; Kummerow, C.D.; Kojima, M.; Oki, R.; Nakamura, K.; Iguchi, T. The Global Precipitation Measurement Mission. Bull. Am. Meteorol. Soc. 2014, 95, 701–722. [Google Scholar] [CrossRef]
  12. Sharifi, E.; Steinacker, R.; Saghafian, B. Assessment of GPM-IMERG and Other Precipitation Products against Gauge Data under Different Topographic and Climatic Conditions in Iran: Preliminary Results. Remote Sens. 2016, 8, 135. [Google Scholar] [CrossRef]
  13. Boluwade, A.; Stadnyk, T.; Fortin, V.; Roy, G. Assimilation of Precipitation Estimates from the Integrated Multisatellite Retrievals for GPM (IMERG, Early Run) in the Canadian Precipitation Analysis (CaPA). J. Hydrol. Reg. Stud. 2017, 14, 10–22. [Google Scholar] [CrossRef]
  14. Ruhi, A.; Messager, M.L.; Olden, J.D. Tracking the Pulse of the Earth’s Fresh Waters. Nat. Sustain. 2018, 1, 198–203. [Google Scholar] [CrossRef]
  15. Papalexiou, S.M.; Montanari, A. Global and Regional Increase of Precipitation Extremes Under Global Warming. Water Resour. Res. 2019, 55, 4901–4914. [Google Scholar] [CrossRef]
  16. Jones, J.A.; Trahel, V.; Hakopian, C. Threats to Global Water Security; Springer Science & Business Media: Berlin/Heidelberg, Germany, 2009; ISBN 978-90-481-2344-5. [Google Scholar]
  17. Dalin, C.; Wada, Y.; Kastner, T.; Puma, M.J. Groundwater Depletion Embedded in International Food Trade. Nature 2017, 543, 700–704. [Google Scholar] [CrossRef]
  18. Huffman, G.J.; Bolvin, D.T.; Braithwaite, D.; Hsu, K.; Joyce, R.; Xie, P.; Yoo, S.H. NASA Global Precipitation Measurement (GPM) Integrated Multi-Satellite Retrievals for GPM (IMERG). Algorithm Theor. Basis Doc. Version 2015, 4, 2020-05. [Google Scholar]
  19. Aonashi, K.; Awaka, J.; Hirose, M.; Kozu, T.; Kubota, T.; Liu, G.; Shige, S.; Kida, S.; Seto, S.; Takahashi, N.; et al. GSMaP Passive Microwave Precipitation Retrieval Algorithm: Algorithm Description and Validation. J. Meteorol. Soc. Jpn. Ser II 2009, 87A, 119–136. [Google Scholar] [CrossRef]
  20. Joyce, R.J.; Janowiak, J.E.; Arkin, P.A.; Xie, P. CMORPH: A Method That Produces Global Precipitation Estimates from Passive Microwave and Infrared Data at High Spatial and Temporal Resolution. J. Hydrometeorol. 2004, 5, 487–503. [Google Scholar] [CrossRef]
  21. Hsu, K.; Gao, X.; Sorooshian, S.; Gupta, H.V. Precipitation Estimation from Remotely Sensed Information Using Artificial Neural Networks. J. Appl. Meteorol. 1997, 36, 1176–1190. [Google Scholar] [CrossRef]
  22. Huffman, G.J.; Bolvin, D.T.; Nelkin, E.J.; Wolff, D.B.; Adler, R.F.; Gu, G.; Hong, Y.; Bowman, K.P.; Stocker, E.F. The TRMM Multisatellite Precipitation Analysis (TMPA): Quasi-Global, Multiyear, Combined-Sensor Precipitation Estimates at Fine Scales. J. Hydrometeorol. 2007, 8, 38–55. [Google Scholar] [CrossRef]
  23. Funk, C.; Peterson, P.; Landsfeld, M.; Pedreros, D.; Verdin, J.; Shukla, S.; Husak, G.; Rowland, J.; Harrison, L.; Hoell, A.; et al. The Climate Hazards Infrared Precipitation with Stations—A New Environmental Record for Monitoring Extremes. Sci. Data 2015, 2, 150066. [Google Scholar] [CrossRef] [PubMed]
  24. Adler, R.F.; Huffman, G.J.; Chang, A.; Ferraro, R.; Xie, P.-P.; Janowiak, J.; Rudolf, B.; Schneider, U.; Curtis, S.; Bolvin, D.; et al. The Version-2 Global Precipitation Climatology Project (GPCP) Monthly Precipitation Analysis (1979–Present). J. Hydrometeorol. 2003, 4, 1147–1167. [Google Scholar] [CrossRef]
  25. Wang, J.; Wolff, D.B.; Tan, J.; Marks, D.A.; Pippitt, J.L.; Huffman, G.J. Validation of IMERG Oceanic Precipitation over Kwajalein. Remote Sens. 2022, 14, 3753. [Google Scholar] [CrossRef]
  26. Maggioni, V.; Meyers, P.C.; Robinson, M.D. A Review of Merged High-Resolution Satellite Precipitation Product Accuracy during the Tropical Rainfall Measuring Mission (TRMM) Era. J. Hydrometeorol. 2016, 17, 1101–1117. [Google Scholar] [CrossRef]
  27. Tan, J.; Petersen, W.A.; Kirstetter, P.-E.; Tian, Y. Performance of IMERG as a Function of Spatiotemporal Scale. J. Hydrometeorol. 2017, 18, 307–319. [Google Scholar] [CrossRef]
  28. Chen, H.; Yong, B.; Kirstetter, P.-E.; Wang, L.; Hong, Y. Global Component Analysis of Errors in Three Satellite-Only Global Precipitation Estimates. Hydrol. Earth Syst. Sci. 2021, 25, 3087–3104. [Google Scholar] [CrossRef]
  29. Maggioni, V.; Massari, C.; Kidd, C. Errors and Uncertainties Associated with Quasiglobal Satellite Precipitation Products. In Precipitation Science; Elsevier: Amsterdam, The Netherlands, 2022; pp. 377–390. ISBN 978-0-12-822973-6. [Google Scholar]
  30. Piani, C.; Weedon, G.P.; Best, M.; Gomes, S.M.; Viterbo, P.; Hagemann, S.; Haerter, J.O. Statistical Bias Correction of Global Simulated Daily Precipitation and Temperature for the Application of Hydrological Models. J. Hydrol. 2010, 395, 199–215. [Google Scholar] [CrossRef]
  31. Katiraie-Boroujerdy, P.-S.; Rahnamay Naeini, M.; Akbari Asanjan, A.; Chavoshian, A.; Hsu, K.; Sorooshian, S. Bias Correction of Satellite-Based Precipitation Estimations Using Quantile Mapping Approach in Different Climate Regions of Iran. Remote Sens. 2020, 12, 2102. [Google Scholar] [CrossRef]
  32. Shen, Z.; Yong, B.; Gourley, J.J.; Qi, W. Real-Time Bias Adjustment for Satellite-Based Precipitation Estimates over Mainland China. J. Hydrol. 2021, 596, 126133. [Google Scholar] [CrossRef]
  33. Rozante, J.R.; Moreira, D.S.; de Goncalves, L.G.G.; Vila, D.A. Combining TRMM and Surface Observations of Precipitation: Technique and Validation over South America. Weather Forecast. 2010, 25, 885–894. [Google Scholar] [CrossRef]
  34. Li, W.; Jiang, Q.; He, X.; Sun, H.; Sun, W.; Scaioni, M.; Chen, S.; Li, X.; Gao, J.; Hong, Y. Effective Multi-Satellite Precipitation Fusion Procedure Conditioned by Gauge Background Fields over the Chinese Mainland. J. Hydrol. 2022, 610, 127783. [Google Scholar] [CrossRef]
  35. Chen, S.; Xiong, L.; Ma, Q.; Kim, J.-S.; Chen, J.; Xu, C.-Y. Improving Daily Spatial Precipitation Estimates by Merging Gauge Observation with Multiple Satellite-Based Precipitation Products Based on the Geographically Weighted Ridge Regression Method. J. Hydrol. 2020, 589, 125156. [Google Scholar] [CrossRef]
  36. Alharbi, R.; Hsu, K.; Sorooshian, S. Bias Adjustment of Satellite-Based Precipitation Estimation Using Artificial Neural Networks-Cloud Classification System over Saudi Arabia. Arab. J. Geosci. 2018, 11, 508. [Google Scholar] [CrossRef]
  37. Pan, B.; Hsu, K.; AghaKouchak, A.; Sorooshian, S. Improving Precipitation Estimation Using Convolutional Neural Network. Water Resour. Res. 2019, 55, 2301–2321. [Google Scholar] [CrossRef]
  38. Le, X.-H.; Nguyen Van, L.; Hai Nguyen, D.; Nguyen, G.V.; Jung, S.; Lee, G. Comparison of Bias-Corrected Multisatellite Precipitation Products by Deep Learning Framework. Int. J. Appl. Earth Obs. Geoinf. 2023, 116, 103177. [Google Scholar] [CrossRef]
  39. Huffman, G.J.; Stocker, E.F.; Bolvin, D.T.; Nelkin, E.; Tan, J. GPM IMERG Final Precipitation L3 Half Hourly 0.1 Degree X 0.1 Degree V06; Goddard Earth Sciences Data and Information Services Center (GES DISC): Greenbelt, MD, USA, 2019. [Google Scholar]
  40. Huffman, G.J.; Bolvin, D.T.; Joyce, R.; Nelkin, E.J.; Tan, J.; Braithwaite, D.; Hsu, K.; Kelley, O.A.; Nguyen, P.; Sorooshian, S.; et al. Algorithm Theoretical Basis Document (ATBD) NASA Global Precipitation Measurement (GPM) Integrated Multi-Satellite Retrievals for GPM (IMERG), Version 07 2023; National Aeronautics and Space Administration: Washington, DC, USA, 2018. [Google Scholar]
  41. Ramsauer, T.; Marzahn, P. Global Soil Moisture Estimation Based on GPM IMERG Data Using a Site Specific Adjusted Antecedent Precipitation Index. Int. J. Remote Sens. 2023, 44, 542–566. [Google Scholar] [CrossRef]
  42. Watters, D.C.; Gatlin, P.N.; Bolvin, D.T.; Huffman, G.J.; Joyce, R.; Kirstetter, P.; Nelkin, E.J.; Ringerud, S.; Tan, J.; Wang, J.; et al. Oceanic Validation of IMERG-GMI Version 6 Precipitation Using the GPM Validation Network. J. Hydrometeorol. 2024, 25, 125–142. [Google Scholar] [CrossRef]
  43. Gan, F.; Gao, Y.; Xiao, L. Comprehensive Validation of the Latest IMERG V06 Precipitation Estimates over a Basin Coupled with Coastal Locations, Tropical Climate and Hill-Karst Combined Landform. Atmos. Res. 2021, 249, 105293. [Google Scholar] [CrossRef]
  44. Ali, M.; Nazir, J. Validation of Global Precipitation Measurements (GPM) Over Two Different Physiographic Regions of Pakistan. In Proceedings of the IGARSS 2022-2022 IEEE International Geoscience and Remote Sensing Symposium, Kuala Lumpur, Malaysia, 17–22 July 2022; IEEE: Kuala Lumpur, Malaysia, 2022; pp. 6468–6470. [Google Scholar]
  45. Li, L.; Chen, X.; Ma, Y.; Zhao, W.; Zuo, H.; Liu, Y.; Cao, D.; Xu, X. Implications for Validation of IMERG Satellite Precipitation in a Complex Mountainous Region. Remote Sens. 2023, 15, 4380. [Google Scholar] [CrossRef]
  46. Wang, Y.; Li, Z.; Gao, L.; Zhong, Y.; Peng, X. Comparison of GPM IMERG Version 06 Final Run Products and Its Latest Version 07 Precipitation Products across Scales: Similarities, Differences and Improvements. Remote Sens. 2023, 15, 5622. [Google Scholar] [CrossRef]
  47. Ramadhan, R.; Marzuki, M.; Suryanto, W.; Sholihun, S.; Yusnaini, H.; Muharsyah, R. Validating IMERG Data for Diurnal Rainfall Analysis across the Indonesian Maritime Continent Using Gauge Observations. Remote Sens. Appl. Soc. Environ. 2024, 34, 101186. [Google Scholar] [CrossRef]
  48. Rozante, J.R.; Vila, D.A.; Barboza Chiquetto, J.; Fernandes, A.D.A.; Souza Alvim, D. Evaluation of TRMM/GPM Blended Daily Products over Brazil. Remote Sens. 2018, 10, 882. [Google Scholar] [CrossRef]
  49. Roebber, P.J. Visualizing Multiple Measures of Forecast Quality. Weather Forecast. 2009, 24, 601–608. [Google Scholar] [CrossRef]
  50. Mesinger, F. Bias Adjusted Precipitation Threat Scores. Adv. Geosci. 2008, 16, 137–142. [Google Scholar] [CrossRef]
  51. Guo, H.; Chen, S.; Bao, A.; Behrangi, A.; Hong, Y.; Ndayisaba, F.; Hu, J.; Stepanian, P.M. Early Assessment of Integrated Multi-Satellite Retrievals for Global Precipitation Measurement over China. Atmos. Res. 2016, 176–177, 121–133. [Google Scholar] [CrossRef]
  52. Rozante, J.R.; Cavalcanti, I.F.A. Regional Eta Model Experiments: SALLJEX and MCS Development. J. Geophys. Res. Atmos. 2008, 113, D17106. [Google Scholar] [CrossRef]
  53. Guo, H.; Tian, Y.; Li, J.; Guo, C.; Meng, X.; Wang, W.; De Maeyer, P. Has IMERG_V07 Improved the Precision of Precipitation Retrieval in Mainland China Compared to IMERG_V06? Remote Sens. 2024, 16, 2671. [Google Scholar] [CrossRef]
  54. Rozante, J.R.; Gutierrez, E.R.; Fernandes, A.D.A.; Vila, D.A. Performance of Precipitation Products Obtained from Combinations of Satellite and Surface Observations. Int. J. Remote Sens. 2020, 41, 7585–7604. [Google Scholar] [CrossRef]
  55. Liu, C.; Zipser, E.J. “Warm Rain” in the Tropics: Seasonal and Regional Distributions Based on 9 Yr of TRMM Data. J. Clim. 2009, 22, 767–779. [Google Scholar] [CrossRef]
  56. Machado, L.A.T.; Silva Dias, M.A.F.; Morales, C.; Fisch, G.; Vila, D.; Albrecht, R.; Goodman, S.J.; Calheiros, A.J.P.; Biscaro, T.; Kummerow, C.; et al. The Chuva Project: How Does Convection Vary across Brazil? Bull. Am. Meteorol. Soc. 2014, 95, 1365–1380. [Google Scholar] [CrossRef]
  57. Luiz-Silva, W.; Oscar-Júnior, A.C.; Cavalcanti, I.F.A.; Treistman, F. An Overview of Precipitation Climatology in Brazil: Space-Time Variability of Frequency and Intensity Associated with Atmospheric Systems. Hydrol. Sci. J. 2021, 66, 289–308. [Google Scholar] [CrossRef]
  58. Huffman, G.; Bolvin, D.; Joyce, R.; Nelkin, E.; Tan, J. Lessons Learned in V07 IMERG 2023. In EGU General Assembly Conference Abstracts; NASA ADS: Cambridge, MA, USA, 2023. [Google Scholar]
  59. Stephens, G.L.; Haynes, J.M. Near Global Observations of the Warm Rain Coalescence Process. Geophys. Res. Lett. 2007, 34, 2007GL030259. [Google Scholar] [CrossRef]
  60. Prigent, C. Precipitation Retrieval from Space: An Overview. Comptes Rendus Géoscience 2010, 342, 380–389. [Google Scholar] [CrossRef]
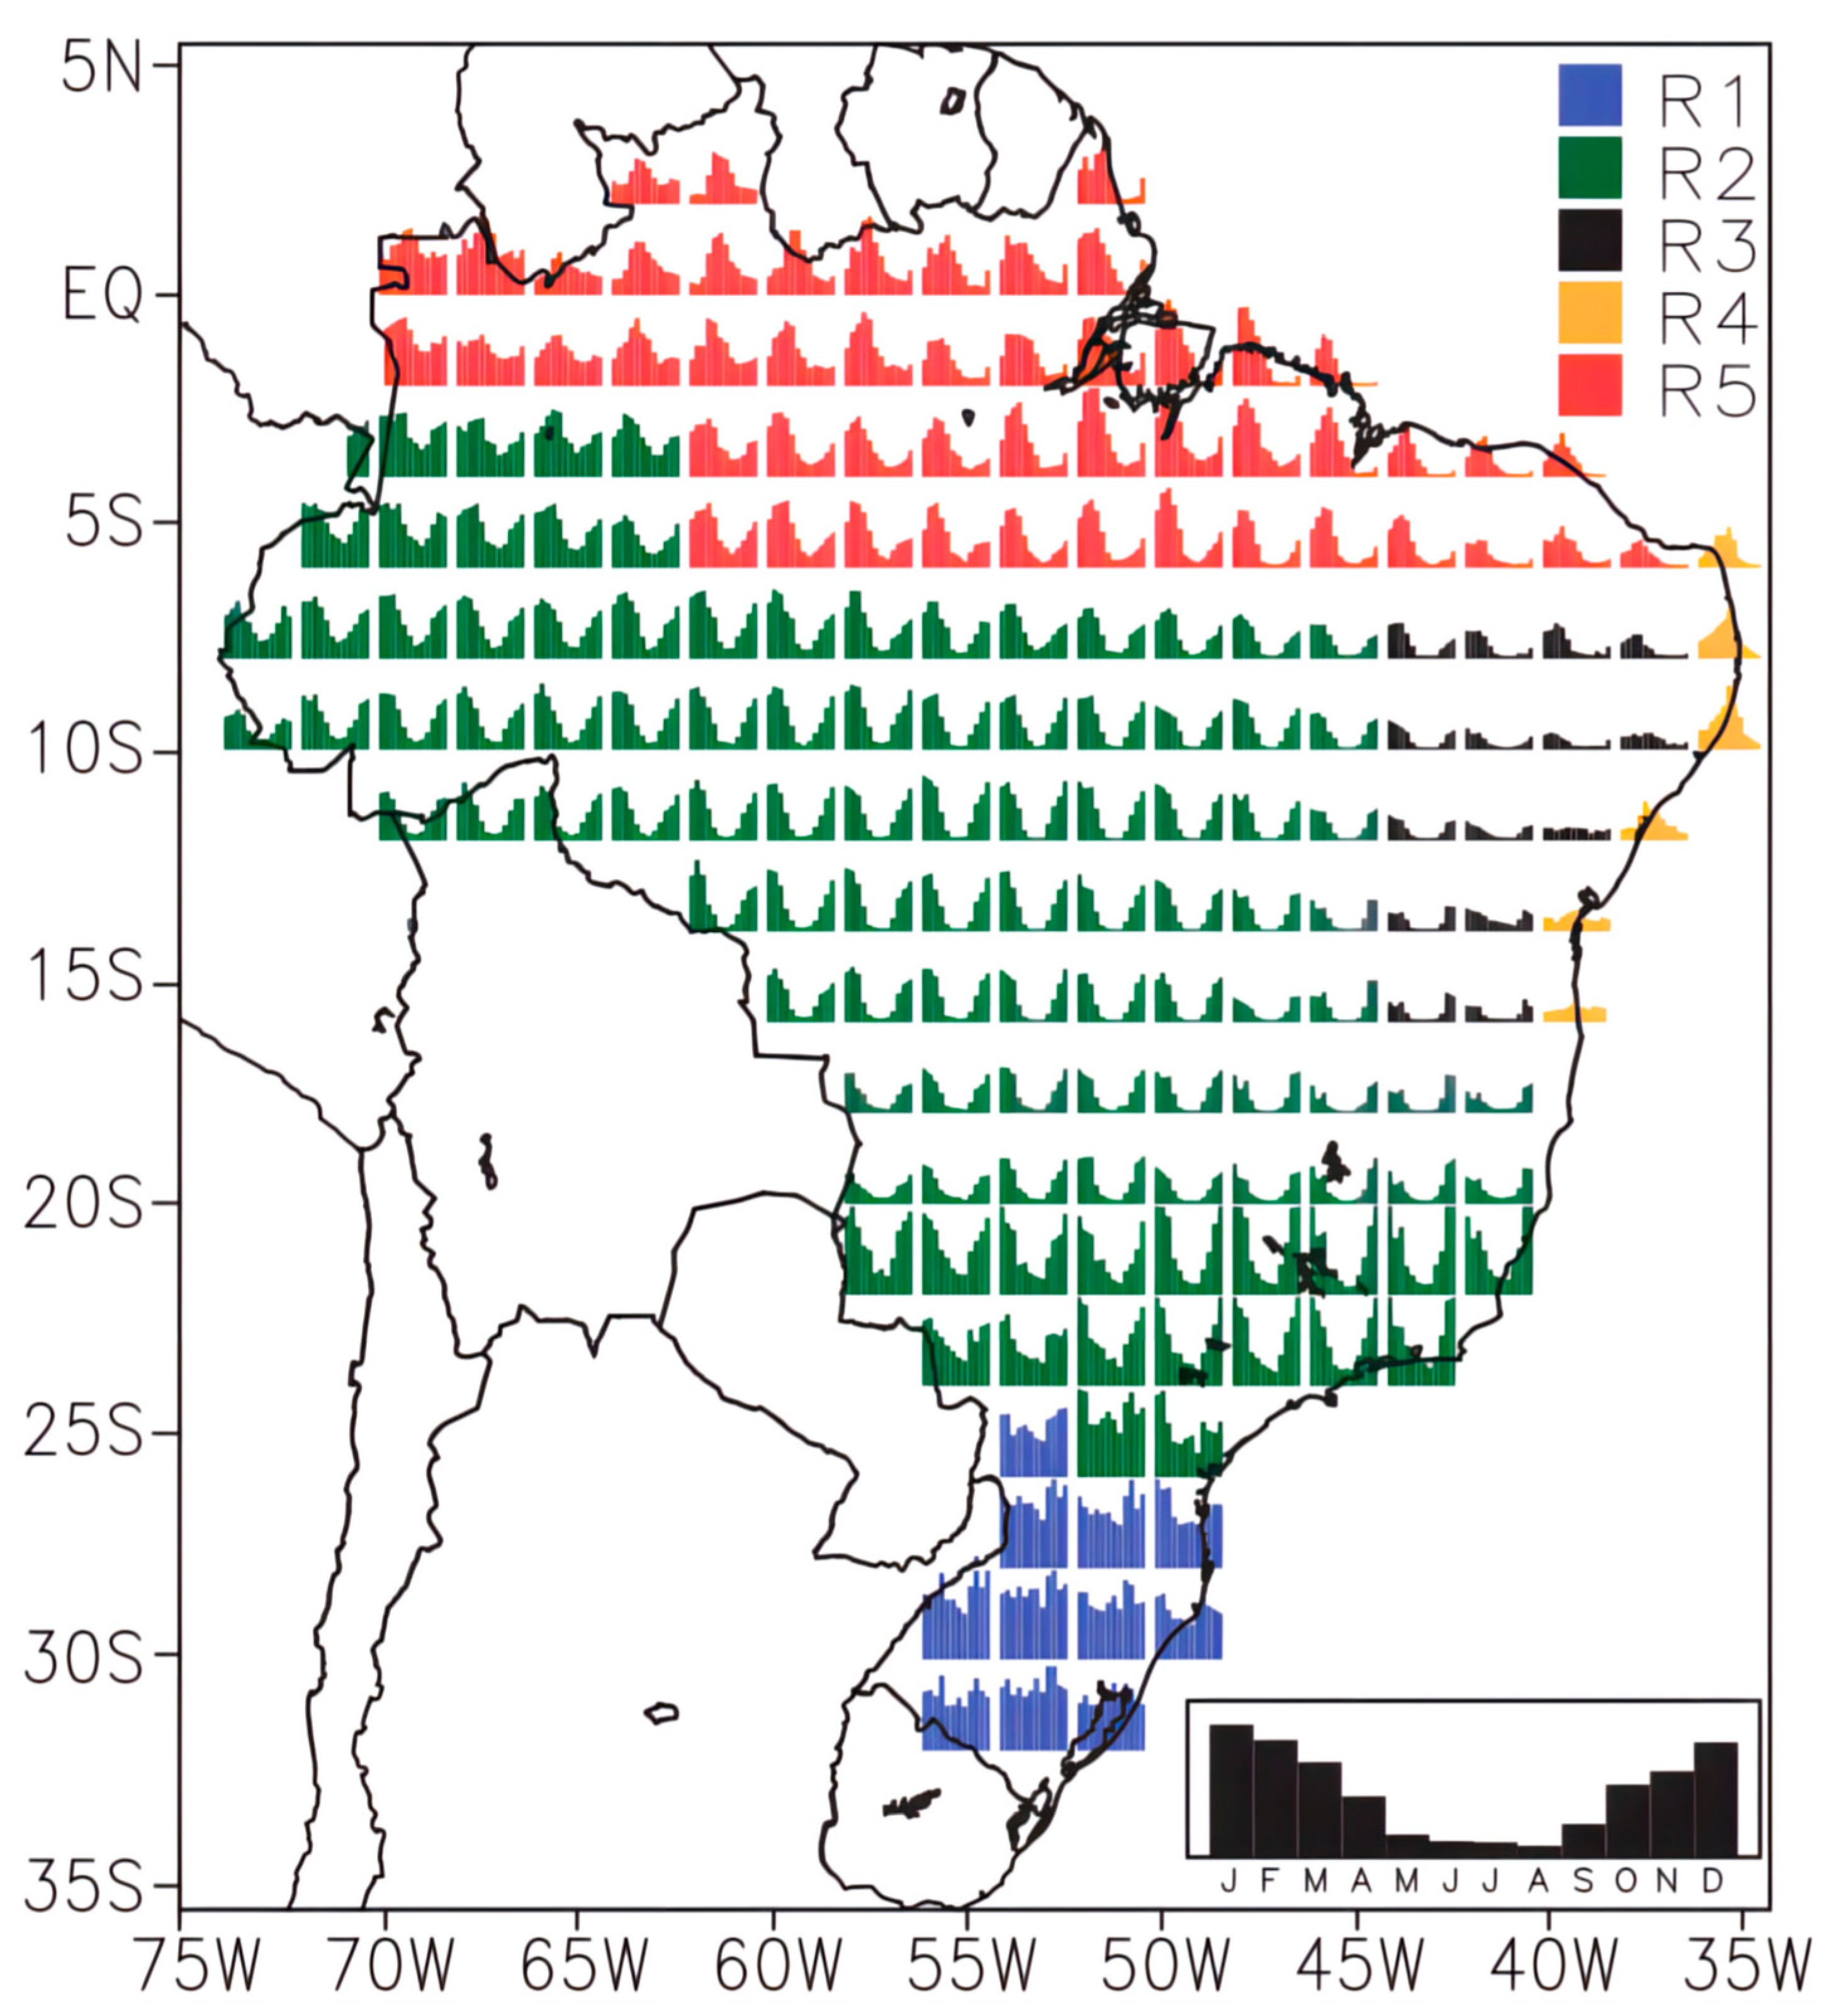
Figure 1. Spatial distribution of precipitation climatology (1998–2016) based on MERGE data for the five identified regions, for each grid box of approximately 2 degrees.
Remotesensing 16 04722 g001
Figure 2. Spatial distribution of grid points with rain gauges and the number of measurements from each rain gauge throughout the study period.
Remotesensing 16 04722 g002
Figure 3. Temporal evolution of the number of grid points with rain gauges for regions R1 (blue), R2 (green), R3 (black), R4 (orange), and R5 (red).
Remotesensing 16 04722 g003
Figure 4. Spatial distribution of the seasonal accumulated precipitation average over the entire study period for the V06B (ad) and V07B (eh) versions, along with their differences (il).
Remotesensing 16 04722 g004
Figure 5. Temporal evolution of the spatially averaged accumulated seasonal precipitation, calculated for the entire domain (a), continent (b), and oceans (c), along with trend lines for the V06B and V07B versions.
Remotesensing 16 04722 g005
Figure 6. Spatial distribution of the seasonal precipitation RMSE obtained from versions V06B (a,d,g,j), V07B (b,e,h,k), and their respective differences (c,f,i,l).
Remotesensing 16 04722 g006
Figure 7. Temporal evolution of the seasonal precipitation RMSE for versions V06B (blue) and V07B (orange) in regions R1 (a), R2 (b), R3 (c), R4 (d), and R5 (e).
Remotesensing 16 04722 g007
Figure 8. Performance diagram comparing versions V06B (blue circle) and V07B (orange triangle) in region R1 for the summer (a), autumn (b), winter (c), and spring (d) seasons. The symbols with increasing sizes shown in the figure indicate the precipitation thresholds.
Remotesensing 16 04722 g008
Figure 9. Adjusted equitable threat score for precipitation estimated by versions V06B (blue) and V07B (orange) for the summer (a), autumn (b), winter (c), and spring (d) months, calculated for region R1.
Remotesensing 16 04722 g009
Figure 10. Performance diagram comparing versions V06B (blue circle) and V07B (orange triangle) in region R2 for the summer (a), autumn (b), winter (c), and spring (d) seasons. The symbols with increasing sizes shown in the figure indicate the precipitation thresholds.
Remotesensing 16 04722 g010
Figure 11. Adjusted equitable threat score for precipitation estimated by versions V06B (blue) and V07B (orange) for the summer (a), autumn (b), winter (c), and spring (d) months, calculated for region R2.
Remotesensing 16 04722 g011
Figure 12. Performance diagram comparing versions V06B (blue circle) and V07B (orange triangle) in region R3 for the summer (a), autumn (b), winter (c), and spring (d) seasons. The symbols with increasing sizes shown in the figure indicate the precipitation thresholds.
Remotesensing 16 04722 g012
Figure 13. Adjusted equitable threat score for precipitation estimated by versions V06B (blue) and V07B (orange) for the summer (a), autumn (b), winter (c), and spring (d) months, calculated for region R3.
Remotesensing 16 04722 g013
Figure 14. Performance diagram comparing versions V06B (blue circle) and V07B (orange triangle) in region R4 for the summer (a), autumn (b), winter (c), and spring (d) seasons. The symbols with increasing sizes shown in the figure indicate the precipitation thresholds.
Remotesensing 16 04722 g014
Figure 15. Adjusted equitable threat score for precipitation estimated by versions V06B (blue) and V07B (orange) for the summer (a), autumn (b), winter (c), and spring (d) months, calculated for region R4.
Remotesensing 16 04722 g015
Figure 16. Performance diagram comparing versions V06B (blue circle) and V07B (orange triangle) in region R5 for the summer (a), autumn (b), winter (c), and spring (d) seasons. The symbols with increasing sizes shown in the figure indicate the precipitation thresholds.
Remotesensing 16 04722 g016
Figure 17. Adjusted equitable threat score for precipitation estimated by versions V06B (blue) and V07B (orange) for the summer (a), autumn (b), winter (c), and spring (d) months, calculated for region R4.
Remotesensing 16 04722 g017
Table 1. Statistical index.
Statistical IndexEquationOptimum Value
Root Mean Square Error R M S E = i = 1 N ( P i O i ) 2 N 0
P—precipitation products (IMERG V06B or V07B); O—observational data; i—grid points with rain gauges; N—number of grid points with rain gauges.
Table 2. Contingency table.
Rain (Gauge)No Rain (Gauge)Total
Rain (Precipitation products) a = HbP = (a + b)
No rain (Precipitation products)cd(c + d)
TotalO = (a + c)(b + d)N = (a + b + c + d)
a—hit; (H)—an event estimated to occur, and it did occur; b—false alarm—an event estimated to occur, but it did not occur; c—miss—an event estimated not to occur, but it did occur; d—correct negative—an event estimated not to occur and it did not occur; H—number of hits; P—number of precipitation products; O—number of observations; N—total number.
Table 3. Categorical indices used.
Categorical IndicesEquationOptimum Value
Adjusted equitable threat score (Mesinger 2008) E T S a = H a O 2 N P + O + H a O 2 N
where;
H a = O 1 O H O O P
1
Probability of Detection P O D = H O 1
False Alarm Ratio F A R = P H P 0
BIAS B i a s = P O 1
Table 4. Rain classification and thresholds.
Rain Intensity
Classification
Precipitation Thresholds
(mm)
Rain/no rain0.5
Light2.0; 5.0
Moderate10.0; 20.0
Heavy35.0; 50.0
Disclaimer/Publisher’s Note: The statements, opinions and data contained in all publications are solely those of the individual author(s) and contributor(s) and not of MDPI and/or the editor(s). MDPI and/or the editor(s) disclaim responsibility for any injury to people or property resulting from any ideas, methods, instructions or products referred to in the content.