Article

Statistical Analysis of the Occurrence of Ionospheric Scintillations at the Low-Latitude Sanya Station During 2004–2021

1
School of Mathematics and Physics, North China Electric Power University, Baoding 071003, China
2
Hebei Key Laboratory of Physics and Energy Technology, Baoding 071003, China
3
Beijing National Observatory of Space Environment, Institute of Geology and Geophysics, Chinese Academy of Sciences, Beijing 100029, China
4
Key Laboratory of Earth and Planetary Physics, Institute of Geology and Geophysics, Chinese Academy of Sciences, Beijing 100029, China
5
College of Earth and Planetary Sciences, University of Chinese Academy of Sciences, Beijing 100029, China
*
Author to whom correspondence should be addressed.
Remote Sens. 2024, 16(24), 4668; https://doi.org/10.3390/rs16244668
Submission received: 7 November 2024 / Revised: 6 December 2024 / Accepted: 11 December 2024 / Published: 13 December 2024

Abstract

:
The ionosphere of the Earth often becomes turbulent and develops electron density irregularities that can cause rapid and random changes in the amplitude and phase of radio signals, which is known as ionospheric scintillation. In this study, the statistical behavior of global navigation satellite system (GNSS) ionospheric amplitude scintillation of varying intensities over the Chinese low-latitude station in Sanya (18.34°N, 109.62°E; magnetic latitude: 7.61°N) has been investigated with respect to its dependence on solar activity, seasons, local time (LT), and geomagnetic activity during the period from July 2004 to December 2021. A detailed study on the solar activity dependence of scintillation occurrence shows that the occurrence rates of strong and moderate scintillations significantly increase with enhanced solar activity, but weak amplitude scintillations do not entirely conform to this characteristic. In terms of seasonal dependence, the scintillations in Sanya from 2004 to 2021 mainly occurred during equinoxes and exhibit a distinct equinoctial asymmetry. This asymmetry is characterized by a higher occurrence rate in autumn than in spring during the years 2007, 2011, and from 2017 to 2021, while in other years, the pattern is reversed, with a higher occurrence rate in spring than in autumn. Regarding LT dependence, scintillations are predominantly observed during 19:30–23:30 LT, with a notable persistence beyond midnight during years of high solar activity. Furthermore, geomagnetic disturbances have been observed to promote weak scintillations at 20:00 LT during the autumn and winter of 2014, and from 20:00 LT to 01:00 LT the next day in the latter half of 2013. In contrast, during the spring and autumn of most other years with high solar activity, these disturbances have been found to inhibit weak scintillations from 20:00 LT to midnight. The promoting/inhibiting effect of geomagnetic disturbances on ionospheric scintillation is not solely influenced by electric field disturbances but is to some extent jointly controlled by a variety of factors including solar activity, season, and LT.

1. Introduction

Ionospheric irregularities range in scale from a few centimeters to thousands of kilometers, can be detected by a wide range of observational instruments, and exhibit different morphologies [1,2,3]. In the observations captured by a coherent scatter radar operating at very high frequency (VHF), meter-scale field-aligned irregularities (FAIs) were discerned, which are characteristically manifested as plume-like structures in the radar’s distance-time-intensity image [4,5,6]. The main manifestation of this on the frequency-height maps observed by an ionosonde is the severe expansion of the F-layer traces [7,8,9], known as equatorial spread F (ESF). All-sky airglow imagers observe low-intensity structures in the 630.0 nm airglow images [10,11,12,13,14]. Furthermore, global navigation satellite system (GNSS) receiver observations reveal rapid fluctuations in signal amplitude, phase, and total electron content (TEC) [15,16,17]. In situ satellite measurements reveal voids in plasma density over equatorial or low-latitude regions, known as equatorial plasma bubbles (EPBs) [18]. When radio waves traverse ionospheric irregularities, there are rapid and random fluctuations in amplitude and phase, known as ionospheric scintillation. The degree of scintillation is determined by the frequency of the signal and the intensity of the electron density irregularities [19]. Generally, radio wave signals within the frequency range of 100 MHz to 4 GHz are susceptible to ionospheric scintillation effects [20,21,22]. Ionospheric scintillation seriously affects radio wave propagation and leads to a decrease in the accuracy of satellite navigation and positioning systems. Thus, studying the formation mechanisms and evolution of ionospheric irregularities is crucial for space weather monitoring, ionospheric modeling, and enhancing the reliability of communication and navigation systems [23].
Based on ground-based measurements, such as GNSS receivers, ionosondes, and VHF coherent scatter radar, and space-based in situ measurements, such as C/NOFS, ROCSAT-1, DMSP, and Swarm, numerous scholars have conducted extensive studies on the relationships between ionospheric irregularities and solar activity, season, local time (LT), and geomagnetic activity: (1) Regarding solar activity, previous studies have pointed out a strong correlation between the occurrence rate of ionospheric irregularities and solar activity. The occurrence rate of ionospheric irregularities is significantly higher during solar maximum years compared to solar minimum years [2,24,25]. During solar minimum years, the occurrence of ionospheric irregularities is rarely observed [17,26]. (2) In terms of seasonal variation, the occurrence rate of ionospheric irregularities is mainly controlled by the magnetic declination and the geographic latitude of the magnetic equator. In the Asian region, the occurrence rate of ionospheric irregularities is highest during the equinoxes and exhibits a distinct equinoctial asymmetry, with the occurrence rate in spring being higher than in autumn [15,27,28]. In the American sector, the occurrence rate of ionospheric irregularities is maximized in December and minimized in June [22]. During solar minimum years, ionospheric irregularities predominantly occur in summer [29,30]. (3) In terms of LT, ionospheric irregularities primarily emerge after sunset and typically dissipate before midnight. However, a small fraction of these irregularities persist beyond midnight [2,27]. The dissipation time of ionospheric irregularities tends to extend as solar activity intensifies [17]. (4) Regarding the impact of geomagnetic activity on the occurrence of ionospheric irregularities: Li et al. [27] suggested that geomagnetic activity primarily manifests an inhibitory effect on the development of ionospheric irregularities [31,32]. Huang et al. [33] proposed that geomagnetic activity predominantly acts to facilitate the development of ionospheric irregularities [34,35]. Some researchers believe that geomagnetic activity has both promoting and inhibiting effects on the occurrence of ionospheric irregularities; the specific effect depends on the LT of the geomagnetic disturbance [26].
Ionospheric scintillation caused by ionospheric irregularities are intense at high latitudes, weaker at mid-latitudes, and extremely intense at equatorial and low latitudes [20]. At low latitudes, an enhanced eastward electric field, known as the pre-reversal enhancement (PRE), typically develops at F-region heights around sunset. The PRE drives the ionosphere to move upward, creating a steep density gradient at the bottom of the F-layer and intensifying the Rayleigh–Taylor (R-T) instability [36]. This process leads to the formation of large-scale plasma depletions at the bottomside of the F-layer, known as plasma bubbles. During the ascent of plasma bubbles to higher altitudes, numerous small-scale irregularities are formed, causing intense scintillations in satellite signals [20,37]. The Sanya region in China is located in an area prone to low-latitude scintillations. The Institute of Geology and Geophysics of the Chinese Academy of Sciences has established multiple ionospheric scintillation monitoring instruments in Sanya, including a GNSS ionospheric scintillation monitor, digital ionosonde, VHF coherent scatter radar, and incoherent scatter radar [38,39]. This paper will utilize the data observed by the GNSS ionospheric scintillation monitor in Sanya from 2004 to 2021 to statistically study the distribution characteristics of the occurrence rates of ionospheric scintillations.

2. Data and Method

The GNSS ionospheric scintillation data were recorded by the GNSS Ionospheric Scintillation and TEC Monitor System (GISTMS) over Sanya (18.34°N, 109.62°E; magnetic latitude: 7.61°N), using NovAtel’s GSV4004B GNSS (Alexandria, VA, USA) scintillation receiver from Canada. The parameters recorded by the GISTMS include satellite positions, amplitude scintillation index, corrections to the amplitude scintillation index, phase scintillation index, signal-to-noise ratio, total electron content (TEC) every 15 s, and the variation in TEC every 15 s. The amplitude scintillation index, denoted as S4, is often used to measure the intensity of ionospheric scintillation. It is defined as the ratio of the standard deviation of the signal power per minute to its mean value, which is expressed as
S 4 = < SI 2 > < SI > 2 < SI > ,
where < > denotes the average value over a one-minute interval, and SI represents the signal intensity, which is tantamount to the power of the received signal. Due to the influence of environmental noise, the S4 index defined by Equation (1) may occasionally be affected by ambient noise in practical measurements. Consequently, this study first selects observational data with elevation angles above 20°. The S4 index is then preliminarily corrected by subtracting the square of the noise-based S4 value from the square of the S4 value before correction. Finally, the square root of the preliminary corrected S4 value is taken [27]. Table 1 presents the annual number of observation days recorded by the GITMS over Sanya from 2004 to 2021. As shown in Table 1, the observation rate of the GITMS is above 92% throughout the period from 2005 to 2021.
In order to better reflect the distribution characteristics of different intensity scintillations in relation to solar activity, season, LT, and geomagnetic activity, based on the S4 index, scintillation intensity is classified into three categories: weak scintillation (0.3 < S4 ≤ 0.4), moderate scintillation (0.4 < S4 ≤ 0.5), and strong scintillation (S4 > 0.5) [16]. Furthermore, the occurrence rates of scintillation at a given moment are defined as the ratio of the number of data points within the ranges of weak, moderate, and strong scintillations to the total number of observed data points within 30 min before and after that moment [17,40].
To facilitate the analysis of the equinoctial asymmetry in ionospheric scintillation over Sanya, we have defined an equinoctial asymmetry index (EAI) for ionospheric scintillation. The formula for the EAI is as follows:
EAI = SO AO 0 . 5 × ( SO + AO ) ,
where SO and AO, respectively, represent the occurrence rates of scintillation in spring and in autumn. When the EAI is greater than 0, it indicates that the occurrence rates of scintillation in spring are higher than those in autumn.
The occurrence of scintillations is analyzed in relation to geomagnetic activity using the Kp index, which provides a temporal resolution of 3 h. The solar flux F10.7 index, characterized by a daily resolution, is used to study the dependence on solar activity. Data for both the Kp index and the F10.7 index are supplied by the German Research Centre for Geosciences. Due to the weak solar activity cycle selected for this study, we have categorized the years based on the yearly average value of F10.7 to distinguish between low and high solar activity: low solar activity years (where the yearly average value of F10.7 is less than 90) and high solar activity years (where the yearly average value of F10.7 is greater than 110). We have classified geomagnetic disturbances based on the Kp index into two categories: geomagnetic disturbed conditions (when Kp > 3 or the average value of Kp on the previous day is greater than 3) and geomagnetic quiet conditions (when Kp ≤ 3 and the average value of Kp on the previous day is less than or equal to 3).

3. Result and Analysis

3.1. The Distribution of Scintillations of Different Intensities from 2004 to 2021

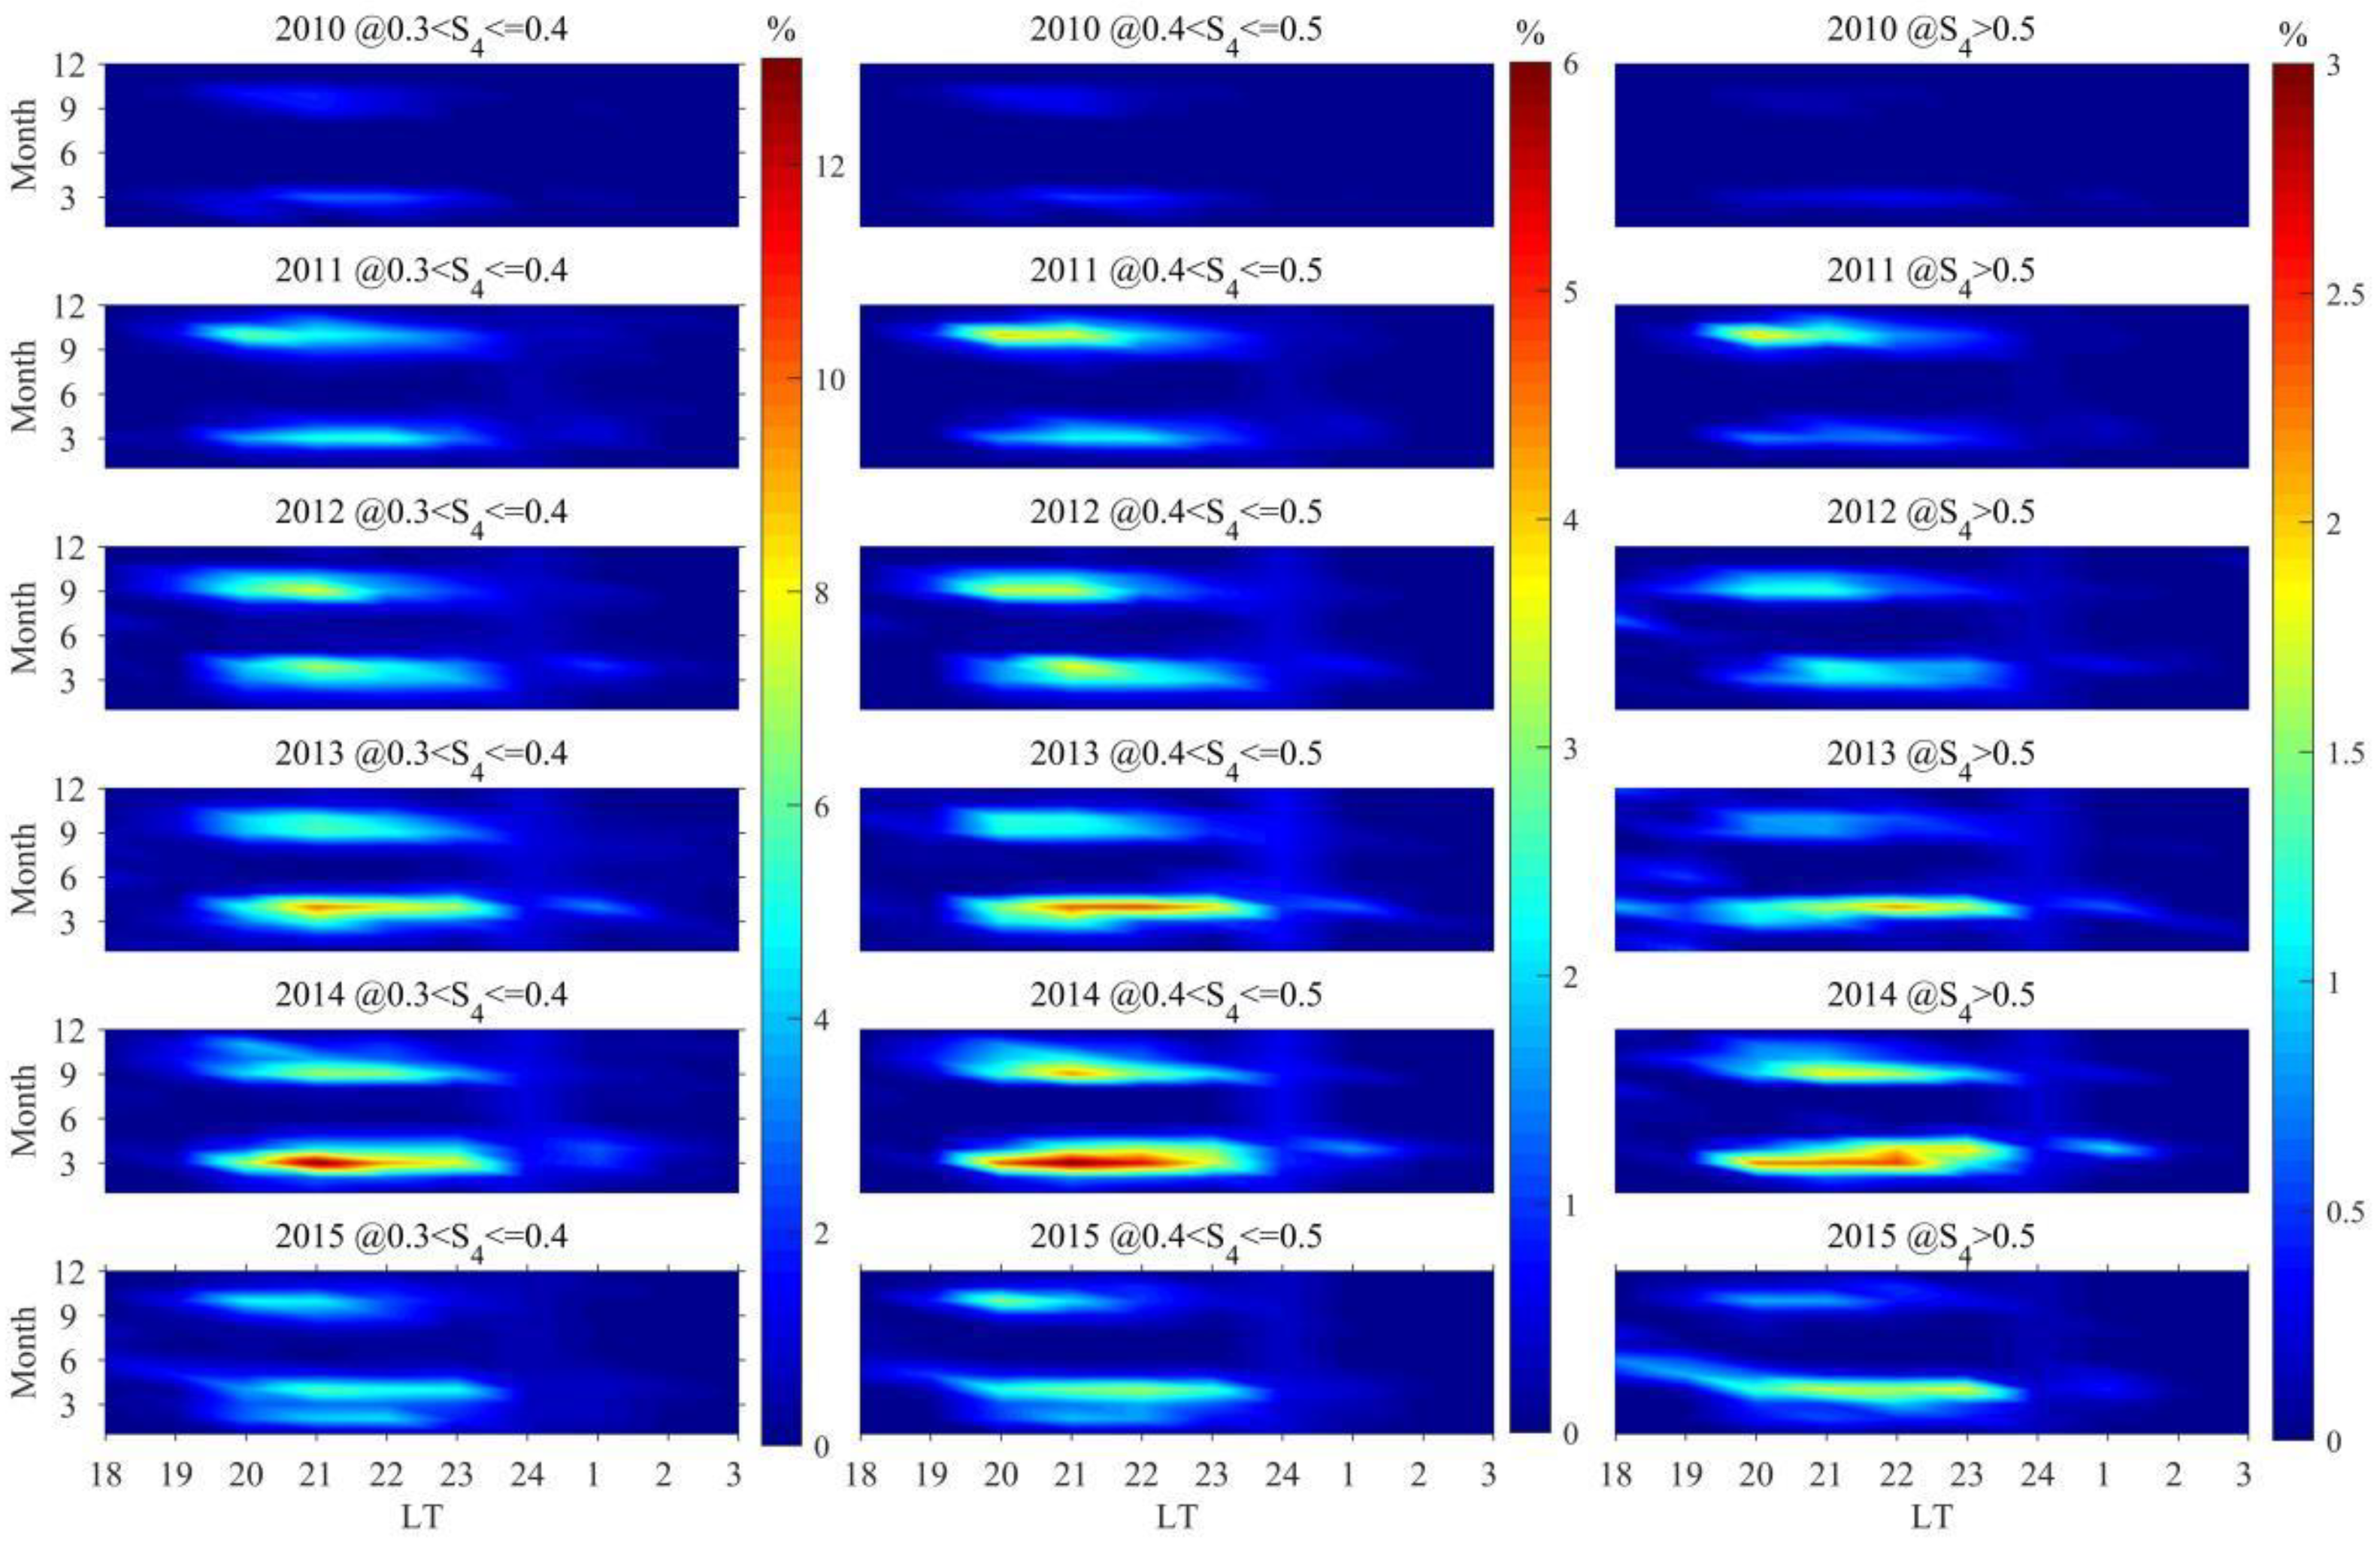
Figure 1, Figure 2 and Figure 3 present the distribution of scintillation occurrence rates with different intensities in Sanya for the periods 2004–2009, 2010–2015, and 2016–2021, respectively, as a function of year, month, and LT. In the three figures, the selected LT range spans from 18:00 to 03:00 the following day, with different colors representing the magnitude of the occurrence rates. Figure 1 illustrates that the occurrence rates of scintillations in Sanya from 2004 to 2005 are much higher than those from 2006 to 2009, and the scintillations mainly occurred in the fall of 2004 and the spring of 2005. Additionally, the scintillations in the fall of 2004 cover a broader range of months and occurred earlier than those in the spring of 2005 [40]. In the fall of 2004, the duration of strong scintillations is shorter compared to weak and moderate scintillations. However, in the spring of 2005, there is almost no difference in the duration of scintillations of different intensities.
As shown in Figure 2, the occurrence rates of scintillations are highest in 2014, the year with the strongest solar activity, and are concentrated around the spring and autumn equinoxes. In 2013 and 2014, the occurrence rates of scintillations exhibit a pronounced equinoctial asymmetry, characterized by a significantly higher rate in spring than in autumn. In the spring of 2011 and in the autumn of 2013 and 2015, the occurrence rates of scintillations decrease as the scintillation intensity increases. In contrast, in the autumn of 2011 and in the spring of 2013 and 2015, there is no significant change in the occurrence rates with the enhancement of scintillation intensity. Additionally, in 2011, 2012, and 2015, scintillations in the autumn occur about one hour earlier than those in the spring.
Figure 3 illustrates that the occurrence rates of scintillations in Sanya are significantly higher in 2016, 2020, and 2021 compared to 2017–2019. In 2016, a pronounced equinoctial asymmetry is observed, with the highest incidence of scintillations noted during the spring equinox. In 2020 and 2021, scintillations are predominantly concentrated around the autumnal equinox. The occurrence of scintillations spans a broader range of months and LTs, and its intensity is greater in the autumn of 2021 than in that of 2020. In the autumns of 2016, 2020, and 2021, the occurrence rates of scintillations decrease gradually with increasing scintillation intensity and even disappear at higher intensities. In 2016, the ionospheric scintillations in Sanya exhibit a distinct characteristic compared to other years: a strong scintillation is observed before sunset in February 2016.
To more clearly analyze the distribution pattern of ionospheric scintillations in Sanya, the following discussion will examine the distribution characteristics of the occurrence rates of scintillations of different intensities in Sanya from 2004 to 2021, considering four aspects: solar activity, season, LT, and geomagnetic activity.

3.2. The Occurrence Rates of Scintillations of Varying Intensities Distributed with Solar Activity

Figure 4 presents the distribution of the occurrence rates of scintillations of different intensities with solar activity in Sanya from 2004 to 2021. The red rectangular frame line in the figure represents the F10.7 index. As shown in Figure 4, the occurrence rates of ionospheric scintillations of different intensities in Sanya are generally consistent with the trends of solar activity: the occurrence rates of strong and moderate scintillations significantly increase with an increase in solar activity [2]; the occurrence rate of weak scintillations does not entirely increase with an enhancement in solar activity; and the occurrence rate during the year of low solar activity (2021) is basically equal to that during the year of high solar activity (2014). Additionally, it can be seen from Figure 4 that the correlation between moderate scintillations and solar activity is the highest, with a correlation coefficient of 0.9297; the correlation between weak scintillations and solar activity is the weakest, with a correlation coefficient of 0.6596.

3.3. The Occurrence Rates of Scintillations of Varying Intensities Distributed with Different Seasons and LTs

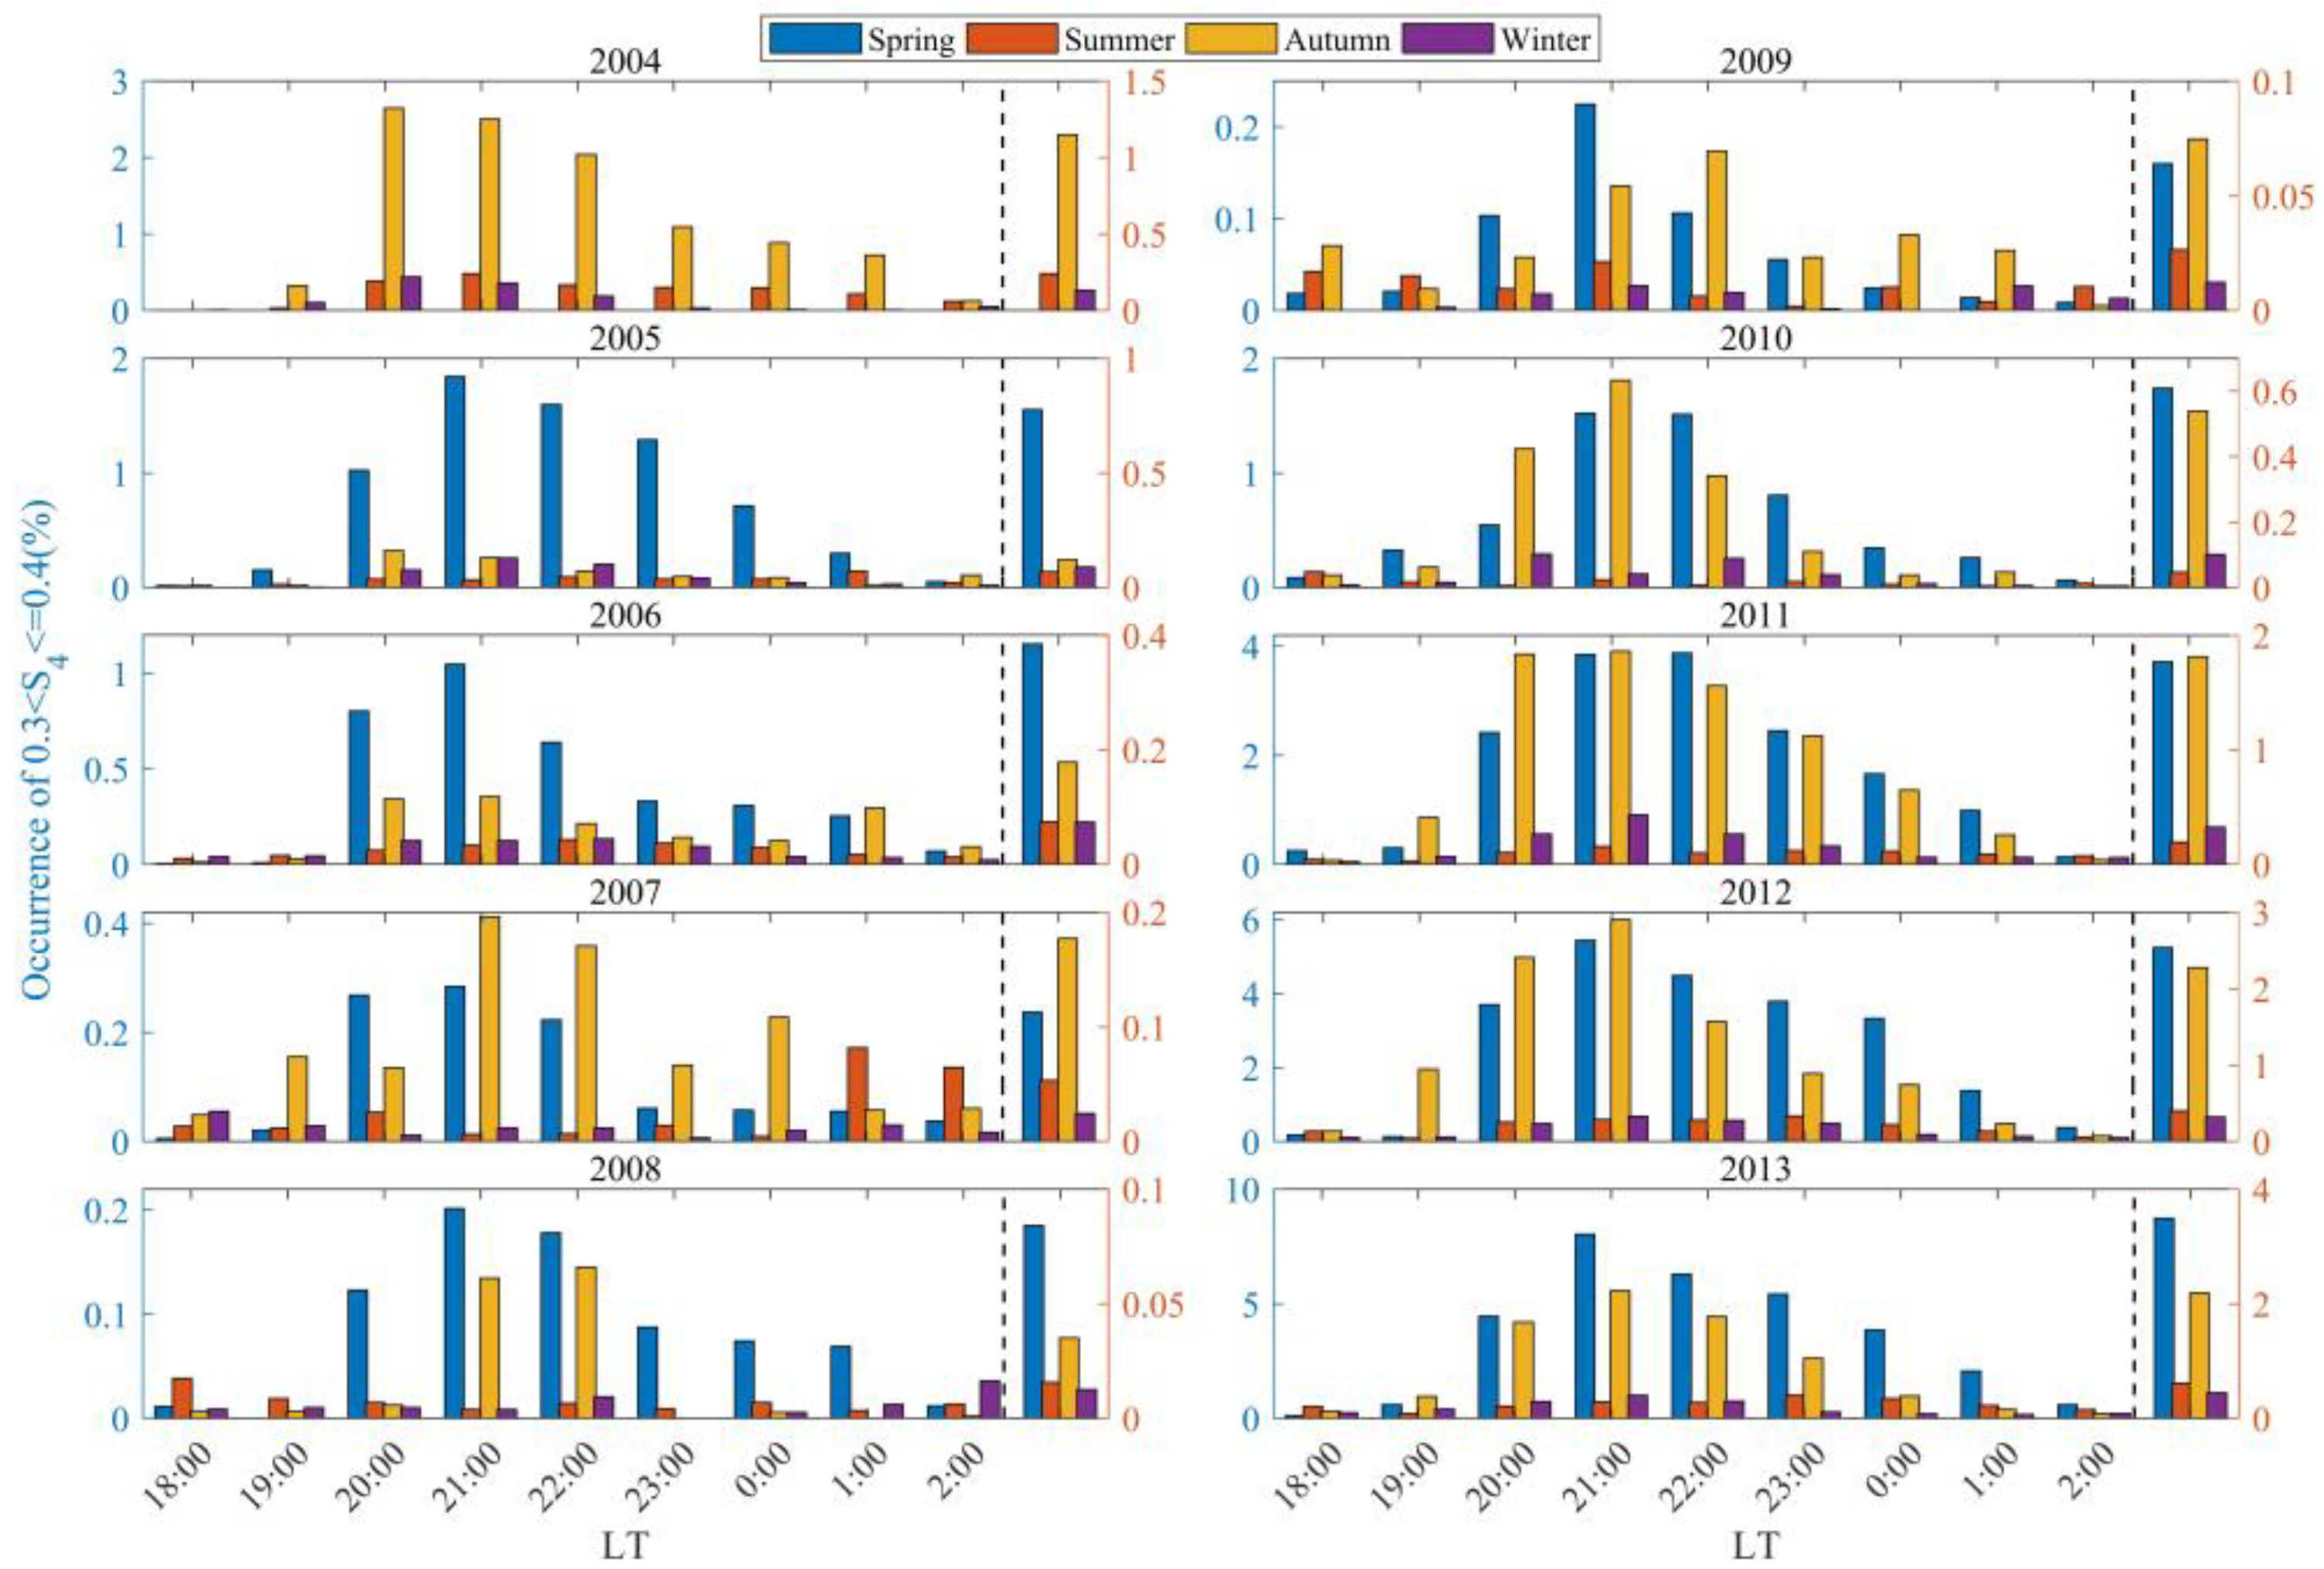
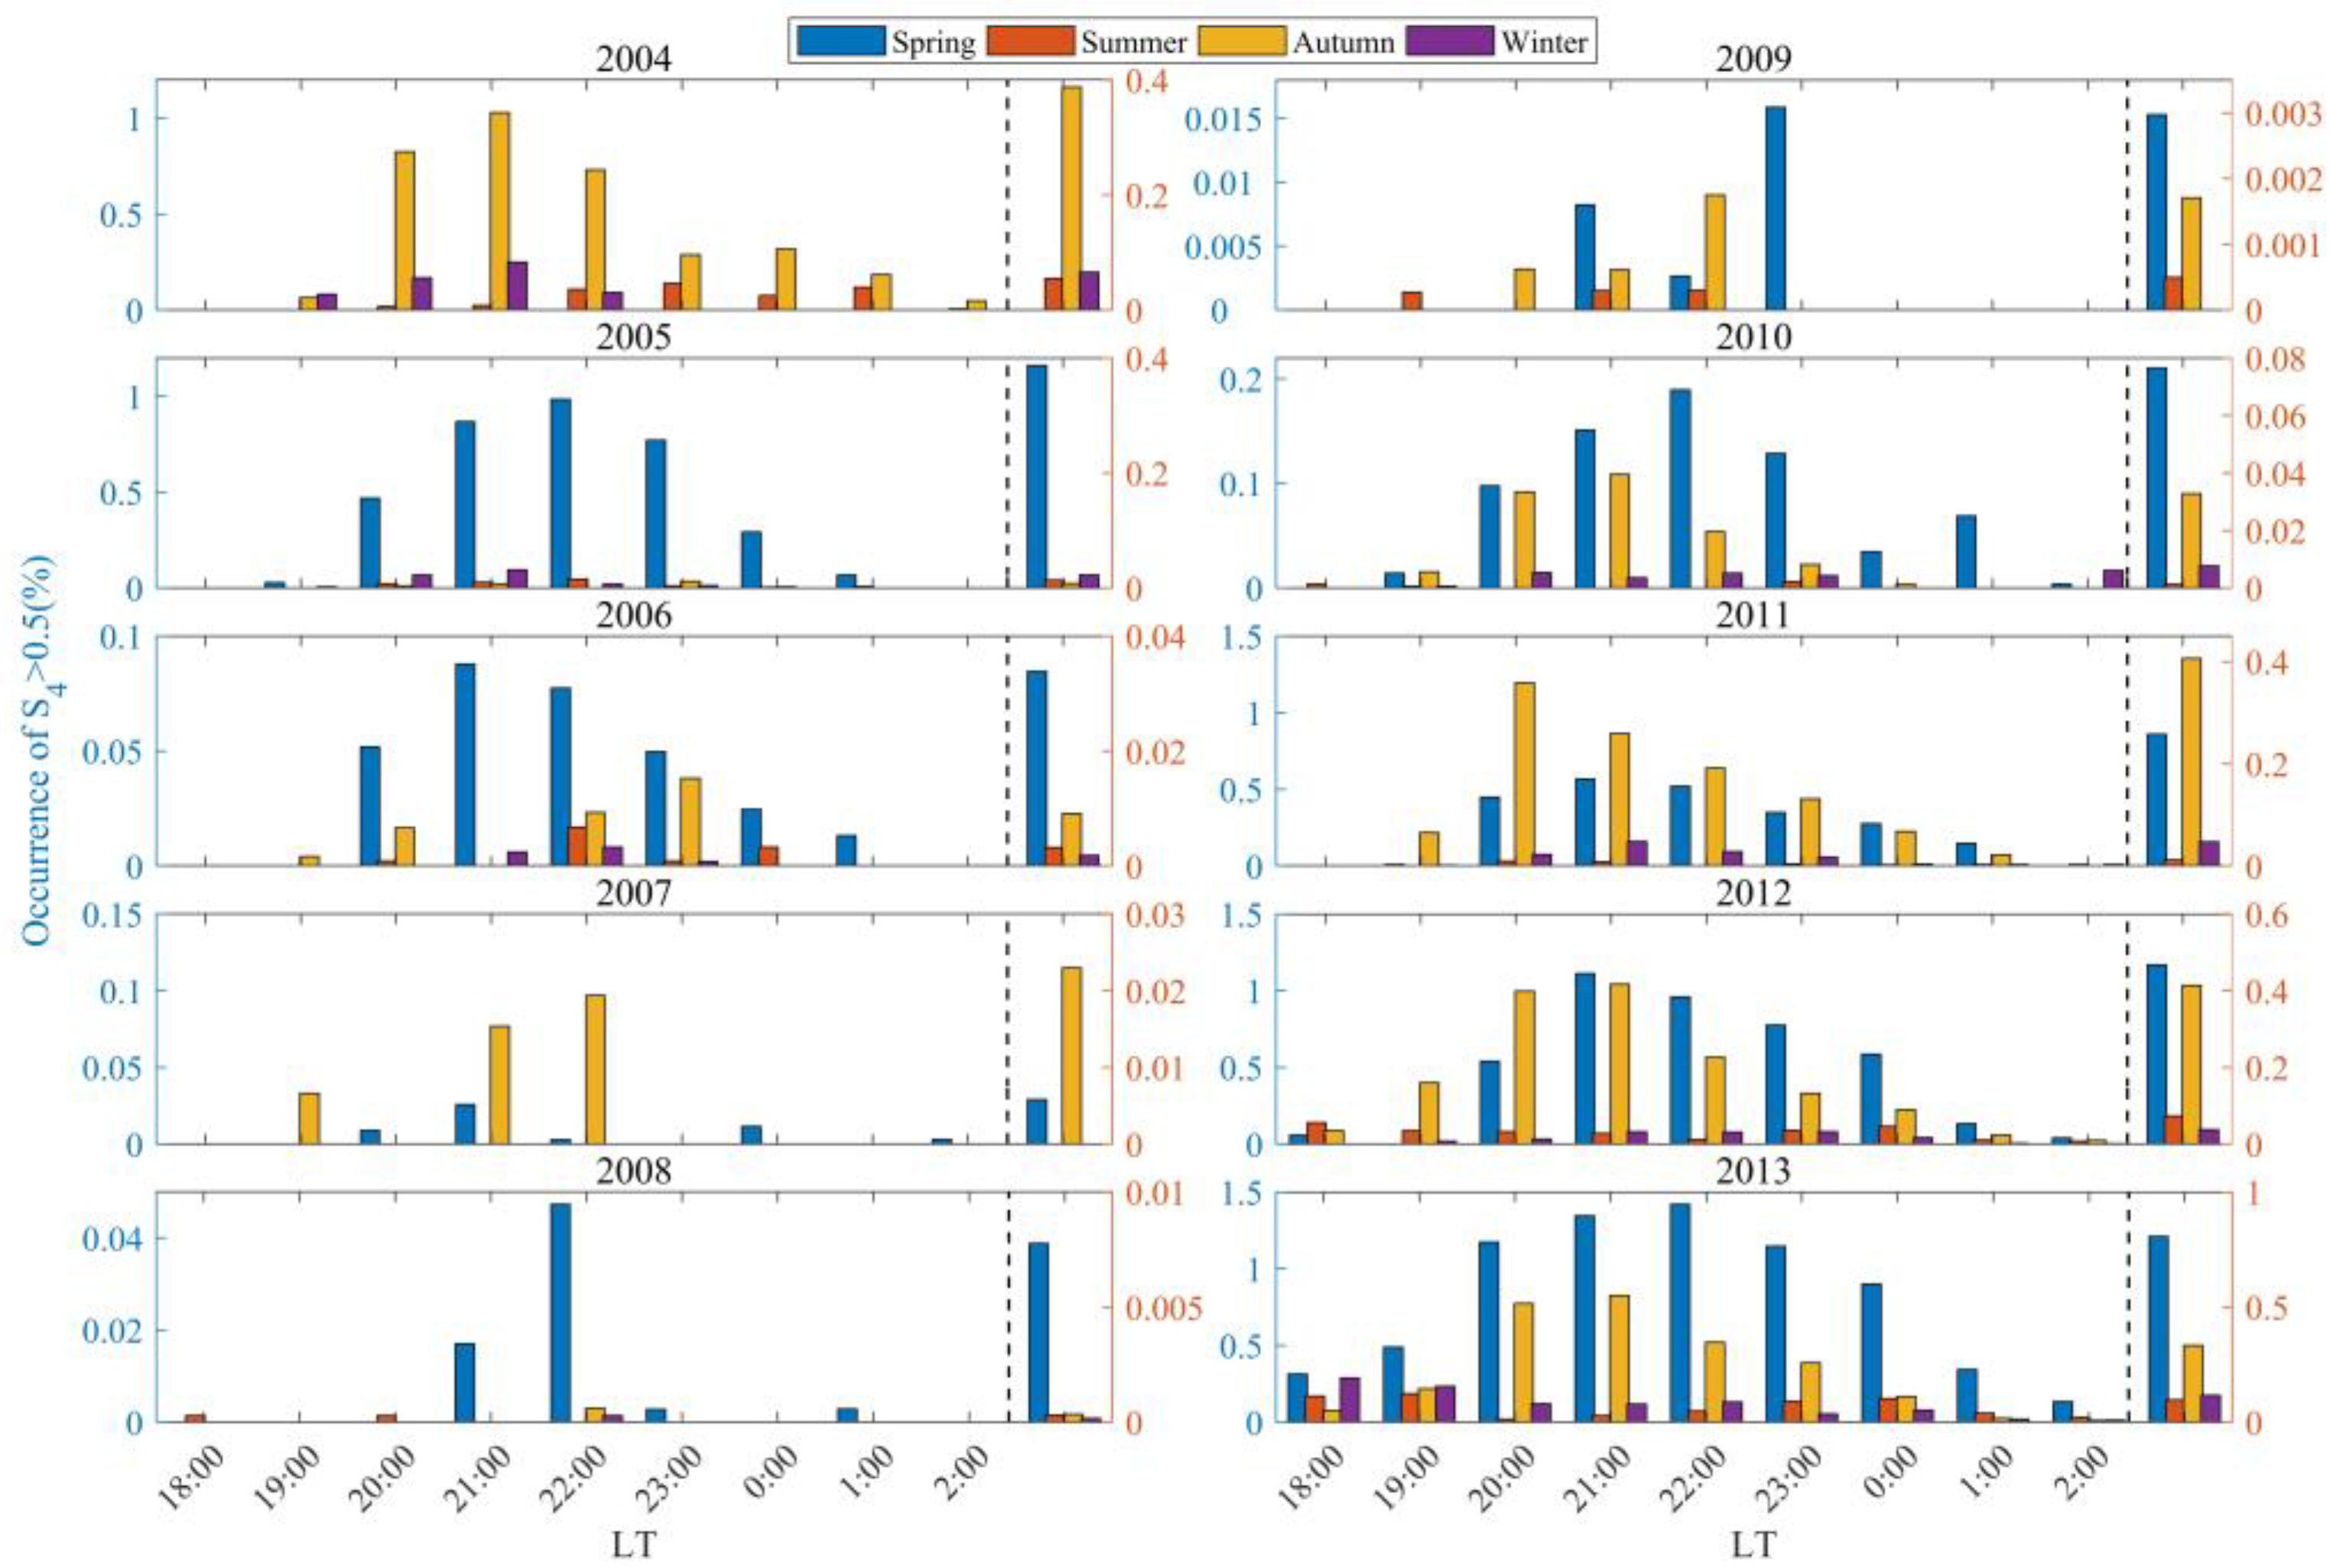
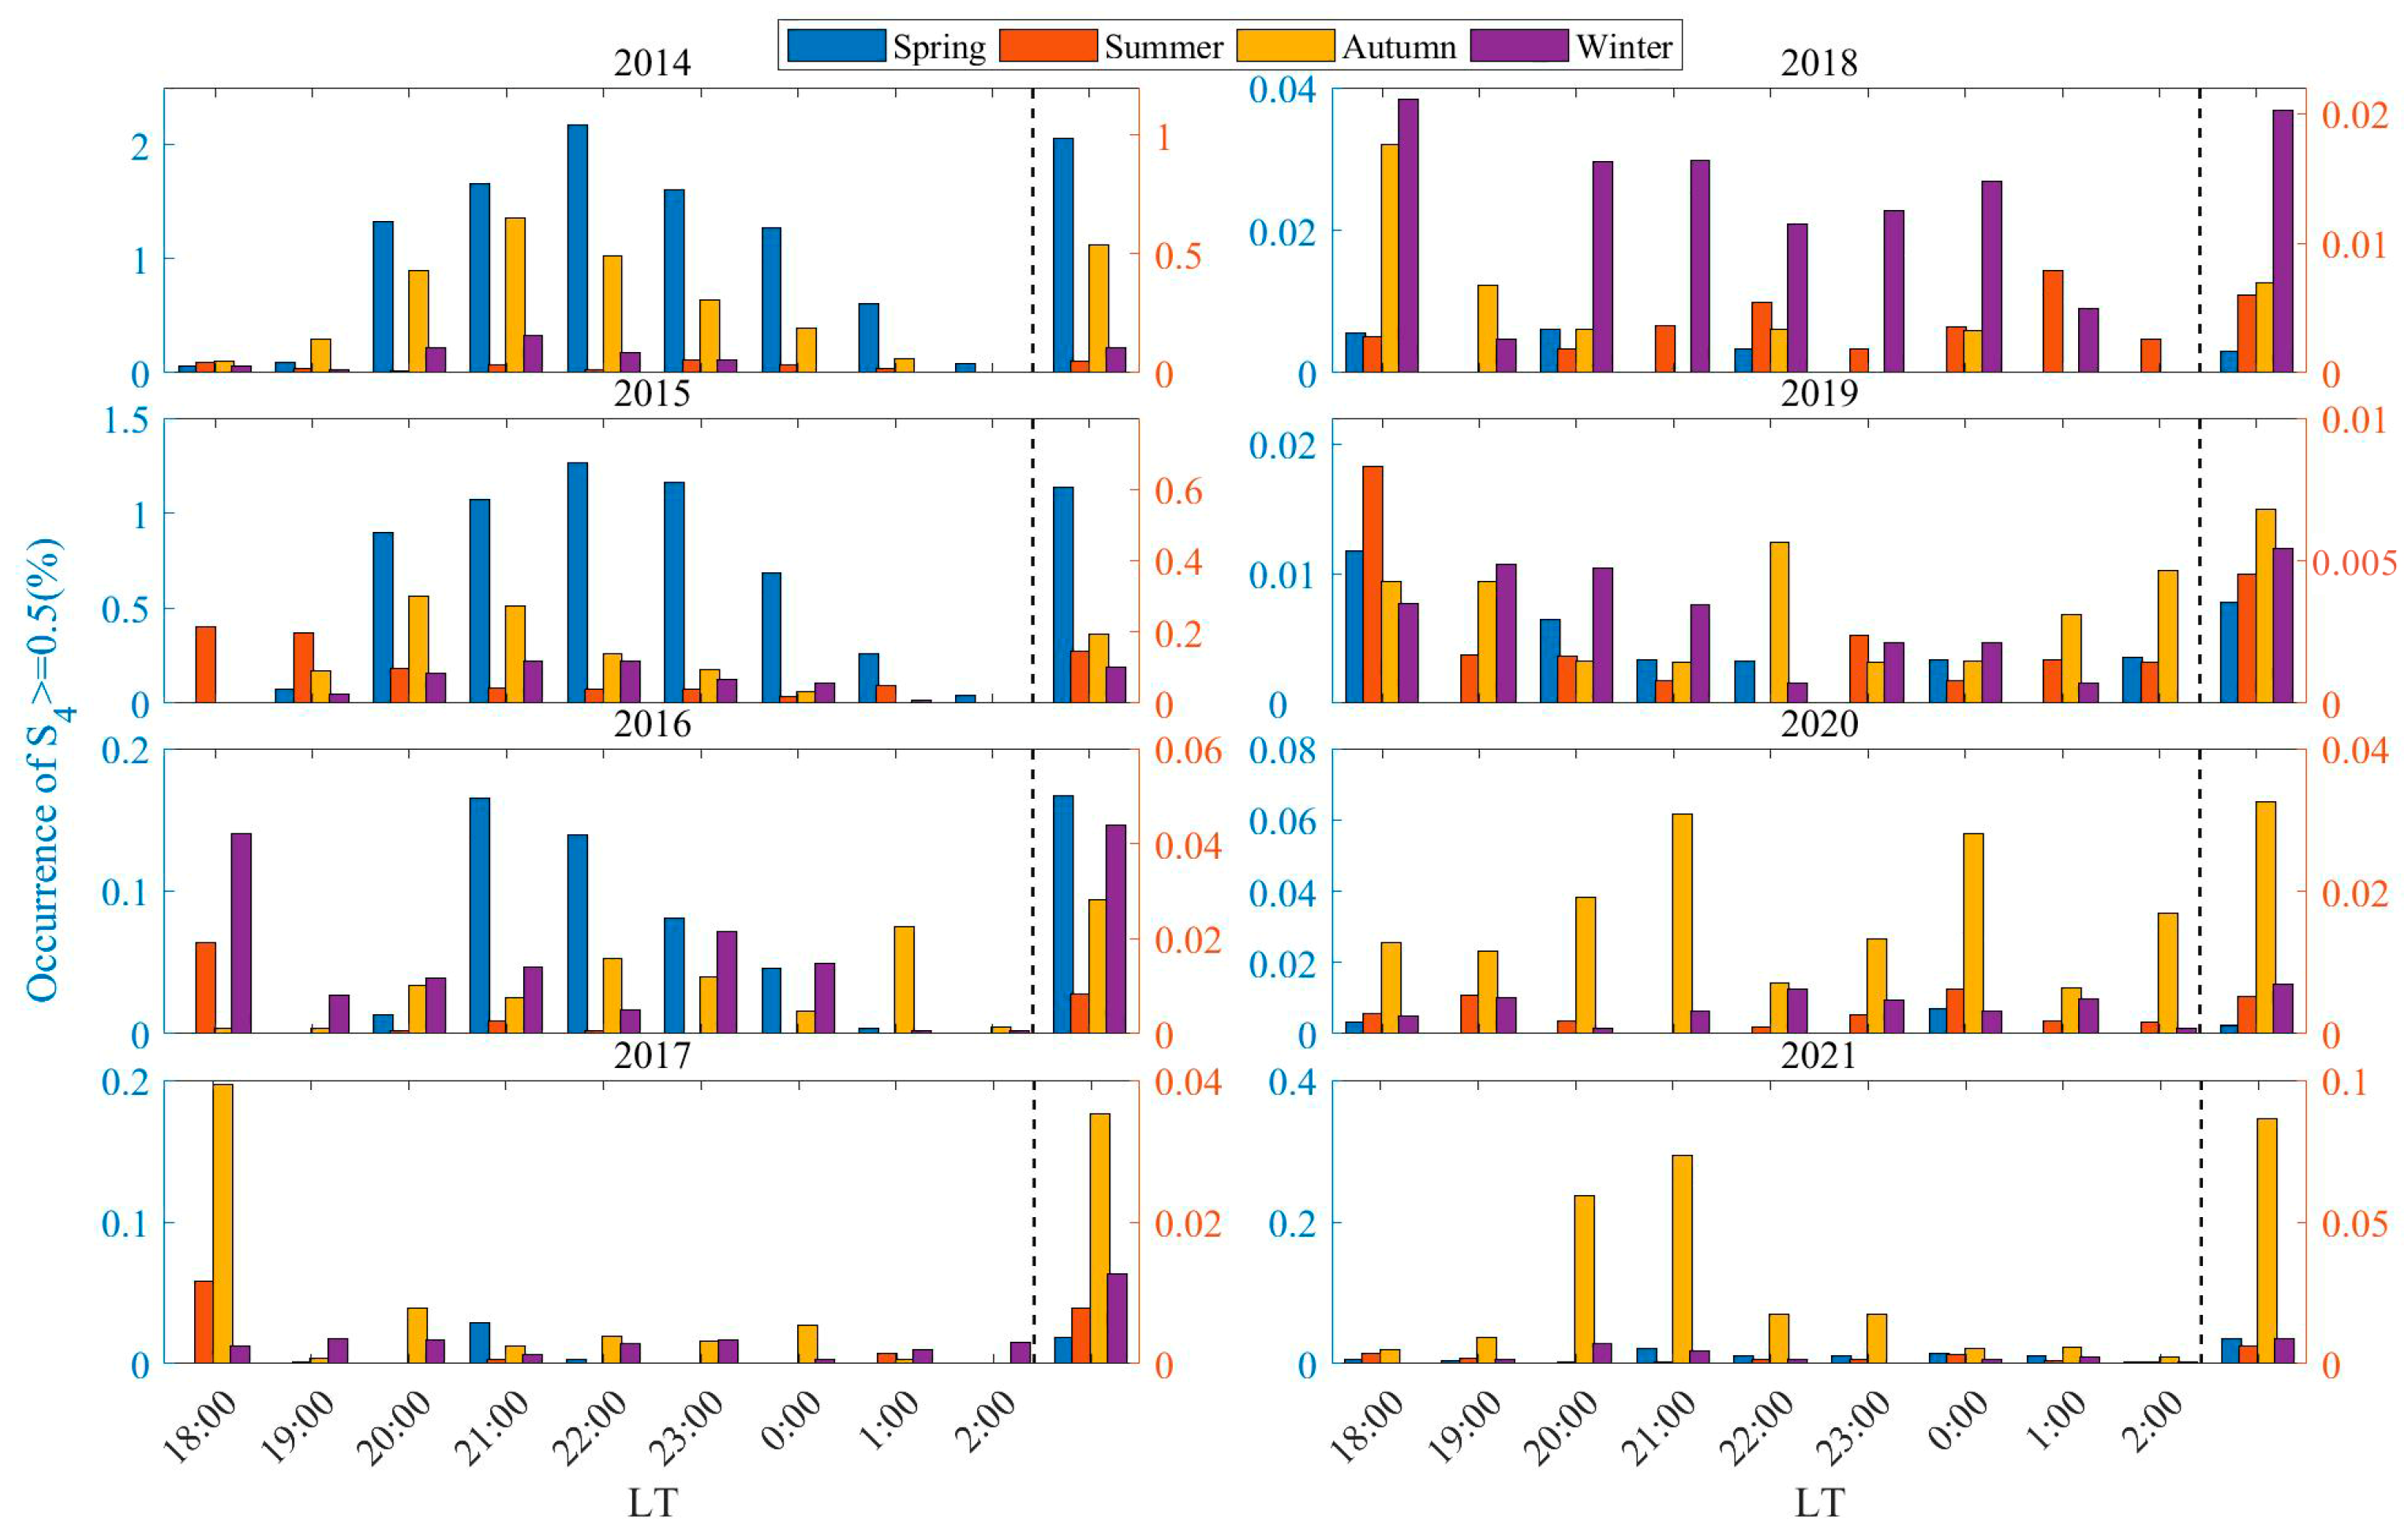
While the occurrence rates of scintillations are modulated by solar activity, season and LT also play crucial roles. Figure 5 and Figure 6 present the distribution of weak scintillation occurrence rates in Sanya, by season and LT, for the periods 2004 to 2013 and 2014 to 2021, respectively. The left side of the dashed line in the figures represents the distribution of weak scintillation occurrences in Sanya from 18:00 LT to 02:00 the following day during different seasons, and the right side of the dashed line shows the distribution of the average values of weak scintillation occurrences in Sanya during the corresponding time periods. From the left side of the dashed line in Figure 5, it can be found that weak scintillations in Sanya during 2004–2013 mainly occur from 19:30 to 23:30 LT. The occurrence rate of weak scintillations begins to increase from 19:30 to 20:30 LT, reaches its peak between 20:30 and 22:30 LT, and then significantly decreases after midnight. The peak occurrence rate of weak scintillations is primarily concentrated around 21:00 LT [27,37]. The duration of weak scintillations in Sanya varies across different seasons, with the longest duration occurring in spring [22,41]. From the left side of the dashed line in Figure 6, it can be observed that the local distribution of weak scintillation occurrence rates before midnight in Sanya from 2004 to 2013 is largely consistent with that during the high solar activity years (2014–2015) and some low solar activity years (2016, 2020–2021). During some low solar activity years (2017–2019), due to the overall low occurrence rate of weak scintillations, there is no significant difference in the occurrence rate of weak scintillations at different LTs [2].
From the right side of the dashed line in Figure 5, it can be observed that weak scintillations mainly occurred during the equinoxes from 2005 to 2013, exhibiting a bimodal structure, with occurrence rates in spring and autumn being significantly higher than in summer and winter [15,27]. The occurrence rate of weak scintillations during the equinoxes shows a pronounced asymmetry, with a stronger occurrence in spring than in autumn in the years 2005, 2006, 2008, 2010, 2012, and 2013, while in 2007 and 2009, the occurrence is stronger in autumn than in spring. Overall, the occurrence rate of weak scintillations in summer is greater than in winter [2]. The right side of the dashed line in Figure 6 indicates that weak scintillations mainly occur during the equinoxes, and there is an equinoctial asymmetry characterized by a stronger occurrence rate in spring compared to autumn from 2014 to 2016. Weak scintillations in 2017 and 2019–2021 exhibit a unimodal structure, with peaks occurring in autumn; in 2018, a similar unimodal structure is observed, but the peak occurs in winter. Between 2014 and 2020, the occurrence rate of weak scintillations is significantly higher in winter compared to summer, which is the reverse of the distribution characteristics from 2004 to 2013.
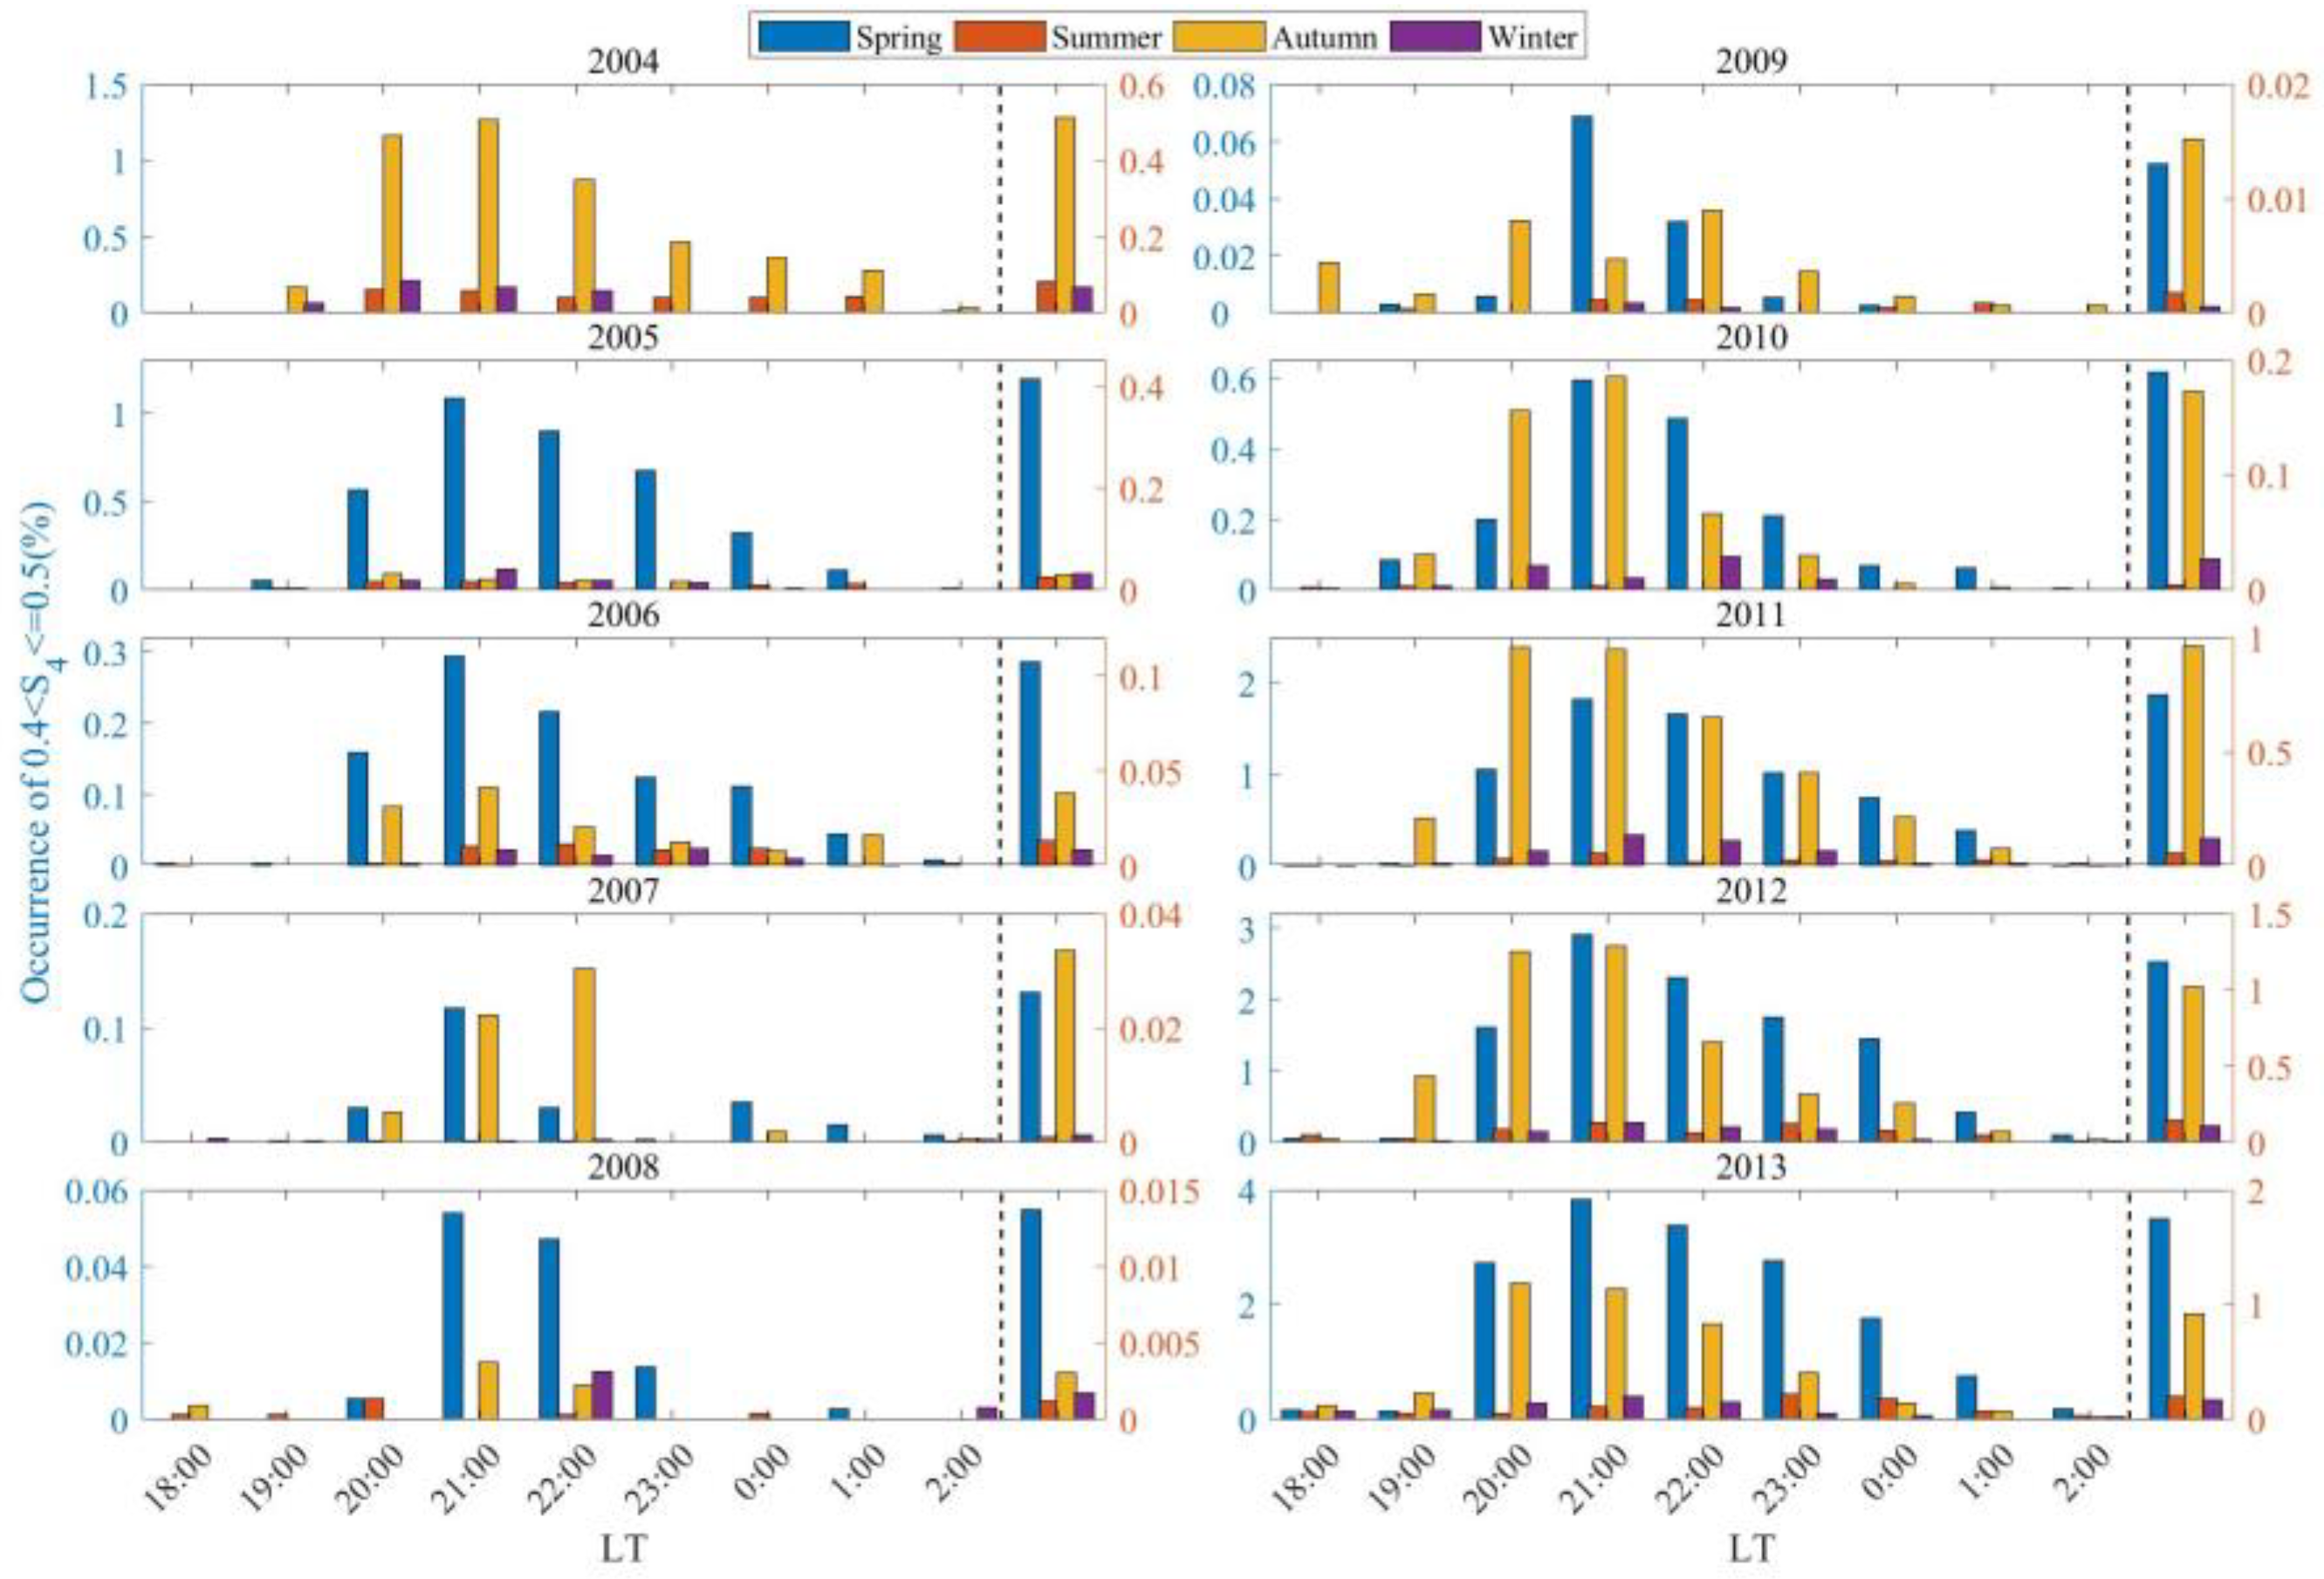
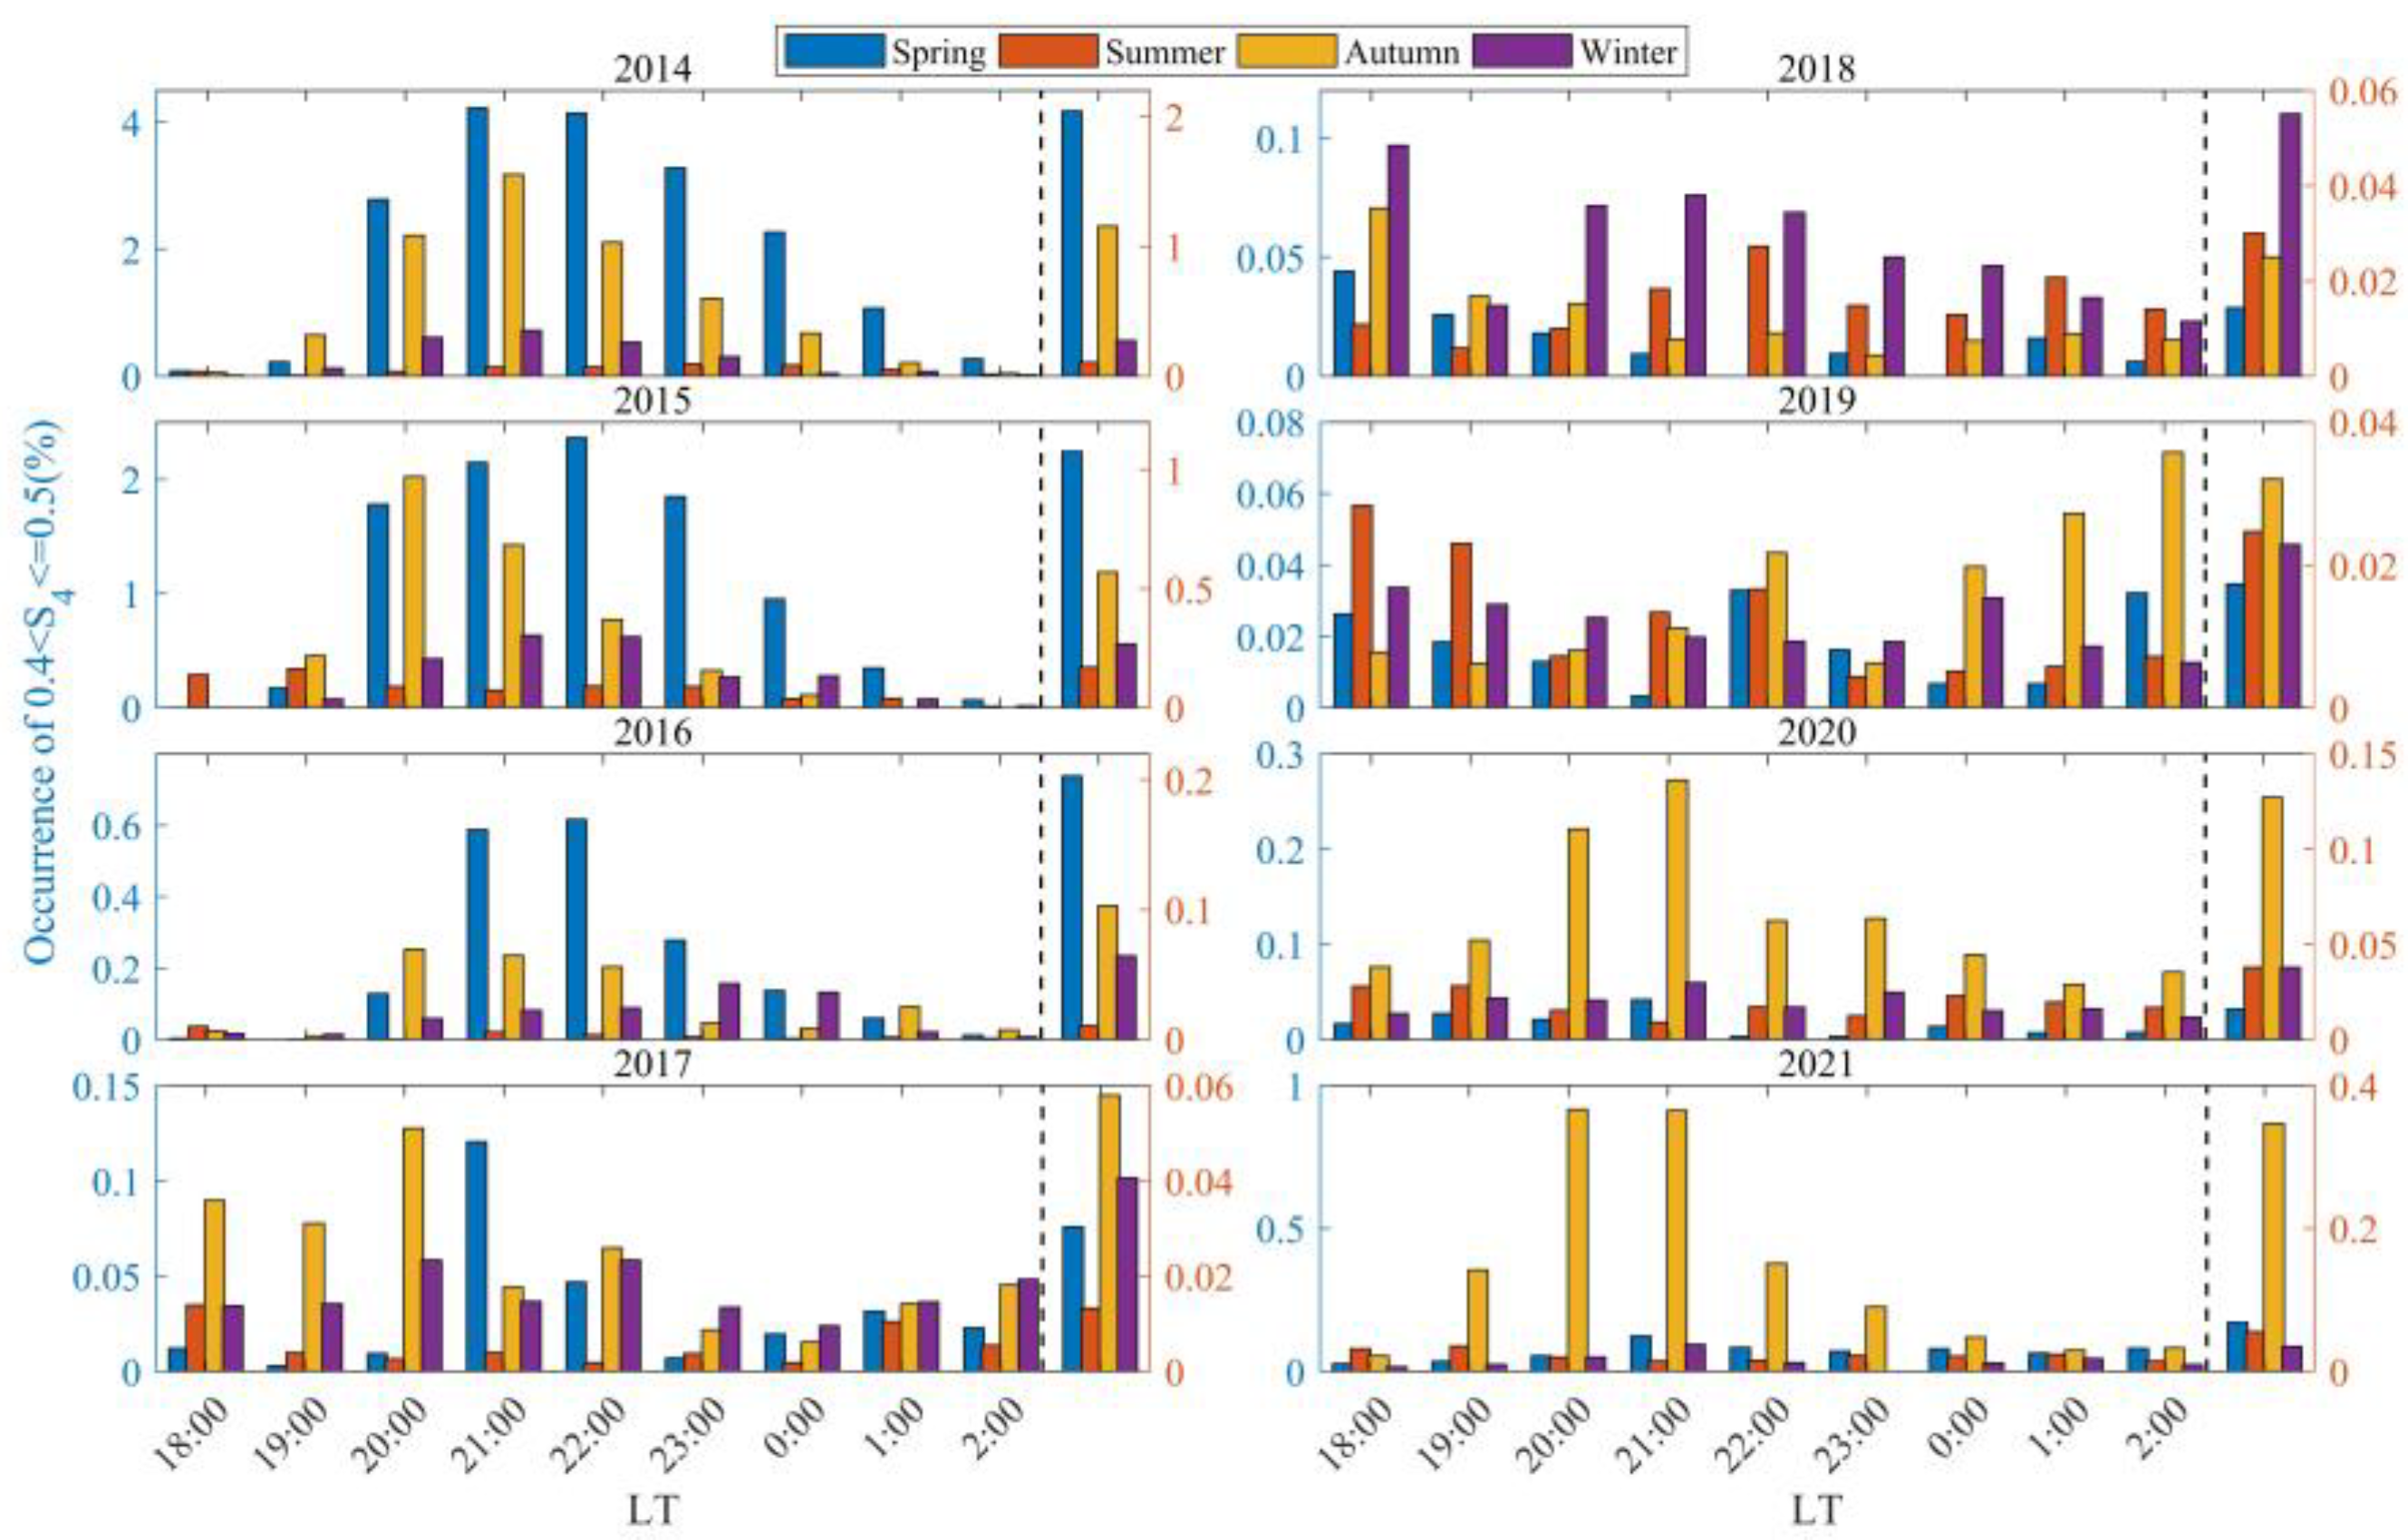
Figure 7 and Figure 8, respectively, illustrate the distribution of moderate scintillation occurrence rates in Sanya from 2004 to 2013 and from 2014 to 2021, as a function of season and LT. Figure 9 and Figure 10 present the corresponding distributions for strong scintillations. The left side of the dashed line in these figures represents the distribution of moderate or strong scintillation occurrences in Sanya from 18:00 to 02:00 LT the following day during different seasons, while the right side of the dashed line indicates the distribution of the average values of moderate or strong scintillation occurrences in Sanya during the corresponding time periods. From the left side of the dashed line in Figure 7 and Figure 8, it can be seen that the distribution of moderate scintillation occurrences with LT in Sanya from 2004 to 2021 follows the same pattern as that of weak scintillations in Sanya during the same period, as shown in Figure 5 and Figure 6. From the left side of the dashed line in Figure 9 and Figure 10, it can be observed that in the spring of 2009, the occurrence rate of strong scintillations in Sanya reaches its peak around 23:00 LT, which is later than the occurrence rates of weak and moderate scintillations that reach their peaks at 21:00 LT. Additionally, strong scintillation events in Sanya occur before 18:30 LT during the winter of 2016 and the autumn of 2017.
From the right side of the dashed line in Figure 7, it can be seen that the seasonal distribution of moderate scintillations in Sanya is essentially consistent with the distribution on the right side of the dashed line in Figure 5. However, the asymmetry between the spring and autumn equinoxes for moderate scintillations is more pronounced, with the occurrence rates in summer and winter being roughly equal. The right side of the dashed line in Figure 8 shows that the seasonal distribution of moderate scintillations is basically consistent with the distribution of weak scintillations on the right side of the dashed line in Figure 6. From the right side of the dashed lines in Figure 9 and Figure 10, it can be observed that the seasonal distribution of strong scintillations in Sanya is basically consistent with the seasonal distribution of weak scintillations in Figure 7 and Figure 8, with the difference being that the seasonal asymmetry of strong scintillations is more pronounced. As shown in Figure 10, strong scintillations in Sanya during 2016 predominantly occur in the spring and winter seasons. Compared to other years, the occurrence rate of strong scintillations significantly increases in the winter of 2016 and is generally on par with the occurrence rate in the spring of that year.
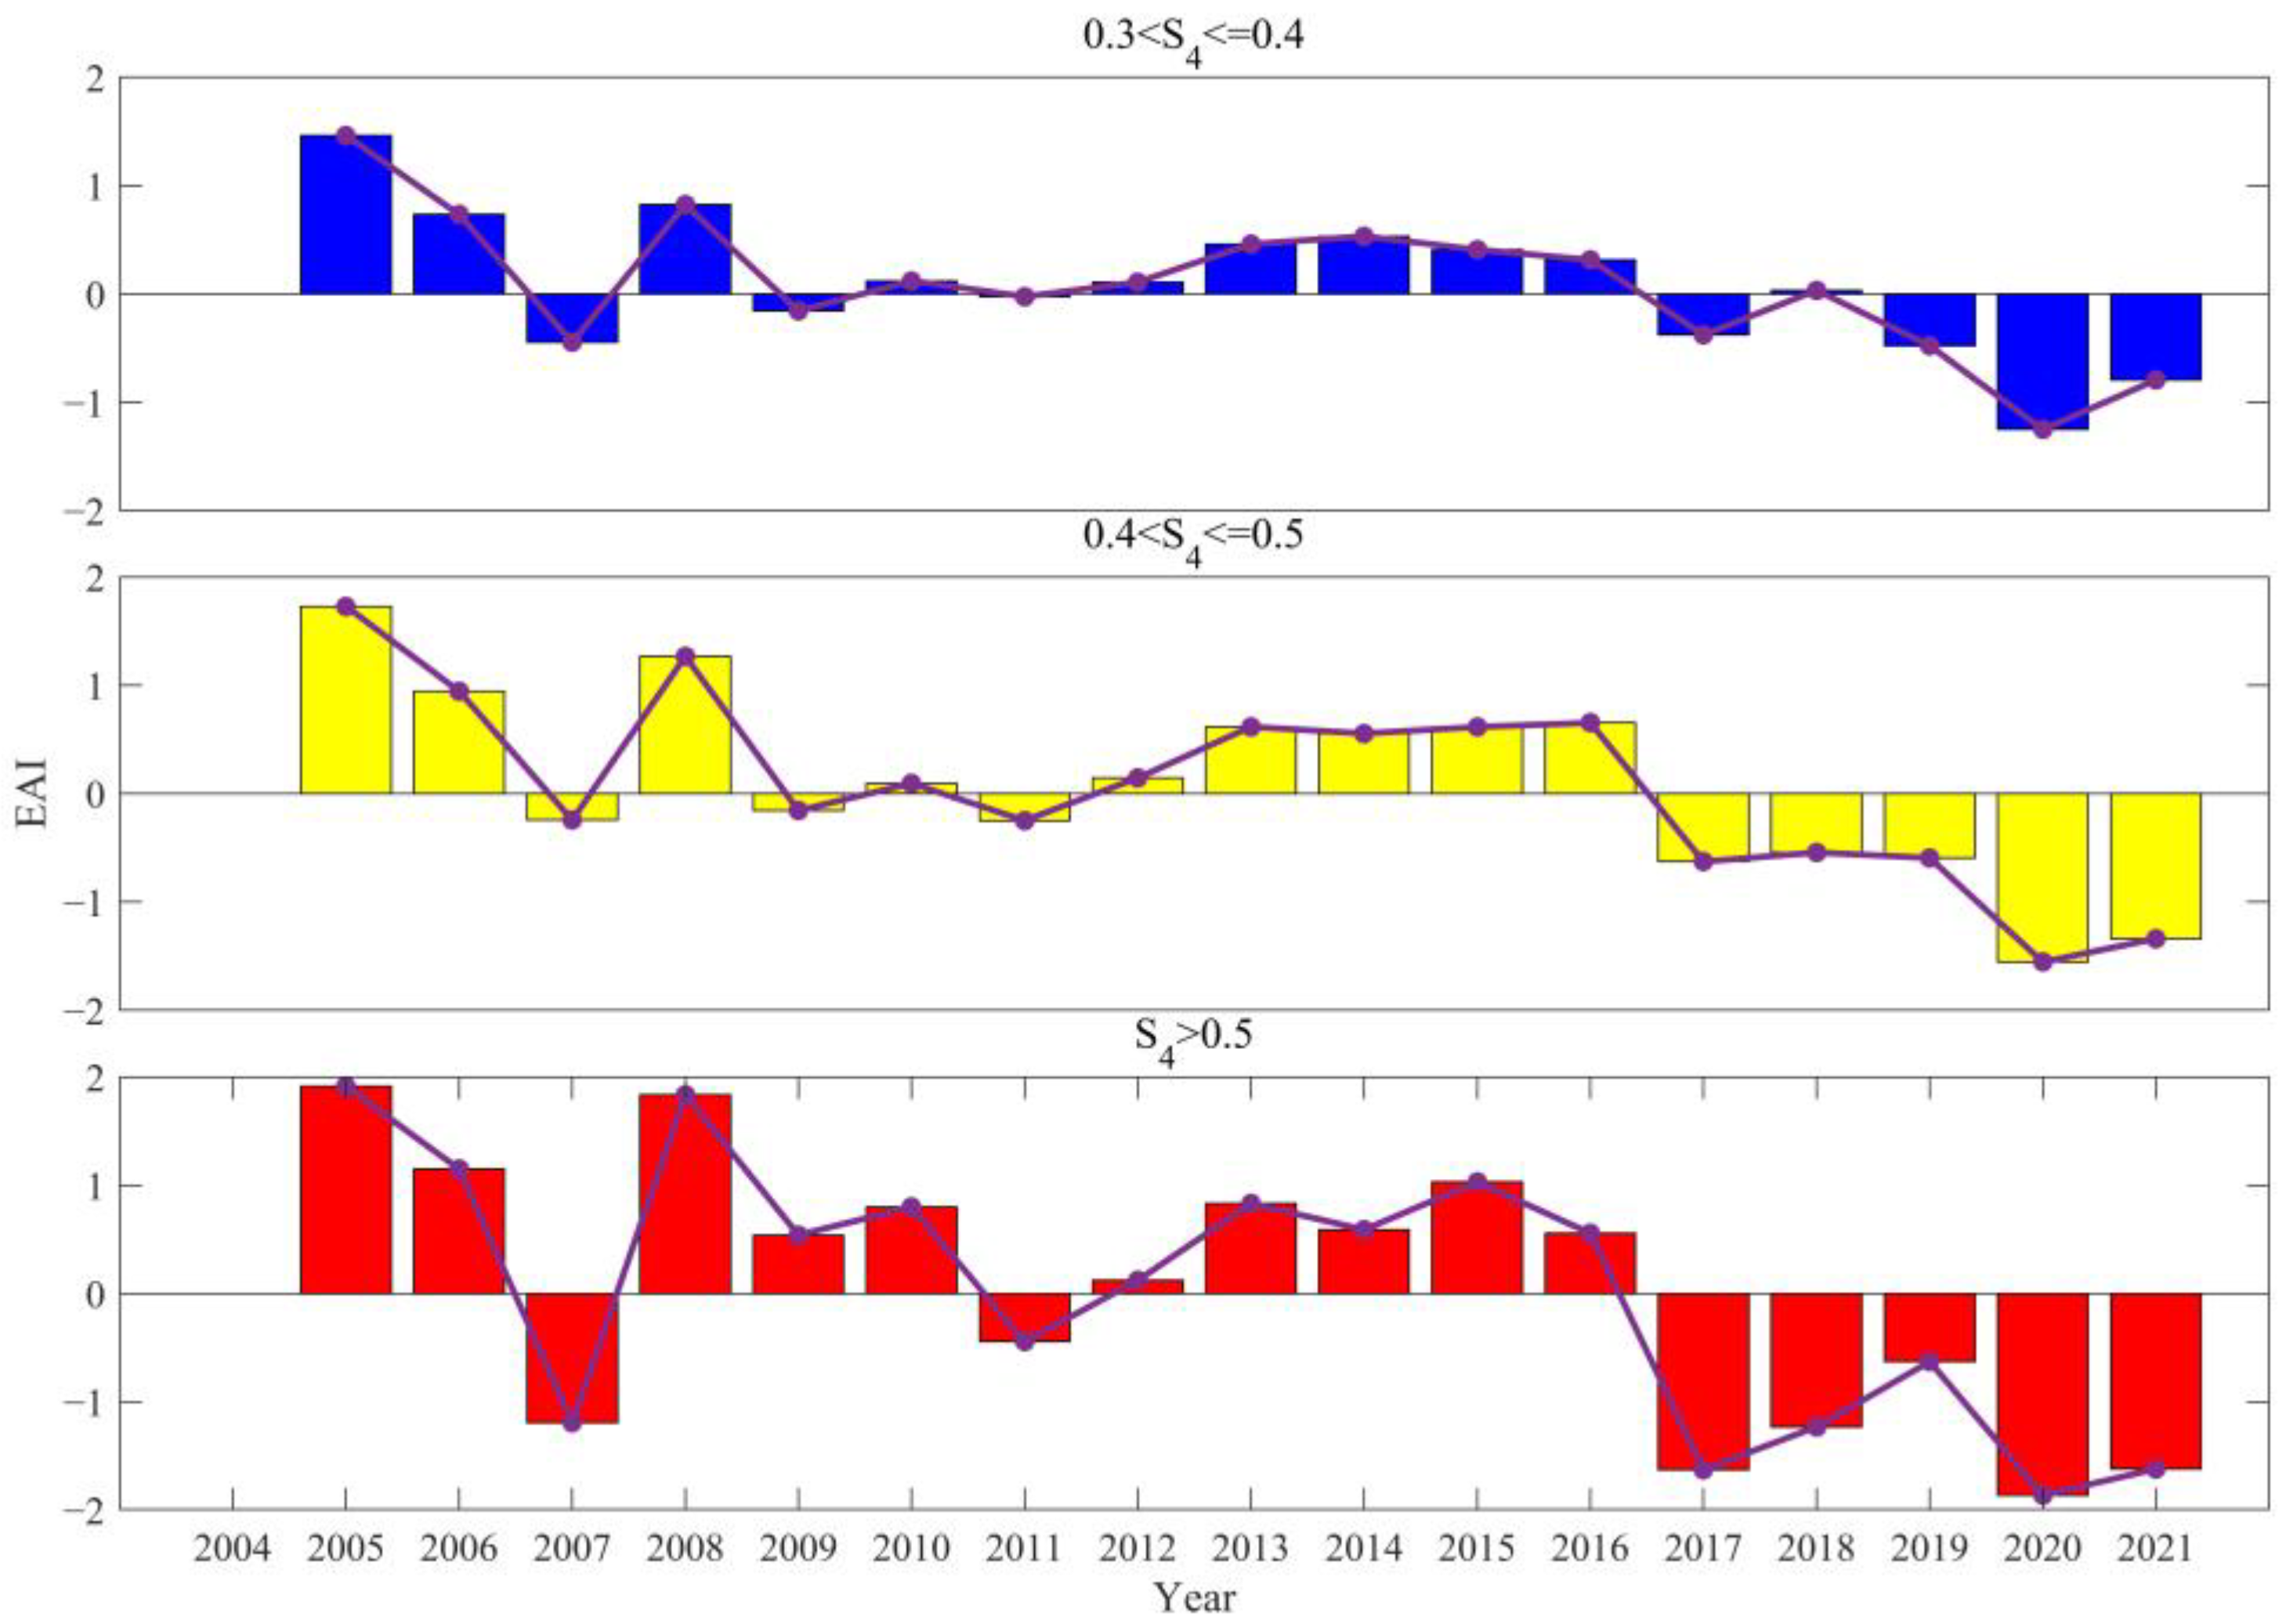
To further analyze the equinoctial asymmetry of scintillations of different intensities, Figure 11 displays the distribution of the EAI for scintillations of different intensities in Sanya from 2004 to 2021. The blue bars represent weak scintillations, the yellow bars represent moderate scintillations, and the red bars represent strong scintillations. The diamond-shaped line frames in the figure illustrate the trend of equinoctial asymmetry for scintillations of different intensities. It is observable from the figure that the occurrence rates of scintillations are higher in spring than in autumn for most years. However, during 2007, 2011, and from 2017 to 2021, the asymmetry is reversed, with autumn showing a higher occurrence rate than spring. Additionally, as the intensity of scintillation increases, the equinoctial asymmetry tends to intensify in most years. In 2009, the occurrence rates for weak and moderate scintillations are higher in autumn than in spring, whereas for strong scintillations, the rate is higher in spring than in autumn.

3.4. The Impact of Geomagnetic Activity on the Occurrence Rates of Scintillations of Different Intensities

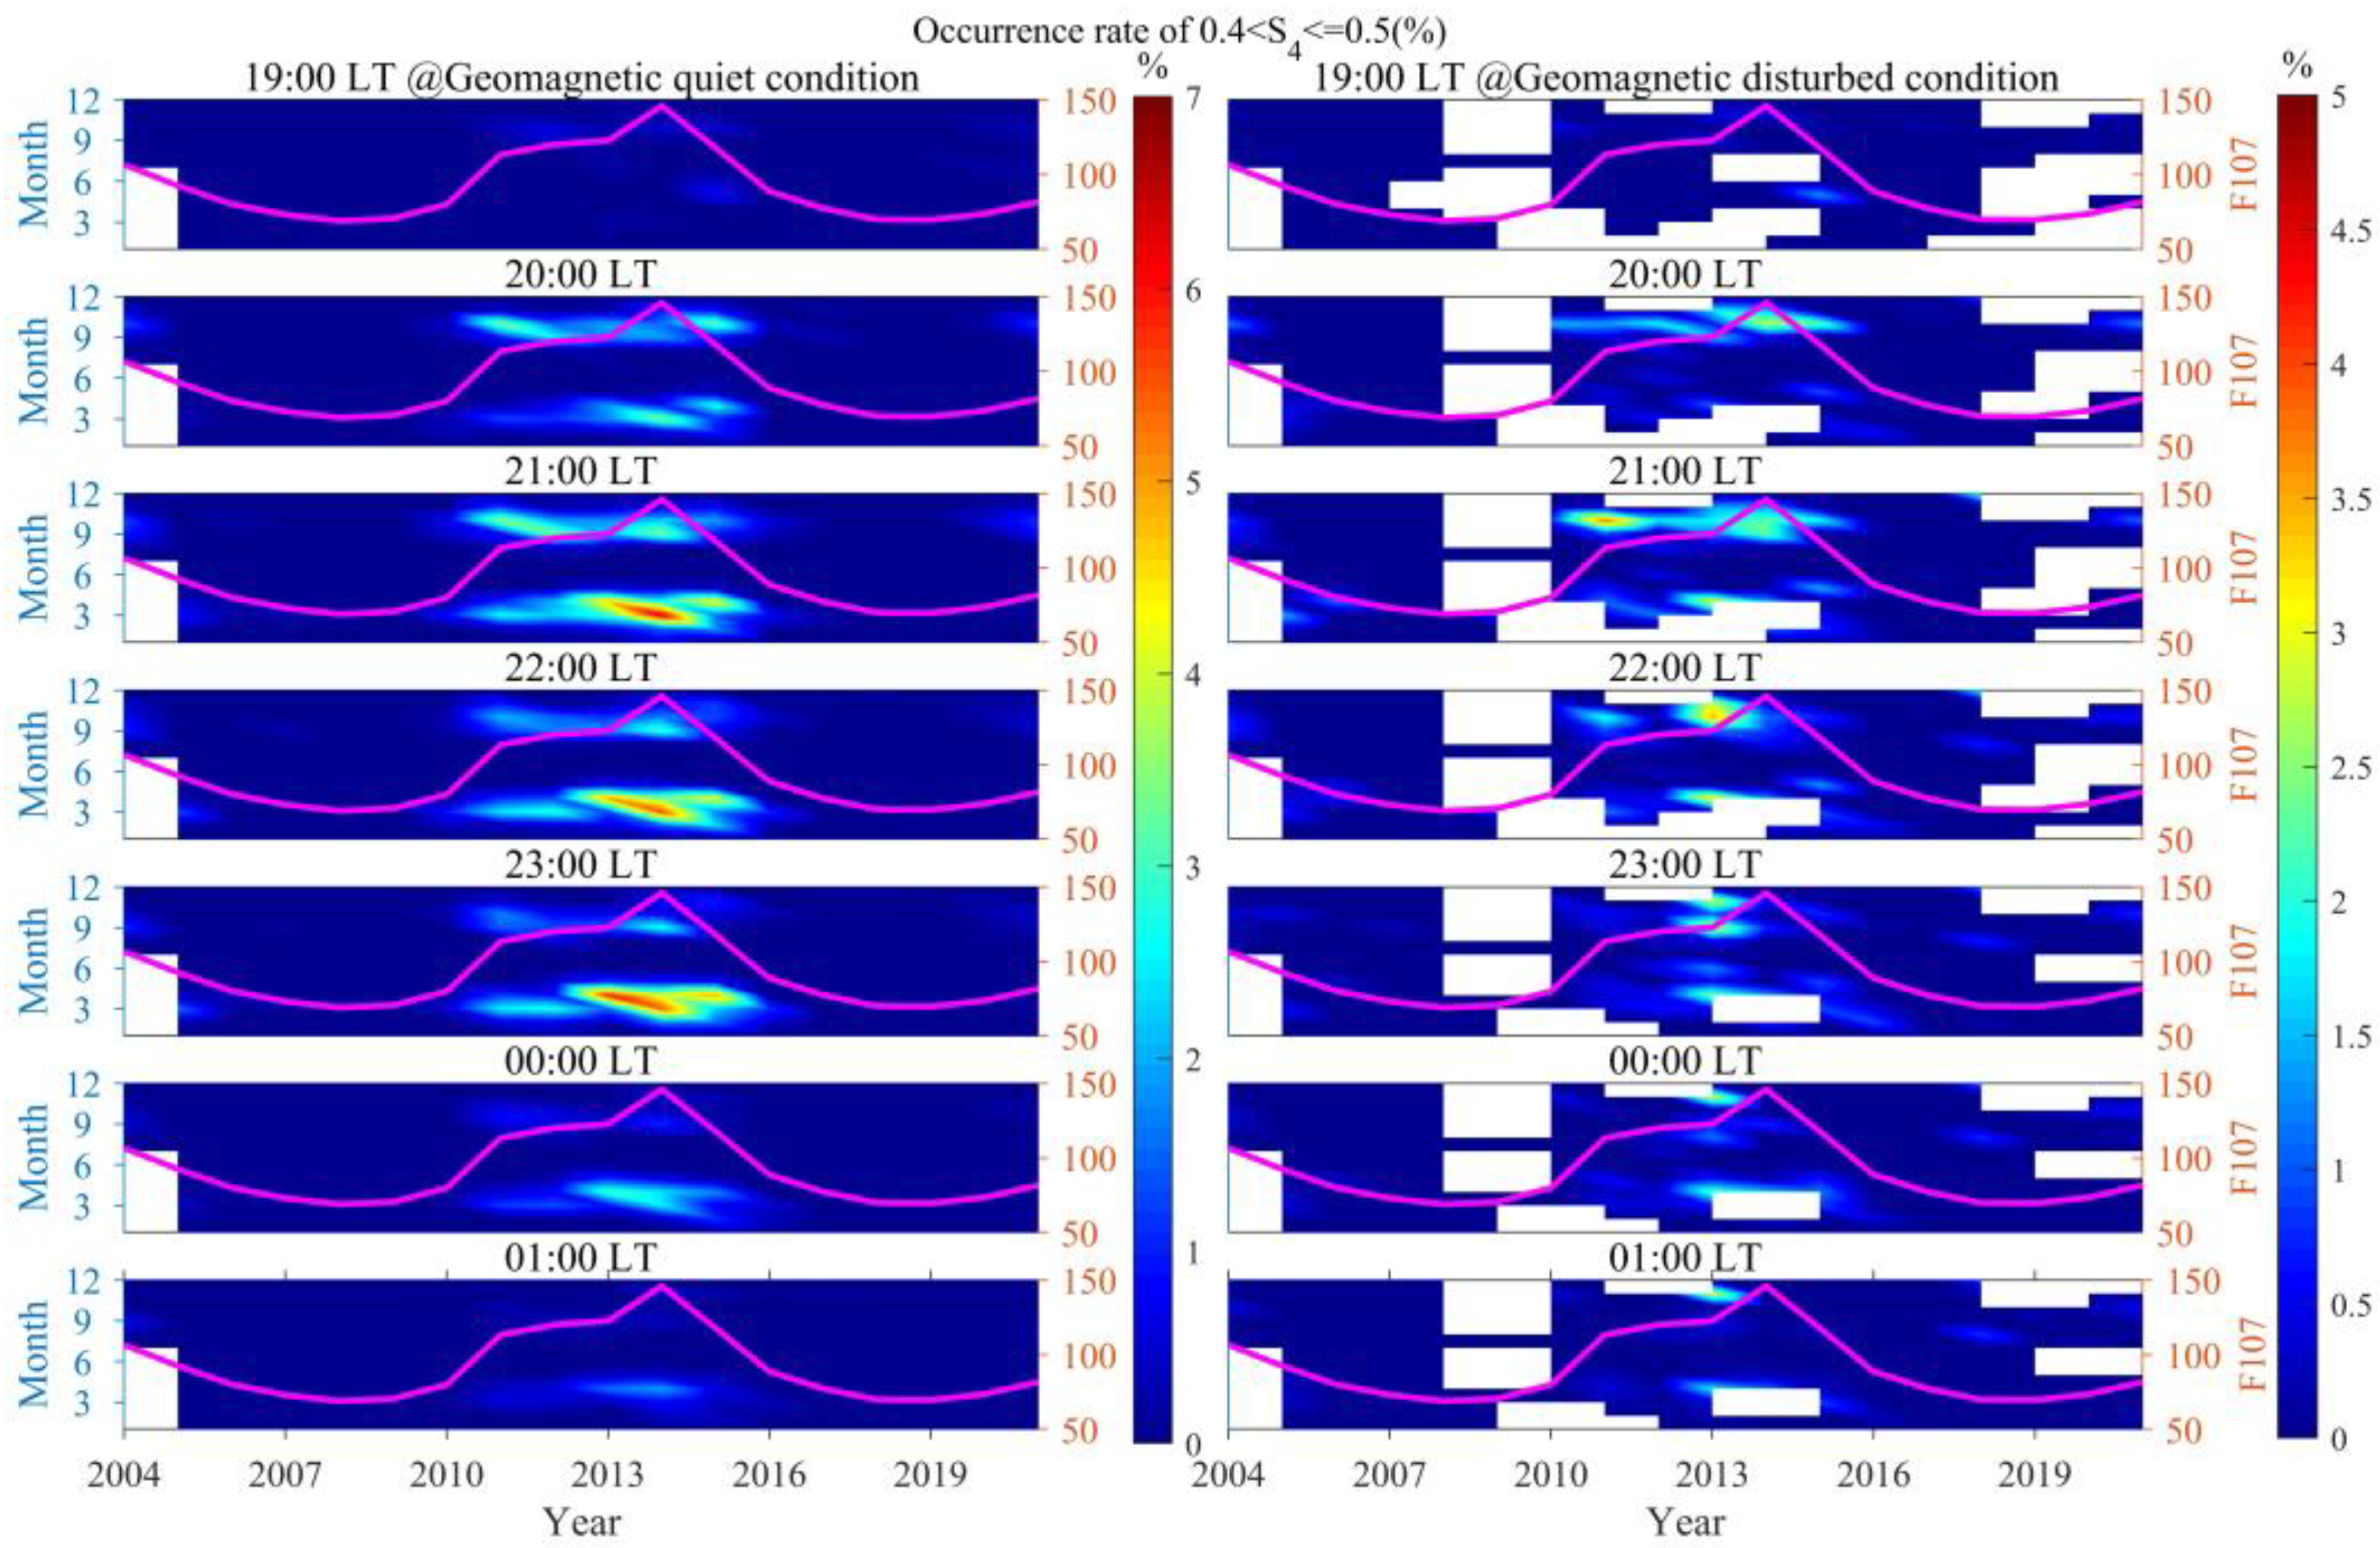
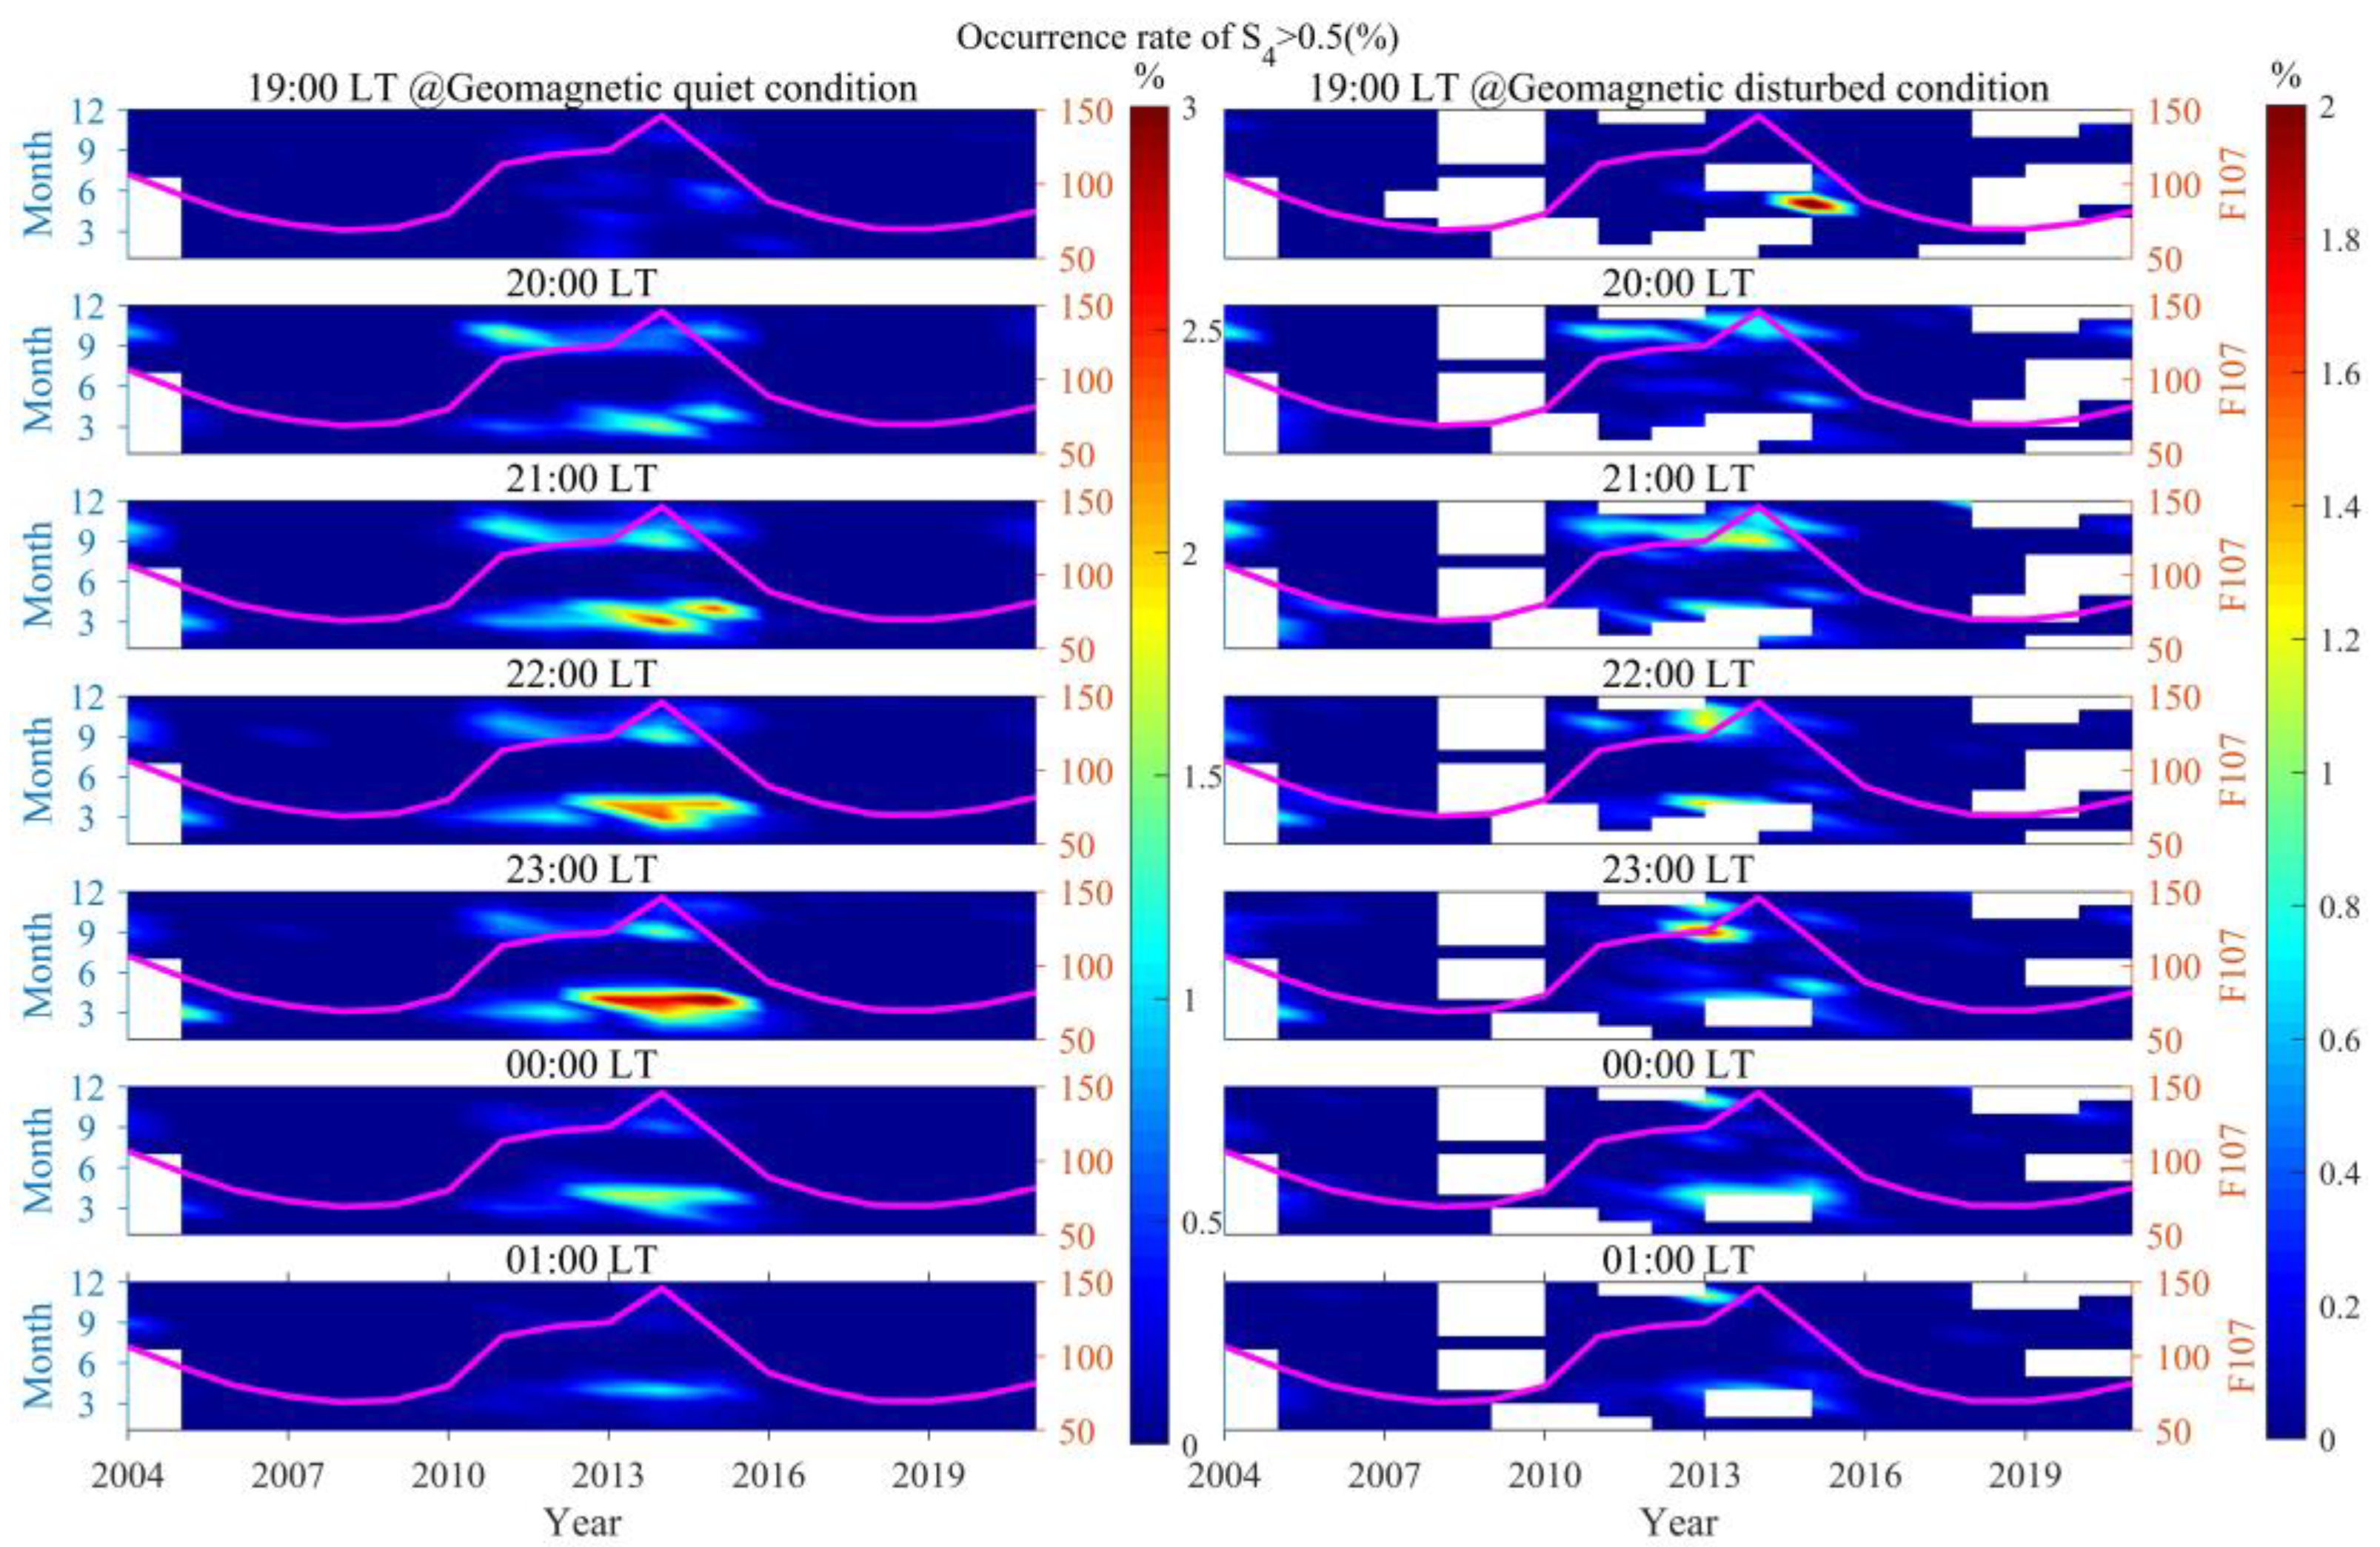
In order to comprehensively analyze the impact of geomagnetic activity on the occurrence rates of scintillations of different intensities, Figure 12 presents the distribution of the occurrence rates of scintillations of different intensities in Sanya under different geomagnetic activity conditions from 2004 to 2021, during the LT from 19:00 to 03:00 of the next day. The upper and lower subplots in the figure, respectively, present the distribution of ionospheric scintillations under geomagnetic quiet and disturbed conditions. Different colors represent the occurrence rates of different scintillation intensities: blue represents the occurrence rate of weak scintillations, yellow represents the occurrence rate of moderate scintillations, and red represents the occurrence rate of strong scintillations. At the same time, we use the letter S to represent spring and the letter A to represent autumn. From the figure, it can be found that the occurrence rates of ionospheric scintillations under disturbed magnetic conditions are generally lower than those under quiet conditions. This result indicates that geomagnetic disturbances generally inhibit the occurrence of scintillations. Meanwhile, geomagnetic disturbances show a significant promoting effect on ionospheric scintillations in Sanya during the spring of 2006, the summer of 2011, the autumn and winter of 2013, and the winter of 2018.
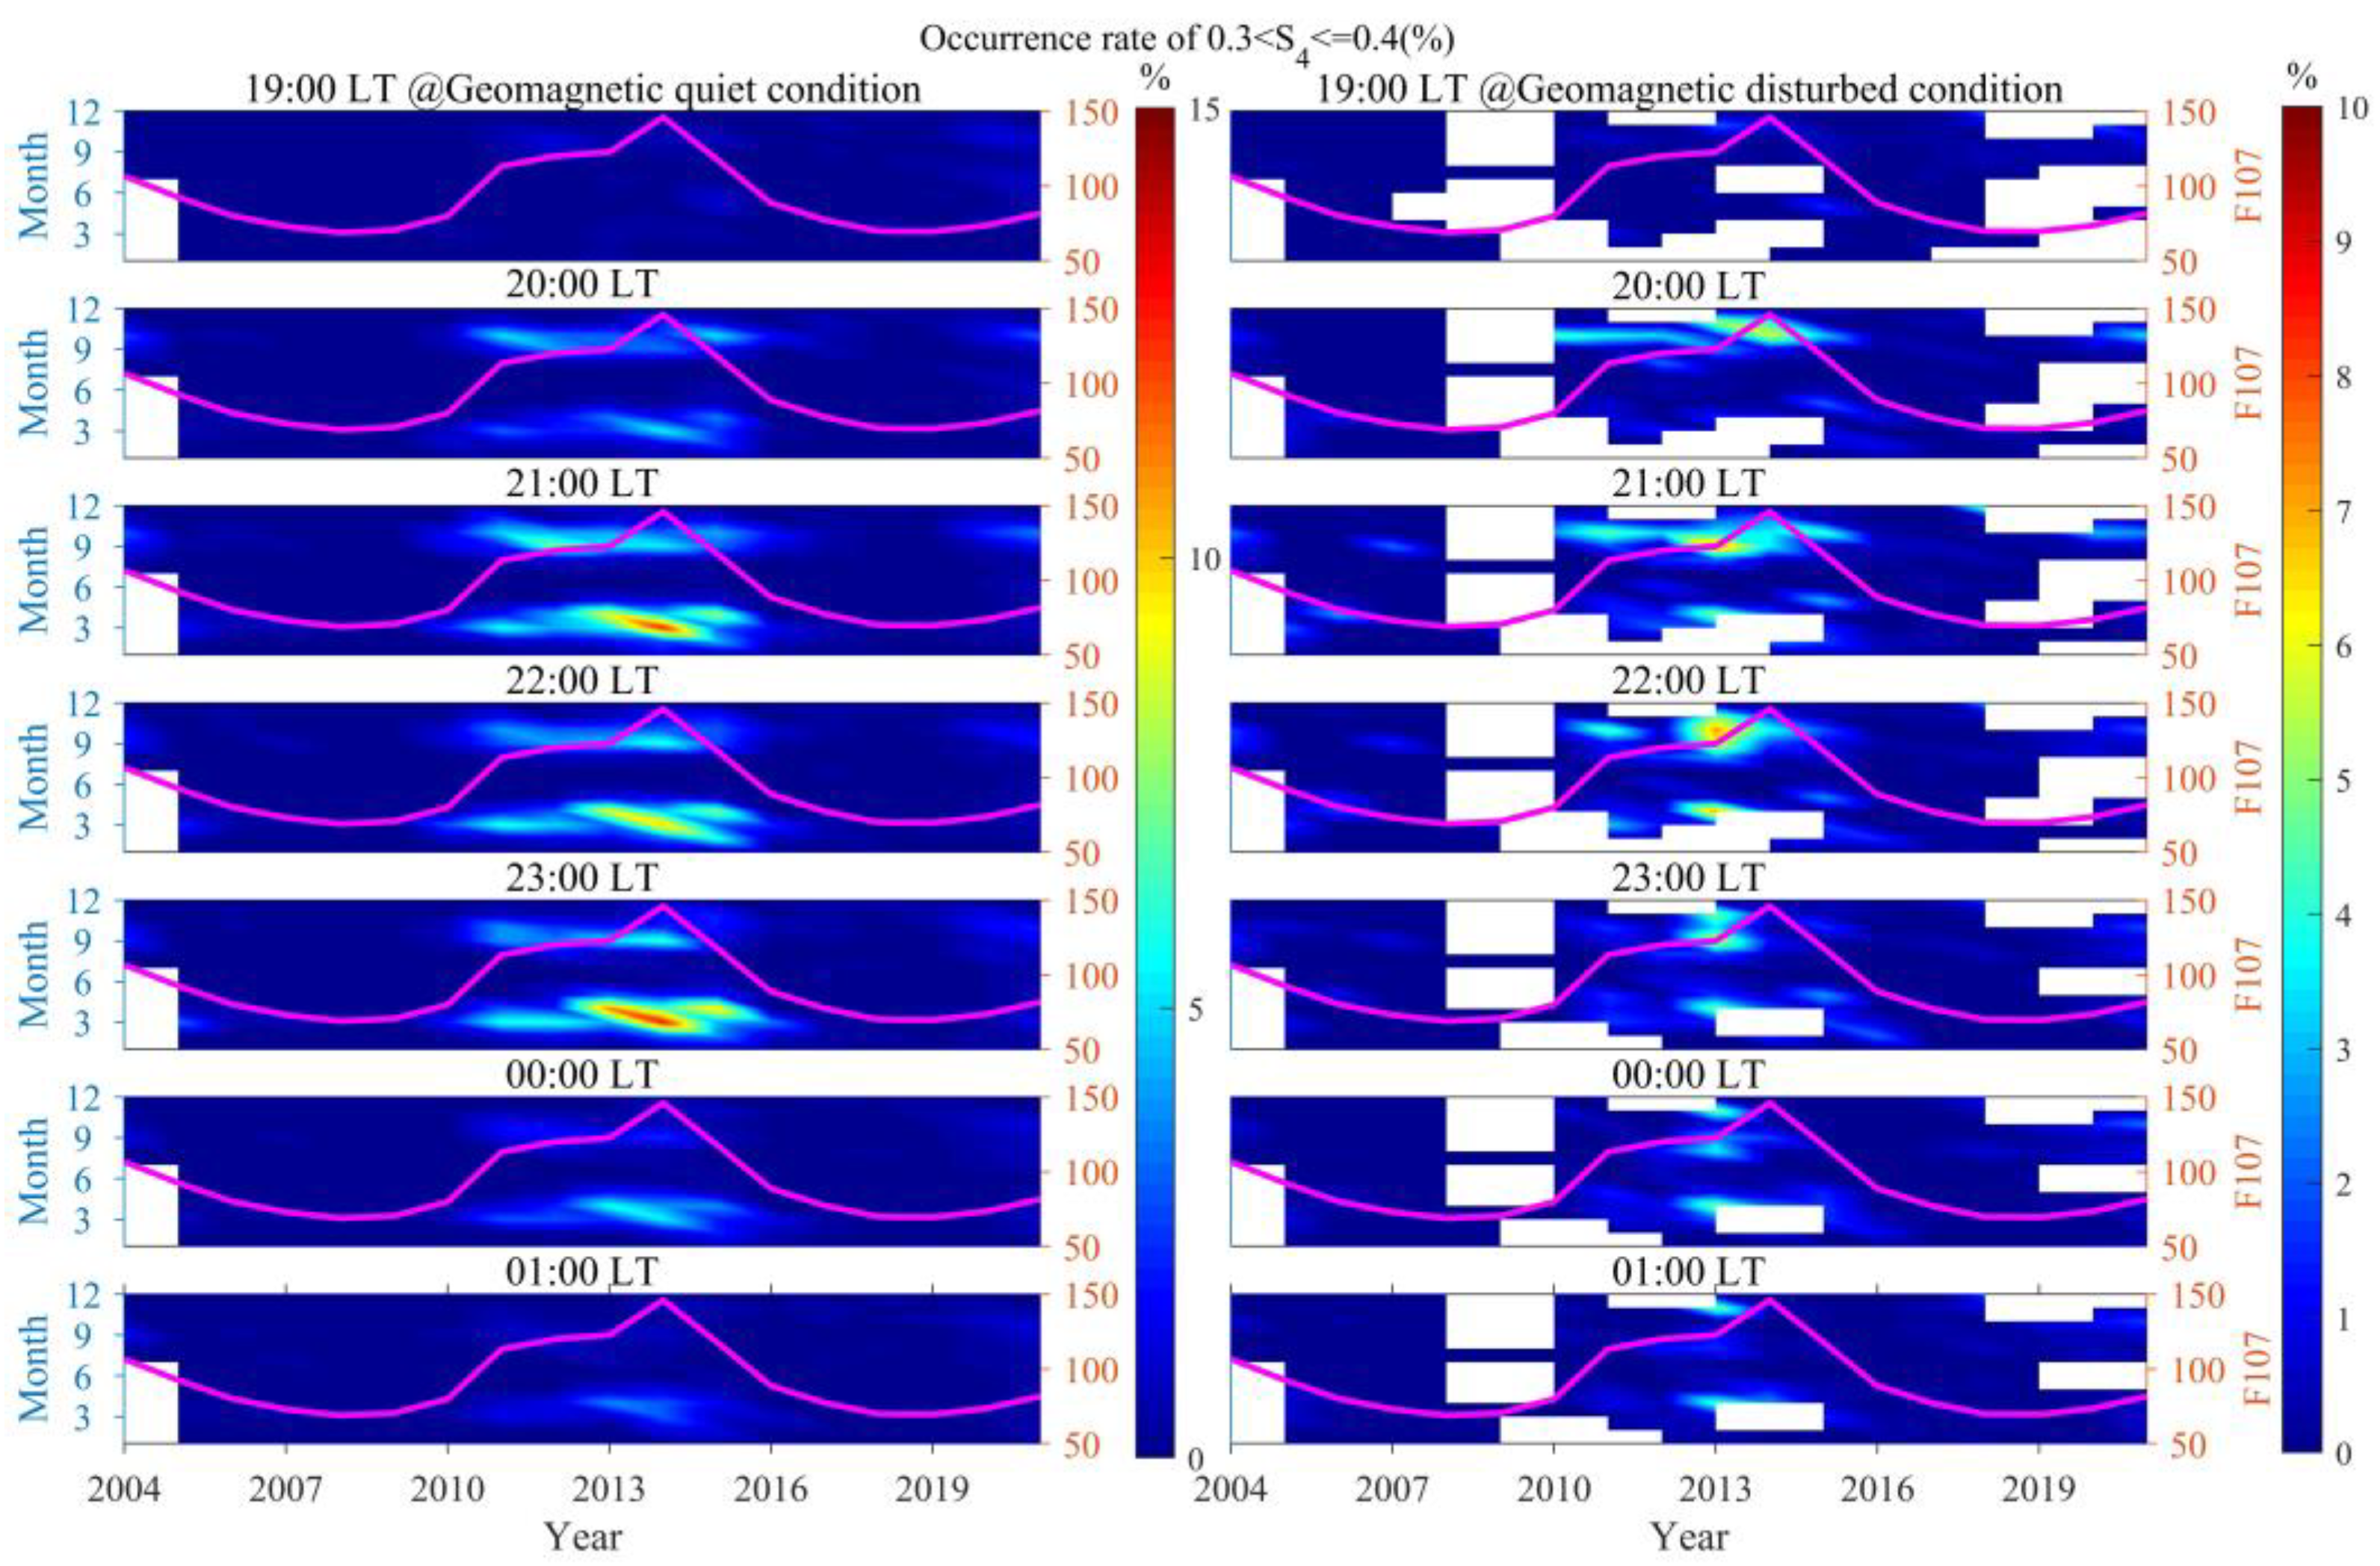
In order to more accurately analyze the impact of LT under different geomagnetic activity conditions on the occurrence rates of ionospheric scintillations in Sanya, Figure 13, Figure 14 and Figure 15, respectively, illustrate the variation in occurrence rates of weak, moderate, and strong scintillations under different geomagnetic activity conditions with LT, solar activity, and season. The left panel of Figure 13 reveals that weak scintillations under quiet geomagnetic conditions exhibit a higher occurrence rate between 20:30 and 23:30 LT during the spring and autumn seasons from 2013 to 2015. In the spring from 2013 to 2015, the occurrence rate of weak scintillations reaches a peak around 21:00 LT, begins to decrease at 22:00, and reaches another peak around 23:00. Moreover, the occurrence rate of weak scintillations under quiet magnetic conditions is greater in spring than in autumn. The right panel of Figure 13 illustrates that weak scintillations under disturbed geomagnetic conditions first appear around 20:00 LT during the autumn and winter of 2013 and 2014. As LT progresses, weak scintillations are concentrated between 21:00 and 23:00 LT during the autumn and winter of 2013, and the occurrence rate of weak scintillations reaches a peak around 22:00 LT in the autumn of 2013. A comprehensive analysis indicates that the occurrence rate of weak ionospheric scintillations in Sanya is lower under disturbed geomagnetic conditions compared to quiet magnetic conditions. Moreover, weak scintillations predominantly occur in spring under quiet conditions, while they are mainly observed in autumn under disturbed conditions.
From Figure 14, it can be found that the impact of LT on the distribution pattern of moderate scintillations under different geomagnetic activity conditions is essentially consistent with that of weak scintillations. From the left side of Figure 15, it can be seen that under quiet magnetic conditions, the occurrence rate of strong scintillations reaches a peak near 23:00 LT during the spring from 2013 to 2015. The right panel of Figure 15 indicates that under disturbed magnetic conditions, strong scintillations first occur around 19:00 LT in the summer of 2014, and the occurrence rate reaches a peak around 23:00 LT in the autumn of 2013.
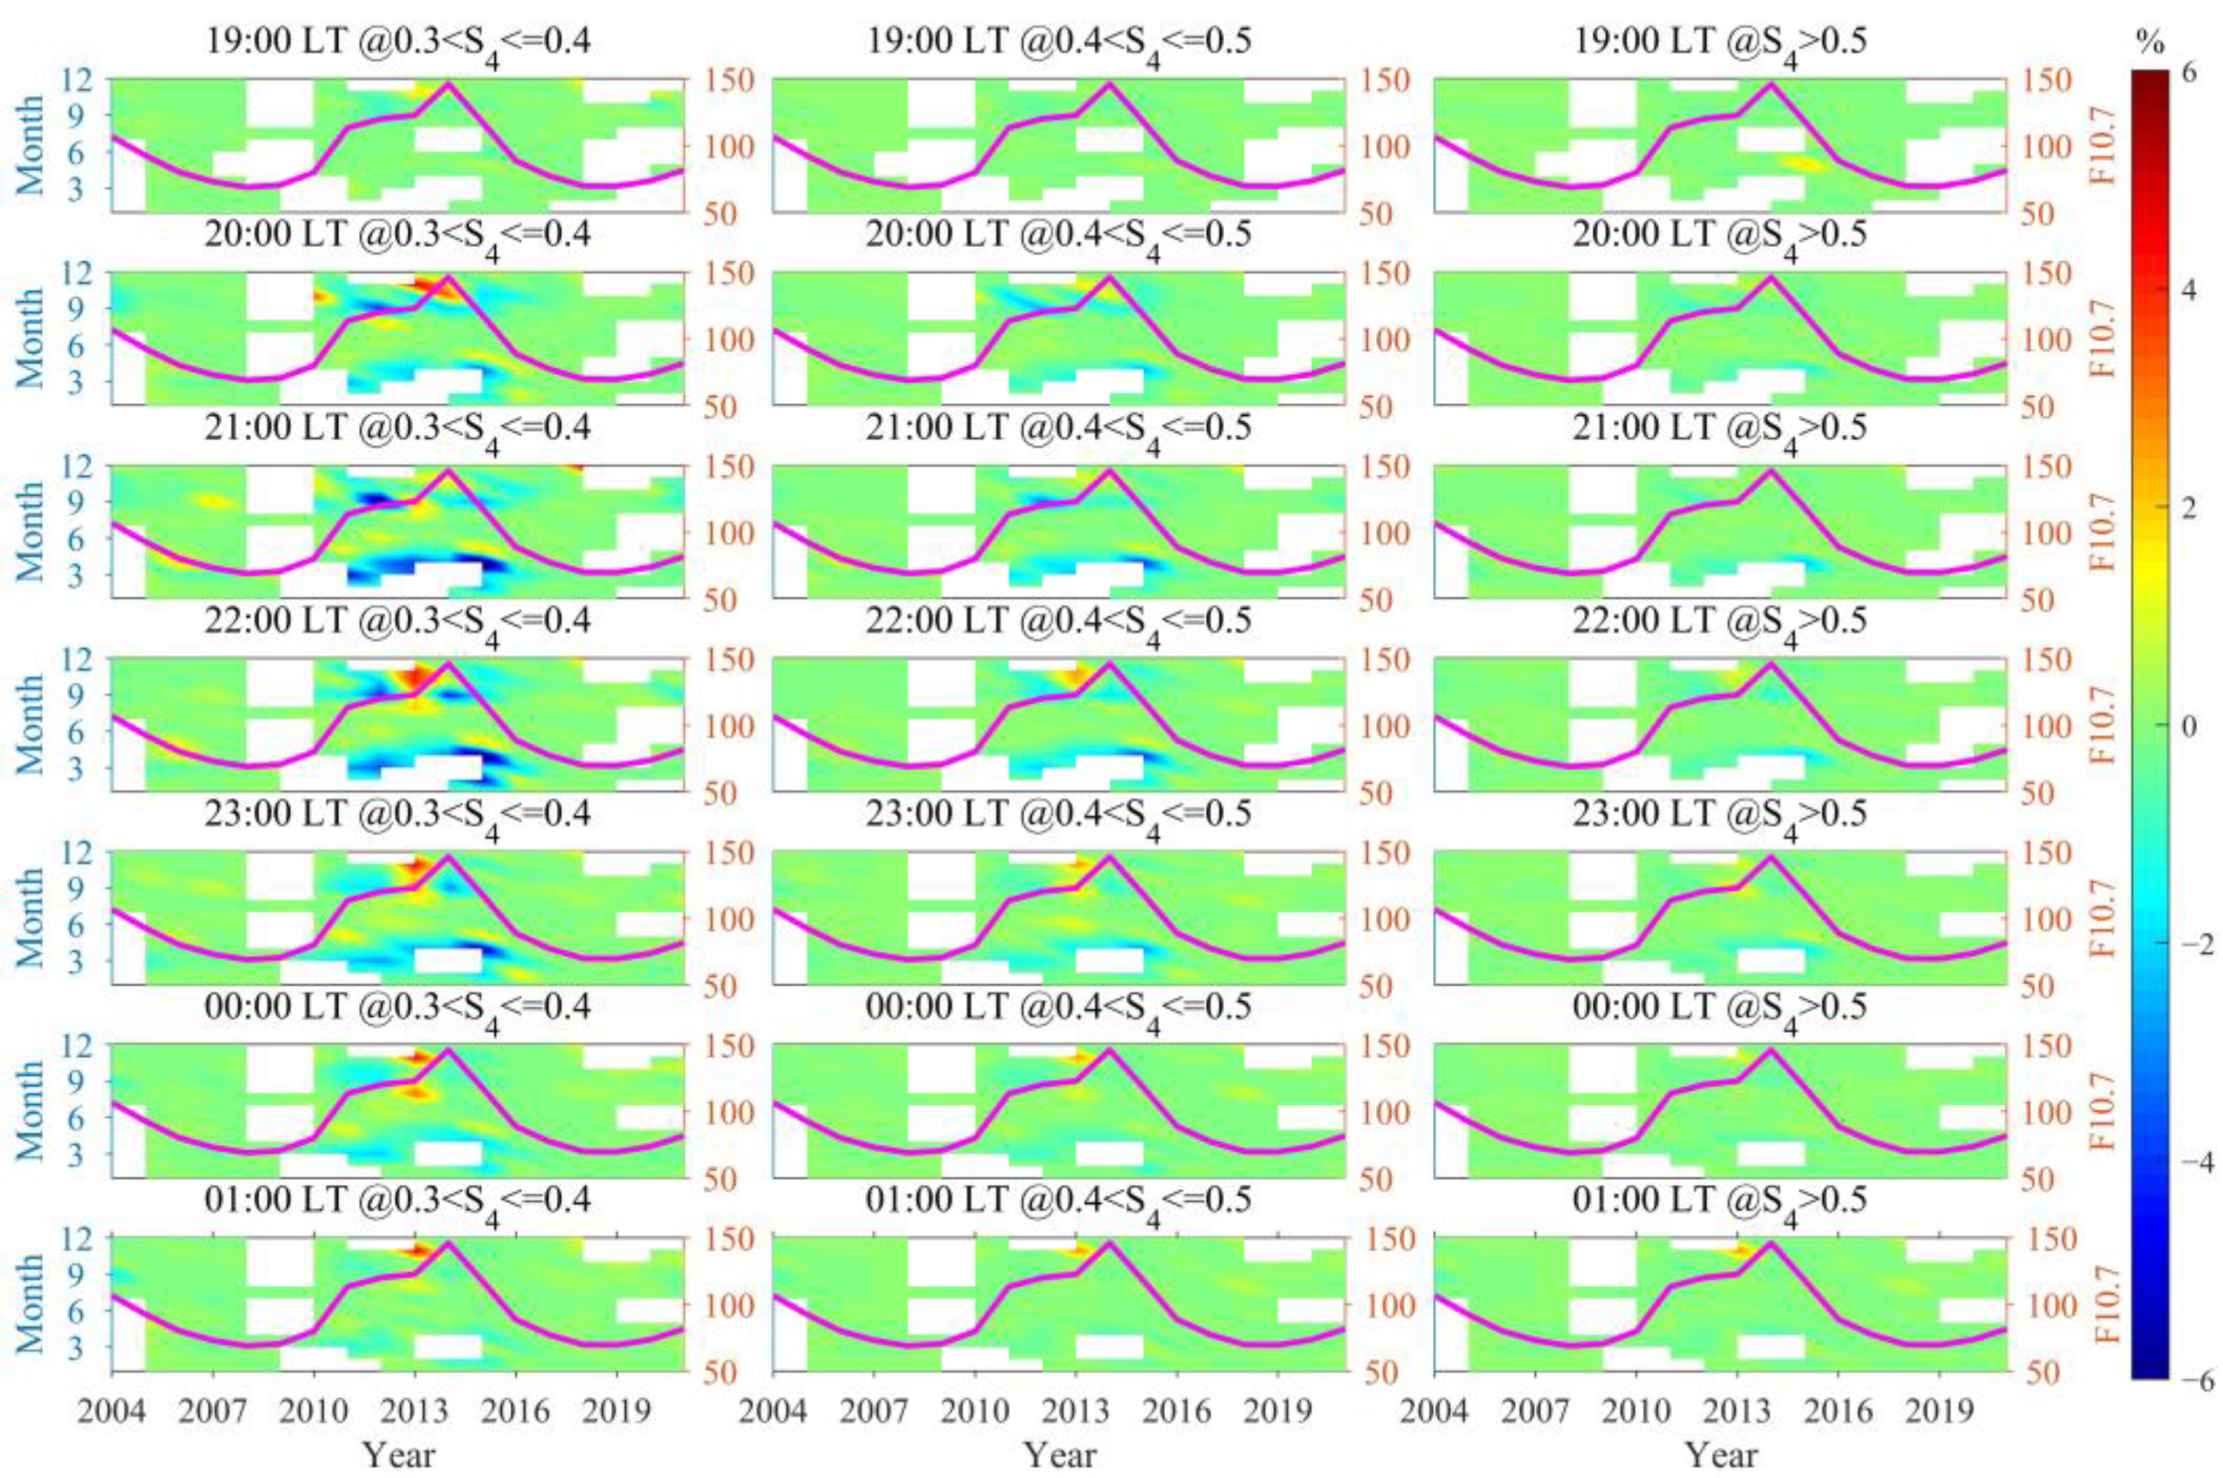
To more intuitively display the impact of geomagnetic disturbances on the occurrence rates of scintillations of different intensities, Figure 16 presents the distribution of the influence of geomagnetic disturbances on the occurrence rates of scintillations of different intensities in Sanya from 2004 to 2021. In the figure, the different colors represent the difference in the occurrence rates of scintillations of different intensities under disturbed magnetic conditions compared to quiet magnetic conditions. When the difference is greater than 0, it indicates that geomagnetic disturbances promote the occurrence of scintillations (red areas in the figure). If the difference is less than 0, it indicates that geomagnetic disturbances have an inhibitory effect on scintillations (blue areas in the figure). If the difference is equal to 0, it indicates that geomagnetic disturbances have no effect on scintillations (green areas in the figure). From the figure, we can first observe that the influence of geomagnetic disturbances on scintillations gradually decreases with increasing scintillation intensity. Secondly, geomagnetic disturbances significantly inhibit weak scintillations from 21:00 to midnight in spring during the high solar activity years (2011–2015), from 20:00 to 23:00 in the autumn of 2011, 2012, and 2015, and from 21:00 to 23:00 in the autumn of 2014 [42]. The inhibitory effect is most pronounced between 21:00 and 22:00 LT. Lastly, geomagnetic disturbances promote weak scintillations at 20:00 LT in the autumn and winter of 2013 and 2014, and from 21:00 to 01:00 the next day in the latter half of 2013.

4. Discussion

From Figure 1, Figure 2, Figure 3 and Figure 4, it is evident that the variability in the occurrence rates of scintillations is modulated by solar activity. A large quantity of research indicates that variations in solar radiation flux can influence the distribution of ionospheric electron density and temperature, thereby affecting the changes in vertical drift velocities [43,44,45]. The variations in vertical drift velocity can not only directly promote the development of EPBs [46,47,48] but can also indirectly enhance the Rayleigh–Taylor (R-T) instability by reducing the collision frequency between F-layer ions and neutral particles, thus promoting the generation of EPBs [27,49,50]. Based on observations from a Brazilian digital ionosonde (44.2°W, 2.33°S), Santos et al. [51] studied the relationship between the pre-midnight vertical drift velocities in the equatorial F-region and the solar activity index F10.7. Their results showed a positive correlation between the vertical drift velocities and solar activity.
Figure 1, Figure 2, Figure 3, Figure 5, Figure 6, Figure 7, Figure 8, Figure 9 and Figure 10 reveal that scintillations in Sanya during low solar activity years mainly occur in spring and autumn, which is significantly different from previous literature concluding that the peak occurrence of scintillations in Sanya is primarily in summer. Luo [52] utilized observations from an ionosonde in Haikou to statistically analyze the occurrence of ionospheric irregularities, revealing that the peak occurrence of irregularities in Haikou during the years of low solar activity is essentially in summer. Guo [32] used a digital ionosonde to statistically analyze the seasonal variation characteristics of the occurrence of irregularities in Sanya from 2007 to 2009. The results indicated that the irregularities at low latitudes during the years of high solar activity are mainly strong range spread-F and had a higher occurrence rate in spring and autumn. During the years of low solar activity, irregularities at low latitudes are primarily composed of mixed spread-F, predominantly occurring in summer [1].
The scintillations in Sanya are predominantly observed in spring and autumn, primarily associated with the PRE of vertical plasma drift velocity and the angle between the solar terminator and the magnetic meridian. Hong et al. [53] conducted a statistical analysis of the response of plasma drift in Sanya to seasonal changes from 2003 to 2016. Their results indicated that the amplitude of the PRE of the vertical plasma drift velocity is the greatest after sunset in the equinoxes. Fejer et al. [45] statistically analyzed the response of vertical plasma drift velocities in the equatorial region to solar activity and seasonal variations. Their results indicated that the PRE of vertical plasma drift velocity is almost non-existent during the summer and winter seasons of the low solar activity years. Because the PRE of vertical plasma drift velocity can promote the occurrence of scintillation [54], the scintillations that occur in Sanya are primarily in spring and autumn during years of low solar activity when the amplitude of the PRE of vertical plasma drift velocity is larger during these seasons. Tsunoda [55] indicated that the frequency of scintillation occurrences is closely related to the angle between the solar terminator and the geomagnetic meridian. As the angle between the solar terminator and the magnetic meridian decreases, the frequency of scintillation occurrences correspondingly increases. In Sanya, China, the geomagnetic meridian and the solar terminator are nearly aligned during the equinoxes, which leads to ionospheric scintillations occurring more frequently during these seasons.
Figure 2 and Figure 11 show that in most years, the occurrence rates of scintillations in Sanya are stronger in spring than in autumn. The asymmetry of ionospheric scintillation during the equinoxes is mainly caused by the asymmetry of neutral winds. Maruyama and Matuura [56] pointed out that the difference in neutral wind speeds between the Northern and Southern Hemispheres during spring and autumn leads to the asymmetry of ionospheric scintillation during the equinoxes. Maruyama et al. [57] found through model simulations that an increase in zonal wind speed can suppress the occurrence of irregularities: the equatorial zonal wind speeds in March and September are approximately 10 m/s and 40 m/s, respectively, and as the zonal wind increases from 10 m/s to 40 m/s, the occurrence rate of ionospheric irregularities gradually decreases. The asymmetry in the occurrence rates of intense scintillations between spring and autumn may be attributed to the asymmetry in the intensity of background plasma density. Sripathi et al. [41] utilized the amplitude scintillation index from GPS L1 signals at the equatorial station in Tirunelveli to statistically assess the seasonal characteristics of scintillations and TIMED/GUVI-retrieved peak electron density during the spring and autumn equinoxes. Their findings indicate that the higher incidence of scintillations in spring compared to autumn is very likely attributed to the higher background electron density at the vernal equinox as opposed to the autumnal equinox.
Figure 5, Figure 6, Figure 7, Figure 8, Figure 9 and Figure 10 show that scintillations in Sanya mainly occur from 19:30 to 23:30 LT during the period from 2004 to 2021. The LT characteristics of scintillations in Sanya are more closely related to the occurrence and disappearance times of the polarized electric field. Abdu et al. [54] pointed out that the eastward thermosphere zonal wind at dusk can generate a vertical polarization electric field in the F-layer. The decay of the E-layer conductivity at night leads to an increase in the longitudinal gradient, which in turn increases the linear growth rate of the Rayleigh–Taylor (R-T) instability. A large number of studies suggest that R-T instability is responsible for promoting the generation of irregularities [27,49,50]. Therefore, the polarized electric field generated at dusk indirectly promotes the occurrence of ionospheric scintillations in Sanya around dusk. After midnight, the polarization electric field generated in the F-layer is weakened due to the decrease in the electron density of the F-layer, which leads to a lower occurrence rate of scintillation after midnight compared to before midnight.
Regarding the impact of geomagnetic activity on the occurrence rate of ionospheric irregularities, Zhao et al. [32] suggested that geomagnetic disturbances have a general suppressive effect on the formation of ionospheric irregularities following sunset. During magnetic storms, whether irregularities are excited or suppressed is determined by the perturbations of the zonal electric field in equatorial or low-latitude regions. The disturbance electric fields during magnetic storms primarily originate from two distinct processes, namely, the prompt penetration electric field (PPEF) [58] and the ionospheric disturbance dynamo electric field (DDEF) [59]. During the dusk of magnetic storms, the PPEF tends to promote the generation of irregularities, while the DDEF suppresses their occurrences. Due to the short duration of the PPEF, the DDEF dominates, thus geomagnetic disturbances during the evening of magnetic storms generally exhibit a suppressive effect on the occurrence of irregularities [27,31]. Huang et al. [33] suggested that the PPEF plays a dominant role before the full development of the DDEF during periods of strong geomagnetic activity. Therefore, geomagnetic disturbances primarily act to promote the occurrence of ionospheric irregularities [34,35]. Kumar et al. [26] held the view that geomagnetic activity can either promote or inhibit the development of ionospheric irregularities and that these effects are influenced by the LT at which the geomagnetic disturbances take place. Our statistical analysis results indicate that the promotional or inhibitory effect of geomagnetic disturbances on scintillations depends not only on the influence of disturbed electric fields but is also jointly controlled by various factors, including solar activity, season, and LT.

5. Conclusions

The observation data collected by the GISTMS in Sanya from 2004 to 2021 are used for a statistical analysis of the distribution of scintillations of varying intensities in relation to solar activity, season, LT, and geomagnetic activity. The main findings are summarized as follows.
(1)
From 2005 to 2016, scintillations in Sanya mainly occurred during the equinoxes, exhibiting a spring–autumn equinox asymmetry with a higher occurrence rate in spring than in autumn. This result can be associated with the geomagnetic meridian near the equinoxes in Sanya being almost at a 0° angle with the sun’s terminator, as well as the asymmetry caused by neutral winds. During the period of low solar activity from 2017 to 2021, the peak of scintillation occurrence in 2018 was observed in winter, while in other years, the peaks were predominantly in autumn.
(2)
Geomagnetic disturbances were observed to promote weak scintillations at 20:00 LT during the autumn and winter of 2014, and from 20:00 to 01:00 LT the next day in the latter half of 2013. In contrast, during the spring and autumn of most other years with high solar activity, these disturbances were found to inhibit weak scintillations from 20:00 LT to midnight. As scintillation intensity increases, the promoting/inhibiting effect of geomagnetic disturbances on scintillations gradually decreases. The promoting/inhibiting effect of geomagnetic disturbances on ionospheric scintillations is not solely influenced by electric field perturbations; it is to some extent jointly controlled by a variety of factors, including solar activity, season, and LT.

Author Contributions

Conceptualization, B.X.; methodology, B.X. and C.Y.; formal analysis, C.Y., Y.W. (Yuqing Wang) and X.L.; validation, Y.L., C.Y., Y.W. (Yuxin Wang) and L.D.; data curation, B.X. and L.H.; writing—original draft preparation, B.X., C.Y. and Y.L. All authors have read and agreed to the published version of the manuscript.

Funding

This work was supported by the Beijing Natural Science Foundation (1242028 and 1244058), Hebei Natural Science Foundation (D2022502001 and D2019502010), Fundamental Research Funds for the Central Universities (2018MS128 and 2024MS123), the National Natural Science Foundation of China (41404127, 41574151, and 41574162), and the National High Technology Research and Development Program of China (2014AA123503).

Data Availability Statement

The data presented in this study are available from the corresponding author upon reasonable request. The data are not publicly available due to the fact that they are only accessible to registered users.

Acknowledgments

The GNSS ionospheric scintillation data were provided by the Beijing National Observatory of Space Environment (BNOSE), Institute of Geology and Geophysics, Chinese Academy of Sciences (IGGCAS) through the Geophysics Center, National Earth System Science Data Center (http://wdc.geophys.ac.cn//dbList.asp?dType=GPSPublish&dStation=Sanya&dYear=2006, accessed on 10 October 2024), and the Chinese Meridian Project (https://dcstatus.meridianproject.ac.cn/#/sjfw/sjjs, accessed on 10 October 2024).

Conflicts of Interest

The authors declare no conflicts of interest.

References

  1. Alfonsi, L.; Spogli, L.; Pezzopane, M.; Romano, V.; Zuccheretti, E.; De Franceschi, G.; Cabrera, M.A.; Ezquer, R.G. Comparative analysis of spread-F signature and GPS scintillation occurrences at Tucumán, Argentina. J. Geophys. Res. Space Phys. 2013, 118, 4483–4502. [Google Scholar] [CrossRef]
  2. Jin, H. Observational Study on the Low-Latitude Ionospheric Field-Aligned Irregularities over Hainan; Wuhan University: Wuhan, China, 2019. [Google Scholar]
  3. Shi, J.K.; Wang, G.J.; Reinisch, B.W.; Shang, S.P.; Wang, X.; Zherebotsov, G.; Potekhin, A. Relationship between strong range spread F and ionospheric scintillations observed in Hainan from 2003 to 2007. J. Geophys. Res. Space Phys. 2011, 116, A08306. [Google Scholar] [CrossRef]
  4. Fukao, S.; Ozawa, Y.; Yokoyama, T.; Yamamoto, M.; Tsunoda, R.T. First observations of the spatial structure of F region 3-m-scale field-aligned irregularities with the equatorial atmosphere radar in Indonesia. J. Geophys. Res. Space Phys. 2004, 109, A02304. [Google Scholar] [CrossRef]
  5. Nakata, H.; Nagashima, I.; Sakata, K.; Otsuka, Y.; Akaike, Y.; Takano, T.; Shimakura, S.; Shiokawa, K.; Ogawa, T. Observations of equatorial plasma bubbles using broadcast VHF radio waves. Geophys. Res. Lett. 2005, 32, L17110. [Google Scholar] [CrossRef]
  6. Sekar, R.; Chakrabarty, D.; Sarkhel, S.; Patra, A.K.; Devasia, C.V.; Kelley, M.C. Identification of active fossil bubbles based on coordinated VHF radar and airglow measurements. Ann. Geophys. 2007, 25, 2099–2102. [Google Scholar] [CrossRef]
  7. Abdu, M.A. Equatorial spread F/plasma bubble irregularities under storm time disturbance electric fields. J. Geophys. Res. Space Phys. 2012, 117, A05301. [Google Scholar] [CrossRef]
  8. Berkner, L.V.; Wells, H.W. F-region ionosphere: Investigations at low latitudes. Terr. Magn. Atmos. Electr. 1934, 39, 215–230. [Google Scholar] [CrossRef]
  9. Candido, C.M.N.; Batista, I.S.; Becker-Guedes, F.; Abdu, M.A.; Sobral, J.H.A.; Takahashi, H. Spread F occurrence over a southern anomaly crest location in Brazil during June solstice of solar minimum activity. J. Geophys. Res. Space Phys. 2011, 116, A06316. [Google Scholar] [CrossRef]
  10. Weber, E.J.; Buchau, J.; Eather, R.H.; Mende, S.B. North-south aligned equatorial airglow depletions. J. Geophys. Res. Space Phys. 1978, 83, 712–716. [Google Scholar] [CrossRef]
  11. Sahai, Y.; Fagundes, P.R.; Bittencourt, J.A. Transequatorial F-region ionospheric plasma bubbles: Solar cycle effects. J. Atmos. Sol. Terr. Phys. 2000, 62, 1377–1383. [Google Scholar] [CrossRef]
  12. Sobral, J.H.A.; Abdu, M.A.; Takahashi, H.; Taylor, M.J.; de Paula, E.R.; Zamlutti, C.J.; de Aquino, M.G.; Borba, G.L. Ionospheric plasma bubble climatology over Brazil based on 22 years (1977–1998) of 630 nm airglow observations. J. Atmos. Sol. Terr. Phys. 2002, 64, 1517–1524. [Google Scholar] [CrossRef]
  13. Wu, K.; Xu, J.; Wang, W.; Sun, L.; Liu, X.; Yuan, W. Interesting equatorial plasma bubbles observed by all-sky imagers in the equatorial region of China. J. Geophys. Res. Space Phys. 2017, 122, 596–612. [Google Scholar] [CrossRef]
  14. Martinis, C.; Baumgardner, J.; Wroten, J.; Mendillo, M. All-sky-imaging capabilities for ionospheric space weather research using geomagnetic conjugate point observing sites. Adv. Space Res. 2018, 61, 1636–1651. [Google Scholar] [CrossRef]
  15. Zhao, X.K.; Li, G.Z.; Hu, L.H.; Xie, H.Y.; Sun, W.J.; Li, Y.; Ning, B.Q.; Liu, L.B. Solar and geomagnetic activity and seasonal dependence of global equatorial plasma bubbles based on GNSS observations. Chin. J. Geophys. 2023, 66, 2703–2712. [Google Scholar]
  16. Akala, A.O.; Amaeshi, L.L.N.; Doherty, P.H.; Groves, K.M.; Carrano, C.S.; Bridgwood, C.T.; Seemala, G.K.; Somoye, E.O. Characterization of GNSS scintillations over Lagos, Nigeria during the minimum and ascending phases (2009–2011) of solar cycle 24. Adv. Space Res. 2014, 53, 37–47. [Google Scholar] [CrossRef]
  17. Liu, K.K.; Li, G.Z.; Ning, B.Q.; Hu, L.H.; Li, H.K. Statistical characteristics of low-latitude ionospheric scintillation over China. Adv. Space Res. 2015, 55, 1356–1365. [Google Scholar] [CrossRef]
  18. Hysell, D.L.; Kelley, M.C.; Swartz, W.E.; Woodman, R.F. Seeding and layering of equatorial spread F by gravity waves. J. Geophys. Res. Space Phys. 1990, 95, 17253–17260. [Google Scholar] [CrossRef]
  19. Xu, L.; Cheng, J.; Xu, J.S. Statistical feature of TEC fluctuations and phase scintillations in the low latitude ionosphere of China. Chin. J. Geophys. 2020, 63, 19–30. [Google Scholar]
  20. Basu, S.; MacKenzie, E.; Basu, S. Ionospheric constraints on VHF/UHF communications links during solar maximum and minimum periods. Radio Sci. 1988, 23, 363–378. [Google Scholar] [CrossRef]
  21. Aarons, J. The longitudinal morphology of equatorial F-layer irregularities relevant to their occurrence. Space Sci. Rev. 1993, 63, 209–243. [Google Scholar] [CrossRef]
  22. Brahmanandam, P.S.; Uma, G.; Liu, J.Y.; Chu, Y.H.; Latha Devi, N.S.M.P.; Kakinami, Y. Global S4 index variations observed using FORMOSAT-3/COSMIC GPS RO technique during a solar minimum year. J. Geophys. Res. Space Phys. 2012, 117, A017966. [Google Scholar] [CrossRef]
  23. Li, G.Z.; Ning, B.Q.; Otsuka, Y.; Abdu, M.A.; Abadi, P.; Liu, Z.; Spogli, L.; Wan, W.X. Challenges to equatorial plasma bubble and ionospheric scintillation short-term forecasting and future aspects in east and southeast Asia. Surv. Geophys. 2021, 42, 201–238. [Google Scholar] [CrossRef]
  24. Xiong, C.; Park, J.; Lühr, H.; Stolle, C.; Ma, S.Y. Comparing plasma bubble occurrence rates at CHAMP and GRACE altitudes during high and low solar activity. Ann. Geophys. 2010, 28, 1647–1658. [Google Scholar] [CrossRef]
  25. Smith, J.; Heelis, R.A. Equatorial plasma bubbles: Variations of occurrence and spatial scale in LT, longitude, season, and solar activity. J. Geophys. Res. Space Phys. 2017, 122, 5743–5755. [Google Scholar] [CrossRef]
  26. Kumar, S.; Chen, W.; Liu, Z.; Ji, S. Effects of solar and geomagnetic activity on the occurrence of equatorial plasma bubbles over Hong Kong. J. Geophys. Res. Space Phys. 2016, 121, 9164–9178. [Google Scholar] [CrossRef]
  27. Li, G.Z. Studies on Monitoring, Analysis and Application of Mid- and Low-Latitude Ionospheric Scintillation in China; Chinese Academy of Sciences: Beijing, China, 2007. [Google Scholar]
  28. Su, S.-Y.; Liu, C.H.; Ho, H.H.; Chao, C.K. Distribution characteristics of topside ionospheric density irregularities: Equatorial versus midlatitude regions. J. Geophys. Res. Space Phys. 2006, 111, A06305. [Google Scholar] [CrossRef]
  29. Wang, G.J.; Shi, J.K.; Wang, X.; Shang, S.P.; Zherebtsov, G.; Pirog, O.M. The statistical properties of spread F observed at Hainan station during the declining period of the 23rd solar cycle. Ann. Geophys. 2010, 28, 1263–1271. [Google Scholar] [CrossRef]
  30. Guo, B. Study on Ionospheric Spread-Fat Low- and Mid-Latitude and Wavelike Structure in Equatorial Ionization Anomaly Crests; University of Chinese Academy of Sciences: Beijing, China, 2020. [Google Scholar]
  31. Huang, C.S.; de La Beaujardiere, O.; Roddy, P.A.; Hunton, D.E.; Pfaff, R.F.; Valladares, C.E.; Ballenthin, J.O. Evolution of equatorial ionospheric plasma bubbles and formation of broad plasma depletions measured by the C/NOFS satellite during deep solar minimum. J. Geophys. Res. Space Phys. 2011, 116, A03306. [Google Scholar] [CrossRef]
  32. Zhao, X.K.; Xie, H.Y.; Hu, L.H.; Sun, W.J.; Hao, X.Q.; Ning, B.Q.; Hisao, T.; Li, G.Z. Climatology of equatorial and low-latitude F region kilometer-scale irregularities over the meridian circle around 120°E/60°W. GPS Solut. 2021, 25, 20. [Google Scholar] [CrossRef]
  33. Huang, C.Y.; Burke, W.J.; Machuzak, J.S.; Gentile, L.C.; Sultan, P.J. DMSP observations of equatorial plasma bubbles in the topside ionosphere near solar maximum. J. Geophys. Res. Space Phys. 2001, 106, 8131–8142. [Google Scholar] [CrossRef]
  34. Stolle, C.; Lühr, H.; Rother, M.; Balasis, G. Magnetic signatures of equatorial spread F as observed by the CHAMP satellite. J. Geophys. Res. Space Phys. 2006, 111, A02304. [Google Scholar]
  35. Aa, E.; Zou, S.; Liu, S. Statistical analysis of equatorial plasma irregularities retrieved from Swarm 2013–2019 observations. J. Geophys. Res. Space Phys. 2020, 125, e2019JA027022. [Google Scholar] [CrossRef]
  36. Kelley, M.C. The Earth’s Ionosphere; Academic Press: San Diego, CA, USA, 1989. [Google Scholar]
  37. Burke, W.J.; Gentile, L.C.; Huang, C.Y.; Valladares, C.E.; Su, S.Y. Longitudinal variability of equatorial plasma bubbles observed by DMSP and ROCSAT-1. J. Geophys. Res. Space Phys. 2004, 109, A12301. [Google Scholar] [CrossRef]
  38. Yue, X.A.; Cai, Y.H.; Wang, J.Y.; Lei, J.H.; Wang, Z.Q.; Wang, Y.H.; Li, M.Y.; Zhang, N.; Ding, F.; Ning, B.Q. Ionospheric Pre-Sunrise Uplift: Comparison of Sanya Incoherent Scatter Radar Observations and Numerical Simulations. J. Geophys. Res. Space Phys. 2023, 128, A031119. [Google Scholar] [CrossRef]
  39. Li, G.Z.; Ning, B.Q.; Abdu, M.A.; Otsuka, Y.; Yokoyama, T.; Yamamoto, M.; Liu, L.B. Longitudinal characteristics of spread F backscatter plumes observed with the EAR and Sanya VHF radar in Southeast Asia. J. Geophys. Res. Space Phys. 2013, 118, 6544–6557. [Google Scholar] [CrossRef]
  40. Li, G.Z.; Ning, B.Q.; Liu, L.B.; Wan, W.X.; Liu, J.Y. Effect of magnetic activity on plasma bubbles over equatorial and low-latitude regions in East Asia. Ann. Geophys. 2009, 27, 303–312. [Google Scholar] [CrossRef]
  41. Sripathi, S.; Kakad, B.; Bhattacharyya, A. Study of equinoctial asymmetry in the Equatorial Spread F (ESF) irregularities over Indian region using multi-instrument observations in the descending phase of solar cycle 23. J. Geophys. Res. Space Phys. 2011, 116, A11302. [Google Scholar] [CrossRef]
  42. Yu, X.; Yue, X.A.; Zhen, W.M.; Xu, J.X.; Liu, D.; Guo, S. On the occurrence of F region irregularities over Haikou retrieved from COSMIC GPS radio occultation and ground-based ionospheric scintillation monitor observations. Radio Sci. 2017, 52, 34–48. [Google Scholar] [CrossRef]
  43. Abdu, M.A.; Batista, I.S.; Brum, C.G.M.; MacDougall, J.W.; Santos, A.M.; de Souza, J.R.; Sobral, J.H.A. Solar flux effects on the equatorial evening vertical drift and meridional winds over Brazil: A comparison between observational data and the IRI model and the HWM representations. Adv. Space Res. 2010, 46, 1078–1085. [Google Scholar] [CrossRef]
  44. Fejer, B.G.; Farley, D.T.; Woodman, R.F.; Calderon, C. Dependence of equatorial F region vertical drifts on season and solar cycle. J. Geophys. Res. Space Phys. 1979, 84, 5792–5796. [Google Scholar] [CrossRef]
  45. Fejer, B.G.; De Paula, E.R.; Gonzalez, S.A.; Woodman, R.F. Average vertical and zonal F region plasma drifts over Jicamarca. J. Geophys. Res. Space Phys. 1991, 96, 13901–13906. [Google Scholar] [CrossRef]
  46. Fejer, B.G.; Scherliess, L.; De Paula, E.R. Effects of the vertical plasma drift velocity on the generation and evolution of equatorial spread F. J. Geophys. Res. Space Phys. 1999, 104, 19859–19869. [Google Scholar] [CrossRef]
  47. Lee, C.C.; Liu, J.Y.; Reinisch, B.W.; Chen, W.S.; Chu, F.D. The effects of the pre-reversal ExB drift, the EIA asymmetry, and magnetic activity on the equatorial spread F during solar maximum. Ann. Geophys. 2005, 23, 745–751. [Google Scholar] [CrossRef]
  48. Whalen, J.A. Dependence of equatorial bubbles and bottomside spread F on season, magnetic activity, and E×B drift velocity during solar maximum. J. Geophys. Res. Space Phys. 2002, 107, SIA-3. [Google Scholar] [CrossRef]
  49. Sultan, P.J. Linear theory and modeling of the Rayleigh-Taylor instability leading to the occurrence of equatorial spread F. J. Geophys. Res. Space Phys. 1996, 101, 26875–26891. [Google Scholar] [CrossRef]
  50. Kelley, M.C. The Earth’s Ionosphere: Plasma Physics and Electrodynamics; Academic Press: Amsterdam, The Netherlands, 2009. [Google Scholar]
  51. Santos, A.M.; Abdu, M.A.; Sobral, J.H.A.; Mascarenhas, M.; Nogueira, P.A.B. Equatorial evening prereversal vertical drift dependence on solar EUV flux and F10.7 index during quiet and disturbed periods over Brazil. J. Geophys. Res. Space Phys. 2013, 118, 4662–4671. [Google Scholar] [CrossRef]
  52. Luo, F.G. The Ionospheric Characteristics of Haikou Region. J. Radio Sci. 1995, 10, 90–93. [Google Scholar]
  53. Hong, Y.; Wang, G.J.; Shi, J.K.; Wang, X.; Cheng, Z.W.; Wang, Z.; Shang, S.P. Response of Low-latitude Hainan Ionospheric Plasma Drifts to Geomagnetic Activities. Chin. J. Space Sci. 2019, 39, 730–737. [Google Scholar] [CrossRef]
  54. Abdu, M.A. Day-to-day and short-term variabilities in the equatorial plasma bubble/spread F irregularity seeding and development. Prog. Earth Planet. Sci. 2019, 6, 11. [Google Scholar] [CrossRef]
  55. Tsunoda, R.T. Control of the seasonal and longitudinal occurrence of equatorial scintillations by the longitudinal gradient in integrated E region Pedersen conductivity. J. Geophys. Res. Space Phys. 1985, 90, 447–456. [Google Scholar] [CrossRef]
  56. Maruyama, T.; Matuura, N. Longitudinal variability of annual changes in activity of equatorial spread F and plasma bubbles. J. Geophys. Res. Space Phys. 1984, 89, 10903–10912. [Google Scholar] [CrossRef]
  57. Maruyama, T.; Saito, S.; Kawamura, M.; Nozaki, K.; Krall, J.; Huba, J.D. Equinoctial asymmetry of a low-latitude ionosphere-thermosphere system and equatorial irregularities: Evidence for meridional wind control. Ann. Geophys. 2009, 27, 2027–2034. [Google Scholar] [CrossRef]
  58. Nishida, A. Coherence of geomagnetic DP2 fluctuations with interplanetary magnetic variations. J. Geophys. Res. Space Phys. 1968, 73, 5549–5559. [Google Scholar] [CrossRef]
  59. Blanc, M.; Richmond, A.D. The ionospheric disturbance dynamo. J. Geophys. Res. Space Phys. 1980, 85, 1669–1686. [Google Scholar] [CrossRef]
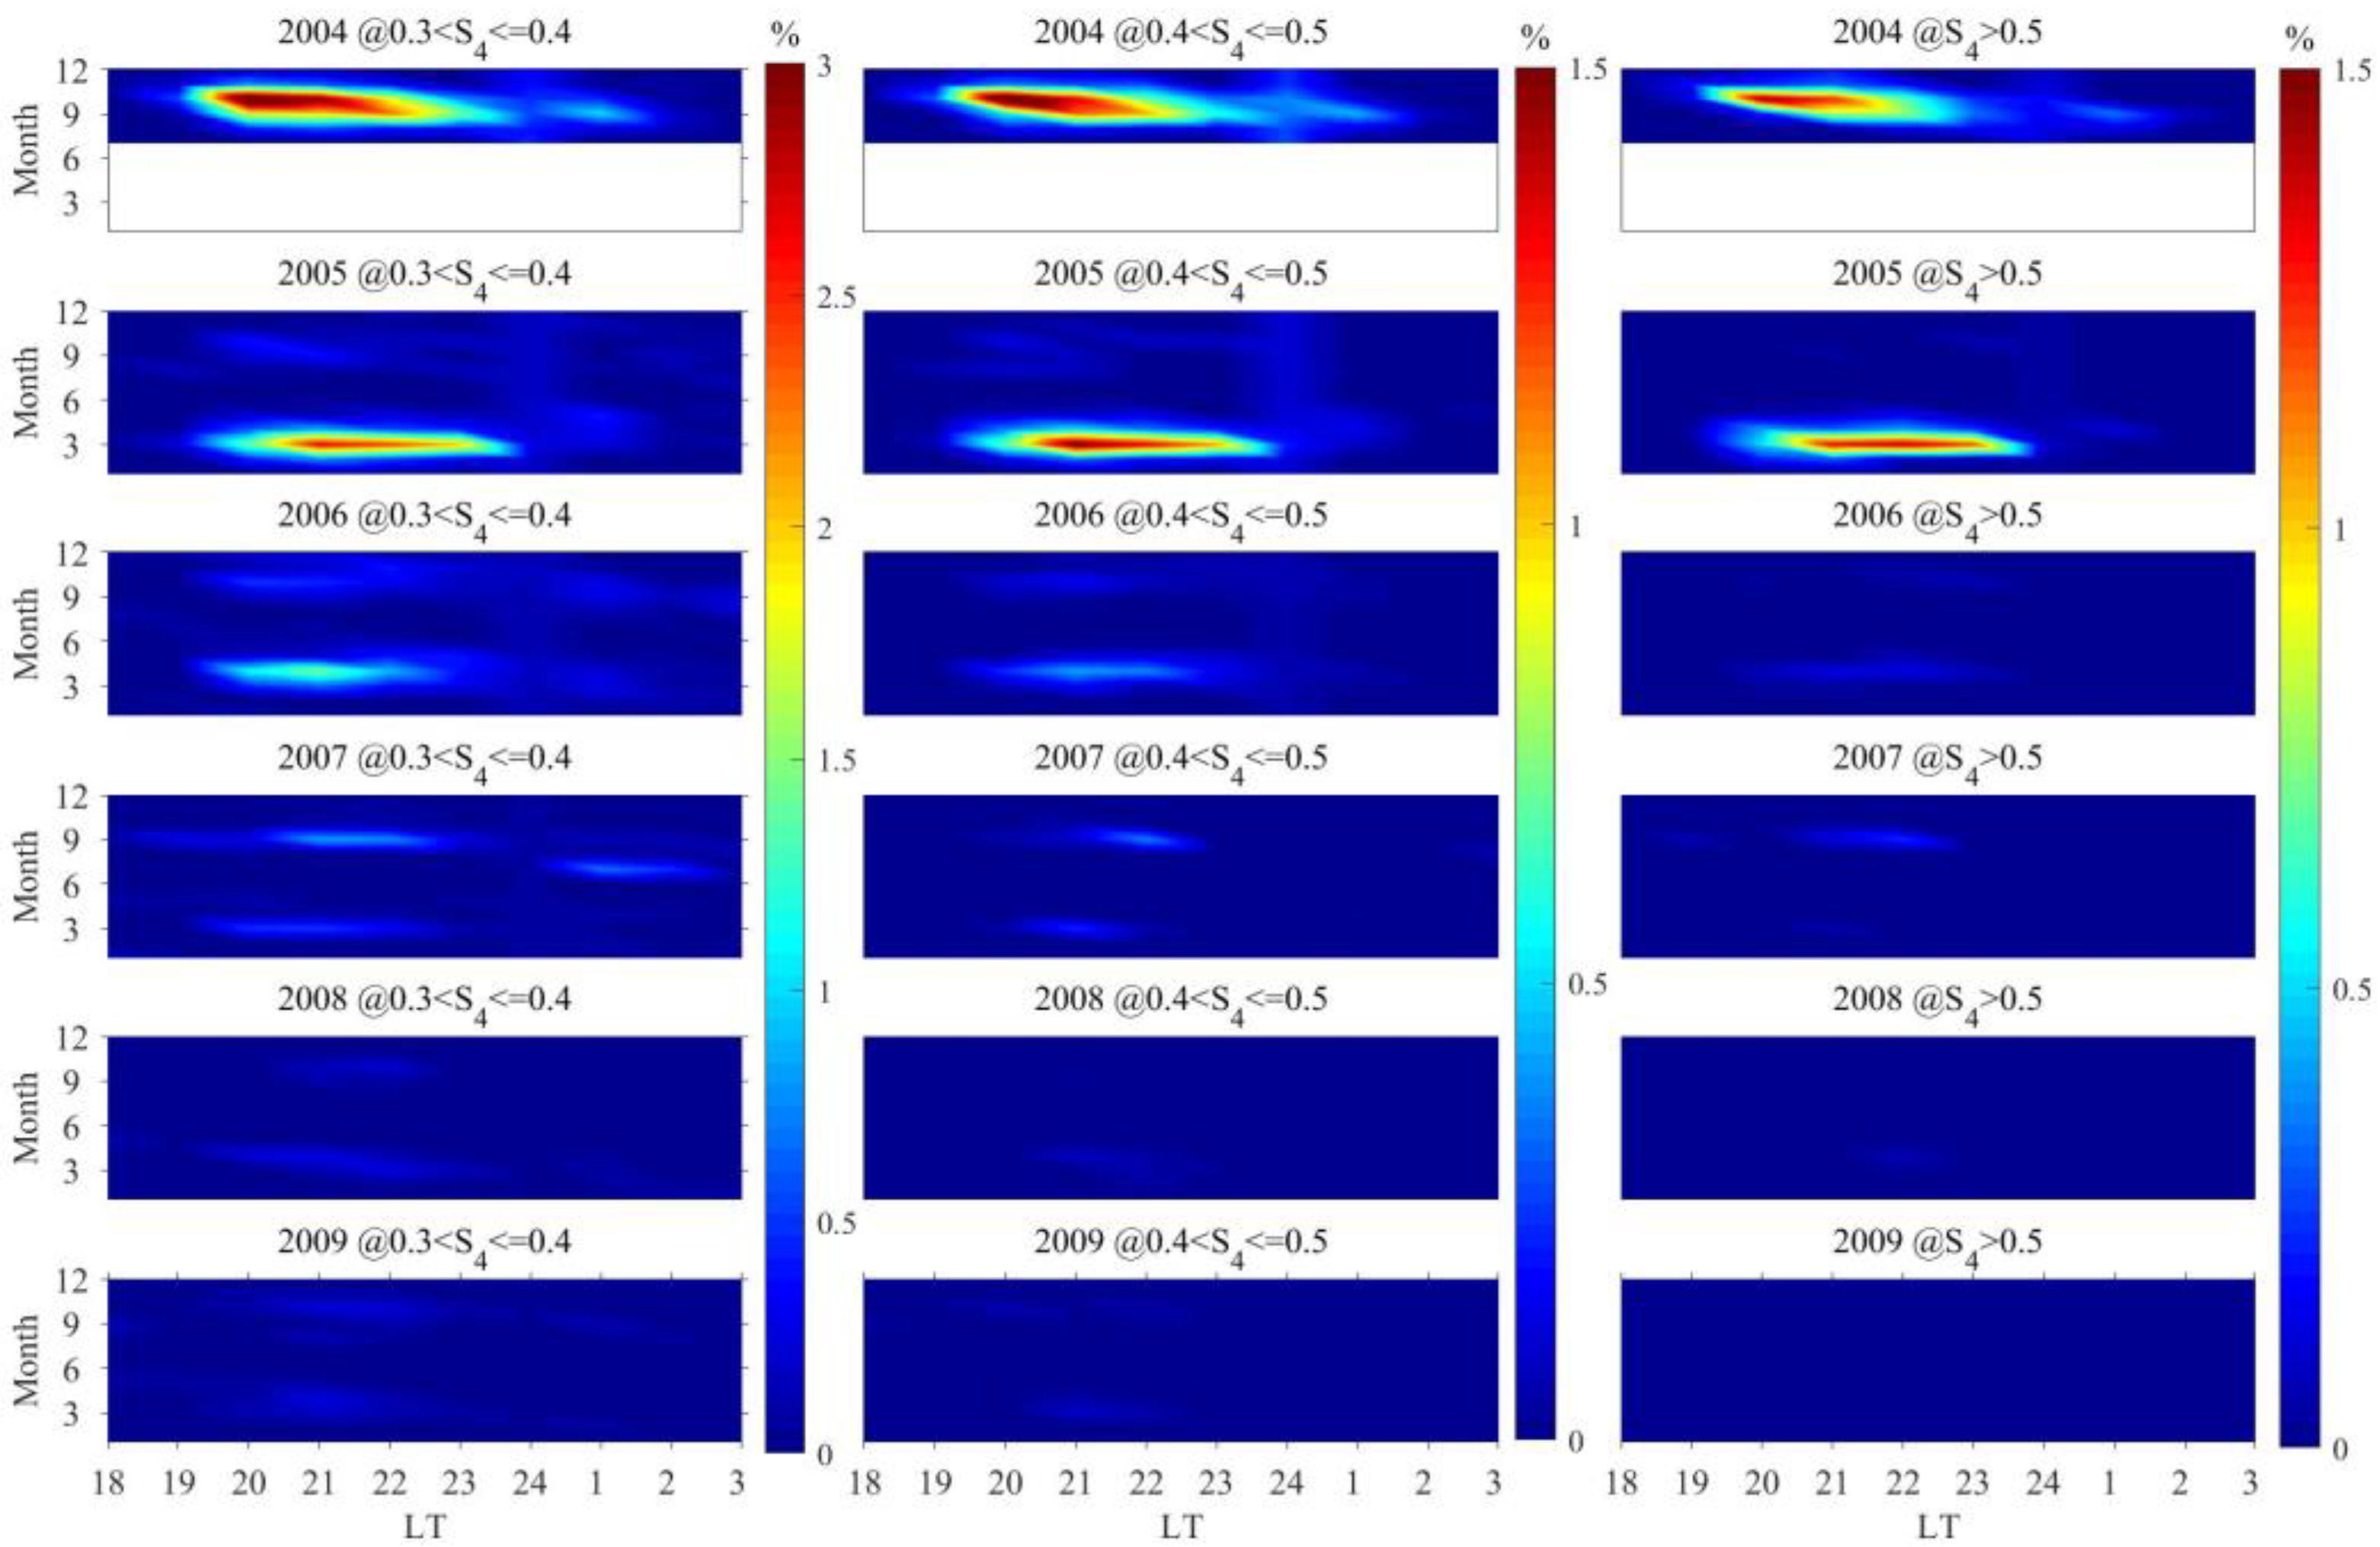
Figure 1. The distribution of the occurrence rates of scintillations with different intensities from 2004 to 2009, as a function of year, month, and LT.
Remotesensing 16 04668 g001
Figure 2. The distribution of the occurrence rates of scintillations with different intensities from 2010 to 2015, as a function of year, month, and LT.
Remotesensing 16 04668 g002
Figure 3. The distribution of the occurrence rates of scintillations with different intensities from 2016 to 2021, as a function of year, month, and LT.
Remotesensing 16 04668 g003
Figure 4. The distribution of the occurrence rates of scintillations of different intensities in Sanya from 2004 to 2021, as influenced by solar activity.
Remotesensing 16 04668 g004
Figure 5. The distribution of the occurrence rates of weak scintillations in Sanya from 2004 to 2013, as a function of season and LT, with the dashed line dividing the characteristics of LT distribution on the left and seasonal distribution on the right.
Remotesensing 16 04668 g005
Figure 6. The distribution of the occurrence rates of weak scintillations in Sanya from 2014 to 2021, as a function of season and LT, with the dashed line dividing the characteristics of LT distribution on the left and seasonal distribution on the right.
Remotesensing 16 04668 g006
Figure 7. The distribution of the occurrence rates of moderate scintillations in Sanya from 2004 to 2013, as a function of season and LT, with the dashed line dividing the characteristics of LT distribution on the left and seasonal distribution on the right.
Remotesensing 16 04668 g007
Figure 8. The distribution of the occurrence rates of moderate scintillations in Sanya from 2014 to 2021, as a function of season and LT, with the dashed line dividing the characteristics of LT distribution on the left and seasonal distribution on the right.
Remotesensing 16 04668 g008
Figure 9. The distribution of the occurrence rates of strong scintillations in Sanya from 2004 to 2013, as a function of season and LT, with the dashed line dividing the characteristics of LT distribution on the left and seasonal distribution on the right.
Remotesensing 16 04668 g009
Figure 10. The distribution of the occurrence rates of strong scintillations in Sanya from 2014 to 2021, as a function of season and LT, with the dashed line dividing the characteristics of LT distribution on the left and seasonal distribution on the right.
Remotesensing 16 04668 g010
Figure 11. The distribution of the EAI for different intensities of scintillations in Sanya from 2004 to 2021.
Remotesensing 16 04668 g011
Figure 12. The distribution of the occurrence rates for different intensities of scintillations with solar activity, season, and geomagnetic activity in Sanya between 19:00 LT and 03:00 LT the next day from 2004 to 2021.
Remotesensing 16 04668 g012
Figure 13. The distribution of the occurrence rates of weak scintillations with geomagnetic activity in Sanya between 19:00 LT and 01:00 LT the next day from 2004 to 2021.
Remotesensing 16 04668 g013
Figure 14. The distribution of the occurrence rates of moderate scintillations with geomagnetic activity in Sanya between 19:00 LT and 01:00 LT the next day from 2004 to 2021.
Remotesensing 16 04668 g014
Figure 15. The distribution of the occurrence rates of strong scintillations with geomagnetic activity in Sanya between 19:00 LT and 01:00 LT the next day from 2004 to 2021.
Remotesensing 16 04668 g015
Figure 16. The impact of geomagnetic disturbances on the distribution of occurrence rates of scintillations of different intensities in Sanya between 19:00 LT and 01:00 LT the next day from 2004 to 2021.
Remotesensing 16 04668 g016
Table 1. The annual number of observation days recorded by the GITMS over Sanya from 2004 to 2021.
YearObservation DaysObservation Rate (%)
200415742.8962
200536299.1781
200636499.7260
200736499.7260
200836599.7268
2009365100
201036399.4521
201136299.1781
201233892.3497
201336399.4521
201436499.7260
201536499.7260
201636499.4536
201736499.7260
201836499.7260
2019365100
202036499.4536
202136399.4521
Disclaimer/Publisher’s Note: The statements, opinions and data contained in all publications are solely those of the individual author(s) and contributor(s) and not of MDPI and/or the editor(s). MDPI and/or the editor(s) disclaim responsibility for any injury to people or property resulting from any ideas, methods, instructions or products referred to in the content.