Article

Increases in Temperature and Precipitation in the Different Regions of the Tarim River Basin Between 1961 and 2021 Show Spatial and Temporal Heterogeneity

1
Institute of Desert Meteorology, China Meteorological Administration, Urumqi 830002, China
2
National Observation and Research Station of Desert Meteorology, Taklimakan Desert of Xinjiang, Urumqi 830002, China
3
Taklimakan Desert Meteorology Field Experiment Station of China Meteorological Administration, Urumqi 830002, China
4
Xinjiang Key Laboratory of Desert Meteorology and Sandstorm, Urumqi 830002, China
5
Key Laboratory of Tree-Ring Physical and Chemical Research, China Meteorological Administration, Urumqi 830002, China
6
Wulanwusu National Special Test Field for Comprehensive Meteorological Observation, Shihezi 832061, China
7
Dabancheng National Special Test Field for Comprehensive Meteorological Observation, Urumqi 830002, China
8
College of Geography and Remote Sensing Sciences, Xinjiang University, Urumqi 830046, China
9
Xinjiang Meteorological Society, Urumqi 830002, China
10
Xinjiang Meteorological Equipment Support Center, Urumqi 830002, China
*
Author to whom correspondence should be addressed.
Remote Sens. 2024, 16(23), 4612; https://doi.org/10.3390/rs16234612
Submission received: 23 October 2024 / Revised: 20 November 2024 / Accepted: 4 December 2024 / Published: 9 December 2024
(This article belongs to the Section Atmospheric Remote Sensing)

Abstract

:
The Tarim River Basin (TRB) faces significant ecological challenges due to global warming, making it essential to understand the changes in the climates of its sub-basins for effective management. With this aim, data from national meteorological stations, ERA5_Land, and climate indices from 1961 to 2021 were used to analyze the temperature and precipitation variations in the TRB and its sub-basins and to assess their climate sensitivity. Our results showed that (1) the annual mean temperature increased by 0.2 °C/10a and precipitation increased by 7.1 mm/10a between 1961 and 2021. Moreover, precipitation trends varied significantly among the sub-basins, with that in the Aksu River Basin increasing the most (12.9 mm/10a) and that in the Cherchen River Basin increasing the least (1.9 mm/10a). Moreover, ERA5_Land data accurately reproduced the spatiotemporal patterns of temperature (correlation 0.92) and precipitation (correlation 0.72) in the TRB. (2) Empirical Orthogonal Function analysis identified the northern sections of the Kaidu, Weigan, and Yerqiang river basins as centers of temperature sensitivity and the western part of the Kaidu and Cherchen River Basin as the center of precipitation sensitivity. (3) Global warming is closely correlated with sub-basin temperature (correlation above 0.5) but weakly correlated with precipitation (correlation 0.2~0.5). TRB temperatures were found to have a positive correlation with AMO, especially in the Hotan, Kashgar, and Aksu river basins, and a negative correlation with AO and NAO, particularly in the Keriya and Hotan river basins. Precipitation correlations between the climate indices were complex and varied across the different basins.

1. Introduction

Over the past few decades, climate change and its impacts have attracted widespread attention from governments around the world [1,2]. The IPCC Sixth Assessment Report clearly states that global temperatures have increased by roughly 1.1 °C since the period 1850–1900 due to greenhouse gas emissions from human activities, and predicts that the global temperature increase will reach 1.5 °C or higher by the middle of the 21st century [3]. The impact of global warming on different regions is heterogeneous [4,5]. The characterization of climate change in various regions in this context has therefore increasingly become one of the important research topics in the field of climate science [3].
In recent years, a significant number of studies have highlighted the complex and regionally varied nature of temperature and precipitation changes in China [6,7,8,9]. For example, research shows that, between 1961 and 2018, precipitation patterns in China showed distinct regional differences, i.e., decreasing from southeast to northwest, with precipitation trends varying by time period [8], region [10], and season [11]. In addition, precipitation in China has increased by 13.9% as temperatures have increased, and this relationship varies significantly across regions [12]. Northwest China is the largest Eurasian arid region and one of the most sensitive regions in terms of climate environment. Its precipitation changes are of special significance to global and arid environmental climate change [13,14]. Ever since the academician Shi Yafeng first proposed that the climate in the arid area of Northwest China has gradually changed from “warm and dry” to “warm and wet” since the 1980s, experts and scholars have carried out a significant number of studies on the changes in temperature and precipitation in this area [15,16]. The results of such studies have consistently shown a rising temperature trend and varied precipitation patterns in Northwest China, with significant precipitation increases in the Qaidam Basin, Xinjiang, Qinghai, and the Hexi Corridor of Gansu [17]. From 1979 to 2018, significant warming and humidification trends were observed in China [18], particularly in arid regions and specific mountainous areas, such as the Qilian Mountains [19] and Xinjiang [20]. From 1961 to 2018, temperature increases were consistently observed across different areas, with precipitation trends varying by region. In areas such as the Badain Jaran Desert [21], precipitation changes were insignificant. In comparison, in regions such as Xinjiang, particularly since 1985, precipitation has shown a marked increase, especially in mountainous areas [22]. The Mogao Grottoes also experienced increasing trends in both temperature and precipitation between 1990 and 2020, further emphasizing the diverse climate dynamics within Northwest China [23].
As the largest inland river in China, the Tarim River Basin (TRB) is abundant in natural resources and serves as the primary water source for southern Xinjiang. However, its ecological environment is fragile [24,25,26]. Hence, determining the characteristics of climate change in the TRB will have a significant impact on climate change research and socio-economic development at a global/regional scale [27,28,29,30]. There has been a trend towards warming and, to a lesser extent, humidification in the TRB over the past several decades [31,32,33,34]. However, the authors of most existing studies have focused on the temperature and precipitation changes in the entire TRB, with limited attention given to the variations in temperature and precipitation within its sub-basins. Additionally, the authors of these studies have predominantly employed traditional geographical statistical methods, indicating a need for more nuanced approaches to analyze these climate changes [24,35].
In this study, we analyze and quantify the differences in the spatial and temporal characteristics of temperature and precipitation within the TRB and its sub-basins over the past 60 years. Additionally, we investigate the correlations between temperature, precipitation, and global warming, as well as climate indices in the TRB and its sub-basins.

2. Materials and Methods
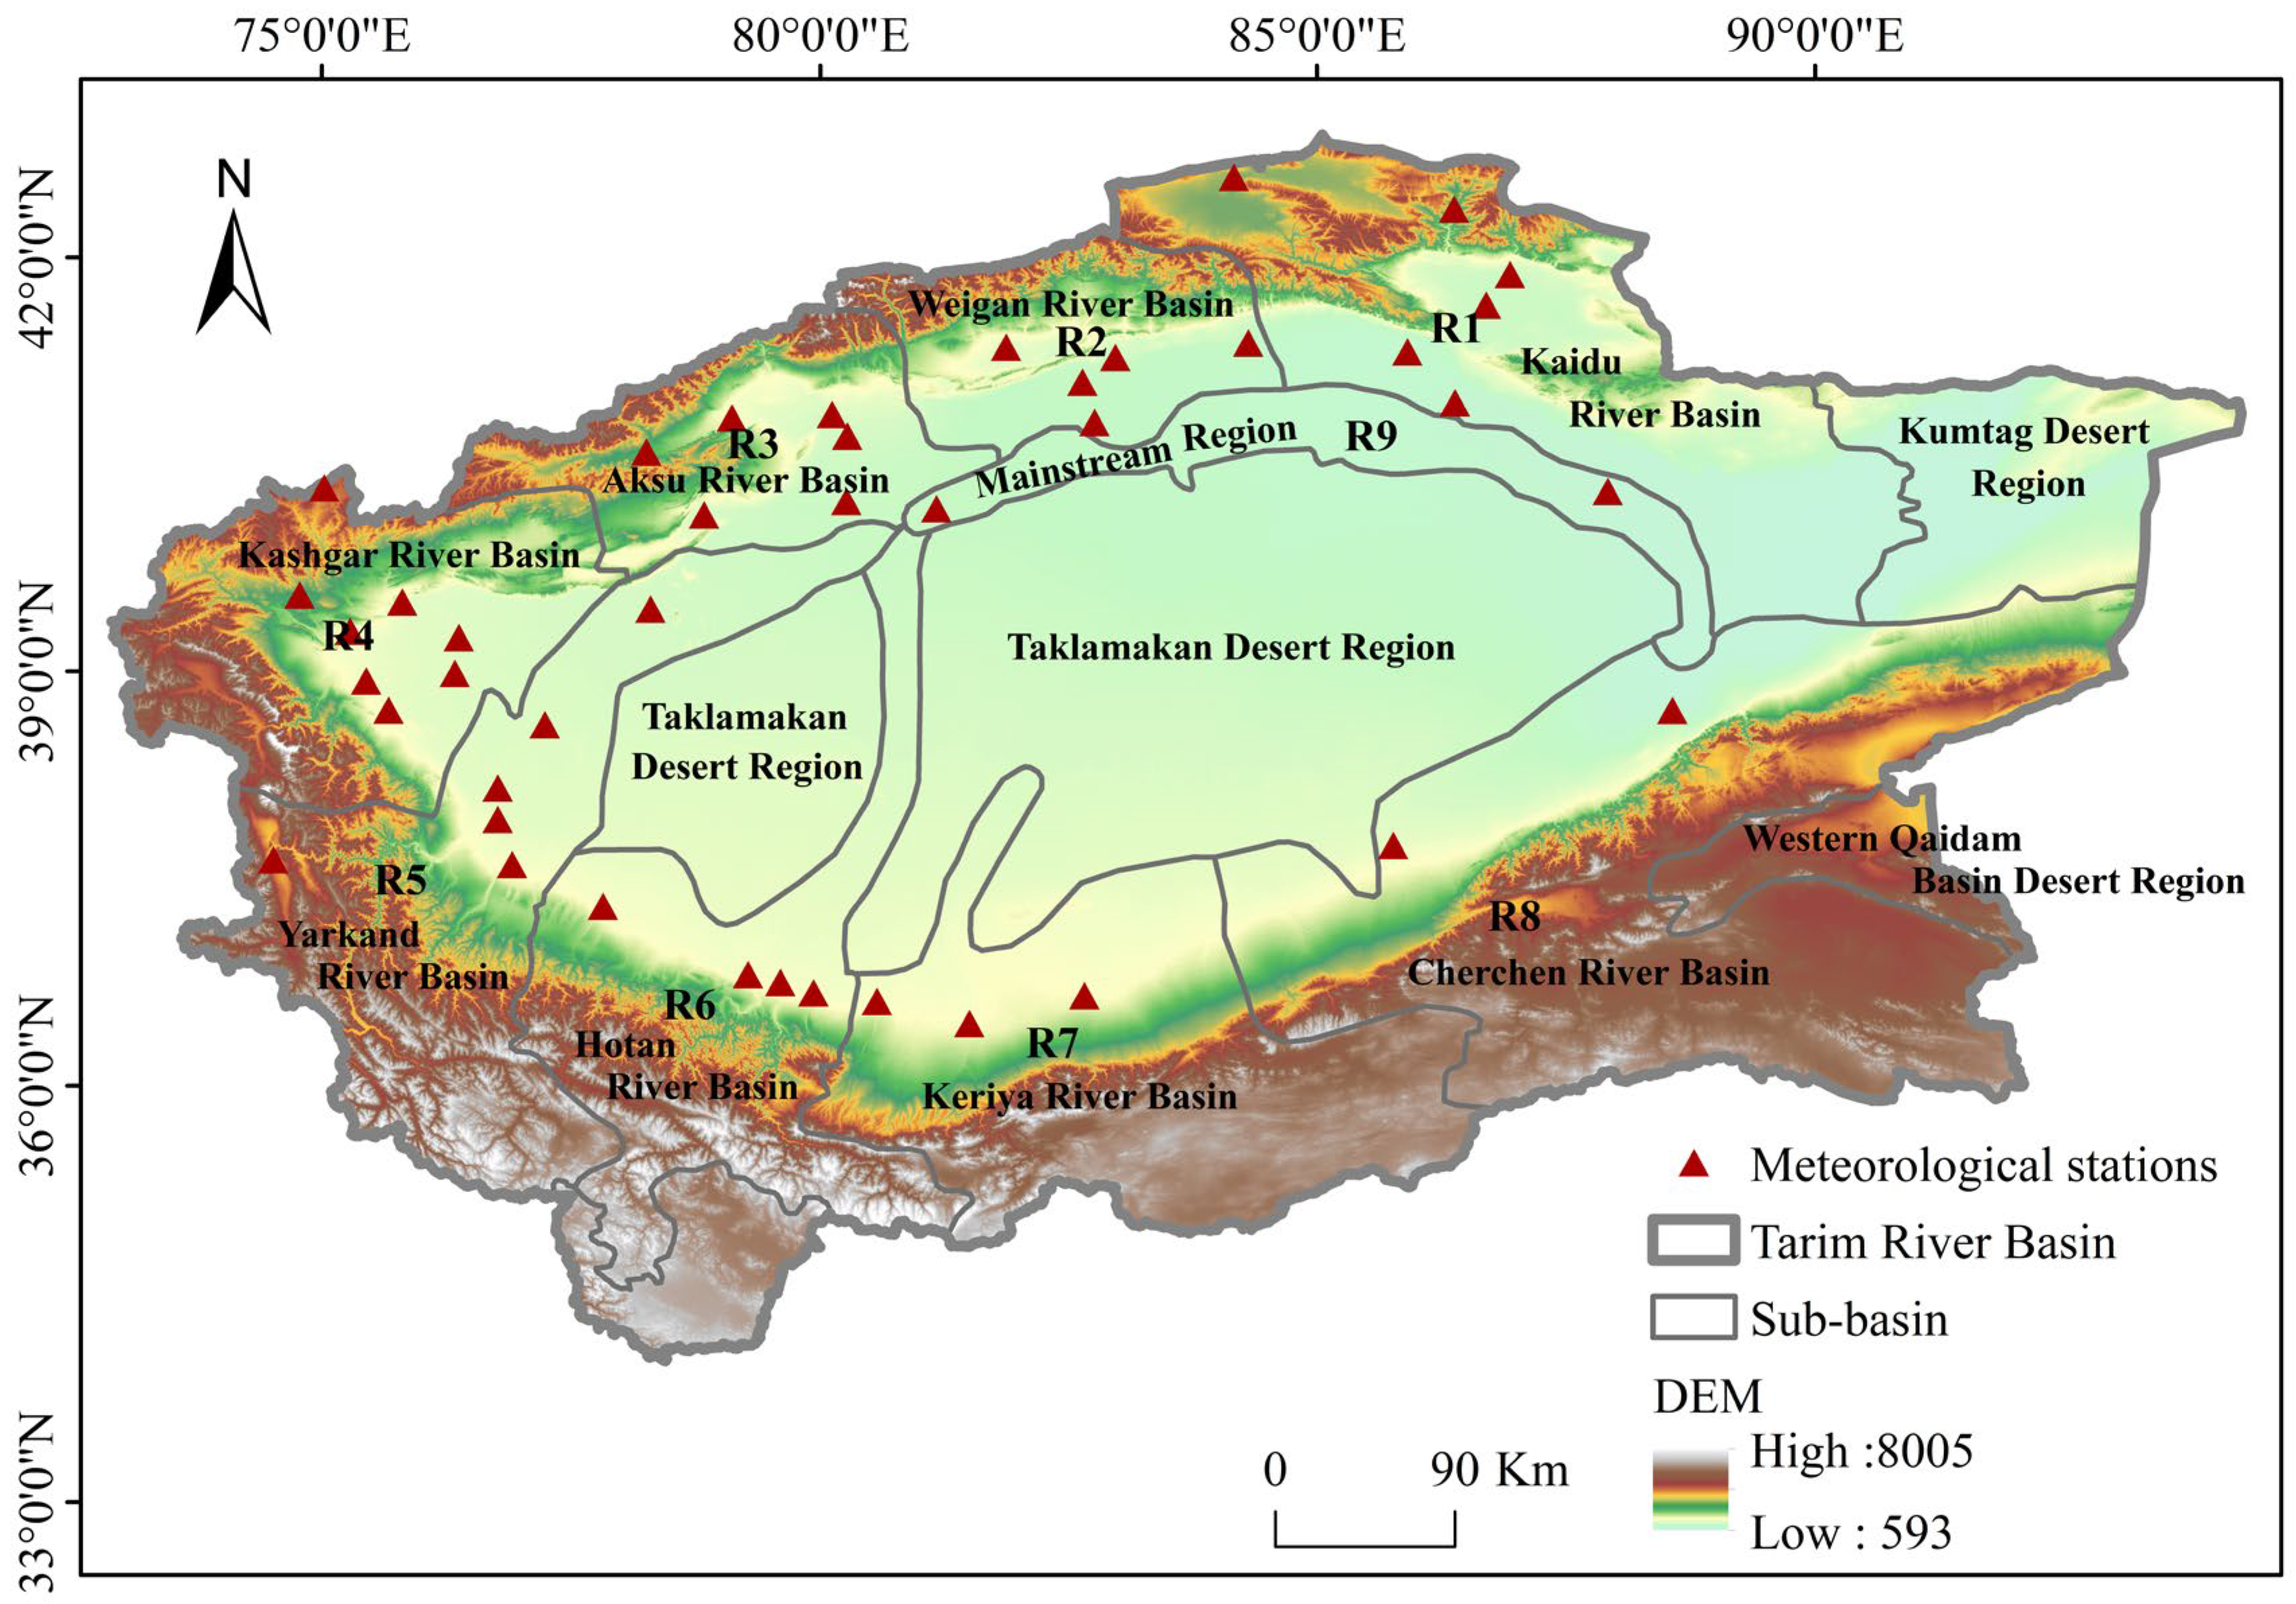
2.1. Data

The TRB (73°10′E to 94°05′E, 34°55′N to 43°08′N) is located in the southern part of Xinjiang, China (Figure 1) and is the largest inland river basin in the world, with a total area of roughly 1.09 × 10⁶ km2 [36,37]. The topography of the region is complex, surrounded by the southern slopes of the Tianshan Mountains, the Kunlun Mountains, the Altun Mountains, and other highland areas [38]. The TRB is dry and windy, with a large difference in daily temperature, scarce precipitation, abundant light and heat resources, and strong evaporation [39]. Additionally, meteorological observation stations are unevenly distributed, particularly in deserts and mountainous regions.
To quantify the temperature and precipitation differences among the TRB sub-basins, we use Xinjiang’s water resource zoning boundaries and a 1:250,000 administrative map to delineate distinct regions within the TRB, labeled as R1 to R9 (Table 1). Additionally, the Taklamakan Desert Region, the Kumtag Desert Region, and the Western Qaidam Basin Desert Region (Figure 1) are also delineated. However, due to limitations in natural conditions and observational data, these areas were not included in the analysis.
In this study, monthly temperature and precipitation data, ERA5_Land reanalysis data, and climate index data for the TRB from 1961 to 2021 were used. Among these, the monthly temperature and precipitation data were provided by the National Meteorological Information Center of the China Meteorological Administration (http://www.nmic.cn/, accessed on 23 February 2023). To ensure long-term continuity and representativeness, each station required at least 52 years of observations with a minimum of 8 months of data per year. Observations with less than 0.1 mm precipitation were excluded to ensure data accuracy. After eliminating missing values and abnormal values, data from 42 stations for temperature and 40 stations for precipitation from 1961 to 2021 were selected for analysis (Table 1). Seasonal scales were assessed based on the traditional division of the weather service, with the four seasons divided into MAM (March to May), JJA (June to August), SON (September to November), and DJF (December to February).
The ERA5_Land temperature and precipitation data provided by the Copernicus Climate Data Store (https://cds.climate.copernicus.eu/, accessed on 1 January 2023) have a spatial resolution of 0.1° × 0.1° and a temporal resolution of one month. These data were further aggregated to an annual scale for analysis. The near-surface global mean temperature (GMT) anomaly data were obtained from NASA’s Goddard Institute for Space Studies (GISS) (https://data.giss.nasa.gov/gistemp/, accessed on 15 March 2024). Additionally, climate indices, such as the Atlantic Multidecadal Oscillation (AMO), Arctic Oscillation (AO), North Atlantic Oscillation (NAO), and Pacific Decadal Oscillation (PDO), were obtained from NOAA Physical Sciences Laboratory (https://www.psl.noaa.gov/data/, accessed on 1 April 2024).

2.2. Methods

In this study, we analyzed the temporal changes in temperature and precipitation in the TRB from 1961 to 2021 using linear trend analysis [40]. The inter-annual climate changes and anomalies in temperature and precipitation were analyzed by using the anomaly method. The reference time was 1981–2010. Furthermore, we applied the Empirical Orthogonal Function (EOF) method to detect the temporal and spatial patterns of the TRB. The principle consists of decomposing the climate variable into a spatial mode (EOF) and a principal component time series (PC) orthogonal to reveal the spatial and temporal changes of the climate variable. Here, the EOF can characterize the spatial distribution of the climate variable to some extent, and its corresponding PC represents the weight of the distribution of that mode in time. The method has been widely used in research fields related to climate and meteorology. The detailed calculation process is as follows: firstly, the data for meteorological elements at each station in the TRB are converted into the matrix form, i.e., the matrix A m × n , where m is the number of weather station points and n is the year. Thereafter, its covariance matrix C m × m is calculated:
C m × m = 1 n A m × n × A m × n T
In the equation, A m × n T is the transpose of the matrix A . The relationship between the characteristic roots ( λ 1 , …, λ m ) and eigenvectors of the covariance matrix V m × m satisfies:
C m × m × V m × m = V m × m × D m × m
D is an m × m dimensional diagonal matrix:
D m × m = λ 1 0 0 0 λ 2 0 0 0 λ m
Next, the time coefficients corresponding to all spatial feature vectors, i.e., P C m × n , are calculated:
P C m × n = V m × m T × A m × n
The variance contribution rate of the first p feature vectors is:
λ p / i = 1 m λ i × 100 %
North’s method [41] was used to perform significance testing on spatial modes.
In order to ensure the independence of each mode, North et al. stated that the error of the feature root at a 95% confidence level is as follows:
λ = λ 2 N *
where λ is the characteristic root and N * is the number of samples.
Next, it is necessary to check λ in order and mark the error range. If there is an overlap in the error ranges between the two λ , then significance is not passed [42].
Additionally, we used the Mann-Kendall (M-K) mutation test to identify abrupt changes and trends in temperature and precipitation [43]. Furthermore, we used Pearson correlation analysis to calculate the correlation between temperature and precipitation changes in the TRB region and several global climate indices and performed significance testing to further explore the mechanisms influencing these changes [44].

3. Results

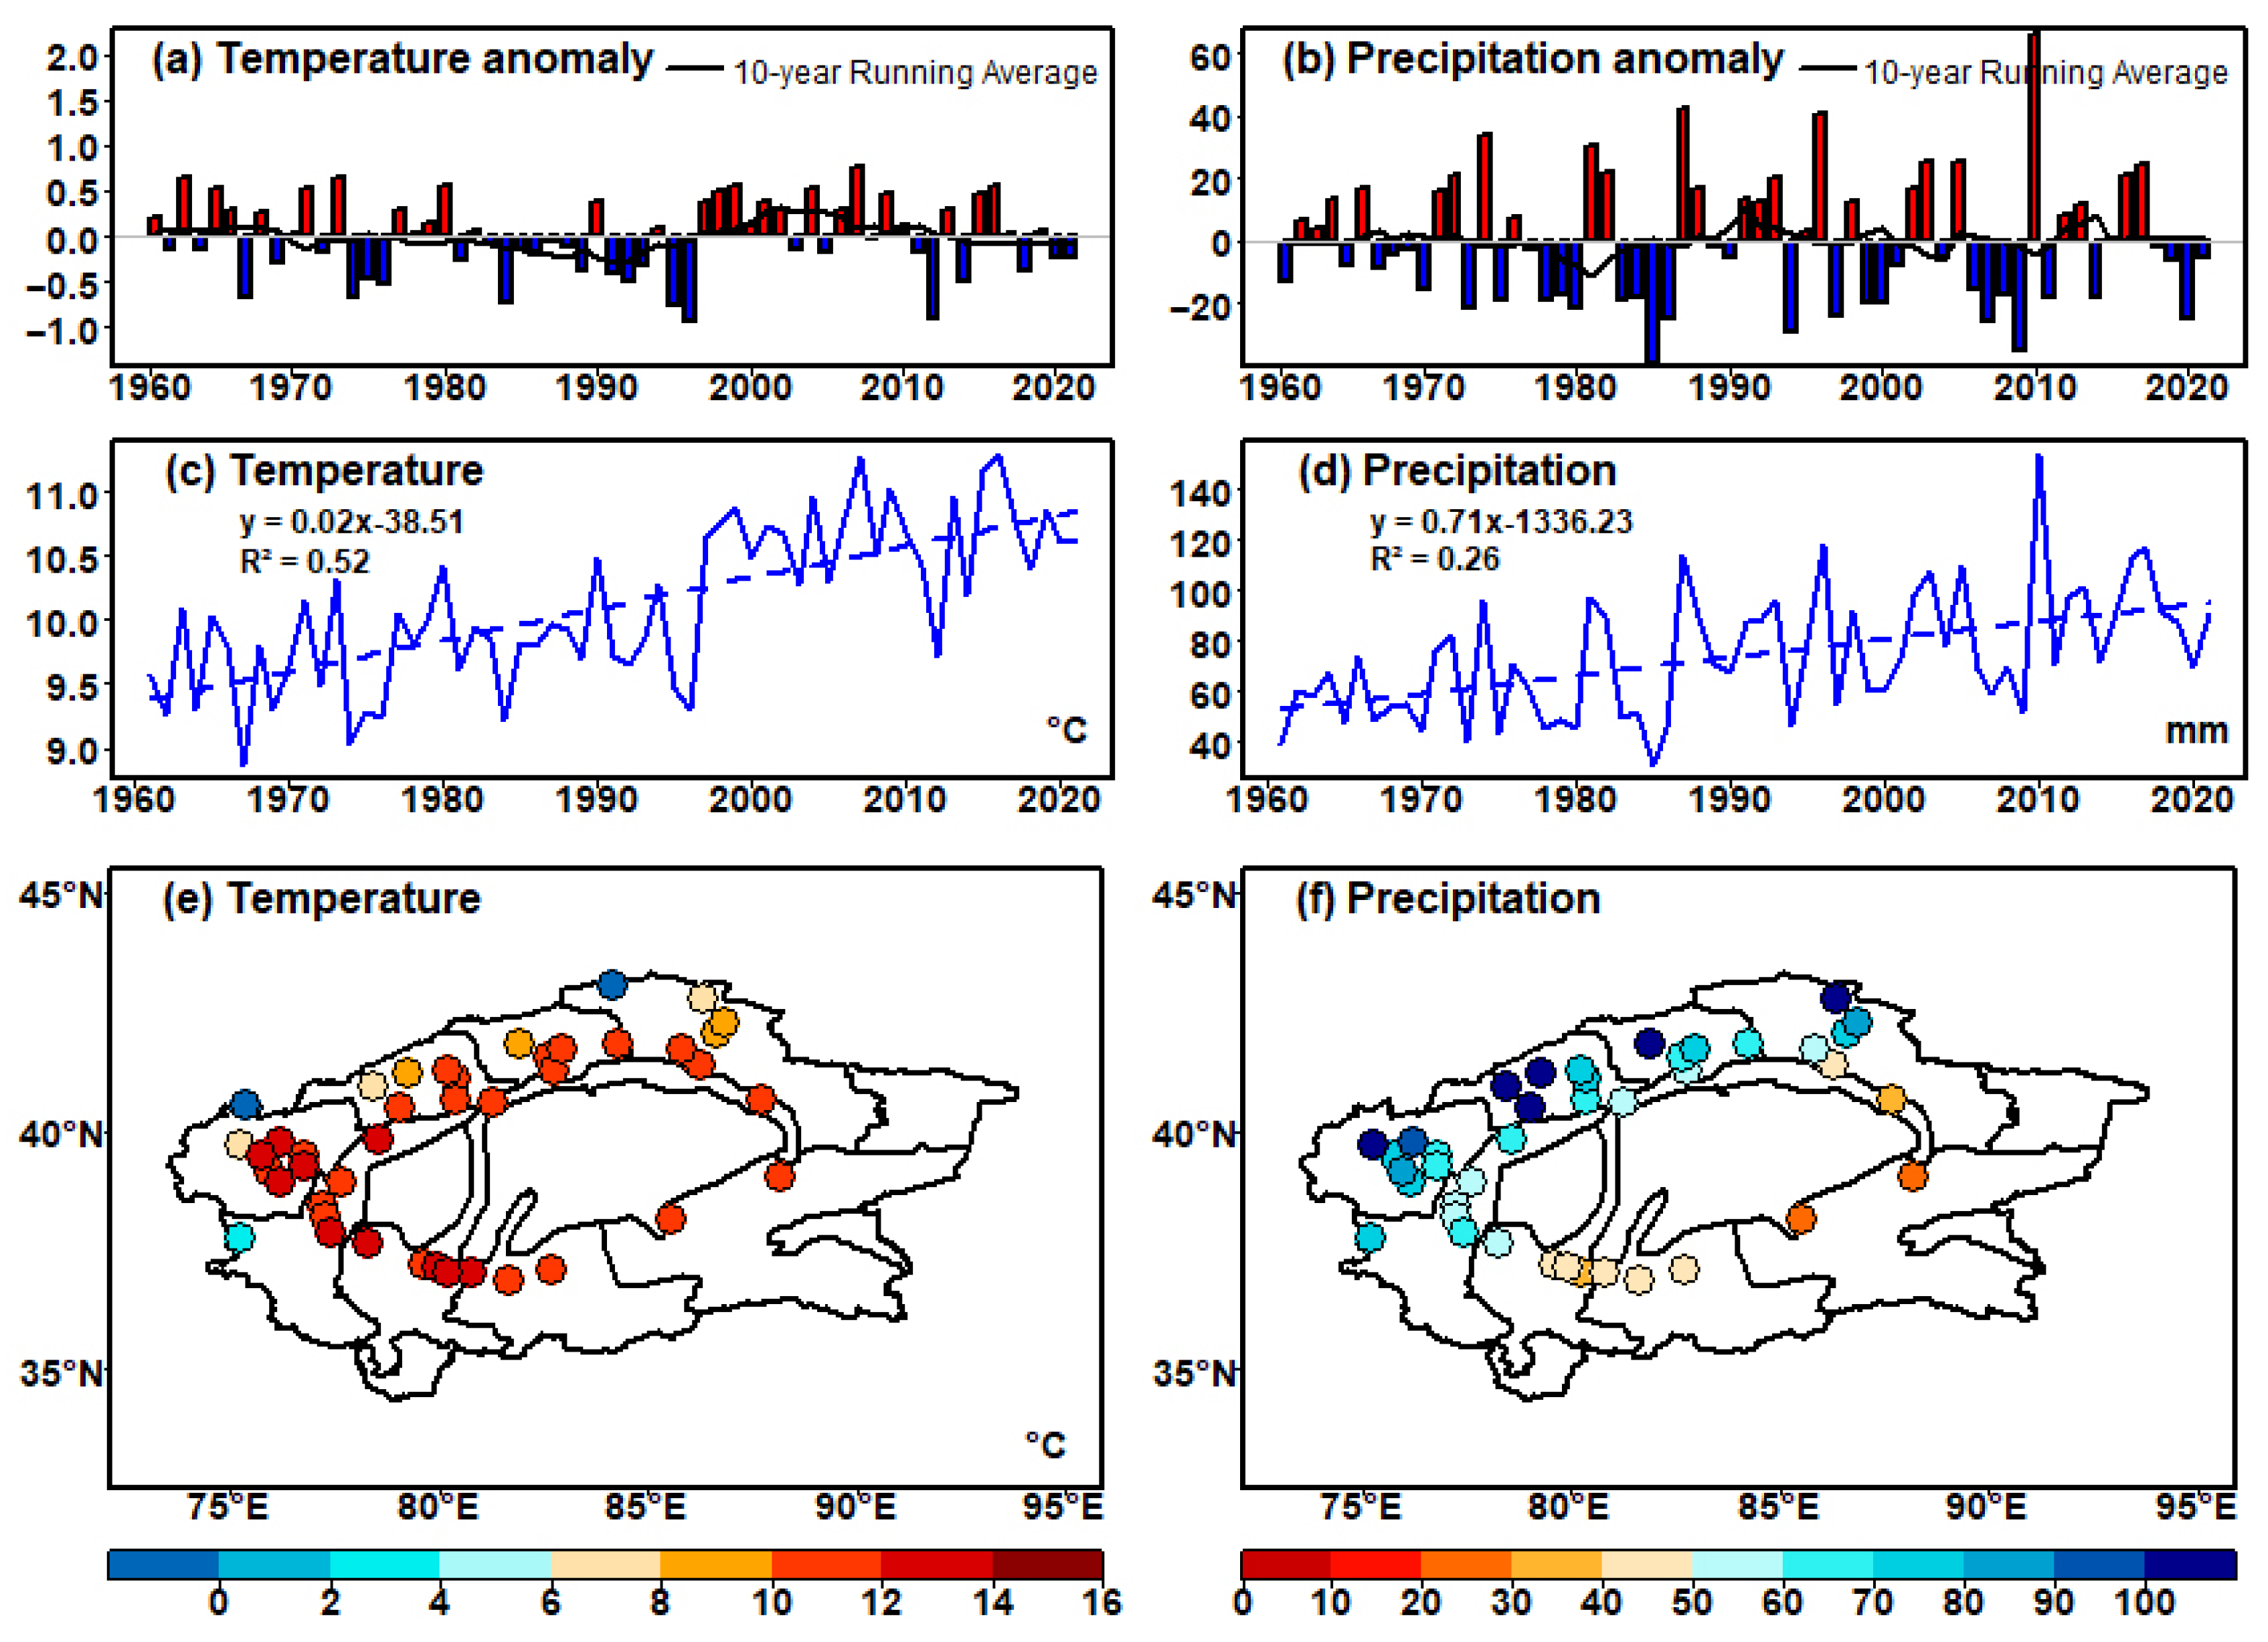
3.1. TRB Temporal and Spatial Trends in Temperature and Precipitation

Over the past 60 years, the mean temperature in the TRB was 10.1 °C, with a 2.4 °C fluctuation between the highest (11.3 °C in 2016) and lowest (8.9 °C in 1967) annual mean temperatures. A significant increase of 0.2 °C/10a was observed (Figure 2c). In addition, from 1961 to 1990, the temperature was dominated by negative anomalies. Ever since, the number of years with positive temperature anomalies has gradually increased, especially after 2000, indicating that temperatures in recent years have generally been above the historical (1981–2010) average (Figure 2a). From 1961 to 2021, the annual mean precipitation in the TRB was 74.2 mm. The highest annual mean precipitation was 153.6 mm in 2010, while the lowest was 30.5 mm in 1985, resulting in an extreme value ratio of 5.04 (Figure 2d). The annual mean precipitation showed an overall increasing trend, rising by 7.1 mm/10a. In addition, precipitation also showed positive and negative anomaly fluctuations (Figure 2b).
The spatial distribution of annual mean temperature and mean PRCPTOT is presented in Figure 2. First, the annual mean temperature of most stations in the TRB was more than 8 °C from 1961 to 2021. Among them, stations around the Tarim Basin Desert Area recorded annual mean temperatures of 10 and 16 °C. Moreover, stations in the northern and western fringes registered temperatures of 0 to 6 °C during the same period (Figure 2c). Specifically, the annual mean temperature in the TRB is closely related to its topography, being higher around the Tarim Basin Desert Area than in the other regions. Conversely, the mean PRCPTOT at most stations throughout the TRB was above 30 mm from 1961 to 2021. The mean PRCPTOT for the last 60 years at the stations in the northwestern fringe of the region was above 90 mm, while for stations in the southeastern region this was between 20 and 50 mm (Figure 2d). Specifically, the mean PRCPTOT showed a gradual decrease from northwest to southeast, with the northwest region higher than the southeast region in terms of spatial distribution.
In order to further study the spatial and temporal distribution characteristics of meteorological elements in the TRB, EOF analysis was conducted on the annual mean temperature and PRCPTOT data, followed by North’s significance test. The values and contributions of the first to fourth eigenvectors of annual mean temperature and PRCPTOT for the TRB from 1961 to 2021 are shown in Table 2. The first mode (EOF1) explained most of the variability in temperature (69.49%) and precipitation (46.99%). This finding may indicate that changes in temperature are more concentrated in one dominant spatial model, while changes in precipitation are more complex, with multiple models working together. Additionally, EOF1 and EOF2 contributed 76.87% of the cumulative variance for annual mean temperature and 56.98% for PRCPTOT, both significant at the 0.05 level. This finding indicates that the first and second eigenvalues could better reflect the type of spatial distribution of annual mean temperature and PRCPTOT in the TRB over the past 60 years, as shown in Figure 3.
The eigenvector values of all stations in EOF1 of annual mean temperature were positive, indicating a highly consistent temperature change trend in the TRB from 1961 to 2021. Specifically, the temperature distribution characteristics of the entire basin were either entirely at high temperature or entirely at low temperature (Figure 3a). The eigenvector value starts from the southern part of the TRB and gradually increases to the north. The high-value center was located in the Kaidu River Basin, the Weigan River Basin, and the northern part of the Yerqiang River Basin, indicating that this region had the highest annual mean temperature and was the sensitive center of temperature change. In contrast, the low-value center was in the southern Yerqiang River Basin, southern Hetian River Basin, and Keriya River Basin.
The variance contribution rate of EOF2 was 7.38%, which was also a typical spatial distribution of temperature in the TRB. The Yerqiang, Hotan, western Chelchen, and Keriya River Basin showed reverse change characteristics compared to the Kaidu, Weigan, Aksu, eastern Cherchen, and Kashgar river basins. The high-value center was in the southern TRB, and the low-value center was in the northern TRB, showing a north–south reverse distribution pattern. Specifically, higher temperatures in the south corresponded to lower temperatures in the north, and vice versa.
The time coefficient can reflect the time change characteristic corresponding to the spatial distribution mode of the eigenvector [45]. The spatial distribution characteristics of annual mean temperature in the TRB were classified into two main types. The first type was whole-region high or low temperature. The second type was characterized by high temperatures in the southwest and low temperatures in the northeast, and vice versa (Figure 3). Figure 4 shows that the trend slope of the time coefficient for EOF1 was greater than zero, indicating to some extent that the annual average temperature of the basin has increased over the past 60 years. Specifically, EOF1 had a trend of high temperature in the entire basin. Furthermore, the trend slope of the time coefficient of EOF2 for annual mean temperature in the TRB was greater than zero, indicating that high temperature in the southwest and low temperature in the northeast were the main distribution types of the basin.
The eigenvector values of all stations in EOF1 of PRCPTOT were positive, indicating a consistent trend in precipitation in the TRB from 1961 to 2021, with the entire basin being either rainy or less rainy (Figure 3c). The high eigenvector value center was located in the western part of the Kaidu and Cherchen river basins. This indicates that this region had the highest PRCPTOT and was the sensitive center of precipitation change. In contrast, the low-value center was in the Yerqiang and Kashgar river basins.
The variance contribution rate of EOF2 was 9.99%, which was also a typical spatial distribution form of PRCPTOT in the TRB. The Kashgar and Yerqiang river basins showed opposite characteristics compared to the Kaidu, Weigan, and Aksu river basins. The PRCPTOT distribution pattern of the southeast and northwest showed the opposite trend, that is, the precipitation was more in the northwest, less in the southeast, and vice versa (Figure 3d).
Figure 4c shows that the trend slope of the time coefficient of EOF1 was greater than zero, indicating to a certain extent that the PRCPTOT exhibited an increasing trend in the basin over the past 60 years. Specifically, EOF1 reflected a distribution pattern of more rainfall across the entire basin. The trend slope of the time coefficient of EOF2 for PRCPTOT in the TRB was greater than zero, indicating that the main distribution type of the PRCPTOT is rainier in the southwest and less rainy in the northeast.

3.2. Differences in Temperature and Precipitation in the Sub-Basins

Through the above analysis, it was found that there were regional differences in the spatiotemporal variation characteristics of temperature and precipitation in the TRB. Therefore, the differences among the sub-basins were further quantitatively analyzed.

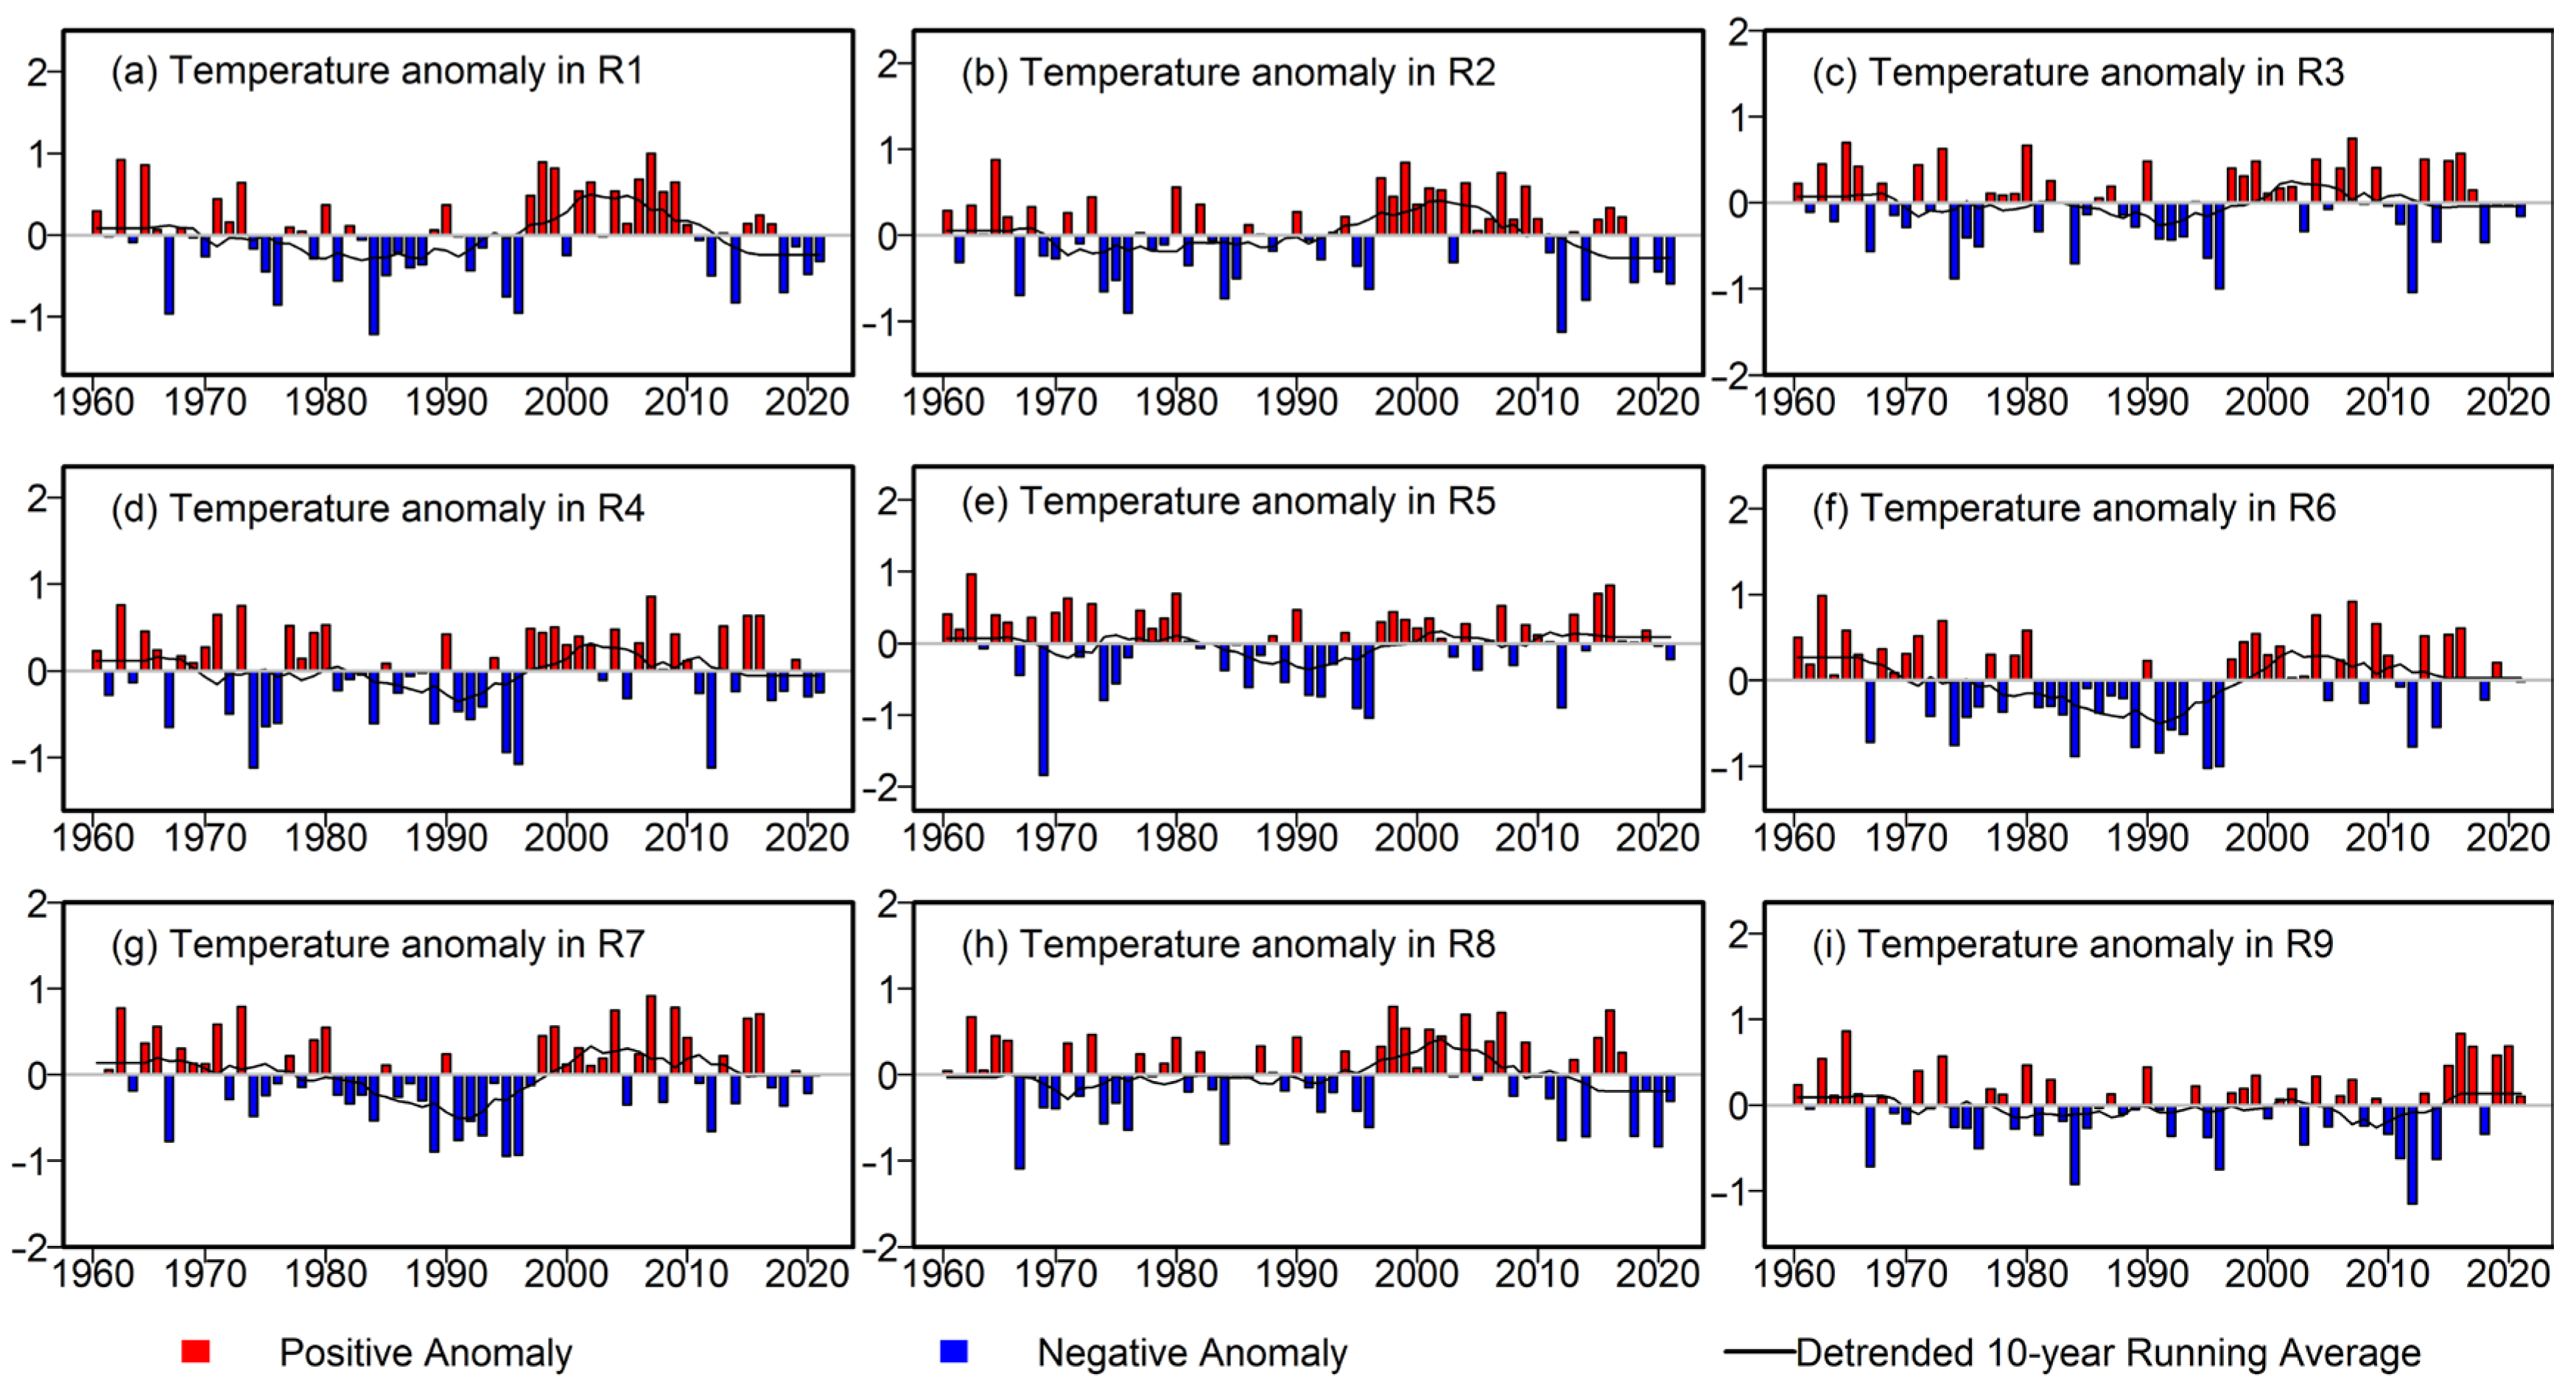
3.2.1. Differences in Temporal Trends

Between 1961 and 2021, the annual mean temperature growth rate was 0.3 °C/10a in R5, R6, and R7, while it was 0.2 °C/10a in the other sub-basins (Table 3). Although the growth rates of annual mean temperature in the sub-basins differed slightly (Figure 5a), the trends in temperature anomalies varied. Among them, R1 to R8 mainly showed positive temperature anomalies between 1961 and 1980 and negative temperature anomalies between 1981 and 2000. The frequency of positive temperature anomalies in R1 to R8 increased after 2000 (Figure 6). However, positive temperature anomalies were observed in R9 between 1961 and 1970, followed by negative anomalies from 1971 to 2000. Thereafter, the frequency of positive temperature anomalies in R9 increased after 2010 (Figure 6i).
From 1961 to 2021, significant differences were observed in the growth rate (Figure 5b) and anomalies (Figure 7) of annual precipitation across the sub-basins. The annual mean precipitation increase rates in regions R1 to R9 were 4.7 mm/10a, 6.0 mm/10a, 12.9 mm/10a, 8.8 mm/10a, 6.8 mm/10a, 7.4 mm/10a, 4.1 mm/10a, 1.9 mm/10a, and 2.5 mm/10a, respectively (Table 3). There was a difference of 11 mm/10a between R3, which had the largest growth rate, and R8, which had the smallest.
Additionally, the annual mean precipitation anomalies of R1, R2, and R3 showed distinct interdecadal changes, and the positive anomaly was the main anomaly during 1990–2000. In contrast, in R4, R5, R6, and R7, the annual mean precipitation anomaly showed no significant interdecadal fluctuations, but the frequency of positive precipitation anomalies has increased since 2010. In R8 (Figure 7h), significant positive precipitation anomalies were observed from 1980 to 1990 and again from 2000 to 2010, but these anomalies turned negative after 2010. Similarly, R9 (Figure 7i) experienced positive anomalies from 1970 to 1990 and after 2010, whereas negative anomalies prevailed from 2000 to 2010. It is worth noting that, in 2010, the TRB and its sub-basins showed significant positive precipitation anomalies.
There were differences in the temperature variation amplitude among the sub-basins in the four seasons, among which DJF was the most significant. Concurrently, the variation in seasonal precipitation in each sub-basin also showed significant differences (Table 4). In MAM, it ranges from 0.4 to 2.3 mm/10a, while in JJA, it ranges from 0.7 to 7.1 mm/10a. During SON, precipitation in most watersheds varies between 0.0 and 1.9 mm/10a, while during DJF, it ranged from 0.2 to 0.7 mm/10a.

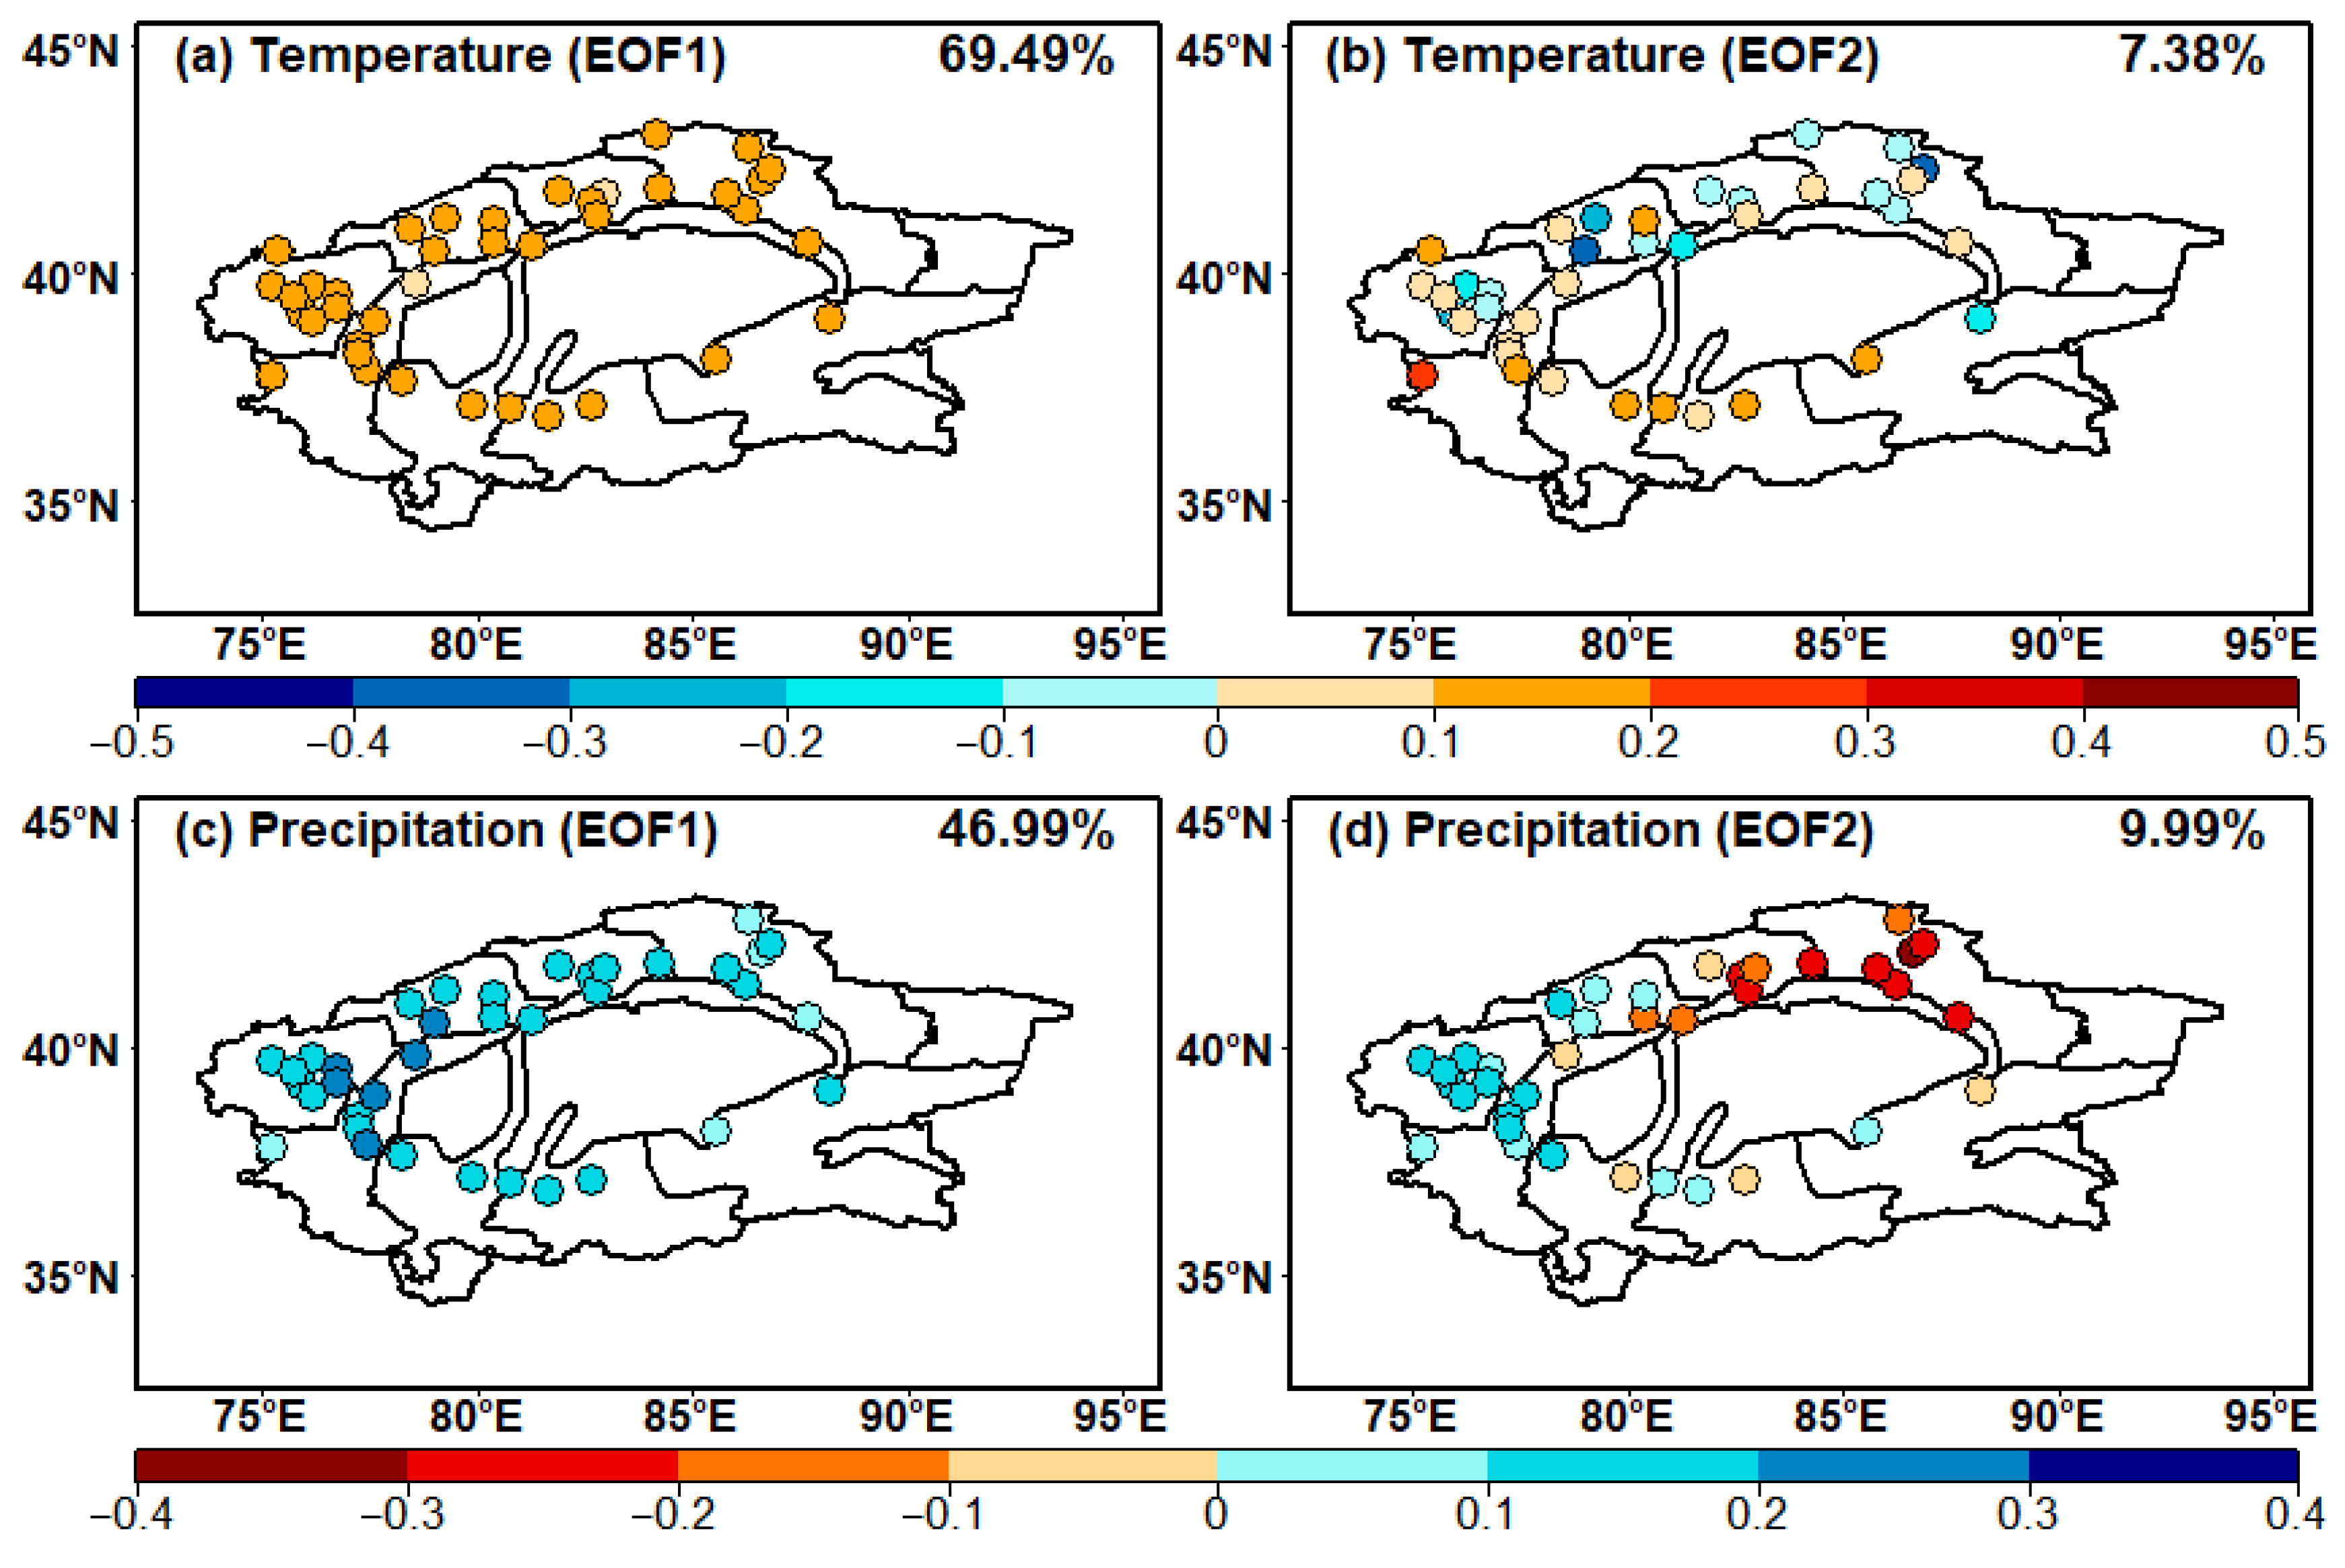
3.2.2. Differences in Spatial Distribution

Over the past 60 years, the annual mean temperature and mean PRCTOP in the TRB have shown significant spatial differentiation. When analyzed on an interannual scale, most of the annual mean temperatures in the TRB were above 8 °C. Among them, the annual mean temperature in R1 to R4 was lower than that in R5 to R9. Conversely, the mean PRCTOP of R1 to R5 was higher than that of R6 to R9.
From 1961 to 2021, the seasonal mean temperature of the sub-basins followed the trend of JJA > MAM > SON > DJF, though there were differences in each season. The mean temperatures of R6 and R7 in MAM were 15.39 °C and 15.35 °C, respectively, which were significantly higher than those of the other sub-basins. Similarly, the mean temperatures of R8 and R9 in JJA were 25.41 °C and 25.07 °C, respectively, which were the highest. In addition, the temperature of R6 (11.79 °C) and R7 (11.41 °C) in SON was higher than in the other sub-basins. Furthermore, the DJF mean temperature of R6 and R7 was higher than in the other sub-basins (Figure 8e). Among them, the mean temperature of R1 in all seasons was significantly lower than that of the other sub-basins, mainly because R1 contains an extremely low temperature point (Figure 8a–d).
From 1961 to 2021, the seasonal precipitation of the sub-basins showed the following pattern: JJA > MAM > SON > DJF; however, there were differences in each season. Among them, the MAM precipitation of R3 and R4 was 23.95 mm and 26.11 mm, respectively, which was significantly higher than in the other regions. The lowest MAM precipitation was 4.51 mm in R8. The JJA precipitation of R1 and R3 was 58.37 mm and 60.35 mm, respectively, which was significantly higher than in the other regions. R8 has the lowest JJJA precipitation at 18.93 mm. The precipitation of R3 and R4 in SON was 19.21 mm and 16.16 mm, respectively, which was significantly higher than in the other regions. R8 has the lowest precipitation in SON at 1.57 mm. The precipitation of R4 in DJF was 10.07 mm, which was significantly higher than in the other regions (Figure 8i). R9 had the lowest precipitation in DJF of 1.55 mm (Figure 8j).

3.3. Spatiotemporal Variation Based on ERA5

The lack of climatological data in the central and high-altitude areas of the TRB has hampered the detailed analysis of temperature and precipitation changes in this region. To address this shortcoming, we utilized ERA5_Land reanalysis data to explore the spatial variation characteristics of temperature and precipitation across the basin.
Figure 9 shows the quantile graphs of annual mean temperature and annual precipitation. Among them, the ERA5_Land data showed strong agreement with the observed data on most quantiles. However, some of the data points deviated from the 1:1 line when the temperature increased, indicating some differences between the ERA5_Land data and the observed data at higher temperatures (Figure 9a). Similarly, at low precipitation levels, the ERA5_Land data matched well with the observed data. However, during extreme precipitation events, there was a large deviation in ERA5_Land data (Figure 9b). Moreover, the correlation between temperature and precipitation and ERA5_Land data was 0.92 and 0.72, respectively.
The analysis results based on ERA5_Land data were generally consistent with those derived from station data, and both revealed significant spatial differences in temperature and precipitation in the TRB (Figure 10). High-temperature areas were concentrated in the Taklimakan Desert and the southern part of the basin (7~14 °C), while the low-temperature regions were in the north, east, and mountainous areas (−16~−6 °C). Areas with high precipitation were distributed on the periphery of the TRB (higher than 90 mm), and areas with low precipitation were distributed in the desert (0~30 mm). Overall, the temperature decreased from the center to the outer regions, whereas precipitation increased toward the periphery.
Concurrently, the TRB and its sub-basins showed a warming trend, and the northeastern part of the growth rate was higher than in the other sub-basins (Figure 10c). In addition, the annual precipitation in the TRB and its sub-basins shows an increasing trend based on the analysis of station observation data. However, the precipitation data analysis based on ERA5_Land data showed that the annual precipitation in the southeast of the Kaidu River Basin, the west of the Weigan River Basin, most of the main stream area, the east of Taklimakan Desert, the north of the Keriya River Basin, and the north of Cherchen River Basin showed a decreasing trend (Figure 10d).

3.4. Possible Impacts of Global Warming and Climate Indices on the TRB

Through the above analysis, it was found that the temperature and precipitation in this basin showed an increasing trend, with the trend differing in the sub-basins. Based on our results, we analyzed the correlations between this trend and global warming to determine if and where increasing global mean temperatures were affecting temperature and precipitation in the TRB.
The correlation between the annual mean temperature in the TRB and the global mean temperature ranges from −0.1 to 0.8 (Figure 11). Among these data, 97.6% of the stations exhibited a positive trend, and 71.4% of the stations had a correlation coefficient greater than 0.5. These findings indicate that the annual mean temperature changes in most regions of the TRB are correlated with global mean temperature changes, and there is little difference in response to global warming among the sub-basins.
Conversely, the response of precipitation to global warming was slightly lower, with correlation coefficients ranging from 0.1 to 0.6 (Figure 11). All stations showed a positive correlation between annual precipitation and global mean temperature; however, only 10% showed a correlation above 0.5, and 82.5% were between 0.2 and 0.5. The correlation between annual precipitation and global warming was significantly different among the sub-basins, with R3 showing a stronger correlation than the others.
Furthermore, the authors of other studies found that the temperature and precipitation in Xinjiang are affected by AMO, AO, NAO, and PDO [46,47]. Therefore, in this study, we continued to explore the correlations between annual mean temperature, precipitation, and climate indices, such as AMO, AO, NAO, and PDO.
Figure 12a shows the correlation between temperature and four climate indices in the TRB and its sub-basins. Among them, TRB temperature was significantly positively correlated with AMO, and the correlation was 0.7. There was also a significant positive correlation between the sub-basin temperature and AMO, especially in R3, R4, and R6, with correlation coefficients of 0.7, 0.71, and 0.81, respectively. In contrast, the temperature in the TRB was significantly negatively correlated with AO, and the correlation coefficient was −0.73. In addition to R9, the other sub-basins also showed significant negative correlations, especially R6 and R7, which were −0.78 and −0.81, respectively. There was a significant negative correlation between TRB temperature and NAO, with a correlation coefficient of −0.79. The temperature in the sub-basins also showed significant negative correlations with NAO, especially R6 and R7, where the correlation coefficients were −0.79 and −0.87, respectively. In addition, the correlation between temperature and PDO in the TRB and its sub-basins was negative, with R6 showing a particularly weak correlation of −0.06.
In addition, the correlation between TRB precipitation and both AMO and NAO was weak, with a coefficient of 0.06 and 0.1, though significant regional differences were found in the sub-basins (Figure 8b). Simultaneously, the correlation between AO and TRB precipitation was 0.32, with R1, R2, and R9 showing significant positive correlations from 0.46 to 0.79 and R3 having the weakest correlation at −0.04. In addition, PDO was negatively correlated with precipitation in the TRB, with a coefficient of −0.14. Among the results, there was a significant positive correlation in R2 (0.77) and significant negative correlations in R4 and R7 (−0.59).

4. Discussion

The results of this study show a significant increase in both annual mean temperature (0.2 °C/10a) and precipitation (7.1 mm/10a) in the TRB over the past 60 years, indicating a general trend toward warmer and wetter conditions from 1961 to 2021. Our results are consistent with the findings of Li [34]. Compared with previous studies, we focused more on the change characteristics of temperature and precipitation in each sub-basin of the TRB, which was more conducive to capturing the regions suitable for sustainable development. The Yerqiang River Basin, Hetian River Basin, and Keriya River Basin had a slightly higher annual temperature growth rate than the other sub-basins, which was more likely to lead to frequent droughts. The higher JJA temperature in the Hotan River Basin, Keriya River Basin, Chelchen River Basin, and Tarim River main stream area may have led to the frequency and intensity of extreme high-temperature events being slightly higher than in the other branch basins.
In addition, we found that, after 2015, there were fewer studies on temperature and precipitation in the Tarim River basin and its sub-basins. The authors of a previous study found an annual precipitation growth rate of 0.6 mm/10a for the Keriya River Basin from 1958 to 2009 [48]. In comparison, we found a significantly higher growth rate of 4.1 mm/10a for the period from 1961 to 2021. Although the annual precipitation in the other sub-basins also showed an increasing trend, the growth rate observed in this study was lower compared to earlier findings [49,50,51,52].
Furthermore, the data from climate stations in the Taklimakan Desert and high-altitude areas were incomplete, which limited climate monitoring and affected the accuracy of climate assessments. To address this shortcoming, we utilized ERA5_Land reanalysis data to explore the spatial variation characteristics of temperature and precipitation across the basin. Moreover, we calculated the correlations between temperature, precipitation, and global warming, as well as the correlations between the detrended 10-year running mean of temperature and precipitation and climate indices. This did not mean that there was a linear correlation, but it was an initial indication of the link between temperature, precipitation and global warming and climate indices in the TRB and its sub-basins.
Additionally, while EOF analysis was effective at identifying and extracting dominant spatiotemporal patterns in the data, its focus on dominant patterns can potentially lead to the neglect of less dominant, but still physically meaningful, patterns. In addition, the spatial scope and sample size of the study area had a significant influence on the EOF decomposition results [53]. Furthermore, the temperature and precipitation in Xinjiang are influenced by many factors, such as decadal variation, topography, and regional circulation characteristics [44,54]. Future studies could further explore the interaction mechanisms between these climate indices and local climate characteristics to better understand the climate change patterns in the TRB.

5. Conclusions

In this study, data from 42 meteorological stations and ERA5_Land data were selected to analyze trends and variations in temperature and precipitation in the TRB and its sub-basins from 1961 to 2021, in addition to their correlations with global warming and various climate indices. From the results, the following conclusions were derived:
(1)
The TRB experienced significant increases in annual mean temperature (0.2 °C/10a) and precipitation (7.1 mm/10a) from 1961 to 2021, with notable differences in precipitation growth rates among its sub-basins. The first EOF mode (EOF1) for temperature and precipitation showed a consistent change pattern; in comparison, EOF2 displayed the opposite pattern.
(2)
Over the past 60 years, the temperature and precipitation in TRB sub-basins have shown significant differences. R5, R6, and R7 exhibited the largest annual mean temperature increase (0.3 °C/10a). R3 showed the highest precipitation increase (12.9 mm/10a), and R8 showed the lowest (1.9 mm/10a).
(3)
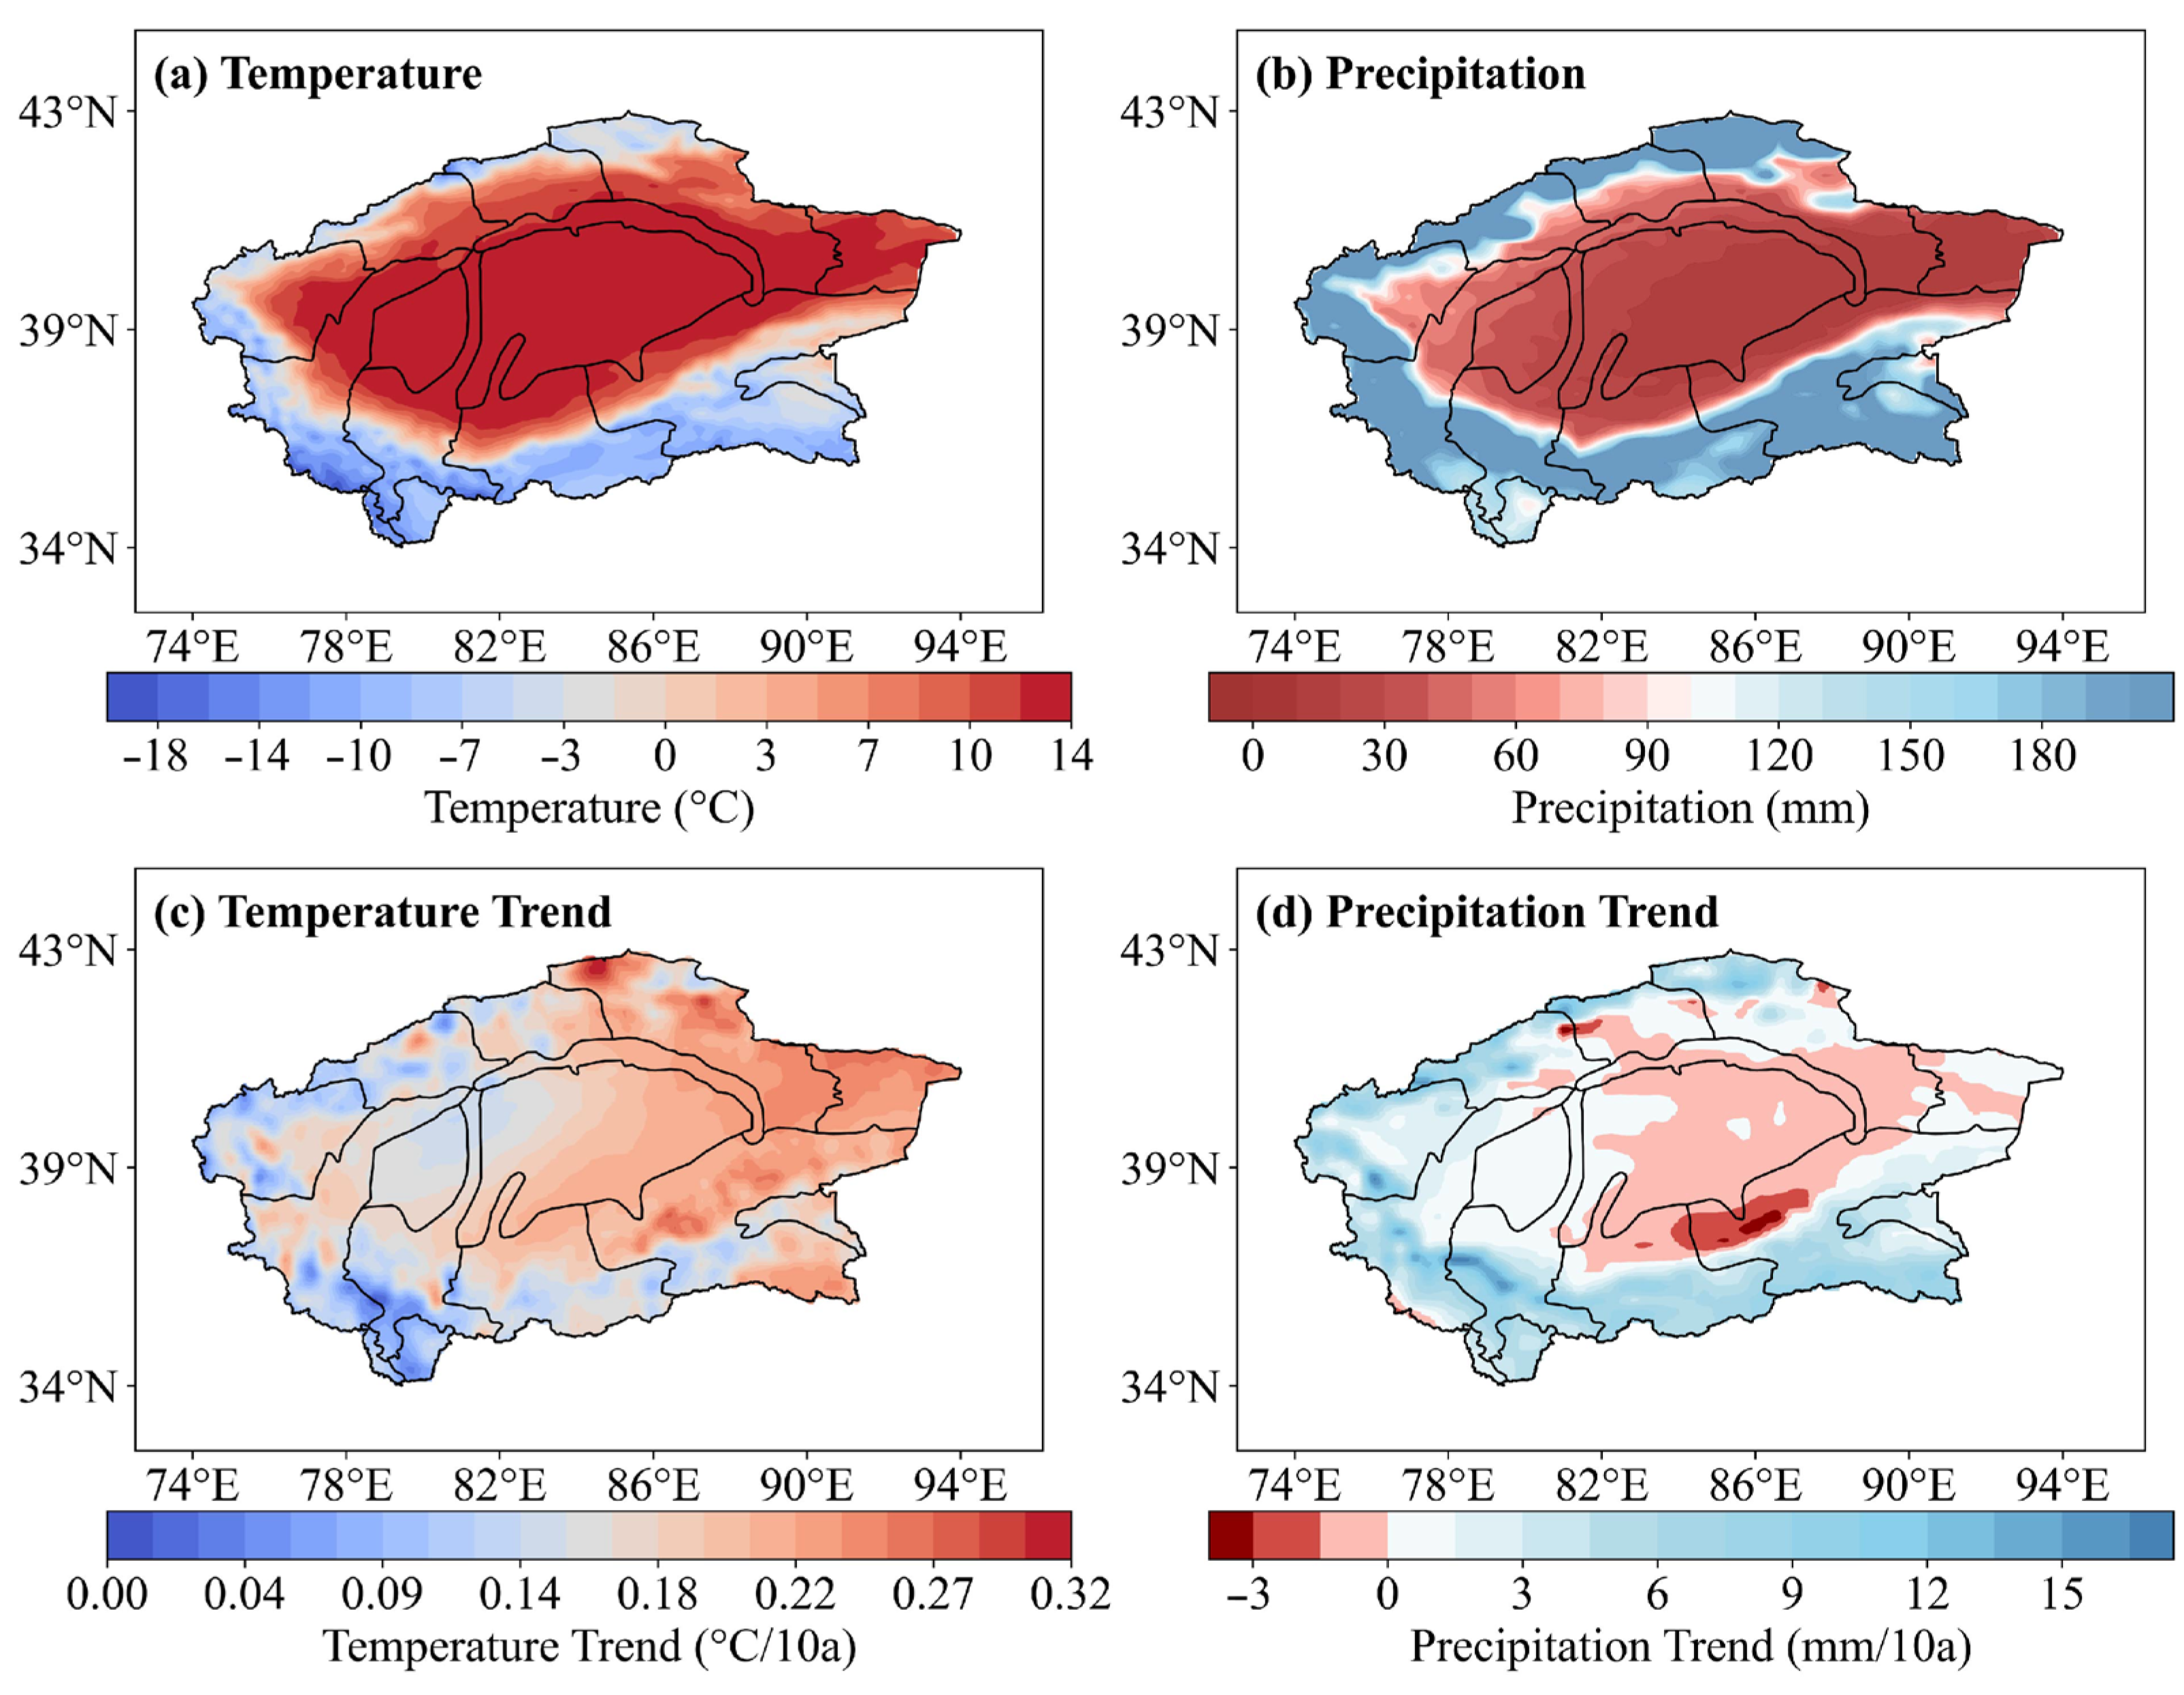
The ERA5_Land data showed high applicability in the TRB. Sub-basins showed warming trends at varying rates. Precipitation in the eastern Taklimakan Desert, most main streams, and the northern Cherchen River Basin showed a decreasing trend, while other sub-basins showed an increasing trend.
(4)
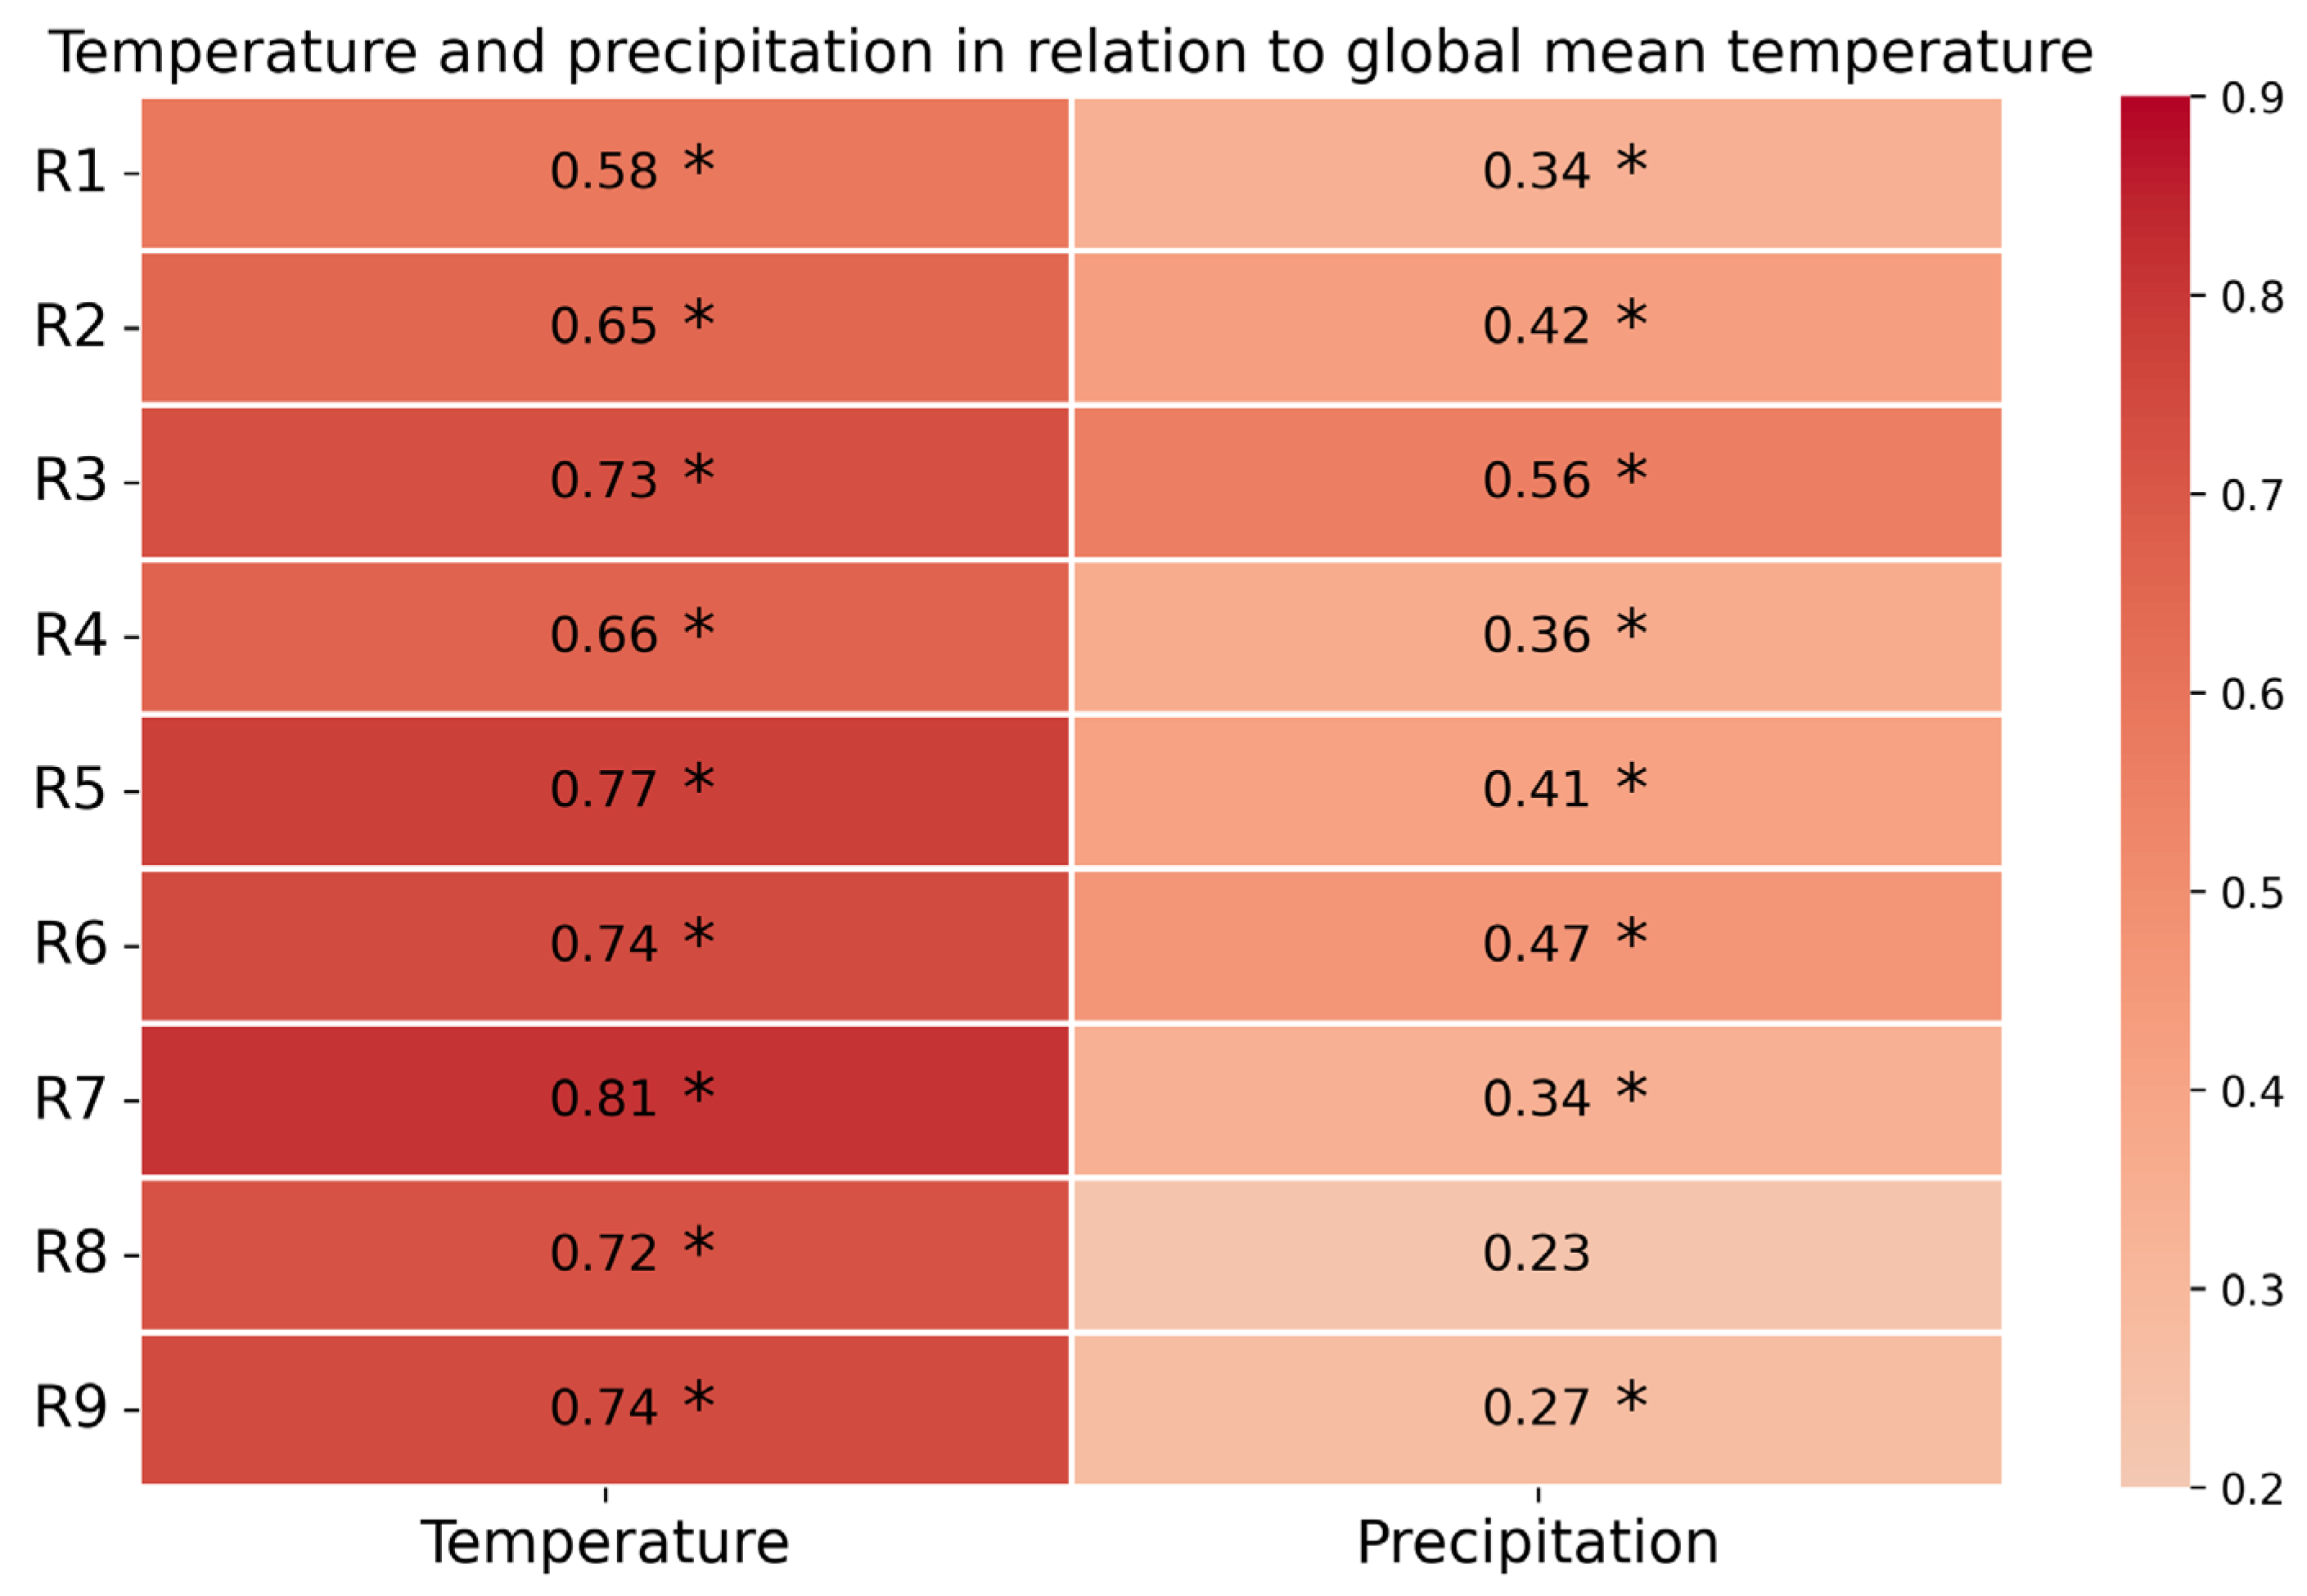
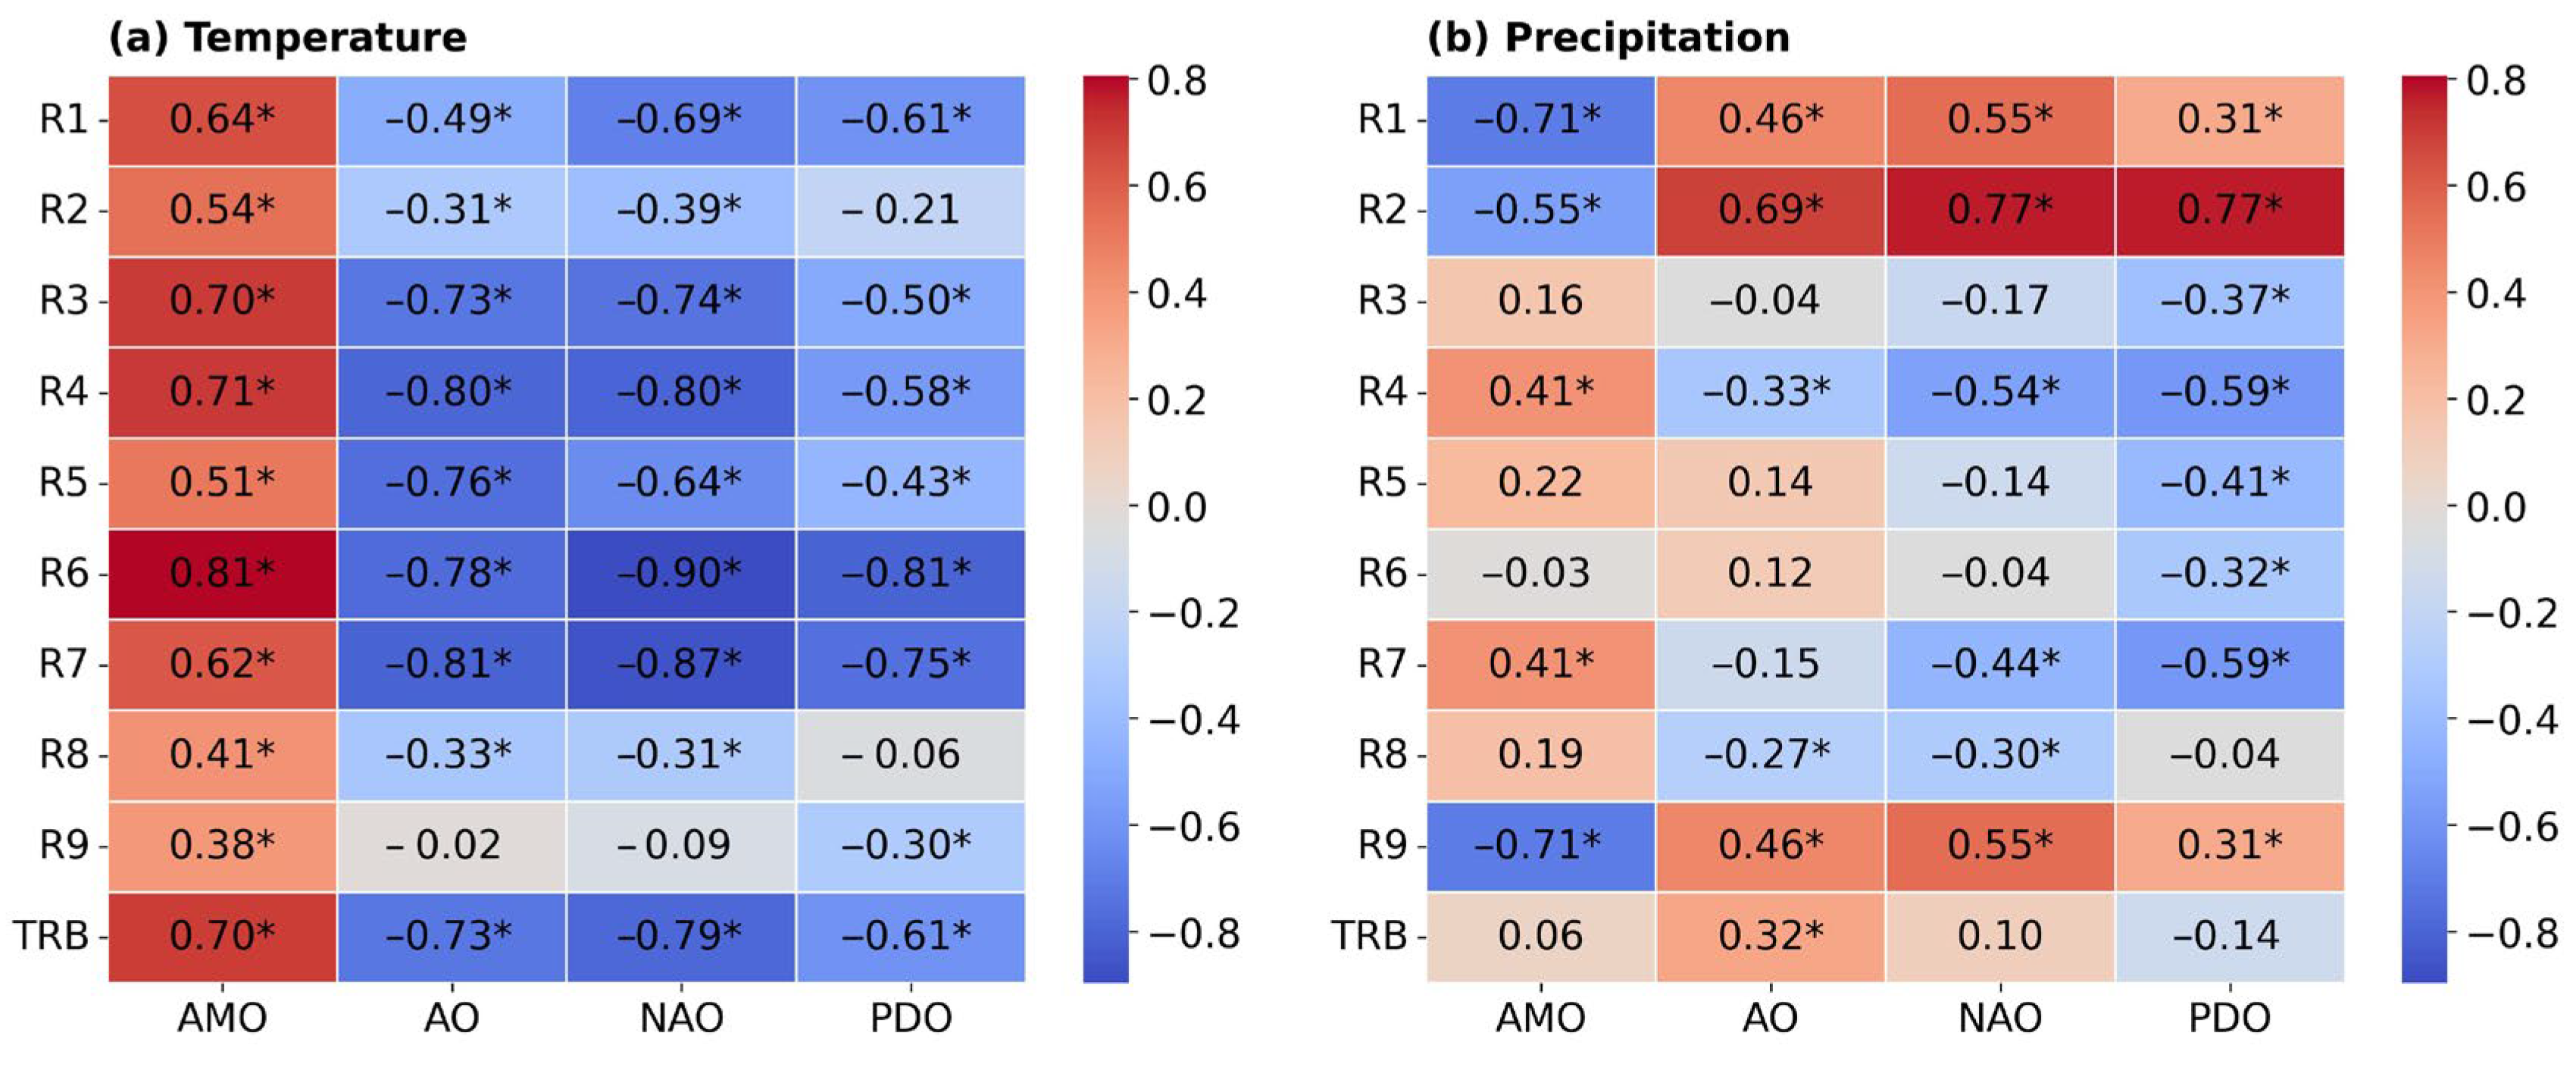
The correlations between global warming and temperature in the TRB sub-basins exceeded 0.5, while those with precipitation amounted to 0.2~0.5. Additionally, AMO showed a positive correlation with TRB temperature, particularly in R3, R4, and R6 (0.7~0.8). AO and NAO had significant negative correlations with TRB temperature, except in R9, while PDO was negatively correlated with TRB temperature, except in R2 and R8. Moreover, AMO, AO, NAO, and PDO significantly influenced precipitation distribution, with varying degrees and directions across sub-basins.
The results of this study provide a scientific basis for water resource management, agricultural planning, ecological protection, and disaster prevention and control in the basin and will help to formulate more efficient response strategies.

Author Contributions

Conceptualization, M.S. and C.W.; methodology, Y.W. (Yisilamu Wulayin); software, J.P.; validation, S.W., J.G. and C.Z.; formal analysis, H.S.; investigation, Y.W. (Yu Wang); resources, W.H.; data curation, S.W.; writing—original draft preparation, S.W.; writing—review and editing, S.W.; visualization, F.Y.; supervision, A.A.; project administration, Y.L.; funding acquisition, A.M. All authors have read and agreed to the published version of the manuscript.

Funding

This research was funded by the Third Xinjiang Scientific Expedition, grant number 2022xjkk030502; the Youth Innovation Team of China Meteorological Administration: CMA2024QN13; Xinjiang Uygur Autonomous Region Key Research and Development Program:2023B02004-2; Technical Service for Risk Survey of Sandstorm Meteorological Disasters in the Autonomous Region:2023-51; Funding for the Training of Key Minority Science and Technology Personnel in 2022:2021TP130XJ; the Innovation Team Project of Xinjiang Meteorological Service, grant number: ZD202306; and the 2024 Detection Center Observation Test Program Project, grant numbers: GCSYJH24-01, GCSYJH24-11, and GCSYJH24-18.

Institutional Review Board Statement

Not applicable.

Informed Consent Statement

Not applicable.

Data Availability Statement

The data used in this paper can be provided by A.M. (ail@idm.cn) upon request.

Acknowledgments

The authors would like to acknowledge the National Meteorological Information Center of the China Meteorological Administration.

Conflicts of Interest

The authors declare no conflicts of interest.

References

  1. Tollefson, J. Climate change is hitting the planet faster than scientists originally thought. Nature, 28 February 2022. [Google Scholar]
  2. Abbass, K.; Qasim, M.Z.; Song, H.; Murshed, M.; Mahmood, H.; Younis, I. A review of the global climate change impacts, adaptation, and sustainable mitigation measures. Environ. Sci. Pollut. Res. Int. 2022, 29, 42539–42559. [Google Scholar] [CrossRef] [PubMed]
  3. IPCC. Climate Change 2021: The Physical Science Basis. Contribution of Working Group I to the Sixth Assessment Report of the Intergovernmental Panel on Climate Change; IPCC: Geneva, Switzerland, 2021. [Google Scholar]
  4. Xing, Y.; Li, Y.; Bai, P.; Zhuang, J.; Feng, A.; Huang, M.; Yan, H. Spatiotemporal variations of meteorological drought and its dominant factors in different climate regions for the first two decades of the twenty-first century. Theor. Appl. Clim. 2024, 155, 3631–3645. [Google Scholar] [CrossRef]
  5. Byrne, J.P.; Vitenu-Sackey, P.A. The Macroeconomic Impact of Global and Country-Specific Climate Risk. Environ. Resour. Econ. 2024, 87, 655–682. [Google Scholar] [CrossRef]
  6. Qin, N.; Wang, J.; Yang, G.; Chen, X.; Liang, H.; Zhang, J. Spatial and temporal variations of extreme precipitation and temperature events for the Southwest China in 1960–2009. Geoenviron. Disasters 2015, 2, 4. [Google Scholar] [CrossRef]
  7. Zhang, Y.; Liang, C. Analysis of Annual and Seasonal Precipitation Variation in the Qinba Mountain area, China. Sci. Rep. 2020, 10, 961. [Google Scholar] [CrossRef]
  8. Zhang, A.; Zhao, X. Changes of precipitation pattern in China: 1961–2010. Theor. Appl. Clim. 2022, 148, 1005–1019. [Google Scholar] [CrossRef]
  9. Wang, Y.; Zhang, W.; Zhang, P.; Tang, L.; Huang, Y.; Feng, N. Spatial and temporal variations of precipitation in Northwest China during 1973–2019. Theor. Appl. Clim. 2024, 155, 1–10. [Google Scholar] [CrossRef]
  10. Zhao, D.; Gao, X.; Wu, S. Nonuniform variations of precipitation and temperature across China over the period 1960–2015. Int. J. Clim. 2021, 41, 316–327. [Google Scholar] [CrossRef]
  11. Guo, B.; Zhang, J.; Meng, X.; Xu, T.; Song, Y. Long-term spatio-temporal precipitation variations in China with precipitation surface interpolated by ANUSPLIN. Sci. Rep. 2020, 10, 81. [Google Scholar] [CrossRef]
  12. Liu, Z.; Wu, G. Quantifying the precipitation—Temperature relationship in China during 1961–2018. Int. J. Clim. 2022, 42, 2656–2669. [Google Scholar] [CrossRef]
  13. Yang, X.; Li, D.; Yang, Z.; Wu, K.; Ji, L.; Zhou, Z.; Lu, Y. Revealing historical observations and future projections of precipitation over Northwest China based on dynamic downscaled CMIP6 simulations. Front. Earth Sci. 2023, 10, 1090221. [Google Scholar] [CrossRef]
  14. Gao, J.; Zhou, B.; Zhai, P. Changes in Persistent Precipitation in Northwest China and Related Large-Scale Circulation Features. J. Meteorol. Res. 2023, 37, 604–616. [Google Scholar] [CrossRef]
  15. Ma, X.; Shi, Y.; Shen, Y.; Yang, B. An Analysis of Climate Changing Trend in Northwest China: Recent and Historical Periods. J. Glaciol. Geocryol. 2003, 25, 672–676. (In Chinese) [Google Scholar]
  16. Shi, Y.; Shen, Y.; Li, D.; Zhang, G.; Ding, Y. Discussion on the Present Climate Change from Warm-Dry to Warm-Wet in Northwest China. Quat. Sci. 2003, 23, 152–164. (In Chinese) [Google Scholar]
  17. Zhang, Q.; Yang, J.; Wang, W.; Ma, P.; Lu, G.; Liu, X.; Yu, H.; Fang, F. Climatic Warming and Humidification in the Arid Region of Northwest China: Multi-Scale Characteristics and Impacts on Ecological Vegetation. J. Meteorol. Res. 2021, 35, 113–127. [Google Scholar] [CrossRef]
  18. Shang, S.; Lian, L.; Ma, T.; Zhang, K.; Han, T. Spatiotemporal Variation of Temperature and Precipitation in Northwest China in Recent 54 Years. Arid. Zone Res. 2018, 35, 68–76. (In Chinese) [Google Scholar]
  19. Wei, S.; Wang, X.; Wang, K.; Liu, L.; Liang, B.; Zhao, W. Rethinking spatiotemporal variations in air temperature over the Qilian Mountains, Western China, from 1979 to 2018. Atmos. Res. 2023, 286, 106671. [Google Scholar] [CrossRef]
  20. Tang, S. Spatiotemporal Variations of the Temperature and Precipitation in Xinjiang During the Past 40 Years. Master’s Thesis, Sichuan Normal University, Chengdu, China, 2021. (In Chinese). [Google Scholar]
  21. Wang, L.; Wang, Z.; Liu, M.; Shen, J.; Nie, Z. The temperature and precipitation change and its impact on lakes in Badain Jaran Desert over the last 60 years. Geol. Bull. China 2023, 42, 1218–1227. [Google Scholar]
  22. Wang, Q.; Zhai, P.; Qin, D. New perspectives on ‘warming–wetting’ trend in Xinjiang, China. Adv. Clim. Chang. Res. 2020, 11, 252–260. [Google Scholar] [CrossRef]
  23. Zhang, H.; Wang, F.; Zhan, Z.; Xue, P.; Qiu, F.; Hou, W. The Variation Characteristics of Temperature and Precipitation in Mogao Grottoes of Dunhuang in Recent 30 Years. Plateau Meteorol. 2023, 42, 1069–1077. (In Chinese) [Google Scholar]
  24. Chen, Y.; Xu, C.; Chen, Y.; Liu, Y.; Li, W. Progress, challenges and prospects of eco-hydrological studies in the Tarim river basin of Xinjiang, China. Environ. Manag. 2013, 51, 138–153. [Google Scholar] [CrossRef] [PubMed]
  25. Bai, J.; Li, J.; Bao, A.; Chang, C. Spatial-temporal variations of ecological vulnerability in the Tarim River Basin, Northwest China. J. Arid. Land 2021, 13, 814–834. [Google Scholar] [CrossRef]
  26. Wang, Z.; Huang, S.; Mu, Z.; Leng, G.; Duan, W.; Ling, H.; Xu, J.; Zheng, X.; Li, P.; Li, Z.; et al. Relative humidity and solar radiation exacerbate snow drought risk in the headstreams of the Tarim River. Atmos. Res. 2024, 297, 107091. [Google Scholar] [CrossRef]
  27. Chen, Y.; Xu, Z. Plausible impact of global climate change on water resources in the Tarim River Basin. Sci. China Ser. D Earth Sci. 2005, 48, 65–73. [Google Scholar] [CrossRef]
  28. Xu, J.; Chen, Y.; Li, W.; Ji, M.; Dong, S.; Hong, Y. Wavelet analysis and nonparametric test for climate change in Tarim River Basin of Xinjiang during 1959–2006. Chin. Geogr. Sci 2009, 19, 306–313. [Google Scholar] [CrossRef]
  29. Milošević, D.; Stojsavljević, R.; Szabó, S.; Stankov, U.; Savić, S.; Mitrović, L. Spatio-Temporal Variability of Precipitation over the Western Balkan Countries and Its Links with the Atmospheric Circulation Patterns. J. Geogr. Inst. Jovan Cvijic 2021, 71, 29–42. [Google Scholar] [CrossRef]
  30. Zhu, J.; Chen, Y.; Li, Z.; Duan, W.; Fang, G.; Wang, C.; He, G.; Wei, W. Using Film-Mulched Drip Irrigation to Improve the Irrigation Water Productivity of Cotton in the Tarim River Basin, Central Asia. Remote Sens. 2023, 15, 4615. [Google Scholar] [CrossRef]
  31. Xu, Z.; Liu, Z.; Fu, G.; Chen, Y. Trends of major hydroclimatic variables in the Tarim River basin during the past 50 years. J. Arid Environ. 2010, 74, 256–267. [Google Scholar] [CrossRef]
  32. Krysanova, V.; Wortmann, M.; Bolch, T.; Merz, B.; Duethmann, D.; Walter, J.; Huang, S.; Tong, J.; Buda, S.; Kundzewicz, Z.W. Analysis of current trends in climate parameters, river discharge and glaciers in the Aksu River basin (Central Asia). Hydrol. Sci. J. 2015, 60, 566–590. [Google Scholar] [CrossRef]
  33. Zhang, J.; Bao, W.; Feng, X.; Lu, J.; Luo, Q. Study on the Change of Meteorological Elements in Tarim River Basin in Recent 50 Years. Water Power 2020, 46, 28–34. (In Chinese) [Google Scholar]
  34. Weihong, L.; Chenggang, Z.; Yapeng, C. Recent changes in the water and ecological condition at the arid Tarim River Basin. In Proceedings of the 25th International Congress on Modelling and Simulation, Darwin, NT, Australia, 9–14 July 2023. [Google Scholar]
  35. Li, Y.; Chen, Y.; Chen, Y.; Duan, W.; Wang, J.; Wang, X. Characteristics of Dry and Wet Changes and Future Trends in the Tarim River Basin Based on the Standardized Precipitation Evapotranspiration Index. Water 2024, 16, 880. [Google Scholar] [CrossRef]
  36. Zhang, S.; Wang, Y.; Wang, Y.; Li, Z.; Hou, Y. Spatiotemporal Evolution and Influencing Mechanisms of Ecosystem Service Value in the Tarim River Basin, Northwest China. Remote Sens. 2023, 15, 591. [Google Scholar] [CrossRef]
  37. Wang, Y.; Zi, F.; Lu, S.; Li, M.; Zhou, J.; Yang, X.; Wang, W.; Niu, R. Analysis of surface-groundwater changes in the Tarim River Basin of Xinjiang from 1989 to 2019. Sci. Geogr. Sin. 2023, 43, 899–909. (In Chinese) [Google Scholar]
  38. Hou, Y.; Chen, Y.; Ding, J.; Li, Z.; Li, Y.; Sun, F. Ecological Impacts of Land Use Change in the Arid Tarim River Basin of China. Remote Sens. 2022, 14, 1894. [Google Scholar] [CrossRef]
  39. Xu, Z.X.; Chen, Y.N.; Li, J.Y. Impact of climate change on water resources in the Tarim River basin. Water Resour. Manag. 2004, 18, 439–458. [Google Scholar] [CrossRef]
  40. Worku, M.A.; Feyisa, G.L.; Beketie, K.T. Climate trend analysis for a semi-arid Borana zone in southern Ethiopia during 1981–2018. Environ. Syst. Res. 2022, 11, 2. [Google Scholar] [CrossRef]
  41. Xia, Z.; Liao, K.; Guo, L.; Chen, X.; Liu, C.; Jiao, Y.; Cao, J. Spatiotemporal Distribution Pattern of Precipitation in Ganjiang River Basin Based on EOF and MK Trend Analysis. Res. Soil Water Conserv. 2023, 30, 223–233, 249. (In Chinese) [Google Scholar]
  42. Yuhao, Z. Temporal and spatial distribution characteristics of multi-year rainfall and temperature in Jiangsu Province based on EOF. Water Resour. Plan. Des. 2024. (In Chinese) [Google Scholar] [CrossRef]
  43. Alemu, Z.A.; Dioha, M.O. Climate change and trend analysis of temperature: The case of Addis Ababa, Ethiopia. Environ. Syst. Res. 2020, 9, 27. [Google Scholar] [CrossRef]
  44. Aihaiti, A.; Jiang, Z.; Li, Y.; Tao, L.; Zhu, L.; Zhang, J. The global warming and IPO impacts on summer extreme precipitation in China. Clim. Dyn. 2023, 60, 3369–3384. [Google Scholar] [CrossRef]
  45. Haynes, R.J.; Beare, M.H. Influence of six crop species on aggregate stability and some labile organic matter fractions. Soil Biol. Biochem. 1997, 29, 1647–1653. [Google Scholar] [CrossRef]
  46. Huang, W.; Chen, F.; Feng, S.; Chen, J.; Zhang, X. Interannual precipitation variations in the mid-latitude Asia and their association with large-scale atmospheric circulation. Chin. Sci. Bull. 2013, 58, 3962–3968. [Google Scholar] [CrossRef]
  47. Meng, L.; Zhao, Y.; Li, M. Effects of Whole SST Anomaly in the Tropical Indian Ocean on Summer Rainfall Over Central Asia. Front. Earth Sci. 2021, 9, 738066. [Google Scholar] [CrossRef]
  48. Zhang, L. Analysis of variation trend of rainfall runoff in Keriya River basin. Gansu Water Conserv. Hydropower Technol. 2011, 47, 7–8. (In Chinese) [Google Scholar]
  49. Zheng, P.; Chen, Y.; Wang, H.; Yang, Y. The impact of climate change on extreme runoffs in the Tianshan region: Taking Kaidu River as an example. J. Irrig. Drain. 2024, 43, 105–112. (In Chinese) [Google Scholar]
  50. Huang, X. Analysis of the change of Tarim River main stream and climate factors based on set pair analysis. Hydro Sci. Cold Zone Eng. 2024, 7, 79–84. (In Chinese) [Google Scholar]
  51. Ren, C. Effects of Climate and Land Use Change on Runoff in Yerqiang River Basin. Master’s Thesis, Shihezi University, Shihezi, China, 2021. (In Chinese). [Google Scholar]
  52. Wang, P.; Xu, M.; Han, H.; Li, Z.; Song, X.; Zhou, W. Response of glacier mass balance and meltwater runoff to climate change in the Akesu River Basin, Southern Tianshan. Earth Sci. Front. 2024, 31. (In Chinese) [Google Scholar] [CrossRef]
  53. Zhu, J.S.; Zhang, Z.; Chen, H.; Zhong, X. Analysis of Temporal-spatial Variations of 61 Years Summer Precipitation in Haihe River Basin based on EOF and REOF. Haihe Water Resour. 2017, 1–6. (In Chinese) [Google Scholar] [CrossRef]
  54. Zhou, G.; Chen, Y.; Yao, J. Variations in Precipitation and Temperature in Xinjiang (Northwest China) and Their Connection to Atmospheric Circulation. Front. Environ. Sci. 2023, 10, 1082713. [Google Scholar] [CrossRef]
Figure 1. Location map of the study area. The shaded color indicates the elevation of the TRB (m); red color symbols represent the distribution of stations in the sub-basins of the TRB.
Remotesensing 16 04612 g001
Figure 2. (a,b) Time series of the annual mean temperature and precipitation anomalies, red represents a positive anomaly, blue represents a negative anomaly; solid lines represent the detrended 10-year running average; (c,d) linear trends of annual mean temperature (°C) and precipitation (mm) in the TRB from 1961 to 2021; (e,f) spatial distribution of annual mean temperature and mean PRCPTOT in the TRB from 1961 to 2021.
Remotesensing 16 04612 g002
Figure 3. Spatial distribution of (a,c) the first eigenvector and (b,d) second eigenvector of the EOF analysis of the annual mean temperature and PRCTOP in the TRB from 1961 to 2021.
Remotesensing 16 04612 g003
Figure 4. Temporal trends of (a,c) EOF1 and (b,d) EOF2 for annual mean temperature and PRCPTOT in the TRB from 1961 to 2021, where the solid line is the PC value and the dashed line is the linearly fitted trend.
Remotesensing 16 04612 g004
Figure 5. Trends in (a) annual mean temperature and (b) precipitation in the sub-basins of the TRB from 1961 to 2021.
Remotesensing 16 04612 g005
Figure 6. The annual mean temperature anomaly after detrending in the TRB sub-basins from 1961 to 2021, where the reference period was 1981–2010, red represents a positive anomaly, blue represents a negative anomaly.
Remotesensing 16 04612 g006
Figure 7. The annual precipitation anomaly after detrending in the TRB sub-basins from 1961 to 2021, where the reference period was 1981–2010, red represents a positive anomaly, blue represents a negative anomaly.
Remotesensing 16 04612 g007
Figure 8. (ad) The spatial distribution of seasonal mean temperature (°C) in the sub-basins from 1961 to 2021; (fi) the spatial distribution of seasonal precipitation (mm) in the sub-basins from 1961 to 2021; (e,j) thermal maps of seasonal mean temperature (°C) and seasonal precipitation (mm) in the sub-basins.
Remotesensing 16 04612 g008
Figure 9. Comparison of observed quantiles for (a) temperature and (b) precipitation with ERA5_Land data. The solid red line represents the 1:1 line.
Remotesensing 16 04612 g009
Figure 10. Spatial distribution of (a) annual mean temperature and (b) annual precipitation and (c,d) their spatial variation trends in the TRB and its sub-basins based on ERA5_Land data.
Remotesensing 16 04612 g010
Figure 11. The correlation between the annual mean temperature (°C) and annual precipitation (mm) in the sub-basins and global warming (* represents significance p < 0.05).
Remotesensing 16 04612 g011
Figure 12. The correlations between the 10-year running average of (a) annual mean temperature and (b) precipitation in the TRB and the 10-year running average of each climate index after the detrend (* represents significance p < 0.05).
Remotesensing 16 04612 g012
Table 1. Watershed zoning and distribution of meteorological stations.
Primary ZoneTRB
Secondary ZoneR1R2R3R4R5R6R7R8R9
Number of sitesTemperature656864322
Precipitation556764322
Table 2. Variance contributions and accumulated variance contribution of the first to four eigenvectors of the EOF decomposition of annual mean temperature and PRCPTOT in the TRB from 1961 to 2021.
Serial
Number
EOFVariance Contribution
Rate (%)
Cumulative Variance Contribution Rate (%)
TemperaturePrecipitationTemperaturePrecipitationTemperaturePrecipitation
127.5517.6869.4946.9969.4946.99
22.933.767.389.9976.8756.98
32.162.035.455.3982.3162.37
41.481.623.734.2986.0466.66
Table 3. The difference in the climate tendency rate and abrupt change time of annual mean temperature and precipitation in each branch basin of the TRB from 1961 to 2021.
Secondary ZoneClimatic Tendency Rate
(°C/10a, mm/10a)
Mutation Time (Year)
TemperaturePrecipitationTemperaturePrecipitation
R10.24.719941988, 2009, 2010, 2011, 2012, 2018, 2021
R20.26.019911978, 2020, 2021
R30.212.919991995
R40.28.819982003, 2006, 2008
R50.36.820042010, 2019, 2021
R60.37.420032010, 2011, 2012, 2013, 2016, 2019, 2020
R70.34.120012010, 2011, 2012, 2020, 2021
R80.21.919931974, 1975, 1981, 1983, 1984, 1985, 1987, 2020, 2021
R90.22.520022008, 2009, 2010, 2011, 2012, 2020, 2021
Table 4. The difference in the climate tendency rate of season mean temperature and precipitation in each sub-basin of the TRB from 1961 to 2021.
MAMJJASONDJF
Temperature
°C/10a
Precipitation
mm/10a
Temperature
°C/10a
Precipitation
mm/10a
Temperature
°C/10a
Precipitation
mm/10a
Temperature
°C/10a
Precipitation
mm/10a
R10.22.300.11.990.10.010.30.38
R20.20.550.13.600.11.530.30.36
R30.31.710.17.070.23.560.30.51
R40.31.460.14.770.21.940.30.65
R50.31.060.24.520.30.970.40.21
R60.31.570.24.630.30.900.40.28
R70.30.350.22.690.30.830.50.19
R80.30.580.30.680.10.300.30.32
R90.30.740.21.200.10.230.30.29
Disclaimer/Publisher’s Note: The statements, opinions and data contained in all publications are solely those of the individual author(s) and contributor(s) and not of MDPI and/or the editor(s). MDPI and/or the editor(s) disclaim responsibility for any injury to people or property resulting from any ideas, methods, instructions or products referred to in the content.

