Article

Matching Vegetation Indices and Tree Vigor in Pyrenean Silver Fir Stands

by
Juan Pablo Crespo-Antia
1,2,
Antonio Gazol
1,
Manuel Pizarro
1,
Ester González de Andrés
1,
Cristina Valeriano
1,
Álvaro Rubio Cuadrado
3,
Juan Carlos Linares
2 and
Jesús Julio Camarero
1,*
1
Instituto Pirenaico de Ecología (IPE-CSIC), 50059 Zaragoza, Spain
2
Departamento de Sistemas Físicos, Químicos y Naturales, Universidad Pablo de Olavide, 41013 Sevilla, Spain
3
Departamento de Sistemas y Recursos Naturales, Escuela Técnica Superior de Ingeniería de Montes, Forestal y del Medio Natural, Universidad Politécnica de Madrid, Ciudad Universitaria s/n, 28040 Madrid, Spain
*
Author to whom correspondence should be addressed.
Remote Sens. 2024, 16(23), 4564; https://doi.org/10.3390/rs16234564
Submission received: 25 October 2024 / Revised: 29 November 2024 / Accepted: 2 December 2024 / Published: 5 December 2024

Abstract

:
Forest health monitoring is crucial for sustainable management, especially with the challenges posed by climate warming. Remote sensing data provide vegetation indices, such as the Normalized Difference Vegetation Index (NDVI) and Enhanced Vegetation Index (EVI), that are widely used in assessing forest health. However, studies considering the validation of these data with field assessments of tree vigor are still scarce. To address this issue, we explored the relationships in declining (D) and non-declining (N) silver fir (Abies alba Mill.) stands from the Spanish Pyrenees between changes in canopy (a proxy of vigor), vegetation indices (NDVI, EVI) and climate variables. We compared trends in the NDVI and EVI for the period of 1984–2023 for D and N stands showing high and low crown defoliation levels, respectively. The EVI values allowed for the separation of stands according to their vigor earlier and more clearly than NDVI values, which did not show clear patterns throughout the time series. Significant negative correlations were found between the EVI and stand defoliation (r = −0.57) or mean radial growth (r = 0.81). Late-spring drought reduced the EVI. The EVI series reflected similar spatial patterns in terms of stand defoliation and tree growth, offering complementary information, along with the strengths of remote sensing with respect to its spatial and temporal coverage, for the early detection of forest dieback. This study also contributes to a better understanding of remote sensing indices, which is useful for forest health monitoring.

1. Introduction

Forest health monitoring is crucial for sustainable forest management, especially in the face of climate change and increasing human pressures [1]. As temperatures rise, climate-change-related forest disturbances and tree mortality events are becoming widespread in Europe, creating hotspots of forest dieback and mortality [2,3]. Understanding how climate-change-related threats such as drought affect forests is important for projecting their responses in the future [4]. The integration of remote sensing technologies in recent decades has greatly improved our understanding of forest responses to climate change, already providing a reliable time span, at large spatial scales and covering vast areas (e.g., [5]). Satellite-derived products can help to detect early warning signals of forest dieback and growth decline, improving our monitoring capacity [6]. However, assessing forest responses to climate change based exclusively on satellite-derived images is challenging, since forest dynamics (disturbances, succession) can mask dieback processes [7]. Additionally, visual signs of decline, such as a loss of canopy cover and greenness, precede tree death [8]. Thus, field data are needed to validate the information derived from remote sensing data and to delimit the advantages and weaknesses of multispectral images, in order to detect and evaluate drought-induced forest dieback in hotspots of forest mortality [4,7,9]. Rear-edge forests, located near the drier southernmost distribution limits of drought-sensitive tree species, offer a suitable experimental system to validate the reliability of remote sensing data for monitoring forest health and detecting drought-induced dieback.
Hence, we focused on Spanish Pyrenean silver fir (Abies alba Mill.) forests, located at the southwestern limit of the species range, where extensive dieback and mortality have already been reported as a consequence of ongoing aridification [10]. Silver fir is a conifer with significant ecological and economic importance in Europe, growing primarily in mountains in the central and eastern regions of the continent [11]. It plays a crucial role in preserving forest biodiversity in mountain forests [12]. While it is considered a drought-tolerant species in central European forests (e.g., [13]), widespread growth declines and drought-induced growth reductions have been observed in southern and eastern Europe (e.g., [14]). The dieback of silver fir has been extensively studied and is associated with various factors, including drought stress and pathogens, but also historical management leading to a negative selection of trees [15,16,17,18,19,20].
Reflectance-based indices, such as the Normalized Difference Vegetation Index (NDVI), are commonly used tools for assessing forest health [21]. The NDVI measures the difference between near-infrared light, which vegetation strongly reflects, and red light, which vegetation absorbs. The Enhanced Vegetation Index (EVI), on the other hand, was later developed to address some of the limitations of the NDVI, including its sensitivity to atmospheric and canopy background noise. The EVI improves sensitivity in regions with dense vegetation by including a canopy background adjustment and incorporating the blue band to correct for aerosol influences in the red band [22].
Although the EVI is less frequently used, primarily due to the NDVI’s longer history of use and its simpler calculation, both indices may offer insights into above-ground changes in canopy greenness, cover and photosynthetic activity from landscape to stand levels [23]. The NDVI is calculated using the following formula: N D V I = n i r r e d n i r + r e d , where nir represents near-infrared light, and red refers to visible red light [24]. Meanwhile, the EVI is derived from the formula E V I = G n i r r e d n i r C 1 r e d C 2 b l u e + L [25], where G is the gain factor, C1 and C2 are coefficients for atmospheric resistance, blue is the reflectance in the blue band and L is the canopy background adjustment. The inclusion of the blue band and adjustment reduces the adverse effects of environmental factors such as atmospheric conditions and soil background [22,26].
Vegetation indices have proven to be valuable tools for understanding various forest dynamics and behaviors. NDVI variations might reflect natural successional changes rather than large-scale productivity shifts in Siberian larch forests [27]. Other studies [28] have found stronger declining NDVI trends in regions under drought stress and insect infestations, whereas declines in the NDVI of oak forests in southern Europe in mountainous areas with shallow soils have been found [29]. However, in the Spanish Pyrenees, few studies have explored the relationship between forest health and these indices. This region has undergone significant land use changes linked to the abandonment of traditional uses (grazing, logging), which have been analyzed using the NDVI [30,31]. An increase in vegetation activity during early spring in vegetated areas subjected to ongoing encroachment was identified in NDVI trends from 1984 to 2007 [32]. The inclusion of VI analyses alongside field data, particularly in forested areas, represents a novel approach for this region, contributing to a deeper understanding of the dynamics of silver fir stands and other forests showing dieback in Spain. In this sense, [23] examined the resilience of forests to drought using the NDVI, and emphasized the importance of combining remote sensing with field-based analyses, although they lacked field data.
Both the NDVI and EVI are useful tools for monitoring forest health. However, although the NDVI is widely used, it is limited in areas with a high biomass density due to signal saturation [33], whereas the EVI was developed to overcome these limitations, and it maintains its sensitivity in dense canopies by reducing atmospheric and soil noise [22,33]. This makes the EVI particularly valuable in ecosystems subjected to environmental stress, such as mountain forests experiencing drought stress or climate extremes [23].
In the context of forest dieback, the EVI offers additional advantages. It has been shown to capture subtle changes in canopy structure and photosynthetic activity, enabling the detection of early signs of stress before they are visually apparent [22,33,34]. The NDVI saturation in areas of dense vegetation limits its ability to differentiate between stands of different vigor in mature mixed forests [22,33].
Different studies have explored the relationship between tree-ring data and indices such as the NDVI, finding positive correlations between them [35,36,37,38,39,40], even in the context of drought-induced forest decline and/or resilience [41,42]. A recent literature review [43] concluded that combining tree-ring width data with NDVI data is useful for assessing forest dieback processes. However, monitoring changes in vegetation with remote sensing can lead to overlooked results due to factors such as landscape heterogeneity, stand density, age structure, variation in phenology among coexisting tree species and the spatial resolution of vegetation indices [43,44], all of which can weaken the relationship between tree-ring width and vegetation indices. Therefore, field data quantifying drought impacts over different periods, such as canopy defoliation or tree mortality, are highly required to validate the information provided by vegetation indices [43,45].
This study aims to assess whether vegetation indices (NDVI, EVI) can be used as a reliable tool for the detection of changes in forest health, by comparing declining (very defoliated) and non-declining (not defoliated) silver fir stands in the western Spanish Pyrenees. Our specific aims were as follows: (i) to compare the NDVI and EVI values between declining and non-declining stands; (ii) to analyze the relationships between the NDVI and EVI data with field assessments of stand defoliation and growth; and (iii) to investigate the climatic factors influencing the NDVI and EVI. We expect that currently declining stands, characterized by severe defoliation, will show lower values of NDVI and EVI years before the visual effects of dieback can be identified, and these values can therefore constitute an early signal of impending dieback. Due to the sensitivity of silver fir to atmospheric and soil drought (e.g., [10]), we expect that the EVI and NDVI will be substantially reduced in years with high spring–summer VPD values.

2. Materials and Methods

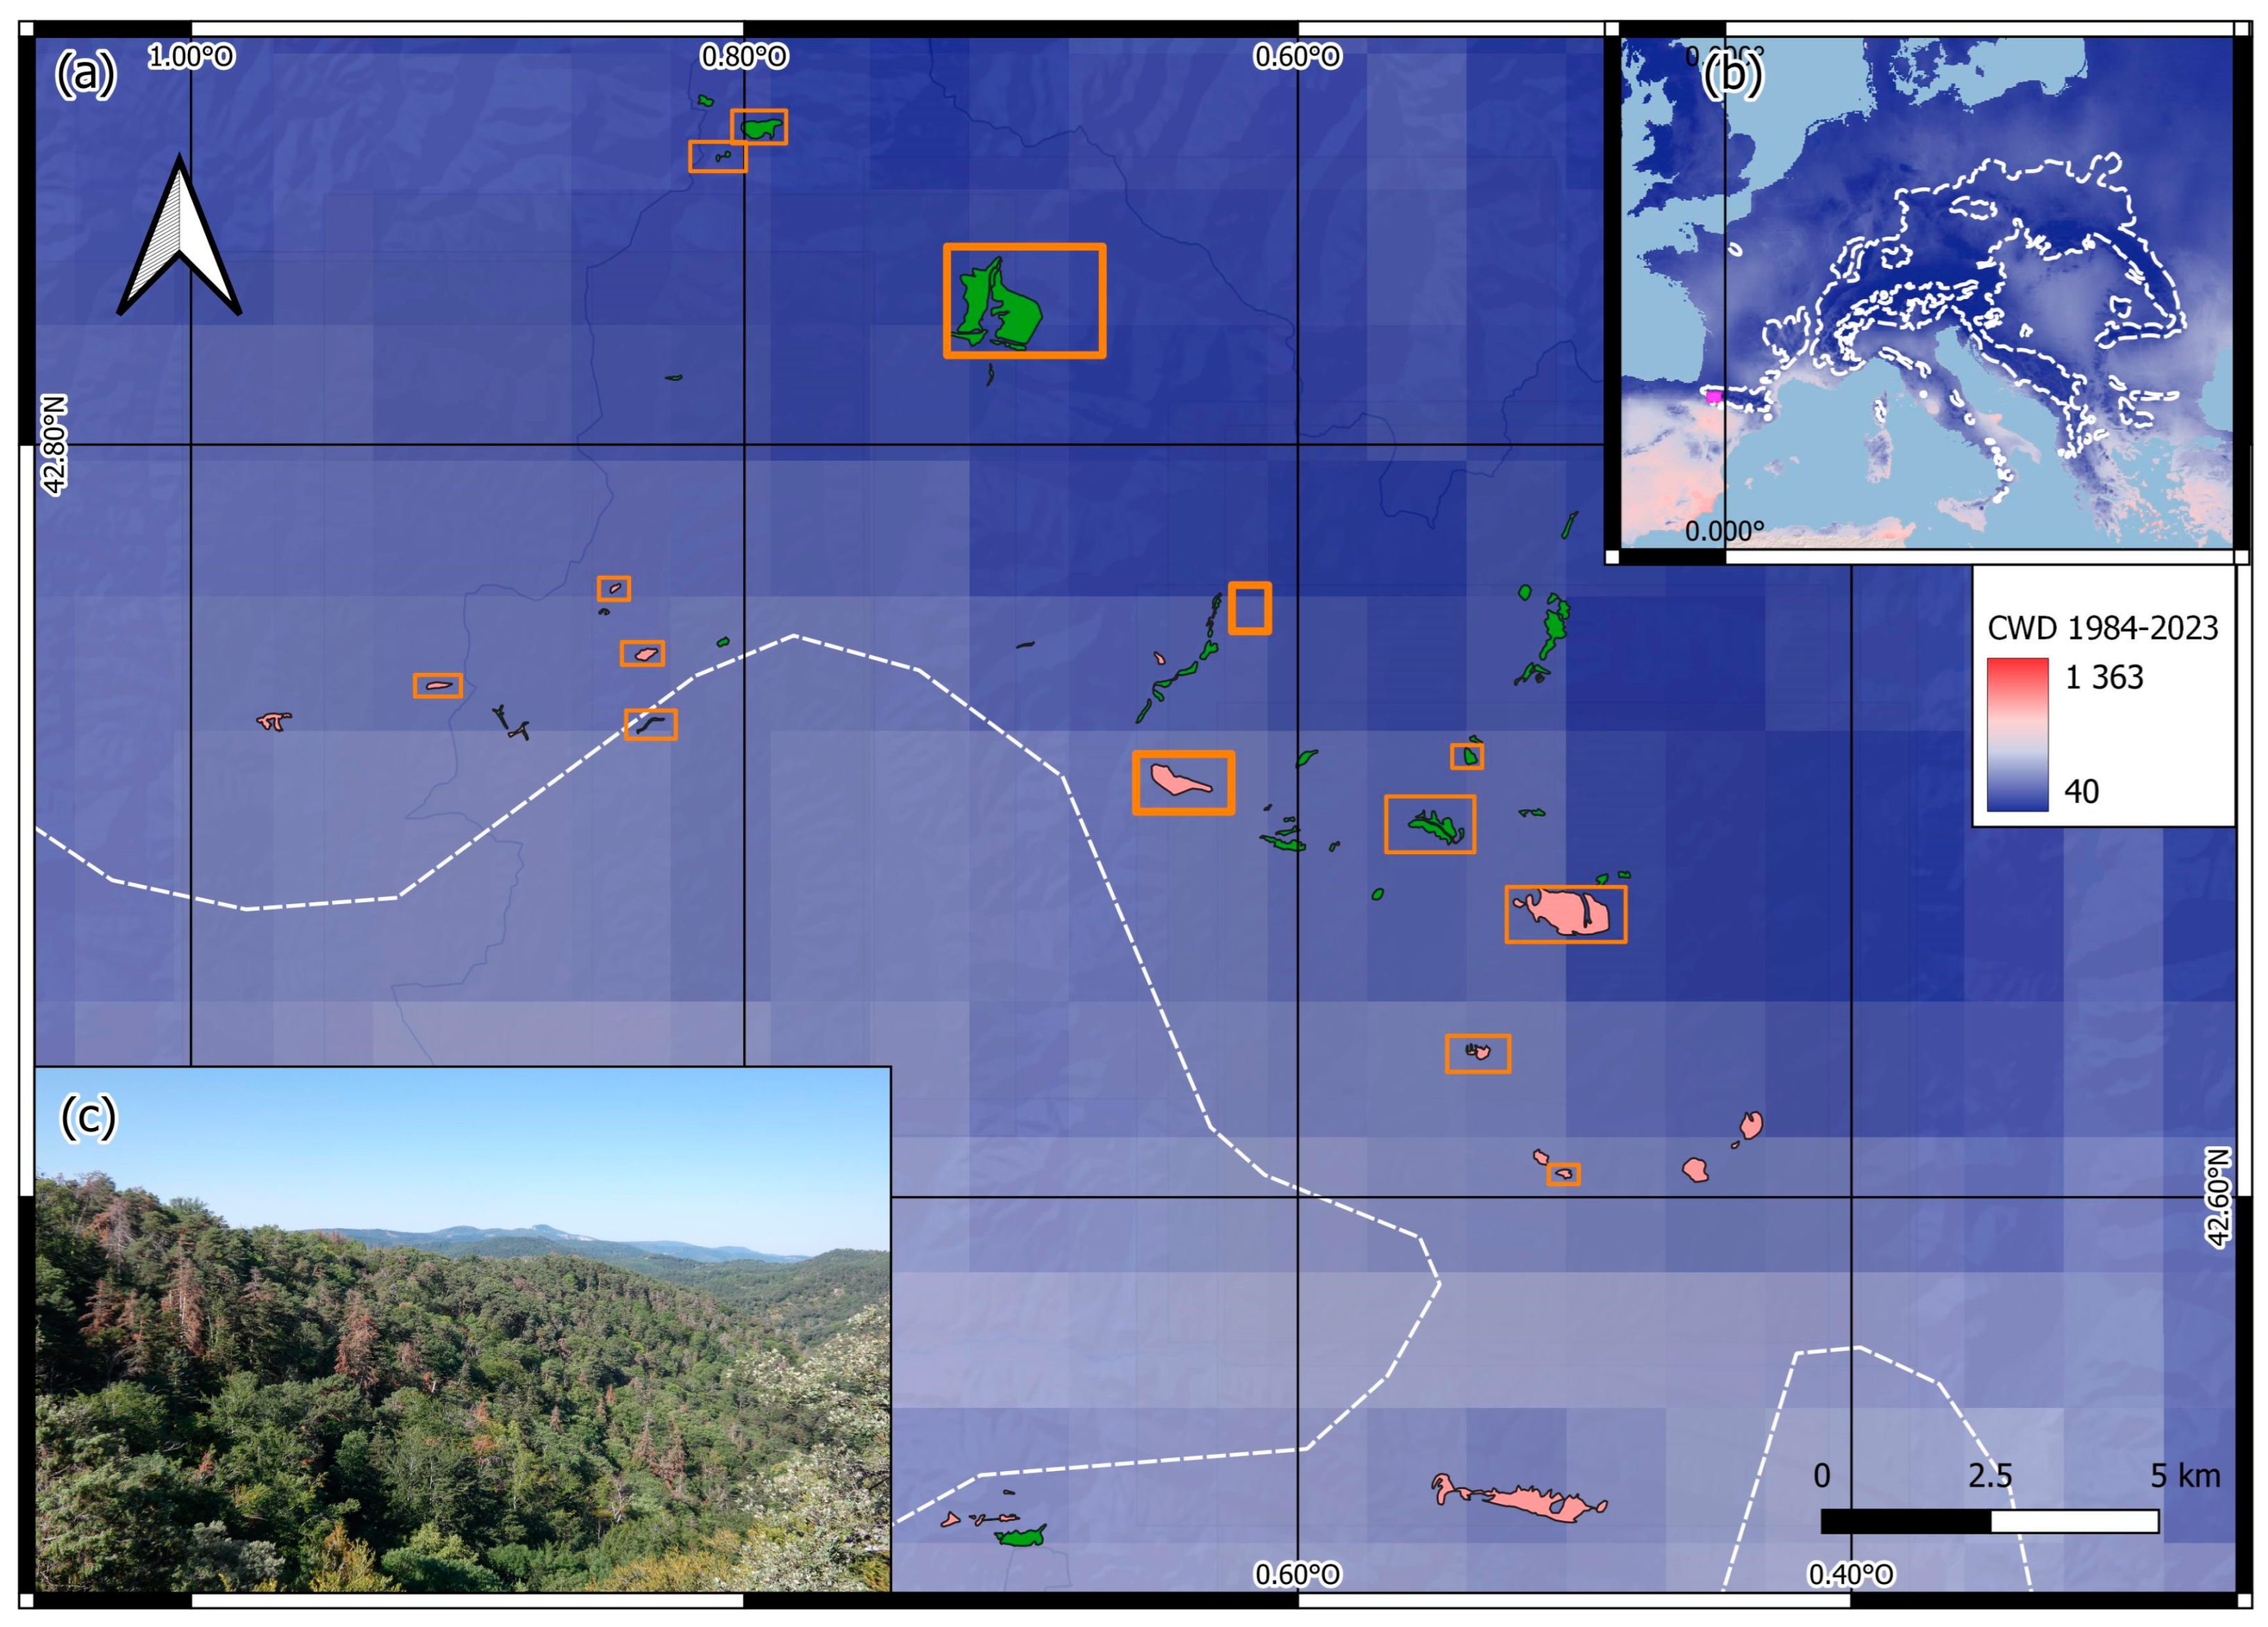
2.1. Study Sites and Field Sampling

The study was conducted on montane, mixed to pure silver fir stands from the western Spanish Pyrenees, located at the southwestern limit of the species’ distribution in Europe (Figure 1). These populations typically inhabit mesic, north-facing slopes, forming pure or mixed forests with European beech (Fagus sylvatica L.) or Scots pine (Pinus sylvestris L.), with understory vegetation dominated by shrubs like European box (Buxus sempervirens L.). The climate in the study area is continental, with relatively cool and wet summers. The mean annual temperature range is 8.0–12.5 °C, and the total annual precipitation varies between ca. 900 and 1800 mm. Our study was based on 62 fir stands classified as declining (D) and non-declining (N) by forest technicians of the Aragón Government (Figure 1, Supplementary Materials Table S1). The separation between D and N stands was based on the abundance of dead and defoliated trees at the stand level during 2023–2024.
We validated the classification of the Aragón Government with 16 stands that were previously sampled in 2000 [10,46] and 2020–2024 [19] by our team. During 2000 and 2024, declining and non-declining silver fir stands were selected for field sampling to assess their vigor and to obtain growth data (tree-ring width) using dendrochronological methods [47]. In each site, a 100 m long and 10 m wide transect was sampled across a representative zone of the stand. Using the point-centered quarter method [48], four trees were manually selected every 10 m along the transect, prioritizing dominant and co-dominant individuals to best represent the main structural and vigor conditions of the stand. The trees sampled in both the declining and non-declining stands were predominantly mature, with ages ranging between 90 and 150 years. Their diameter at 1.3 m was measured. Their crown defoliation was visually assessed, and declining trees were considered as those having >50% defoliation. Dead trees were considered as those having no living branches or needles. Two cores per tree were taken from 10–20 trees per stand, and mean tree-ring widths (period 1984–2000) were calculated for each stand using dendrochronological methods (Table S2). With this information, the percentage of defoliation of the stand was calculated as the proportion of trees with a crown defoliation higher than 50%.

2.2. Climatological Data

Long-term climatological records were retrieved from the TerraClimate database [49]. This dataset provides a ~4 km (1/24th degree) spatial resolution of monthly climate data, covering a time period from 1958 to the present. We obtained maximum temperature (Tmax), minimum temperature (Tmin), precipitation (PPT), vapor pressure deficit (VPD), climatic water deficit (CWD; a proxy of drought stress based on the evaporative demand that is not met by available water, soil moisture and potential evapotranspiration (PET). To assess drought severity, the Standardized Precipitation–Evapotranspiration Index (SPEI) was calculated at 1-, 3- and 12-month-long resolutions using the package SPEI in R [50]. Drought events were defined as periods with SPEI values below −1 [51]. Then, we identified the decades during which these droughts occurred by counting the number of years with SPEI values below −1 in each decade, to assess whether their frequency increased over time. Multi-scalar drought indices, such as the SPEI, are effective in monitoring drought impacts on growth and vegetation indices [52].
The selection of climate variables for this study was based on their ecological significance and influence on vegetation dynamics. Temperature and precipitation are the most basic and commonly used metrics; however, recent studies have suggested that vapor pressure deficit (VPD) plays a critical role in forest vegetation dynamics, since high VPD can increase transpiration [53,54,55,56,57]. Climatic water deficit (CWD) is another key variable, serving as an indicator of drought stress in forest ecosystems [56]. The Standardized Precipitation-Evapotranspiration Index (SPEI) has been widely used to monitor drought impacts on various forests ecosystems, as it effectively captures changes in both moisture supply and atmospheric demand [57]. Thus, VPD, CWD and SPEI, along with temperature, precipitation and soil moisture, were selected to provide a comprehensive assessment of the climatic factors influencing forest health over the study period.

2.3. Remote Sensing Data and Vegetation Indices

To obtain EVI and NDVI time series for the study sites, we used Google Earth Engine (GEE) [58] to implement the “Best Available Pixel” (BAP) compositing method, which allows for the creation of annual image composites by integrating data from multiple sensors and Landsat satellites [59]. This method selects the optimal observation for each pixel from all the available Landsat-5 TM, Landsat-7 ETM+, Landsat-8 OLI and Landsat-9 OLI-2 images, ensuring high-quality data for large spatial extents over time. Selected images were atmospherically corrected based on surface reflectance values [60], with a spatial resolution of 30 m for the bands used in the analysis.
Following [59], each pixel of observation was scored according to the day of acquisition, cloud cover, proximity to clouds and shadows, and sensor type. For our study, we used data for the period 1984–2023, selecting observations within a 105-day window centered on day-of-year (DOY) 166 (June 15), which corresponds to the greenness peak in the growing season (DOY 60–273). We also applied gap-filling procedures to address missing data, and implemented a BAP algorithm to remove outliers and anomalies above defined thresholds. The EVI [25] and NDVI [24] were computed through the BAP process to produce site-specific time series for subsequent analyses. The BAP algorithm was parameterized with the following settings: target day = June 15, day range = 105, cloud threshold = 40%, SLC-off penalty = 0.7, opacity score range = 0.2–0.3, maximum cloud distance = 1500 m, threshold = 0.65, and start and end years from 1984 to 2023.

2.4. Statistical Analyses

Independent t-tests were calculated to compare the NDVI and EVI annual mean values and the climate variables between D and ND stands. To examine climatic trends in D and ND stands, linear regressions were fitted. For each climate variable, we fitted a model using the calendar year as an explanatory variable and considering the period of 1984–2023. The climatic variables considered were Tmax, Tmin, precipitation, CWD, soil moisture and VPD. Subsequently, ANCOVA tests were conducted to compare the slopes of trends between D and ND stands. To analyze changes in drought severity, the regional SPEI was analyzed for 3- (seasonal SPEI) and 12-month (annual SPEI) long scales. Drought events were defined as SPEI values below -1. Following this selection, we identified the frequency of drought events.
For each NDVI and EVI time series (1984–2023), we calculated and compared several statistics between D and ND stands: the mean, standard deviation, and 95% and 5% decile slopes. In addition, we used linear models to compare the temporal trends in EVI and NDVI between stands, as was also performed for the climatic variables.
To analyze the correlations between vegetation indices, mean annual values of NDVI and EVI, growth, defoliation and standardized monthly climate variables (Tmax, Tmin, precipitation, CWD, soil moisture, VPD, 1-month SPEI), linear regression analyses and Pearson correlations were conducted. Correlations were calculated from previous October to current August for the entire study period (1984–2023). This timeframe was chosen because it encompasses the hydrological year, which is highly relevant for assessing the impacts of climate on vegetation dynamics. Finally, climatic variables averaged or summed in the hydrological year were related to the EVI, to obtain estimates of regression coefficients for the climate variables.
All the analyses were performed using R Statistical Software version 4.4.1 [61]. The package SPEI [50] was used to calculate the drought index SPEI; for statistical analysis, including ANOVA and t-tests, we used the car package [62]; and for Pearson correlation analysis, the R base stats package was used [61].

3. Results

3.1. Characteristics of Declining and Non-Declining Silver Fir Stands

The declining (D) stands showed warmer and drier (lower precipitation and soil moisture, higher VPD and CWD) conditions than the non-declining (ND) stands (Table 1). The EVI values were also lower in the D stands than in the ND stands, but no significant difference was found for the NDVI values, although they were also lower in the D stands. Radial growth was also lower in the D stands than in the ND stands. Defoliation was much higher and had increased faster in the D stands (from 18% in 2000 to 40% in 2020) than in the ND stands (from 4% in 2000 to 9% in 2020).

3.2. Climate Trends and Drought Variability

We found a significant positive linear trend in temperature and also in VPD and CWD (Figure 2) over time, while precipitation and soil moisture showed no significant changes (Supplementary Materials, Figure S1). The ANCOVAs showed that both D and N stands experienced similar warming rates (Supplementary Materials, Tables S3–S8). We also detected an increase in the frequency of drought events in both D and N stands, particularly during spring (Supplementary Materials, Figures S2 and S3).

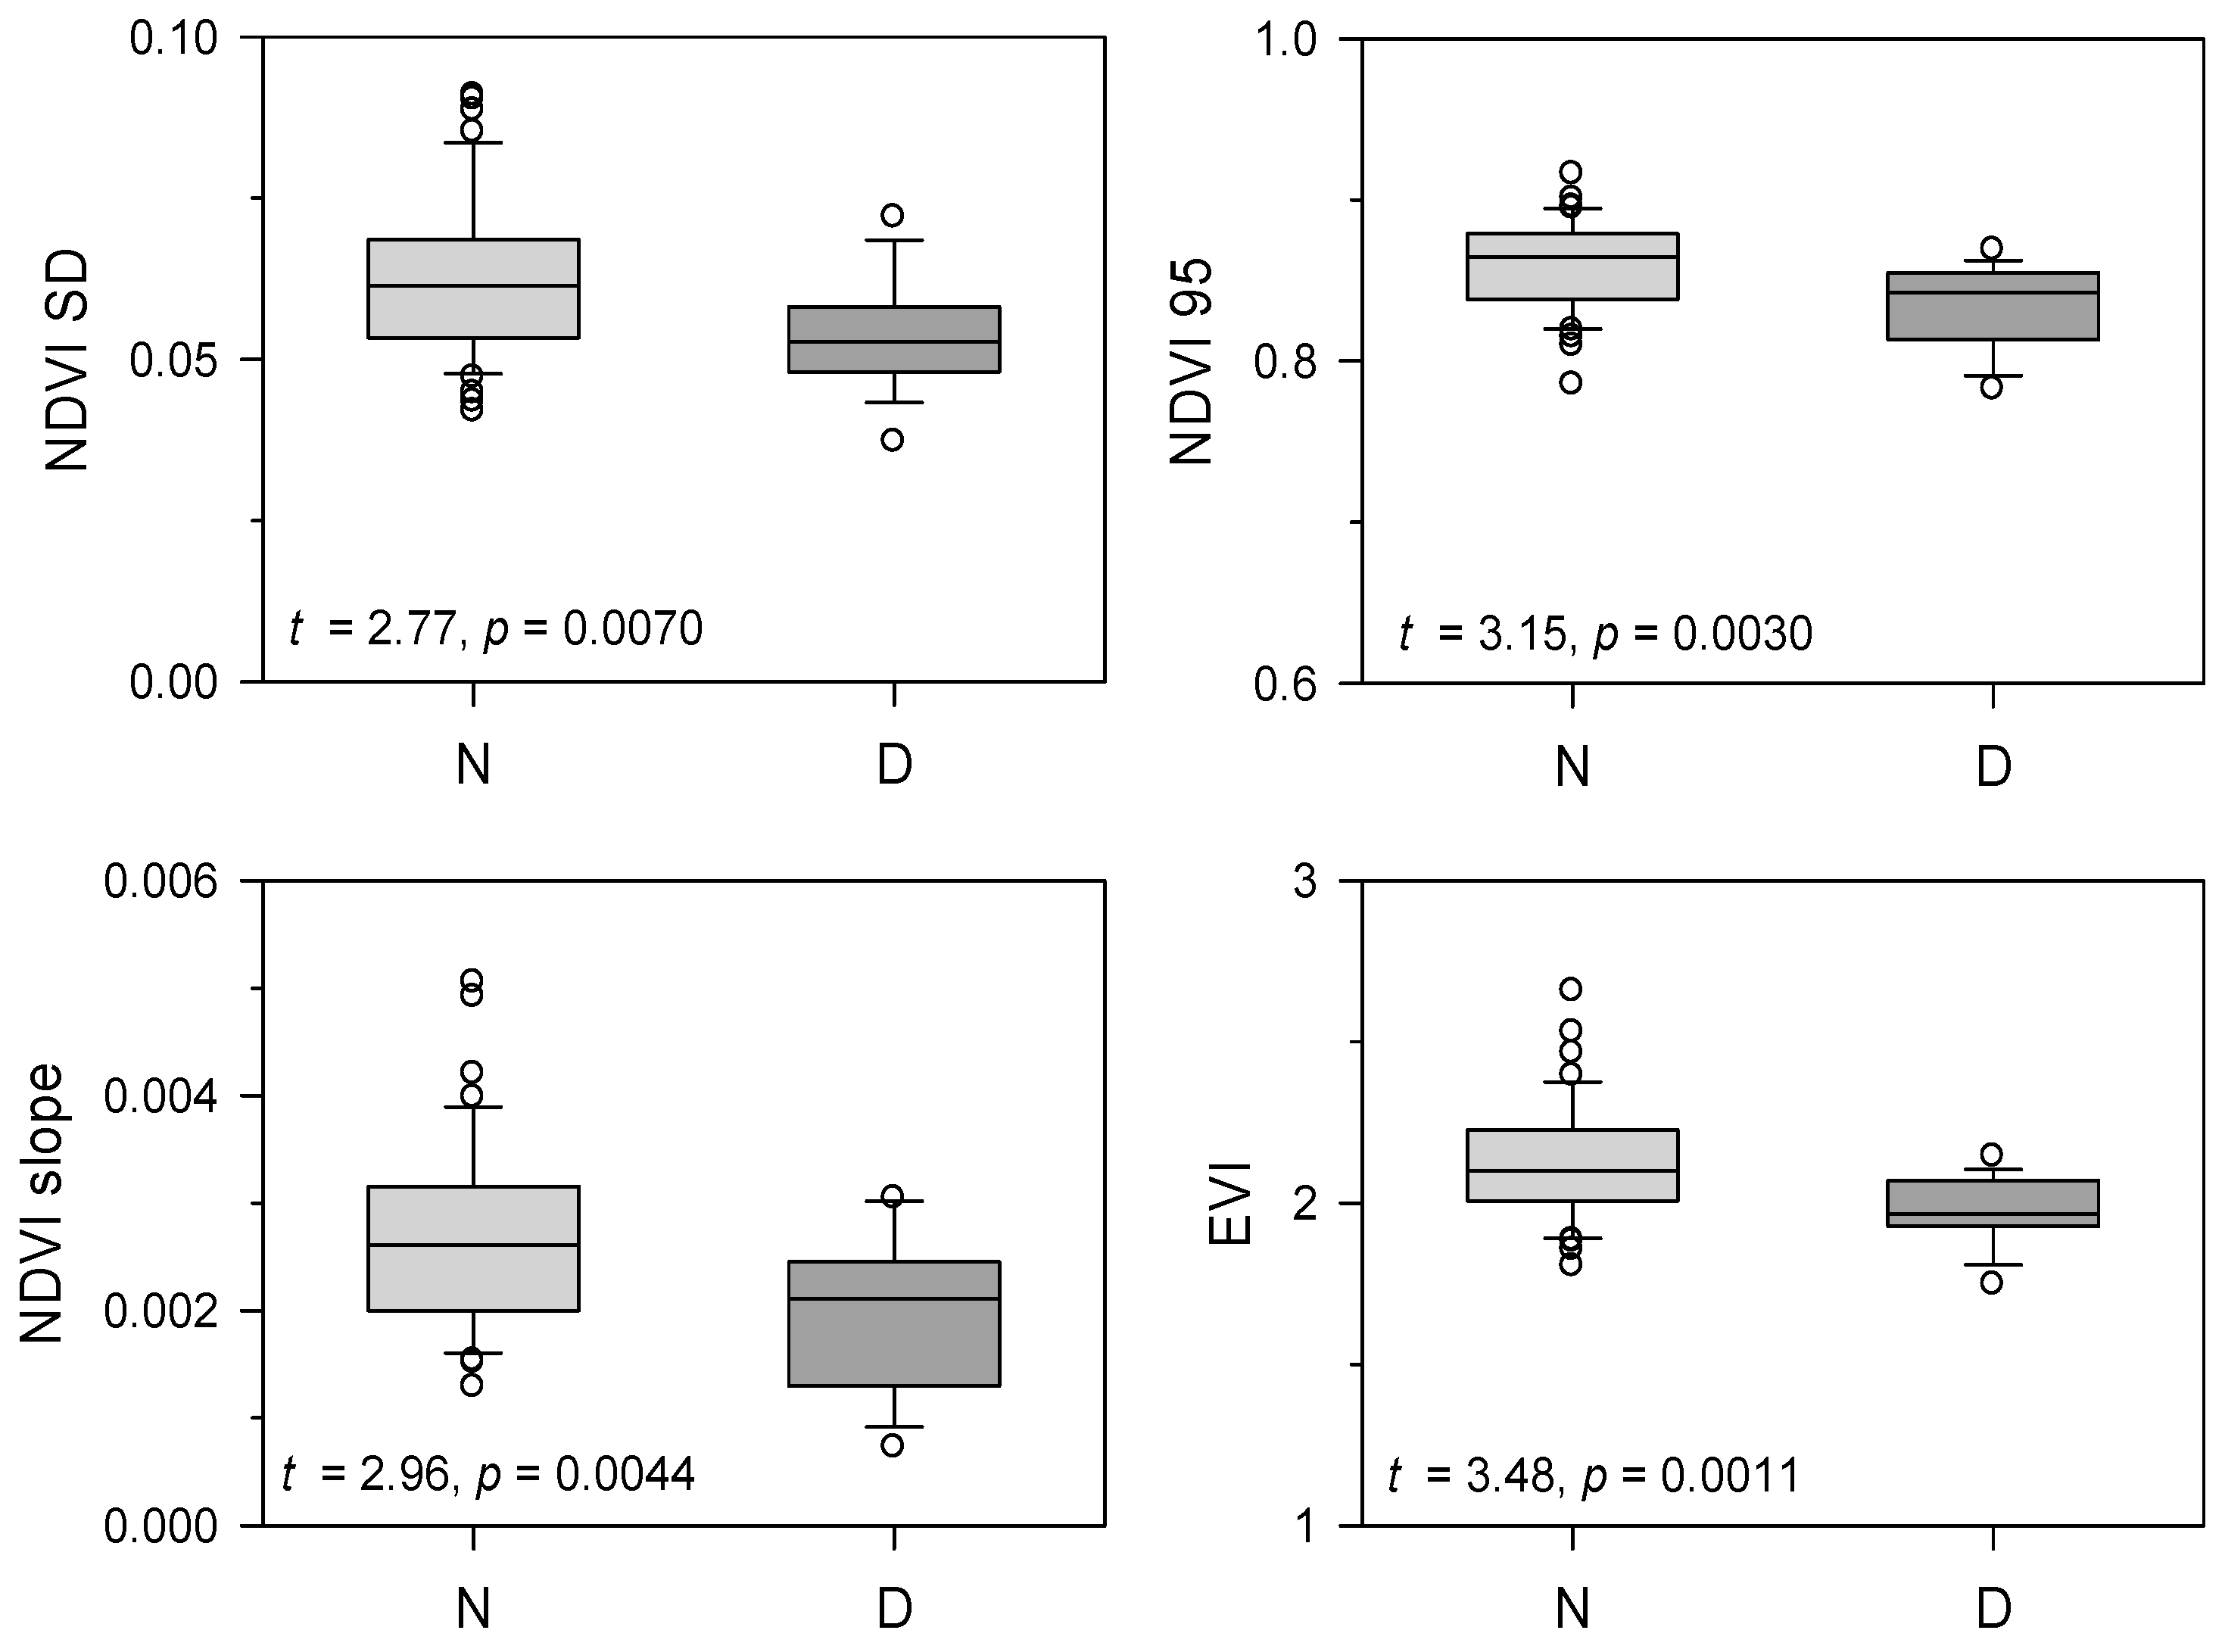
3.3. Comparing Vegetation Indices Between Declining and Non-Declining Stands

The N stands showed a higher mean EVI compared to the D stands (Figure 3), but also higher values of NDVI standard deviation, NDVI 95th value, and NDVI slope.
Both stand types exhibited fluctuations in EVI over the study period, with N stands consistently showing higher EVI values compared to D stands (Figure 4). The most pronounced divergence between the two groups occurred during the 1990s and early 2000s, and after the severe 2012 drought both stand classes experienced a notable reduction in EVI. The NDVI showed a clear tendency of increase, but showed no differences between the D and N stands except for after the year 2012 (Figure S4).

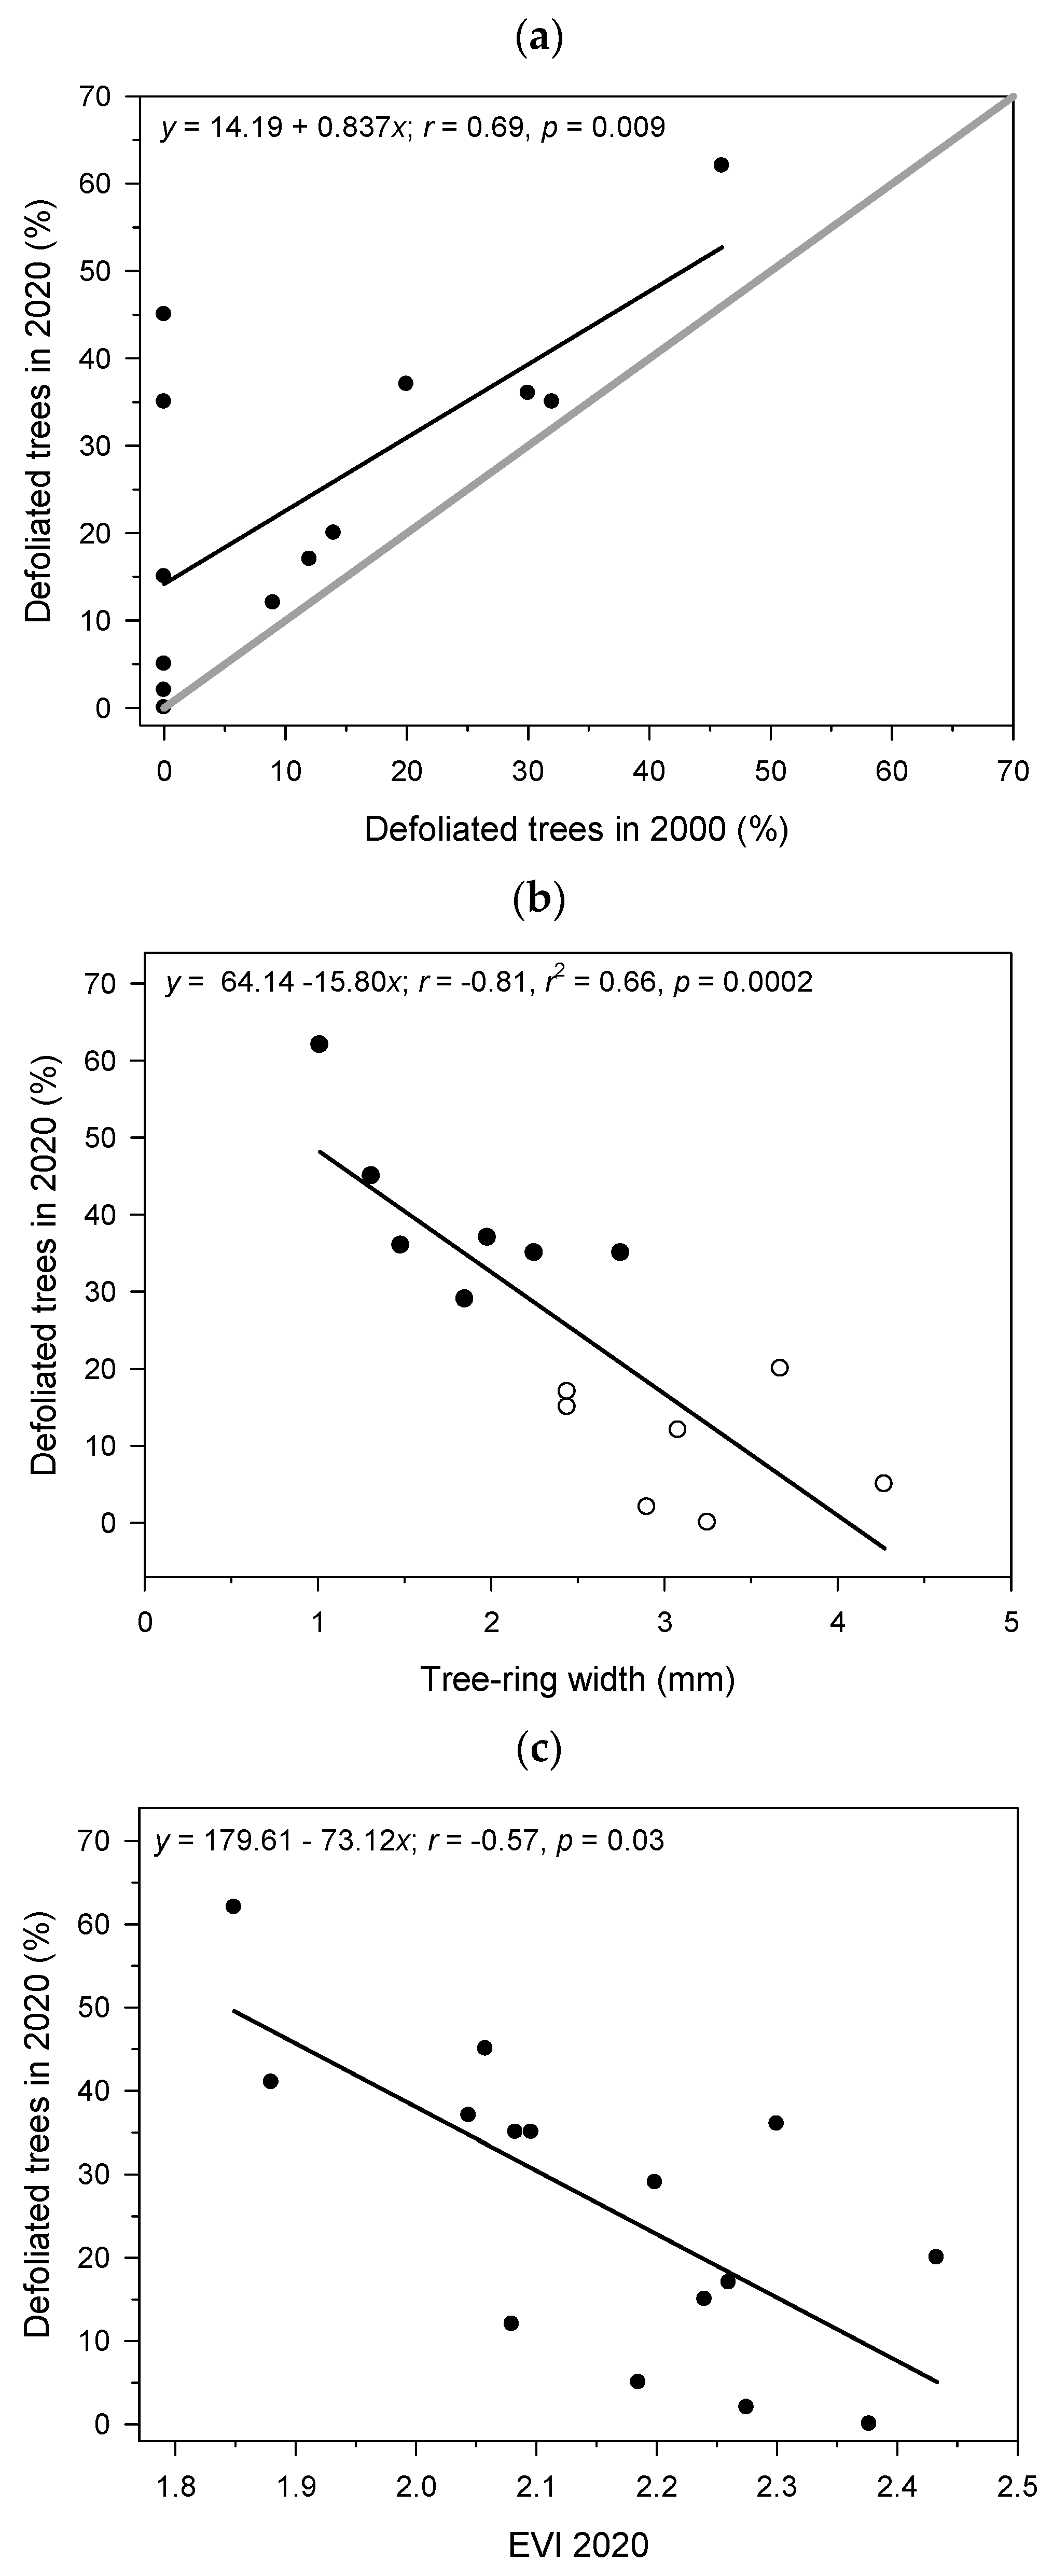
3.4. Relationships Between EVI and Stand Defoliation

We found that stands with higher defoliation in the 2000s were also more defoliated in the 2020s (Figure 5a). In addition, there was a negative relationship between tree-ring width and defoliation in 2020, showing that trees with narrower rings, which indicate reduced growth, were more severely defoliated (Figure 5b). Finally, there was another negative correlation between EVI and defoliation values in 2020 (Figure 5c).

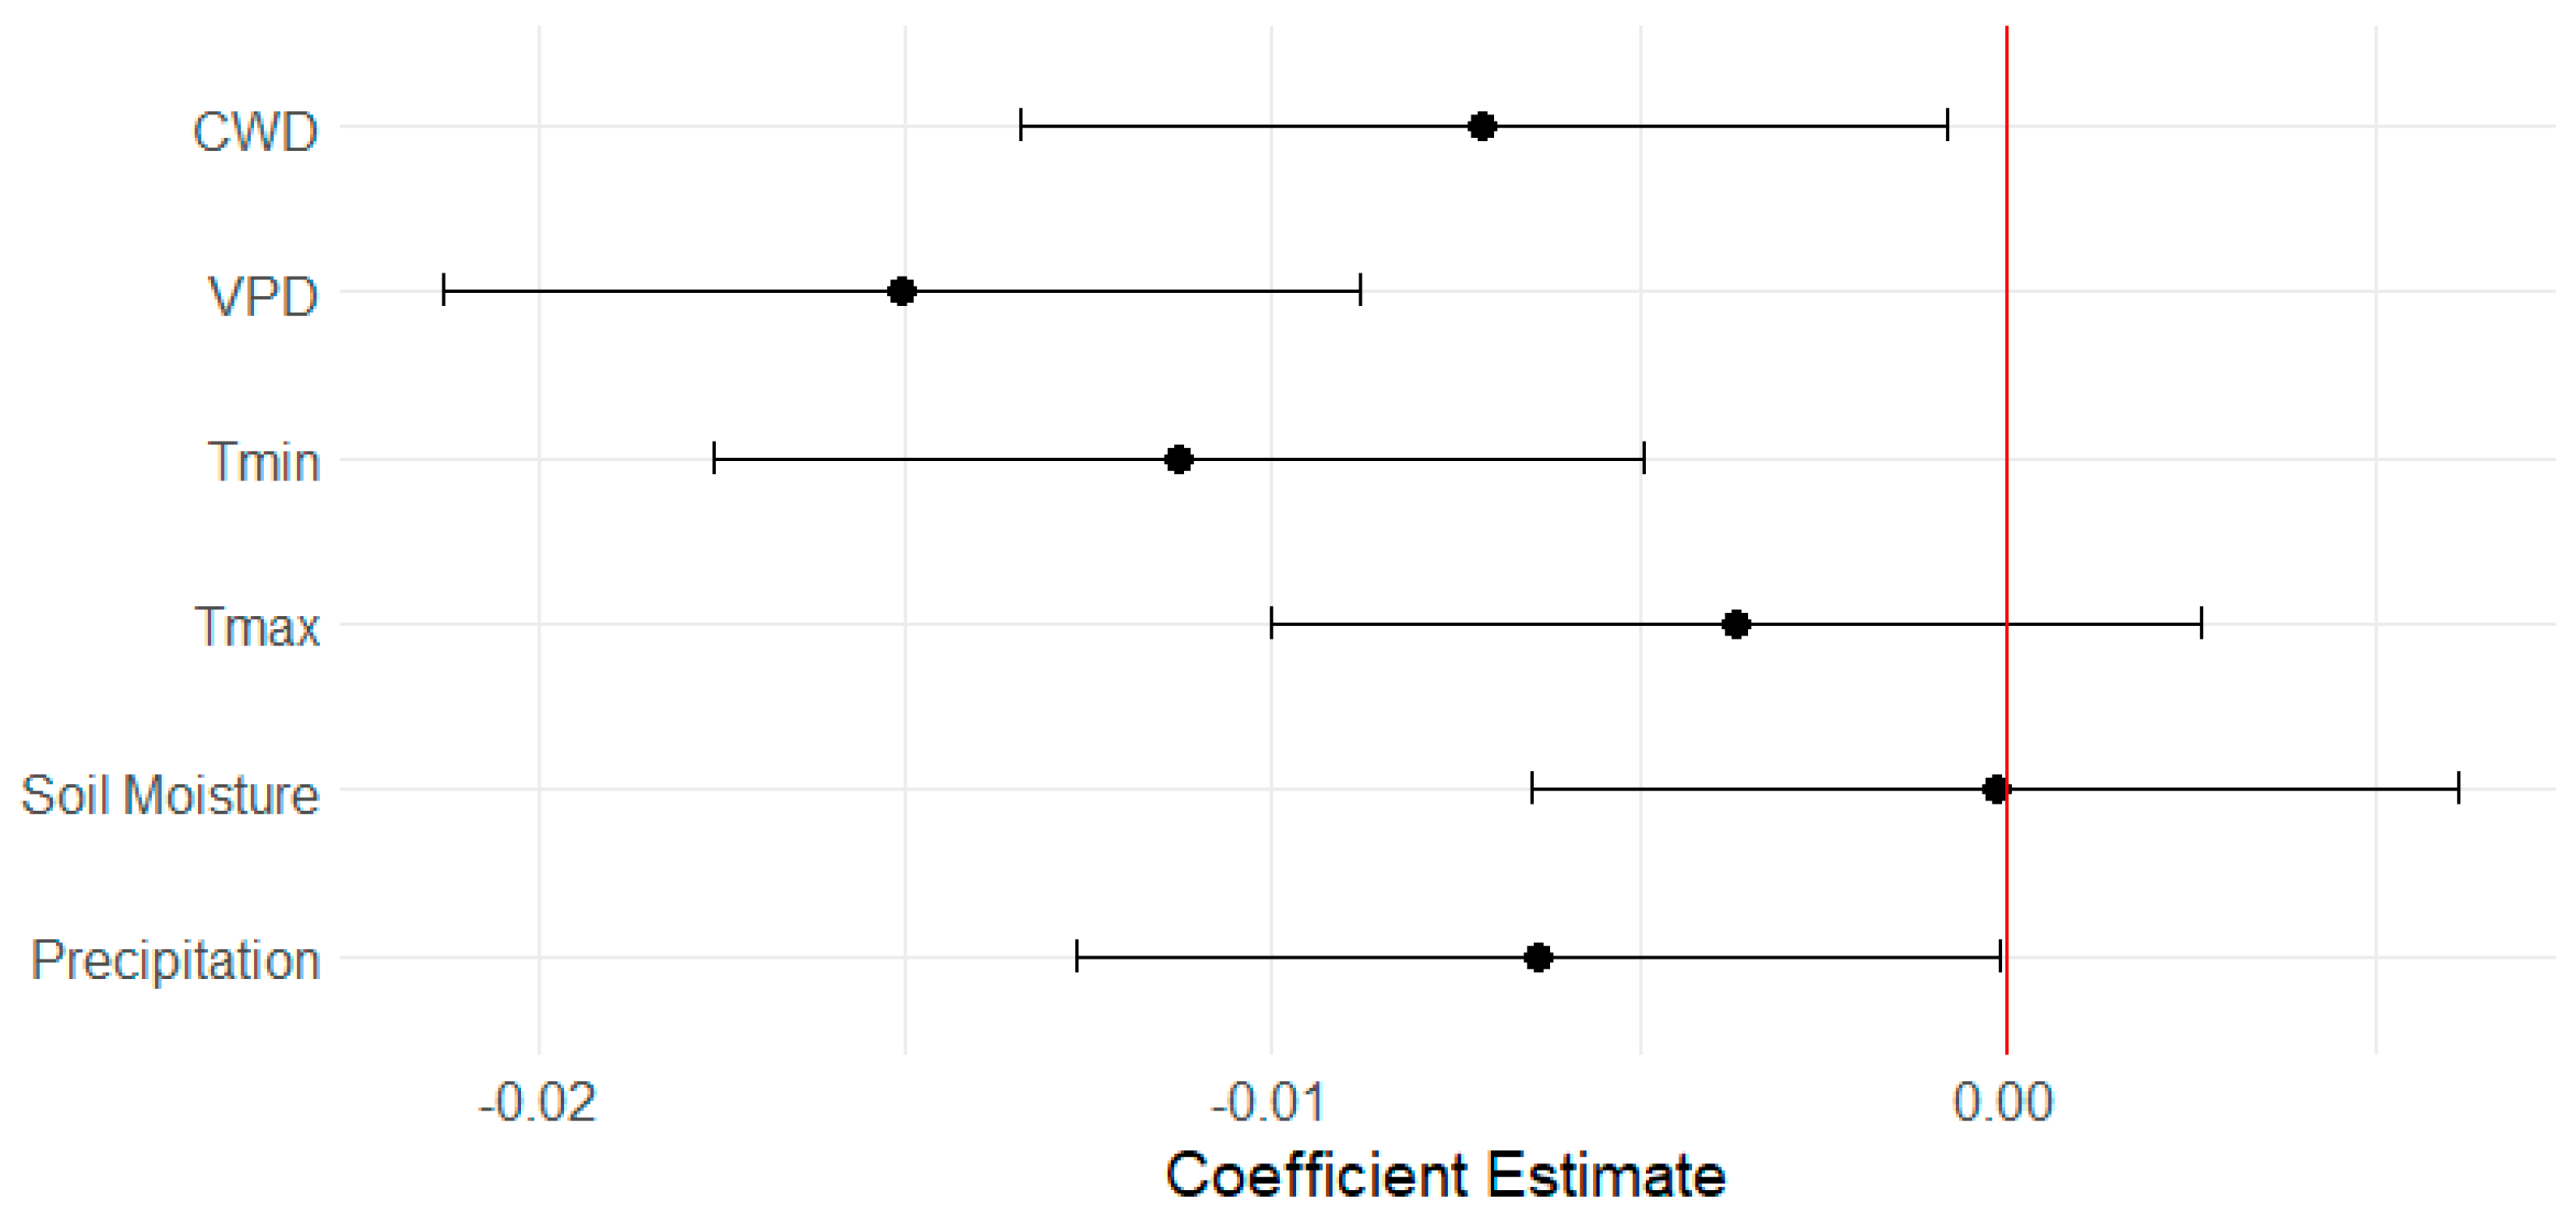
3.5. Responses of EVI to Climate Variables

Significant negative relations were observed between EVI and VPD, Tmin and CWD (Figure 6), indicating that stands in warmer temperatures and drier atmospheric conditions displayed lower EVI values.
In the case of correlation analyses for the period of 1984–2023, we found different climate sensitivity of the EVI between vigor classes, with a negative influence of May VPD and 1-month SPEI on the EVI in D stands (Figure 7). In contrast, N stands exhibited a negative influence of July temperatures (Tmax and Tmin) and August VPD on the EVI. Both the D and N stands shared a positive effect from the January SPEI on the EVI.

4. Discussion

4.1. Comparison of NDVI and EVI Between Stands of Different Vigor

The assessment of forest health through remote sensing techniques has gained significant attention in recent years because of its spatial extent and readability [63]. In our comparative analysis, we found differences between silver fir stands of different vigor in NDVI and EVI spatial characteristics (Figure 3). However, the EVI reflects differences in temporal trends better than the NDVI (Figure 4), likely due to the EVI ability to reduce atmospheric and canopy background noise [22,33,43]. Thus, we validated the findings based on the EVI with field stand data regarding canopy defoliation and tree growth (Figure 5).
Although the NDVI has been widely used, it may not fully capture the complex responses of mountain mixed forests due to its limitations, such as saturation problems caused by atmospheric and canopy background noise [22,43,52]. These limitations can introduce uncertainty in the monitoring of forest health. In our study, the NDVI detected some differences between declining and non-declining stands when comparing statistics calculated over the entire temporal period (Figure 3). That is, non-declining stands had a more stepped increase in NDVI values, which was also more variable in time, than declining stands, which, in general, presented lower values. Assuming that canopies are denser in non-declining stands, this higher variability might indicate a more active response to temporal variations in drought [23].
However, the NDVI did not show clear differences between declining and non-declining silver fir stands when comparing the temporal trends in the period of 1984–2023. This could be attributed to the structural and phenological heterogeneity of silver fir stands, which often form mixed forest compositions. As previously mentioned, these conditions may exacerbate the NDVI’s limitations due to increased background noise, such as exposed soil or shadows, further emphasizing its constraints. This finding aligns with similar results from the authors of [64], who found that the NDVI in Siberian larch forests did not increase appreciably with forest cover, and concluded that increasing NDVI values could correspond to increases in understory vegetation.
Our results highlight the limitations of the NDVI in capturing subtle differences in forest health under complex forest structures, suggesting that the EVI is a more robust tool for monitoring temporal dynamics and early signs of decline in silver fir stands.

4.2. Relationship of NDVI and EVI with Vigor Field Data

Our results highlight the potential of remote sensing indices, particularly the EVI, to monitor forest health by capturing physiological responses to environmental stressors such as elevated VPD and low soil water availability. A high VPD leads to a higher atmospheric water demand and reduces stomatal conductance, thus limiting carbon assimilation, whereas prolonged drought stress leads to defoliation and growth decline [53,56]. Unlike the NDVI, the EVI has a lower sensitivity to saturation effects, which allows it to better capture stress-induced changes in canopy greenness and cover [22,43,52]. These processes of vigor loss, which include decreased photosynthetic rate, often precede growth decline and tree death, making the EVI an effective early warning indicator of forest stress [44].
In our study, the EVI clearly distinguished between declining and non-declining stands, thus being a more reliable indicator of forest health and a promising variable for detecting early warning signals of impending dieback. We found marked differences in mean EVI over time, which were also evident when comparing the temporal series, in contrast to what was found for the NDVI (compare Figure 4 and Figure S4). Moreover, these temporal trends were linked to differences in climate conditions both in space and time.
Nevertheless, the body of studies that have proven the utility of NDVI and vegetation indices in forest health monitoring [35,42] and our findings indicate that while vegetation indices can serve as indicators of forest health, they should be used in conjunction with other proxies or measures to gain a more robust and comprehensive understanding of long-term changes in forest vigor.
In other studies related to forest mortality [7], the negative NDVI anomalies during mortality events were significant, but often obscured by large-scale greening trends over time at coarse spatial resolutions. Similarly, in our study, positive trends in the NDVI, despite the vitality of the stand, are in accordance with the results of other studies which have found a prevalence of greening in Spain (e.g., [23,65]). However, it is important to note that since the period of 2016–2019, there has been a change in the NDVI trend (Figure S4), which may indicate saturation or declining carbon accumulation capacity [66]. However, more time will be required to determine whether these forests have reached saturation, or if they are still capable of accumulating carbon, as suggested in previous studies [23].
While the EVI demonstrates clear advantages over the NDVI in terms of reducing atmospheric and canopy background noise, this sensitivity also makes it more prone to external influences, such as topography [67]. These limitations underscore the need to complement remote sensing indices with field-based data to ensure accurate and reliable assessments of forest health. Combining vegetation indices with detailed stand-level measurements ensures a more robust assessment of forest health and helps to account for potential sources of error.

4.3. Climatic Factors Influencing Vegetation Indices

The climate sensitivity and decline of silver firs at the southern limit of their distribution has been extensively studied, mostly using tree-ring data [15]. One predominant factor is their increasing vulnerability to warmer and drier conditions, leading to high water evaporative demand [19,46]. Our study revealed that the EVI reflects these responses, as declining stands showed a negative relationship with SPEI and VPD in late spring, coinciding with peak productivity and growth, while non-declining stands exhibited a negative relationship with summer temperatures and VPD. These different responses suggest that non-declining stands are becoming more responsive to late-summer water shortages, one of the main triggers of dieback in this species [10], whereas declining stands respond to drought in the early growing season. Such a dissimilar sensitivity to climate suggests that some of the non-declining stands could show a loss of vigor, growth decline, and increased defoliation and mortality rates if the climate keeps warming and drying, particularly in late summer, in the study region. This might explain the extraordinary drop in the EVI of non-declining stands observed after the year 2012 (Figure 4), when an extraordinary drought impacted silver fir stands [68].
Interestingly, while the EVI showed moderate climate sensitivity, aligning with the known vulnerabilities of silver fir to drought and atmospheric dryness, the NDVI variability did not reflect relevant climate signals, and was limited to positive correlations with temperature and precipitation during specific months, without clear differences between declining and non-declining stands (Figure S5). Other studies found similar results, showing changing and weak relationships between the NDVI and climate variables under non-stationary conditions [66], and even an inability to capture detailed climate-driven trends in Spanish ecosystems [65]. This highlights the limitations of NDVI in accurately reflecting relationships with climatic variables, emphasizing the need to complement it with other indices, such as the EVI, and field-based measurements for a more accurate assessment.
Several studies have shown that vegetation indices are less sensitive to climate extremes such as droughts than defoliation and tree-ring width data [52,69], and are also less resilient to droughts [41], especially in seasonally dry Mediterranean forests. For example, the authors of [23] noted that trends varied depending on species’ drought tolerance, with stronger correlations were observed in drought-avoiding species. Despite the NDVI strongly correlates with tree-ring width in summer, it may be less accurate in assessing forest decline due to other environmental factors [43]. In fact, it was found that the EVI is more sensitive to climate factors than tree-ring width in spruce forests across the Tibetan Plateau [70]. These diverse findings confirm the necessity to compare vegetation indices with field assessments of forest health, which could be obtained using monitoring plots but also by operating Unmanned Aerial Vehicles (UAV).
The observed differences in vegetation indices between declining and non-declining stands are influenced by their climatic conditions, as declining stands are typically located at lower elevations with warmer and drier conditions, highlighting the role of drought stress as a primary driver of forest dieback. The differences in the EVI between declining and non-declining stands could be linked to stress factors, such as atmospheric dryness and water shortage, linked to warming trends. The EVI showed strong drops in 1986 and 2013, after severe droughts, suggesting that it was responsive to extreme climatic events, even in the relatively mesic conditions of the study area. The 1986 drought is considered a “point of no return” for the decline of several silver fir stands in the Western Pyrenees [68], and the 2012 drought was characterized by triggering severe growth reductions and tree mortality events in forests across Spain [2,41]. Moreover, our findings mirror analyses, based on correlations between climate and growth, which showed that silver fir dieback was triggered by a negative water balance during the previous late summer, and by low soil moisture levels during the growing season [19]. This is also consistent with our findings showing that the SPEI (soil drought) and VPD (atmospheric drought) exerted negative influences on the EVI in declining stands during spring. This suggests that short-term droughts, particularly at the end of the growing season, have a significant impact on silver fir growth and greenness as measured by the EVI, likely exacerbated by the increase in hot drought events during spring. Non-declining stands, however, showed negative correlations with summer temperature and VPD, which aligns more closely with the climatic responses observed in dendrochronological analyses. The higher defoliation found in stands showing dieback that presented warmer and drier conditions confirms the great sensitivity of silver fir growth to spring–summer drought stress [46]. A similar effect of climate on silver fir cover and greenness is demonstrated by the negative influences of CWD and VPD on the EVI, reinforcing the hypothesis that declining stands have experienced greater environmental stress over time.

5. Conclusions

This study has important ecological and methodological implications. On the one hand, our results demonstrate that the increase in canopy defoliation and tree mortality observed in silver fir forests in the western Pyrenees after the 1980s impacts on the canopy activity at the stand (pixel) level. Thus, the deterioration of trees due to the occurrence of higher temperatures, increasing vapor pressure deficit and lower soil water availability limits the capacity of the stand to capture and store carbon. On the other hand, our results suggest that the information provided by different vegetation indices is complementary, rather than exclusive. EVI temporal trends fully capture the differences between declining and non-declining stands during the past 40 years, and reflect short-scale temporal variations in response to drought and heat anomalies. Conversely, the NDVI presents a marked increase over time that is more intense in non-declining stands, but a saturation in this trend over the past few years is also suggested, when declining and non-declining stands also started to separate.
Given that the EVI reflects differences between vitality classes over longer periods and captures the early responses of stands to climatic stress, it is preferable over the NDVI when the aim is to detect early warning signals of forest dieback. However, vegetation indices have inherent limitations, and should be analyzed with caution and supported by field data for accurate interpretation. When combined with field-based validation, the EVI can provide valuable insights for identifying vulnerable stands and guiding interventions to mitigate forest decline. Nonetheless, due to the regional scope of our study, further research on different environments and forest types is essential to validate the broader applicability of the EVI over the NDVI in forest health assessments.

Supplementary Materials

The following supporting information can be downloaded at https://www.mdpi.com/article/10.3390/rs16234564/s1, Table S1: Mean characteristics and location of silver fir stands analyzed under vegetation indices; Table S2: Mean characteristics and location of silver fir stands analyzed under dendrochronological methods; Table S3: Summary of vapor pressure deficit (VPD) ANCOVA results; Table S4: Summary of climatic water deficit (CWD) ANCOVA results; Table S5: Summary of maximum temperature ANCOVA results; Table S6: Summary of minimum temperature ANCOVA results; Table S7: Summary of precipitation ANCOVA results; Table S8: Summary of soil moisture ANCOVA results; Table S9: Relevant results of climatic variables t-tests between declining and non-declining sites; Figure S1: Long-term climatic trends for declining (D) and non-declining (N) silver fir stands from 1984 to 2023; Figure S2: Drought event frequency by decade for declining (D) and non-declining (N) silver fir stands in the hydrological year, from 1985 to 2024; Figure S3: SPEI 1, 3 and 6 in declining and non-declining stands; Figure S4: Long-term trends in NDVI (Normalized Difference Vegetation Index) for declining (dieback) and non-declining (no dieback) silver fir stands from 1984 to 2023; Figure S5: Monthly correlations calculated between the 1-month SPEI drought index or climatic variables (VPD, CWD, Tmax, Tmin, precipitation, soil moisture, SPEI) and the NDVI for declining (D) and non-declining (N) silver fir stands.

Author Contributions

Conceptualization, A.G. and J.J.C.; formal analysis, J.P.C.-A.; resources, E.G.d.A., M.P., C.V., Á.R.C. and J.C.L.; data curation, M.P.; writing—original draft preparation, J.P.C.-A.; writing—review and editing, A.G., J.C.L. and J.J.C.; project administration, A.G.; funding acquisition, A.G., J.C.L. and J.J.C. All authors have read and agreed to the published version of the manuscript.

Funding

This research was funded by the Spanish Science and Innovation Ministry (projects PID2021-123675OB-C43 and TED2021-129770B-C21).

Data Availability Statement

The dataset is available on request from the corresponding author.

Acknowledgments

We thank the Aragón Government and their technical staff for their work in classifying the silver fir stands, which provided essential data for this study.

Conflicts of Interest

The authors declare no conflicts of interest.

References

  1. Buras, A.; Rammig, A.; Zang, C.S. The European Forest Condition Monitor: Using Remotely Sensed Forest Greenness to Identify Hot Spots of Forest Decline. Front. Plant Sci. 2021, 12, 689220. [Google Scholar] [CrossRef] [PubMed]
  2. Gazol, A.; Camarero, J.J. Compound Climate Events Increase Tree Drought Mortality across European Forests. Sci. Total Environ. 2022, 816, 151604. [Google Scholar] [CrossRef] [PubMed]
  3. Senf, C.; Buras, A.; Zang, C.S.; Rammig, A.; Seidl, R. Excess Forest Mortality Is Consistently Linked to Drought across Europe. Nat. Commun. 2020, 11, 6200. [Google Scholar] [CrossRef]
  4. Hartmann, H.; Moura, C.F.; Anderegg, W.R.L.; Ruehr, N.K.; Salmon, Y.; Allen, C.D.; Arndt, S.K.; Breshears, D.D.; Davi, H.; Galbraith, D.; et al. Research Frontiers for Improving Our Understanding of Drought-induced Tree and Forest Mortality. New Phytol. 2018, 218, 15–28. [Google Scholar] [CrossRef]
  5. Thonfeld, F.; Gessner, U.; Holzwarth, S.; Kriese, J.; Da Ponte, E.; Huth, J.; Kuenzer, C. A First Assessment of Canopy Cover Loss in Germany’s Forests after the 2018–2020 Drought Years. Remote Sens. 2022, 14, 562. [Google Scholar] [CrossRef]
  6. Alibakhshi, S. A Robust Approach and Analytical Tool for Identifying Early Warning Signals of Forest Mortality. Ecol. Indic. 2023, 155, 110983. [Google Scholar] [CrossRef]
  7. Yan, Y.; Piao, S.; Hammond, W.M.; Chen, A.; Hong, S.; Xu, H.; Munson, S.M.; Myneni, R.B.; Allen, C.D. Climate-Induced Tree-Mortality Pulses Are Obscured by Broad-Scale and Long-Term Greening. Nat. Ecol. Evol. 2024, 8, 912–923. [Google Scholar] [CrossRef]
  8. Hammond, W.M.; Johnson, D.M.; Meinzer, F.C. A Thin Line between Life and Death: Radial Sap Flux Failure Signals Trajectory to Tree Mortality. Plant Cell Environ. 2021, 44, 1311–1314. [Google Scholar] [CrossRef]
  9. Rogers, B.M.; Solvik, K.; Hogg, E.H.; Ju, J.; Masek, J.G.; Michaelian, M.; Berner, L.T.; Goetz, S.J. Detecting Early Warning Signals of Tree Mortality in Boreal North America Using Multiscale Satellite Data. Glob. Chang. Biol. 2018, 24, 2284–2304. [Google Scholar] [CrossRef]
  10. Camarero, J.J.; Bigler, C.; Linares, J.C.; Gil-Pelegrín, E. Synergistic Effects of Past Historical Logging and Drought on the Decline of Pyrenean Silver Fir Forests. For. Ecol. Manag. 2011, 262, 759–769. [Google Scholar] [CrossRef]
  11. Caudullo, G.; Welk, E.; San-Miguel-Ayanz, J. Chorological Maps for the Main European Woody Species. Data Brief. 2017, 12, 662–666. [Google Scholar] [CrossRef] [PubMed]
  12. Balao, F.; Rios, M.; Sanchez-Robles, J.M.; Lorenzo, M.T.; Linares, J.C.; Terrab, A. Postglacial Genetic Legacies, Demography, and Climate Change: Setting Conservation Priorities for Silver Fir. bioRxiv 2024. [Google Scholar] [CrossRef]
  13. Vitasse, Y.; Bottero, A.; Cailleret, M.; Bigler, C.; Fonti, P.; Gessler, A.; Lévesque, M.; Rohner, B.; Weber, P.; Rigling, A.; et al. Contrasting Resistance and Resilience to Extreme Drought and Late Spring Frost in Five Major European Tree Species. Glob. Chang. Biol. 2019, 25, 3781–3792. [Google Scholar] [CrossRef] [PubMed]
  14. Gazol, A.; Camarero, J.J.; Gutiérrez, E.; Popa, I.; Andreu-Hayles, L.; Motta, R.; Nola, P.; Ribas, M.; Sangüesa-Barreda, G.; Urbinati, C.; et al. Distinct Effects of Climate Warming on Populations of Silver Fir (Abies alba) across Europe. J. Biogeogr. 2015, 42, 1150–1162. [Google Scholar] [CrossRef]
  15. Camarero, J.J. The Multiple Factors Explaining Decline in Mountain Forests: Historical Logging and Warming-Related Drought Stress Is Causing Silver-Fir Dieback in the Aragón Pyrenees. In High Mountain Conservation in a Changing World; Catalan, J., Ninot, J.M., Aniz, M.M., Eds.; Advances in Global Change Research; Springer International Publishing: Cham, Switzerland, 2017; Volume 62, pp. 131–154. [Google Scholar] [CrossRef]
  16. Dobrowolska, D.; Bončina, A.; Klumpp, R. Ecology and Silviculture of Silver Fir (Abies alba Mill.): A Review. J. For. Res. 2017, 22, 326–335. [Google Scholar] [CrossRef]
  17. Gazol, A.; González De Andrés, E.; Colangelo, M.; Valeriano, C.; Camarero, J.J. Pyrenean Silver Fir Forests Retain Legacies of Past Disturbances and Climate Change in Their Growth, Structure and Composition. Forests 2023, 14, 713. [Google Scholar] [CrossRef]
  18. Sangüesa-Barreda, G.; Camarero, J.J.; Oliva, J.; Montes, F.; Gazol, A. Past Logging, Drought and Pathogens Interact and Contribute to Forest Dieback. Agric. For. Meteorol. 2015, 208, 85–94. [Google Scholar] [CrossRef]
  19. Valeriano, C.; Tumajer, J.; Gazol, A.; González De Andrés, E.; Sánchez-Salguero, R.; Colangelo, M.; Linares, J.C.; Valor, T.; Sangüesa-Barreda, G.; Julio Camarero, J. Delineating Vulnerability to Drought Using a Process-Based Growth Model in Pyrenean Silver Fir Forests. For. Ecol. Manag. 2023, 541, 121069. [Google Scholar] [CrossRef]
  20. Vejpustková, M.; Čihák, T.; Fišer, P. The Increasing Drought Sensitivity of Silver Fir (Abies alba Mill.) Is Evident in the Last Two Decades. J. For. Sci. 2023, 69, 67–79. [Google Scholar] [CrossRef]
  21. Wang, J.; Sammis, T.W.; Gutschick, V.P.; Gebremichael, M.; Dennis, S.O.; Harrison, R.E. Review of Satellite Remote Sensing Use in Forest Health Studies. TOGEOGJ 2010, 3, 28–42. [Google Scholar] [CrossRef]
  22. Huete, A.; Didan, K.; Miura, T.; Rodriguez, E.P.; Gao, X.; Ferreira, L.G. Overview of the Radiometric and Biophysical Performance of the MODIS Vegetation Indices. Remote Sens. Environ. 2002, 83, 195–213. [Google Scholar] [CrossRef]
  23. Khoury, S.; Coomes, D.A. Resilience of Spanish Forests to Recent Droughts and Climate Change. Glob. Chang. Biol. 2020, 26, 7079–7098. [Google Scholar] [CrossRef] [PubMed]
  24. Rouse, J.W.; Haas, R.H.; Schell, J.A.; Deering, D.W. Monitoring Vegetation Systems in the Great Plains with ERTS. NASA Spec. Publ. 1974, 1, 309. [Google Scholar]
  25. Huete, A. A Comparison of Vegetation Indices over a Global Set of TM Images for EOS-MODIS. Remote Sens. Environ. 1997, 59, 440–451. [Google Scholar] [CrossRef]
  26. Xiao, X.; Braswell, B.; Zhang, Q.; Boles, S.; Frolking, S.; Moore, B. Sensitivity of Vegetation Indices to Atmospheric Aerosols: Continental-Scale Observations in Northern Asia. Remote Sens. Environ. 2003, 84, 385–392. [Google Scholar] [CrossRef]
  27. Fiore, N.M.; Goulden, M.L.; Czimczik, C.I.; Pedron, S.A.; Tayo, M.A. Do Recent NDVI Trends Demonstrate Boreal Forest Decline in Alaska? Environ. Res. Lett. 2020, 15, 095007. [Google Scholar] [CrossRef]
  28. Parent, M.B.; Verbyla, D. The Browning of Alaska’s Boreal Forest. Remote Sens. 2010, 2, 2729–2747. [Google Scholar] [CrossRef]
  29. Aubard, V.; Paulo, J.A.; Silva, J.M.N. Long-Term Monitoring of Cork and Holm Oak Stands Productivity in Portugal with Landsat Imagery. Remote Sens. 2019, 11, 525. [Google Scholar] [CrossRef]
  30. Vicente Serrano, S.M.; Lasanta, T.; Romo, A. Diferencias Espaciales En La Evolución Del NDVI En La Cuenca Alta Del Aragón: Efectos de Los Caminos En El Uso Del Suelo. CIG 2003, 29, 51–66. [Google Scholar] [CrossRef]
  31. Vicente-Serrano, S.M.; Beguería, S.; Lasanta, T. Diversidad Espacial de La Actividad Vegetal En Campos Abandonados Del Pirineo Central Español: Análisis de Los Procesos de Sucesión Mediante Imágenes Landsat (1984-2001). Pirineos 2006, 161, 59–84. [Google Scholar] [CrossRef]
  32. Alatorre, L.C.; Beguería, S.; Vicente-Serrano, S.M. Análisis de La Evolución Espacio-Temporal Del NDVI Sobre Áreas Vegetadas y Zonas de Riesgo de Erosión En El Pirineo Central. Pirineos 2010, 165, 7–27. [Google Scholar] [CrossRef]
  33. Xiao, X.; Hollinger, D.; Aber, J.; Goltz, M.; Davidson, E.A.; Zhang, Q.; Moore, B. Satellite-Based Modeling of Gross Primary Production in an Evergreen Needleleaf Forest. Remote Sens. Environ. 2004, 89, 519–534. [Google Scholar] [CrossRef]
  34. Lausch, A.; Erasmi, S.; King, D.; Magdon, P.; Heurich, M. Understanding Forest Health with Remote Sensing -Part I—A Review of Spectral Traits, Processes and Remote-Sensing Characteristics. Remote Sens. 2016, 8, 1029. [Google Scholar] [CrossRef]
  35. Barka, I.; Bucha, T.; Molnár, T.; Móricz, N.; Somogyi, Z.; Koreň, M. Suitability of MODIS-Based NDVI Index for Forest Monitoring and Its Seasonal Applications in Central Europe. Cent. Eur. For. J. 2019, 65, 206–217. [Google Scholar] [CrossRef]
  36. Berner, L.T.; Beck, P.S.A.; Bunn, A.G.; Lloyd, A.H.; Goetz, S.J. High-Latitude Tree Growth and Satellite Vegetation Indices: Correlations and Trends in Russia and Canada (1982–2008). J. Geophys. Res. 2011, 116, G01015. [Google Scholar] [CrossRef]
  37. Bunn, A.G.; Hughes, M.K.; Kirdyanov, A.V.; Losleben, M.; Shishov, V.V.; Berner, L.T.; Oltchev, A.; Vaganov, E.A. Comparing Forest Measurements from Tree Rings and a Space-Based Index of Vegetation Activity in Siberia. Environ. Res. Lett. 2013, 8, 035034. [Google Scholar] [CrossRef]
  38. Gallardo, V.B.; Hadad, M.A.; Roig, F.A.; Gatica, G.; Chen, F. Spatio-Temporal Linkage Variations between NDVI and Tree Rings on the Leeward Side of the Northern Patagonian Andes. For. Ecol. Manag. 2024, 553, 121593. [Google Scholar] [CrossRef]
  39. Montoya-Jiménez, L.R.; Gómez-Guerrero, A.; Pedraza-Oropeza, F.J.A.; González-Martínez, T.M.; Correa-Díaz, A. Short-Term Tree-Ring Series of Pinus Hartwegii Lindl. Taken at Ground Level Correlate to Normalized Difference Vegetation Index Series. Forests 2024, 15, 324. [Google Scholar] [CrossRef]
  40. Vicente-Serrano, S.M.; Camarero, J.J.; Olano, J.M.; Martín-Hernández, N.; Peña-Gallardo, M.; Tomás-Burguera, M.; Gazol, A.; Azorin-Molina, C.; Bhuyan, U.; El Kenawy, A. Diverse Relationships between Forest Growth and the Normalized Difference Vegetation Index at a Global Scale. Remote Sens. Environ. 2016, 187, 14–29. [Google Scholar] [CrossRef]
  41. Gazol, A.; Camarero, J.J.; Vicente-Serrano, S.M.; Sánchez-Salguero, R.; Gutiérrez, E.; De Luis, M.; Sangüesa-Barreda, G.; Novak, K.; Rozas, V.; Tíscar, P.A.; et al. Forest Resilience to Drought Varies across Biomes. Glob. Chang. Biol. 2018, 24, 2143–2158. [Google Scholar] [CrossRef]
  42. Wang, Z.; Lyu, L.; Liu, W.; Liang, H.; Huang, J.; Zhang, Q.-B. Topographic Patterns of Forest Decline as Detected from Tree Rings and NDVI. CATENA 2021, 198, 105011. [Google Scholar] [CrossRef]
  43. Zhang, T.; Song, J.; Fan, Y.; Liu, Y.; Yu, S.; Guo, D.; Hou, T.; Guo, K. Vegetation Index Research on the Basis of Tree-Ring Data: Current Status and Prospects. Forests 2023, 14, 2016. [Google Scholar] [CrossRef]
  44. Mašek, J.; Tumajer, J.; Lange, J.; Kaczka, R.; Fišer, P.; Treml, V. Variability in Tree-Ring Width and NDVI Responses to Climate at a Landscape Level. Ecosystems 2023, 26, 1144–1157. [Google Scholar] [CrossRef]
  45. Norman, S.P.; Koch, F.H.; Hargrove, W.W. Review of Broad-Scale Drought Monitoring of Forests: Toward an Integrated Data Mining Approach. For. Ecol. Manag. 2016, 380, 346–358. [Google Scholar] [CrossRef]
  46. Gazol, A.; Sangüesa-Barreda, G.; Camarero, J.J. Forecasting Forest Vulnerability to Drought in Pyrenean Silver Fir Forests Showing Dieback. Front. For. Glob. Chang. 2020, 3, 36. [Google Scholar] [CrossRef]
  47. Fritts, H.C. Tree Rings and Climate; Academic Press: London, UK; New York, NY, USA, 1976. [Google Scholar]
  48. Cottam, G.; Curtis, J.T. The Use of Distance Measures in Phytosociological Sampling. Ecology 1956, 37, 451–460. [Google Scholar] [CrossRef]
  49. Abatzoglou, J.T.; Dobrowski, S.Z.; Parks, S.A.; Hegewisch, K.C. TerraClimate, a High-Resolution Global Dataset of Monthly Climate and Climatic Water Balance from 1958–2015. Sci Data 2018, 5, 1–12. [Google Scholar] [CrossRef]
  50. Beguería, S.; Vicente-Serrano, S.M. SPEI: Calculation of the Standardized Precipitation-Evapotranspiration Index. 2023. Available online: https://CRAN.R-project.org/package=SPEI (accessed on 20 October 2024).
  51. Abu Arra, A.; Şişman, E. A Comprehensive Analysis and Comparison of SPI and SPEI for Spatiotemporal Drought Evaluation. Env. Monit. Assess. 2024, 196, 980. [Google Scholar] [CrossRef]
  52. Peña-Gallardo, M.; Vicente-Serrano, S.M.; Camarero, J.J.; Gazol, A.; Sánchez-Salguero, R.; Domínguez-Castro, F.; El Kenawy, A.; Beguería-Portugés, S.; Gutiérrez, E.; De Luis, M.; et al. Drought Sensitiveness on Forest Growth in Peninsular Spain and the Balearic Islands. Forests 2018, 9, 524. [Google Scholar] [CrossRef]
  53. Yuan, W.; Zheng, Y.; Piao, S.; Ciais, P.; Lombardozzi, D.; Wang, Y.; Ryu, Y.; Chen, G.; Dong, W.; Hu, Z.; et al. Increased Atmospheric Vapor Pressure Deficit Reduces Global Vegetation Growth. Sci. Adv. 2019, 5, eaax1396. [Google Scholar] [CrossRef]
  54. Liu, X.; He, B.; Guo, L.; Huang, L.; Yuan, W.; Chen, X.; Hao, X.; Xie, X.; Zhang, Y.; Zhong, Z.; et al. European Carbon Uptake Has Not Benefited from Vegetation Greening. Geophys. Res. Lett. 2021, 48, e2021GL094870. [Google Scholar] [CrossRef]
  55. Grossiord, C.; Buckley, T.N.; Cernusak, L.A.; Novick, K.A.; Poulter, B.; Siegwolf, R.T.W.; Sperry, J.S.; McDowell, N.G. Plant Responses to Rising Vapor Pressure Deficit. New Phytol. 2020, 226, 1550–1566. [Google Scholar] [CrossRef]
  56. Luo, Y.; Liang, W.; Yan, J.; Zhang, W.; Gou, F.; Wang, C.; Liang, X. Vegetation Growth Response and Trends after Water Deficit Exposure in the Loess Plateau, China. Remote Sens. 2023, 15, 2593. [Google Scholar] [CrossRef]
  57. Vicente-Serrano, S.M.; Beguería, S.; López-Moreno, J.I. A Multiscalar Drought Index Sensitive to Global Warming: The Standardized Precipitation Evapotranspiration Index. J. Clim. 2010, 23, 1696–1718. [Google Scholar] [CrossRef]
  58. Gorelick, N.; Hancher, M.; Dixon, M.; Ilyushchenko, S.; Thau, D.; Moore, R. Google Earth Engine: Planetary-Scale Geospatial Analysis for Everyone. Remote Sens. Environ. 2017, 202, 18–27. [Google Scholar] [CrossRef]
  59. White, J.C.; Wulder, M.A.; Hobart, G.W.; Luther, J.E.; Hermosilla, T.; Griffiths, P.; Coops, N.C.; Hall, R.J.; Hostert, P.; Dyk, A.; et al. Pixel-Based Image Compositing for Large-Area Dense Time Series Applications and Science. Can. J. Remote Sens. 2014, 40, 192–212. [Google Scholar] [CrossRef]
  60. Zhu, Z.; Woodcock, C.E. Object-Based Cloud and Cloud Shadow Detection in Landsat Imagery. Remote Sens. Environ. 2012, 118, 83–94. [Google Scholar] [CrossRef]
  61. R Core Team. R: A Language and Environment for Statistical Computing. 2024. Available online: https://www.R-project.org/ (accessed on 20 September 2024).
  62. Fox, J.; Weisberg, S. An R Companion to Applied Regression. 2023. Available online: https://CRAN.R-project.org/package=car (accessed on 20 October 2024).
  63. Torres, P.; Rodes-Blanco, M.; Viana-Soto, A.; Nieto, H.; García, M. The Role of Remote Sensing for the Assessment and Monitoring of Forest Health: A Systematic Evidence Synthesis. Forests 2021, 12, 1134. [Google Scholar] [CrossRef]
  64. Loranty, M.M.; Davydov, S.P.; Kropp, H.; Alexander, H.D.; Mack, M.C.; Natali, S.M.; Zimov, N.S. Vegetation Indices Do Not Capture Forest Cover Variation in Upland Siberian Larch Forests. Remote Sens. 2018, 10, 1686. [Google Scholar] [CrossRef]
  65. Novillo, C.J.; Arrogante-Funes, P.; Romero-Calcerrada, R. Recent NDVI Trends in Mainland Spain: Land-Cover and Phytoclimatic-Type Implications. IJGI 2019, 8, 43. [Google Scholar] [CrossRef]
  66. Astigarraga, J.; Andivia, E.; Zavala, M.A.; Gazol, A.; Cruz-Alonso, V.; Vicente-Serrano, S.M.; Ruiz-Benito, P. Evidence of Non-stationary Relationships between Climate and Forest Responses: Increased Sensitivity to Climate Change in Iberian Forests. Glob. Chang. Biol. 2020, 26, 5063–5076. [Google Scholar] [CrossRef] [PubMed]
  67. Matsushita, B.; Yang, W.; Chen, J.; Onda, Y.; Qiu, G. Sensitivity of the Enhanced Vegetation Index (EVI) and Normalized Difference Vegetation Index (NDVI) to Topographic Effects: A Case Study in High-Density Cypress Forest. Sensors 2007, 7, 2636–2651. [Google Scholar] [CrossRef] [PubMed]
  68. Camarero, J.J.; Gazol, A.; Sangüesa-Barreda, G.; Oliva, J.; Vicente-Serrano, S.M. To Die or Not to Die: Early Warnings of Tree Dieback in Response to a Severe Drought. J. Ecol. 2015, 103, 44–57. [Google Scholar] [CrossRef]
  69. Sánchez-Salguero, R.; Camarero, J.; Grau, J.; De La Cruz, A.; Gil, P.; Minaya, M.; Fernández-Cancio, Á. Analysing Atmospheric Processes and Climatic Drivers of Tree Defoliation to Determine Forest Vulnerability to Climate Warming. Forests 2016, 8, 13. [Google Scholar] [CrossRef]
  70. Wei, M.; Jiao, L.; Zhang, P.; Wu, X.; Xue, R.; Du, D. Spatio-Temporal Diversity in the Link between Tree Radial Growth and Remote Sensing Vegetation Index of Qinghai Spruce on the Northeastern Margin of the Tibetan Plateau. Forests 2023, 14, 260. [Google Scholar] [CrossRef]
Figure 1. Spatial distribution of the studied silver fir stands in the Spanish Pyrenees. (a) Map of all study sites, with pink polygons representing declining stands, green polygons indicating non-declining stands, and orange squares showing locations where comparisons of stand defoliation or growth and vegetation indices were conducted. (b) Map of Europe and distribution range of silver fir, highlighting the study region (pink square) in the Pyrenees. (c) Panoramic view of a declining stand in Salvatierra de Escá. The white dashed line in panels (a,b) indicates silver fir distribution obtained from [11]. The color scale in panels (a,b) indicates climatic water deficit (CWD), with blue indicating higher moisture availability and red indicating moisture deficit. The CWD was calculated for the period of 1984–2023.
Remotesensing 16 04564 g001
Figure 2. Climatic trends for declining (D, black circles) and non-declining (N, white triangles) silver fir stands. Panel (a) shows trends for vapor pressure deficit (VPD) and panel (b) for climatic water deficit (CWD). Linear regressions are fitted for both D and N stands.
Remotesensing 16 04564 g002
Figure 3. Box plots of EVI and NDVI indices showing differences between declining (D) and non-declining (N) silver fir stands from 1984 to 2024 in the Spanish Pyrenees. The panels show standard deviation of NDVI (NDVI SD), 95% decile slope of NDVI (NDVI 95), slope of NDVI (NDVI slope) and Enhanced Vegetation Index (EVI).
Remotesensing 16 04564 g003
Figure 4. Long-term trends in EVI for declining (dieback) and non-declining (no dieback) silver fir stands from 1984 to 2024. Error bars represent standard error (SE).
Remotesensing 16 04564 g004
Figure 5. Relationships between defoliation, tree growth and EVI in silver fir stands. Panel (a) shows the correlation between the mean percentage of defoliated silver fir stands in 2000 and 2020. Panel (b) shows the correlation between the mean tree-ring width and the mean percentage of defoliated silver fir trees in 2020 for both declining (D, black circles) and non-declining (N, white triangles) stands. Panel (c) shows the correlation between EVI and the mean percentage of defoliated silver fir trees in 2020. The black lines represent linear regressions. The thick gray line in panel (a) represents the 1:1 relationship for reference. Linear regressions are fitted with corresponding equations, showing correlation and p values in each panel.
Remotesensing 16 04564 g005
Figure 6. Coefficient estimates for the relationships between average climatic variables (CWD, VPD, Tmin, Tmax, soil moisture, precipitation) and EVI for silver fir stands. The black dots represent the coefficient estimates and the bars represent the standard error associated with the coefficient. The red vertical lines indicate the null value (0) for reference.
Remotesensing 16 04564 g006
Figure 7. Monthly correlations calculated between the 1-month SPEI drought index or climatic variables (VPD, CWD, Tmax, Tmin, precipitation, soil moisture) and EVI for declining (D) and non-declining (N) silver fir stands. Correlations were obtained from the previous October to the current (growth year) August. Significant correlations are marked with an asterisk (*) for p < 0.05.
Remotesensing 16 04564 g007
Table 1. Main characteristics of declining and non-declining stands (mean ± SE).
StatusDeclining (D)Non-Declining (N)
N° stands2042
Total area (km2)6.967.63
Elevation (m a.s.l.)1222 ± 2111314 ± 160
Maximum temperature (°C)14.76 ± 0.04 a12.75 ± 0.04 b
Minimum temperature (°C)5.04 ± 0.03 a3.52 ± 0.02 b
Precipitation (mm)829.7 ± 4.9 a1024.8 ± 4.6 b
Vapor pressure deficit (kPa)0.566 ± 0.002 a0.482 ± 0.001 b
Climatic water deficit (mm)343.0 ± 3.5 a220.0 ± 2.2 b
Soil moisture (mm)85.8 ± 0.7 a111.9 ± 0.5 b
NDVI0.766 ± 0.005 a0.779 ± 0.005 a
EVI1.916 ± 0.060 a2.154 ± 0.038 b
Tree-ring width (mm) * [10,19,46]1.74 ± 0.17 a2.57 ± 0.51 b
Defoliation 2000 (%) * [10,46]184
Defoliation 2020 (%) * [19]409
* Tree-ring width represents the mean value calculated for the entire available time series (1984–2000), and defoliation (percentage of trees with defoliation >50%) corresponds to specific assessments conducted in 2000 and 2020 for 9 declining (D) and 7 non-declining (N) sampled stands (see Table S2). Significant differences between groups, as determined by t-tests, are marked with different letters (a, b).
Disclaimer/Publisher’s Note: The statements, opinions and data contained in all publications are solely those of the individual author(s) and contributor(s) and not of MDPI and/or the editor(s). MDPI and/or the editor(s) disclaim responsibility for any injury to people or property resulting from any ideas, methods, instructions or products referred to in the content.

