Abstract
Initial comparisons of the OI 135.6 nm and LBH radiances collected by the FY3E/TriIPM and TIMED/GUVI from 1 January 2023 to 15 May 2024 at 0500 LT and 1700 LT are performed in this study. The analysis reveals that the consistencies of the OI 135.6 nm and LBH radiances are better at 1700 LT than those at 0500 LT in the Northern and Southern Hemispheres, and that the consistencies of the LBH radiances are better than those of OI 135.6 nm in both hemispheres at 0500 LT and 1700 LT. Moreover, compared to the equinoxes, the measurements of FY3E/TriIPM and TIMED/GUVI agree well in summer and winter, especially at 1700 LT. Despite the observed consistencies between these two instruments, differences are also existent, especially for the OI 135.6 nm in equinoxes at 1700 LT and at latitudes between 30°S and 60°S at 0500 LT, which may be due to the altitudinal and responsivity differences between these two instruments. This study illustrates the possibility of the fusion of FUV observations from multiple sources for future modeling.
1. Introduction
Far ultraviolet (FUV) remote sensing has emerged as a powerful tool for monitoring the thermosphere and ionosphere, providing valuable insights into space weather phenomena and upper atmospheric dynamics. This technique utilizes observations of FUV emissions, typically in the 110–180 nm wavelength range, to infer critical parameters of the upper atmosphere [1]. FUV remote sensing offers several advantages, including the ability to observe global-scale phenomena from high-altitude platforms and sensitivity to geophysically significant solar spectral variations. FUV observations can provide information on neutral composition (O, O2, and N2), nightside F-region electron density, and auroral E-region ionization due to particle precipitation [2]. These measurements are crucial for understanding thermospheric and ionospheric responses to solar and geomagnetic disturbances, as well as for improving atmospheric models used in space weather forecasting [3,4,5].
In the study of the thermosphere and ionosphere, the observations of the atomic oxygen at 135.6 nm (OI 135.6 nm) and nitrogen Lyman–Birge–Hopfield bands (LBH) radiances provide several important scientific objectives. These radiances result from energetic photon–electron impact excitation of the neutral atmosphere and are proportional to the concentrations of atomic oxygen and molecular nitrogen, respectively [6,7]. The temporal–spatial evolutions of these radiances can indicate variations of electron density, neutral composition, and temperature, which are valuable for investigating the dynamics of the thermosphere and ionosphere. For example, the OI 135.6 nm radiances, which are particularly sensitive to changes in the thermosphere and ionosphere, recently revealed many phenomena, such as the equatorial ionization anomaly (EIA), day–night brightness variation, and photoelectron impact excitation [8,9,10,11].
The upper atmosphere is a complex and dynamically evolving system, requiring in situ observations to accurately characterize its structure and behavior. The proliferation of space-based and ground-based observatories has significantly expanded the dataset available for atmospheric studies. However, substantial challenges persist in achieving comprehensive atmospheric characterization. While the volume of data has increased exponentially compared to previous decades, individual observatories are constrained by their spatial and temporal coverage, limiting their ability to provide a holistic representation of the upper atmospheric environment. Data fusion techniques, widely applied across various sectors, enhance decision-making and system performance. In healthcare, these techniques combine MRI, CT, and PET data for better diagnosis and treatment planning. The automotive industry uses data fusion to integrate sensor information for autonomous driving. Urban planning benefits from merging data from traffic sensors, weather stations, and social media. In finance, fraud detection systems analyze transaction data alongside customer behavior and external sources. Environmental assessments are improved by combining satellite imagery with ground-based sensors. These applications demonstrate the effectiveness of data fusion in extracting valuable insights from disparate data sources [12,13,14,15,16].
While the volume of upper atmospheric data has increased exponentially, individual observatories remain constrained by their spatial and temporal coverage due to factors such as orbital parameters, instrument field of view, and operational lifetimes. Consequently, single-platform observations often fail to provide a holistic representation of the dynamic and complex atmospheric environment. To address these limitations, data fusion techniques have emerged as a promising approach. By integrating observations from multiple instruments and platforms, data fusion enables a more comprehensive understanding of atmospheric processes across various spatial and temporal scales. Research on individual instruments, such as the Global Ultraviolet Imager (GUVI) onboard the Thermosphere, Ionosphere, Mesosphere Energetics and Dynamics (TIMED) satellite [17,18,19,20,21] and the Global-scale Observations of the Limb and Disk (GOLD) onboard the SES-14 telecommunications satellite [22,23], underscores both their capabilities and their limitations, emphasizing the need for complementary data sources.
This study focuses on comparing the daytime radiances of OI 135.6 nm and LBH from the Triple Ionospheric Photometer aboard the Fengyun 3-E meteorological satellite (FY3E/TriIPM) and the TIMED/GUVI during the 2023–2024 period. These instruments operate in similar wavelength ranges, facilitating potential data fusion applications. However, differences in orbital parameters and instrument response functions necessitate careful analysis. This comparative study is essential for optimizing the utilization of both satellite datasets and advancing our understanding of upper atmospheric dynamics through integrated multi-platform observations.
2. Data
2.1. Triple Ionosphere Photometer (TriIPM)
The Fengyun 3E (FY3E) satellite is China’s first early morning orbit meteorological satellite, launched on 5 July 2021 into a sun-synchronous orbit at an altitude of 831 km, with an equatorial crossing time of 0530 descending. As part of the global meteorological satellite constellation, FY3E helps improve the spatial coverage and temporal resolution of Earth observations by forming a complete three-orbit system, together with existing mid-morning and afternoon polar-orbiting satellites [24].
One of the 12 instruments onboard FY3E is the Triple Ionosphere Photometer (TriIPM), which is a compact, high-sensitivity, nadir-viewing FUV remote sensing instrument with three probes, named A, B, and C. The angles between probes A, B, and C and the nadir are 0°, −30°, and 30°, respectively. TriIPM measures FUV radiances in two bandpass channels, OI 135.6 nm (132–138 nm) and LBH (147.5–162.5 nm). The laboratory calibration results and radiance uncertainty of the TriIPM are between 8.74% and 13.25%. The data used in this paper are the OI 135.6 nm and LBH radiances of probe A. Figure 1 shows the responsivities of the OI 135.6 nm dayside channel and the LBH channel in count/s/R.
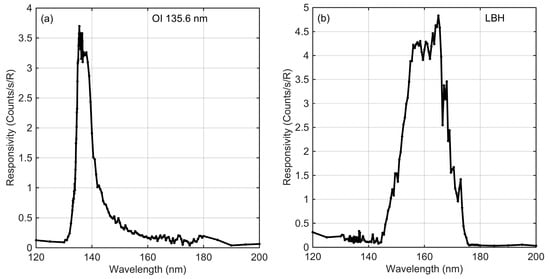
Figure 1.
The TriIPM responsivities of the OI 135.6 nm dayside channel (a) and LBH channel (b) in counts/s/R.
The TriIPM plays a crucial role in advancing our understanding of the thermosphere and ionosphere. This instrument is specifically designed to measure FUV emissions from thermosphere and ionosphere, providing valuable data that enhance our knowledge of the complex interactions between solar activity, atmospheric dynamics, and ionospheric behavior. The data from TriIPM, along with those of other FY3E instruments, contribute to operational meteorology and climate monitoring. As an early morning orbit satellite, FY3E helps form a complete three-orbit observation system, together with the existing mid-morning and afternoon polar-orbiting meteorological satellites. This improves the spatial coverage and temporal resolution of the global observation system [25,26].
2.2. Global Ultraviolet Imager (GUVI)
The Thermosphere Ionosphere Mesosphere Energetics and Dynamics (TIMED) satellite is part of a NASA mission launched on 7 December 2001, designed to study the dynamics and energetics of Earth’s upper atmosphere. TIMED orbits at an altitude of approximately 625 km in a circular orbit inclined at 74.1° to the equator. The satellite’s primary mission is to investigate the mesosphere and lower thermosphere/ionosphere (MLTI) region. One of the four scientific instruments aboard TIMED is the Global Ultraviolet Imager (GUVI), which is a FUV imaging spectrograph designed to observe the upper atmosphere and ionosphere. GUVI measures FUV emissions in several channels, including H 121.6 nm (119.3–123.6 nm), OI 130.4 nm (128.3–131.8 nm), OI 135.6 nm (134.3–137.7 nm), LBHS (141.0–152.8 nm), and LBHL bands (167.2–181.2 nm). These observations provide crucial information about the composition, temperature, and dynamics of the upper atmosphere [27]. GUVI plays a significant role in advancing our understanding of space weather phenomena and the complex interactions between solar activity and Earth’s upper atmosphere [17,19].
TIMED/GUVI is a crucial component of NASA’s efforts to study the upper atmosphere and ionosphere. The instrument’s unique capabilities in FUV imaging have significantly contributed to our understanding of space weather phenomena and the complex dynamics of Earth’s upper atmospheric regions. The data from GUVI, along with other TIMED instruments, continue to support research in atmospheric science, space physics, and related fields, enhancing our ability to monitor and predict space weather events.
2.3. Challenge of Data Cross-Validation
Data validation between FY3E/TriIPM and TIMED/GUVI is essential for ensuring the accuracy and reliability of measurements related to the thermosphere and ionosphere. Both instruments are designed to observe FUV emissions, but they operate under different conditions and with distinct methodologies.
A main goal of data validation is to indicate the data consistency of both instruments, which is a prerequisite for enhancing global coverage of ionospheric measurements through data fusion. This is particularly important for monitoring regions that may be underrepresented by either satellite alone, leading to a more comprehensive understanding of global ionospheric behavior. Continuous comparisons of OI 135.6 nm and LBH radiances over time enable us to assess the variability across different geographic regions and times, revealing long-term trends in the thermosphere and ionosphere, and how factors like solar activity and geomagnetic events influence ionospheric structures and dynamics.
By establishing coincident observation periods and spatial overlap, we can assess the consistency and discrepancies in the data sets. This is crucial for identifying potential biases or errors that may arise from differences in instrument calibration, atmospheric conditions, or data processing techniques. However, some potential challenges do exist. On example is orbital differences: TIMED orbits at an altitude of approximately 625 km, while FY3E is at 831 km. This altitudinal difference can lead to variations in the observed atmospheric layers and phenomena. Moreover, FY3E is in an early morning orbit with an equatorial crossing time of 0530 descending, while TIMED’s orbit inclination is 74.1°. This difference in local observation times can make direct comparisons challenging due to diurnal variations in atmospheric properties. The instruments may observe different geophysical phenomena due to their orbital characteristics and observation time periods. For example, they might capture different aspects of geomagnetic storms or ionospheric disturbances.
In this study, we address the challenges of cross-validating datasets from FY3E/TriIPM and TIMED/GUVI by implementing a careful data matching process. We consider two primary parameters: time and distance. Specifically, we only retain observations when the time difference is less than 5 min and the horizontal distance is less than 200 km. The flowchart of our method is shown in Figure 2. To minimize the impact of factors affecting emissions, such as solar zenith angle and local time, we concentrate our analysis on specific time periods. Given that FY3E is designed for dawn–dusk orbit observations, we focus exclusively on local times (LTs) of 0500 and 1700. This approach allows us to account for the instruments’ characteristics, orbital parameters, and data processing methods, ensuring a meaningful comparison between the two satellite systems.
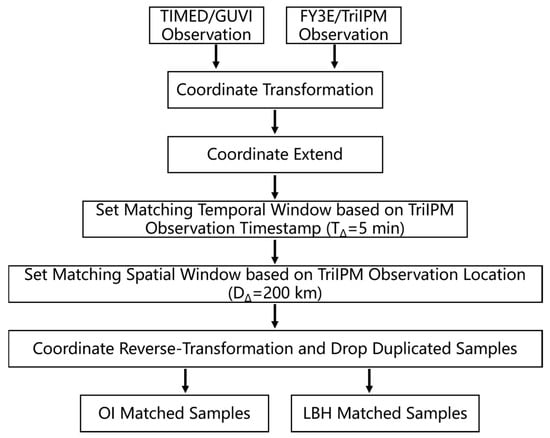
Figure 2.
Flowchart of the sample matched method.
3. Comparison of OI 135.6 nm and LBH Obtained from TriIPM and GUVI
3.1. Histogram of Matched Data
Data collected between 1 January 2023 and 15 May 2024 were used for matching, resulting in matched sample sizes of 2479 at 0500 LT and 11,595 at 1700 LT, respectively. Figure 3 illustrates the distribution of the matched samples according to LT, latitude, longitude, and month of the year. The longitudinal distribution shows no significant variation, while the 0500 LT samples are primarily concentrated in the middle latitude band, and the 1700 LT samples are mostly distributed around the equator, with a secondary concentration in the middle latitudes comparable to the 0500 LT distribution, providing an opportunity for further comparative analysis between these two time periods. Regarding monthly distribution, the 0500 LT samples show relatively consistent sample sizes across months, albeit with some gaps, while at 1700 LT, the samples are limited to the first five months of 2024, with higher sample counts exhibited in January and February compared to the subsequent months.
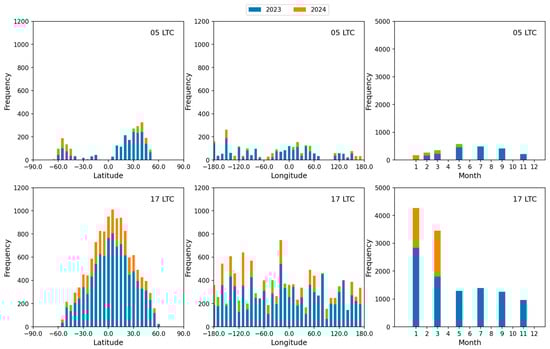
Figure 3.
Latitudinal, longitudinal, and month distributions of matched samples.
Figure 4 illustrates the correspondence between the observed values of FY3E/TriIPM and TIMED/GUVI, with the color of the data points indicating the horizontal distance between the matched observations in degrees. Although both observation instruments focus on the radiation intensities of the OI 135.6 nm and LBH, different response curves lead to variations in the distribution ranges of their observations. At 0500 LT and 1700 LT, GUVI shows consistent ranges for the OI 135.6 nm and LBH observations. For TriIPM, the LBH observation ranges are similar at both fixed local times, while the OI 135.6 nm observation ranges are different. At 1700 LT, the OI 135.6 nm fluctuates between 50 and 500 Rayleigh, whereas at 0500 LT, it remains below 300 Rayleigh.
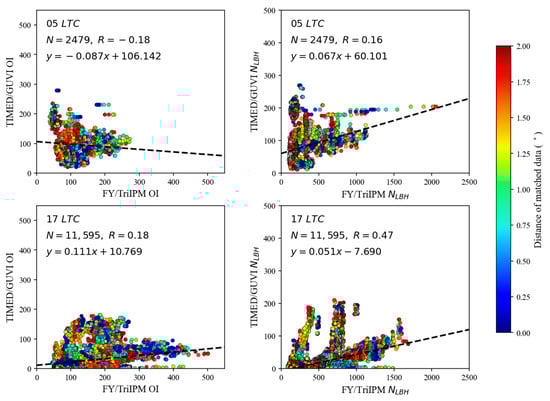
Figure 4.
Comparison of matched samples between TriIPM and GUVI at 0500 LT and 1700 LT. The colors of data points indicate the horizontal distances between matched observations in degrees.
3.2. Latitudinal Comparison of OI 135.6 nm and LBH Radiances from TriIPM and GUVI at 0500 LT and 1700 LT
For a latitudinal comparison of the OI 135.6 nm and LBH radiances between TriIPM and GUVI, we selected four latitude ranges between 60°S and 60°N at two fixed local times (0500 LT and 1700 LT), excluding the higher latitudes to remove auroral contamination. Figure 5 and Figure 6 show the correlations of the OI 135.6 nm and the LBH radiances between the two instruments in four latitude ranges at 0500 LT and 1700 LT, respectively.
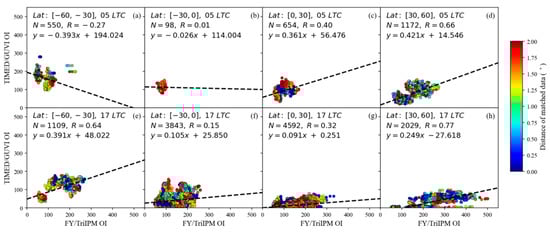
Figure 5.
TriIPM OI 135.6 nm versus GUVI OI 135.6 nm at 0500 LT in four latitude ranges: 30°S–60°S (a), 0°S–30°S (b) 0°N–30°N (c) 30°N–60°N (d) and TriIPM OI 135.6 nm versus GUVI OI 135.6 nm at 1700 LT in four latitude ranges: 30°S–60°S (e), 0°S–30°S (f) 0°N–30°N (g) 30°N–60°N (h).
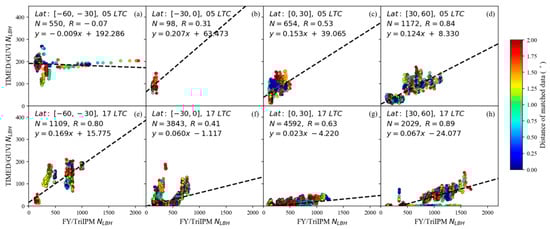
Figure 6.
TriIPM LBH versus GUVI LBH at 0500 LT in four latitude ranges: 30°S–60°S (a), 0°S–30°S (b) 0°N–30°N (c) 30°N–60°N (d) and TriIPM LBH versus GUVI LBH at 1700 LT in four latitude ranges: 30°S–60°S (e), 0°S–30°S (f) 0°N–30°N (g) 30°N–60°N (h).
At 0500 LT, the OI 135.6 nm radiances from both instruments show a positive correlation in the Northern Hemisphere, with the best correlation occurring in the mid-latitude band, reaching a coefficient of 0.66 (Figure 5d). However in the Southern Hemisphere, a weak negative correlation is shown in the latitudinal range between 30°S and 60°S (Figure 5a), while between latitudes 0° and 30°S, only 98 samples were available, limiting the representativeness of the data (Figure 5b). As for the LBH radiances, a weak negative correlation is present in the Southern Hemisphere at latitudes between 30°S and 60°S (Figure 6a), while a strong positive correlation is present in the mid-latitude band, achieving a coefficient of 0.84 in the Northern Hemisphere at latitudes between 30°N and 60°N (Figure 6d). It is interesting to note that, for the LBH radiances at latitudes between 30°S and 60°S, the LBH radiances of GUVI are stable around 200, while they vary between 500 and 2000 for the TriIPM, as shown in Figure 6a.
Unlike at 0500 LT, the OI 135.6 nm and LBH radiances from both instruments show positive correlations at 1700 LT. Compared to the 0500 LT, the coefficient between latitudes 30°S and 60°S increases from −0.27 to 0.64 for the OI 135.6 nm radiances, and from −0.07 to 0.8 for the LBH radiances. For the other three latitude ranges, the coefficients are comparable for these two fixed local times, even though the coefficients at 1700 LT are slightly higher. Furthermore, compared to the middle latitudes, the correlation coefficients of the OI 135.6 nm and LBH radiances are significantly lower at equatorial latitudes at 1700 LT. It is interesting to see that, for the LBH radiances, there are two distinct correlation patterns between latitudes 0° and 60° in the Southern Hemisphere, as shown in Figure 6e,f. These patterns possibly indicate regional differences in LBH radiance distributions, which may be related to the differences in instrumental responsivity and observation altitude. This is not the concern of this paper, and needs further investigation in the future.
3.3. Seasonal Comparison of OI 135.6 nm and LBH Radiances from TriIPM and GUVI at 0500 LT and 1700 LT
Due to the significant seasonal characteristics of fluctuations in the thermosphere and ionosphere, we conducted a seasonal analysis of the matched samples. In this paper, we divide the matched samples into three segments: winter (January, February, November, and December), summer (May–August), and equinoxes (March, April, September, and October). Figure 7 and Figure 8 show the seasonal variations of the OI 135.6 nm and LBH radiances correlations between TriIPM and GUVI at 0500 LT and 1700 LT, respectively.
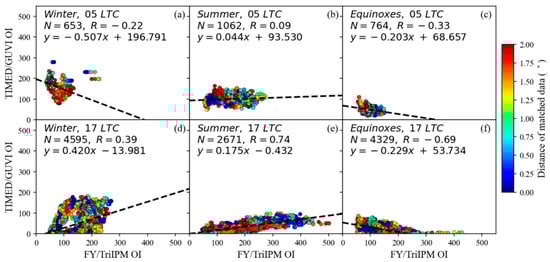
Figure 7.
Seasonal comparisons of TriIPM OI 135.6 nm versus GUVI OI 135.6 nm at 0500 LT: Winter (a), Summer (b), Equinoxes (c) and Seasonal comparisons of TriIPM OI 135.6 nm versus GUVI OI 135.6 nm at 1700 LT: Winter (d), Summer (e), Equinoxes (f).
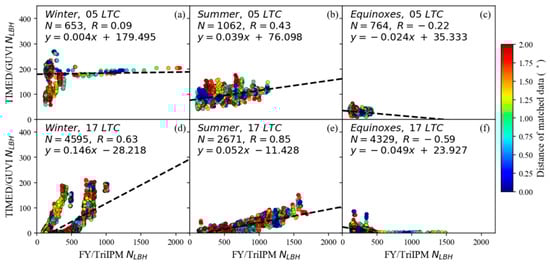
Figure 8.
Seasonal comparisons of TriIPM LBH versus GUVI LBH at 0500 LT: Winter (a), Summer (b), Equinoxes (c) and Seasonal comparisons of TriIPM LBH versus GUVI LBH at 1700 LT: Winter (d), Summer (e), Equinoxes (f).
At 0500 LT, for the OI 135.6 radiances, the correlation coefficients between the TriIPM and GUVI are small and even negative in equinoxes and winter, as shown in Figure 7a,c. For the LBH radiances, the correlation coefficients between these two instruments are slightly larger than those of the OI 135.6 nm radiances, especially in summer, as shown in Figure 7b and Figure 8b. In winter, the comparison of the LBH radiances between the two instruments resembles the comparison results for latitudes between 30°S and 60°S (Figure 6a), that is, the LBH radiances from GUVI are stable around 200, while the LBH radiances from TriIPM vary between 500 and 2000.
At 1700 LT, the correlation coefficients of the OI 135.6 nm and LBH radiances in summer and winter are higher than the corresponding correlation coefficients at 0500 LT, with the best correlation coefficient of 0.74 for the OI 135.6 nm radiances and 0.85 for the LBH radiances in summer. While the negative correlation coefficients in equinoxes increase from −0.33 at 0500 LT to −0.69 at 1700 LT for the OI 135.6 nm radiances, and from −0.22 at 0500 LT to −0.59 at 1700 LT for the LBH radiances. The LBH radiance correlation coefficients are larger than those of the OI 135.6 nm radiances in winter and summer (Figure 7d,e and Figure 8b,e). Furthermore, the comparison of the LBH radiances in winter (Figure 8a) also shows two distinct correlation patterns, which are similar to those at latitudes between 0° and 30°S (Figure 6f).
4. Discussion and Conclusions
In this paper, we make an initial attempt to cross-validate the OI 135.6 nm and LBH radiances from FY3E/TriIPM and TIMED/GUVI between 1 January 2023 and 15 May 2024 at two fixed local times (0500 LT and 1700 LT). The primary goal of this paper is to explore the possibility of applying data fusion techniques using these two instruments for assimilation models.
Generally, the trends of the OI 135.6 nm and LBH radiances are similar between the FY3E/TriIPM and TIMED/GUVI. However, the ranges of FY3E/TriIPM OI 135.6 nm and LBH radiances are larger than those observed from TIMED/GUVI, which may be related to the altitudinal and responsivity differences between these two instruments [27].
The OI 135.6 nm and LBH radiances from both instruments show positive and comparable correlations in the Northern Hemisphere at 0500LT and 1700 LT, while in the Southern Hemisphere, the coefficients are larger at 1700 LT than at 0500 LT, especially at latitudes between 30°S and 60°S. The coefficients of the LBH radiances are larger than those of OI 135.6 nm in the Northern and Southern Hemispheres for both fixed local times. The local time differences of the coefficients may be related to the temporal and altitudinal variations in the thermosphere and ionosphere. The discrepancies in the coefficients between the OI 135.6 nm and LBH radiances, especially at latitudes between 30°S and 60°S at 1700 LT, may be related to the altitudinal differences between these two instruments. At the dusk, the ionospheric contribution to the OI 135.6 nm radiances cannot be ignored [10,20].
The correlation coefficients of the OI 135.6 nm and LBH radiances at 1700 LT are larger than the corresponding parameters at 0500 LT in summer and in winter. On the other hand, the correlation coefficients of the OI 135.6 nm radiances are negative in winter at 0500 LT and in equinoxes at 0500 LT and 1700 LT, while the correlation coefficients of the LBH radiances are negative in equinoxes at 0500 LT and 1700 LT. The OI 135.6 nm and the LBH radiances from TriIPM and GUVI agree well in summer, especially at 1700 LT. In addition, the correlation coefficients of the LBH radiances are larger than those of the OI 135.6 nm radiances, regardless of latitude ranges or seasons. This may also indicate that the ionospheric contribution to the OI 135.6 nm radiances cannot be ignored.
In conclusion, we conducted the first quantitative comparison of the OI 135.6 nm and LBH radiances from two independent instruments: FY3E/TriIPM and TIMED/GUVI. The set of comparisons and initial analyses presented herein provide early information on the OI 135.6 nm and LBH radiance correlation of these two instruments for future data fusion. However, the data comparison in this paper is limited to the consideration of latitudinal and seasonal data variations at two fixed local times in a relatively short time period. For a better understanding of the data comparison, a comparative analysis of longer-time-period data, as well as the effects of solar radiation, geomagnetic activity, neutral winds, and so forth, will be investigated in the future work.
Author Contributions
Conceptualization, Q.Y., T.M., Q.S. and X.Z.; Data curation, Q.Y. and Q.S.; Formal analysis, Q.Y. and Q.S.; Funding acquisition, T.M., Q.S. and X.Z.; Investigation, Q.Y. and Q.S.; Methodology, Q.Y. and Q.S.; Project administration, Q.S.; Resources, Q.Y. and Q.S.; Software, Q.Y.; Supervision, T.M. and X.Z.; Validation, Q.Y. and Q.S.; Visualization, Q.Y.; Writing—original draft, Q.Y. and Q.S.; Writing—review and editing, T.M. and X.Z. All authors have read and agreed to the published version of the manuscript.
Funding
This research was funded by National Natural Science Foundations of China (41931073, 41874187), Meteorological Administration ‘Ionospheric Forecast and Alerting’ Youth Innovation Team (CMA2024QN09), and National Key R&D Program of China (2021YFA0718600).
Data Availability Statement
The GUVI data are publicly available from http://guvitimed.jhuapl.edu/data_products, accessed on 1 July 2024. The TriIPM data are publicly available from https://satellite.nsmc.org.cn/PortalSite/Data/Satellite.aspx, accessed on 1 July 2024.
Conflicts of Interest
The authors declare no conflicts of interest.
References
- Paxton, L.J.; Morrison, D.; Strickland, D.J.; McHarg, M.G.; Zhang, Y.; Wolven, B.; Kill, H.; Crowley, G.; Christensen, A.B.; Meng, C.-I. The use of far ultraviolet remote sensing to monitor space weather. Adv. Space Res. 2003, 31, 813–818. [Google Scholar] [CrossRef]
- Qin, J. Far ultraviolet remote sensing of the nighttime ionosphere using the OI 130.4-nm emission. J. Geophys. Res. Space Phys. 2020, 125, e2020JA028049. [Google Scholar] [CrossRef]
- Balasis, G.; Papadimitriou, C.; Boutsi, A.Z. Ionospheric response to solar and interplanetary disturbances: A swarm perspective. Philos. Trans. R. Soc. A Math. Phys. Eng. Sci. 2019, 377, 20180098. [Google Scholar] [CrossRef]
- Qin, J.; Liu, H.; Yin, X.; Liu, M.; Wang, J.; Mao, T.; Liu, M.; Zhang, X.; Zong, W.; Lu, F.; et al. Inferring the ionospheric state with the far ultraviolet imager on the Fengyun-4C geostationary satellite: Retrieval algorithm and verification. Earth Space Sci. 2023, 10, e2023EA003222. [Google Scholar] [CrossRef]
- Saiz, E.; Cerrato, Y.; Cid, C.; Dobrica, V.; Hejda, P.; Nenovski, P.; Stauning, P.; Bochnicek, J.; Danov, D.; Demetrescu, C.; et al. Geomagnetic response to solar and interplanetary disturbances. J. Space Weather Space Clim. 2013, 3, A26. [Google Scholar] [CrossRef]
- Meier, R.R. Ultraviolet spectroscopy and remote sensing of the upper atmosphere. In Space Science Reviews; Springer: Berlin/Heidelberg, Germany, 1991; Volume 58, pp. 1–185. [Google Scholar]
- Strickland, D.J.; Evans, J.S.; Paxton, L.J. Satellite remote sensing of thermospheric O/N2 and solar EUV: 1. Theory. J. Geophys. Res. Space Phys. 1995, 100, 12217–12226. [Google Scholar] [CrossRef]
- Cai, X.; Burns, A.G.; Wang, W.; Qian, L.; Liu, J.; Solomon, S.C.; Eastes, R.W.; Daniell, R.E.; Martinis, C.R.; McClintock, W.E.; et al. Observation of postsunset OI 135.6 nm radiance enhancement over South America by the GOLD mission. J. Geophys. Res. Space Phys. 2021, 126, e2020JA028108. [Google Scholar] [CrossRef]
- Greer, K.R.; Eastes, R.; Solomon, S.; McClintock, W.; Burns, A.; Rusch, D. Variations of lower thermospheric FUV emissions based on GOLD observations and GLOW modeling. J. Geophys. Res. Space Phys. 2020, 125, e2020JA027810. [Google Scholar] [CrossRef]
- Kil, H.; Lee, W.K.; Shim, J.; Paxton, L.J.; Zhang, Y. The effect of the 135.6 nm emission originated from the ionosphere on the TIMED/GUVI O/N2 ratio. J. Geophys. Res. Space Phys. 2013, 118, 859–865. [Google Scholar] [CrossRef]
- Wang, Y.; Fu, L.; Jiang, F.; Hu, X.; Liu, C.; Zhang, X.; Li, J.; Ren, Z.; He, F.; Sun, L.; et al. Far-ultraviolet airglow remote sensing measurements on Feng Yun 3-D meteorological satellite. Atmos. Meas. Tech. 2022, 15, 1577–1586. [Google Scholar] [CrossRef]
- Dal Pozzolo, A.; Caelen, O.; Le Borgne, Y.-A.; Waterschoot, S.; Bontempi, G. Learned lessons in credit card fraud detection from a practitioner perspective. Expert Syst. Appl. 2014, 41, 4915–4928. [Google Scholar] [CrossRef]
- Fayyad, J.; Jaradat, M.A.; Gruyer, D.; Najjaran, H. Deep learning sensor fusion for autonomous vehicle perception and localization: A review. Sensors 2020, 20, 4220. [Google Scholar] [CrossRef] [PubMed]
- James, A.P.; Dasarathy, B.V. Medical image fusion: A survey of the state of the art. Inf. Fusion 2014, 19, 4–19. [Google Scholar] [CrossRef]
- Joshi, N.; Baumann, M.; Ehammer, A.; Fensholt, R.; Grogan, K.; Hostert, P.; Jepsen, M.; Kuemmerle, T.; Meyfroidt, P.; Mitchard, E.; et al. A review of the application of optical and radar remote sensing data fusion to land use mapping and monitoring. Remote Sens. 2016, 8, 70. [Google Scholar] [CrossRef]
- Mohammadi, N.; Taylor, J.E. Smart city digital twins. In Proceedings of the 2017 IEEE Symposium Series on Computational Intelligence (SSCI), Honolulu, HI, USA, 27 November–1 December 2017; pp. 1–5. [Google Scholar]
- Meier, R.R.; Crowley, G.; Strickland, D.J.; Christensen, A.B.; Paxton, L.J.; Morrison, D.; Hackert, C.L. First look at the 20 November 2003 superstorm with TIMED/GUVI: Comparisons with a thermospheric global circulation model. J. Geophys. Res. Space Phys. 2005, 110. [Google Scholar] [CrossRef]
- Zhang, Y.; Paxton, L.J.; Morrison, D.; Wolven, B.; Kil, H.; Meng, C.-I.; Mende, S.B.; Immel, T.J. O/N2 changes during 1–4 October 2002 storms: IMAGE SI-13 and TIMED/GUVI observations. J. Geophys. Res. Space Phys. 2004, 109. [Google Scholar] [CrossRef]
- Zhang, Y.; Paxton, L.J.; Schaefer, R. Estimation of solar EUV flux from TIMED/GUVI data. J. Atmos. Sol. Terr. Phys. 2020, 202, 105258. [Google Scholar] [CrossRef]
- Zhang, Y.; Paxton, L.J.; Schaefer, R. Ionospheric and Thermospheric Contributions in TIMED/GUVI O 135.6 nm Radiances. J. Geophys. Res. Space Phys. 2021, 126, e2021JA029333. [Google Scholar] [CrossRef]
- Duann, Y.; Chang, L.C.; Liu, J.-Y. Impact of the February 3–4, 2022 geomagnetic storm on ionospheric S4 amplitude scintillation index: Observations and implications. Adv. Space Res. 2023, 72, 4379–4391. [Google Scholar] [CrossRef]
- Gan, Q.; Eastes, R.W.; Burns, A.G.; Wang, W.; Qian, L.; Solomon, S.C.; Codrescu, M.V.; McInerney, J.; McClintock, W.E. First synoptic observations of geomagnetic storm effects on the global-scale OI 135.6-nm dayglow in the thermosphere by the GOLD mission. Geophys. Res. Lett. 2020, 47, e2019GL085400. [Google Scholar] [CrossRef]
- Cai, X.; Burns, A.G.; Wang, W.B.; Coster, A.; Qian, L.; Liu, J.; Solomon, S.C.; Eastes, R.W.; Daniell, R.E.; McClintock, W.E. Comparison of GOLD night measurements with total electron content: Preliminary results. J. Geophys. Res. Space Phys. 2020, 125, e2019JA027767. [Google Scholar] [CrossRef]
- Zhang, P.; Hu, X.; Lu, Q.; Zhu, A.; Lin, M.; Sun, L.; Chen, L.; Xu, N. FY-3E: The first operational meteorological satellite mission in an early morning orbit. Adv. Atmos. Sci. 2022, 39, 1–8. [Google Scholar] [CrossRef]
- Jiang, F.; Mao, T.; Zhang, X.; Wang, Y.-G.; Hu, X.; Wang, D.; Jia, N.; Wang, T.; Sun, Y.; Fu, L.-P. Observation of thermosphere and ionosphere using the ionosphere PhotoMeter (IPM) on the Chinese meteorological satellite FY-3D. Adv. Space Res. 2020, 66, 2151–2167. [Google Scholar] [CrossRef]
- Jiang, F.; Mao, T.; Zhang, X.; Fu, L.-P. Nightside 135.6 nm emission enhancements of mid/low latitudes during geomagnetic storms as observed by the ionosphere PhotoMeter (IPM) on the Chinese meteorological satellite FY-3D. Adv. Space Res. 2023, 71, 2781–2798. [Google Scholar] [CrossRef]
- Christensen, A.B.; Paxton, L.J.; Avery, S.; Craven, J.; Crowley, G.; Humm, D.C.; Kil, H.; Meier, R.R.; Meng, C.-I.; Morrison, D.; et al. Initial observations with the global ultraviolet imager (GUVI) in the NASA TIMED satellite mission. J. Geophys. Res. Space Phys. 2003, 108. [Google Scholar] [CrossRef]
Disclaimer/Publisher’s Note: The statements, opinions and data contained in all publications are solely those of the individual author(s) and contributor(s) and not of MDPI and/or the editor(s). MDPI and/or the editor(s) disclaim responsibility for any injury to people or property resulting from any ideas, methods, instructions or products referred to in the content. |
© 2024 by the authors. Licensee MDPI, Basel, Switzerland. This article is an open access article distributed under the terms and conditions of the Creative Commons Attribution (CC BY) license (https://creativecommons.org/licenses/by/4.0/).