Article

A Deformable Split Fusion Method for Object Detection in High-Resolution Optical Remote Sensing Image

College of Electronic and Information Engineering, Changchun University of Science and Technology, Changchun 130022, China
*
Author to whom correspondence should be addressed.
Remote Sens. 2024, 16(23), 4487; https://doi.org/10.3390/rs16234487
Submission received: 1 October 2024 / Revised: 8 November 2024 / Accepted: 26 November 2024 / Published: 29 November 2024

Abstract

:
To better address the challenges of complex backgrounds, varying object sizes, and arbitrary orientations in remote sensing object detection tasks, this paper proposes a deformable split fusion method based on an improved RoI Transformer called RoI Transformer-DSF. Specifically, the deformable split fusion method contains a deformable split module (DSM) and a space fusion module (SFM). Firstly, the DSM aims to assign different receptive fields according to the size of the remote sensing object and focus the feature attention on the remote sensing object to capture richer semantic and contextual information. Secondly, the SFM can highlight the spatial location of the remote sensing object and fuse spatial information of different scales to improve the detection ability of the algorithm for objects of different sizes. In addition, this paper presents the ResNext_Feature Calculation_block (ResNext_FC_block) to build the backbone of the algorithm and modifies the original regression loss to the KFIoU to improve the feature extraction capability and regression accuracy of the algorithm. Experiments show that the mAP0.5 of this method on DOTAv1.0 and FAIR1M (plane) datasets is 83.53% and 44.14%, respectively, which is 3% and 1.87% higher than that of the RoI Transformer, and it can be applied to the field of remote sensing object detection.

Graphical Abstract

1. Introduction

With the rapid development of remote-sensing satellite technology and optical equipment, obtaining various high-resolution optical remote-sensing images has become increasingly easy. Faced with many remote sensing object detection needs, designing a remote sensing object detection algorithm with strong generalization performance is significant for military exploration, urban planning, aerospace monitoring, natural disaster prevention, and other fields [1,2,3,4]. Compared to using SAR remote sensing images generated by active radar imaging for object detection in scenarios such as foggy conditions, optical remote sensing image object detection is easily affected by background complexity, object size, object distribution, and other factors. Moreover, the resolution of existing remote sensing images is increasing. Therefore, there are still many difficulties in quickly and accurately detecting various remote sensing objects in complex remote sensing backgrounds and high-resolution remote sensing scenes [5,6,7].
Remote sensing image object detection has two processes: remote sensing object positioning and classification. Traditional object detection algorithms usually consist of candidate region selection, feature extraction, and object detection. Not only does the algorithm have many redundant calculations, high time cost, and poor robustness, but also, in the face of complex remote sensing backgrounds, the algorithm has low detection efficiency and poor detection effect. In recent years, deep learning remote sensing object detection has become mainstream. Algorithm design based on convolutional neural networks can effectively extract target positioning information and deep feature information in remote sensing scenes, significantly improving the speed and accuracy of remote sensing object detection [8,9,10,11]. In 2016, Joseph Redmon et al. proposed a single-stage object detection algorithm named YOLO [12]. This algorithm divides the input image into grids, and each grid is responsible for predicting the target with the center point within that grid, improving the speed of object detection. In 2017, He K et al. proposed a method of directly extracting regions of interest using RPN networks and designed Faster R-CNN [13]. In the same year, Tsung Yi Lin et al. proposed RetinaNet [14] and designed a classification loss Focal Loss, making the model more focused on samples that are difficult to distinguish. In 2019, Jian Ding et al. proposed the RoI Transformer [15], which utilizes horizontal region of interest features to rotate sampling points to the corresponding coordinates in the feature map, completing the detection of rotating objects. In the past three years, a large number of excellent rotation object detection algorithms have emerged, such as R3Det [16], S2ANet [17], ReDet [18], Beyond Bounding Box [19], Oriented R-CNN [20], GWD [21], KLD [22], SASM [23], Oriented RepPoints [24], KFIoU [25], G-Rep [26], etc. R3Det uses a stepwise regression method from coarse-grained to fine-grained to refine features and detect rotation objects. S2ANet has designed FAM and ODM modules to enable the network to generate high-quality oriented bounding boxes and align directional sensitive and invariant features with anchors. ReDet utilizes rotational equivariant features and rotational invariant features to improve detection accuracy. Beyond Bounding Box proposes a convex hull representation method to reduce feature aliasing and introduces a new loss function to improve the accuracy of rotating object detection.
Remote sensing objects have varying sizes and complex and variable backgrounds, so the range of background information required for different remote sensing objects is also different. This requires the designed network to fully consider prior knowledge in remote sensing images and select different large convolutional kernels for feature extraction. In 2023, Yuming Chen et al. proposed the YOLO-MS [27] algorithm, which uses convolution of different sizes to extract features from objects of different sizes, achieving a new multi-scale feature representation. In the same year, Yuxuan Li et al. proposed the LSKNet algorithm [28], fully considering prior knowledge in remote sensing images, and designed a dynamic receptive field feature extraction module.
The above research on remote sensing rotated object detection has achieved good results, but there are also the following challenges:
  • The receptive field range required for remote sensing objects of different sizes differs, and some studies need to process high-resolution features efficiently from a global perspective;
  • The object features observed in feature maps at different scales and levels are different, and some studies cannot effectively handle the different background information required for detecting different objects;
  • To improve the accuracy of remote sensing rotated object detection, it is necessary to simultaneously learn rich prior knowledge, improve the representation method of oriented bounding boxes, and search for better feature fusion methods.
To address the above issues, this article proposes an improved algorithm based on the ROI Transformer, with the main innovative points as follows:
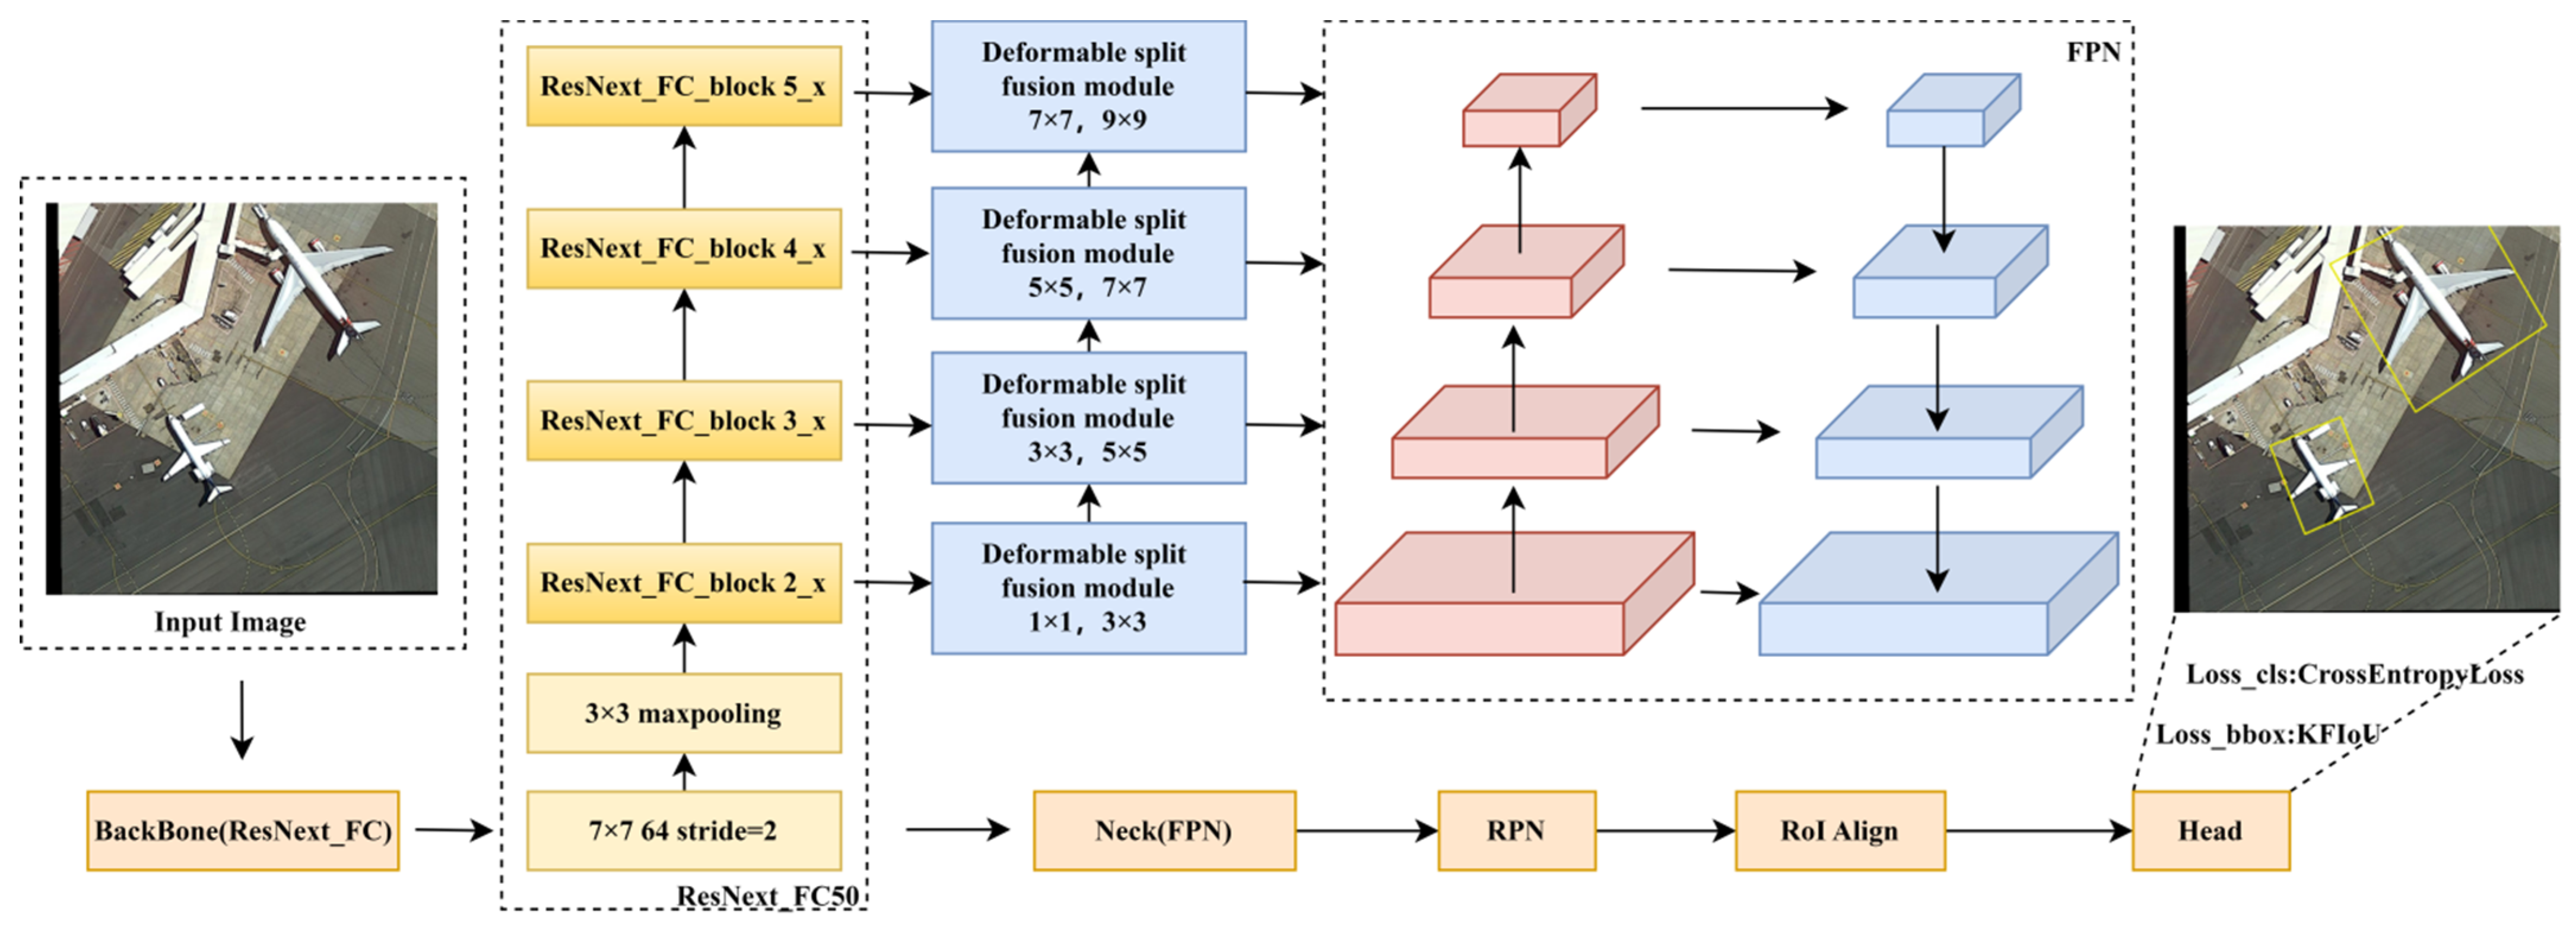
  • Before sending feature maps at different levels into FPN [29], we select convolutional kernels of different sizes for feature extraction. As the network deepens, the size of the convolutional kernels gradually increases, thereby better processing high-resolution object information and rich contextual information;
  • We propose a deformable split fusion method, which consists of two parts: a deformable split module and a space fusion module. This method helps the model dynamically extract contextual information based on different remote sensing objects, improving the model’s detection accuracy for remote sensing objects;
  • This paper proposes the ResNext_FC_block to enhance the ResNext network [30] as the algorithm’s backbone and optimize the loss function, improve the representation method of oriented bounding boxes, and introduce the KFIoU to replace the Smooth L1 loss used by the RoI Transformer [31];
  • This paper proposes a novel remote sensing object detection framework called RoI Transformer-DSF. It conducts extensive comparative experiments and ablation studies on the benchmark DOTAv1.0 and FAIR1M datasets, corroborating the performance enhancement of the proposed method.

2. Related Work

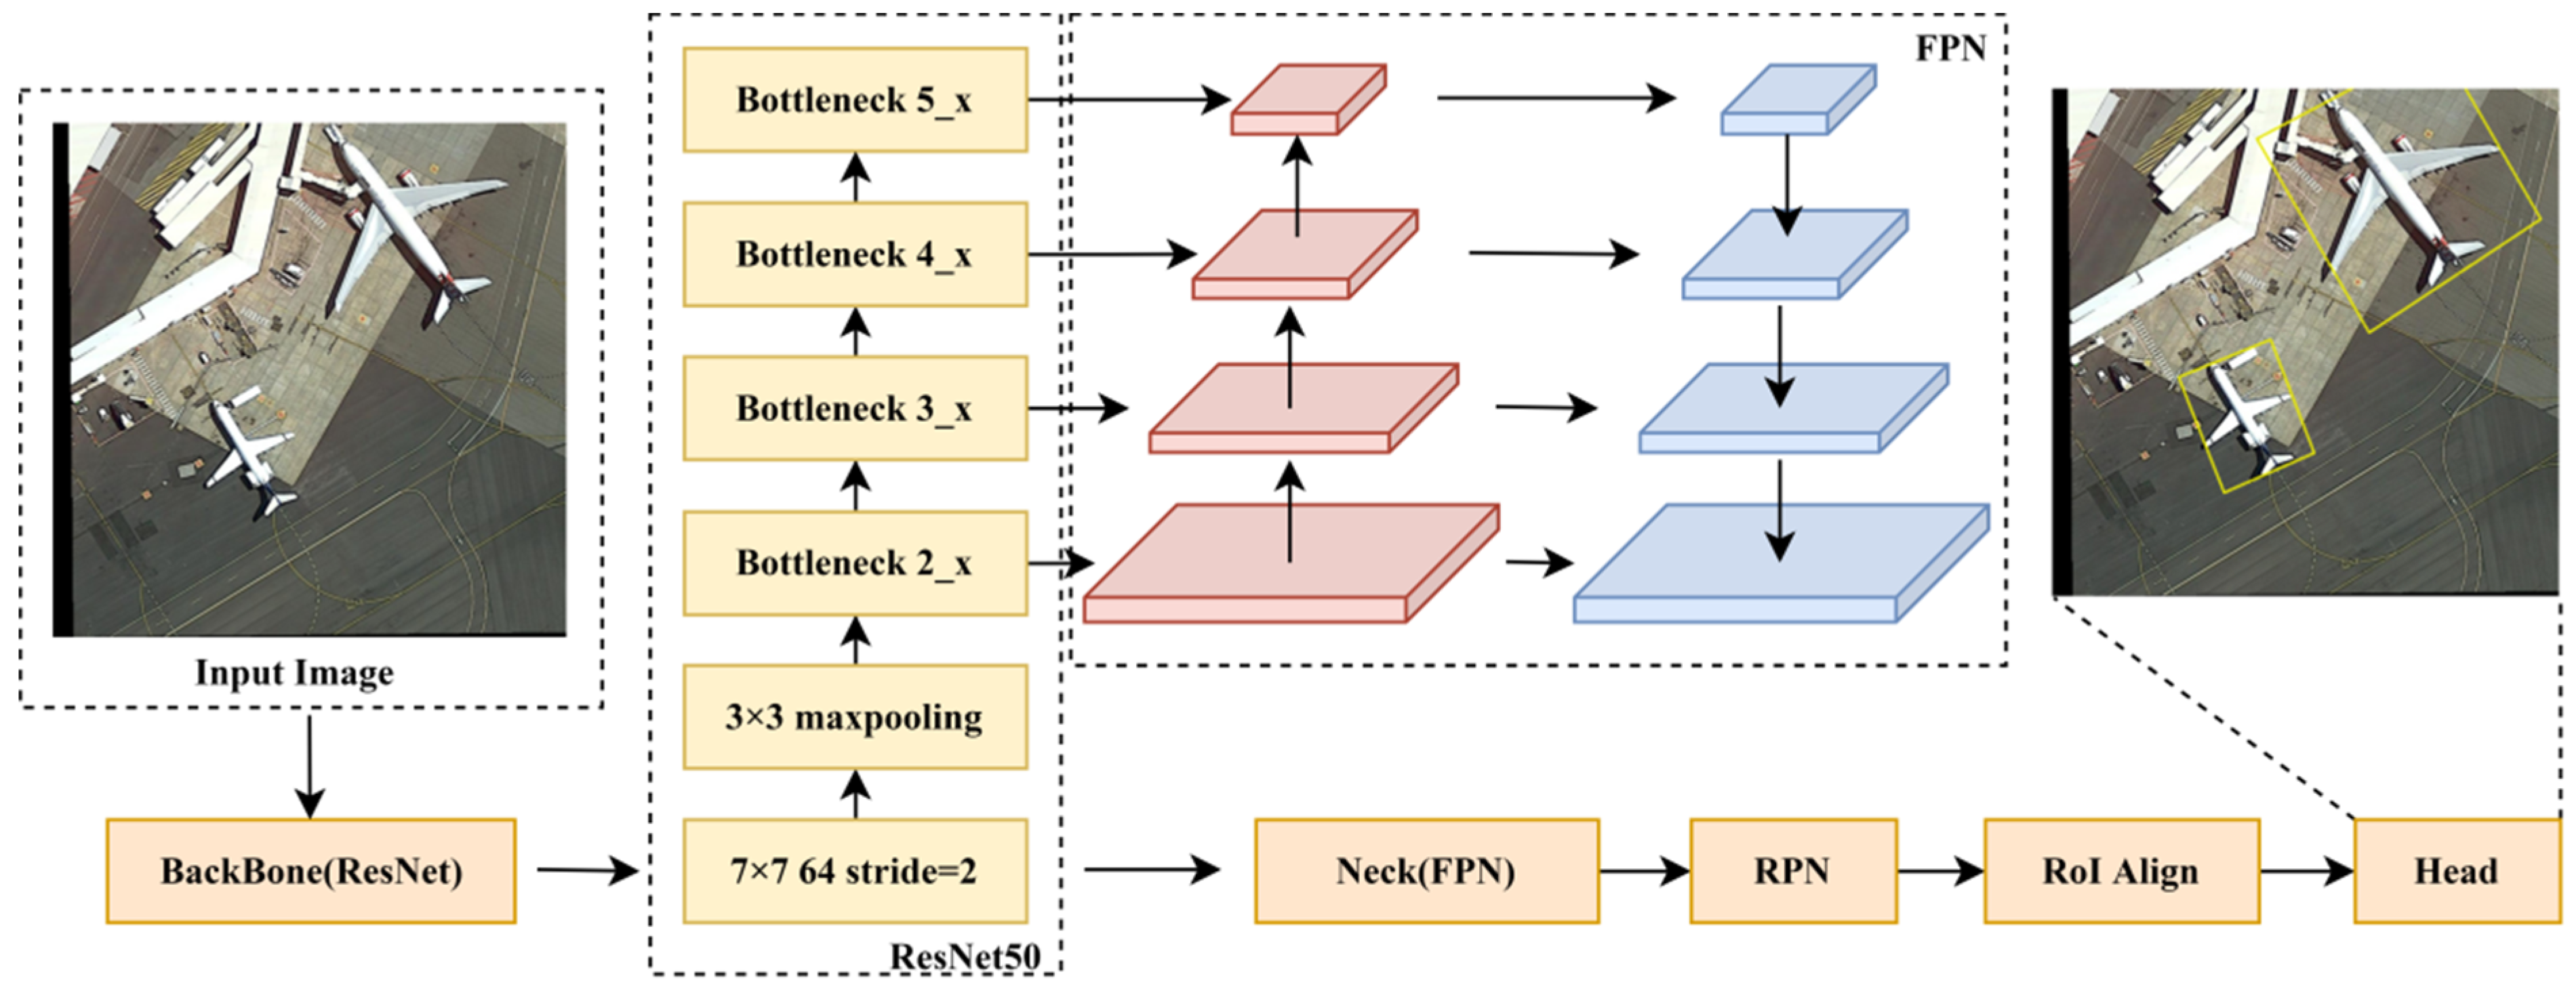
2.1. RoI Transformer

RoI Transformer can detect rotated object detection at any angle. The algorithm is mainly composed of Backbone (ResNet [32]), Neck (FPN), and RoI Transformer modules, which can effectively extract the rotational invariant features of remote sensing objects.
The backbone network of the RoI Transformer is ResNet50. Four different levels of feature maps are generated after the feature extraction of remote sensing images through ResNet50. The feature maps are fed into FPN to complete the information fusion of low-resolution and high-resolution features, reduce feature loss, and facilitate the extraction of semantic and positioning information of remote sensing objects by the network. Afterwards, the feature map through the RoI Transformer module extracts rotational features, and ultimately, the remote sensing rotated object detection is completed based on the rotational features. The RoI Transformer module consists of RRoI Learner and RRoI Warping. RRoI Learner is mainly used to convert HRoI to RRoI. RRoI Warping can extract rotational invariant features of remote sensing objects from RRoI, achieving classification and regression of remote sensing rotated objects. Figure 1 shows the overall structure of the RoI Transformer.

2.2. Multi-Scale Feature Fusion

Multi-scale feature fusion can bring good network performance improvement not only in the field of remote sensing object detection but also in other deep learning fields. Through different feature extraction methods, feature maps of different scales have different object feature information, contextual information, target positioning information, receptive field, etc. By fusing feature maps of different scales, the detection accuracy of the object detection network can be effectively improved. In 2022, DAMO-YOLO [33] proposed RepGFPN, which improves GFPN to achieve cross-level semantic and spatial information fusion while ensuring the efficiency of object detection. SSFPN [34] designed a scale sequence module to extract scale-invariant features of objects and obtained convolutional sequences through 3D convolution, improving the detection accuracy of small objects. CEFPN [35] employs subpixel convolution for upsampling, then fuses feature maps of different scales, and finally obtains the weights of each feature map through the attention mechanism, reducing the loss of feature information and highlighting important object information.

2.3. Attention Mechanism

With the development of computer vision algorithms, there are two main categories of mainstream attention mechanisms: one is the channel and spatial attention mechanism in convolutional neural networks, which can effectively extract the object’s semantic information and spatial localization information, and the other is the self-attention mechanism in the Vision Transformer [36], which can effectively reconstruct sequences and extract the correlation information between different sequences. GAM [37] hybrid attention module mainly consists of two parts, the CAM and the SAM; in the CAM, the feature map first adjusts the dimensional order and then extracts the channel weights through the MLP and the Sigmoid; in the SAM, the feature map extracts the spatial information through two convolutional layers. Self-attention represents each sequence with Q , K , and V vectors and uses the inner product of Q and K vectors as the weights of all sequences for the current sequence. Then, it reconstructs this vector to realize the extraction of the overall information. The expressions for the Q , K , and V vector computation are as follows:
Q i = W q a i
K i = W k a i
V i = W v a i
where i is the index of the corresponding vector, W q , W k , and W k are parameter matrices that can be obtained through learning, and a is the input vector. After obtaining the three vectors Q , K , and V , the Self-attention can be calculated using the following formula:
A t t e n t i o n ( Q , K , V ) = s o f t m a x Q K T d k V
Among them, d k is the dimensions of the vector, and to standardize the dimension of the reconstructed vector. Multiply the Q and K vectors and use the inner product to calculate the similarity between the two. This value can represent the coefficient of the reconstructed vector.

3. Our Work

This article builds on the RoI Transformer and utilizes the proposed improvement methods to construct the RoI Transformer-DSF framework shown in Figure 2. The improved algorithm’s overall framework differs from the RoI Transformer in the backbone, neck, and head. Specific improvements will be detailed in the following subsections.

3.1. Deformable Split Module

This article proposes a hierarchical feature fusion module and draws on applying large convolutional kernels in deep learning to improve the network’s feature extraction ability and detection accuracy in complex remote sensing backgrounds. The DSM is a part of the deformable split fusion module located before the Neck of the network. Figure 3 shows the relationship and parameter configuration between the DSM and FPN.
First, the remote sensing image is subjected to preliminary feature extraction by the ResNext_FC50 and four different levels of feature maps are fed into the DSM before entering into the FPN to extract feature information at different resolutions using 1 × 1 and 3 × 3 convolutional kernels, 3 × 3 and 5 × 5 convolutional kernels, 5 × 5 and 7 × 7 convolutional kernels, and 7 × 7 and 9 × 9 convolutional kernels, respectively, and the size of the convolutional kernels is gradually enlarged with the increase of the depth of the network. ResNext_FC50 stacks a large number of 3 × 3 convolutions, but the actual receptive field is not significant; instead, stacking a small number of deformable split modules with large convolutional kernels can effectively enlarge the receptive field. The use of large convolutional kernels can effectively expand the size of the receptive field, using smaller convolutional kernels in the shallow network to extract the delicate features of small objects and using larger convolutional kernels in the deep network to efficiently enhance the receptive field and extract more contextual information, which is conducive to the detection of significant objects in remote sensing. The sizes of the feature maps of the four different layers are 256 × 256, 128 × 128, 64 × 64 and 32 × 32, respectively. Figure 4 shows the specific structure of the DSM.
K1 and K2 are parameters whose respective values correspond to the four sets of numbers shown in Figure 3. For example, the feature map with a channel count 256 is first split into two parts. In the upper half of the DSM, the feature map is first convolved through K1 and then through K2, then concatenating the two feature maps together to be sent to the lower half. In the second half, half of the input feature maps, the original input feature maps through deformable convolution [38], and the output feature maps of S1 in the upper half are first concatenated, then convolved through K1 and K2, respectively. Finally, the outputs are concatenated, as shown in S2. After the feature maps pass through the S1 and S2, all the used feature maps are concatenated as inputs to the SFM following the final concatenating method of the DSM.

3.2. Space Fusion Module

Spatial information is crucial in remote sensing object detection, and better spatial information and feature information that better fits the object is beneficial for improving the accuracy of remote sensing object detection. The primary function of the space fusion module is to fuse remote sensing object information with varying receptive fields, spatial locations, and contextual information, as well as the information extracted by the deformable convolution and large convolutional kernels. Figure 5 shows the specific structure of the space fusion module.
The feature map enters the space fusion module. First, the spatial attention mechanism calculates the weight of spatial position information. Then, the weight is assigned to the feature maps of the S1, S2, and deformable convolution of the deformable split module to highlight the spatial position information and rotated invariant information of specific remote sensing objects, improving the network’s regression and detection accuracy.

3.3. ResNext_FC_Block

The detection accuracy of the network is intimately tied to the feature extraction capabilities of the detection network’s backbone. Compared to ResNet’s BottleNeck structure, the ResNext_block in the ResNext network is structured into three components. The first component comprises a 1 × 1 convolution layer, doubling the number of channels in the feature map compared to ResNet. The second component employs grouped convolutions, dividing the input feature maps into 32 groups. Each group undergoes a 3 × 3 convolution. Notably, even after doubling the channel count, the total number of parameters is nearly identical to that of ResNet. The third component involves another 1 × 1 convolution layer, resulting in an output feature map with 256 channels.
This paper proposes the ResNext_FC_block, which extends the ResNext_block by incorporating two additional branches: the Channel Weight branch (C) and the Spatial Weight branch (S). Specifically, the C branch computes the mean and maximum values across each channel of the input feature map. In contrast, the S branch calculates the mean and maximum values at each spatial location of the input feature map. These computations result in two output feature maps of size H × W × C. Together with the input feature map, these output feature maps are used to calculate the correlation weights for each pixel. The calculated correlation weights represent the inter-pixel correlations in remote sensing images, highlighting the strong correlations in colour and texture features among adjacent pixels, particularly for remote sensing objects such as aircraft. This mechanism guides the model to effectively focus on and extract relevant information from the object regions within the remote sensing images. Figure 6 shows the ResNet_Block, ResNext_Block, and ResNext_FC_Block structure diagrams.
The three types of blocks differ in their impact on the algorithm’s feature extraction capabilities. To validate the effectiveness of the ResNext_FC_block in extracting pixel correlation and object spatial position information, we conduct comparative experiments with different blocks, using the RoI Transformer as the baseline model. The experimental results are shown in Table 1.
Table 1 shows that the original RoI Transformer attains a mAP0.5 of 80.53% when using the ResNet_block for the backbone network. The mAP0.5 improves by 0.19% and 0.66% when the block is switched to the ResNext_block and ResNext_FC_block, respectively. Utilizing the ResNext_FC_block can obtain the highest detection accuracy, confirming the efficacy of the enhanced block design.

3.4. Optimize the Loss Function

An excellent oriented bounding box regression loss can improve the accuracy of remote sensing object detection and the convergence speed of the algorithm. The regression loss function of the RoI Transformer is Smooth L1 loss, which is easily affected by angle deviation. To obtain a higher accuracy for the rotated IoU, this article uses the KFIoU as the regression loss function of the algorithm.
A one-to-one correspondence exists between a two-dimensional oriented bounding box and a Gaussian function. If the oriented bounding box is represented by ( x , y , h , w , θ ) , its corresponding Gaussian distribution is:
g ( μ , Σ ) = g ( ( x , y , ( z ) ) T , R Λ R T )
R is the rotation matrix, and Λ is the diagonal matrix of the eigenvalue. When the oriented bounding box intersects the actual box, the Gaussian distribution functions of the two are multiplied to obtain the Gaussian function of the overlapping area:
  α g k f ( μ , Σ ) = g 1 ( μ 1 , Σ 1 ) g 2 ( μ 2 , Σ 2 )
Converting the Gaussian function of the overlapping area into the prediction box, the actual box, and the oriented bounding box of the overlapping box. The K F I o U can be calculated according to the following formula based on the area formula of the oriented bounding box:
K F I o U = ν B 3 ( Σ ) ν B 1 ( Σ ) + ν B 2 ( Σ ) ν B 3 ( Σ )
Among them, ν B 1 ( Σ ) , ν B 2 ( Σ ) , and ν B 3 ( Σ ) are the areas of the predicted box, the actual box, and the overlapping area, respectively.
Different classification loss functions and regression loss functions have distinct impacts on algorithm convergence and the learning of model parameter values. Finding a suitable combination of classification and regression loss functions is crucial for algorithm learning. In this article’s remote sensing object detection experiment, we study the impact of different loss function combinations on algorithm accuracy, and Table 2 shows the results.
Table 2 shows that using the Focal Loss and KFIoU Loss alone or simultaneously can improve algorithm accuracy, with mAP0.5 improving by 0.09%, 0.5%, and 0.24%, respectively. When we use the CrossEntropy Loss as the classification loss and the KFIoU Loss as the regression loss, the effect is best, with mAP0.5 of 81.03%, which can effectively improve the algorithm’s detection accuracy for remote sensing objects.
We extract multiple iters within a single epoch and plot convergence curves to compare the convergence rate of the algorithm with and without using the KFIoU Loss on the DOTA dataset, as can be seen in Figure 7; after using the KFIoU Loss as the regression loss function, the overall loss of the algorithm starts to converge gradually after the 150th iter and the final loss value converges near 0.21. Without using the KFIoU Loss, the overall loss of the algorithm starts to converge gradually only after the 200th iter, and the final loss value converges near 0.165.

4. Experiment and Result Analysis

4.1. Experimental Environment and Parameter Configuration

In this paper, the remote sensing object detection algorithm experiments based on the improved RoI Transformer use CUDA11.1, Intel i7-11700 8-core CPU, NVIDIA GeForce RTX 3080Ti to build the training platform, and the deep learning framework is PyTorch. The experiments use DOTAv1.0 and FAIR1M (plane) datasets to evaluate the reasonableness and detection accuracy of the algorithm in this paper. The experimental optimizer chooses SGD with lr = 0.0025, momentum = 0.9, weight_decay = 0.0001, the learning rate strategy adopts linear, set warmup_iters = 500, warmup_ratio = 1.0/3, and the overall training is for 100 epochs, if the algorithm converges in advance, it will end the training round early. The algorithm in this paper is experimented with in the above two datasets, and Figure 8 shows the loss convergence curve of the experiment.

4.2. Datasets

DOTAv1.0 [39] dataset is a remote sensing object detection dataset released by Wuhan University in 2018, containing 2806 remote sensing images from different sensors and platforms. The dataset has a total of 15 categories of remote sensing objects, which are the plane, ship, storage tank, baseball diamond, tennis court, basketball court, ground track field, harbor, bridge, large vehicle, small vehicle, helicopter, roundabout, soccer ball field, and swimming pool. The number of instances is 188282. The resolution of each remote sensing image in the DOTAv1.0 dataset is approximately between 800 × 800 and 4000 × 4000, where the number of training sets is 1411, the number of validation sets is 458, and the number of test sets is 937. Figure 9 shows examples of the DOTAv1.0 dataset.
The FAIR1M (plane) [40] dataset only selects remote sensing images containing remote sensing aircraft objects in the FAIR1M dataset, released by the Aerospace Information Innovation Research Institute of the Chinese Academy of Sciences in 2021. It contains 8017 remote sensing aircraft images, with 44248 instances. There are 11 types of aircraft instances, namely, Boeing737, Boeing777, Boeing747, A321, A220, A330, A350, C919, ARJ21, and other aircraft. The resolution of remote sensing aircraft images in this dataset is 1000 × 1000 to 10,000 × 10,000, including many high-resolution remote sensing aircraft objects, which is very suitable for research and use. Figure 10 is an example of the FAIR1M (plane) dataset.

4.3. Experimental Evaluation Indicators

The evaluation indicators used in the comparative and ablation experiments to verify the performance of the RoI Transformer-DSF algorithm in this article include P r e c i s i o n , R e c a l l , A P , and m A P . First, we calculate P r e c i s i o n and R e c a l l :
P r e c i s i o n = T P T P + F P
R e c a l l = T P T P + F N
T P , F P , and F N represent the number of true positives, false positives, and false negatives, respectively. A P is the Average Precision, which is the average accuracy of different precision and the area enclosed by the PR curve and coordinate axis. The larger the A P , the higher the average accuracy of the model. The calculation formula for A P is as follows:
A P = 0 1 P ( R ) d R
Among them, R is R e c a l l , and m A P is the average of all categories of APs, reflecting the model’s overall accuracy. Generally speaking, the higher the m A P , the better the model’s accuracy. The calculation formula for the m A P is as follows:
m A P = 1 N N = 1 N A P i
where N is the number of categories to be detected, and A P i is the average accuracy of each category. If mAP has a subscript, the subscript denotes the threshold of the intersection over union (IoU) between the ground truth and predicted bounding box. For instance, mAP0.5 represents the average detection accuracy across all categories when the IoU threshold is set to 0.5.

4.4. Analysis of Experimental Results

4.4.1. DOTA Dataset Comparison Experiment

To verify the effectiveness of the algorithm proposed in this article, we compared the RoI Transformer-DSF with the RoI Transformer, KFIoU, SASM, ReDet, Rotated RepPoints, R3Det, Faster Rcnn, Rotated RetinaNet, GWD, and S2ANet, mainly analyzing the impact of each algorithm on mAP0.5, AP, and Recall in remote sensing object detection. Figure 11 shows the detection results of the RoI Transformer-DSF on the DOTA dataset.
According to the detection results, the deformable split fusion method based on the RoI Transformer-DSF in this article has good detection results for remote sensing objects of different sizes, rotated angles, and spatial distributions, and the detection accuracy of small objects is also high. Table 3 shows the detection results of various algorithms. The resolution of input remote sensing images is 1024 × 1024.
From the comparative experimental results, we can know that the mAP0.5 of the proposed method in this article is 83.53%, which is 3%, 12.72%, 4.78%, 8.16%, 4.93%, 5.96%, 17.35%, 3.65%, 4.12%, and 3.95% higher than that of the RoI Transformer, SASM, ReDet, R3Det, Faster Rcnn, Rotated RetinaNet, Rotated RepPoints, KFIoU, GWD, and S2ANet, respectively. Observing the AP, there is almost no difference in the APmax of various algorithms, but the improved algorithm has an APmin of 69.1%, which is 6.8% higher than the RoI Transformer and has the highest APmin. The above data indicate that the algorithm in this paper has more vital feature information extraction ability and generalization performance for various remote sensing objects. Table 4 shows the detection results for each category in the DOTA dataset.
Observing the detection accuracy of various remote sensing objects, among which swimming pool, bridge, and storage tank have the lowest accuracy due to the different distribution and size of these three objects, irregular swimming pool boundaries, difficulty in regression, and complex remote sensing backgrounds. The accuracy of the other remote sensing objects is above 84%. The RoI Transformer-DSF has an excellent detection effect on remote sensing objects. Table 5 presents the complete comparative experimental results.
Figure 12 illustrates the training outcomes of the algorithms mentioned above on the DOTA dataset, with the x-axis representing the Epoch and the y-axis depicting the algorithms’ mAP. An algorithm’s mAP curve closer to the top-left corner indicates higher detection accuracy and faster convergence. All algorithms were trained with pre-trained weights; most initial mAPs were around 75%. As observed in Figure 12, the RoI Transformer-DSF achieved the highest mAP, starting at 80.84%. After 10 training epochs, the algorithm’s mAP stabilized at approximately 83.53%. Compared to the RoI Transformer, RoI Transformer-DSF exhibits higher detection precision and converges about one epoch faster. However, during the training process, the mAP of the RoI Transformer-DSF exhibits larger fluctuations and lacks stability in the mAP convergence curve compared to the RoI Transformer.

4.4.2. FAIR1M Dataset Comparison Experiment

In this section, we will compare the RoI Transformer-DSF in this article with RoI Transformer, SASM, ReDet, R3Det, Faster Rcnn, Rotated RetinaNet, GWD, and S2ANet to verify that it is still effective in other datasets. Figure 13 shows the detection results of the RoI Transformer-DSF on the FAIR1M (plane) dataset.
According to the detection results, the improved algorithm has significantly improved the detection accuracy of the Boeing 737, Boeing 777, Boeing 747, Boeing 787, A321, A220, A330, A350, C919, ARJ21, and other aircraft. However, some aircraft objects have missed detections, and the rotated angle of the regression box needs to be more accurate, which needs to be improved in subsequent research. Table 6 shows the detection results of various algorithms on the FAIR1M dataset.
According to the experimental results in Table 6, the RoI Transformer-DSF proposed in this article achieved the best performance to detect 11 types of remote sensing aircraft objects, with mAP0.5 of 44.14%. Compared to the mAP0.5 of the RoI Transformer, SASM, ReDet, R3Det, Faster Rcnn, Rotated RetinaNet, GWD, and S2ANet, the mAP0.5 increased by 1.87%, 10.81%, 2.15%, 2.32%, 2.38%, 5.83%, 1.86%, and 1.19%, respectively. Table 7 shows the detection results of various types of aircraft.
Due to the long-tailed distribution of the number of instances of various aircraft types in the FAIR1M dataset, the number of instances in C919 and ARJ21 is the lowest, and their detection accuracy is also the lowest. The detection accuracy of C919 is only 0.2%, and the network has yet to learn its features. Overall, the RoI Transformer-DSF has improved the detection accuracy of most remote sensing aircraft, but to truly significantly improve the algorithm’s detection accuracy for various types of aircraft in the FAIR1M dataset, we also need to change the current situation of uneven instance numbers in the future. Table 8 presents the complete comparative experimental results of different algorithms.
Figure 14 presents the training results of the algorithms mentioned above on the FAIR1M dataset, similar to the previous section, with the x-axis denoting the Epoch and the y-axis representing the value of the mAP. It can be observed from Figure 14 that while the initial mAP of the RoI Transformer-DSF is not high, the rate of the mAP increase is rapid. After 9 epochs of training, the mAP of RoI Transformer-DSF stabilizes at around 44.14%, converging faster than most other algorithms, with smaller fluctuation in the mAP throughout the training process.

4.5. Ablation Experiment

In order to assign different receptive fields to remote sensing objects of different sizes, efficiently process feature information and background information of remote sensing objects, fully consider prior knowledge from remote sensing images, and improve the detection accuracy of the remote sensing object detection algorithm, this article proposes four improvements: proposing the ResNext_FC_block to construct the backbone for extracting features of remote sensing objects, designing the DSM and SFM modules, and replacing the original regression loss function with the KFIoU Loss. The ablation experiment of this section mainly verifies the effectiveness of these four parts and explains the impact of each module on the mAP0.5 of the improved algorithm. Table 9 shows the results of the ablation experiment.
Table 9 shows that when the ResNext_FC, DSM, SFM, and KFIoU are used alone, the mAP0.5 of the improved algorithm has increased by 0.66%, 0.94%, 0.12%, and 0.5%, respectively. Each module helps improve the detection accuracy of the algorithm, and the combination of each module can also improve the accuracy of the algorithm to a certain extent, verifying the effectiveness of the improved algorithm. Finally, the algorithm proposed in this article uses the ResNext_FC, DSM, SFM, and KFIoU together. Through the ablation experiment, the RoI Transformer-DSF has the best performance, with mAP0.5 being 83.53, which is 3% higher than the mAP0.5 of the RoI Transformer. Figure 15 compares the detection results of the RoI Transformer and the RoI Transformer-DSF. Figure 15a shows the detection results of the RoI Transformer, and Figure 15b shows the detection results of the RoI Transformer-DSF.
By observing the comparative visualization results, it is evident that the RoI Transformer-DSF exhibits enhanced performance for detecting subtle remote sensing objects such as cars and airplanes. For instance, in the first row and first column of the remote sensing images, some cars not detected by the RoI Transformer algorithm are now successfully detected. The RoI Transformer-DSF also demonstrates robust regression performance for the rotated angles of dense remote sensing objects and maintains good robustness across various sizes of objects. For example, in the second row of the detection results, the RoI Transformer-DSF shows increased detection accuracy for some dense, small objects and large, rotated objects such as harbors.

5. Discussion

The main innovations in this paper are constructing the RoI Transformer-DSF algorithm framework and proposing a deformable split fusion method that can dynamically extract the feature and contextual information of remote sensing objects. Ultimately, through multiple comparative experiments and ablation studies on the DOTAv1.0 and FAIR1M (plane) datasets, we validate the effectiveness of the proposed method. In Section 4.4 and Section 4.5, the RoI Transformer-DSF demonstrates the highest detection accuracy and rapid convergence speed.
The ablation studies indicate that the ResNext_FC_block, DSM, SFM, and the optimized loss function (KFIoU) all enhance our algorithm’s detection performance. The neighboring pixels of remote sensing objects exhibit strong correlations in color and texture information. The ResNext_FC_block effectively decouples this inter-pixel correlation from the feature maps, improving the localization accuracy for remote sensing object detection. As the network deepens, the DSM increases the size of convolutional kernels, efficiently extracting fine-grained features of small objects and contextual features of large objects. The SFM further processes the spatial localization information extracted by the ResNext_FC_block and combines it with the feature information from the DSM, highlighting the rotated invariant features and enhancing the detection accuracy. The regression loss of KFIoU can use the transformation relationship between Gaussian functions and 2D rotated bounding boxes, improving the regression accuracy of the detection.
In addition, the improved algorithm in this article does not consider the algorithm’s computational cost and running speed, and there are no diversity changes for other remote sensing detection scenarios. At the same time, we still need to address the inherent shortcomings of the dataset, which will significantly affect the imbalance in the detection accuracy of various categories and affect the comprehensive learning of the model. In the future, we will improve aspects such as dataset, input feature maps, and algorithm running speed, design an excellent network and continue exploring the impact of larger convolutional kernels on the algorithm’s accuracy and speed, as discussed in Section 3.1, which improves the accuracy and speed.

6. Conclusions

Due to the randomness of remote sensing image shooting and the diversity of size and distribution of remote sensing objects, current remote sensing object detection algorithms still face many challenges. In response to these issues, this article proposes a RoI Transformer-deformable split fusion method, which utilizes the DSM, SFM, and ResNext_FC_block. The backbone captures the rotated invariant, contextual, and spatial position information of remote sensing objects. The KFIoU Loss improves the algorithm’s detection ability and convergence speed, which is beneficial for detecting small objects and regression of rotated angles. The experiments on the DOTA and FAIR1M datasets demonstrate the effectiveness of each module. In future work, we will continue to investigate the related issues mentioned in the discussion, continuously enhancing the detection accuracy and robustness of the algorithm.

Author Contributions

Conceptualization, Q.G. and Y.L. (Yang Li); methodology, Q.G. and Y.L. (Ying Liu); software, Q.G. and G.L.; formal analysis, L.C.; writing—original draft preparation, Q.G.; writing—review and editing, L.C. and Y.L. (Yang Li). All authors have read and agreed to the published version of the manuscript.

Funding

This work is supported by the Department of Science and Technology of Jilin Province, China (20210201130GX), (20230203028SF).

Data Availability Statement

All datasets used for training and evaluating the performance of our proposed approach are publicly available and can be accessed from [39,40].

Acknowledgments

The authors would like to thank the editors and the anonymous reviewers for their valuable comments for greatly improving our manuscript.

Conflicts of Interest

The authors declare no conflicts of interest.

Abbreviations

DSMDeformable split module
SFMSpace fusion module
DSFDeformable split fusion
RoIRegion of Interest
SARSynthetic Aperture Radar
FPN Feature pyramid network
KFIoUSkewIoU based on Kalman Filtering
CNNConvolutional Neural Network
SA-SShape adaptive selection
SA-MShape adaptive measurement
FAMFeature Alignment Module
ODMOrientation Detection Module
CAMChannel attention module
SAMSpatial attention module
ARNAnchor refinement network
APAverage precision
IoUIntersection over union
RRecall
PPrecision
YOLOYou only look once
SSD Single shot multibox detector
mAPMean average precision
MLPMulti-layer perceptron
BNBatch Normalization
SGDStochastic gradient descent
CChannel Weight branch
SSpatial Weight branch

References

  1. Fei, X.; Guo, M.; Li, Y.; Yu, R.; Sun, L. ACDF-YOLO: Attentive and Cross-Differential Fusion Network for Multimodal Remote Sensing Object Detection. Remote Sens. 2024, 16, 3532. [Google Scholar] [CrossRef]
  2. He, X.; Liang, K.; Zhang, W.; Li, F.; Jiang, Z.; Zuo, Z.; Tan, X. DETR-ORD: An Improved DETR Detector for Oriented Remote Sensing Object Detection with Feature Reconstruction and Dynamic Query. Remote Sens. 2024, 16, 3516. [Google Scholar] [CrossRef]
  3. Liu, Z.; He, G.; Dong, L.; Jing, D.; Zhang, H. Task-Sensitive Efficient Feature Extraction Network for Oriented Object Detection in Remote Sensing Images. Remote Sens. 2024, 16, 2271. [Google Scholar] [CrossRef]
  4. Liu, C.; Zhang, S.; Hu, M.; Song, Q. Object Detection in Remote Sensing Images Based on Adaptive Multi-Scale Feature Fusion Method. Remote Sens. 2024, 16, 907. [Google Scholar] [CrossRef]
  5. Mei, S.; Lian, J.; Wang, X.; Su, Y.; Ma, M.; Chau, L.-P. A Comprehensive Study on the Robustness of Image Classification and Object Detection in Remote Sensing: Surveying and Benchmarking. arXiv 2023, arXiv:2306.12111. [Google Scholar]
  6. Cheng, A.; Xiao, J.; Li, Y.; Sun, Y.; Ren, Y.; Liu, J. Enhancing Remote Sensing Object Detection with K-CBST YOLO: Integrating CBAM and Swin-Transformer. Remote Sens. 2024, 16, 2885. [Google Scholar] [CrossRef]
  7. Pan, M.; Xia, W.; Yu, H.; Hu, X.; Cai, W.; Shi, J. Vehicle Detection in UAV Images via Background Suppression Pyramid Network and Multi-Scale Task Adaptive Decoupled Head. Remote Sens. 2023, 15, 5698. [Google Scholar] [CrossRef]
  8. Wang, W.; Cai, Y.; Luo, Z.; Liu, W.; Wang, T.; Li, Z. SA3Det: Detecting Rotated Objects via Pixel-Level Attention and Adaptive Labels Assignment. Remote Sens. 2024, 16, 2496. [Google Scholar] [CrossRef]
  9. Chen, J.; Lin, Q.; Huang, H.; Yu, Y.; Zhu, D.; Fu, G. HVConv: Horizontal and Vertical Convolution for Remote Sensing Object Detection. Remote Sens. 2024, 16, 1880. [Google Scholar] [CrossRef]
  10. Zhao, Q.; Wu, Y.; Yuan, Y. Ship Target Detection in Optical Remote Sensing Images Based on E2YOLOX-VFL. Remote Sens. 2024, 16, 340. [Google Scholar] [CrossRef]
  11. Guan, Q.; Liu, Y.; Chen, L.; Zhao, S.; Li, G. Aircraft Detection and Fine-Grained Recognition Based on High-Resolution Remote Sensing Images. Electronics 2023, 12, 3146. [Google Scholar] [CrossRef]
  12. Redmon, J.; Divvala, S.; Girshick, R.; Farhadi, A. You only look once: Unified, real-time object detection. In Proceedings of the IEEE Conference on Computer Vision and Pattern Recognition, Las Vegas, NV, USA, 27–30 June 2016; pp. 779–788. [Google Scholar]
  13. Ren, S.; He, K.; Girshick, R.; Sun, J. Faster r-cnn: Towards real-time object detection with region proposal networks. In Proceedings of the NIPS’15: Proceedings of the 28th International Conference on Neural Information Processing Systems, Montreal, QC, Canada, 7–12 December 2015; p. 28. [Google Scholar]
  14. Lin, T.-Y.; Goyal, P.; Girshick, R.; He, K.; Dollár, P. Focal loss for dense object detection. In Proceedings of the IEEE International Conference on Computer Vision, Venice, Italy, 22–29 October 2017; pp. 2980–2988. [Google Scholar]
  15. Ding, J.; Xue, N.; Long, Y.; Xia, G.-S.; Lu, Q. Learning RoI transformer for oriented object detection in aerial images. In Proceedings of the IEEE/CVF Conference on Computer Vision and Pattern Recognition, Long Beach, CA, USA, 15–20 June 2019; pp. 2849–2858. [Google Scholar]
  16. Yang, X.; Yan, J.; Feng, Z.; He, T. R3det: Refined single-stage detector with feature refinement for rotating object. Proc. AAAI Conf. Artif. Intell. 2021, 35, 3163–3171. [Google Scholar] [CrossRef]
  17. Han, J.; Ding, J.; Li, J.; Xia, G.-S. Align deep features for oriented object detection. IEEE Trans. Geosci. Remote Sens. 2021, 60, 5602511. [Google Scholar] [CrossRef]
  18. Han, J.; Ding, J.; Xue, N.; Xia, G.-S. Redet: A rotation-equivariant detector for aerial object detection. In Proceedings of the IEEE/CVF Conference on Computer Vision and Pattern Recognition, Nashville, TN, USA, 20–25 June 2021; pp. 2786–2795. [Google Scholar]
  19. Guo, Z.; Liu, C.; Zhang, X.; Jiao, J.; Ji, X.; Ye, Q. Beyond bounding-box: Convex-hull feature adaptation for oriented and densely packed object detection. In Proceedings of the IEEE/CVF Conference on Computer Vision and Pattern Recognition, Nashville, TN, USA, 20–25 June 2021; pp. 8792–8801. [Google Scholar]
  20. Xie, X.; Cheng, G.; Wang, J.; Yao, X.; Han, J. Oriented R-CNN for object detection. In Proceedings of the IEEE/CVF International Conference on Computer Vision, Montreal, QC, Canada, 10–17 October 2021; pp. 3520–3529. [Google Scholar]
  21. Yang, X.; Yan, J.; Ming, Q.; Wang, W.; Zhang, X.; Tian, Q. Rethinking rotated object detection with gaussian wasserstein distance loss. In Proceedings of the International Conference on Machine Learning, PMLR, Virtual Event, 18–24 July 2021; pp. 11830–11841. [Google Scholar]
  22. Yang, X.; Yang, X.; Yang, J.; Ming, Q.; Wang, W.; Tian, Q.; Yan, J. Learning high-precision bounding box for rotated object detection via kullback-leibler divergence. Adv. Neural Inf. Process. Syst. 2021, 34, 18381–18394. [Google Scholar]
  23. Hou, L.; Lu, K.; Xue, J.; Li, Y. Shape-adaptive selection and measurement for oriented object detection. Proc. AAAI Conf. Artif. Intell. 2022, 36, 923–932. [Google Scholar] [CrossRef]
  24. Li, W.; Chen, Y.; Hu, K.; Zhu, J. Oriented reppoints for aerial object detection. In Proceedings of the IEEE/CVF Conference on Computer Vision and Pattern Recognition, New Orleans, LA, USA, 18–24 June 2022; pp. 1829–1838. [Google Scholar]
  25. Yang, X.; Zhou, Y.; Zhang, G.; Yang, J.; Wang, W.; Yan, J.; Zhang, X.; Tian, Q. The KFIoU loss for rotated object detection. arXiv 2022, arXiv:2201.12558. [Google Scholar]
  26. Hou, L.; Lu, K.; Yang, X.; Li, Y.; Xue, J. G-rep: Gaussian representation for arbitrary-oriented object detection. Remote Sens. 2023, 15, 757. [Google Scholar] [CrossRef]
  27. Chen, Y.; Yuan, X.; Wu, R.; Wang, J.; Hou, Q.; Cheng, M.-M. YOLO-MS: Rethinking Multi-Scale Representation Learning for Real-time Object Detection. arXiv 2023, arXiv:2308.05480. [Google Scholar]
  28. Li, Y.; Hou, Q.; Zheng, Z.; Cheng, M.-M.; Yang, J.; Li, X. Large Selective Kernel Network for Remote Sensing Object Detection. arXiv 2023, arXiv:2303.09030. [Google Scholar]
  29. Lin, T.-Y.; Dollár, P.; Girshick, R.; He, K.; Hariharan, B.; Belongie, S. Feature pyramid networks for object detection. In Proceedings of the IEEE Conference on Computer Vision and Pattern Recognition, Honolulu, HI, USA, 21–26 July 2017; pp. 2117–2125. [Google Scholar]
  30. Xie, S.; Girshick, R.; Dollár, P.; Tu, Z.; He, K. Aggregated residual transformations for deep neural networks. In Proceedings of the IEEE Conference on Computer Vision and Pattern Recognition, Honolulu, HI, USA, 21–26 July 2017; pp. 1492–1500. [Google Scholar]
  31. Liu, C.; Yu, S.; Yu, M.; Wei, B.; Li, B.; Li, G. Adaptive smooth L1 loss: A better way to regress scene texts with extreme aspect ratios. In Proceedings of the 2021 IEEE Symposium on Computers and Communications (ISCC), Athens, Greece, 5–8 September 2021; IEEE: New York, NY, USA, 2021; pp. 1–7. [Google Scholar]
  32. He, K.; Zhang, X.; Ren, S.; Sun, J. Deep residual learning for image recognition. In Proceedings of the IEEE Conference on Computer Vision and Pattern Recognition, Las Vegas, NV, USA, 27–30 June 2016; pp. 770–778. [Google Scholar]
  33. Xu, X.; Jiang, Y.; Chen, W.; Huang, Y.; Zhang, Y.; Sun, X. Damo-yolo: A report on real-time object detection design. arXiv 2022, arXiv:2211.15444. [Google Scholar]
  34. Park, H.J.; Kang, J.W.; Kim, B.G. ssFPN: Scale Sequence (S 2) Feature-Based Feature Pyramid Network for Object Detection. Sensors 2023, 23, 4432. [Google Scholar] [CrossRef] [PubMed]
  35. Luo, Y.; Cao, X.; Zhang, J.; Guo, J.; Shen, H.; Wang, T.; Feng, Q. CE-FPN: Enhancing channel information for object detection. Multimed. Tools Appl. 2022, 81, 30685–30704. [Google Scholar] [CrossRef]
  36. Dosovitskiy, A.; Beyer, L.; Kolesnikov, A.; Weissenborn, D.; Zhai, X.; Unterthiner, T.; Dehghani, M.; Minderer, M.; Heigold, G.; Gelly, S.; et al. An image is worth 16x16 words: Transformers for image recognition at scale. arXiv 2020, arXiv:2010.11929. [Google Scholar]
  37. Liu, Y.; Shao, Z.; Hoffmann, N. Global attention mechanism: Retain information to enhance channel-spatial interactions. arXiv 2021, arXiv:2112.05561. [Google Scholar]
  38. Dai, J.; Qi, H.; Xiong, Y.; Li, Y.; Zhang, G.; Hu, H.; Wei, Y. Deformable convolutional networks. In Proceedings of the IEEE International Conference on Computer Vision, Venice, Italy, 22–29 October 2017; pp. 764–773. [Google Scholar]
  39. Xia, G.-S.; Bai, X.; Ding, J.; Zhu, Z.; Belongie, S.; Luo, J.; Datcu, M.; Pelillo, M.; Zhang, L. DOTA: A large-scale dataset for object detection in aerial images. In Proceedings of the IEEE Conference on Computer Vision and Pattern Recognition, Salt Lake City, UT, USA, 18–22 June 2018; pp. 3974–3983. [Google Scholar]
  40. Sun, X.; Wang, P.; Yan, Z.; Xu, F.; Wang, R.; Diao, W.; Chen, J.; Li, J.; Feng, Y.; Xu, T.; et al. FAIR1M: A benchmark dataset for fine-grained object recognition in high-resolution remote sensing imagery. ISPRS J. Photogramm. Remote Sens. 2022, 184, 116–130. [Google Scholar] [CrossRef]
Figure 1. Structure diagram of the RoI Transformer.
Remotesensing 16 04487 g001
Figure 2. Overall framework for the RoI Transformer-DSF.
Remotesensing 16 04487 g002
Figure 3. Interaction between DSM and FPN.
Remotesensing 16 04487 g003
Figure 4. The structure diagram of the DSM.
Remotesensing 16 04487 g004
Figure 5. The structure diagram of the SFM.
Remotesensing 16 04487 g005
Figure 6. Comparison of three types of blocks. (a) ResNet_Block (b) ResNext_Block (c) ResNext_FC_Block.
Remotesensing 16 04487 g006
Figure 7. Algorithm loss before and after using the KFIoU.
Remotesensing 16 04487 g007
Figure 8. Loss function curves for the FAIR1M and DOTA datasets.
Remotesensing 16 04487 g008
Figure 9. Example of DOTAv1.0 Dataset.
Remotesensing 16 04487 g009
Figure 10. Example of FAIR1M (plane) dataset.
Remotesensing 16 04487 g010
Figure 11. DOTA dataset detection results.
Remotesensing 16 04487 g011
Figure 12. Training results of the DOTA dataset.
Remotesensing 16 04487 g012
Figure 13. FAIR1M dataset detection results.
Remotesensing 16 04487 g013
Figure 14. Training results of the FAIR1M dataset.
Remotesensing 16 04487 g014
Figure 15. Detection results before and after algorithmic improvements. (a) Results of the RoI Transformer, (b) Results of the RoI Transformer-DSF.
Remotesensing 16 04487 g015aRemotesensing 16 04487 g015b
Table 1. Experimental results of different blocks.
AlgorithmBlockmAP0.5 (%)
RoI TransformerResNet_block (original) 80.53
ResNext_block80.72
ResNext_FC_block (our)81.19
Table 2. Experimental results of different loss functions.
AlgorithmLoss SetmAP0.5 (%)
RoI TransformerCrossEntropy Loss+SmoothL1 Loss (original) 80.53
Focal Loss+SmoothL1 Loss80.62
Focal Loss+KFIoU Loss80.77
CrossEntropy Loss+KFIoU Loss81.03
Table 3. Comparison experiment results of DOTA dataset.
AlgorithmSizemAP0.5 (%)APmax (%)APmin (%)Recallmax (%)Recallmin (%)
RoI Transformer1024 × 102480.5390.962.399.672.2
SASM1024 × 102470.8190.742.696.871.3
ReDet1024 × 102478.7590.961.397.775.5
R3Det1024 × 102475.3790.956.096.474.2
Faster Rcnn1024 × 102478.6090.859.197.769.6
Rotated RetinaNet1024 × 102477.5790.852.699.273.6
Rotate RepPoints1024 × 102466.1890.034.496.568.9
KFIoU1024 × 102479.8890.962.699.278.3
GWD1024 × 102479.4190.962.098.983.5
S2ANet1024 × 102479.5890.962.699.278.0
RoI Transformer-DSF1024 × 102483.5390.769.199.677.7
Table 4. Detection results of various remote sensing objects in the DOTA dataset.
ClassGtsDetsRecall (%)AP (%)
plane4449684096.490.7
ship18,53724,71195.989.9
storage tank4740698677.772.1
baseball diamond358166691.984.6
tennis course1512266898.490.7
basketball course266138399.687.9
ground track field212119497.286.1
harbor4167841592.686.8
bridge785398385.371.8
large vehicle881921,20198.388.3
small vehicle10,57925,23892.383.3
helicopter122168299.288.5
roundabout275191186.979.0
soccer ball field251186095.684.1
swimming pool732262586.269.1
In this table, Gts and Dets mean the number of ground truths and detections, respectively.
Table 5. The AP results of different algorithms.
AlgorithmSASMReDetR3DetFaster RcnnRotated RetinaNetRotated RepPointsKFIoUGWDS2ANetRoI TransformerRoI Transformer-DSF
plane90.1090.5090.3090.2090.5090.0090.6090.6090.6090.5090.70
ship81.0089.4088.3088.7088.0078.4089.4089.4089.1089.8089.90
storage tank73.2071.5069.6063.2069.0071.9078.6079.1078.7071.1072.10
baseball diamond77.7087.6082.3086.6088.1076.9085.4085.2086.2086.9084.60
tennis course90.7090.9090.9090.8090.8090.9090.9090.9090.9090.9090.70
basketball course79.1088.5083.5088.3084.6074.3089.7088.5089.4089.2087.90
ground track field75.6080.3084.1085.1080.6074.3080.3080.1075.7083.6086.10
harbor74.6079.2075.7078.2072.8054.8078.1077.9077.7079.3086.80
bridge53.4061.3057.4059.1052.6045.5062.6062.0062.6062.3071.80
large vehicle81.0086.4079.7083.1082.8059.1086.8087.0086.4086.2088.30
small vehicle58.5069.7071.3072.3071.3061.9071.8072.4072.1073.2083.30
helicopter42.6076.4056.0078.0078.3034.4071.8069.7073.3079.0088.50
roundabout71.3073.5075.9076.3081.2070.7083.0081.1084.0078.3079.00
soccer ball field53.0074.3060.2070.9065.5050.5072.0071.0072.4079.6084.10
swimming pool60.2061.9065.3068.1067.5059.8067.1066.3064.8068.1069.10
mAP (%)70.8178.7575.3778.6077.5766.1879.8879.4179.5880.5383.53
Table 6. Comparison experiment results of FAIR1M dataset.
AlgorithmSizemAP0.5 (%)APmax (%)APmin (%)Recallmax (%)Recallmin (%)
RoI Transformer1024 × 102442.27 *75.61.094.414.3
SASM1024 × 102433.33 *63.80.498.567.9
ReDet1024 × 102441.99 *70.65.394.917.9
R3Det1024 × 102441.82 *83.90.398.964.3
Faster Rcnn1024 × 102441.76 *83.62.896.713.2
Rotated RetinaNet1024 × 102438.31 *77.60.298.867.9
GWD1024 × 102442.28 *81.60.298.367.9
S2ANet1024 × 102442.95 *86.30.397.867.9
RoI Transformer-DSF1024 × 102444.1481.10.298.264.3
In this table, * means that the results from our previous work [11].
Table 7. Detection results of various types of aircraft.
ClassGtsDetsRecall (%)AP (%)
Boeing737237011,62796.838.3
Boeing7471100400397.681.1
Boeing777375486597.620.7
Boeing787869599896.951.5
ARJ21174988395.412.0
C91928815164.30.2
A220268712,52598.245.5
A3211378932996.458.1
A330696555695.549.7
A350442409692.156.8
Other-airplane519218,03395.471.7
Table 8. Detection results of various remote sensing objects in the DOTA dataset.
AlgorithmSASMReDetR3DetFaster RcnnRotated RetinaNetGWDS2ANetRoI TransformerRoI Transformer-DSF
Boeing73738.1038.0037.4035.2034.7038.8038.6040.5038.30
Boeing74757.7077.9084.2083.6077.5081.6086.3075.6081.10
Boeing77713.3015.3016.4015.8014.9018.7014.1020.7020.70
Boeing78739.3045.6047.4043.4043.6046.9046.3053.6051.50
ARJ217.7010.506.07.03.54.111.0012.3012.00
C9190.405.300.302.800.200.200.301.00.20
A22035.9041.0043.1041.0042.9045.0044.6041.9045.50
A32146.6055.4057.6056.0056.8056.8060.8047.7058.10
A33040.3052.5041.9048.3030.9039.2039.3046.4049.70
A35023.5049.9050.3054.0048.0061.4058.3055.3056.80
Other-airplane63.8070.6075.4072.1068.4072.2072.8070.0071.70
mAP (%)33.3341.9941.8241.7638.3142.2842.9542.2744.14
Table 9. Experimental results of the ablation experiment.
AlgorithmResNext_FCDSMSFMKFIoUmAP0.5 (%)
RoI Transformer 80.53
RoI Transformer+ResNext_FC 81.19
RoI Transformer+DSM 81.47
RoI Transformer+SFM 80.65
RoI Transformer+KFIoU 81.03
RoI Transformer+ResNext_FC+DSM 82.35
RoI Transformer+DSM+SFM 81.69
RoI Transformer+SFM+KFIoU 81.33
RoI Transformer+ResNext_FC+DSM+SFM 83.16
RoI Transformer+DSM+SFM+KFIoU 82.86
RoI Transformer-DSF(ours)83.53
In this table, √ means that the corresponding method was adopted.
Disclaimer/Publisher’s Note: The statements, opinions and data contained in all publications are solely those of the individual author(s) and contributor(s) and not of MDPI and/or the editor(s). MDPI and/or the editor(s) disclaim responsibility for any injury to people or property resulting from any ideas, methods, instructions or products referred to in the content.

