
Mapping Surface Deformation in Rwanda and Neighboring Areas Using SBAS-InSAR

 ,
,  ,
,  , ,
, ,  and
and
Abstract
1. Introduction
2. Study Area and Datasets
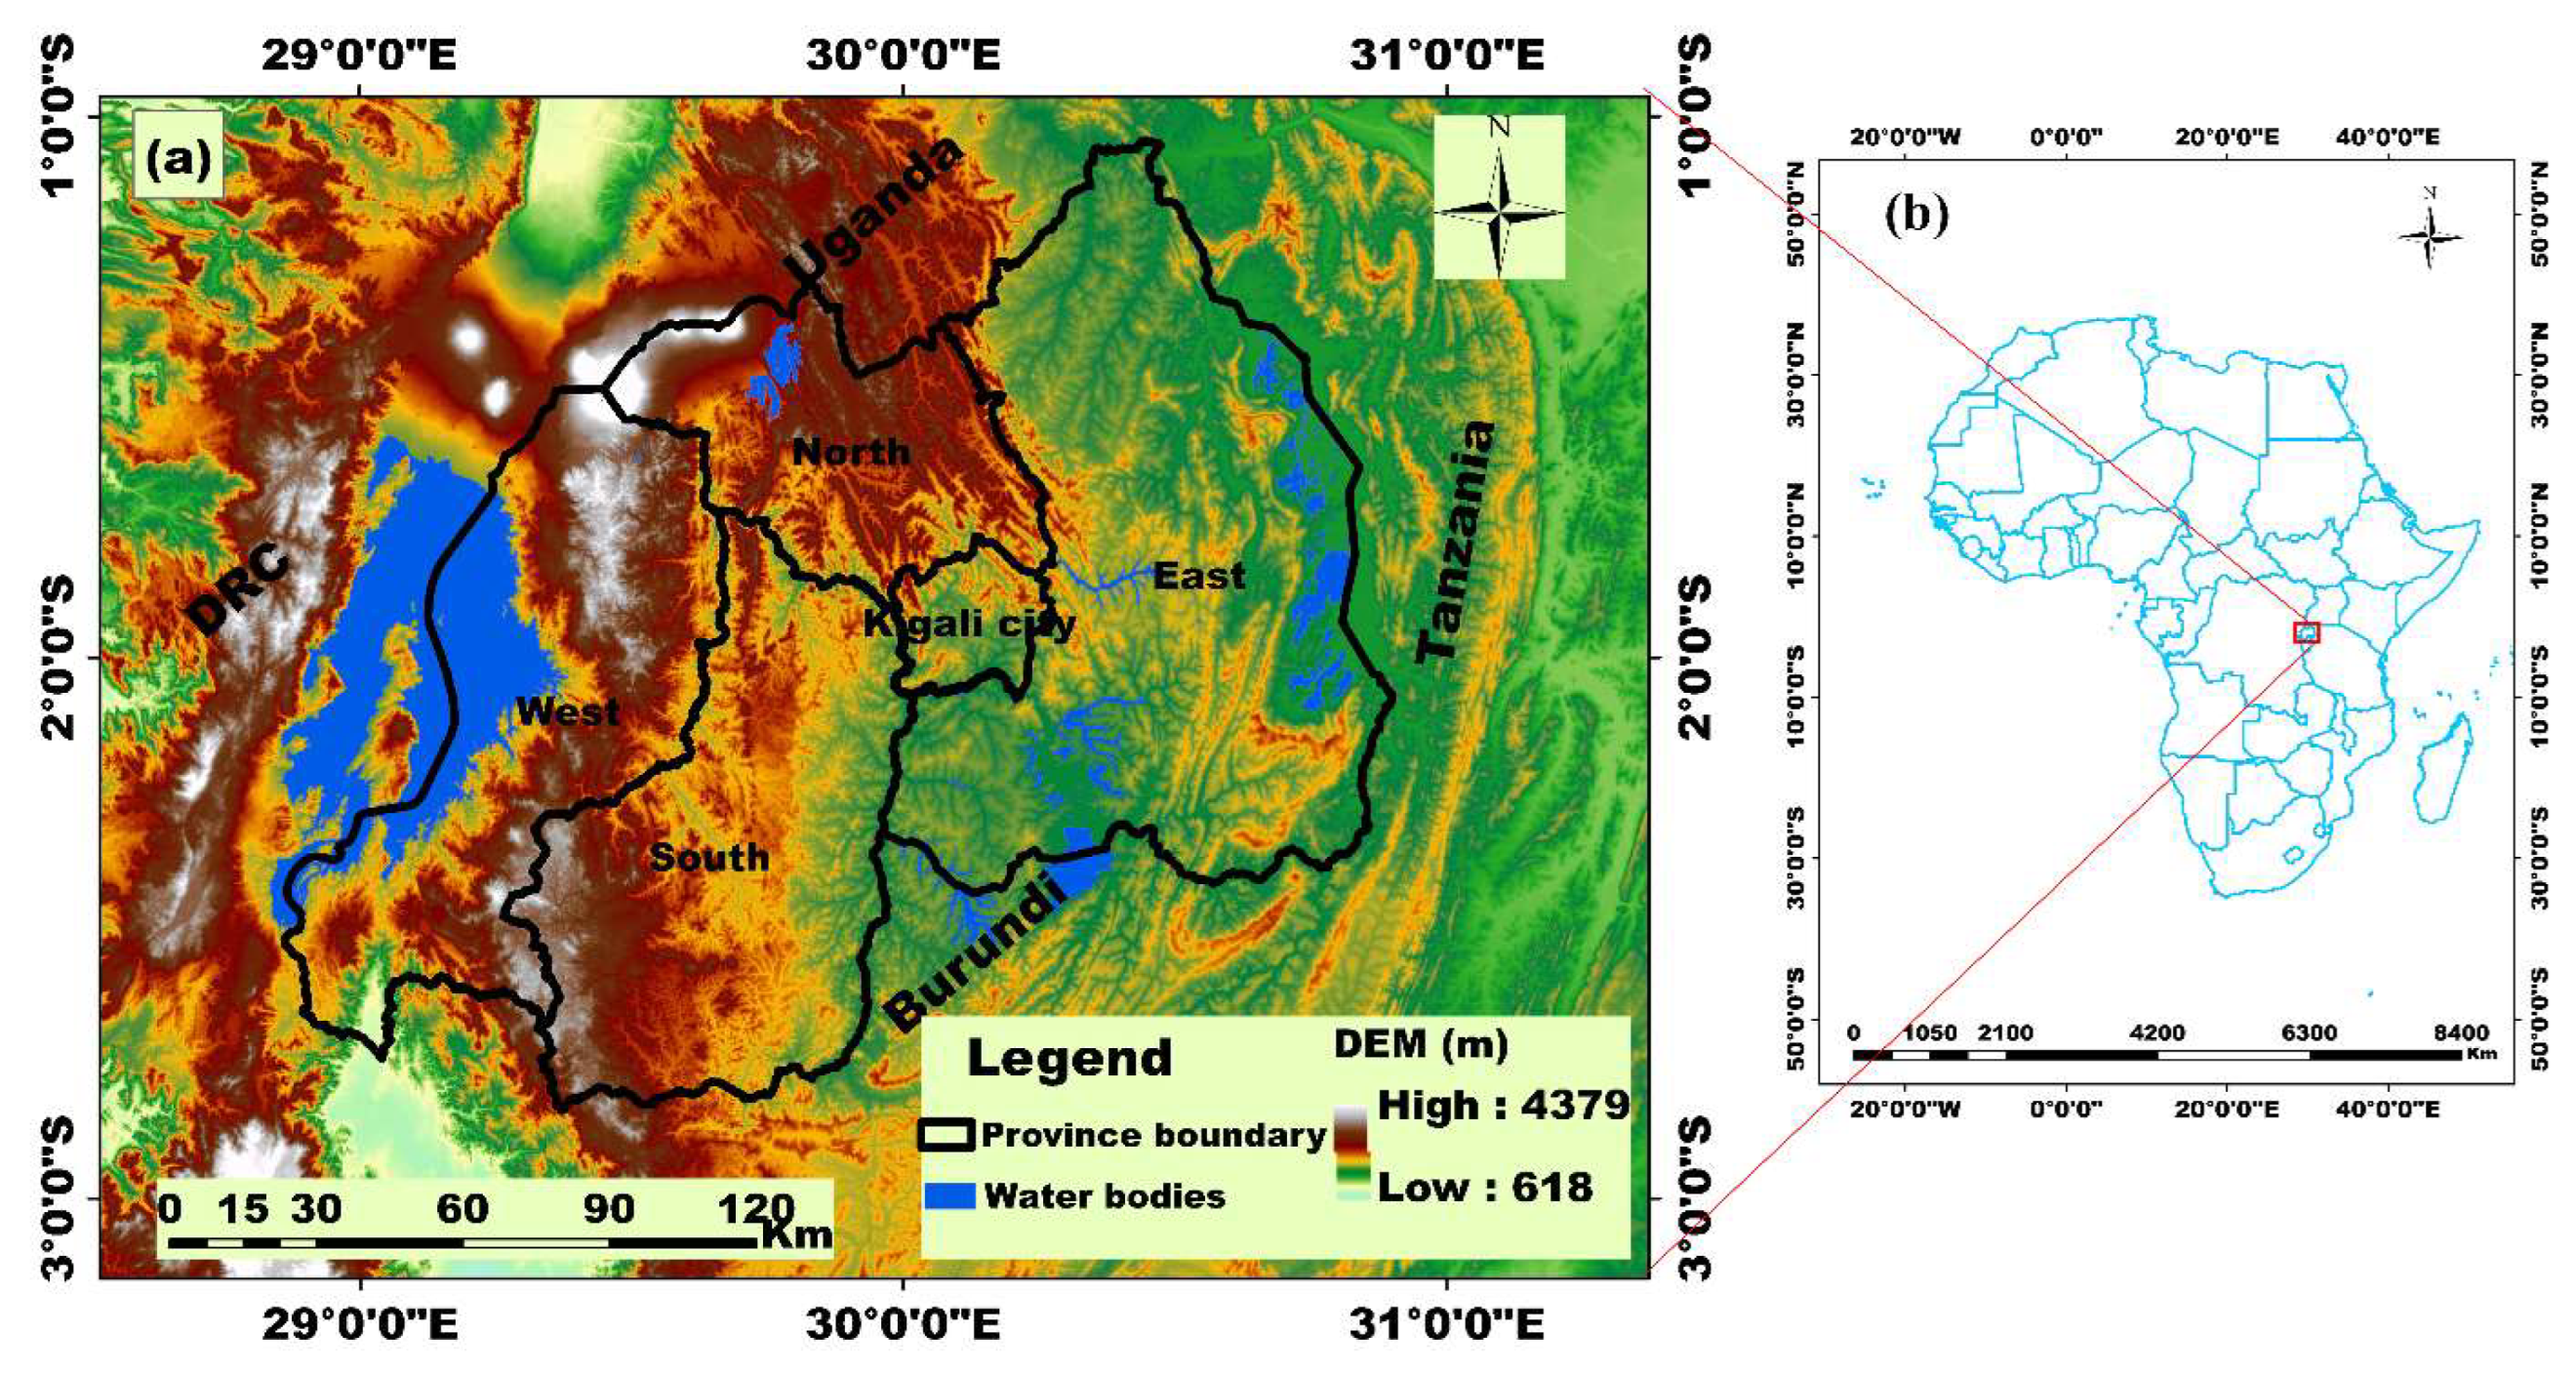
2.1. Study Area
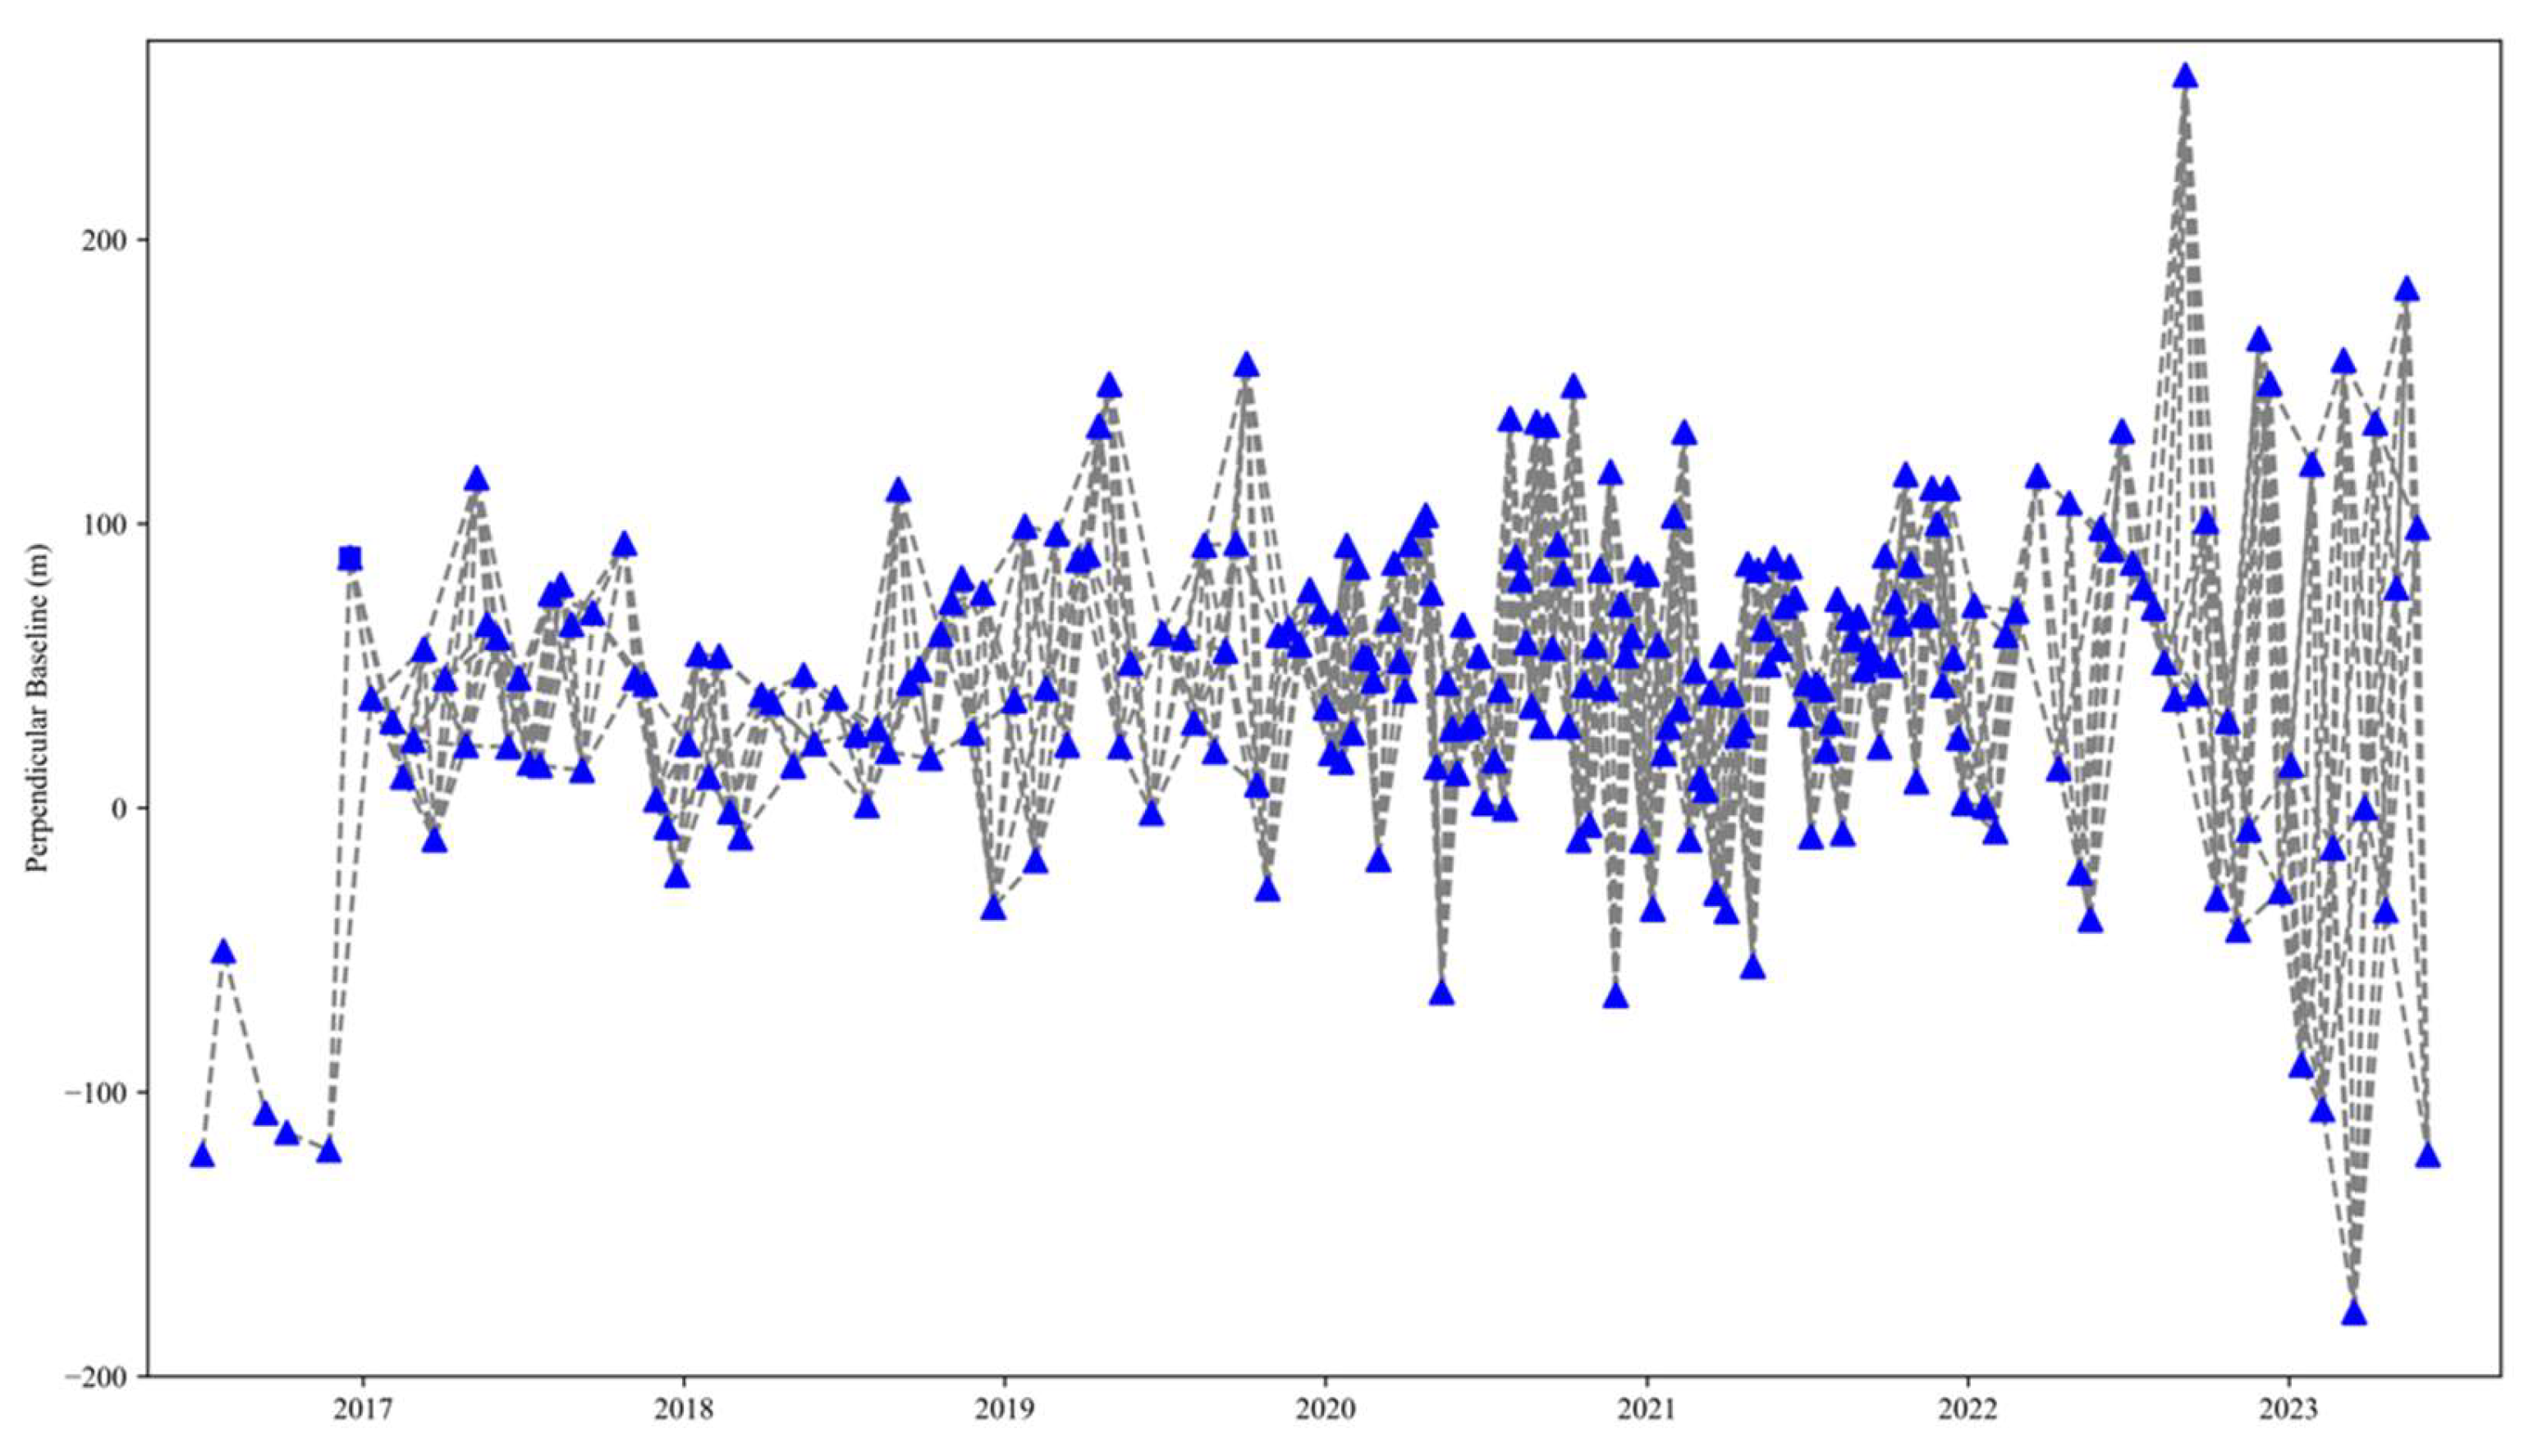
2.2. Datasets
3. Method
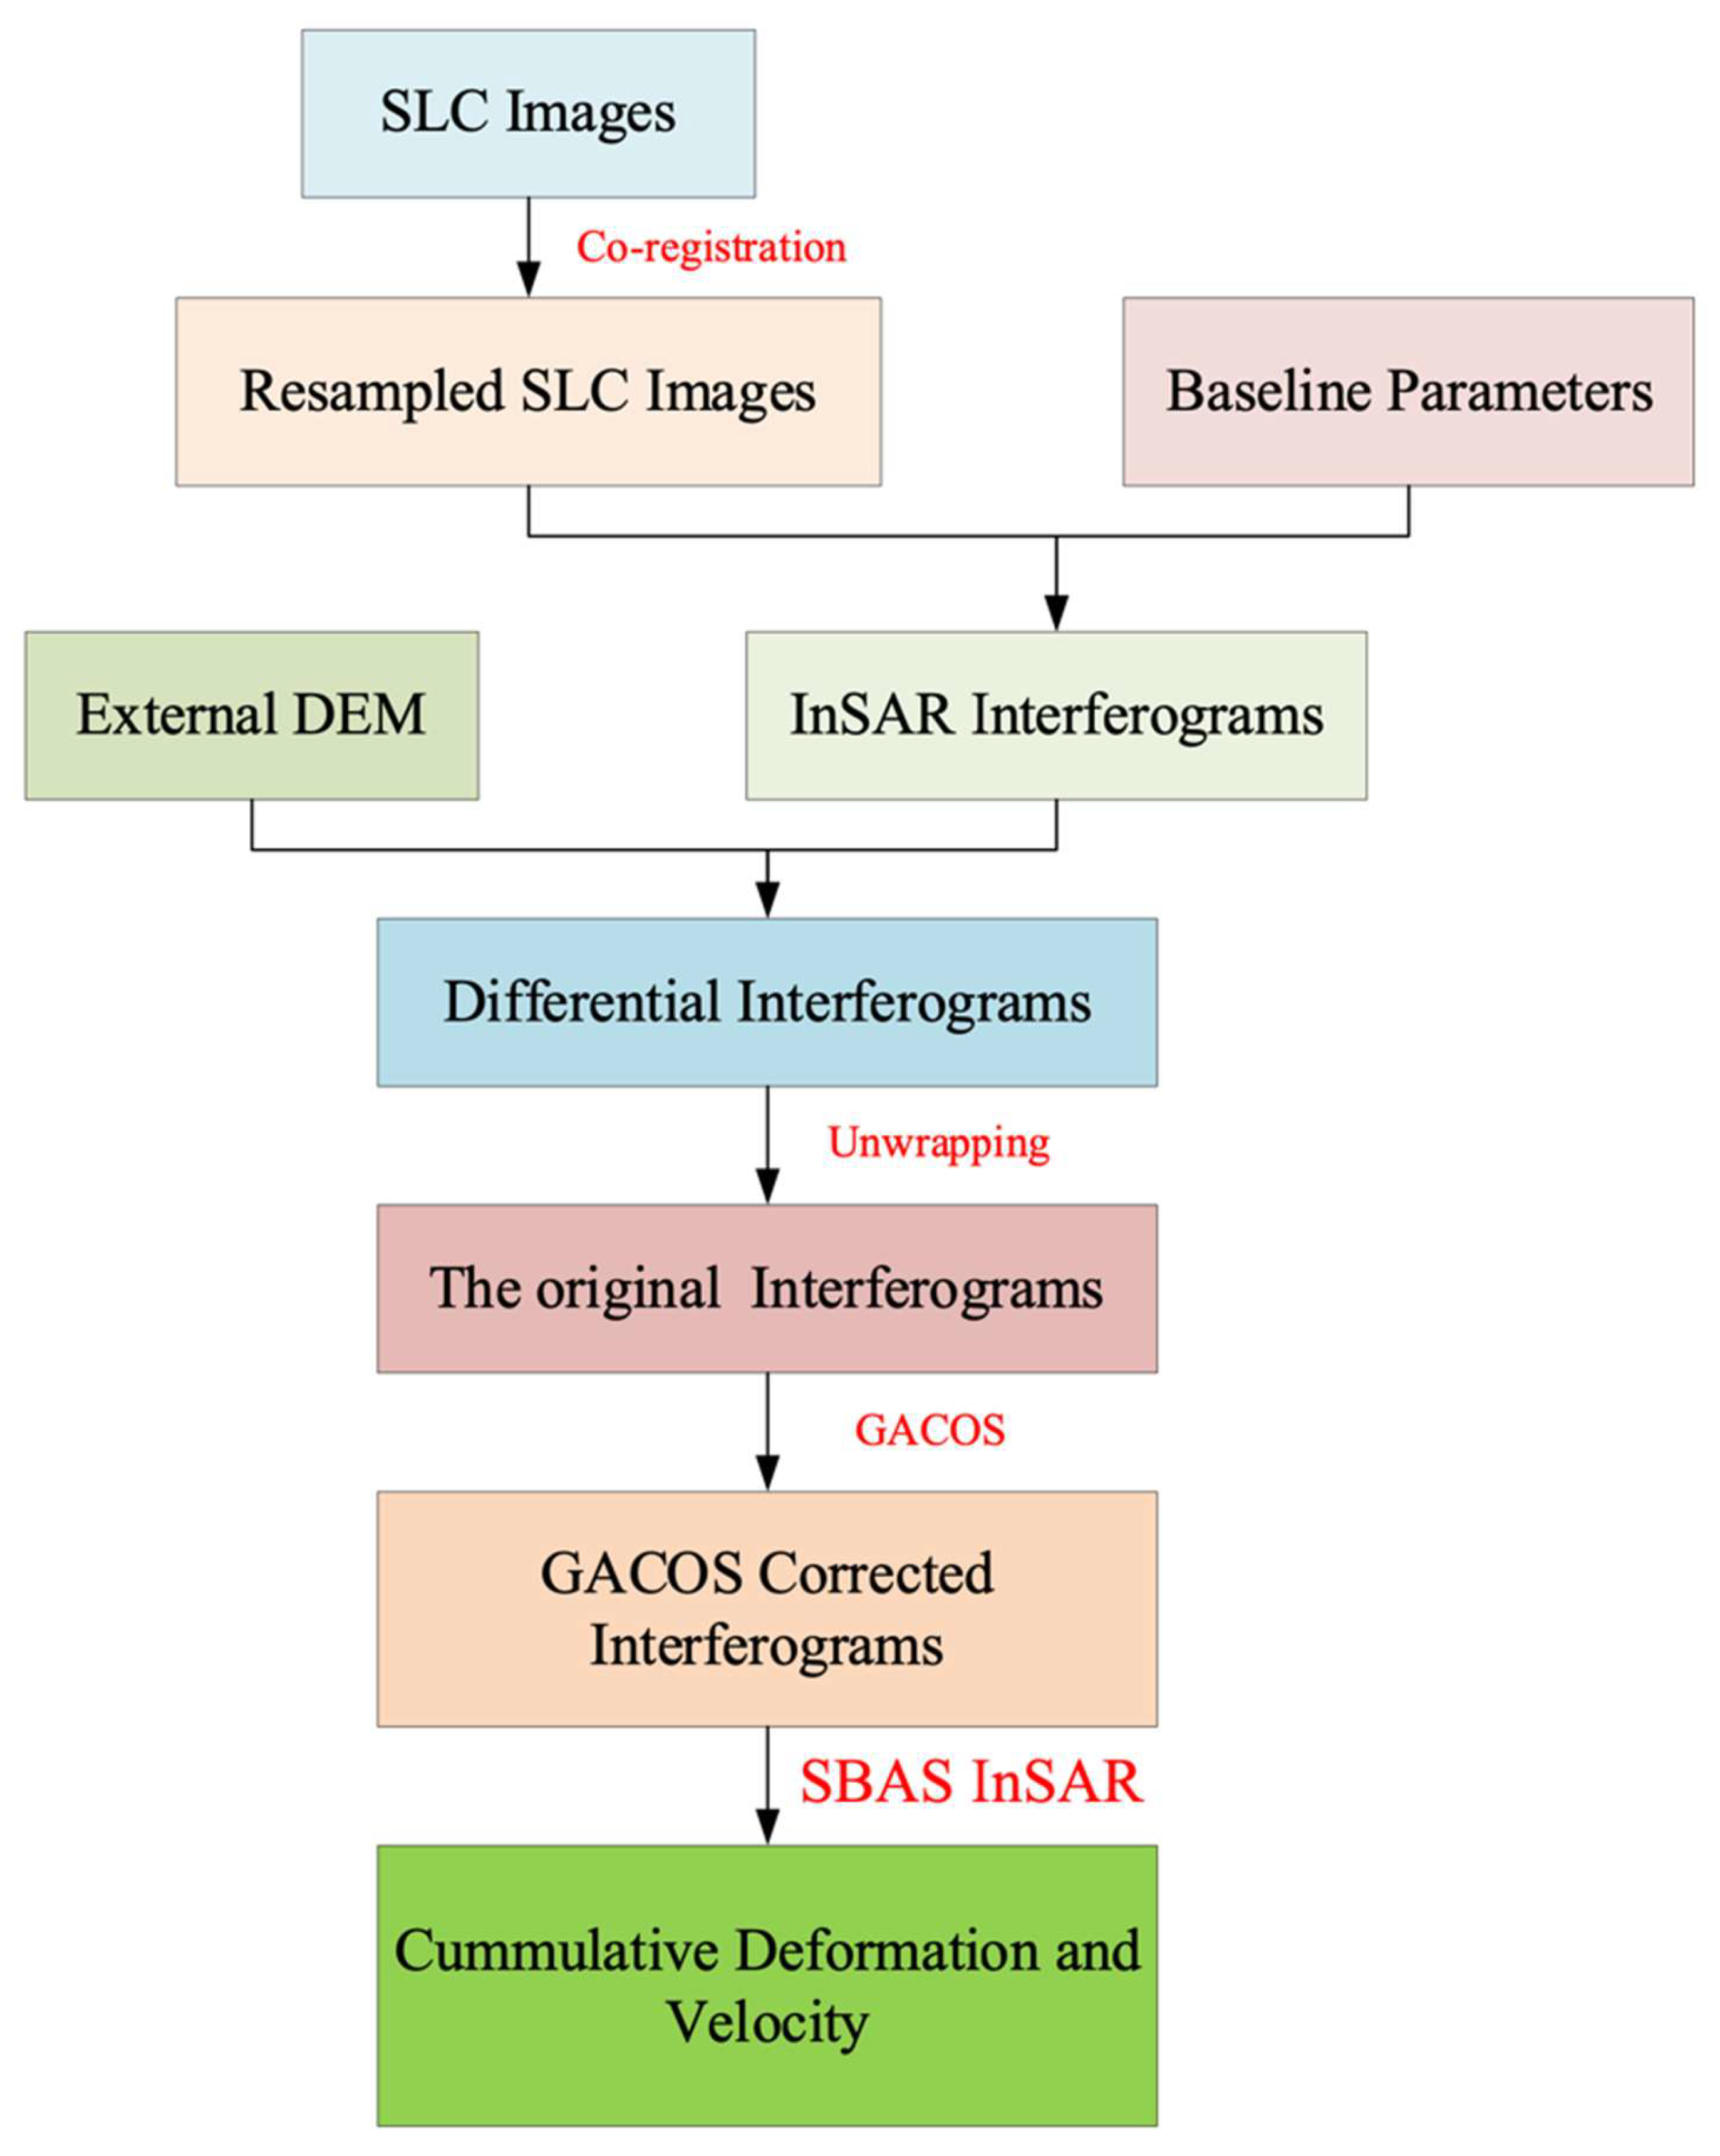
3.1. SBAS-InSAR Processing
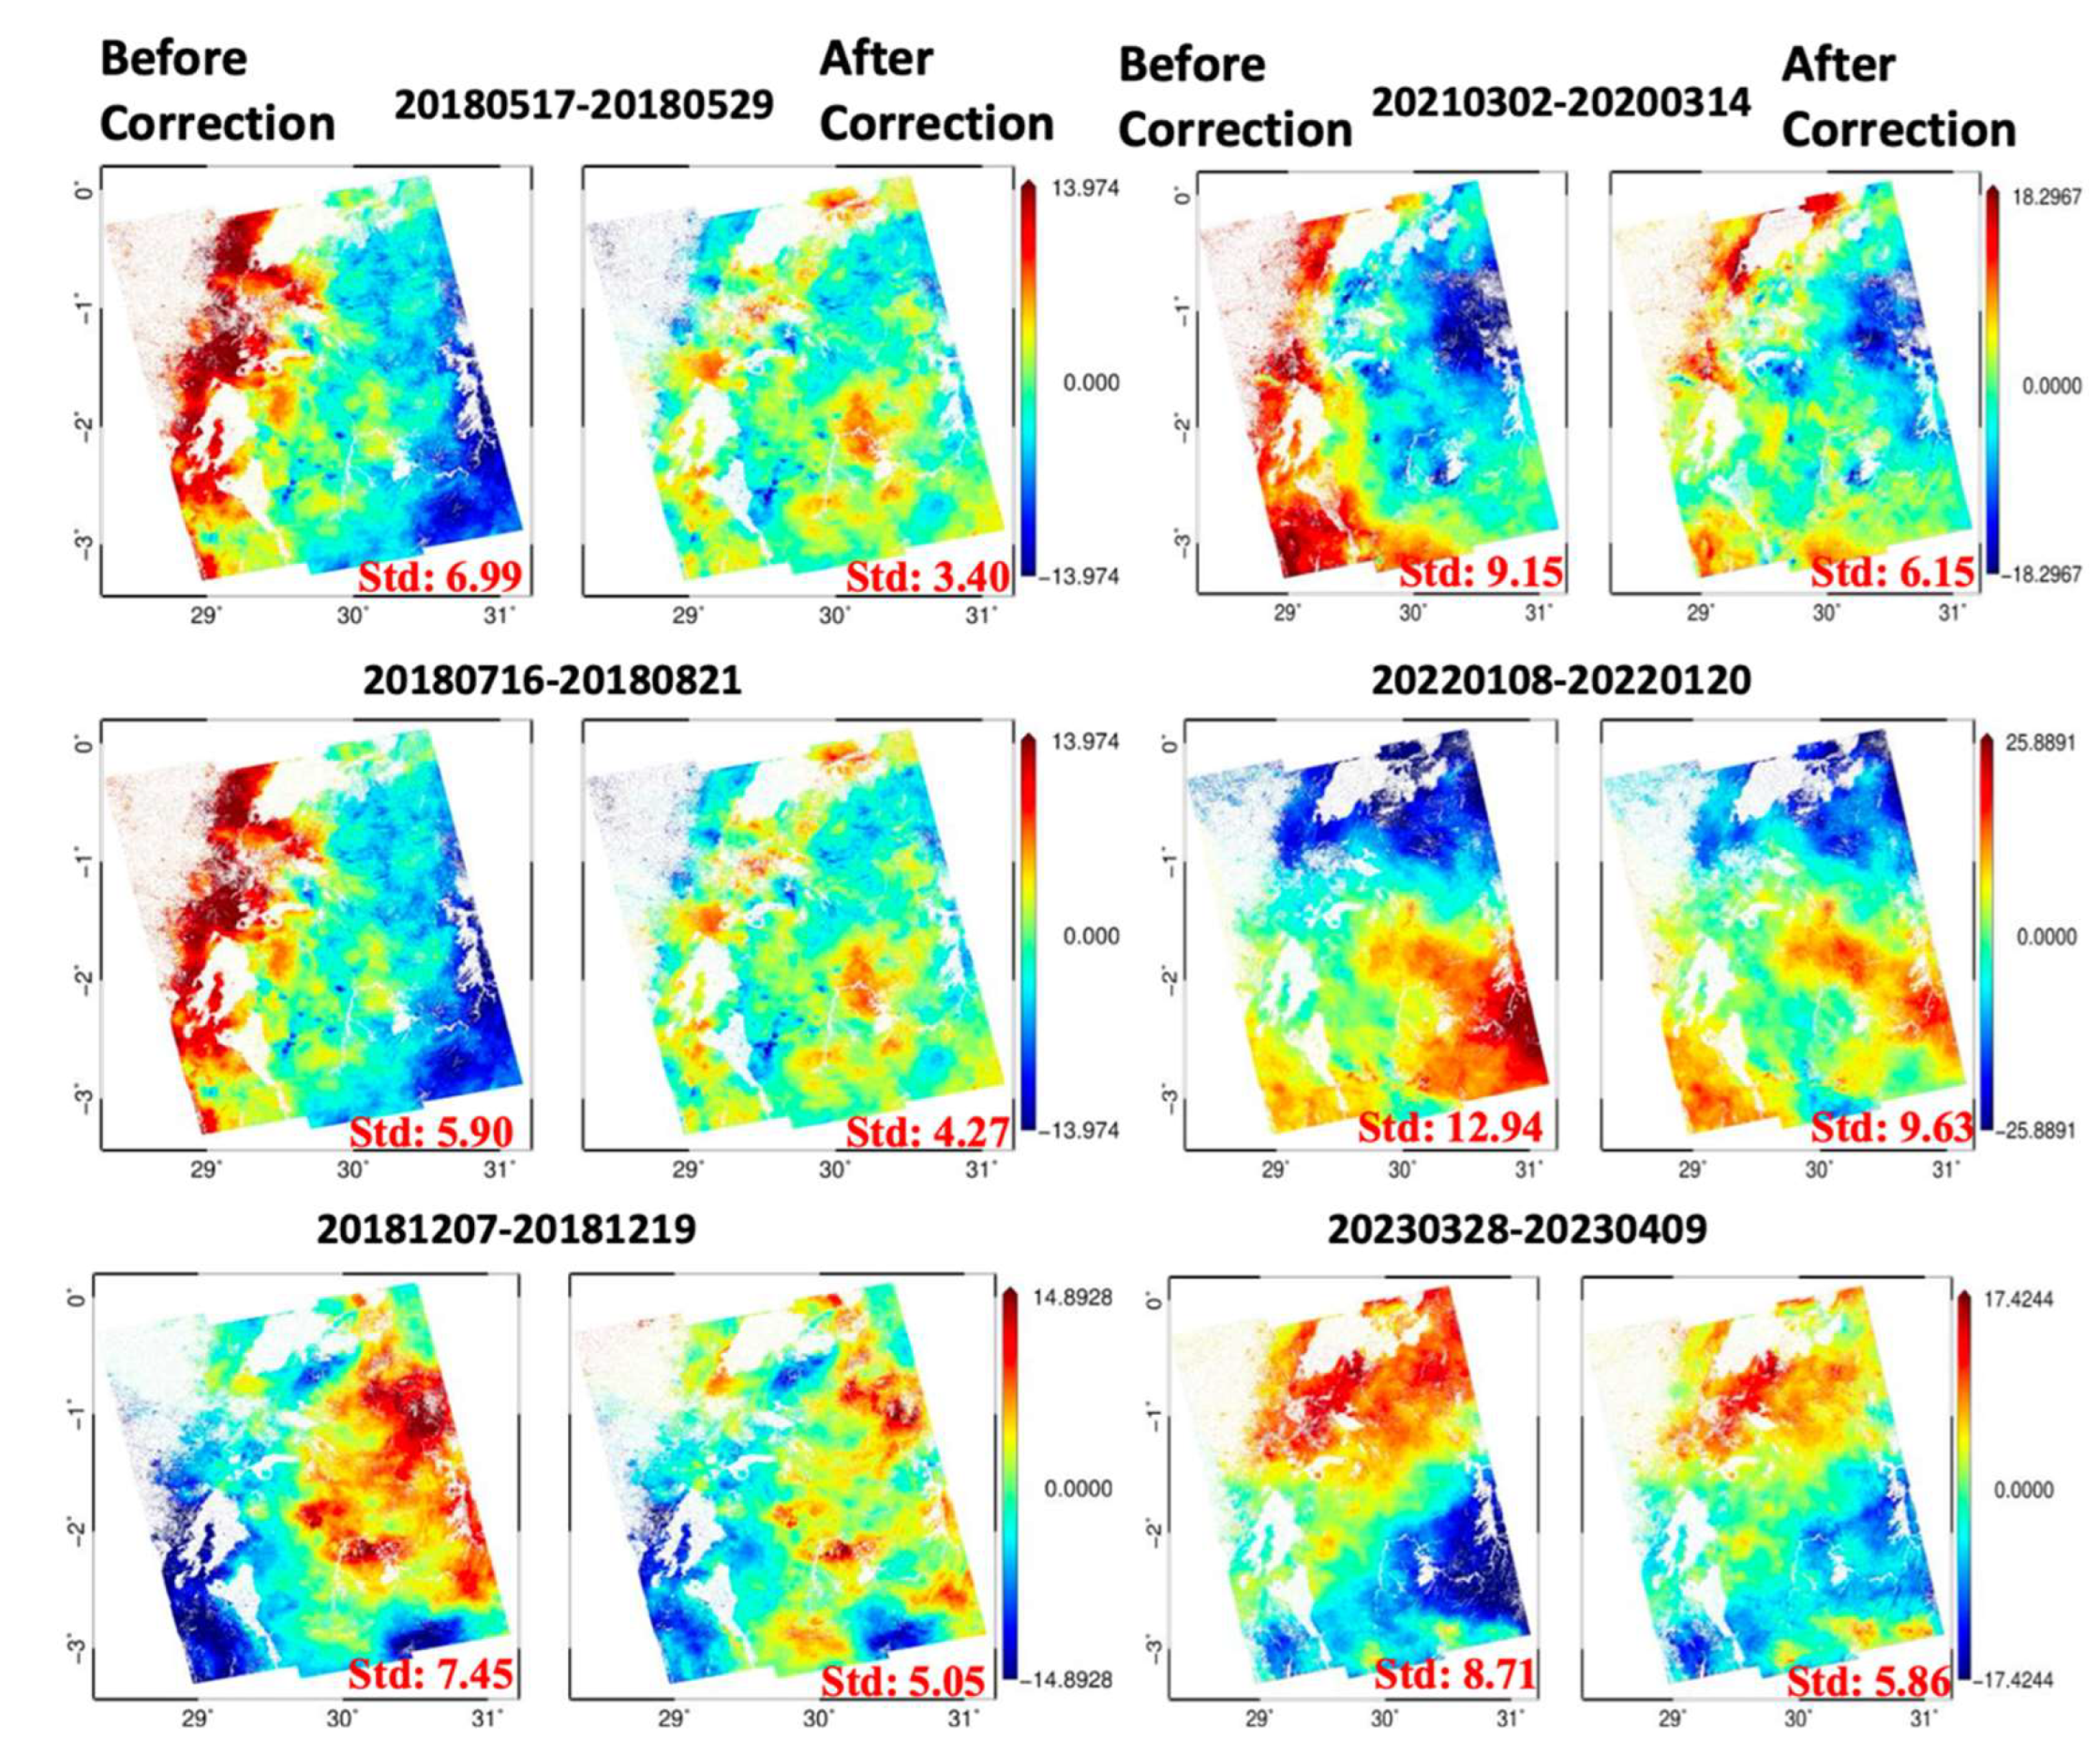
3.2. GACOS Correction
4. Results
4.1. Deformation Velocity Determination
4.2. Time Series Analysis
5. Discussion and Interpretation
5.1. Volcano, Earthquakes
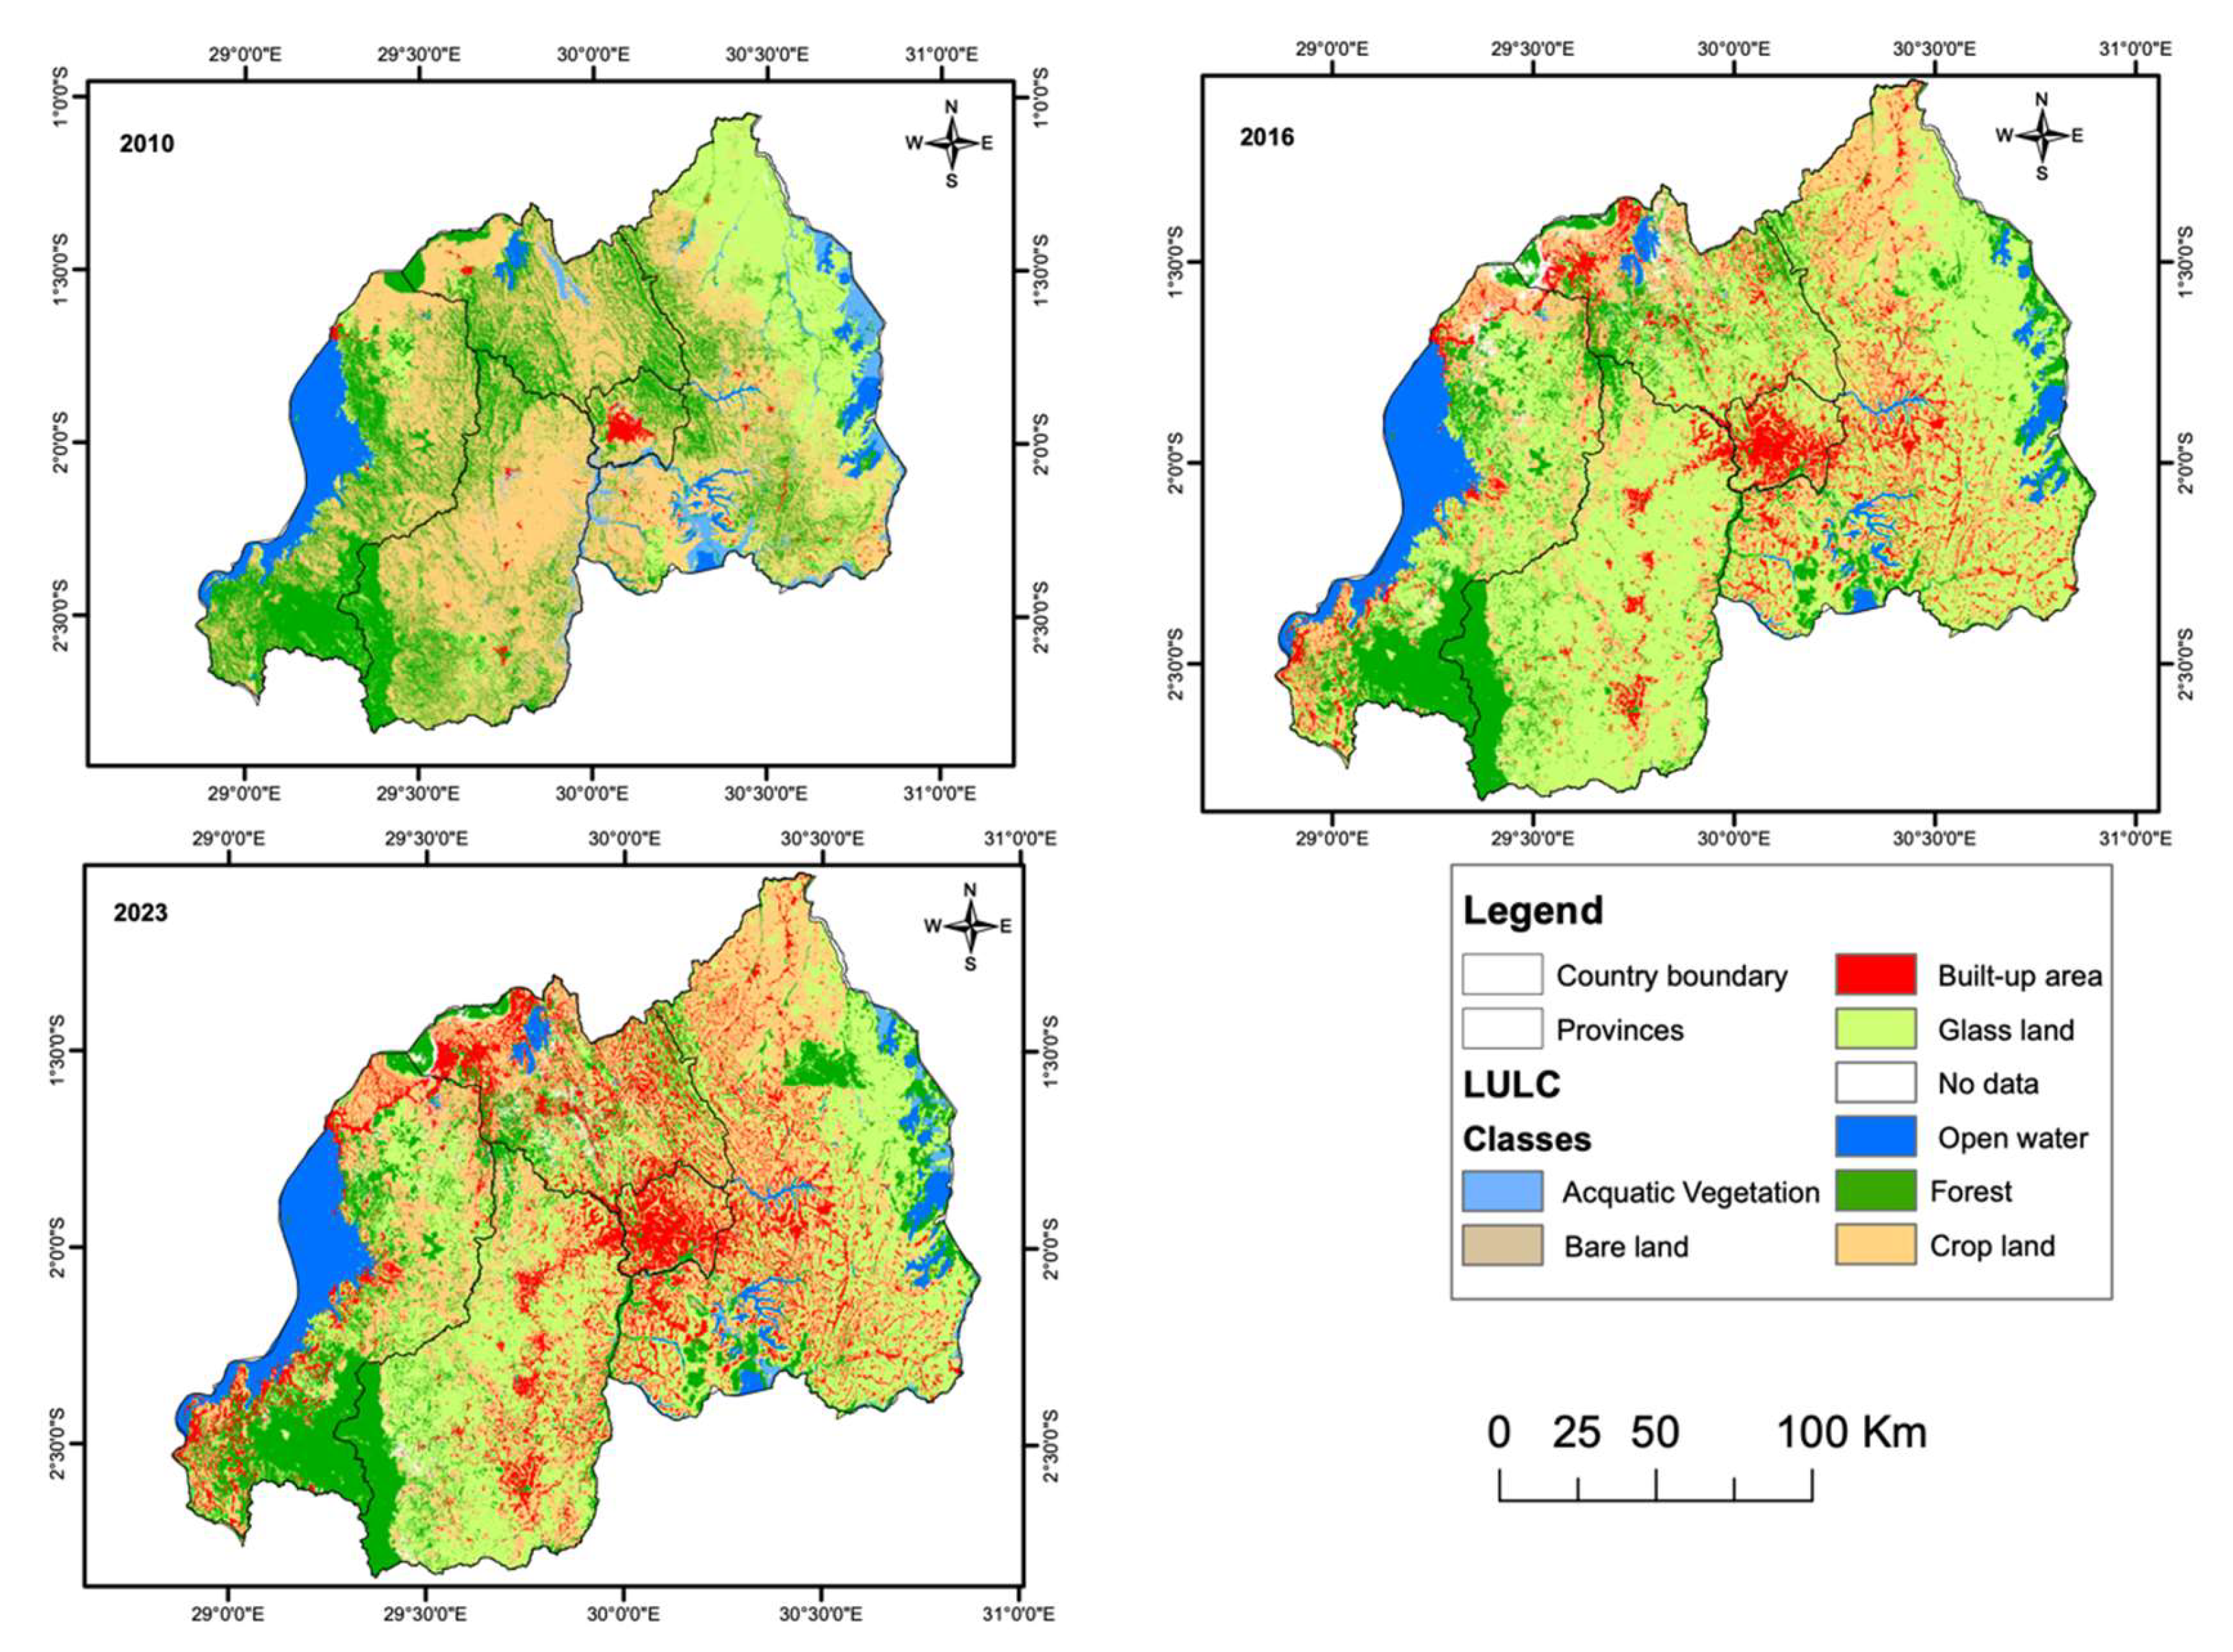
5.2. Land Use/Land Cover Change
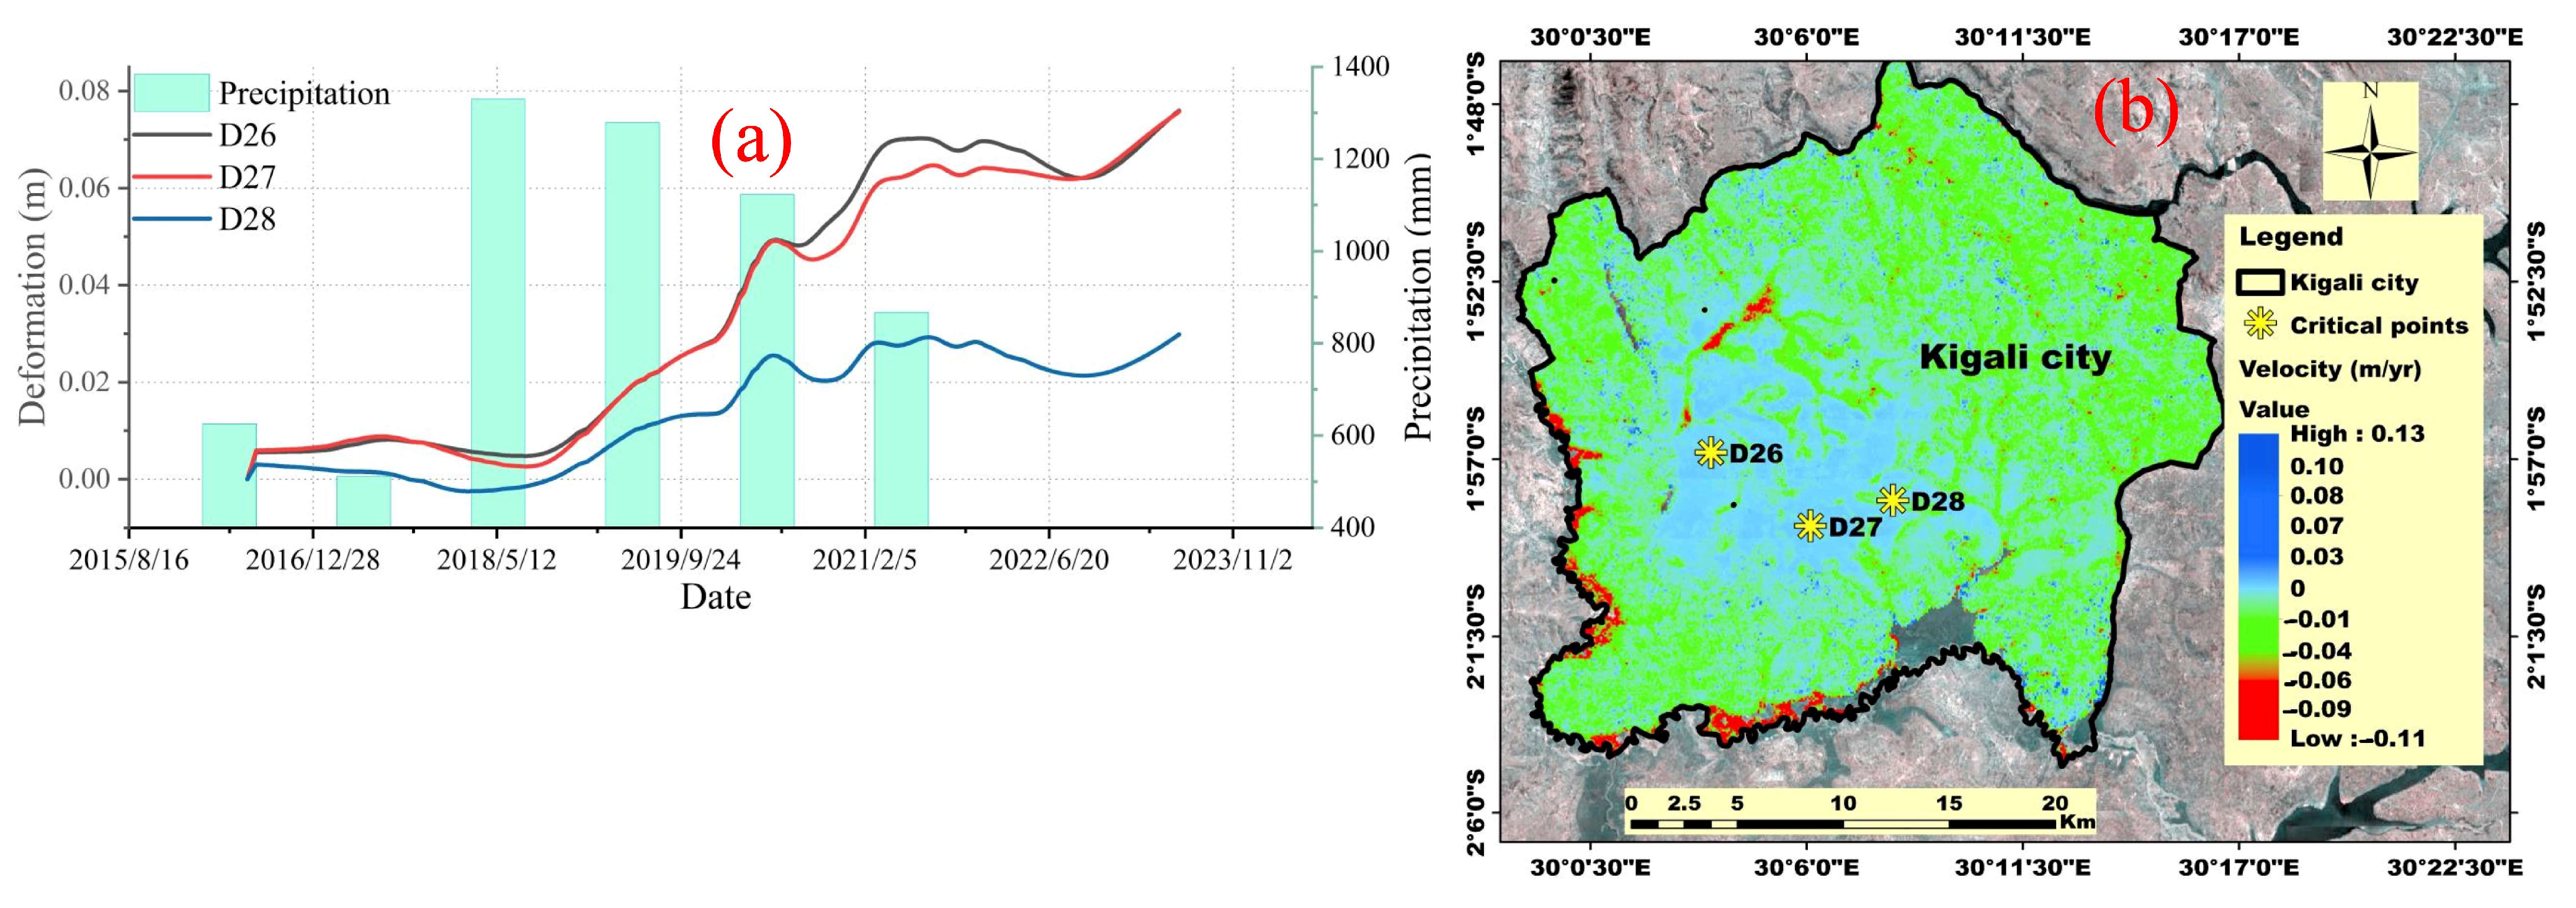
5.3. Rainfall
6. Conclusions
Author Contributions
Funding
Data Availability Statement
Acknowledgments
Conflicts of Interest
References
- Zoysa, R.S.D.; Schöne, T.; Herbeck, J.; Illigner, J.; Haghighi, M.; Simarmata, H.; Porio, E.; Rovere, A.; Hornidge, A.K. The ‘wickedness’ of governing land subsidence: Policy perspectives from urban southeast Asia. PLoS ONE 2021, 16, e0250208. [Google Scholar] [CrossRef]
- Ahmad, A.; Wang, C.; Tang, Y.; Sultan, M.; Falak, A.; Duan, W.; Wang, J. SAR-based Subsidence Monitoring and Assessment of the Factors Involved in the Occurrence of Subsidence, Lahore City. J. Resour. Ecol. 2022, 13, 826–841. [Google Scholar] [CrossRef]
- Zadeng, V. A Review of Resilience Measures for Land Subsidence-prone Areas. J. Hous. Adv. Inter. Des. 2023, 6, 1–15. [Google Scholar] [CrossRef]
- Wu, Y.; Liu, C.; Zhang, Q.; Ge, L. Bibliometric Analysis of Interferometric Synthetic Aperture Radar (InSAR) Application in Land Subsidence from 2000 to 2021. J. Sensors. 2022, 2022, 1027673. [Google Scholar] [CrossRef]
- Tzampoglou, P.; Ilia, I.; Karalis, K.; Tsangaratos, P.; Zhao, X.; Chen, W. Selected Worldwide Cases of Land Subsidence Due to Groundwater Withdrawal. Water 2023, 15, 1094. [Google Scholar] [CrossRef]
- Deng, Z.; Ke, Y.; Gong, H.; Li, X.; Li, Z. Land subsidence prediction in Beijing based on PS-InSAR technique and improved Grey-Markov model. GIScience Remote Sens. 2017, 54, 797–818. [Google Scholar] [CrossRef]
- Liu, X.; Ma, C.; Ling, H.; Yan, W.; Zhang, H.; Jiang, X. Analysis of land subsidence caused by hydrodynamic force in Loess Hilly and gully region based on SBAS-InSAR. PLoS ONE 2023, 18, e0279832. [Google Scholar] [CrossRef]
- Xu, Y.S.; Shen, S.L.; Ren, D.J.; Wu, H.N.X. Analysis of Factors in Land Subsidence in Shanghai: A View Based on a Strategic Environmental Assessment. Sustainability 2016, 8, 573. [Google Scholar] [CrossRef]
- Zhou, C.; Gong, H.; Chen, B.; Li, X.; Li, J.; Wang, X.; Gao, M.; Si, Y.; Guo, L.; Shi, M.; et al. Quantifying the contribution of multiple factors to land subsidence in the Beijing Plain, China with machine learning technology. Geomorphology. 2019, 335, 48–61. [Google Scholar] [CrossRef]
- Huang, Z.; Yu, F. InSAR-derived surface deformation of Chaoshan Plain, China: Exploring the role of human activities in the evolution of coastal landscapes. Geomorphology 2023, 426, 108606. [Google Scholar] [CrossRef]
- Kakar, N.; Zhao, C.; Li, G.; Zhao, H. GNSS and Sentinel-1 InSAR Integrated Long-Term Subsidence Monitoring in Quetta and Mastung Districts, Balochistan, Pakistan. Remote Sens. 2024, 16, 1521. [Google Scholar] [CrossRef]
- Bo, H.; Li, Y.; Tan, X.; Dong, Z.; Zheng, G.; Wang, Q.; Yu, K. Estimation of Ground Subsidence Deformation Induced by Underground Coal Mining with GNSS-IR. Remote Sens. 2023, 15, 96. [Google Scholar] [CrossRef]
- Liu, Y.; Yan, X.; Xia, Y.; Liu, B.; Lu, Z.; Yu, M. Characterizing Spatiotemporal Patterns of Land Subsidence after the South-to-North Water Diversion Project Based on Sentinel-1 InSAR Observations in the Eastern Beijing Plain. Remote Sens. 2023, 14, 5810. [Google Scholar] [CrossRef]
- Caduff, R.; Schlunegger, F.; Kos, A.; Wiesmann, A. A review of terrestrial radar interferometry for measuring surface change in the geosciences. Earth Surf. Process. Landforms 2015, 40, 208–228. [Google Scholar] [CrossRef]
- Torres, R.; Snoeij, P.; Geudtner, D.; Bibby, D.; Davidson, M.; Attema, E.; Potin, P.; Rommen, B.; Floury, N.; Brown, M.; et al. GMES Sentinel-1 mission. Remote Sens. Environ. 2012, 120, 9–24. [Google Scholar] [CrossRef]
- Geudtner, D.; Torres, R.; Snoeij, P.; Davidson, M.; Rommen, B. Sentinel-1 System capabilities and applications. In Proceedings of the 2014 IEEE International Geoscience and Remote Sensing Symposium (IGARSS), Quebec City, QC, Canada, 13–18 July 2014; pp. 1457–1460. [Google Scholar] [CrossRef]
- Yang, K.; Yan, L.; Huang, G.; Chen, C.; Wu, Z. Monitoring building deformation with InSAR: Experiments and validation. Sensors 2016, 16, 2182. [Google Scholar] [CrossRef]
- Zhang, X.; Li, Z.; Liu, Z. Reduction of Atmospheric Effects on InSAR Observations Through Incorporation of GACOS and PCA Into Small Baseline Subset InSAR. IEEE Trans. Geosci. Remote Sens. 2023, 61, 1–15. [Google Scholar] [CrossRef]
- Ferretti, A.; Prati, C.; Rocca, F. Nonlinear subsidence rate estimation using permanent scatterers in differential SAR interferometry. IEEE Trans. Geosci. Remote Sens. 2000, 38, 2202–2212. [Google Scholar] [CrossRef]
- Berardino, P.; Fornaro, G.; Lanari, R.; Sansosti, E. A new algorithm for surface deformation monitoring based on small baseline differential SAR interferograms. IEEE Trans. Geosci. Remote Sens. 2002, 40, 2375–2383. [Google Scholar] [CrossRef]
- Ferretti, A.; Prati, C.; Rocca, F. Permanent scatterers in SAR interferometry. IEEE Trans. Geosci. Remote Sens. 2001, 39, 8–20. [Google Scholar] [CrossRef]
- Fiorentini, N.; Maboudi, M.; Leandri, P.; Losa, M. Can machine learning and ps-insar reliably stand in for road profilometric surveys? Sensors 2021, 21, 3377. [Google Scholar] [CrossRef] [PubMed]
- Thapa, S.; Chatterjee, R.S.; Singh, K.B.; Kumar, D. Land subsidence monitoring using PS-InSAR technique for I-band SAR data. Int. Arch. Photogramm. Remote Sens. Spat. Inf. Sci. 2016, XLI-B7, 995–997. [Google Scholar] [CrossRef]
- Han, Y.; Zhao, Y.; Zhang, Y.; Wang, X.; Wu, L.; Ding, P.; Jin, L. Monitoring and analysis of land subsidence in modern Yellow River Delta using SBAS-InSAR Technology. IOP Conf. Ser. Earth Environ. Sci. 2021, 643, 012166. [Google Scholar] [CrossRef]
- Kirui, P.; Gerke, M. Performance of Numerical Weather Products for Insar. ISPRS Ann. Photogramm. Remote Sens. Spat. Inf. Sci. 2022, V, 6–11. [Google Scholar]
- Yang, Q.; Zuo, X.; Guo, S.; Zhao, Y. Evaluation of InSAR Tropospheric Delay Correction Methods in the Plateau Monsoon Climate Region Considering Spatial–Temporal Variability. Sensors 2023, 23, 23. [Google Scholar] [CrossRef]
- Nsengiyumva, J.B. Republic of Rwanda, Ministry of Disasters Management and Refugee Affairs, Identification of Disaster Higher Risk Zones on Floods and Landslides. 2019. Available online: https://www.preventionweb.net/publication/republic-rwanda-disaster-high-risk-zones-floods-and-landslides (accessed on 3 November 2024).
- Olson, J.M. In Its Extent and Impact Commissioned by Global Mechanism with Support from the World Bank; Michigan State University: East Lansing, MI, USA, 2021. [Google Scholar]
- FONERWA. National Fund for Environment; Rwanda Green Fund: Kigali, Rwanda, 2020. [Google Scholar]
- Geirsson, H.; d’Oreye, N.; Mashagiro, N.; Syauswa, M.; Celli, G.; Kadufu, B.; Smets, B.; Kervyn, F. Volcano-tectonic deformation in the Kivu Region, Central Africa: Results from six years of continuous GNSS observations of the Kivu Geodetic Network (KivuGNet). J. African Earth Sci. 2017, 134, 809–823. [Google Scholar] [CrossRef]
- Nahayo, L.; Ndayisaba, F.; Karamage, F.; Nsengiyumva, J.B.; Kalisa, E.; Mind’je, R.; Mupenzi, C.; Li, L. Estimating landslides vulnerability in Rwanda using analytic hierarchy process and geographic information system. Integr. Environ. Assess. Manag. 2019, 15, 364–373. [Google Scholar] [CrossRef]
- Nsengiyumva, J.B.; Luo, G.; Nahayo, L.; Huang, X. Landslide Susceptibility Assessment Using Spatial Multi-Criteria Evaluation Model in Rwanda. Int. J. Environ. Res. Public Health 2018, 15, 243. [Google Scholar] [CrossRef]
- Ghzala, K.; Tounsi, Y.; Muhire, D.; Nassim, A. Land motion detection in central Rwanda using small baseline subset interferometry. Remote Sens. Appl. Soc. Environ. 2021, 21, 100430. [Google Scholar] [CrossRef]
- Navacchi, C.; Cao, S.; Bauer-Marschallinger, B.; Snoeij, P.; Small, D.; Wagner, W. Utilising Sentinel-1′s orbital stability for efficient pre-processing of sigma nought backscatter. ISPRS J. Photogramm. Remote Sens. 2022, 192, 130–141. [Google Scholar] [CrossRef]
- Kellndorfer, J.; Cartus, O.; Lavalle, M.; Magnard, C.; Milillo, P.; Oveisgharan, S.; Osmanoglu, B.; Rosen, P.; Wegmüller, U. Global seasonal Sentinel-1 interferometric coherence and backscatter data set. Sci. Data 2022, 9, 73. [Google Scholar] [CrossRef] [PubMed]
- Casu, F.; Elefante, S.; Imperatore, P.; Zinno, I.; Manunta, M.; De Luca, C.; Lanari, R. SBAS-DInSAR parallel processing for deformation time-series computation. IEEE J. Sel. Top. Appl. Earth Obs. Remote Sens. 2014, 7, 3285–3296. [Google Scholar] [CrossRef]
- Manunta, M.; De Luca, C.; Zinno, I.; Casu, F.; Manzo, M.; Bonano, M.; Fusco, A.; Pepe, A.; Onorato, G.; Berardino, P.; et al. The Parallel SBAS Approach for Sentinel-1 Interferometric Wide Swath Deformation Time-Series Generation: Algorithm Description and Products Quality Assessment. IEEE Trans. Geosci. Remote Sens. 2019, 57, 6229–6281. [Google Scholar] [CrossRef]
- Yu, C.; Li, Z.; Penna, N.T.; Crippa, P. Generic Atmospheric Correction Model for Interferometric Synthetic Aperture Radar Observations. J. Geophys. Res. Solid. Earth 2018, 123, 9202–9222. [Google Scholar] [CrossRef]
- Yu, C.; Li, Z.; Penna, N.T. Triggered afterslip on the southern Hikurangi subduction interface following the 2016 Kaikōura earthquake from InSAR time series with atmospheric corrections. Remote Sens. Environ. 2020, 251, 112097. [Google Scholar] [CrossRef]
- Xiao, R.; Yu, C.; Li, Z.; Song, C.; He, X. General Survey of Large-scale Land Subsidence by GACOS-Corrected InSAR Stacking: Case Study in North China Plain. Proc. Int. Assoc. Hydrol. Sci. 2020, 382, 213–218. [Google Scholar] [CrossRef]
- Bizamana, H.; Sönmez, O. Landslide occurrences in the hilly areas of Rwanda, their causes and protection measures. Disaster Sci. Eng. 2015, 1, 1–7. Available online: https://www.researchgate.net/publication/326606609 (accessed on 20 December 2023).
- Pouclet, A.; Bram, K. Nyiragongo and Nyamuragira: A review of volcanic activity in the Kivu rift, western branch of the East African Rift System. Bull. Volcanol. 2021, 83, 10. [Google Scholar] [CrossRef]
- Scandone, R.; Cashman, K.V.; Malone, S.D. Magma supply, magma ascent and the style of volcanic eruptions. Earth Planet. Sci. Lett. 2007, 253, 513–529. [Google Scholar] [CrossRef]
- Geshi, N.; Browning, J.; Kusumoto, S. Magmatic overpressures, volatile exsolution and potential explosivity of fissure eruptions inferred via dike aspect ratios. Sci. Rep. 2020, 10, 9406. [Google Scholar] [CrossRef]
- Li, P.; Cai, M. Assessing the role of absolute stress measurement and relative stress real-time monitoring for earthquake research. Arab. J. Geosci. 2022, 15, 831. [Google Scholar] [CrossRef]
- Seropian, G.; Kennedy, B.M.; Walter, T.R.; Ichihara, M.; Jolly, A.D. A review framework of how earthquakes trigger volcanic eruptions. Nat. Commun. 2021, 12, 1004. [Google Scholar] [CrossRef] [PubMed]
- Jackson, J.; McKenzie, D.; Priestley, K. Relations between earthquake distributions, geological history, tectonics and rheology on the continents. Philos. Trans. R. Soc. A Math. Phys. Eng. Sci. 2011, 379, 2193. [Google Scholar] [CrossRef] [PubMed]
- van Dinther, Y.; Preiswerk, L.E.; Gerya, T.V. A Secondary Zone of Uplift Due to Megathrust Earthquakes. Pure Appl. Geophys. 2019, 176, 4043–4068. [Google Scholar] [CrossRef]
- Albino, F.; Biggs, J. Magmatic Processes in the East African Rift System: Insights From a 2015–2020 Sentinel-1 InSAR Survey. Geochem. Geophys. Geosystems 2021, 22, e2020GC009488. [Google Scholar] [CrossRef]
- Boudoire, G.; Calabrese, S.; Colacicco, A.; Sordini, P.; Habakaramo Macumu, P.; Rafflin, V.; Valade, S.; Mweze, T.; Kazadi Mwepu, J.C.; Safari Habari, F.; et al. Scientific response to the 2021 eruption of Nyiragongo based on the implementation of a participatory monitoring system. Sci. Rep. 2022, 12, 7488. [Google Scholar] [CrossRef]
- Zhao, L.; Liang, R.; Shi, X.; Dai, K.; Cheng, J.; Cao, J. Detecting and analyzing the displacement of a small-magnitude earthquake cluster in rong county, china by the gacos based insar technology. Remote Sens. 2021, 13, 4137. [Google Scholar] [CrossRef]
- Andaryani, S.; Nourani, V.; Trolle, D.; Dehghani, M.; Mokhtari, A. Assessment of land use and climate change effects on land subsidence using a hydrological model and radar technique. J. Hydrol. 2019, 578, 124070. [Google Scholar] [CrossRef]
- Minderhoud, P.S.J.; Coumou, L.; Erban, L.E.; Middelkoop, H.; Stouthamer, E.; Addink, E.A. The relation between land use and subsidence in the Vietnamese Mekong delta. Sci. Total Environ. 2018, 634, 715–726. [Google Scholar] [CrossRef]
- REMA. Nyabugogo Catchment Plan (2018–2024); No. October 2018; Ministry of Environment: Kigali, Rwanda, 2018.
- Li, J.; Zhou, L.; Zhu, Z.; Qin, J.; Xian, L.; Zhang, D.; Huang, L. Surface Deformation Mechanism Analysis in Shanghai Areas Based on TS-InSAR Technology. Remote Sens. 2022, 14, 17. [Google Scholar] [CrossRef]
- Sebaziga, J.N.; Twahirwa, A.; Kazora, J.; Rusanganwa, F.; Mbati, M.M.; Higiro, S.; Guhirwa, S.; Nyandwi, J.C.; Niyitegeka, J.M.V. Spatial and Temporal Analysis of Rainfall Variability and Trends for Improved Climate Risk Management in Kayonza District, Eastern Rwanda. Adv. Meteorol. 2023, 5372701, 1–17. [Google Scholar] [CrossRef]
- Zhu, S.; Zuo, X.; Shi, K.; Li, Y.; Guo, S.; Li, C. Surface Subsidence Monitoring in Kunming City with Time-Series InSAR and GNSS. Appl. Sci. 2022, 12, 12752. [Google Scholar] [CrossRef]
- Sun, H.; Peng, H.; Zeng, M.; Wang, S.; Pan, Y.; Pi, P.; Xue, Z.; Zhao, X.; Zhang, A.; Liu, F. Land Subsidence in a Coastal City Based on SBAS-InSAR Monitoring: A Case Study of Zhuhai, China. Remote Sens. 2023, 15, 2424. [Google Scholar] [CrossRef]


| Sensor | Orbit | Path/Frame | Common Master Date | Time Period of Images Collected | No. Images | No. Interferograms |
|---|---|---|---|---|---|---|
| Sentinel 1A/B | Ascending | 174/1176 | 17 February 2019 | 2 July 2016 to 8 June 2023 | 245 | 939 |
| No. | Points | Type | Description |
|---|---|---|---|
| 1 Figure 7A | D1, D2, D3, D5, D6 | Uplift of the plains area along the southern shore of Lake Edward | These points are located on the southern shore of Lake Edward and show similar deformation characteristics after 2019 |
| 2 Figure 7B | D9, D10 | Subsidence in the plain’s region near Mbarara | These points, in the plain’s region near Mbarara, show a broadly subsiding trend, remaining flat between June 2019 and December 2020 |
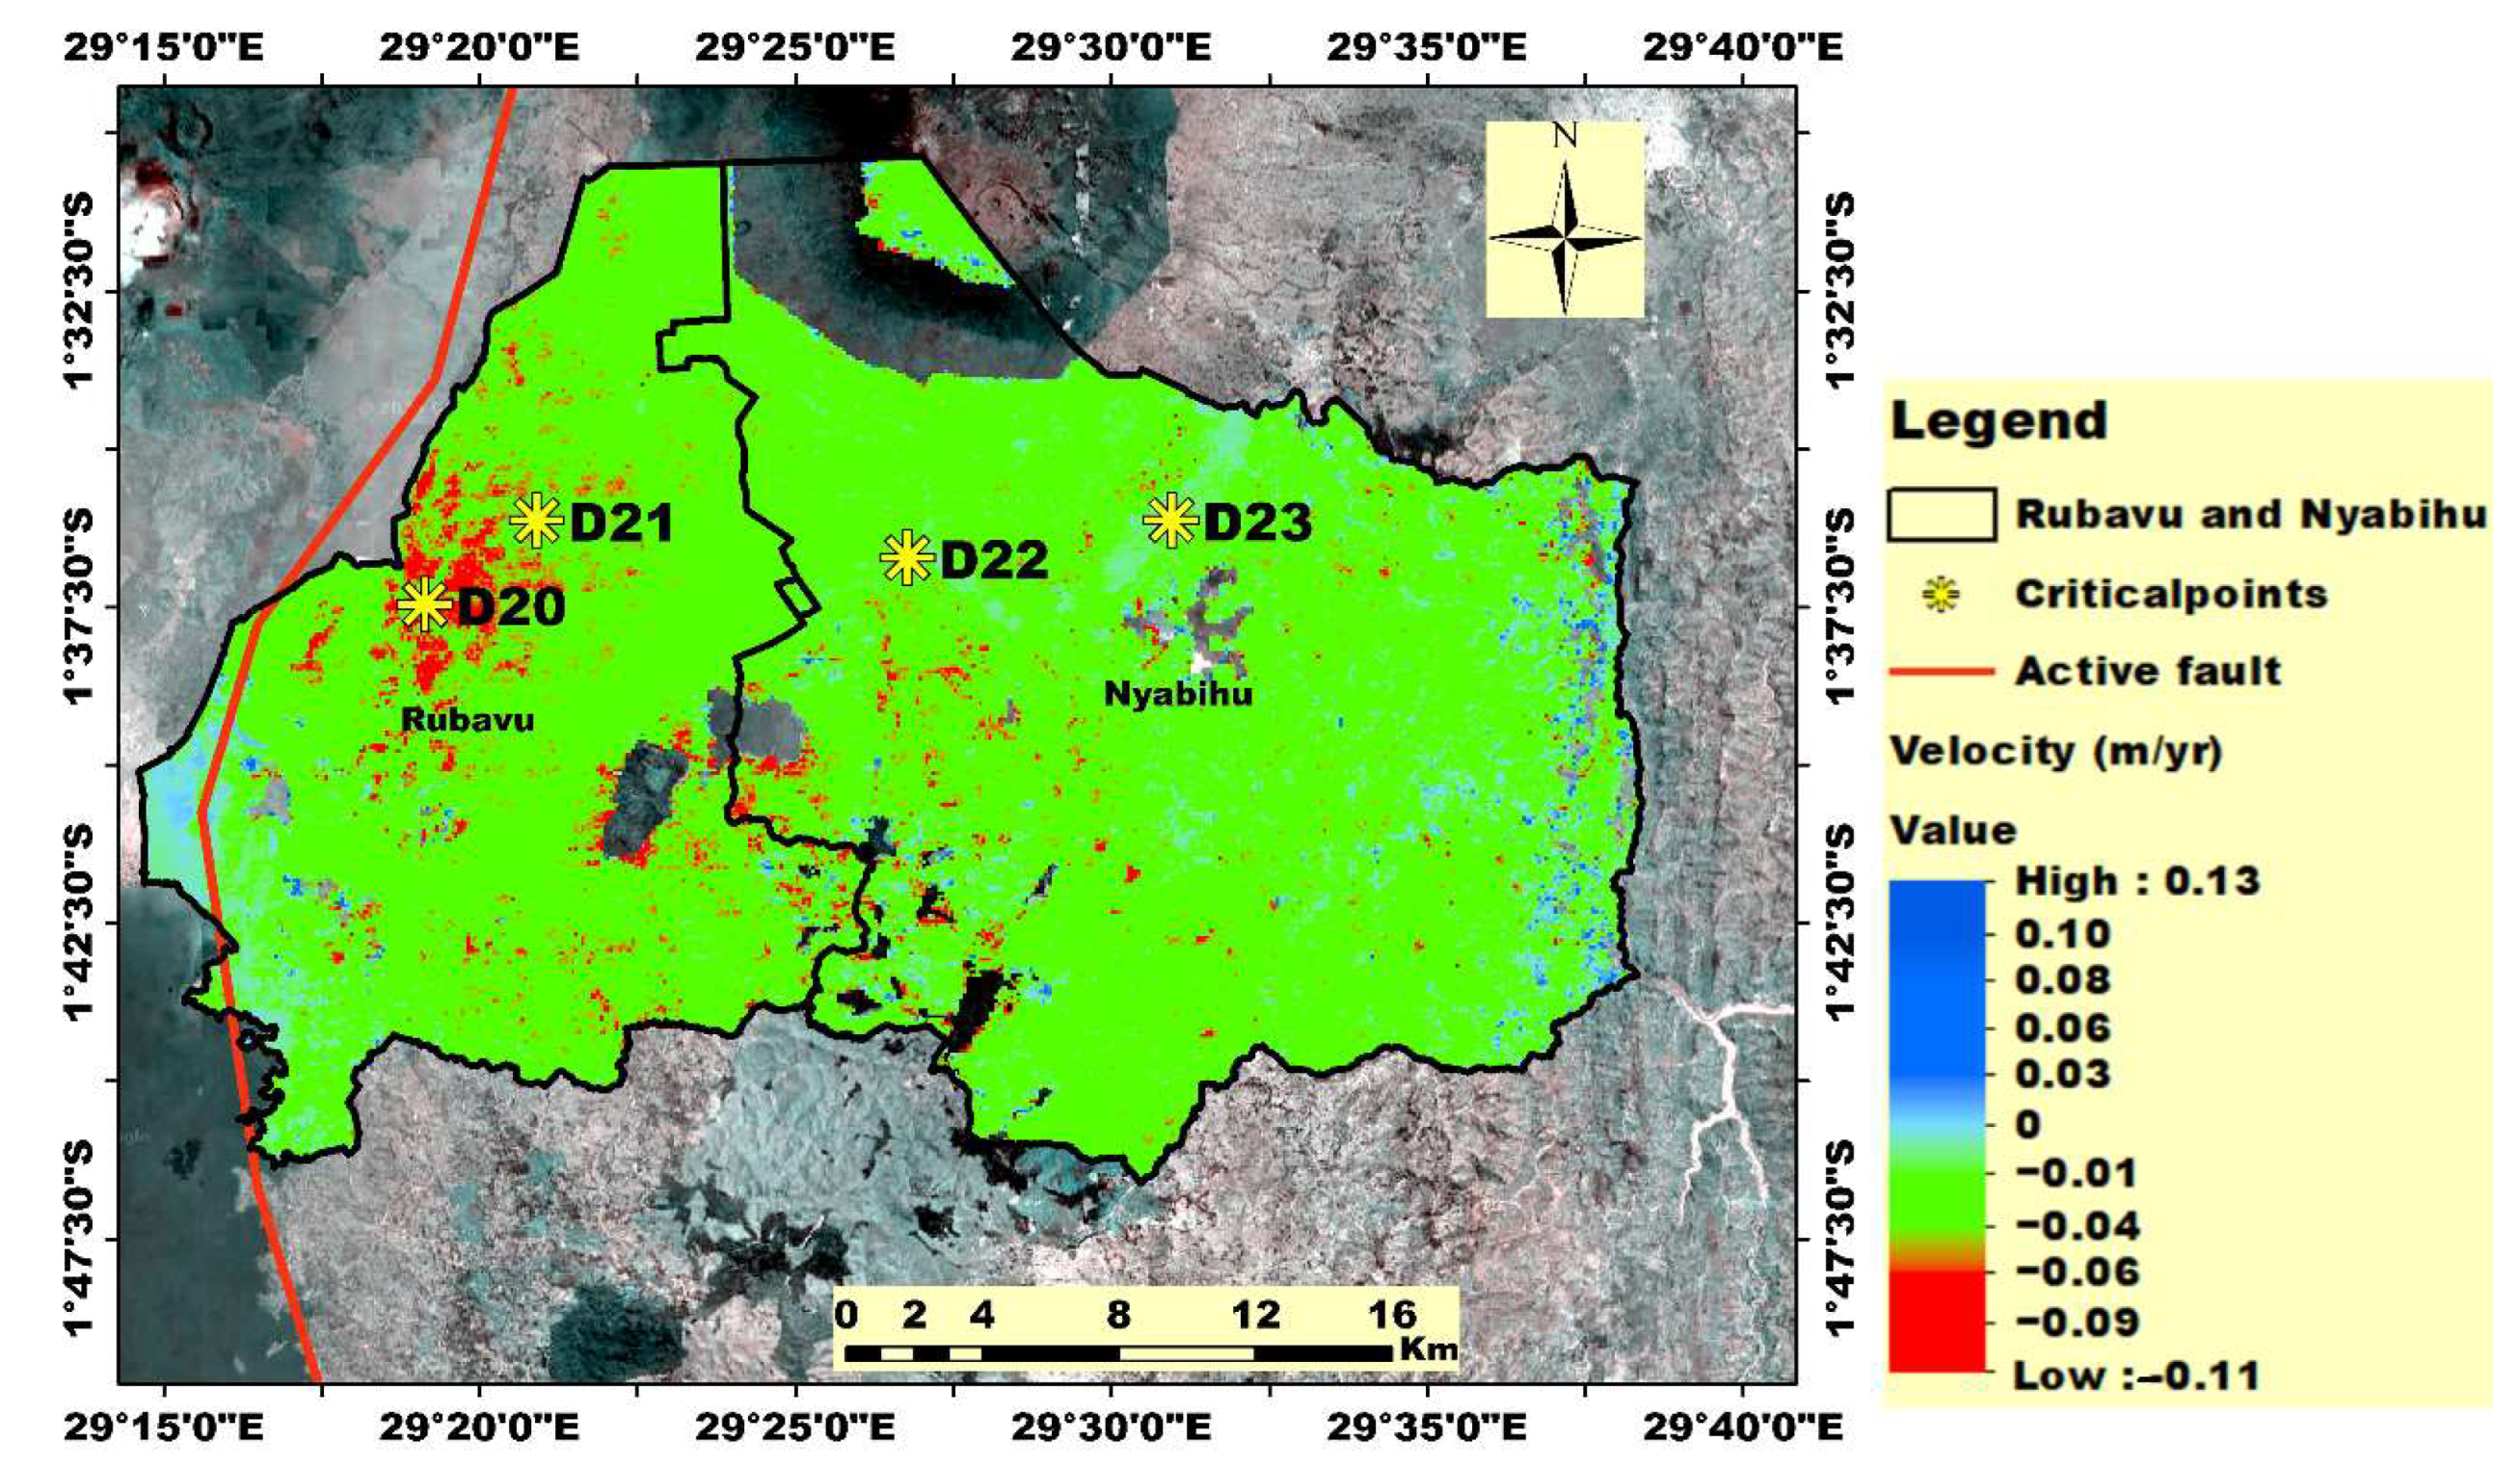
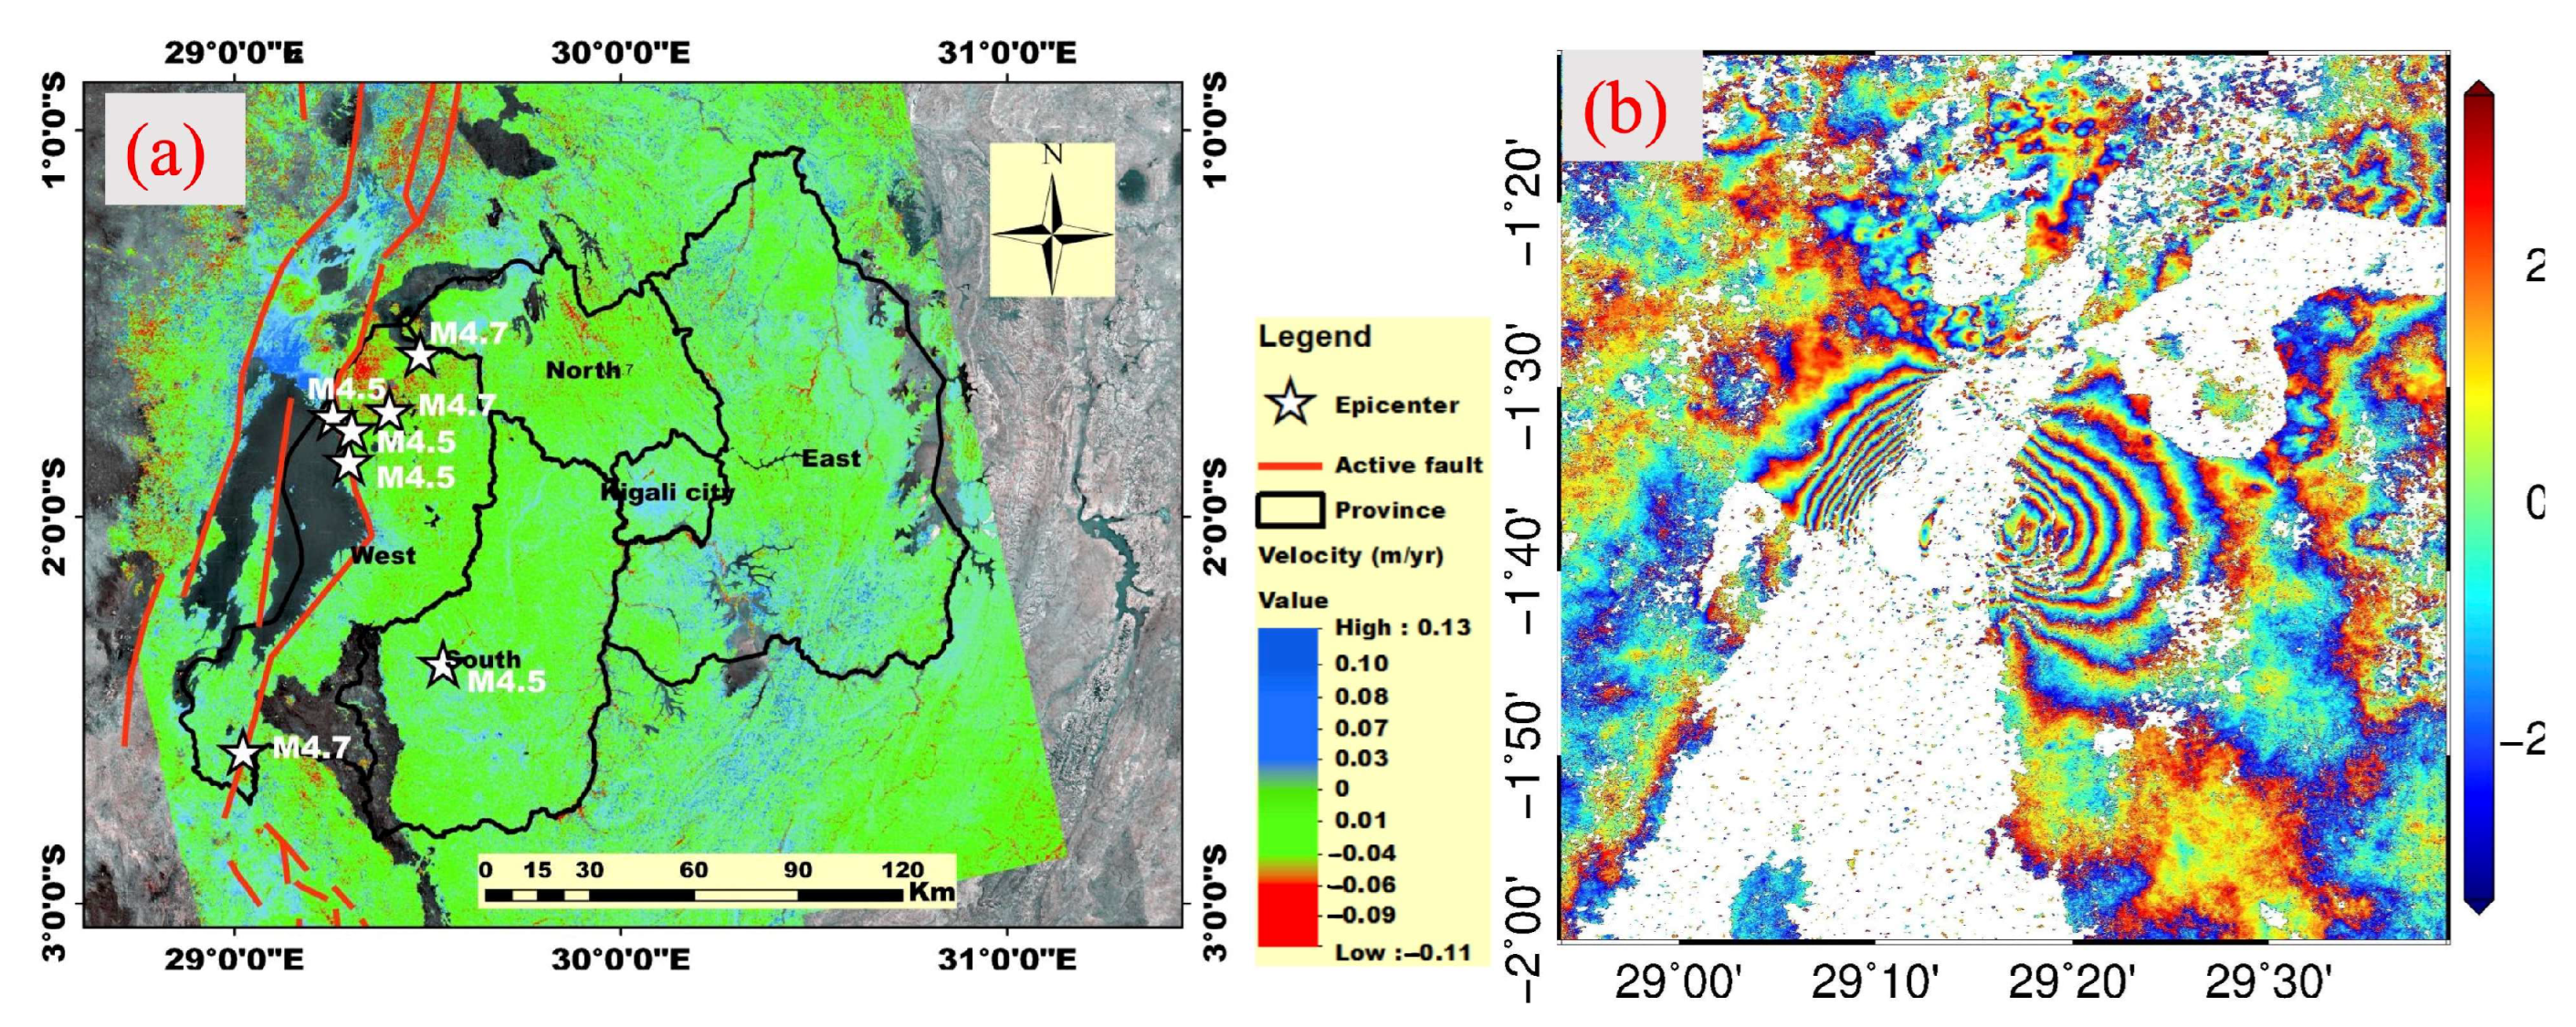
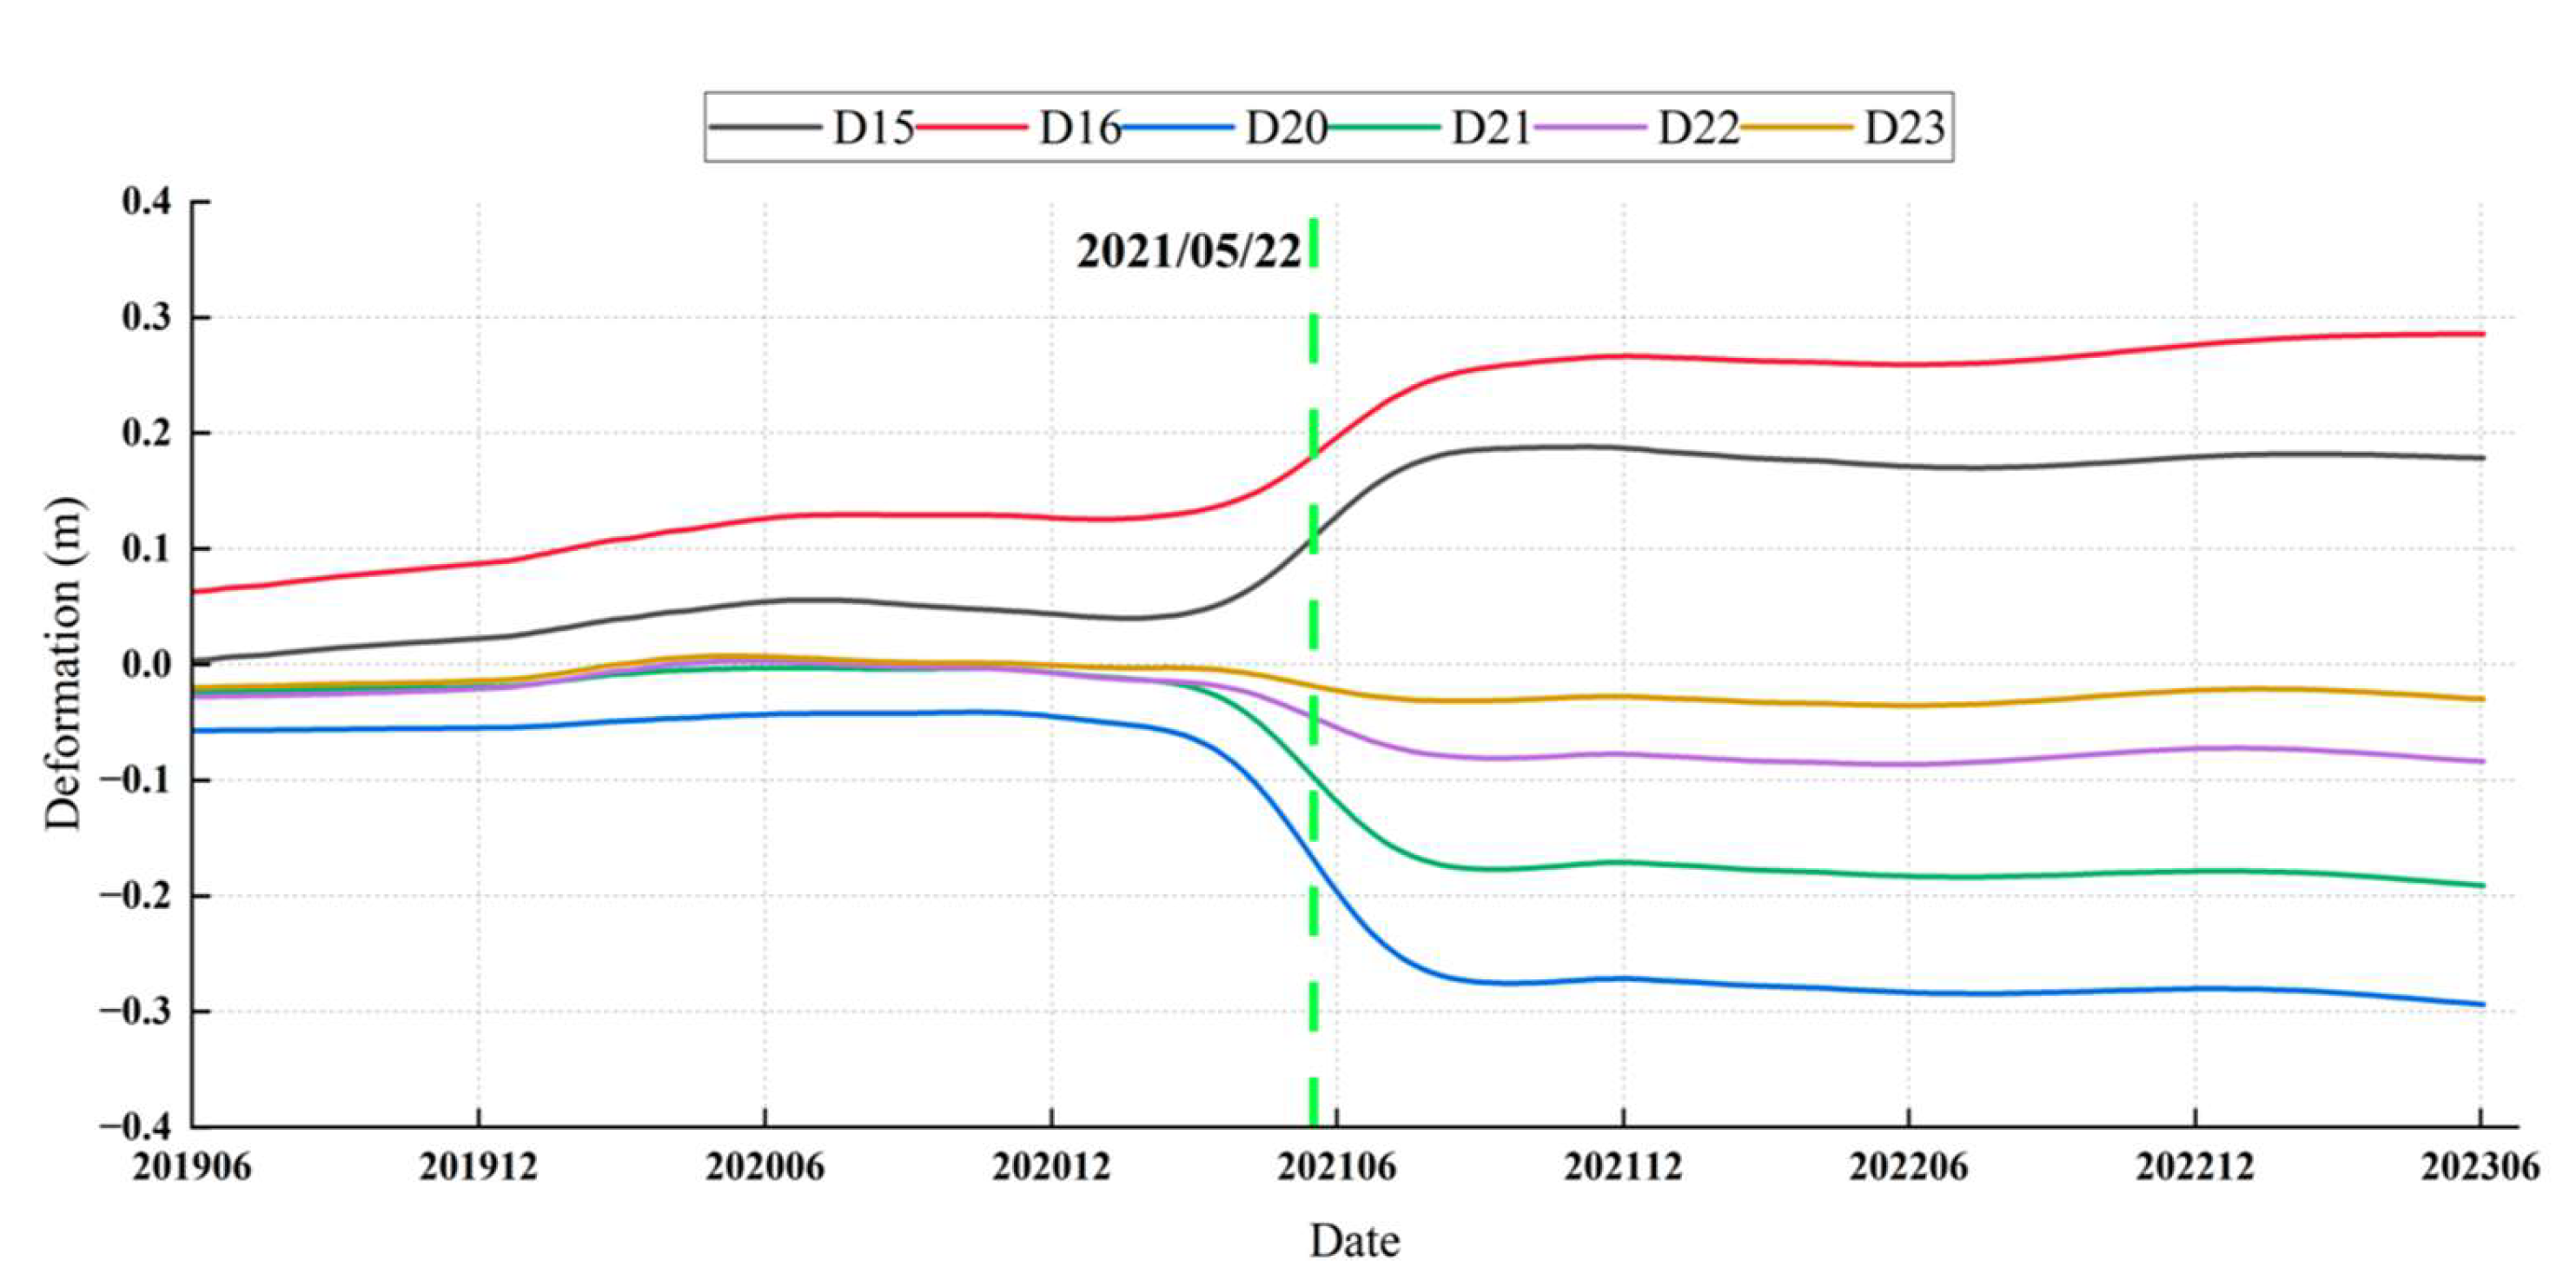
| 3 Figure 7C | D15, D16, D17, D18, D19, D20, D21, D22, D23 | Deformation near Nyiragongo Volcano | Points located south and east of the Nyiragongo Volcano show dramatic deformation between March and September 2021, with different deformation trends on either side of the fault. However, point D23, which is far from the volcano, was less affected |
| 4 Figure 7D | D26, D27, D28 | Uplift in the capital, Kigali City | Kigali City shows an upward trend, including the Kigali International Airport area |
| 5 Figure 7E | D4, D8, D13, D24, D25, D30, D35 | Points of subsidence trends | During the monitoring period, these points showed a trend of subsidence, with a maximum cumulative deformation of more than 20 cm |
| 6 Figure 7F | D7, D11, D12, D14, D23, D29, D32, D34 | Points of fluctuating deformation | The deformation of these points showed a fluctuating trend over the monitoring period, with cumulative deformation in the range of a few centimeters |
| 7 Figure 7G | D31 | Points of uplift deformation | These points show a significant uplift trend over the monitoring time period, with cumulative deformation exceeding 14 cm |
| 8 Figure 7H | D33 | Abnormal points | These points show an anomalous deformation time series |
| Time (YYYY/MM/DD) | Latitude (°) | Longitude (°) | Depth (km) | Magnitude (M) |
|---|---|---|---|---|
| 22 May 2021 | −1.7503 | 29.2111 | 10 | 4.3 |
| 23 May 2021 | −1.9652 | 29.6147 | 10 | 4.2 |
| 23 May 2021 | −1.8121 | 29.3863 | 10 | 4.5 |
| 23 May 2021 | −1.828 | 29.4389 | 13.06 | 4.3 |
| 23 May 2021 | −1.6519 | 29.2368 | 10 | 4.5 |
| 23 May 2021 | −1.6468 | 29.4069 | 10 | 4.3 |
| 24 May 2021 | −1.5912 | 29.2293 | 10 | 4.7 |
| 25 May 2021 | −1.7687 | 29.3804 | 10 | 4.5 |
| 25 May 2021 | −1.5761 | 29.4806 | 10 | 4.7 |
| 25 May 2021 | −1.7569 | 29.3197 | 10 | 4.4 |
| 25 May 2021 | −1.7467 | 29.3986 | 10 | 4.3 |
| 25 May 2021 | −1.756 | 29.2667 | 10 | 4.4 |
| 25 May 2021 | −1.6688 | 29.4184 | 10 | 4.3 |
| 26 May 2021 | −1.7237 | 29.4006 | 10 | 4.7 |
| 26 May 2021 | −1.8137 | 29.4858 | 10 | 4.2 |
| 26 May 2021 | −1.7157 | 29.2514 | 10 | 4.4 |
| 26 May 2021 | −1.6522 | 29.3085 | 10 | 4.4 |
| 26 May 2021 | −1.7731 | 29.304 | 10 | 4.5 |
| 26 May 2021 | −1.7394 | 29.2551 | 12.65 | 4.5 |
| 26 May 2021 | −1.7819 | 29.3238 | 12.91 | 4.5 |
| 26 May 2021 | −1.855 | 29.2957 | 12.86 | 4.5 |
| 27 May 2021 | −1.6168 | 29.3872 | 10 | 4.3 |
| 27 May 2021 | −1.7149 | 29.3823 | 10 | 4.5 |
| LULC Class | 2010 | 2016 | 2023 | |||
|---|---|---|---|---|---|---|
| Area (Km2) | Rate (%) | Area (Km2) | Rate (%) | Area (Km2) | Rate (%) | |
| Open water | 1518.9885 | 5.87 | 1569.4955 | 6.07 | 1603.2575 | 6.24 |
| Forest | 6643.356 | 25.67 | 4103.0375 | 15.86 | 4584.3606 | 17.85 |
| Aquatic Vegetation | 971.703 | 3.76 | 970.823 | 3.75 | 956.67 | 3.72 |
| Crop land | 11,068.92 | 42.78 | 4783.1907 | 18.48 | 6899.5415 | 26.86 |
| Built-up area | 207.4887 | 0.80 | 2103.3386 | 8.13 | 3397.1153 | 13.23 |
| Bare land | 23.2398 | 0.09 | 7.3866 | 0.03 | 8.3801 | 0.03 |
| Glass land | 5441.5887 | 21.03 | 12,339.0382 | 47.68 | 8235.0451 | 32.06 |
| No data | 1.043 | 0.00 | 0.0176 | 0.00 | 0.0022 | 0.00 |
| Total | 25,876.3277 | 100.00 | 25,876.3277 | 100.00 | 25,684.3723 | 100.00 |
Disclaimer/Publisher’s Note: The statements, opinions and data contained in all publications are solely those of the individual author(s) and contributor(s) and not of MDPI and/or the editor(s). MDPI and/or the editor(s) disclaim responsibility for any injury to people or property resulting from any ideas, methods, instructions or products referred to in the content. |
© 2024 by the authors. Licensee MDPI, Basel, Switzerland. This article is an open access article distributed under the terms and conditions of the Creative Commons Attribution (CC BY) license (https://creativecommons.org/licenses/by/4.0/).
Share and Cite
Mugabushaka, A.; Li, Z.; Zhang, X.; Song, C.; Han, B.; Chen, B.; Liu, Z.; Chen, Y. Mapping Surface Deformation in Rwanda and Neighboring Areas Using SBAS-InSAR. Remote Sens. 2024, 16, 4456. https://doi.org/10.3390/rs16234456
Mugabushaka A, Li Z, Zhang X, Song C, Han B, Chen B, Liu Z, Chen Y. Mapping Surface Deformation in Rwanda and Neighboring Areas Using SBAS-InSAR. Remote Sensing. 2024; 16(23):4456. https://doi.org/10.3390/rs16234456
Chicago/Turabian StyleMugabushaka, Adrien, Zhenhong Li, Xuesong Zhang, Chuang Song, Bingquan Han, Bo Chen, Zhenjiang Liu, and Yi Chen. 2024. "Mapping Surface Deformation in Rwanda and Neighboring Areas Using SBAS-InSAR" Remote Sensing 16, no. 23: 4456. https://doi.org/10.3390/rs16234456
APA StyleMugabushaka, A., Li, Z., Zhang, X., Song, C., Han, B., Chen, B., Liu, Z., & Chen, Y. (2024). Mapping Surface Deformation in Rwanda and Neighboring Areas Using SBAS-InSAR. Remote Sensing, 16(23), 4456. https://doi.org/10.3390/rs16234456