Article

The Influence of Local Climatic Factors and Water Vapor Transport from North Atlantic Ocean on Winter Snow-Cover Variation on Western Kunlun Mountains and Eastern Pamir Plateau

1
State Key Laboratory of Severe Weather, Chinese Academy of Meteorological Sciences, Beijing 100081, China
2
Department of Atmospheric Science, School of Environmental Studies, China University of Geosciences, Wuhan 430074, China
3
State Key Laboratory of Tropical Oceanography, South China Sea Institute of Oceanology, Chinese Academy of Sciences, Guangzhou 510301, China
4
College of Geographical Sciences and Tourism, Jilin Normal University, Siping 136000, China
*
Author to whom correspondence should be addressed.
Remote Sens. 2024, 16(23), 4368; https://doi.org/10.3390/rs16234368
Submission received: 2 November 2024 / Revised: 20 November 2024 / Accepted: 21 November 2024 / Published: 22 November 2024

Abstract

:
Snow cover days (SCD) have increased significantly in winter on the Western Kunlun Mountains and Eastern Pamir Plateau (hereafter referred to as KMPP for short), however the causes have not been well understood so far. Here, we use remote sensing data to analyze the abnormal increase in SCD on the KMPP and explore its causes from the perspective of the local factors and water vapor transport caused by sea surface temperatures (SST) warming. We discover that the winter SCD on the KMPP increased significantly at a rate of 4.75 days/decade (significant at the 0.01 level) during 1989–2020, while there has been a significant decrease on the Tibetan Plateau (TP), with a rate of −1.50 days/decade (significant at the 0.1 level). Based on ERA5, GPCP, GHCN, and station data, we find that, in contrast to the significant warming observed on the TP, temperature changes on the KMPP are negligible, while precipitation is increasing, differing from the decreasing precipitation trend observed on the TP. The differences in local temperature and precipitation changes cause different variations in SCD between the KMPP and the TP. The increase in SCD on the KMPP is primarily driven by increased precipitation (over 97% contribution), with minimal impact from the more or less unchanged temperature. In contrast, the decline in SCD on the TP results from decreased precipitation and significantly increased temperature. Furthermore, we found that changes in SCD on the KMPP are significantly correlated with SST in the northern North Atlantic Ocean. Based on the correlation vector, the anomaly field in the high/low SCD years of water vapor transport, and the FLEXPART model, we show that the northern North Atlantic Ocean is one of the major water vapor sources affecting the SCD on the KMPP. The warming SST in the northern North Atlantic Ocean enhances water vapor transport to the KMPP in winter, leading to an abnormal increase in the SCD that differs from the overall trend on the TP. The findings are conductive to further understand the peculiarity of winter precipitation and SCD on the KMPP, and the “Western Kunlun Mountains Oddity” in mountain glacial change.

1. Introduction

Snow Cover (SC) is prevalent in high altitudes and mid-to-high latitudes [1,2,3]. Due to its high albedo and low thermal conductivity [4,5,6], it can significantly impact the balance of the surface energy, the cycle of water, and climate change on a global and regional scale [7]. SC Days (SCD) changes can significantly impact surface energy balance and influence thermal state [5,8,9,10,11]. Moreover, SC is also a critical component of the hydrological system in high altitude regions, acting as a buffer controlling river discharge and associated environmental processes [9,10]. The Tibetan Plateau (TP) is the highest plateau in the world and one of the regions with the most SCD globally. SCD on the TP can influence the climate of East Asia and even the global climate [12,13,14]. Therefore, changes in SCD on the TP and their mechanisms have always been a research hotspot.
Since 1950, the TP has experienced significant warming [15,16], and correspondingly, the SCD on the TP shows a significant decreasing trend from 1979 to 2020 [17]. However, the SCD across the plateau does not exhibit uniform changes. The western Kunlun Mountains and the Eastern Pamir Plateau (hereafter referred to as KMPP for short), situated at the western margin of the TP, show a significant increasing trend in SCD based on remote sensing data [17]. Thus, whether the SCD in the KMPP region exhibits inconsistent changes compared to the TP within multi-dimensional datasets is still an open research question [17].
The SCD variation results from the interplay of snowfall and melting processes, directly influenced by local precipitation and temperature [18,19]. Warming drives earlier snowmelt, leading to a decrease in the SCD [7,20,21]. Observational analyses and model simulations show that the uneven spatial distribution of precipitation changes on the TP results from complex interactions between land and atmosphere [22,23]. The SCD characteristics across regions may be influenced by heterogeneous changes in temperature and precipitation [24]. Besides local factors, large-scale air-sea interactions can influence SCD variations on inter-annual scales through teleconnections; the influencing factors include the El Niño events [25,26], the Indian Ocean Dipole (IOD) [27,28,29,30], and North Atlantic Oscillation (NAO) [31]. El Niño events enhance monsoon intensity in the Indian and Western Pacific Oceans, increasing moisture sources and SCD on the TP [25,26]. During IOD events, high SST boosts moisture transport from the northern Indian Ocean to the TP, leading to increased SCD [27,28,29,30]. The NAO affects the TP by enhancing the meridional height gradient over the North Atlantic, which shifts the European trough eastward and strengthens subtropical westerlies, thereby increasing TP SCD [31]. Additionally, significant warming on the TP heightens the contrast in heat exchange between land and ocean, intensifying the subtropical wave pattern and affecting moisture transport, ultimately influencing regional SCD [32,33,34,35,36,37]. Adjustments in oceanic moisture transport due to SST warming are also key factors in the TP SCD variations [38,39].
The data used for the SC research mainly include station data, satellite observations by the National Oceanic and Atmospheric Administration (NOAA), Scanning Multichannel Microwave Radiometer by the National Aeronautics and Space Administration (NASA), and Earth Observation System/Moderate Resolution Imaging Spectroradiometer satellite retrieval products [6,40,41,42,43,44]. Each dataset has its advantages and limitations [44]. For example, there are about 133 observation stations on the TP, but most are located in the southeastern TP (Figure 1). In the high mountains with high SCD, especially over the western TP, there are few stations and thus the regional representativeness of station data is limited [6,17,44,45]. SCD products derived from passive microwave remote sensing have large uncertainties on the TP, especially in the northwest and southeast areas [41,44]. Thus, data combining the advantages of remote sensing and station data with high-resolution and strong objectivity [17] are needed to examine the abnormal increasing trend in the SCD on the TP, particularly in the KMPP.
In summary, SCD changes result from the interaction between local precipitation/temperature and atmospheric teleconnections. Local temperature and precipitation changes directly affect TP SCD, while SST variations influence atmospheric dynamics, adjusting oceanic moisture transport and impacting TP SCD. Therefore, the following key questions should be addressed: Does the increase of the SCD on the KMPP exist? How do the local temperature and precipitation affect the changes of the SCD on the KMPP? How does the warming SST affect the SCD on the KMPP and where is the oceanic moisture source? Here, we utilize the high-resolution remote sensing data of the SCD to examine the phenomenon of the abnormal increasing trend in the SCD on the KMPP and use multiple data sources to investigate the possible influence of the local precipitation/temperature and the water vapor transport on SCD changes. The analysis shows interesting results and provides new insights into the change in precipitation, SCD, and mountain glaciers on the KMPP. Because SCD on the TP and KMPP regions mainly occurs in winter, and the mechanisms of SCD changes on the plateau differ across seasons, we only focus on the changes in winter SCD.

2. Methods and Materials

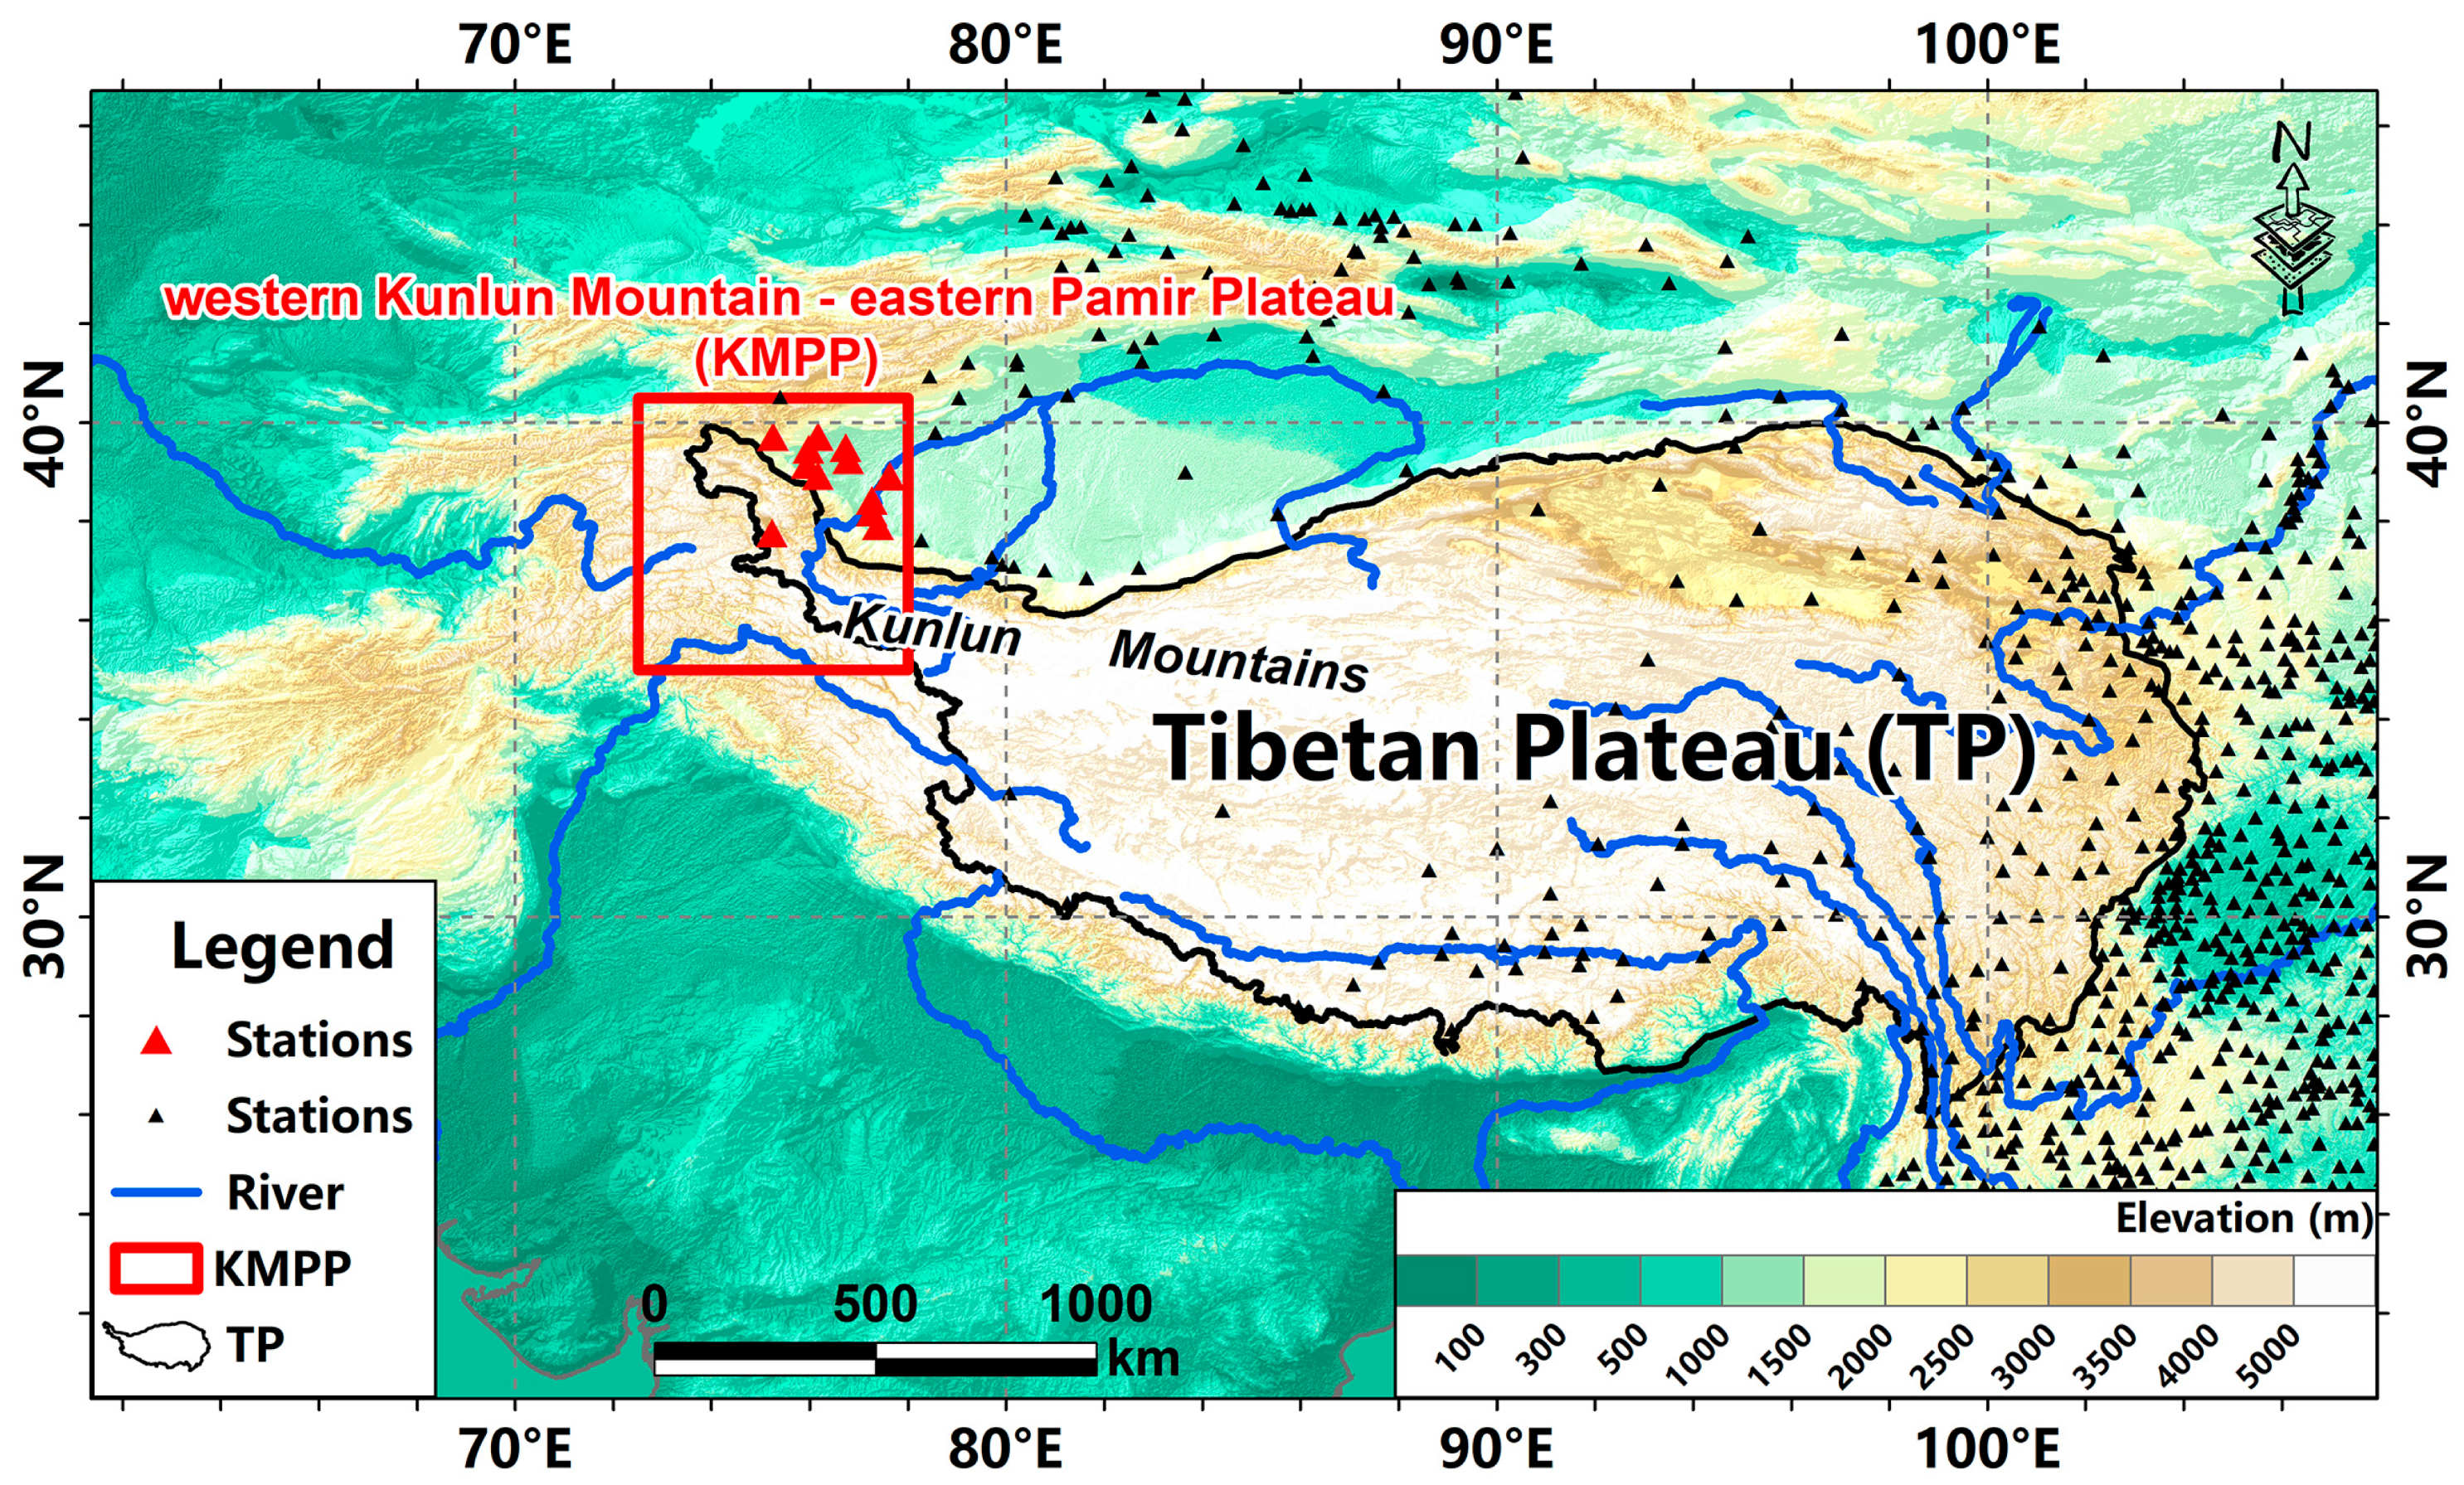
2.1. The Western Kunlun Mountain and Eastern Pamir Plateau
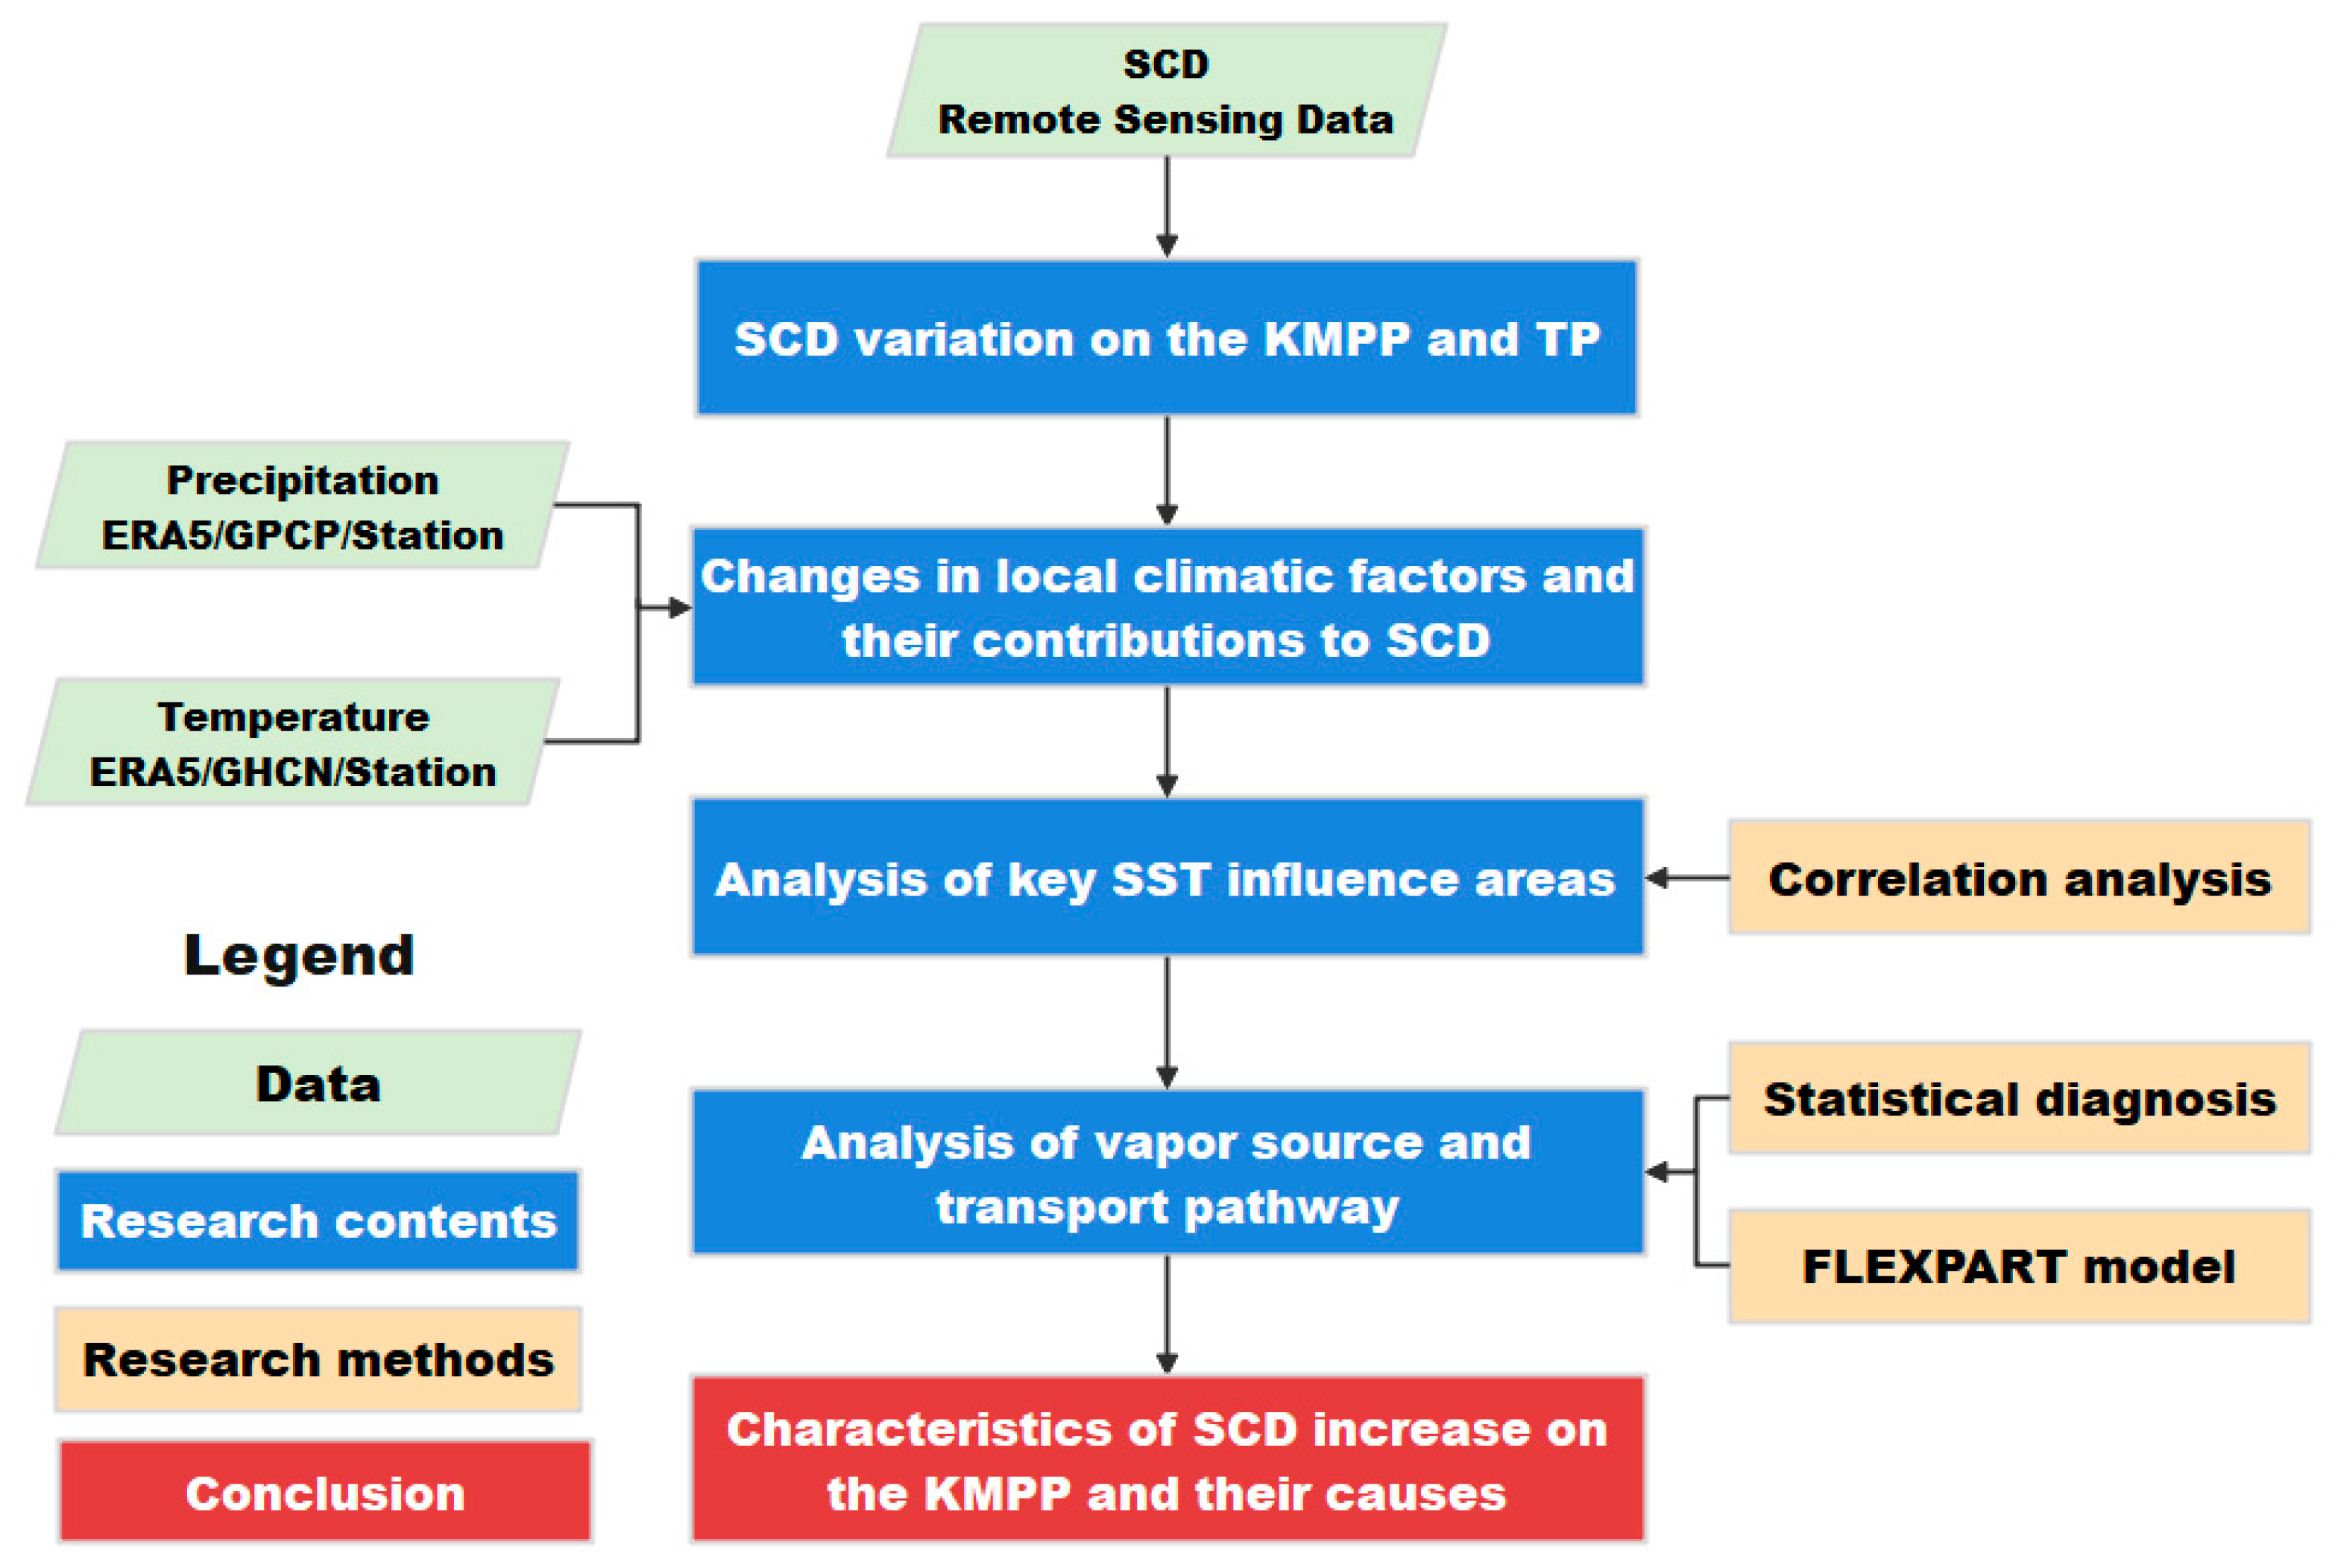
The Pamir Plateau, also known as the “Roof of the World”, is a significant highland region in Central Asia that serves as a confluence point for several major mountain ranges, including the Himalayas, Kunlun, Hindu Kush, and Tian Shan. It covers roughly 10,100 km2, the average elevation is over 4500 m, and the Kongur Tagh is the highest peak (7719 m). It is under the influence of westerly and southwesterly monsoons and is perennially dry and cold, with annual precipitation of 75–100 mm and an annual average temperature of 3.53 °C [46]. It is the region with the most developed glaciers in the high mountains of Asia, and many Asian large rivers, such as the Amu Darya, the Tarim River, and the Indus River, originate on the plateau. In dry years with less precipitation, the glaciers on the Pamir Plateau play a crucial role [46]. It is also an area with high SCD [17].
The research area in this paper is the western Kunlun Mountains and eastern Pamir Plateau (KMPP) (35–40.5°N, 72.5–78°E). The eastern Pamir Plateau is mainly located in China and the western Kunlun Mountains are included because the area exhibits a similar change in climate and SCD with that on the Pamir Plateau. Few observation stations exist on the KMPP, and only one at an altitude of higher than 4000 m (Figure 1). The objective and high-resolution remote sensing data of SCD are needed for this paper.

2.2. Data Sources

In this study, we used remote sensing SCD data, station observation SCD data, and temperature and precipitation data alongside SST data and reanalysis data, as shown in Table 1. The data availability pathways are described in the Data Availability Statement section. The data details are as follows:
The SCD data used in this paper are derived from the 1 km snow cover dataset of the optical remote sensing instrument on the Qinghai-Tibet Plateau released by the National Tibetan Plateau/Third Pole Environment Data Center, which was obtained by using an optimized variation processing method [17]. These data combine the advantages of remote sensing and station data with high-resolution and robust objectivity. The original 1 km SCD data had higher Root-Mean-Square Error (RMSE) values in the southern and eastern parts of the TP, indicating discrepancies between station and remote sensing data. After applying an optimized variational processing method, the RMSE significantly decreased, particularly in regions with larger initial errors, making the remote sensing data more consistent with station data. Low SCD areas are similarly reflected across different datasets, while high SCD areas are more clearly depicted in remote sensing and processed data. The trends in SCD during winter, as per the station data, show a decline, contrasting with the increasing trends observed in remote sensing data during the snow season (Januay–April, October–December). The SCD data, after optimized processing, align better with the station data, suggesting that they are more suitable for TP SCD research. This processed SCD data, which integrate station and remote sensing observations, offers a more accurate representation of SCD changes on the TP, with detailed accuracy discussed by Xue et al. [17]. It covers January–April and October–December from 1989 to 2020, with a monthly resolution. The coverage area is 17°N–41°N, 65°E–106°E, and the spatial resolution is 0.1° × 0.1°.
The temperature/precipitation data used in this paper are obtained from the ERA5 reanalysis dataset (the European Centre for Medium-Range Weather Forecasts (ECMWF)) after a variation processing method [17]. The data combine the advantages of ERA5 temperature/precipitation data and station observation data [17]. They cover the period from January 1961 to December 2020 and have a monthly resolution. The coverage area is 17°N–41°N, 65°E–106°E and the spatial resolution is 0.25° × 0.25°.
The reanalysis data used to calculate the water vapor flux (the meridional u, the zonal wind v, and the specific humidity q) are from the ERA5 reanalysis dataset, and the spatial resolution is 0.25° × 0.25°. They cover the period from January 1940 to December 2020 and have a monthly resolution. The SST data are derived from the Hadley Centre Sea Ice and Sea Surface Temperature dataset (HadISST), with a spatial resolution of 1° × 1°. They cover the period from January 1870 to December 2020 and have a monthly resolution.
The GPCP (Global Precipitation Climatology Project) data are from NOAA. The spatial resolution is 2.5° × 2.5°. They cover the period from January 1979 to December 2020 and have a monthly resolution. The microwave and infrared satellite data and observation data were used to form the dataset by applying the method of optimal mixed estimation.
The GHCN_CAMS Gridded 2 m Temperature (Land) data are from NOAA. The spatial resolution is 0.5° × 0.5°. They cover the period from January 1948 to December 2020 and have a monthly resolution.
The station data for temperature and precipitation are from the daily dataset of surface observation in China provided by the National Meteorological Information Center (NMIC). The TP contains 133 observation stations (Figure 1) and the data cover the period from January 1961 to December 2020.
The reanalysis data used to drive the FLEXPART model are the final version of the US National Center for Environmental Prediction (NCEP) Operational Global Analysis data, with a time resolution of 6 h, a spatial resolution of 1° × 1°, and a vertical layering of 26 layers.
The altitude data are from the Advanced Spaceborne Thermal Emission and Reflection Radiometer Global Digital Elevation Model (ASTER GDEM, V3), has and have a spatial resolution of 1° × 1°.

2.3. The Whole Layer Water Vapor Flux and Related Vectors

To research the effects of water vapor transport on the SCD of the KMPP and to analyze the structural characteristics of water vapor transport pathways, a method that explores the water vapor transport vectors is used to track the sources of the water vapor and reveal the pathways of water vapor transport caused by SST anomalies [23].
The calculation formula for the whole-layer vapor flux is:
Q = 1 g p s p t q v   d p
Q can be decomposed into two directions:
q u = 1 g p s p t q u   d p
q v = 1 g p s p t q v   d p
where g is the gravitational acceleration, u and v are the meridional and zonal wind, respectively, q is the specific humidity, p s is the surface atmospheric pressure (taken as 1000 hPa in this study), and p t represents the top layer atmospheric pressure (taken as 300 hPa in this study) [23].
Then, the composite correlation vector is as follows:
R x , y = i R u x , y + j R v x , y
where R x , y is the composite correlation vector, R u x , y presents the correlation coefficient field of q u , and R v x , y presents the correlation coefficient field of qv.

2.4. The FLEXPART Model

The FLEXPART (Flexible Particle Dispersion) model is a Lagrangian particle transport model developed by the Norwegian Institute of Atmospheric Research (NILU) [46,47,48]. It describes the diffusion process of tracers in the atmosphere by calculating the trajectory of particles [47,48,49]. This model can simulate the diffusion of tracers from the source region to the surrounding area through time forward operation, and can determine the distribution of potential source regions that impact the fixed point through backward operation [47,48,49]. It is publicly available (https://www.flexpart.eu/) (accessed on 25 July 2024). Using the FLEXPART model, backward simulation of the atmospheric particle swarm is conducted to verify the ocean transport source affecting the SCD on the KMPP.

2.5. Trend Calculation and Significance Assessment

The Ordinary Least Squares (OLS) method is usually used to calculate the trends in climate research, but it assumes that the data obey the Gaussian distribution [50]. Since the SCD does not follow the Gaussian distribution, the Theil–Sen Median method [51,52] should be utilized to calculate the trend. It assumes a time series x 0 , x 1 , x 2 , …, x n , and for any i , j < n , the calculation formula is as follows:
β = m e d i a n x j x i j i ,   j > i
where x j and x i denote SCD; when β > 0, it denotes an increase, while β < 0 indicates a decrease.
The Mann–Kendall test is used to judge the significance of the trend in the SCD [51,52]. OLS is used to calculate the trends of variables that comply with the Gaussian distribution assumption [50].
In addition, other methods, such as variable standardization, correlation coefficient, and multiple partial regressions, are also used. Since SCD is mainly concentrated in winter, the research period for this paper is the climatological winter, defined as January, February, and December of the previous year. The flowchart (Figure 2) below shows the data collection, methods, and analysis steps.

3. Results

3.1. Spatiotemporal Characteristics of the SCD on the KMPP

Figure 3 shows the spatial and temporal distribution characteristics of SCD in winter from 1989 to 2020, based on remote sensing SCD data after an optimized variation processing method. It shows that on the KMPP, the average SCD in winter is 50.22 days, significantly higher than the average of the TP, which is 22.74 days, making the KMPP a high-value region for SCD in winter (Figure 3a). From the spatial variation characteristic of the SCD (Figure 3b), it can be observed that there is a decreasing trend in most regions of the TP in winter, but the KMPP shows a significant increasing trend. Overall, the average SCD in winter on the TP significantly decreased at a rate of −1.50 days/decade (significant at the 0.1 level), while on the KMPP, it experiences a significant increase at a rate of 4.75 days/decade (significant at the 0.01 level) (Figure 3c,d), confirming the anomalous increasing trend of the SCD in winter on the KMPP. Interestingly, the northern rim of the TP, including the central Kunlun Mountains, also experienced an increase in the SCD during the analysis period. This is consistent with the so-called “Western Kunlun Mountains Oddity” in mountain glacial change, as found in previous studies [53,54,55,56].

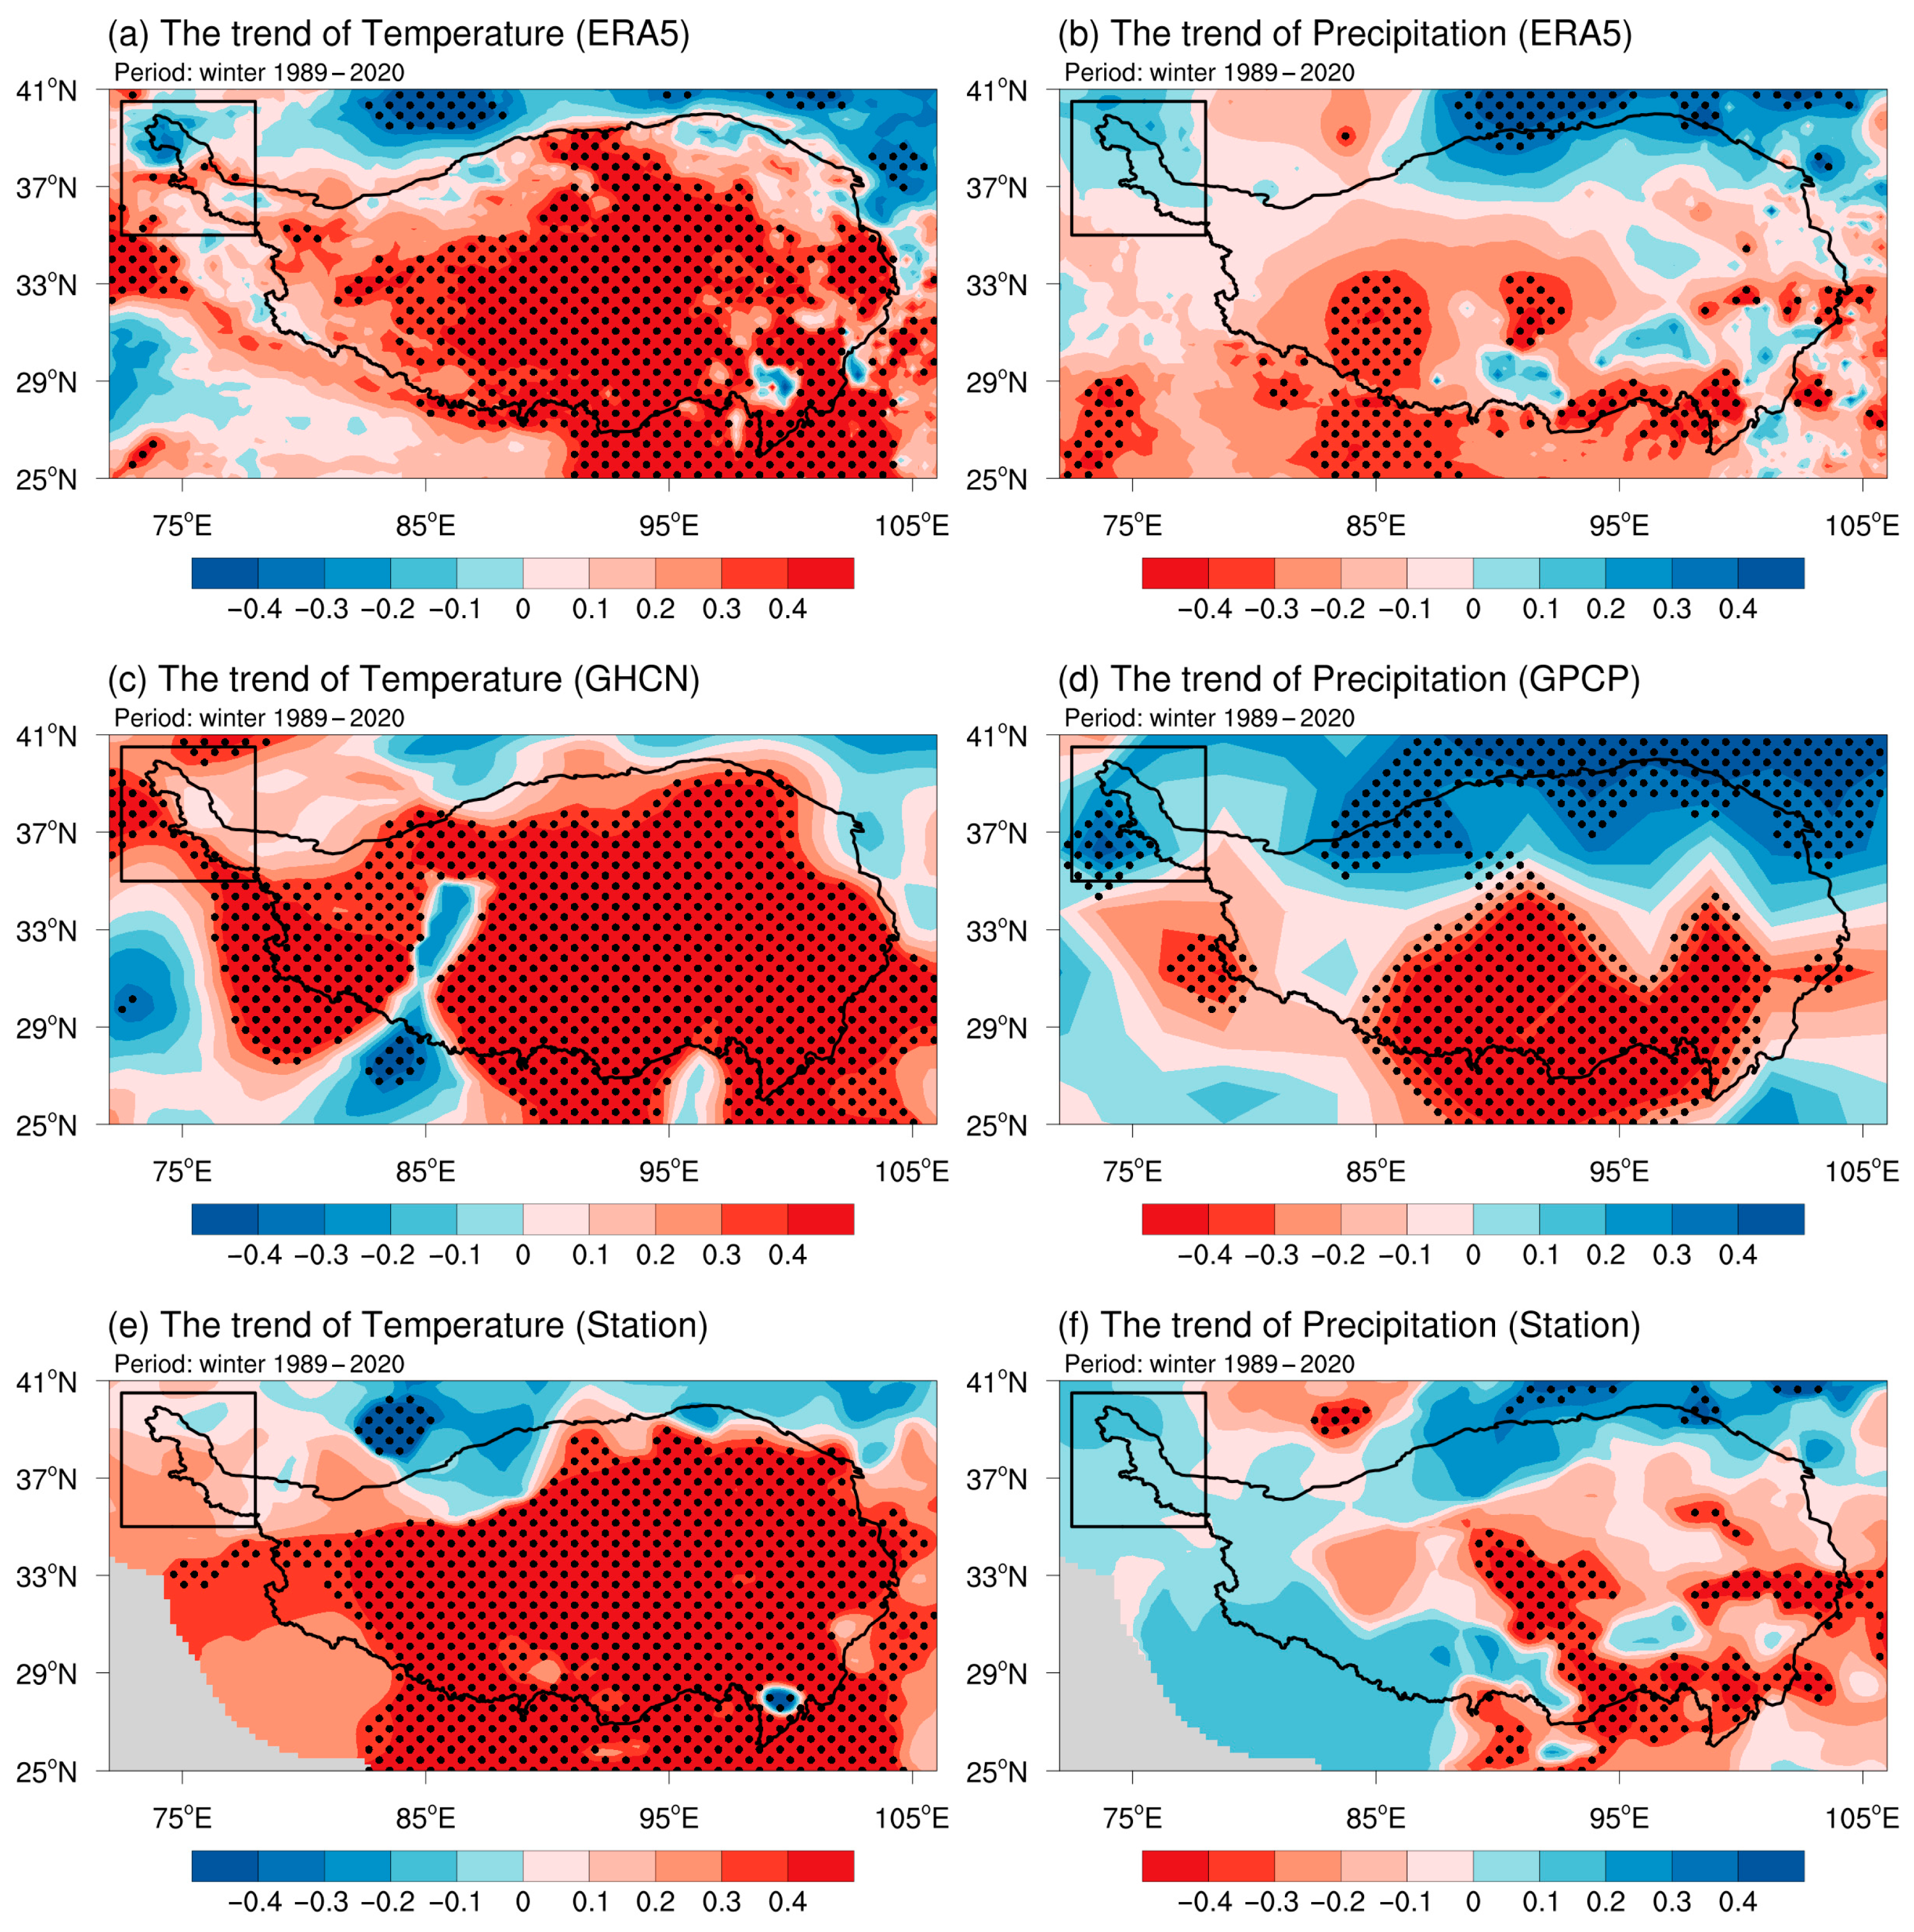
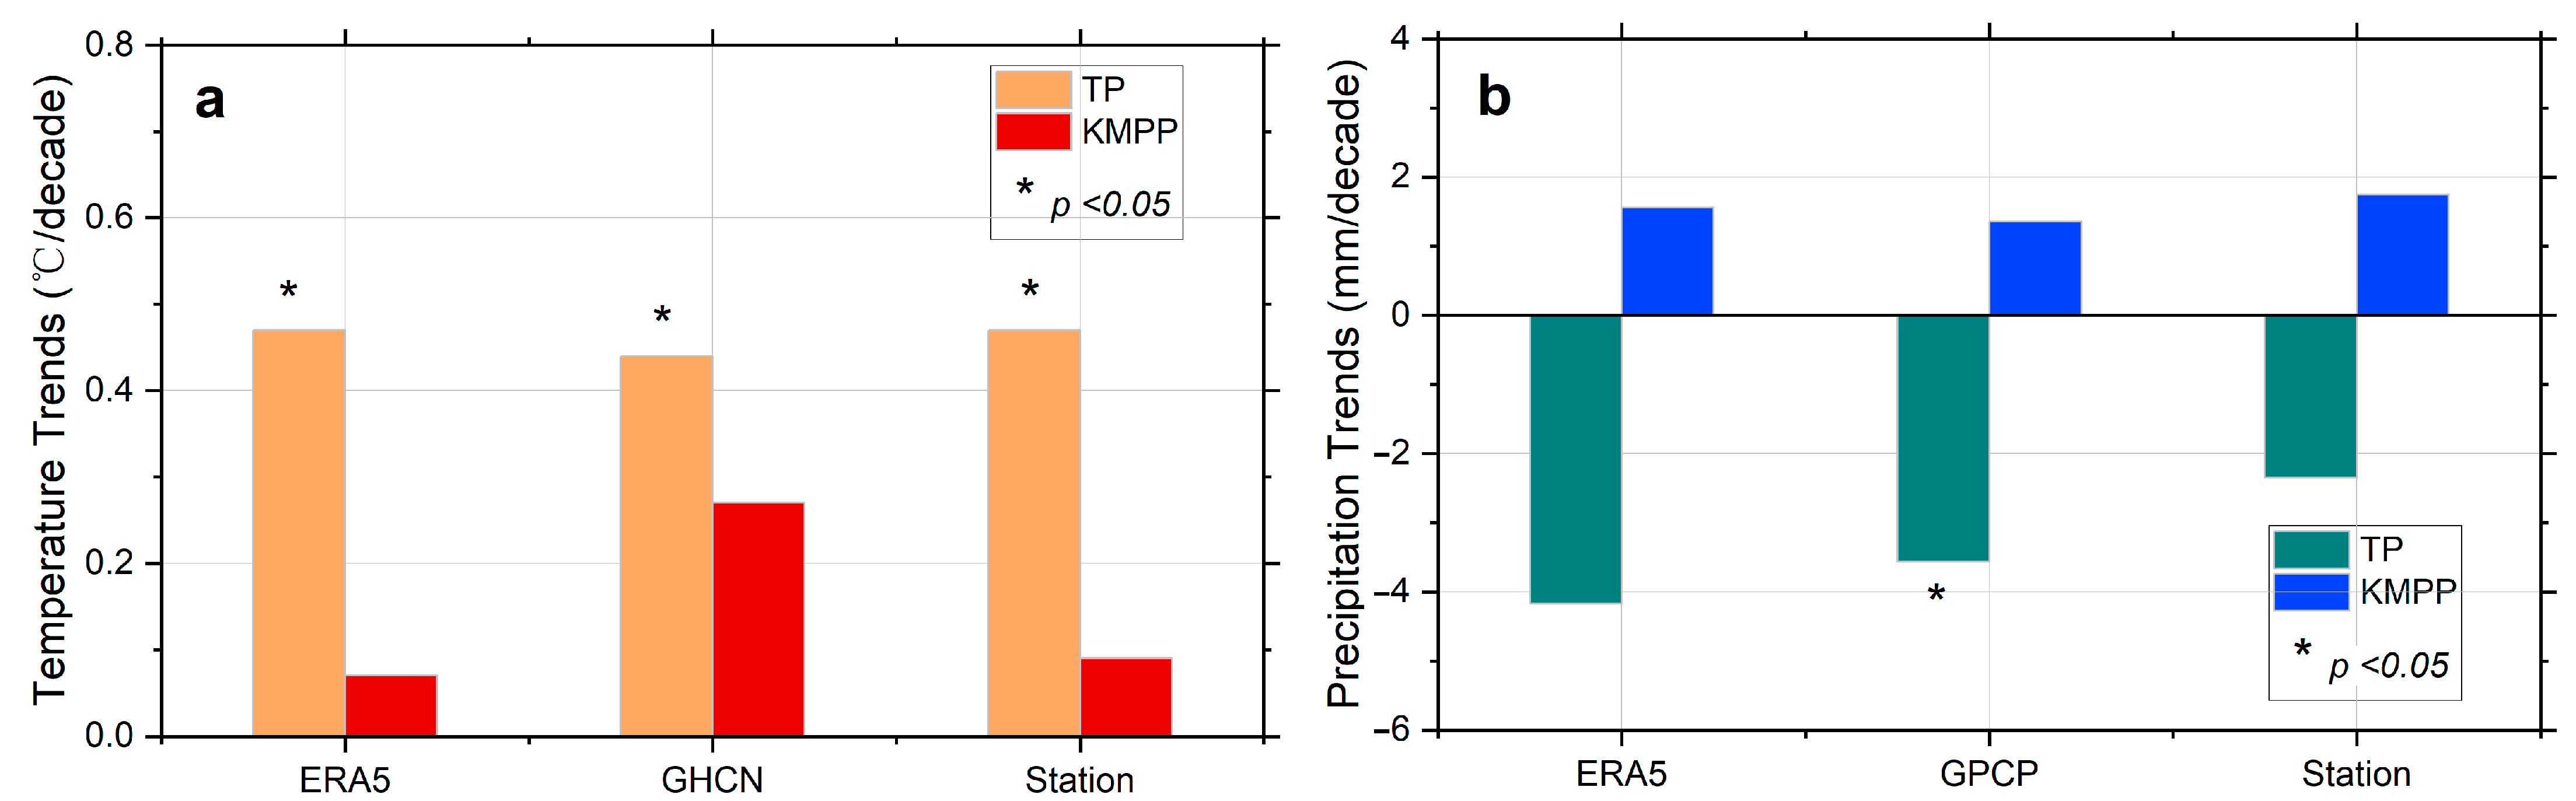
3.2. Effects of the Temperature and Precipitation on the Increasing SCD on the KMPP

The variation of SCD is the result of local and atmospheric teleconnection synergies, where changes in local temperature and precipitation directly influence the variation in SCD. During the period from 1989 to 2020, based on ERA5/GHCH/GPCP/Station data (Figure 4), the temperatures all present significant increasing trends in winter on the TP, with those in most parts of the region passing the confidence significance test at the 95% level (Figure 4a,c,e). However, the temperature-increasing trend on the KMPP is significantly weaker than that of the TP. Some grids show a decreasing trend based on ERA5 and station data (Figure 4a,e). The significant rise of the temperature contributes to snow melting, leading to a decrease of SCD on the TP.
The precipitation trend in winter on the TP exhibits significant regional heterogeneity (Figure 4b,d,f), but the precipitation on the KMPP shows an increasing trend in most grids. The changes of the temperature and precipitation in winter on the KMPP have a certain uniqueness compared to the TP, and the synergistic effect of the temperature and precipitation may have directly caused the abnormal increase of the SCD in winter on the KMPP.
Figure 5 depicts the region-averaged temporal change of the temperature/precipitation in winter for the KMPP and the TP based on ERA5/GHCH/GPCP/station data during the period from 1989 to 2020. The results, based on different kinds of data, show a high level of consistency. They show that the change in temperature on the KMPP is notably weaker than that on the TP, with the latter experiencing a significant increase at 95% confidence significance (Figure 5a). The winter precipitation on the KMPP is increasing, while on the TP it is decreasing (Figure 5b).
This affirms that the long-term changes in temperature and precipitation on the KMPP differ from those observed on the TP. The more-or-less stable temperature and the upward trend of precipitation both contribute to the abnormal change of SCD in winter on the KMPP. On the other hand, the decrease in precipitation and a significant increase in temperature on the TP both play a role in SCD decline as a whole.
It shows that SCD in winter are negatively correlated with temperature but are positively correlated with precipitation on both the TP and the KMPP (Figure 6a). The correlation coefficients between SCD and precipitation on the KMPP/TP in winter are very close, but the coefficient with temperature on the KMPP is notably smaller than that on the TP. The relative contributions of the temperature and precipitation to the SCD based on ERA5/GHCH/GPCP/station data are calculated by multiple partial regressions (Figure 6b). It shows that on both the KMPP and the TP, precipitation plays a more important role than temperature for SCD. On the KMPP, the relative contributions of precipitation are greater than 97%. This indicates that the anomalous increasing trend of SCD on the KMPP is mainly related to the precipitation increase.

3.3. Correlation Between Global SST and KMPP SCD

The global annual average SST has significantly increased almost linearly from the 1970s to the 2000s, with the 1980s and 1990s seeing the most rapid warming [23]. The characteristics of SST changes in boreal winter from 1989 to 2020 are analyzed. It is found that SST in boreal winter has significantly increased (Figure 7a). The correlation between SCD on the KMPP and SST in global oceans in boreal winter shows that there is a significant correlation between the SST of northern North Atlantic Ocean (50–80°N, −25–20°E) and SCD on the KMPP (Figure 7b). It indicates that the north Atlantic Ocean SST may have a high impact on SCD increase on the KMPP. Inter-annual to decadal variability of the SST in boreal winter in the North Atlantic Ocean may have led to variations in SCD on the KMPP.

3.4. The Influence of Water Vapor Transport in the Northern North Atlantic Ocean on the KMPP SCD

The plateau can act as a powerful thermal pump through the “hollow heat island” effect, continuously absorbing anomalously warm and moist airflows from the ocean [9]. Zhang et al. [57] suggest that because of climate warming, the water vapor over the TP has changed dramatically, affecting the moisture balance. The enhanced transport of the water vapor from the ocean to the TP promotes the water cycle and is one of the main reasons for the increased humidity on the TP [23]. Using water vapor transport related vectors as tracers of moisture sources, we aim to expose the water vapor transport pathways from the northern North Atlantic Ocean that affect SCD on the KMPP.
The correlation between SCD and precipitation on the KMPP in winter and the whole layer water vapor flux indicates that there are water vapor transports from the northern North Atlantic Ocean to the KMPP (Figure 8a,b). The water vapor flows out of the northern North Atlantic Ocean, spreads northeastward along the north side of the anticyclone at the Eastern European Plains, turns southwestward at the Baikal Lake or Kara Sea, then spreads southwestward along the south side of the anticyclone and north side of a cyclone west of the KMPP, and finally turns to the KMPP through the Iranian Plateau.
The correlation between the SST of the northern North Atlantic Ocean in winter and the whole layer water vapor flux also indicates a similar but more direct water vapor transport route from the northern North Atlantic Ocean to the KMPP (Figure 8c). The water vapor flows out of the northern North Atlantic Ocean, spreads southwestward along the western side of the cyclone at the eastern Mediterranean Sea, then turns northeastward, and finally reaches the KMPP through the Iranian Plateau.
Therefore, the water vapor transport caused by SST warming from the northern North Atlantic Ocean is a crucial factor for the observed variability of and change in winter precipitation on the KMPP, which influences the variability and trends of SCD on the plateau.
By comparing the anomalies in water vapor flux fields between high and low years of winter SCD on the KMPP, it is found that the abnormal water vapor flux patterns affecting the KMPP are exactly opposite between the two kinds of years (Figure 9). In the years with high SCD, the water vapor flows out of the northern North Atlantic Ocean, spreads northeastward along the north side of the anticyclone in the Eastern European Plains, turns southwestward at the Kara Sea, then spreads southwestward along the west side of the cyclone west of the KMPP, turns northeastward on the Iranian Plateau, and finally reaches the KMPP (Figure 9a). These water vapor transport pathways are similar to Figure 8a,b. It proves again that the water vapor transport caused by SST warming from the northern North Atlantic Ocean is a crucial factor for the abnormal increasing trend of SCD on the KMPP.
Conversely, in years with low SCD, water vapor flows out of the KMPP, spreads southwestward along the south side of the anticyclone west of the KMPP, turns northward at the Persian Gulf, goes westward along the north side of the cyclone near the Black Sea, and then flows to the northern North Atlantic Ocean (Figure 9b).
The water vapor transport patterns for years with high and low SCD are exactly opposite, which once again proves that the SST warming in the northern North Atlantic Ocean can lead to anomalous water vapor transport, influencing the abnormal increasing trend of SCD in winter on the KMPP. SST warming in the North Atlantic Ocean has a significant heating effect on the atmosphere above. The air is forced to rise, and an anomalous low-level cyclonic is formed over the North Atlantic, which is conductive to forming a Rossby wave train-like pattern. The North Atlantic SST thus has the potential to influence the SCD changes on the KMPP by exerting a regulatory effect on the large-scale atmospheric circulation patterns, as pointed out by Liu et al. [58]. The SST warming-associated circulations favor the transport of water vapor from the North Atlantic Ocean to the KMPP, allowing for greater-than-normal precipitation that leads to SCD increase in the study area. In this study, we mainly focus on the effect that the water vapor transport caused by SST warming in the North Atlantic Ocean has on SCD increase on the KMPP. We intend to conduct an in-depth analysis of these dynamics in the future.

3.5. Simulation of the Water VAPOR Transport Influence from the Northern North Atlantic Ocean

The previous discussion indicates that SST warming in the northern North Atlantic Ocean may have affected the abnormal increasing trend of SCD in winter on the KMPP. Here, we use FLEXPART model simulation to determine the water vapor transport pathways. Previous studies conducted model simulations to trace water vapor based on the global average residence time of the water vapor (10 days) [59]. Because SST in the northern North Atlantic Ocean experienced the most significant warming in December 2016, this paper selects December 2016 as the time point for the simulation using the FLEXPART model. Simulations for periods lasting 5 days and 10 days were conducted. During the simulation period, the total number of particles remained constant (100 particles for the simulation in this paper). From the simulation backwards for 5 days from the KMPP, the water vapor flows from the northern North Atlantic Ocean to the KMPP can be visualized (Figure 10). One branch of the water vapor flows out of the northern North Atlantic Ocean, turns southeastward at the Black Sea and eastern Mediterranean Sea, and finally travels to the KMPP through the Iranian Plateau.
The water vapor transport pathway based on the FLEXPART model (Figure 10) is similar to that obtained by analyzing the water vapor transport by the related vectors (Figure 8a,b) and the anomalies in water vapor flux fields in high SCD years (Figure 9a). It reaffirmed that the water vapor transport caused by SST warming from the North Atlantic Ocean is an important contributor to the abnormal increasing trend of SCD in winter on the KMPP. Our observations and simulations also confirm that the water vapor path is an inverted S-shape.

4. Discussion

4.1. The Representativeness of SCD Data

SCD changes at stations on the TP are similar to those from remote sensing data after an optimized variation processing in areas with station coverage (Figure 3a,b and Figure 11a,b), and their time series are closely aligned (Figure 11d). However, in areas with no stations, spatial differences are more pronounced (Figure 11c). On the KMPP, stations are mainly concentrated in the northeastern region, and the observed SCD increase is also seen in this area (Figure 11a,b). The only station in the central KMPP shows a decrease in SCD, so apart from the station-rich northeastern KMPP, SCD shows a decrease in other areas (Figure 11). This also helps explain the inconsistency between the station and remote sensing SCD time series data shown in Figure 11c.
However, when using the more comprehensive variational SCD data, we find that the overall SCD on the KMPP is still increasing, which aligns with the SCD changes in areas with dense station coverage. This indicates that in regions with low station coverage, relying on only a few stations to estimate SCD changes introduces greater uncertainty, potentially leading to contradictory trends. Data combining the advantages of remote sensing and station data with high-resolution and strong objectivity are needed to examine the trend in the SCD on the TP, particularly on the KMPP.

4.2. Changes in SCD on the TP and KMPP

The data for SCD on the TP include station observations, satellite remote sensing data, reanalysis data, and climate model output products [44]. Research results based on different data have some differences in the variations of SCD on the TP (Table 2). The station data are highly accurate, but there are few meteorological stations in the areas above 5000 m, resulting in poor regional representativeness in the central and western regions of the plateau [7]. The satellite remote sensing data have a high resolution, but are subject to cloud contamination issues, and their accuracy is thus limited [44]. Most reanalysis data perform poorly when analyzing the SCD trend on the TP, while the model output products are often too coarse to resolve the local changes of SCD on the TP [44]. Because of the high resolution and strong objectivity of SCD data in this paper, the results showing that TP SCD decreases and KMPP SCD increases are considered to be reliable.
Research regarding SCD changes on the KMPP is limited because of the limited observation data from the region (only 11 stations, Figure 1). Based on the NOAA Climate Data Record of the snow cover extent, Liu et al. [58] showed that SCD in the western TP (including the KMPP) have remarkable decreasing trends in spring. Huang et al. [7] analyzed the daily cloud-free remote sensing snow cover data from 1980 to 2020, indicating that the SCD in the Amu Darya basin has increased. The conclusions regarding SCD trends from these studies on the KMPP are exactly the opposite to ours. In this paper, we used remote sensing SCD data after an optimized variation processing process [17] and found that winter SCD on the KMPP increased significantly at a rate of 4.75 days/decade during the period from 1989 to 2020, while there has been a significant decrease on the TP with a rate of −1.50 days/decade. Our research confirms the increasing trend of SCD on the KMPP, as found in Huang et al. [7]. The increase in SCD on the KMPP differs from the changes in SCD on the TP.

4.3. Causes and Impacts of SCD Changes on the KMPP

Wu and Wu [31] found that the North Atlantic tri-pole SST anomalies induced by the spring NAO can persist into summer and excite downstream atmospheric teleconnections. The Rossby wave train, triggered by the tri-pole SST anomalies, exhibits an anomalous cyclonic or anticyclonic center over the Pamir-Tienshan region, favoring excessive or reduced snow cover, respectively. The change in the spring NAO is responsible for the inter-decadal variability of the spring NAO impact on summer Pamir-Tienshan snow cover. This indicates that high-latitude atmospheric patterns can influence spring SCD on the plateau. In this paper, we focus on winter SCD variability in the KMPP region and explore the reasons for the increase in SCD on the KMPP from the perspective of local climatic factors and water vapor transport. We found that the changes in SCD on the KMPP differ from those on the TP. The difference can be summarized in a mechanism diagram (Figure 12). For local climatic factors, we find that precipitation on the KMPP almost dominates the changes in SCD, while the changes in SCD on the TP are jointly influenced by precipitation and temperature. Furthermore, the increased SCD on the KMPP is attributed to SST warming in the northern North Atlantic Ocean. Previous studies have shown that tropical ocean phenomena like ENSO and IOD significantly impact TP snow levels [25,26,27,28,29,30], but here we highlight that the spatial inconsistency of TP snow changes is mainly regulated by high-latitude North Atlantic SST.
SCD are closely related to the snow depth and mountain glacial mass balance. Previous studies have found that the glacial area of the western Kunlun Mountains shows a different change from that of other regions in China and central Asia [53,54,55,56]. Under climate warming conditions, most mountainous glaciers are melting, but the western Kunlun Mountains and the Pamir Plateau are experiencing increased mass balance [53,54,55,56]. This phenomenon has been termed the “Western Kunlun Mountains Oddity” [53,54,55,56]. As shown in this paper, the findings can well explain the peculiarities of winter precipitation and SCD on the KMPP and the “Western Kunlun Mountains Oddity” in the mountains’ glacial change. This analysis will also be crucial for further understanding the current and future changes in the mountainous hydro-cycle and water resources, which are closely related to managing and using water resources in the central Asian highlands.
The TP, also known as the “Water Tower of Asia”, is the source of several major rivers in Asia, including the Yangtze, Yellow, Yarlung Zangbo, Indus, Ganges, Mekong, Amu Darya, and Tarim rivers [12,13,14]. Yao et al. [61] noted a decrease in solid water resources and an increase in liquid water resources reflected in rising river flows and the expansion of plateau lakes. Walter et al. [62] assessed the impact of climate change on the plateau’s water resources and found that increased glacial melt and snowmelt have altered river flows. While changes in the Indus River are mainly glacier-driven, other rivers are primarily influenced by snowmelt. Yao et al. [61] also indicated that the variation in water resources across the plateau is uneven due to differing regional climatic factors, a trend that may intensify under future climate change. The KMPP, as the source of the Tarim, Indus, and Amu Darya rivers, shows an increase in the number of snow days based on satellite SCD data, suggesting a potential rise in solid water reserves in this area. This contrasts with other regions of the plateau and supports Yao et al.’s [61] conclusion of spatially uneven changes in water resources due to climate change. The findings reported in this paper will not only enhance our understanding of the regional change in climate, hydro-cycle, and environment, but also contribute to a more efficient and integrated management of water resources in the KMPP and the surrounding areas.

4.4. Limitations

Although this paper utilizes high-resolution and objective remote sensing data to confirm the abnormal increasing trend of SCD in winter on the KMPP from 1989 to 2020, the reasons for the increase are explored from the perspectives of temperature, precipitation, and water vapor transport caused by SST warming in the northern North Atlantic Ocean; as such, it must be noted that the variations of SCD on the KMPP and TP are a complex process. Other factors, such as Indian and Pacific Ocean SST, Arctic sea ice, stationary waves, and human activity, including anthropogenic global warming and aerosol emission [44,58], may also play an important role. Moreover, this paper did not undertake a quantitative assessment of the individual contributions of these factors. The numerical models can be used in the future to address this limitation and provide a more in-depth understanding of the relative contributions of these factors. Another issue worthy of research in the future is whether the factors affecting SCD variations in the KMPP and the TP have experienced changes in the past. You et al. [44] indicated that SCD variation on the TP experienced a turning point around 1990. Was the effect of the water vapor transport caused by SST warming in the northern North Atlantic Ocean on the KMPP SCD before 1989 different than that after 1989? These questions need to be investigated in the future.

5. Conclusions

This study utilizes high-resolution and objective remote sensing data obtained using an optimized variation processing method to confirm the abnormal increasing trend of SCD in winter on the KMPP from 1989 to 2020. The possible influencing factors and mechanisms are discussed, and the impacts of local climatic factors and water vapor transport caused by SST warming on SCD on the KMPP are explored from the perspectives of temperature, precipitation, and northern North Atlantic Ocean SST. The FLEXPART model was used to simulate water vapor transport. The main results of this study are as follows:
(1)
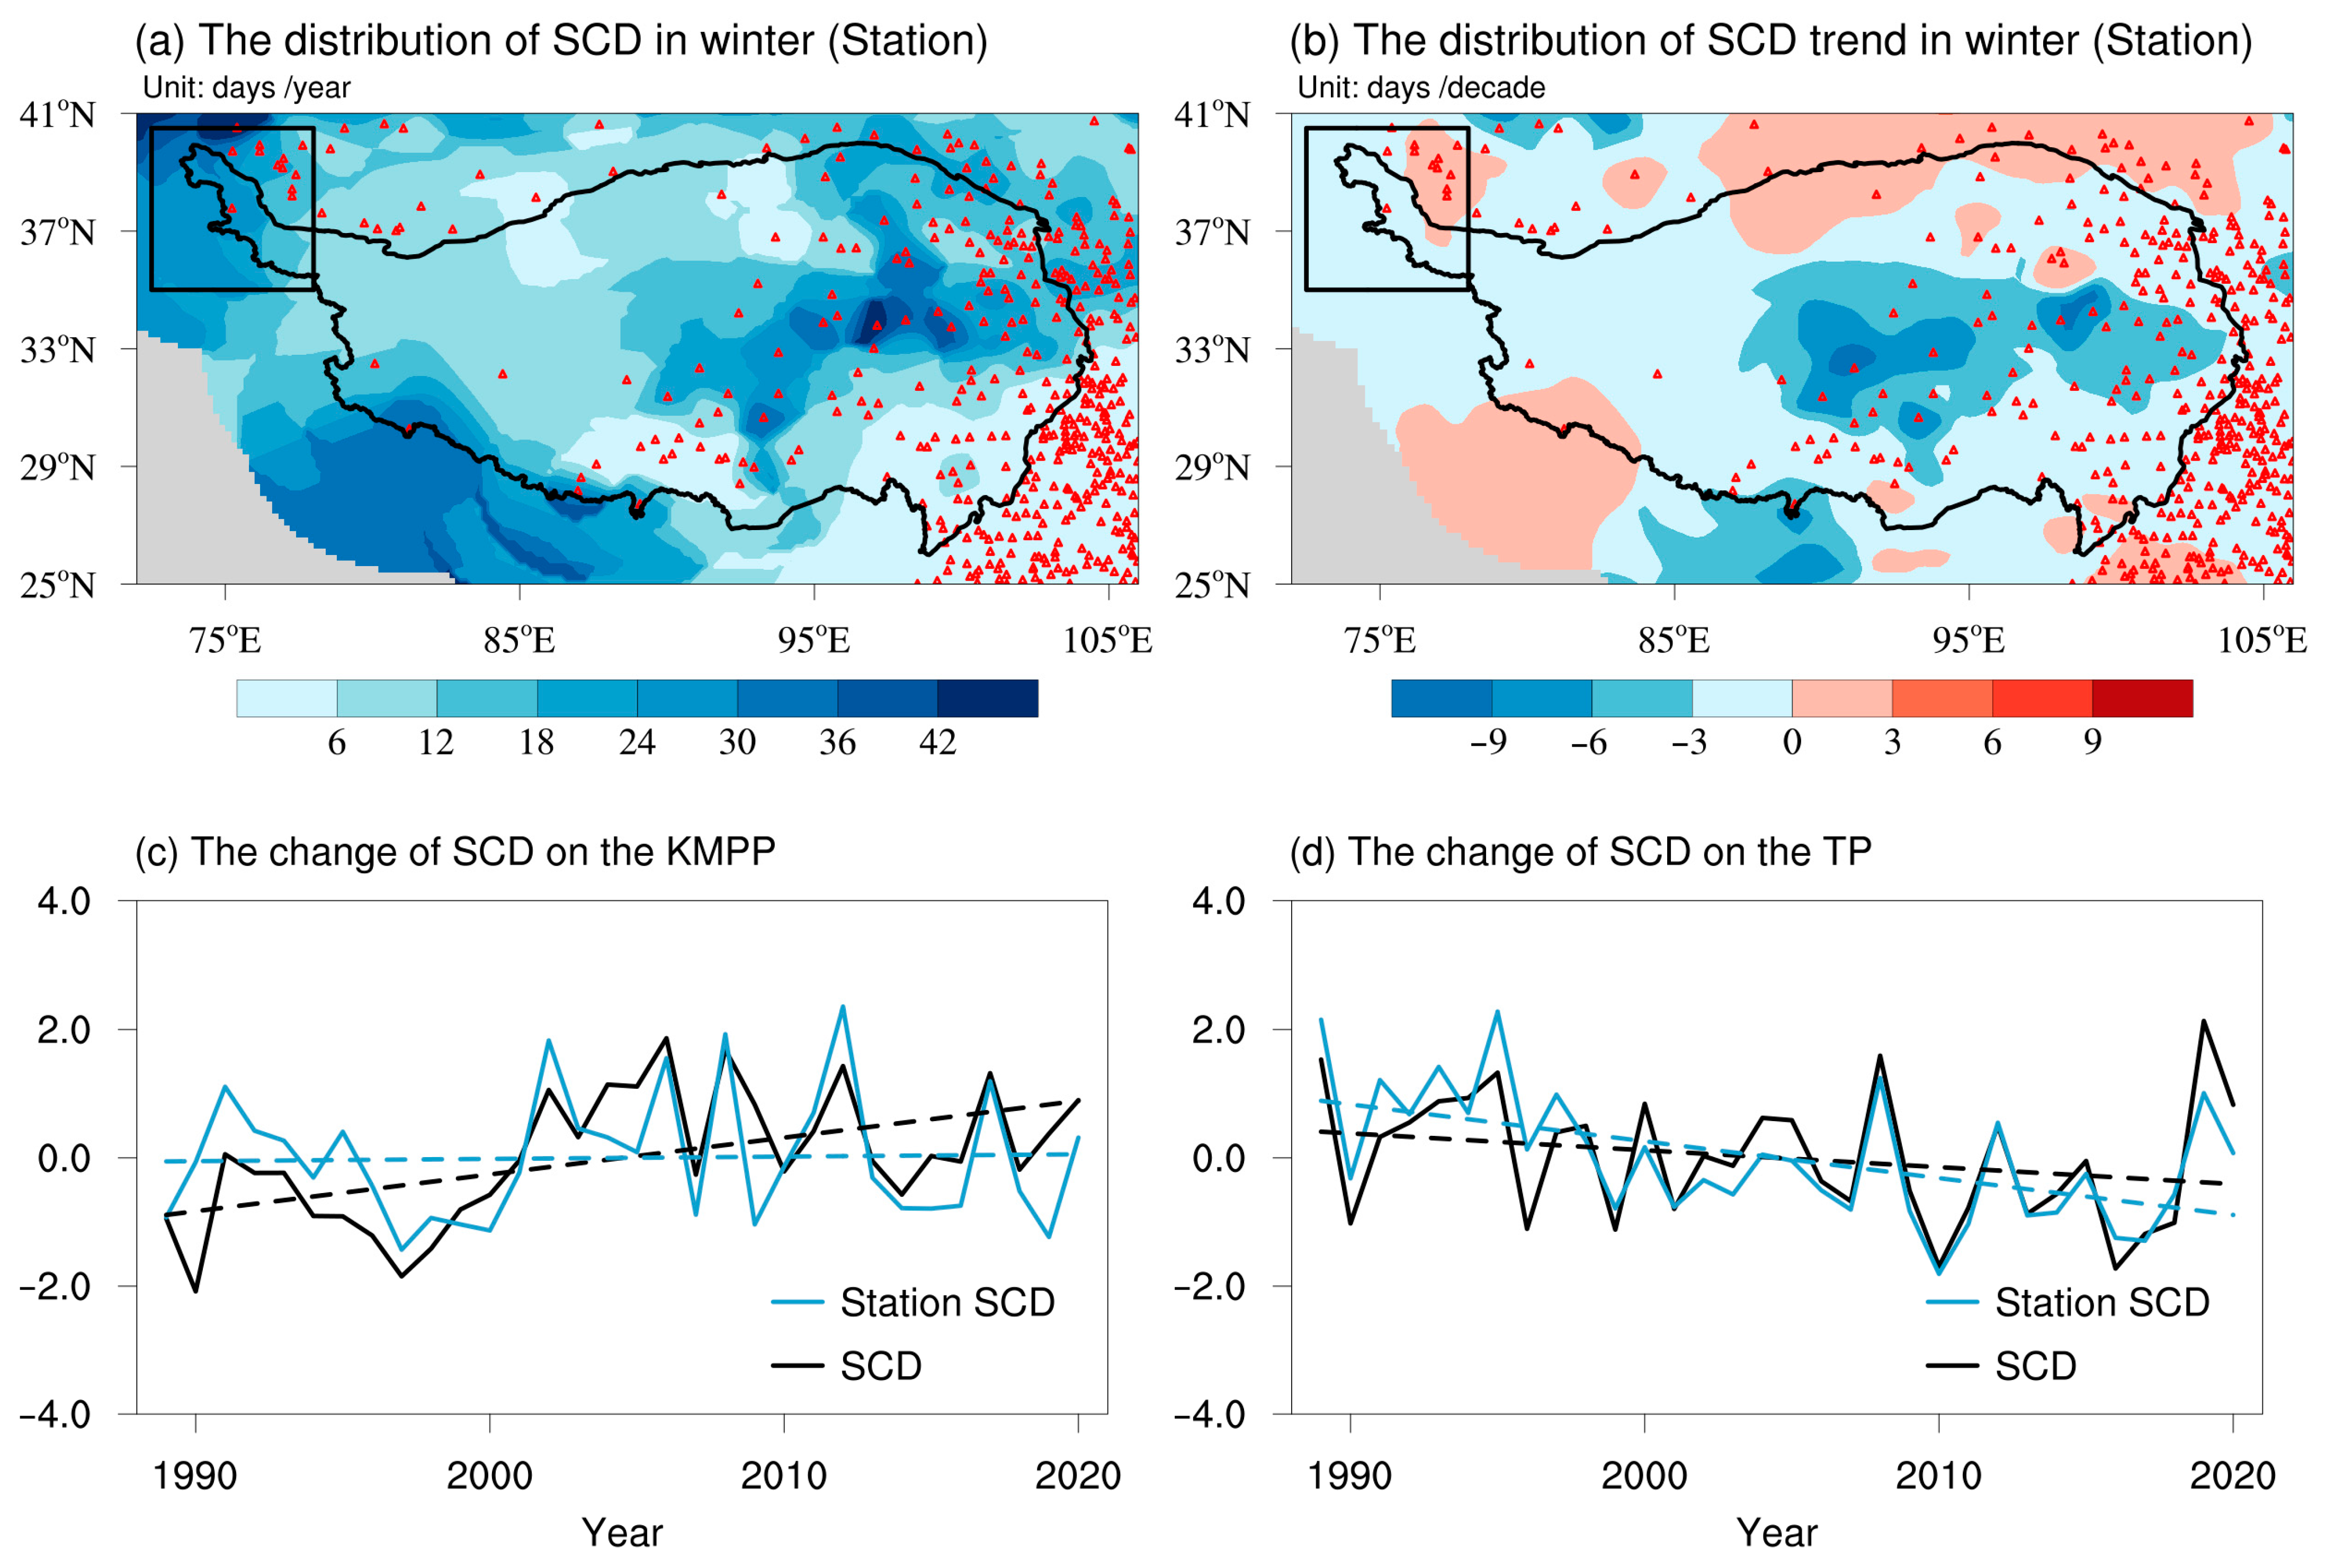
From 1989 to 2020, SCD increased significantly, with the trend of 4.75 days/decade (significant at the 0.01 level), in winter on the KMPP, while that of the TP decreased significantly at −1.50 days/decade (significant at the 0.1 level). This confirms previous research findings that SCD on the KMPP have not decreased, but show a significant increase that differs from that on the TP region. Additionally, using more comprehensive variational SCD data, we found that SCD on the KMPP continue to increase, which is consistent with trends in areas with dense station coverage. This highlights the uncertainty of relying on sparse station data and the need for high resolution remote sensing and station data to better assess SCD trends, particularly on the KMPP.
(2)
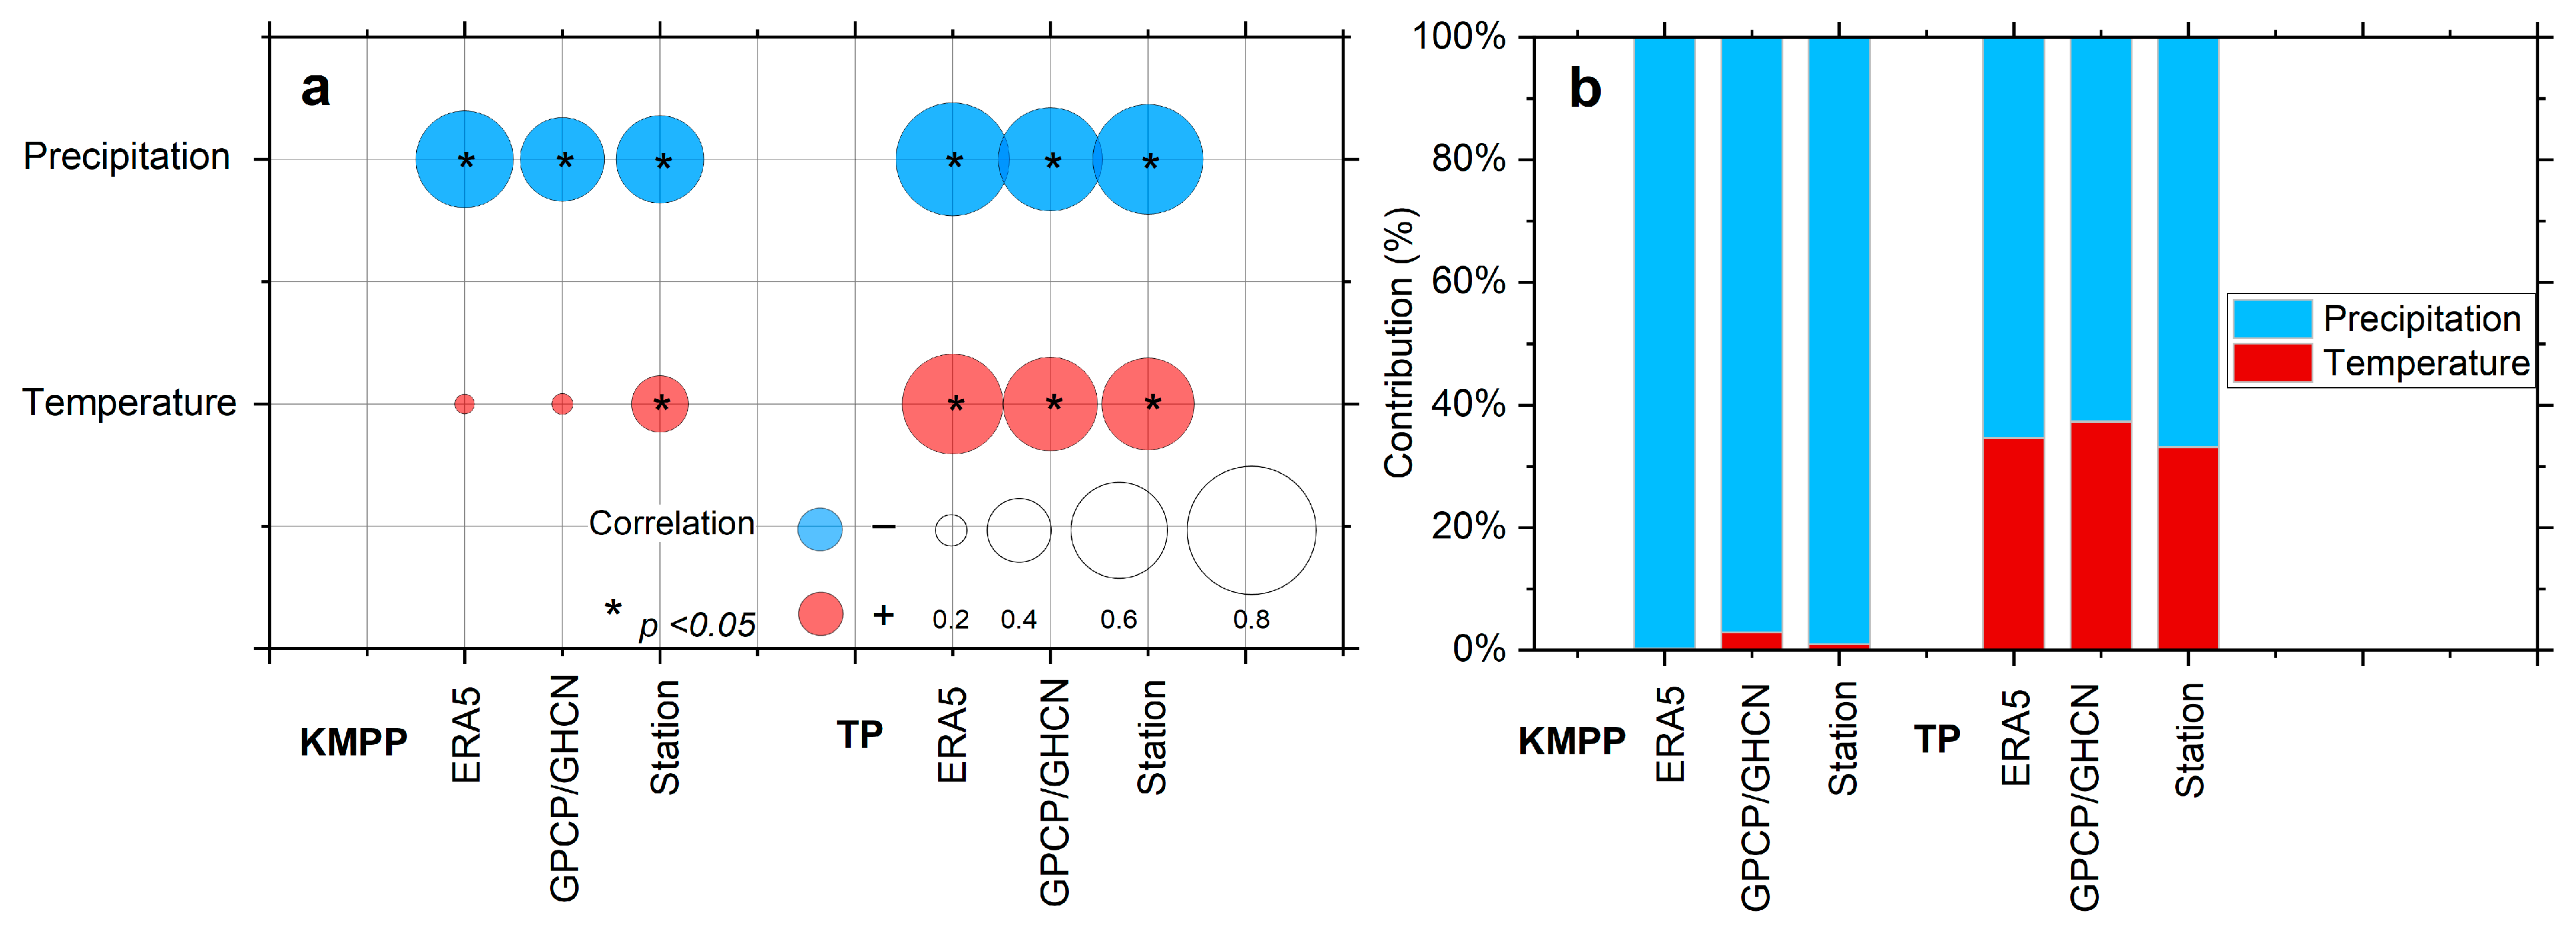
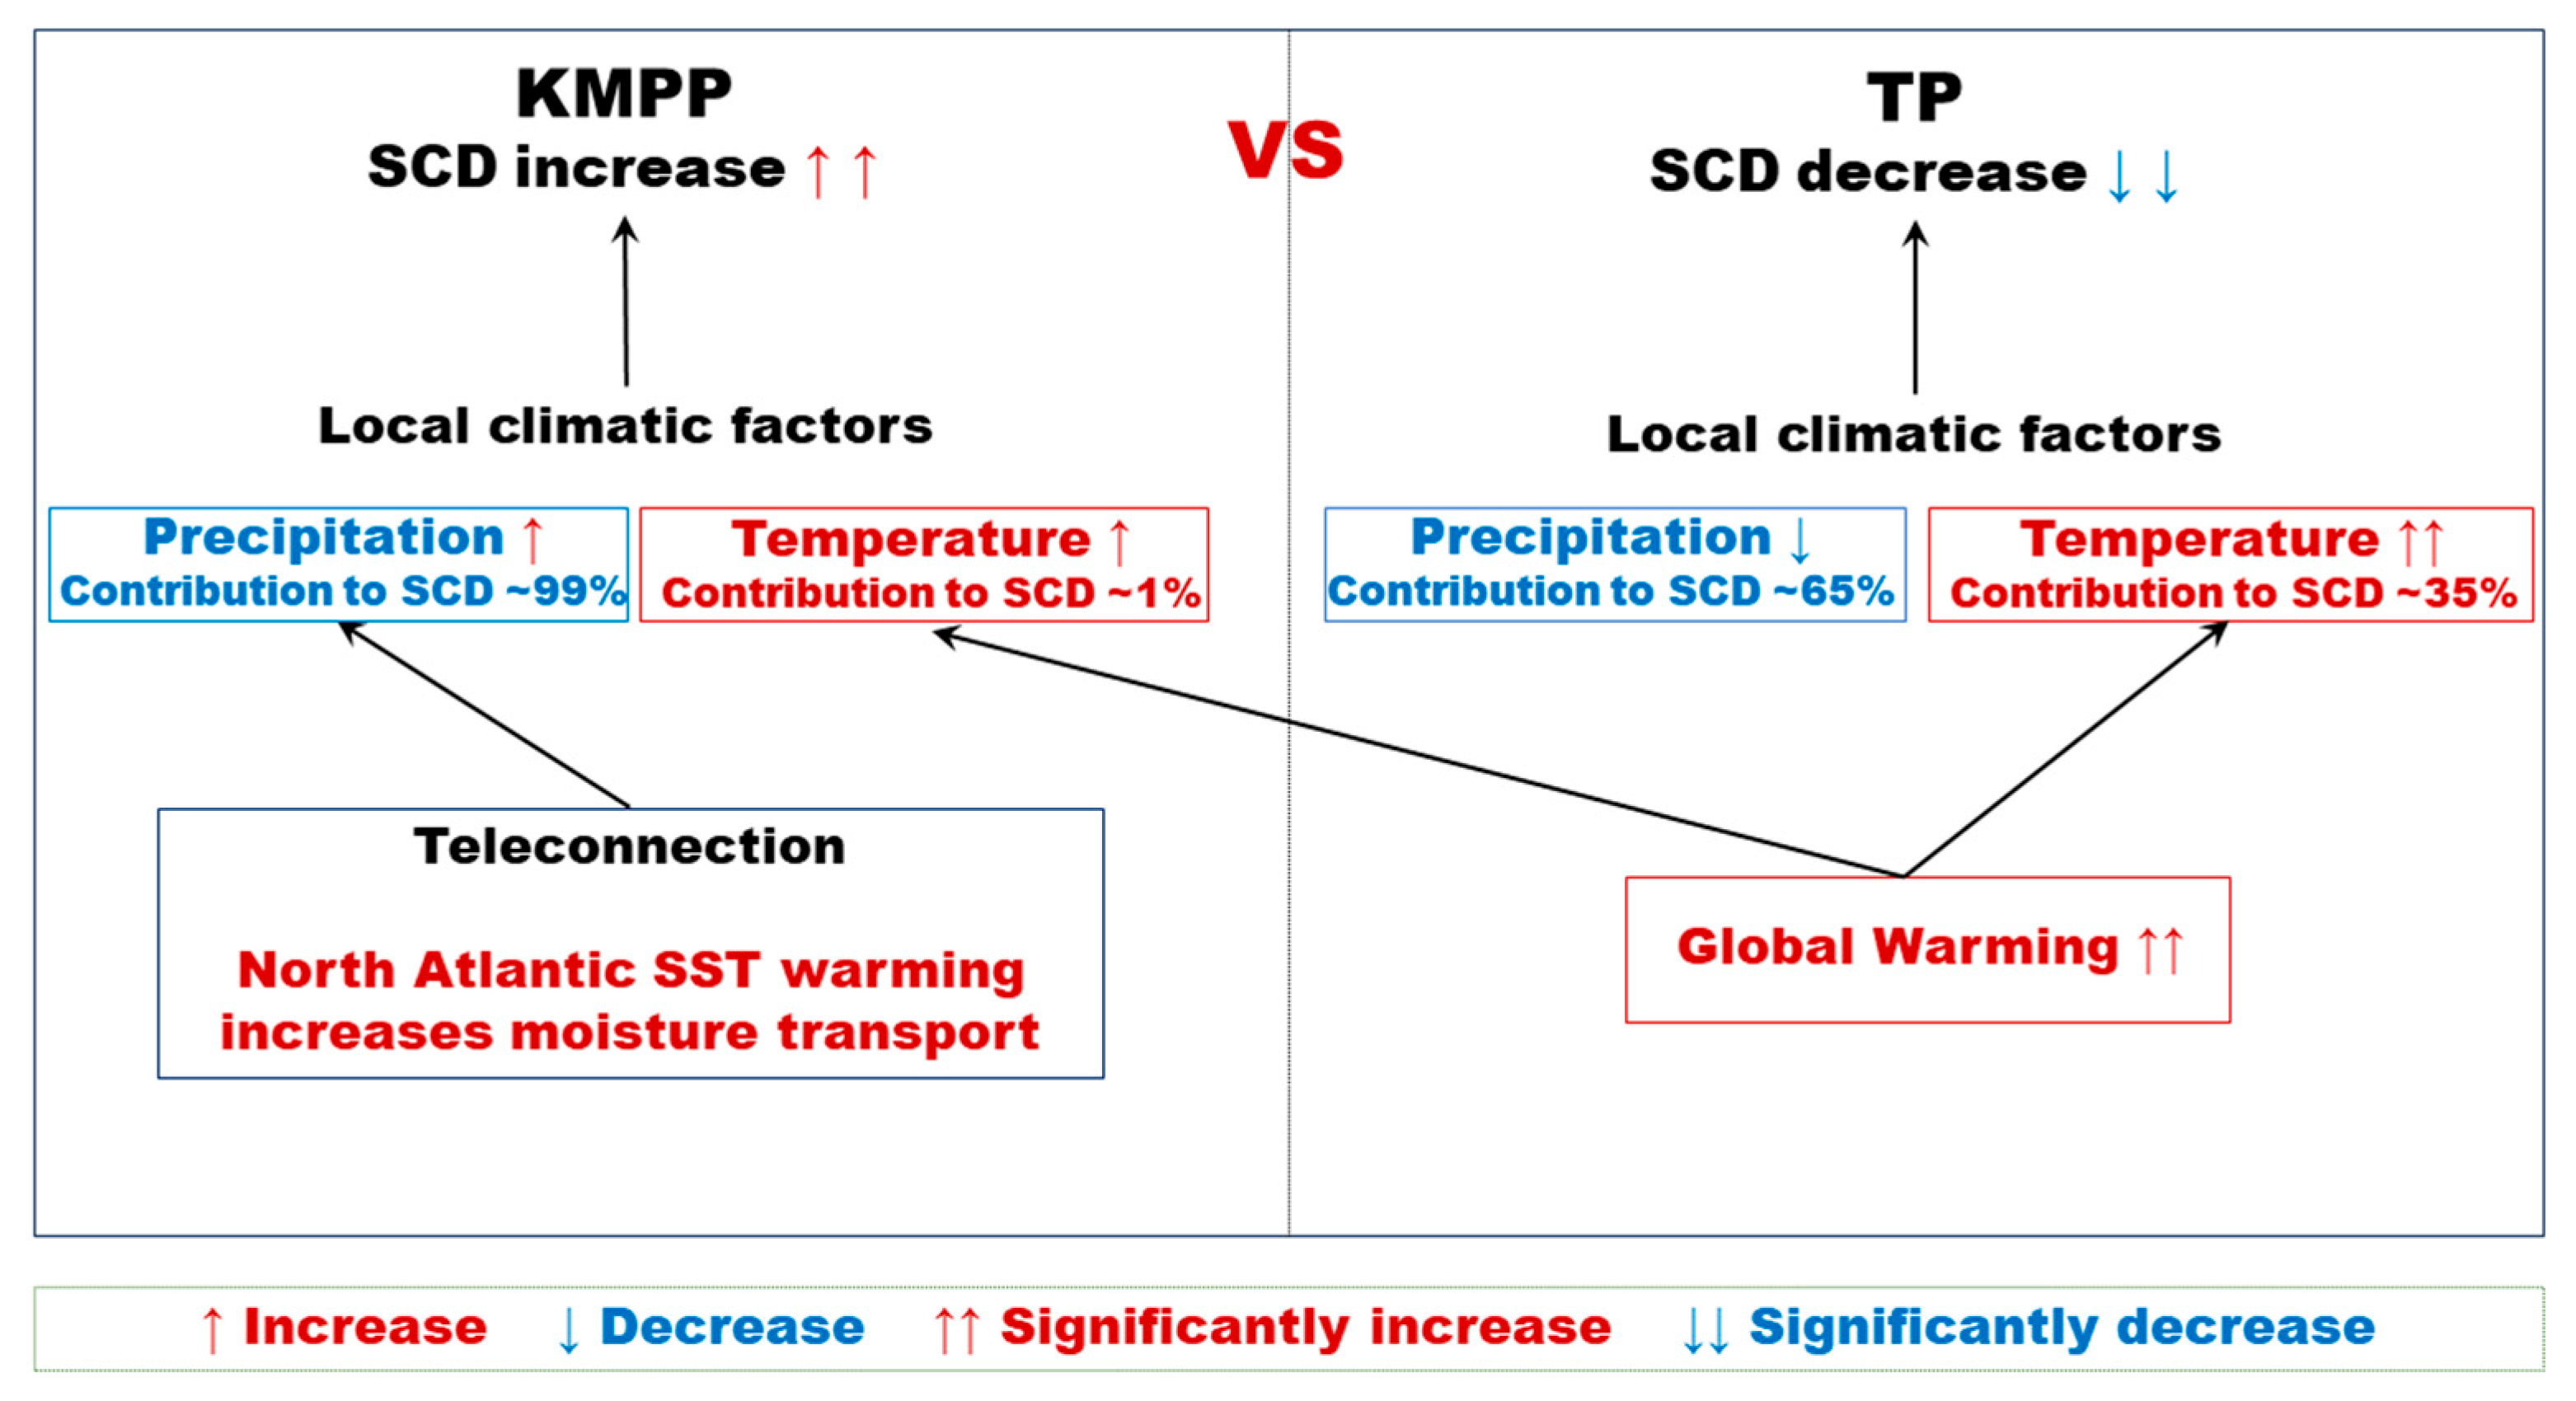
The variation of SCD results from the combined effect of local temperature and local precipitation. On the KMPP, there is an increasing trend of precipitation, derived from ERA5, GPCP, and station data, while a decreasing trend is clear on the TP. The relative contributions of precipitation to SCD play a dominant role on the KMPP. Increasing precipitation is the local influencing factor for the abnormal increase of SCD in winter on the KMPP. This is clearly different from the reasons for SCD changes on the TP, where the decrease in SCD is attributed to a combination of temperature and precipitation changes.
(3)
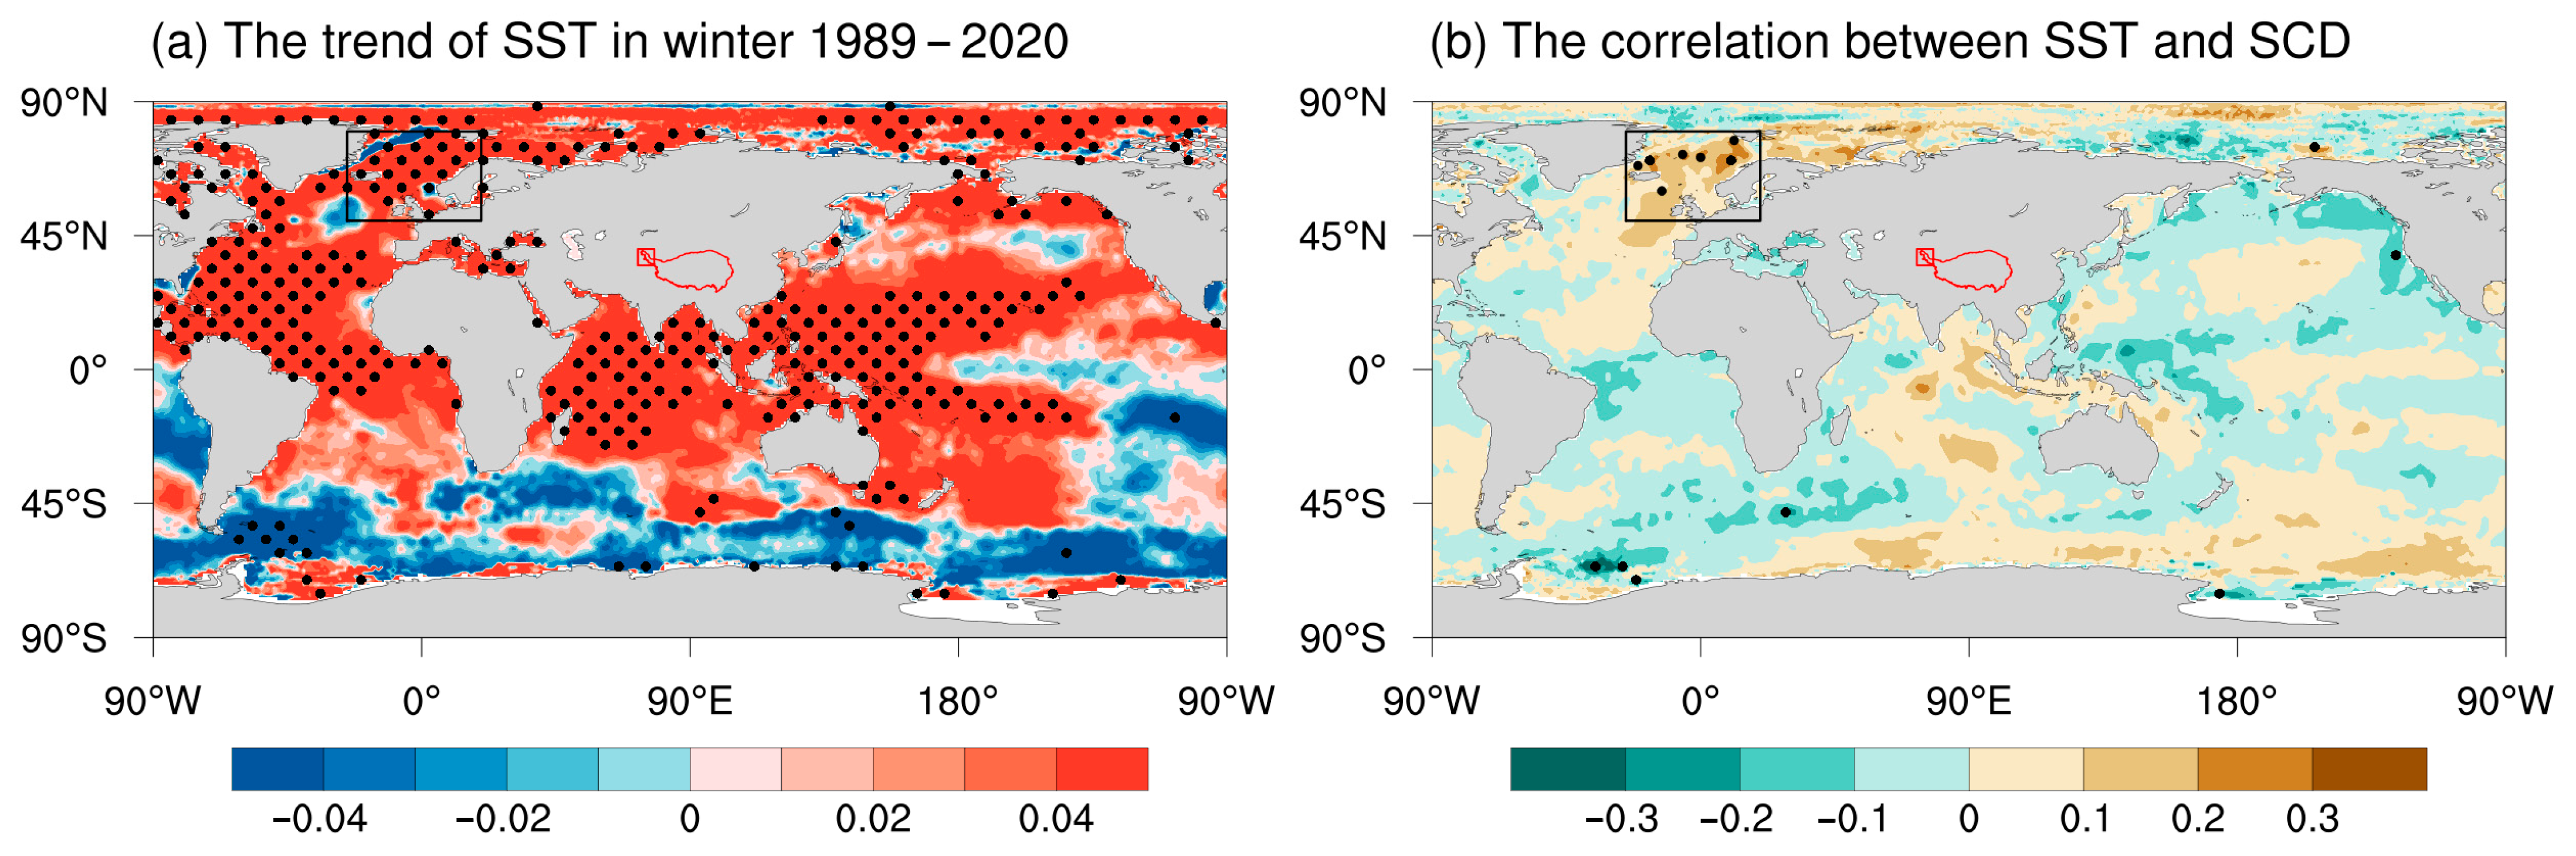
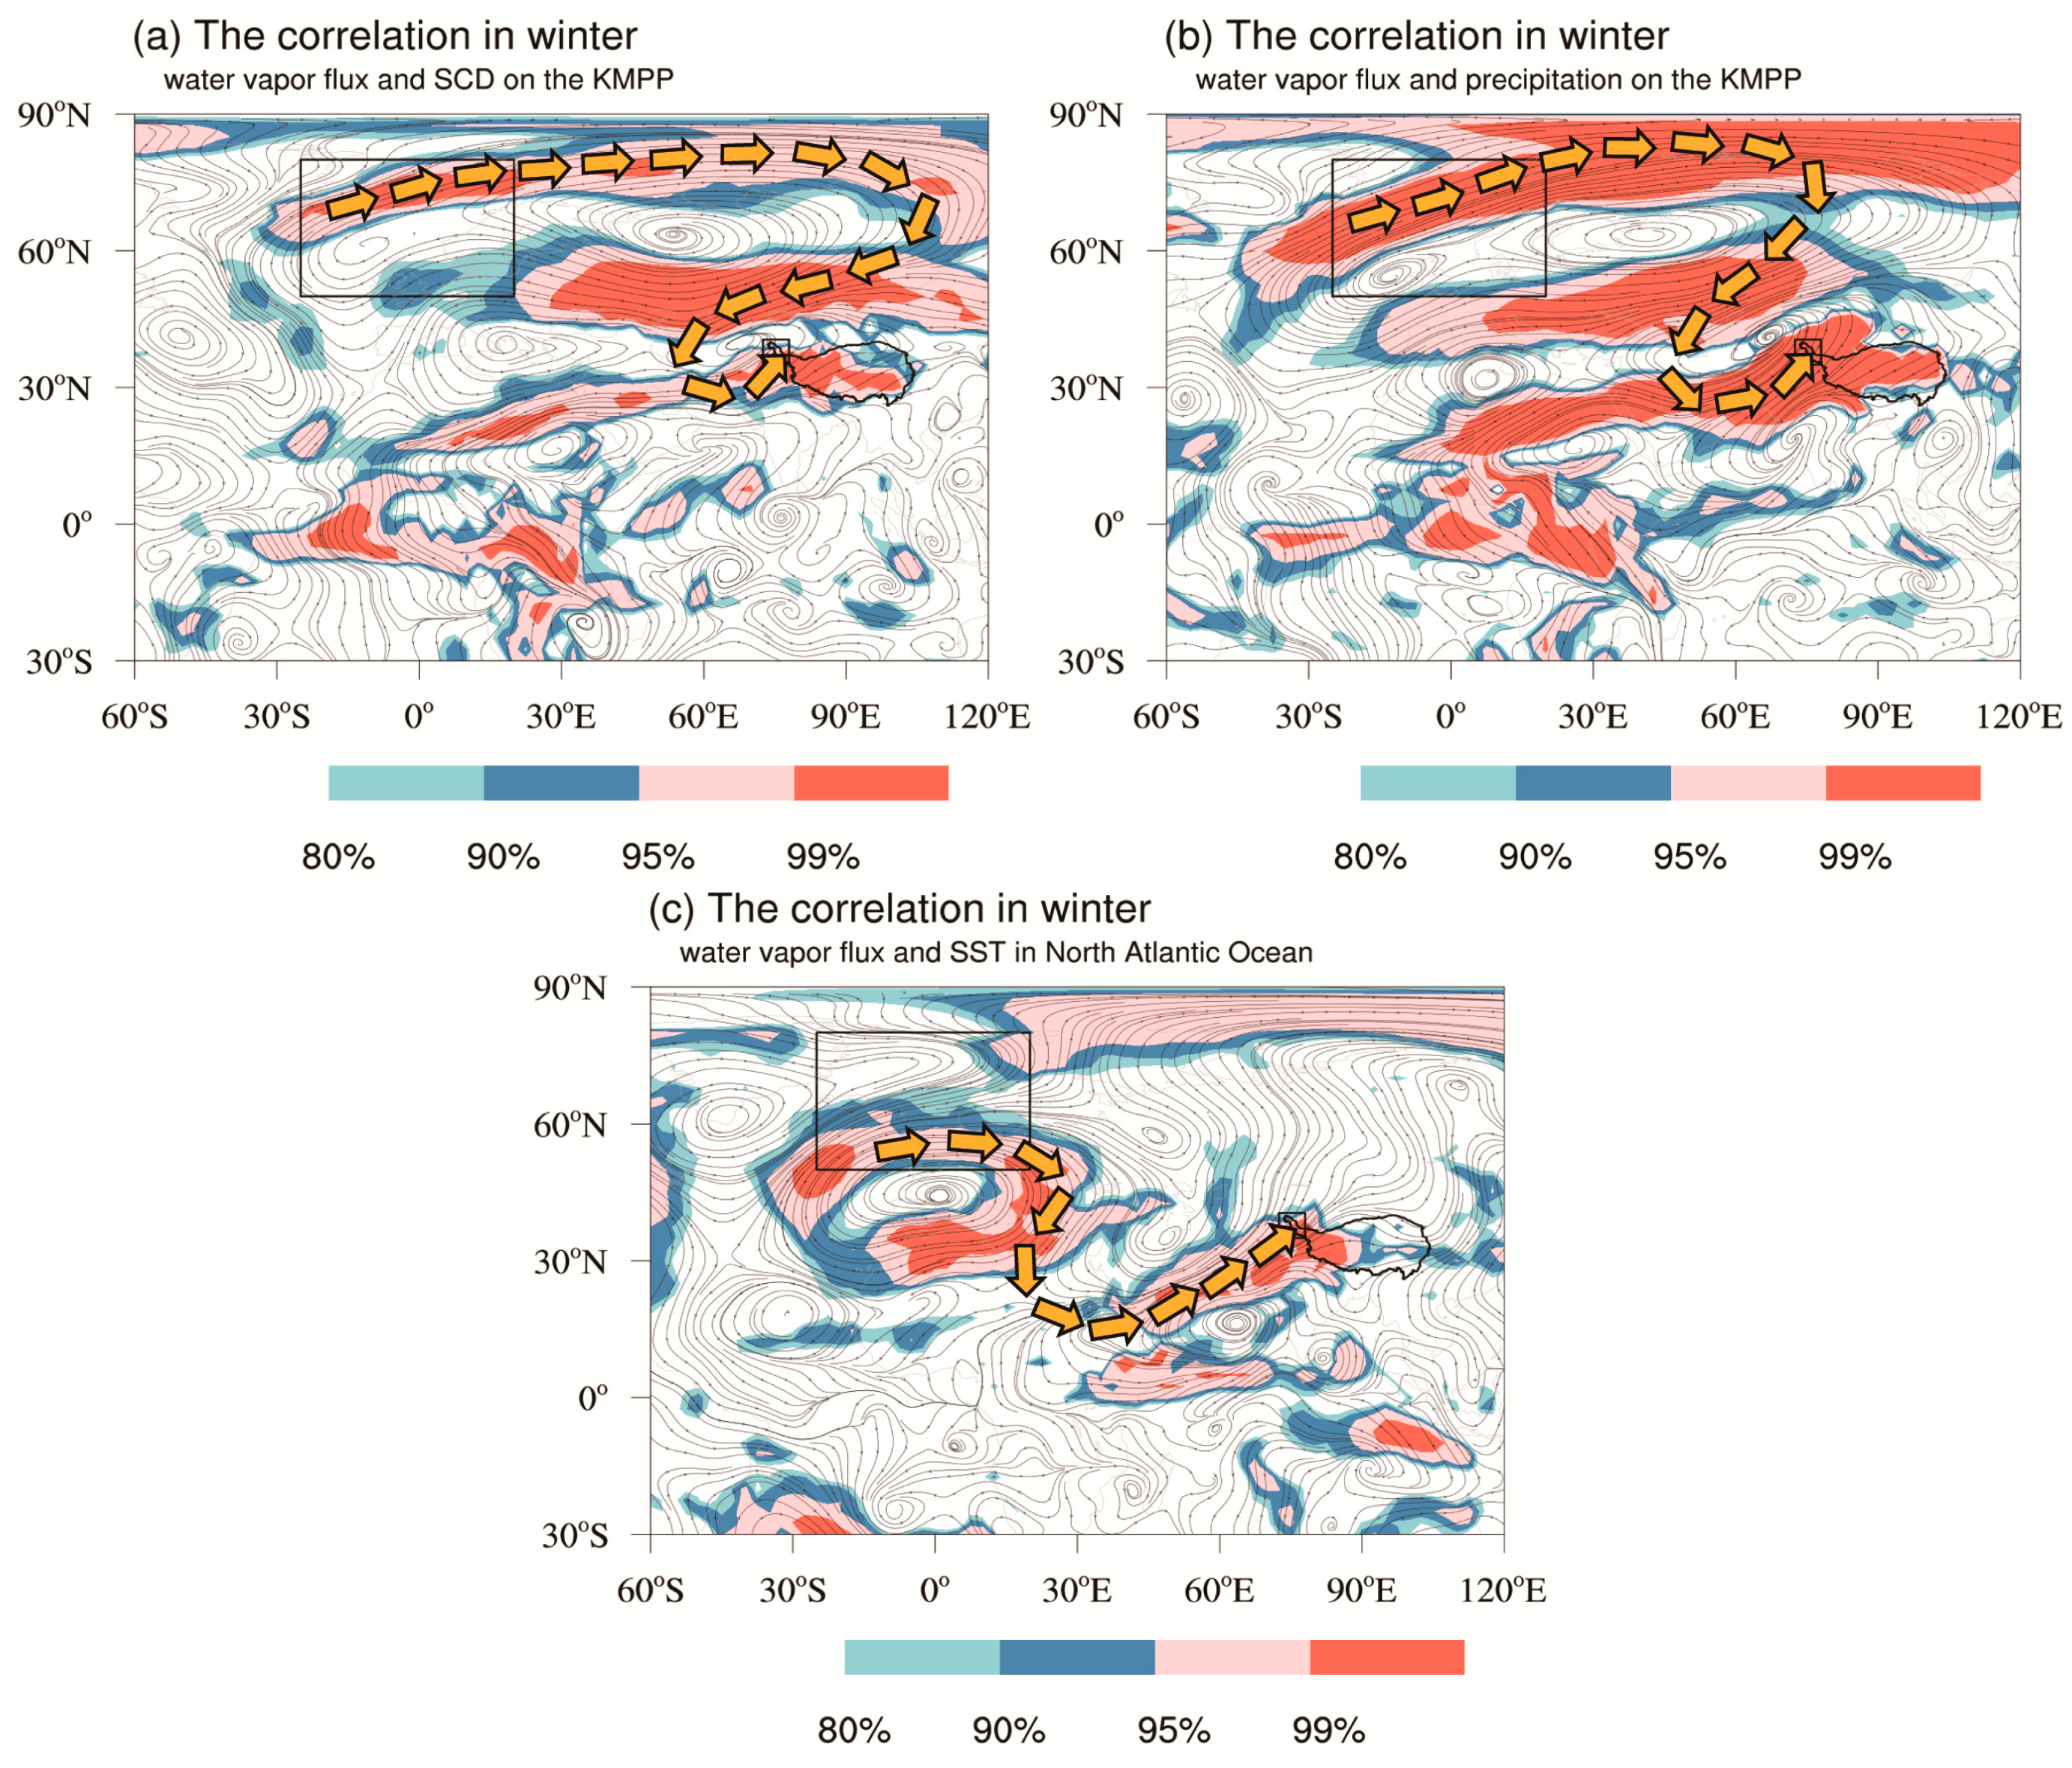
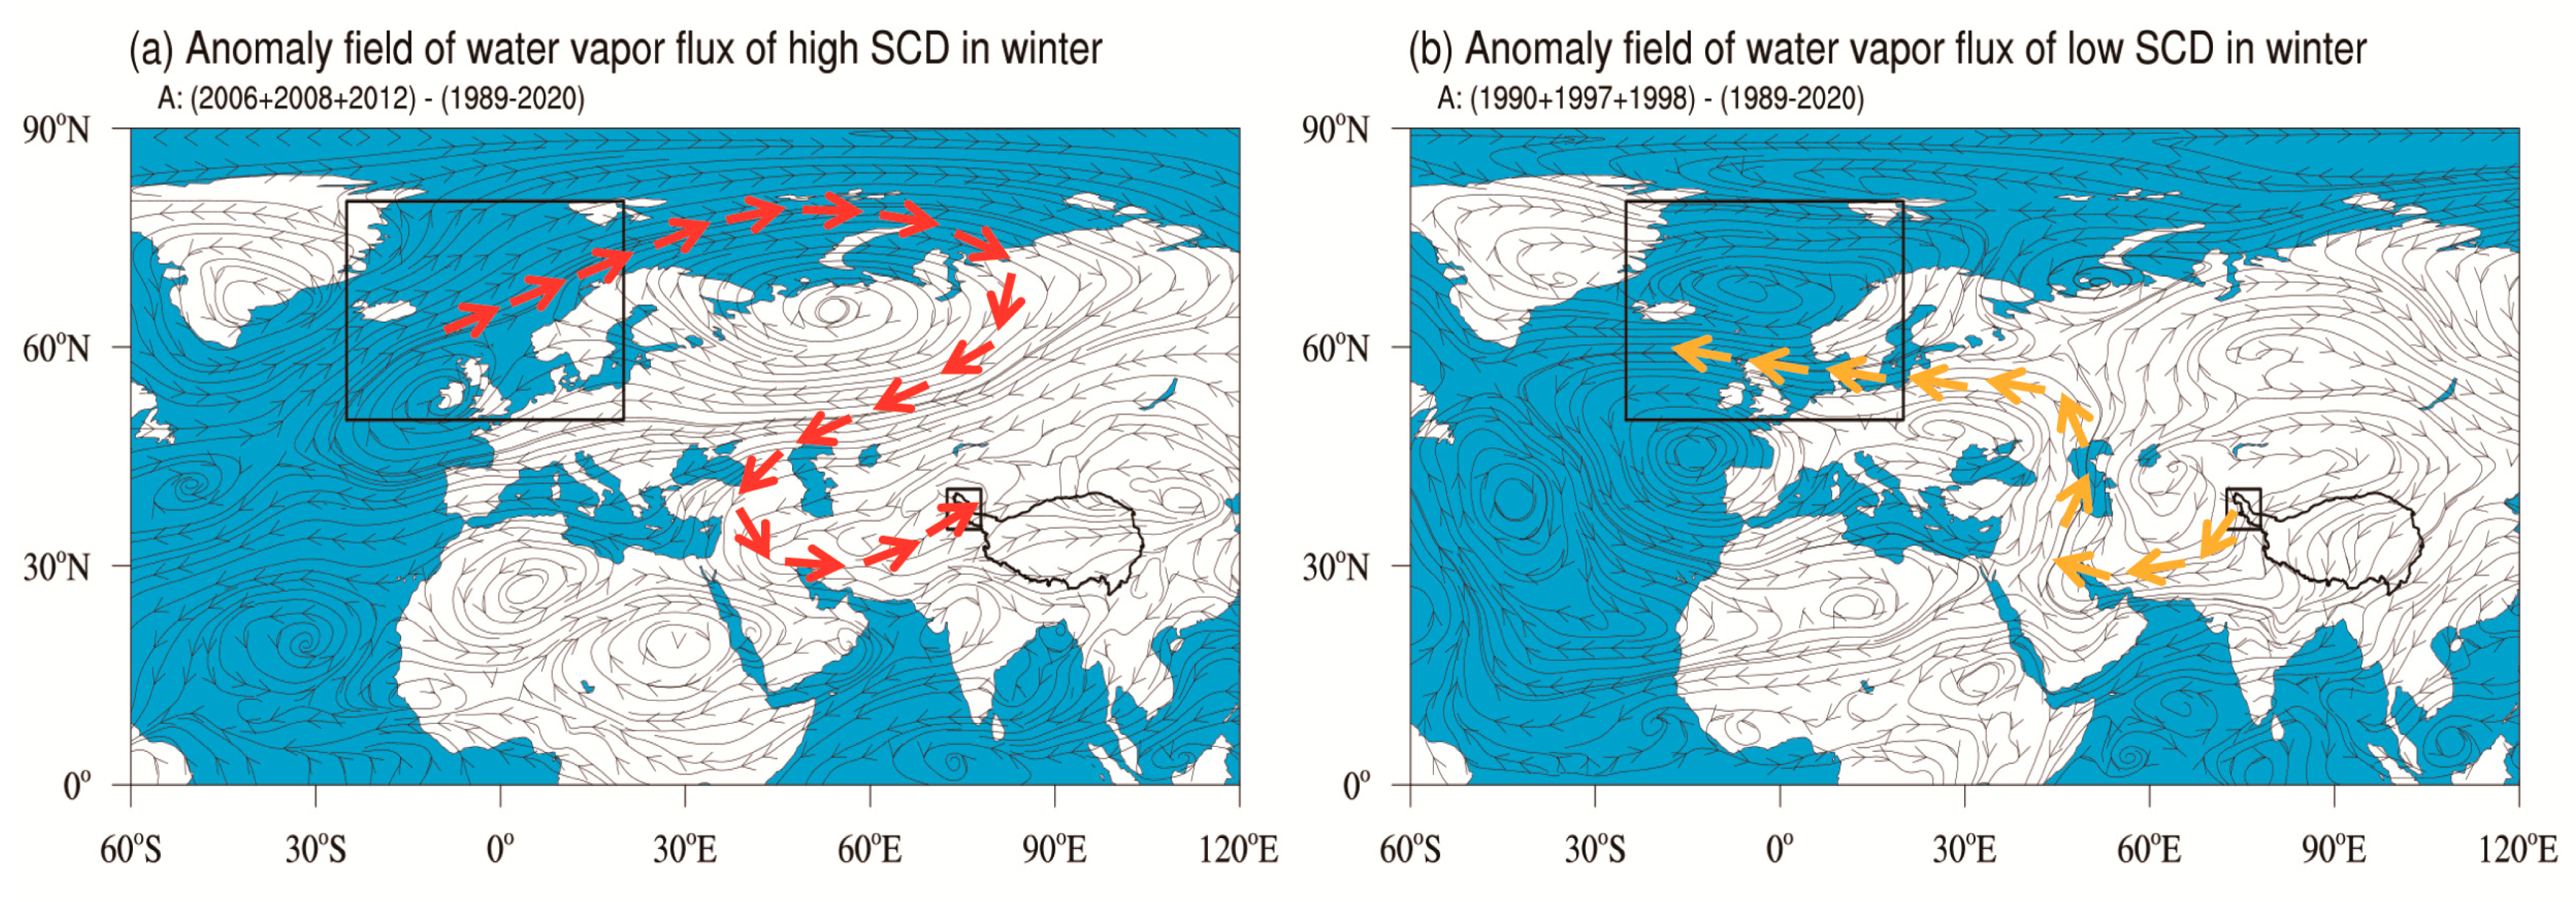
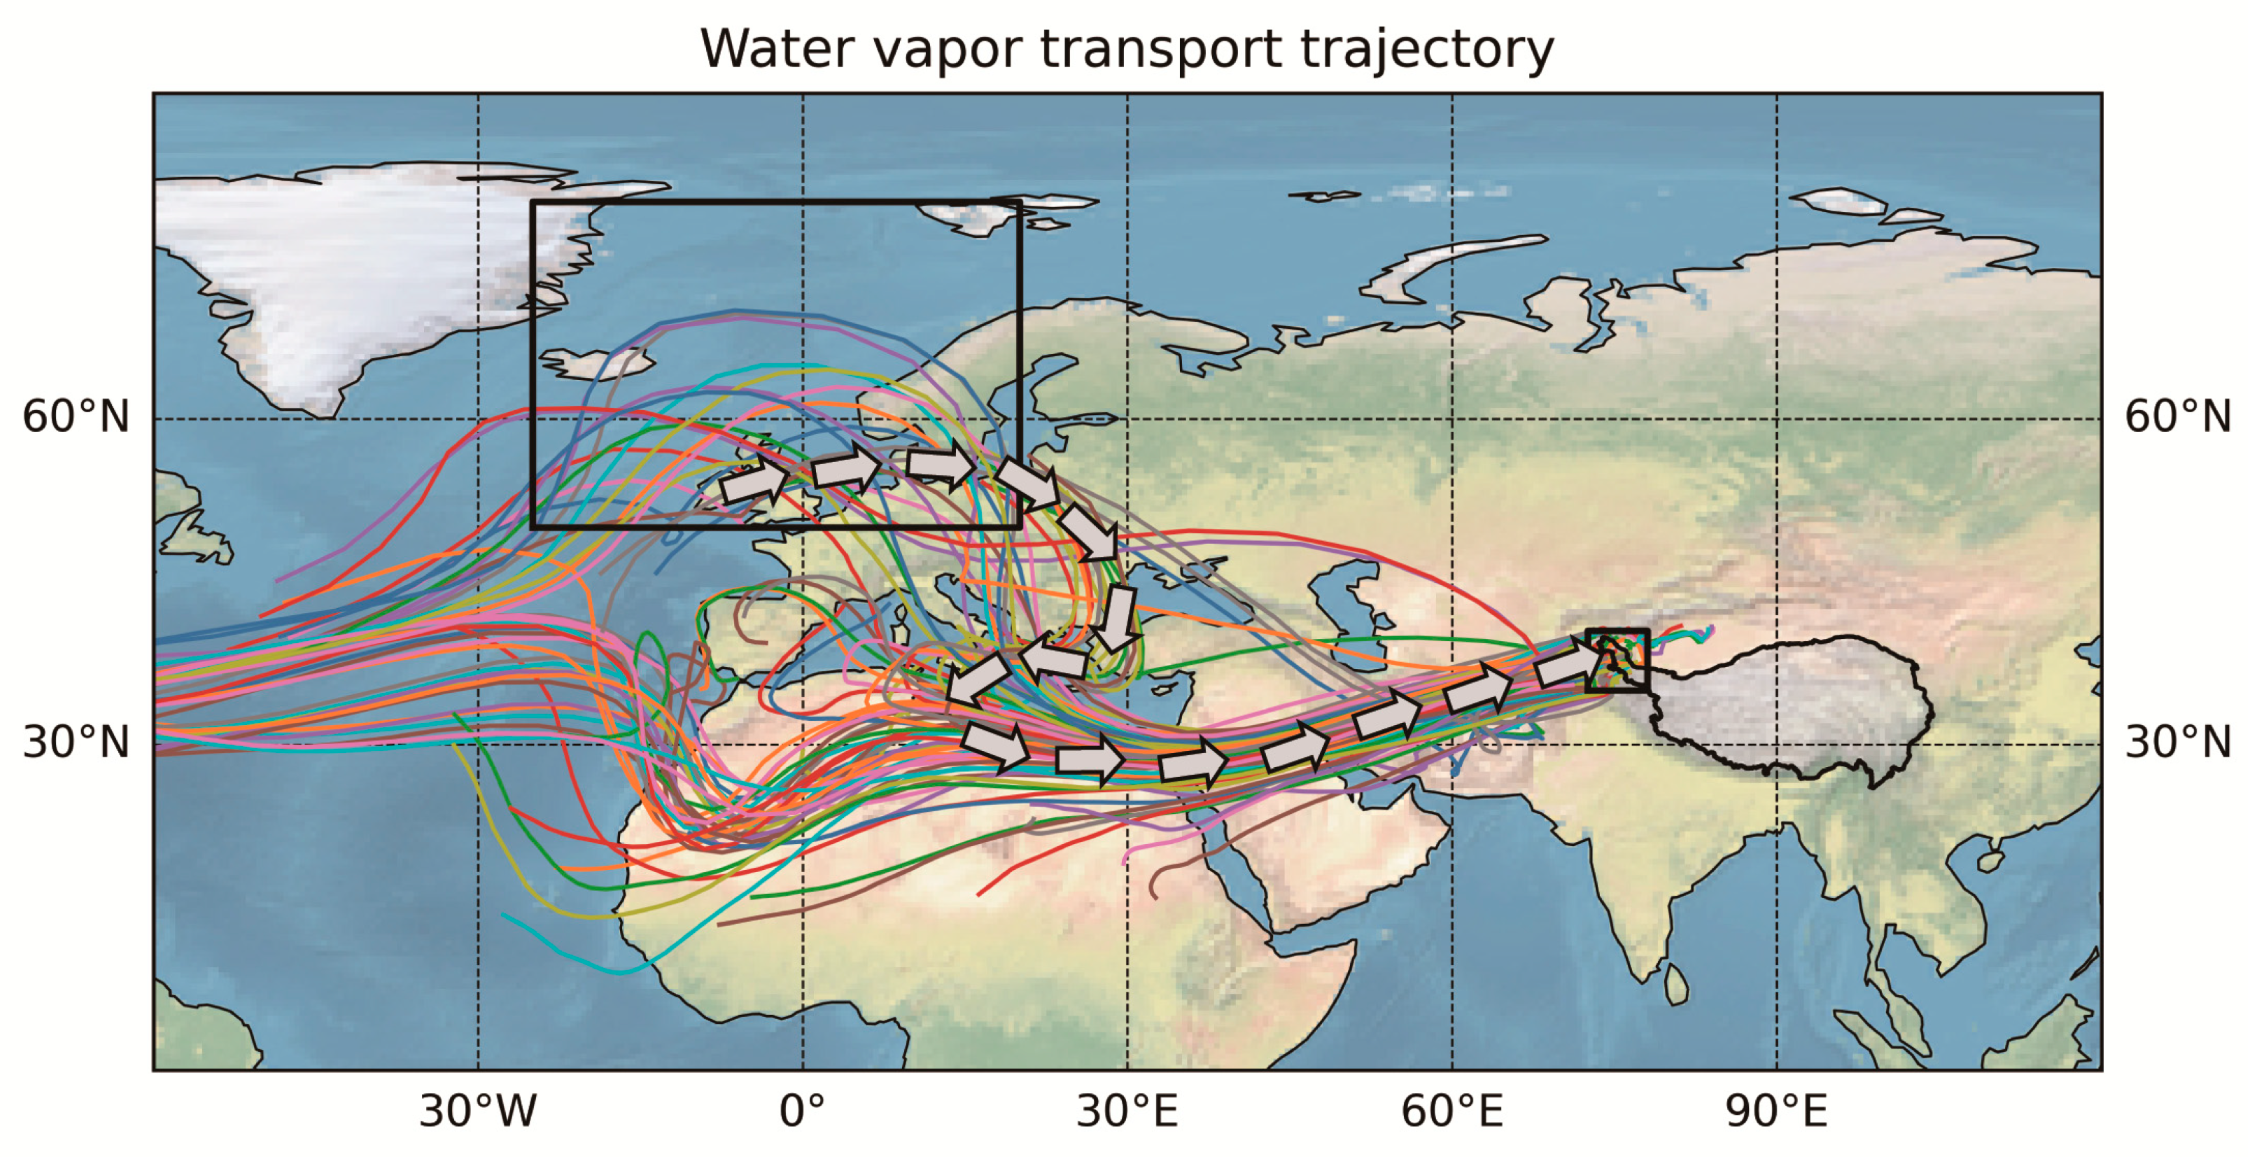
The correlation vector, the anomaly fields of water vapor transport in high SCD years, and the FLEXPART model simulation all confirm that the northern North Atlantic Ocean is one of the main water vapor sources. The water vapor caused by SST warming flows out of the northern North Atlantic Ocean and then travels to the KMPP through the Iranian Plateau. Atlantic SST warming has enhanced moisture transport, increasing precipitation and SCD in winter on the KMPP. This indicates that the warming of high-latitude SST in the North Atlantic plays an important role in regulating regional differences in TP snow changes. However, this study only focuses on the impact of water vapor transport from North Atlantic SST warming on SCD increase on the KMPP, and an in-depth dynamic analysis is needed in the future.
The KMPP, as the source of the Tarim, Indus, and Amu Darya rivers, exhibits an increase in snow days, indicating rising solid water reserves. This supports the trend of uneven water resource changes across the plateau due to climate change. It can also help explain the previously observed “Western Kunlun Mountains Oddity” phenomenon. The findings presented in this paper deepen our understanding of regional climate, hydrological, and environmental changes while also supporting more efficient and integrated water resource management in the KMPP and its surrounding areas. Future research could delve into the long-term impacts of climate change on regional water resources and the development of adaptive strategies for water management in the KMPP region.

Author Contributions

Conceptualization, X.X. (Xiangde Xu) and X.X. (Xiaoying Xue); methodology, X.X. (Xiangde Xu); software, P.Z.; validation, G.R., X.S. and P.Z.; formal analysis, X.X. (Xiaoying Xue); investigation, X.X. (Xiaoying Xue); resources, X.X. (Xiangde Xu); data curation, X.X. (Xiangde Xu); writing—original draft preparation, X.X. (Xiaoying Xue); writing—review and editing, X.X. (Xiaoying Xue); visualization, X.X. (Xiaoying Xue); supervision, X.X. (Xiangde Xu); project administration, X.X. (Xiangde Xu); funding acquisition, X.X. (Xiangde Xu). All authors have read and agreed to the published version of the manuscript.

Funding

This research is financially supported by the Second Tibetan Plateau Scientific Expedition and Research (STEP) program (2019QZKK0105), the Natural Science Foundation of China (42305047), the Natural Science Foundation of China (42005036), and the development fund of South China Sea Institute of Oceanology of the Chinese Academy of Sciences (SCSIO202203 and SCSIO202208), the Major Science and Technology Project of the Xizang Autonomous Region (XZ202402ZD0006).

Data Availability Statement

ERA5 reanalysis data are from the European Center for Medium Weather Forecasting (https://cds.climate.copernicus.eu/#!/search?text=ERA5&type=dataset) (accessed on 25 July 2024). The GPCP and the GHCN_CAMS Gridded 2 m temperature (land) data are from the National Oceanic and Atmospheric Administration (https://psl.noaa.gov/data/gridded/) (accessed on 25 July 2024). Fnl reanalysis data (https://rda.ucar.edu/datasets/ds083.2/index.html#!cgi-bin/datasets/getWebList?dsnum=083.2&gindex=2) (accessed on 25 July 2024). For access to the remote sensing snow cover day data after an optimized variational processing method, ERA5 temperature/precipitation data after a variational processing method, and the station observation data, the corresponding author can be contacted if necessary. The FLEXPART model is publicly available (https://www.flexpart.eu/) (accessed on 25 July 2024).

Conflicts of Interest

The authors declare no conflicts of interest.

References

  1. Li, P.; Mi, D. Distribution of snow cover in China. J. Glaciol. Geocryol. 1983, 4, 9–18. (In Chinese) [Google Scholar]
  2. Bamzai, A.S. Relationship between snow cover variability and Arctic oscillation index on a hierarchy of time scales. Int. J. Climatol. 2003, 23, 131–142. [Google Scholar] [CrossRef]
  3. Wang, C.; Wang, Z.; Cui, Y. Snow cover of China during the last 40 years: Spatial distribution and interannual variation. J. Glaciol. Geocryol. 2009, 31, 301–310. (In Chinese) [Google Scholar]
  4. Barnett, T.P.; Dümenil, L.; Schlese, U.; Roeckner, E.; Latif, M. The effect of Eurasian snow cover on regional and global climate variations. J. Atmos. Sci. 1989, 46, 661–686. [Google Scholar] [CrossRef]
  5. Brown, R.D.; Mote, P.W. The response of Northern Hemisphere snow cover to a changing climate. J. Clim. 2009, 22, 2124–2145. [Google Scholar] [CrossRef]
  6. Yang, M.X.; Wang, X.J.; Pang, G.J.; Wan, G.N.; Liu, Z.C. The Tibetan Plateau cryosphere: Observations and model simulations for current status and recent changes. Earth-Sci. Rev. 2019, 190, 353–369. [Google Scholar] [CrossRef]
  7. Huang, X.; Ma, Y.; Li, Y.; Yang, X. Spatiotemporal variation of snow cover over the Tibetan Plateau from 1980 to 2020. J. Glaciol. Geocryol. 2023, 45, 423–434. (In Chinese) [Google Scholar]
  8. Aichner, B.; Makhmudov, Z.; Rajabov, I.; Zhang, Q.; Pausata, F.S.; Werner, M.; Heinecke, L.; Kuessner, M.L.; Feakins, S.J.; Sachse, D.; et al. Hydroclimate in the Pamirs was driven by changes in precipitation-evaporation seasonality since the last glacial period. Geophys. Res. Lett. 2019, 46, 23. [Google Scholar] [CrossRef]
  9. Xu, X.; Zhao, T.; Lu, C.; Guo, Y.; Chen, B.; Liu, R.; Li, Y.; Shi, X. An important mechanism sustaining the atmospheric “water tower” over the Tibetan Plateau. Atmos. Chem. Phys. 2014, 14, 11287–11295. [Google Scholar] [CrossRef]
  10. Cohen, J.; Rind, D. The effect of snow cover on the climate. J. Clim. 1991, 4, 689–706. [Google Scholar] [CrossRef]
  11. Qian, Q.F.; Jia, X.J.; Wu, R.G. On the interdecadal change in the interannual variation in autumn snow cover over the central eastern Tibetan Plateau in the mid-1990s. J. Geophys. Res. 2020, 125, e2020JD032685. [Google Scholar] [CrossRef]
  12. Pu, Z.; Xu, X.L.; Salomonson, V.V. MODIS/Terra observed seasonal variations of snow cover over the Tibetan Plateau. Geophys. Res. Lett. 2007, 34, 137–161. [Google Scholar] [CrossRef]
  13. Li, W.; Guo, W.; Qiu, B.; Xue, Y.; Hsu, P.C.; Wei, J. Influence of Tibetan Plateau snow cover on East Asian atmospheric circulation at medium-range time scales. Nat. Commun. 2018, 9, 4243. [Google Scholar] [CrossRef] [PubMed]
  14. Wang, C.H.; Yang, K.; Li, Y.L.; Wu, D.; Bo, Y. Impacts of spatiotemporal anomalies of Tibetan Plateau snow cover on summer precipitation in eastern China. J. Clim. 2017, 30, 885–903. [Google Scholar] [CrossRef]
  15. Li, R.; Zhao, L.; Ding, Y.; Wu, T.; Xiao, Y.; Du, E.; Liu, G.; Qiao, Y. Temporal and spatial variations of the active layer along the Qinghai-Tibet Highway in a permafrost region. Chin. Sci. Bull. 2012, 57, 4609–4616. [Google Scholar] [CrossRef]
  16. Wu, G.; He, B.; Duan, A.; Liu, Y.; Yu, W. Formation and variation of the atmospheric heat source over the Tibetan Plateau and its climate effects. Adv. Atmos. Sci. 2017, 34, 1169–1184. [Google Scholar] [CrossRef]
  17. Xue, X.; Xu, X.; Zhao, R.; Cai, W. An Optimized Variational Processing Method Based on Satellite-Station Data on Snow Cover Days on the Qinghai–Tibet Plateau. Remote Sens. 2024, 16, 1427. [Google Scholar] [CrossRef]
  18. Deng, H.J.; Pepin, N.C.; Chen, Y.N. Changes of snow-fall under warming in the Tibetan Plateau. J. Geophys. Res. 2017, 122, 7323–7341. [Google Scholar] [CrossRef]
  19. Li, S.X.; Sato, T.; Nakamura, T.; Liu, X.Y.; Guo, W.K. Controlling factors of historical variation of winter Tibetan Plateau snow cover revealed by large-ensemble experiments. J. Geophys. Res. 2021, 126, e2021JD035127. [Google Scholar] [CrossRef]
  20. Chen, X.; An, S.; Inouye, D.W.; Schwartz, M.D. Temperature and snowfall trigger alpine vegetation green-up on the world’s roof. Glob. Change Biol. 2015, 21, 3635–3646. [Google Scholar] [CrossRef]
  21. Xiong, C.; Shi, J.; Cui, Y.; Peng, B. Snowmelt pattern over high-mountain asia detected from active and passive microwave remote sensing. IEEE Geosci. Remote Sens. Lett. 2017, 14, 1096–1100. [Google Scholar] [CrossRef]
  22. Mao, F.; Tang, S.H.; Sun, H.; Zhang, J.H. A study of dynamic change of dry and wet climate regions in the Tibetan Plateau over the last 46 years. Chin. J. Atmos. Sci. 2008, 32, 499–507. (In Chinese) [Google Scholar]
  23. Dong, N.; Xu, X.D.; Cai, W.Y.; Zhao, T.L.; Sun, C. Comprehensive effects of interdecadal change of sea surface temperature increase in the Indo-Pacific Ocean on the warming-wetting of the Qinghai−Tibet Plateau. Sci. Rep. 2022, 12, 22306. [Google Scholar] [CrossRef] [PubMed]
  24. Guo, H. Snow Phenology and Its Response to Climate in Northeastern China; Lanzhou University: Lanzhou, China, 2021. (In Chinese) [Google Scholar]
  25. Shaman, J.; Tziperman, E. The effect of ENSO on Tibetan Plateau snow depth: A stationary wave teleconnection mechanism and implications for the South Asian monsoons. J. Clim. 2005, 18, 2067–2079. [Google Scholar] [CrossRef]
  26. Wang, Z.B.; Wu, R.G.; Yang, S.; Lu, M.M. An interdecadal change in the influence of ENSO on the spring Tibetan Plateau snow-cover variability in the early 2000s. J. Clim. 2022, 35, 725–743. [Google Scholar] [CrossRef]
  27. Yuan, C.X.; Tozuka, T.; Miyasaka, T.; Yamagata, T. Respective influences of IOD and ENSO on the Tibetan snow cover in early winter. Clim. Dyn. 2009, 33, 509–520. [Google Scholar] [CrossRef]
  28. Yuan, C.X.; Tozuka, T.; Yamagata, T. IOD influence on the early winter Tibetan Plateau snow cover: Diagnostic analyses and an AGCM simulation. Clim. Dyn. 2012, 39, 1643–1660. [Google Scholar] [CrossRef]
  29. Ye, K.H.; Wu, R.G.; Liu, Y. Interdecadal change of Eurasian snow, surface temperature, and atmospheric circulation in the late 1980s. J. Geophys. Res. 2015, 120, 2738–2753. [Google Scholar] [CrossRef]
  30. Wang, Z.B.; Wu, R.G.; Zhao, P.; Yao, S.-L.; Jia, X.J. Formation of snow cover anomalies over the Tibetan Plateau in cold seasons. J. Geophys. Res. 2019, 124, 4873–4890. [Google Scholar] [CrossRef]
  31. Wu, J.J.; Wu, Z.W. Inter-decadal change of the spring North Atlantic Oscillation impact on the summer Pamir-Tienshan snow cover. Int. J. Climatol. 2018, 39, 629–642. [Google Scholar] [CrossRef]
  32. Yang, J.L. Analyses of atmospheric circulation of tropical Indian Ocean Basin mode influencing precipitation in East of Northwest China. Plateau Meteorol. 2015, 34, 700–705. (In Chinese) [Google Scholar]
  33. Ren, Q.; Zhou, C.Y.; He, J.H.; Cen, S.X.; Deng, M.Y. Impact of preceding Indian Ocean Sea surface temperature anomaly on water vapor content over the Tibetan Plateau moist pool in summer and its possible reason. Chin. J. Atmos. Sci. 2017, 41, 648–658. [Google Scholar] [CrossRef]
  34. Tang, J.; Guo, X.L.; Chang, Y.; Lu, G.X.; Qi, P. Temporospatial distribution and trends of thunderstorm, hail, gale, and heavy precipitation events over the Tibetan Plateau and associated mechanisms. J. Clim. 2021, 34, 9623–9646. [Google Scholar] [CrossRef]
  35. Li, L.; Zhang, R.H.; Wen, M.; Lv, J.M. Regionally different precipitation trends over the Tibetan Plateau in the warming context: A perspective of the Tibetan Plateau vortices. J. Geophys. Res. 2021, 48, 1680. [Google Scholar] [CrossRef]
  36. Braganza, K.; Karoly, D.J.; Hirst, A.C.; Stott, P.; Stouffer, R.J.; Tett, S.F.B. Simple indices of global climate variability and change Part II: Attribution of climate change during the twentieth century. Clim. Dyn. 2004, 22, 823–838. [Google Scholar] [CrossRef]
  37. Kamae, Y.; Watanabe, M.; Kimoto, M.; Shiogama, H. Summertime land–sea thermal contrast and atmospheric circulation over East Asia in a warming climate—Part I: Pastchanges and future projections. Clim. Dyn. 2014, 43, 2553–2568. [Google Scholar] [CrossRef]
  38. Xu, X.D.; Ma, Y.M.; Sun, C.; Wei, F.Y. Effect of energy and water circulation over Tibetan Plateau. Bull. Chin. Acad. Sci. 2019, 34, 1293–1305. [Google Scholar] [CrossRef]
  39. Yuan, J.C.; Li, W.H.; Deng, Y. Amplified subtropical stationary waves in boreal summer and their implications for regional water extremes. Environ. Res. Lett. 2015, 10, 104009. [Google Scholar] [CrossRef]
  40. Che, T.; Li, X.; Jin, R.; Armstrong, R.; Zhang, T. Snow depth derived from passive microwave remote-sensing data in China. Ann. Glaciol. 2017, 49, 145–154. [Google Scholar] [CrossRef]
  41. Dai, L.; Che, T.; Ding, Y.; Hao, X. Evaluation of snow cover and snow depth on the Qinghai–Tibetan Plateau derived from passive microwave remote sensing. Cryosphere 2017, 11, 1933–1948. [Google Scholar] [CrossRef]
  42. Qin, D.H.; Liu, S.Y.; Li, P.J. Snow cover distribution, variability, and response to climate change in western China. J. Clim. 2006, 19, 1820–1833. [Google Scholar]
  43. You, Q.L.; Kang, S.C.; Ren, G.Y.; Fraedrich, K.; Pepin, N.; Yan, Y.P.; Ma, L.J. Observed changes in snow depth and number of snow days in the eastern and central Tibetan Plateau. Clim. Res. 2011, 46, 171–183. [Google Scholar] [CrossRef]
  44. You, Q.L.; Wu, T.; Shen, L.C.; Pepin, N.; Zhang, L.; Jiang, Z.H.; Wu, Z.W.; Kang, S.C.; Aghakouchak, A. Review of snow cover variation over the Tibetan Plateau and its influence on the broad climate system. Earth-Sci. Rev. 2020, 201, 103043. [Google Scholar] [CrossRef]
  45. Xiao, C.D.; Qin, D.H.; Yao, T.D.; Ding, Y.J.; Liu, S.Y.; Zhao, L.; Liu, Y.J. Progress on observation of cryospheric components and climate-related studies in China. Adv. Atmos. Sci. 2008, 25, 164–180. [Google Scholar] [CrossRef]
  46. Huang, D.N.; Zhang, Z.; Zhang, S.S.; Xue, N.T. Characteristics of glacier movement in the eastern Pamir Plateau. Arid Land Geography 2021, 44, 1. (In Chinese) [Google Scholar]
  47. Sodemann, H.; Schwierz, C.; Wernli, H. Interannual variability of Greenland winter precipitation sources: Lagrangian moisture diagnostic and North Atlantic Oscillation influence. J. Geophys. Res. Atmos. 2008, 113, 8503. [Google Scholar] [CrossRef]
  48. Chen, B.; Xu, X.D.; Shi, X.H. Estimating the water vapor transport pathways and associated sources of water vapor for the extreme rainfall event over east of China in July 2007 using the Lagrangian method. Acta Meteorol. Sin. 2011, 69, 810–818. (In Chinese) [Google Scholar]
  49. Zhu, L.; Liu, R.; Wang, X.; Wang, Z.L.; Wen, J.; Zhao, Y.; Xie, Y.; Zhang, T.T. The characteristics of the water vapor transport and associated sources under abnormal precipitation conditions in the source region of the Yellow River using FLEXPART. Plateau Meteorol. 2019, 38, 484–496. (In Chinese) [Google Scholar]
  50. Zhang, X.; Vincent, L.A.; Hogg, W.D.; Niitsoo, A. Temperature and precipitation trends in Canada during the 20th century. Atmos.-Ocean 2000, 38, 395–429. [Google Scholar] [CrossRef]
  51. Sen, P.K. Estimates of the regression coefficient based on Kendall’s tau. J. Am. Stat. Assoc. 1968, 63, 1379–1389. [Google Scholar] [CrossRef]
  52. Jassby, A.D.; Cloern, J.E. Some Tools for Exploring Water Quality Monitoring Data. R Package Version 1.0.0. Available online: https://cran.r-project.org/package=wq (accessed on 15 July 2023).
  53. Luke, C.; Tyler, S.; Michael, P.B.; John, F.S.; Yeong, B.S.; Lewis, A.O.; Andrew, B.; Ulrich, K. Expanded and recently increased glacier surging in the Karakoram. Arct. Antarct. Alp. Res. 2011, 43, 503–516. [Google Scholar] [CrossRef]
  54. Hewitt, K. The Karakoram anomaly? Glacier expansion and the elevation effect, Karakoram Himalaya. Mt. Res. Dev. 2005, 25, 332–340. [Google Scholar] [CrossRef]
  55. Wang, N.L.; Yao, T.D.; Xu, B.Q.; Chen, A.A.; Wang, W.C. Spatiotemporal pattern, trend, and influence of glacier change in Tibetan Plateau and surroundings under global warming. China Acad. J. Electron. Publ. House 2019, 34, 1220–1232. [Google Scholar] [CrossRef]
  56. Gardelle, J.; Berthier, E.; Arnaud, Y. Slight mass gain of Karakoram glaciers in the early twenty-first century. Nat. Geosci. 2012, 5, 322–325. [Google Scholar] [CrossRef]
  57. Zhang, C.; Tang, Q.H.; Chen, D.L. Recent changes in the moisture source of precipitation over the Tibetan Plateau. J. Clim. 2017, 30, 1807–1819. [Google Scholar] [CrossRef]
  58. Liu, F.C.; Jia, X.J.; Dong, W. Changes in spring snow cover over the Eastern and Western Tibetan Plateau and their associated mechanism. Adv. Atmos. Sci. 2024, 41, 959–973. [Google Scholar] [CrossRef]
  59. Trenberth, K.E.; Guillemot, C.J. Evaluation of the atmospheric moisture and hydrological cycle in the NCEP/NCAR reanalyses. Clim. Dyn. 1998, 14, 213–231. [Google Scholar] [CrossRef]
  60. Wang, W.; Huang, X.D.; Deng, J.; Xie, H.J.; Liang, T.G. Spatio-temporal change of snow cover and its response to climate over the Tibetan Plateau based on an improved daily cloud-free snow cover product. Remote Sens. 2015, 7, 169–194. [Google Scholar] [CrossRef]
  61. Yao, T.; Bolch, T.; Chen, D.; Gao, J.; Immerzeel, W.; Piao, S.; Su, F.; Thompson, L.; Wada, Y.; Wang, L.; et al. The imbalance of the Asian water tower. Nat. Rev. Earth Environ. 2022, 3, 618–632. [Google Scholar] [CrossRef]
  62. Walter, W.I.; Ludovicus, P.H.V.; Marc, F.P.B. Climate change will affect the Asian Water Towers. Science 2010, 328, 1382. [Google Scholar] [CrossRef]
Figure 1. The locations of the western Kunlun Mountains and eastern Pamir Plateau (KMPP) and the Tibetan Plateau (TP), and the distribution of the observation stations. The black curve represents the boundary of the TP, based on the recommendation from the Second Tibetan Plateau Scientific Expedition and Research (STEP) program. The red box represents the KMPP. The red and black triangles represent station observations on the KMPP and TP. The blue curves represent rivers.
Remotesensing 16 04368 g001
Figure 2. The flowchart of this paper. Green rectangles present data, blue rectangles present research contents, orange rectangles present research methods, and red rectangles present conclusion.
Remotesensing 16 04368 g002
Figure 3. The spatial distribution (a) and the trend characteristics (b) of winter SCD, and the region-averaged yearly time series and trends of the winter SCD, on the KMPP (c) and TP (d) from 1989 to 2020. (c,d) present the standardized series of the SCD in winter, with the black dashed line representing the regression line and the black solid line representing the three-point moving average line. In (a,b), the areas within the black curve represent the TP, and the KMPP is defined as the region 35–40.5°N, 72.5–78°E. Winter SCD on the KMPP increased at a rate of 4.75 days/decade (significant at the 0.01 level), while TP decreased at a rate of −1.50 days/decade (significant at the 0.1 level).
Remotesensing 16 04368 g003
Figure 4. The temperature trends ((a,c,e), units: °C/decade) and precipitation ((b,d,f), units: mm/decade) in winter from 1989 to 2020. (a,b) are based on the ERA5 reanalysis dataset, (c,d) are based on the GHCN and GPCP dataset, and (e,f) are based on station observation data. The areas with black dots indicate that the trends pass the 95% confidence significance test. Areas within the black curve represent the TP. Block areas indicate the KMPP.
Remotesensing 16 04368 g004
Figure 5. The trends of temperature (a) and precipitation (b) in winter from 1989 to 2020. * indicates that the trends pass the 95% confidence significance test. The temperature trends on the TP and KMPP are positive; the precipitation trends on the TP are negative while they are positive on the KMPP.
Remotesensing 16 04368 g005
Figure 6. The correlations between the temperature/precipitation and SCD (a), and the relative contributions of temperature/precipitation to SCD (b), in winter for the TP and the KMPP during 1989–2020. The red dots in (a) indicate positive correlations, blue dots indicate negative correlations, and * indicates that the trends pass the 95% confidence significance test. The larger dot represents the larger correlation. The columns in (b) indicate the relative contributions. The larger column presents the larger relative contributions.
Remotesensing 16 04368 g006
Figure 7. The trends of the SST ((a), unit: °C/decade) and its correlations with SCD on the KMPP (b) in winter from 1989 to 2020. The black dotted areas indicate trends/correlations that pass the 95% significance test, and the black boxed areas denote the northern North Atlantic Ocean. Areas within the red curves represent the TP. Red areas indicate the KMPP.
Remotesensing 16 04368 g007
Figure 8. The distribution of correlations between whole-layer water vapor flux and winter SCD on the KMPP (a): precipitation on the KMPP (b)/SST of the northern North Atlantic Ocean (c) from 1989 to 2020. The color shading represents the significance level of the correlation, with red indicating regions where the correlations pass a high (99%) level of a significance test. The yellow arrows represent the pathway of the water vapor transport from the northern North Atlantic Ocean to the KMPP. The black boxed areas denote the northern North Atlantic Ocean. Areas within the black curve represent the TP. The small boxed areas indicate the KMPP.
Remotesensing 16 04368 g008
Figure 9. Schematic diagrams of water vapor flux anomalies and transport in high (a) and low (b) years of SCD on the KMPP in winter during 1989–2020. The high SCD years are 2006, 2008, and 2012, and the low SCD years are 1990, 1997, and 1998. The reference period for calculating anomalies is 1989–2020. The black boxed areas denote the northern North Atlantic Ocean. Areas within the black curve represent the TP. The small boxed areas indicate the KMPP. The red and yellow arrows represent the pathway of the water vapor transport.
Remotesensing 16 04368 g009
Figure 10. The FLEXPART model simulation of the water vapor transport from the northern North Atlantic Ocean to the KMPP. The black curve represents the TP, and the large and small black squares represent the northern North Atlantic Ocean and the KMPP, respectively. One track is a simulated particle, and the colors represent the different particles. The gray arrows represent the water vapor transport pathways.
Remotesensing 16 04368 g010
Figure 11. The spatial distribution (a) and the trend characteristics (b) of winter SCD based on station observation SCD data, and the region-averaged yearly time series and trends of the winter SCD, on the KMPP (c) and TP (d) from 1989 to 2020. (c,d) present the standardized series of SCD in winter based on station observation SCD data (blue, Station SCD) and remote sensing SCD data after an optimized variation processing used in this study (black, SCD), with the dashed line representing the regression line. In (a,b), the areas within the black curve represent the TP, the black boxes represent the KMPP (defined as the region 35–40.5°N, 72.5–78°E), and red triangles represent station observations.
Remotesensing 16 04368 g011
Figure 12. The mechanism diagram for increased SCD on the KMPP compared to that on the TP.
Remotesensing 16 04368 g012
Table 1. The data used in this study.
Data TypesData NamesResolutionData Sources
SCD DataRemote sensing data0.1° × 0.1°Xue et al. [17]
Station observation data133 StationsNational Meteorological Information Center, China Meteorological Administration (NMIC, CMA)
TemperatureERA5 reanalysis data0.25° × 0.25°European Centre for Medium-Range Weather Forecasts (ECMWF)
Global Historical Climatology Network and the Climate Anomaly Monitoring System Gridded 2 m Temperature (Land) data (GHCN_CAMS)0.25° × 0.25°National Oceanic and Atmospheric Administration (NOAA)
Station observation data133 StationsNMIC, CMA
PrecipitationERA5 reanalysis data0.25° × 0.25°ECMWF
Global Precipitation Climatology Project data (GPCP)2.5° × 2.5°NOAA
Station observation data133 StationsNMIC, CMA
Sea surface temperature (SST)Hadley Centre Sea Ice and Sea Surface Temperature data (HadISST)1° × 1°Hadley Centre
Water vapor flux (u/v/q)ERA5 reanalysis data0.25° × 0.25°ECMWF
The FLEXPART modelOperational global analysis data1° × 1°US National Center for Environmental Prediction (NCEP)
Table 2. Summary of SCD changes on the TP.
RegionDatasetPeriodResultsReference
TPCloud-free SCD remote sensing data1980–2020TP decrease, Amu Darya basin increaseHuang et al. [7]
TPSnow cover fraction from MODIS2001–2014Slightly decreased by about 1.1%Li et al. [13]
TPMODIS daily snow products and the Interactive Multi-sensor Snow
and Ice Mapping System (IMS)
2000–2015No widespread declineWang et al. [14]
TPSnow cover fraction data of the Northern Hemisphere Snow Cover
Version 4.1
1966–2016Large interannual variations in cold seasonsWang et al. [30]
Eastern and central TP69 stations above 2000 m from CMA1961–2005Weakly positiveYou et al. [43]
TPNOAA Climate Data Record of SCD1985–2020Western TP decrease, eastern TP increaseLiu et al. [58]
TPSnow cover fraction from MODIS2003–2010Decrease since 2003Wang et al. [60]
TPRemote sensing SCD data1989–2020TP decrease, KMPP increaseThis study
Disclaimer/Publisher’s Note: The statements, opinions and data contained in all publications are solely those of the individual author(s) and contributor(s) and not of MDPI and/or the editor(s). MDPI and/or the editor(s) disclaim responsibility for any injury to people or property resulting from any ideas, methods, instructions or products referred to in the content.

