Technical Note

Dynamic Expansion and Merging of the Equatorial Ionization Anomaly During the 10–11 May 2024 Super Geomagnetic Storm

1
Haystack Observatory, Massachusetts Institute of Technology, Westford, MA 01886, USA
2
National Space Science Center, Chinese Academy of Sciences, Beijing 100190, China
*
Author to whom correspondence should be addressed.
Remote Sens. 2024, 16(22), 4290; https://doi.org/10.3390/rs16224290
Submission received: 24 October 2024 / Revised: 14 November 2024 / Accepted: 15 November 2024 / Published: 18 November 2024
(This article belongs to the Special Issue Ionosphere Monitoring with Remote Sensing (3rd Edition))

Abstract

:
This study investigates the responses of the equatorial and low-latitude ionosphere in the American–Atlantic longitude sector during the super geomagnetic storm that occurred on 10–11 May 2024. The investigation utilizes multi-instrument datasets, including ground-based observations (GNSS TEC, ionosonde, and Fabry–Perot interferometer) as well as space-borne satellite measurements (GOLD, Swarm, DMSP, and TIMED). Our findings reveal significant day-to-day variations in the storm-time equatorial ionization anomaly (EIA), summarized as follows: (1) During the main phase of the storm, the low- and mid-latitude ionosphere experienced a positive storm, with TEC drastically enhanced by 50–100% within a few hours. The EIA crests exhibited a substantial poleward expansion, reaching as high as ±35° MLAT. This expansion was caused by the enhanced fountain effect driven by penetration electric fields, along with increased ambipolar diffusion due to transient meridional wind surges. (2) During the recovery phase of the storm, the global ionosphere was characterized by a substantial negative storm with a 50–80% depletion in TEC. The EIA crests were notably suppressed and merged into a single equatorial band, which can be attributed to the composition change effect and the influence of disturbance dynamo electric fields. These results illustrate the complex processes of magnetosphere–ionosphere–thermosphere coupling during a superstorm, highlighting the significant impacts of space weather on the global ionosphere.

1. Introduction

The storm-time equatorial and low-latitude ionosphere is a highly complex region that can exhibit significant large-scale density gradient structures, subject to considerable energy and momentum injections and various electrodynamic/dynamic processes. One of the most notable density gradient features in this region is the equatorial ionization anomaly (EIA), which is characterized by double plasma density peaks at around ±15° geomagnetic latitudes (MLAT) and an equatorial density trough in between them [1]. The formation of the EIA is commonly explained through the plasma uplift in the equatorial ionosphere, along with the subsequent ambipolar diffusion driven by gravitational and pressure gradients [2,3]. During geomagnetic storms, the morphology and intensity of EIA crests can exhibit complex short-term (hours to a day) spatial-temporal variability due to the intertwined impact of electric field perturbations, modified neutral winds, and variations in thermospheric composition. This can be summarized as follows: (1) Electrodynamic effect. The prompt penetration electric field (PPEF), resulting from rapidly changing magnetospheric convection, typically has an eastward polarity between the daytime and dusk hours [4,5]. This can induce substantial upward E × B drift and strong ambipolar diffusion in the dayside equatorial and low-latitude ionosphere. Such a “super-fountain” effect can strongly broaden and intensify the EIA crests while deepening the equatorial trough (e.g., [2,6,7,8,9,10]). On the other hand, the disturbance dynamo electric field (DDEF) usually builds up during the storm recovery phase due to changes in the neutral wind patterns, which tend to have a westward polarity in the daytime but an eastward polarity in the nighttime [11]. This can lead to a negative storm effect in the daytime by reducing or even reversing the upward vertical drifts, thereby suppressing the EIA intensity [12,13,14,15]. (2) Neutral dynamic effect. The equator-ward wind surge due to enhanced Joule heating pushes plasma along magnetic field lines to higher altitudes through neutral drag. This reduces the downward plasma diffusion and raises ionospheric heights, slowing chemical loss and facilitating positive ionospheric storm effects that strengthen the EIA intensity [16,17]. (3) Composition change effect. The O/N2 ratio decreases at high and mid-latitudes due to atmospheric upwelling but increases at lower latitudes due to atmospheric downwelling equator-ward of the composition depletion zone. This composition change can alter the ionospheric F-region electron density by modifying the chemical loss rate [18,19,20]. However, the composition change effect is generally less significant during the early stages of a geomagnetic storm, as the ionosphere has been elevated to higher altitudes by the electrodynamic effect of PPEF and the mechanical effect of neutral winds. During the recovery phase of a storm, the composition change effect becomes more dominant, contributing to negative ionospheric storms and altering the EIA morphology [2,15].
The morphology of the EIA usually experiences the most dramatic variations during the dusk hours around the local sunset. During this period, rapid changes in zonal winds and large Cowling conductivities lead to significant enhancements in eastward electric fields and vertical plasma drifts in the equatorial ionosphere, a phenomenon known as pre-reversal enhancement (PRE) [21,22]. The superposition of PPEF and PRE during the early stages of a geomagnetic storm can substantially amplify upward E × B drift and ambipolar diffusion, thereby resulting in considerable poleward expansion of the EIA crests. For instance, during a strong geomagnetic storm on 23 April 2023, the EIA crests in the dusk sector shifted to ±25° MLAT [23,24]. Moreover, during intense geomagnetic storms on 29–30 October and 20–21 November 2003, the EIA crests exhibited significant poleward expansions and reached ±30° MLAT [8,9,25].
In contrast to the aforementioned poleward expansion, the double crests of the EIA can sometimes merge into a single peak over the geomagnetic equator. This phenomenon was initially captured by a far ultraviolet camera during the Apollo 16 lunar mission [26]. Follow-up studies have shown that the merging of EIA crests can be occasionally observed during strong volcanic eruption events [27], during geomagnetically quiet times [28,29], or under geomagnetically disturbed conditions [30]. In particular, some recent studies observed that double crests of the EIA temporarily merged into a distinct equatorial band during the storm on 3–4 November 2021 [31] and the storm on 13–14 March 2022 [12]. It is known that the variation of storm-time EIA can be quite dynamic under the impact of disturbed electric fields, modified neutral winds, and changes in thermospheric composition. Thus, the merging of EIA crests is collectively explained by a combination of the electrodynamic effect with downward equatorial plasma drift [27,28,31], plasma convergence due to equator-ward neutral winds [32], and an increase in the low-latitude O/N2 ratio [15]. However, the relative importance of these factors can vary in different cases, which remains a topic of debate within the research community.
As solar activity approaches its maximum in Solar Cycle 25, it is of great importance to monitor the equatorial and low-latitude ionospheric responses during recent storm events to investigate dynamic variations of the EIA for a better understanding of its characteristics and mechanisms. Recently, a super geomagnetic storm occurred on 10–11 May 2024, which was the strongest geomagnetic storm in the past two decades [33]. To date, some prompt studies have demonstrated initial results about the ionospheric variations, such as significant mid-latitude plasma density peaks [34], intense auroral breakup and westward surge [35], strong plasma uplifting and sporadic E-layers in the subauroral ionosphere [36], considerable changes in thermospheric composition and temperature [37], and pronounced negative ionospheric storm in the European region [38]. In this study, we analyze the dynamic day-to-day variation of EIA crests in the American–Atlantic longitude sector, utilizing global navigation satellite systems (GNSS) total electron content (TEC) data, Fabry–Perot interferometer (FPI) neutral winds observations, ionosonde measurements, remote sensing measurements from the global-scale observations of the limb and disk (GOLD) mission, and in situ observations from the swarm and defense meteorological satellite program (DMSP) satellites, as well as global ultraviolet imager (GUVI) O/N2 measurements from the TIMED satellite. These ground-based and space-borne observations collectively reveal that the EIA crests experienced significant storm-time variations, which exhibited a distinct poleward expansion during the main phase of the storm but merged into a single equatorial band during the recovery phase of the storm.

2. Instruments and Data Sets

Ground-based GNSS TEC is routinely calculated utilizing over 5000 receivers worldwide at the Massachusetts Institute of Technology’s Haystack Observatory, and the gridded TEC data is made available to the community with a spatial-temporal resolution of 1° (longitude) by 1° (latitude) and 5 min [39,40]. In addition to the ground-based GNSS TEC data, this study also incorporates satellite measurements from the following four missions: GOLD, Swarm, DMSP, and TIMED. The GOLD instrument is an ultraviolet imager with two identical spectrographs, located in geostationary orbit at 47.5°W, which measures Earth’s airglow emissions in the far ultraviolet wavelength range of 132–162 nm across the West African to South American longitude sectors [41,42]. This study uses the nighttime disk measurements of the oxygen-I 135.6 nm emission, which primarily results from the recombination of oxygen ions and electrons, making it a representative indicator of F-region peak plasma density. These measurements are widely used to examine the spatial-temporal variation of the equatorial and low-latitude ionospheric dynamics during the early evening hours (e.g., [24,27,28,42,43]). Moreover, in situ measurements of electron density from the polar-orbiting Swarm A satellites, at an altitude of ∼460 km, are used in this study. In addition, we use the plasma density and cross-track drift measurements from DMSP F17 and F18 satellites, at an altitude of ∼860 km, to examine the topside ionospheric response. Furthermore, the GUVI onboard the TIMED satellite provides thermospheric composition measurements along the satellite’s orbit, and a column density ratio of the O/N2 is used in this study for examining composition changes during the storm. In addition, this study also uses ionosonde observations at Ascension island (7.95°S, 14.4°W) and Cachoeira Paulista (22.7°S, 45.0°W) to investigate variations in ionospheric electron density profiles and F2 region peak height (hmF2). The ionospheric peak parameters were scaled by digisonde and then manually calibrated. Furthermore, measurements from the Fabry–Perot interferometer (FPI) at Cachoeira Paulista (22.7°S, 45.0°W) are utilized to analyze responses of the thermospheric neutral winds.

3. Results

Figure 1 displays the temporal variation of the interplanetary magnetic field (IMF) and the solar wind velocity, density, and temperature, as well as the Dst and Kp indices during the period of 10–12 May 2024. Solar activity was at a high level, with the F10.7 index reaching 220–230 solar flux units (sfu; 1 sfu = 10 22 W/m2/Hz) among this period. Multiple coronal mass ejections (CMEs) associated with flare activity erupted from Active Region 3664, which began to hit Earth at ∼17:00 UT on 10 May and triggered severe geomagnetic disturbances over the following two days. Following the arrival of the first interplanetary shock, the solar wind speed rose to 700 km/s around 17:00 UT on 10 May. The IMF Bz became highly volatile after the arrival of the interplanetary shock, displaying several major southward dips. The first major dip in IMF Bz occurred between 19:00 and 22:30 UT on 10 May, reaching a minimum value of −43.4 nT at 22:12 UT. The second major dip occurred between 00:00 and 05:00 UT on 11 May, with a minimum value of −47.8 nT recorded at 00:36 UT. The initial phase of the storm started with asudden commencement at 17:07 UT on 10 May. After that, the storm entered into the main phase, during which the Dst index exhibited a dramatic decrease and reached a minimum value of −412 nT at 02:14 UT on 11 May. In addition, the Kp index peaked at nine, indicating the strongest level of geomagnetic storm activity. Collectively, these indices reveal that this storm event was the strongest geomagnetic storm in the past 20 years.
To provide a synoptic overview of the low-latitude and equatorial ionospheric variations during the main phase of the storm, Figure 2 displays four combined maps of GNSS TEC and GOLD nighttime OI 135.6 nm emission radiance over the American–Atlantic longitude sector, from 19:35 UT on 10 May to 00:10 UT on 11 May 2024. The orbits of the Swarm A satellite at around 460 km are overlapped on the maps, with corresponding electron density profiles shown in the right sub-panels. At 19:35 UT (Figure 2a), GNSS TEC indicates that the double crests of EIA were located at around ±15° MLAT, and the Swarm Ne profile displays that the latitudinal distance between two crests was 29°. At 21:10 UT (Figure 2b), the position of the EIA crests in the GNSS TEC map had moved modestly poleward by about 5°. Furthermore, the GOLD nighttime disk emission shows that the northern crest was positioned at around 20° MLAT. The Swarm Ne profile shows that the crest-to-crest distance increased to around 40°. At 22:40 UT (Figure 2c), the morphology of the EIA underwent striking changes in both the GNSS TEC and GOLD disk images: On the one hand, the equatorial ionosphere was characterized by a deep equatorial plasma depletion, [44] with the TEC magnitude therein being largely reduced by 50–80% compared to just three hours earlier; on the other hand, the EIA crests exhibited a pronounced intensification and poleward expansion, reaching up to ±25–30° MLAT. The corresponding Swarm Ne profile shows that the crest-to-crest distance increased to 60°. At 00:10 UT (Figure 2d), the combined GNSS TEC and GOLD nighttime disk image shows that the EIA crests evolved into a “V”-shaped structure due to further poleward expansion, with the crests’ edge reaching as high as ±35° MLAT at around 60°W. Notably, the relative locations of Ascension Island and Cachoeira Paulista, which were around −20° MLAT and initially situated at the poleward edge of the southern EIA crest at 19:35 UT (Figure 2a), shifted to the equator-ward edge of the EIA crest after 22:40 UT (Figure 2c,d) due to the dramatic expansion of the EIA crests. Such a substantial poleward expansion of EIA crests, accompanied by a deep equatorial trough, can be attributed to the super-fountain effect driven by strong PPEF, as the IMF Bz underwent continuous and significant southward dips ranging from −20 to −45 nT between 19:30 UT and 22:30 UT on 10 May 2024.
In addition, Figure 3 shows combined GNSS TEC maps and GOLD nighttime disk images at four times between 18:20 UT and 23:25 UT on 10 May, overlapped with the orbital paths of DMSP F17 and F18 satellites at the altitude of 860 km. The right sub-panels display the corresponding latitudinal profiles of ion density in the topside ionosphere along the DMSP F17 and F18 orbits. Through comparing Figure 3a–c, it can be seen that the mid-latitude ionosphere in the American sector experienced a strong positive storm phase, where the GNSS TEC showed a drastic enhancements of 50–100% in just 2–3 h. In particular, Figure 3c,d reveal the presence of a distinct storm-enhanced density (SED) plume around the west coast of North America, which manifested as a stream-like structure with elevated TEC values that elongated northwestward toward the dayside cusp. Moreover, GNSS TEC and DMSP in situ data in Figure 3c indicate that the poleward edge of the SED plume was adjacent to a substantial density drop-off in the subauroral ionosphere, signifying the mid-latitude ionospheric trough that had been pushed to as low as 45° MLAT associated with the storm-time convection expansion. In the meantime, the equatorial and low-latitude ionosphere was characterized by a pronounced super-fountain effect with a deep equatorial trough and dramatic poleward expansion of EIA crests. In the topside ionosphere at 860 km, the crest-to-crest latitudinal distance in the DMSP in situ ion density profile increased from 10 to 15° at 18:20 UT (Figure 3a) to approximately 40° at 23:25 UT (Figure 3d).
To further examine the day-to-day variation in EIA morphology and to showcase its temporal evolution during different phases of the storm, Figure 4 displays TEC keograms as a function of time and latitude along the 65°W longitude on 9–11 May. For the quiet-time result on 9 May (Figure 4a), the TEC keogram shows a typical double-crest EIA structure around ±15° MLAT during the daytime through local evening hours. In contrast, Figure 4b shows that, during the main phase of the storm, the EIA crests were characterized by a dramatic poleward expansion, with their latitudinal positions shifting from ±15° MLAT at 18:00–20:00 UT to ±30–35° MLAT at around 23:00–01:00 UT. In addition, the intensity of the EIA crests during the main phase of the storm increased significantly by 50–100% compared to their quiet-time levels. However, Figure 4c illustrates that, during the recovery phase of the storm, the daytime ionosphere experienced a pronounced negative storm, with TEC values being significantly reduced by 50–80% across the entire mid-latitude and low-latitude ionosphere compared to their quiet-time counterparts. In particular, the intensity of the EIA during the daytime through local dusk showed substantial suppression, with the double crests collapsing toward the equator and gradually merging into a weak equatorial band between 19:00 and 23:00 UT on 11 May. This distinct merging of EIA crests during the negative ionospheric storm in the recovery phase sharply contrasts with the aforementioned significant expansion of EIA observed during the positive ionospheric storm in the main phase.
To showcase the merging of EIA crests in more detail, Figure 5 displays combined GNSS TEC maps and GOLD nighttime disk images of OI 135.6 nm emission between 19:10 UT and 23:50 UT on 11 May 2024. The Swarm A orbits and corresponding electron density profiles are also included. At 19:10 UT (Figure 5a), the GNSS TEC shows that the previous double-crest EIA structure in the afternoon sector had merged into a single equatorial peak in the dusk sector, and the GOLD disk image further indicates that the early evening ionosphere was also characterized by a single bright equatorial band, rather than the previous double-peak structure. Correspondingly, the Swarm in situ profile also reveals a single-peak EIA signature in the equatorial region, with a peak density of around 1.2 × 10⁶/cm3 at 460 km. At 20:50 UT (Figure 5b) and 22:10 UT (Figure 5c), the peak magnitude of the merged EIA further diminishes to 20 TECU in GNSS TEC and 0.5 × 10⁶/cm3 in Swarm electron density profile. Such a small magnitude represents only 15–20% of the EIA peak intensity observed at the same times during the main phase of the storm, which was about 100–110 TECU in GNSS TEC and 3 × 10⁶/cm3 in Swarm electron density profile, as shown in Figure 2b,c. These observations demonstrate the dramatic and dynamic variation of EIA morphology and intensity during this super geomagnetic storm, and we will further analyze their underlying mechanisms in the Section 4.

4. Discussion

4.1. EIA Crests Expansion During the Main Phase

The storm-time EIA morphology in the American–Atlantic longitude sector experienced dramatic changes. During the main phase of the superstorm, the EIA crests exhibited a rapid poleward expansion during 19:00–23:00 UT on 10 May, reaching as high as ±35° MLAT. Such a substantial poleward expansion of EIA crests can be attributed to the equatorial super-fountain effect driven by strong PPEF, which were associated with a substantial negative excursion of IMF Bz between 19:30 UT and 22:30 UT on 10 May. To further showcase the possible variations in electric fields, Figure 6 presents the temporal variation of interplanetary electric field (IEF) and equatorial electric field (EEF) on 10–11 May. The EEF values are calculated at the American–Atlantic longitude of 60°W, where the EIA expansion was observed, using the prompt penetration equatorial electric field model [45]. During the period of 20:00 to 23:00 UT on 10 May, the IEF was strongly positive, corresponding with the pronounced southward excursion of the IMF Bz component. In response to the PPEF, the storm-time EEF values showed a noticeable enhancement of 50–200% compared to quiet-time levels among this period. Specifically, EEF values increased significantly from 0.36 mV/m (quiet-time) to a localized maximum of 1.1 mV/m (quiet-time plus penetration) around 20:30 UT, which maintained strongly positive until 23:00 UT on 10 May. Consequently, the equatorial and low-latitude ionosphere underwent an enhanced fountain effect with considerable uplift and ambipolar diffusion, which in turn resulted in the dramatic poleward expansion of EIA crests in the local afternoon and dusk sector, as observed by multiple instruments.
To further demonstrate the influence of PPEF on the low-latitude and equatorial ionosphere, Figure 7 shows digisonde measurements of electron density profile and F2 layer peak height (hmF2) at Ascension island and Cachoeira Paulista on 9–11 May 2024, respectively. The electron density profiles in the bottom-side ionosphere are retrieved in terms of shifted Chebyshev polynomials with a logarithmic argument containing the starting plasma frequency and the critical frequency of the layer, and the topside ionospheric electron density results are derived using an alpha-Chapman function of plasma density distribution [46]. Both stations are located in the lower mid-latitude ionosphere at approximately −15∼−20° MLAT. During the magnetic quiet-time on 9 May, the hmF2 at both stations showed a normal pre-reversal enhancement during 22:00–24:00 UT, characterized by a moderate post-sunset rise that reached altitudes of 320–340 km. However, during the main phase of the storm, the ionospheric electron density exhibited a drastic enhancement around 20:00–21:00 UT on 10 May, indicating that levels of local electron density were significantly influenced by the expansion of EIA crests. In the subsequent hours from 21:00 to 00:00 UT, the ionospheric hmF2 at both stations exhibited an extraordinary post-sunset rise from around 300 km to more than 500 km, while the ionospheric electron density profiles showed a notable depletion during this period. This drastic enhancement in hmF2 and coinciding substantial reduction in electron density indicates that these two stations were overwhelmed by the deep equatorial trough associated with the super-fountain effect. During this period, the EIA crests had shifted to the further poleward side of these two stations, which is consistent with the observations presented in Figure 2. These findings further support the role of PPEF in driving considerable ionospheric uplift and ambipolar diffusion within the equatorial and low-latitude ionosphere, ultimately leading to the observed poleward expansion of the EIA crests.
In addition to the PPEF, we next discuss the potential impact of neutral winds. Figure 8 shows the FPI red-line measurements of thermospheric nighttime neutral winds at the lower mid-latitude station of Cachoeira Paulista on 9–12 May. During the geomagnetic quiet-time on 9–10 May (Figure 8a,b), the nighttime meridional winds were predominantly in the northward (equator-ward) direction with small magnitudes of around 10–30 m/s, and the zonal winds exhibited eastward velocities of 80–100 m/s. In contrast, during the storm period, the neutral winds experienced significant disturbances. Between 22:00 UT and 00:00 UT during the main phase of the storm (Figure 8c), the meridional winds in the pre-midnight sector exhibited strong southward (poleward) components, ranging from 80 to 180 m/s. This robust poleward wind surge would greatly strengthen the ambipolar diffusion in the Southern Hemisphere via neutral drag, thereby contributing to some extent to the poleward expansion of EIA crests during this period. This observation aligns well with the GOLD images (Figure 2d and Figure 3d) and TEC keograms (Figure 4) in the Brazil longitude sector, which indicated that the southern EIA crests expanded to as high as −35∼−40° MLAT during the same time frame. In the meanwhile, the storm-time zonal winds exhibited strong westward surges of around −100 m/s between 22:00 UT on 10 May and 04:00 UT on 11 May (Figure 8d), which was opposite to the prevailing eastward zonal winds observed during quiet times at the same times. The mid-latitude westward wind surge may be generated by the Coriolis-induced deflection of equator-ward wind surges, as well as by the ion drag effect of the intense westward subauroral polarization stream collocated with the main ionospheric trough [47]. Such a strong westward wind surge suggests the building-up of DDEF in the low- and mid-latitude ionosphere. Given that the polarity of DDEF is normally westward in the daytime through local dusk, this will modify the equatorial zonal electric field to cause a reduction in the upward plasma drifts, suppressing the intensity of the EIA. Thus, it is unlikely that the disturbance dynamo was responsible for the observed extreme poleward expansion of EIA crests during the storm’s main phase.

4.2. EIA Crests Merging During the Recovery Phase

During the recovery phase of the magnetic storm on 11 May, the global ionosphere underwent a notable negative storm phase with 50–80% depletion in GNSS TEC. In particular, the EIA double crests in the American–Atlantic sector were largely suppressed and collapsed toward the equator, merging into a single equatorial band. This merging of EIA crests could be connected to changes in thermospheric composition. It is known that the increased Joule heating leads to atmospheric upwelling of molecule-rich air in mid- to high-latitude regions. This reduces the O/N2 ratio and leads to negative ionospheric storm phase through modifying the chemical loss rate therein; conversely, the atmospheric downwelling of atomic-rich air on the equator-ward side of the composition depletion zone causes enhancement in O/N2, contributing to the positive ionospheric effect in equatorial and low-latitude regions. Given that the ionosphere has usually been uplifted to higher altitudes by electrodynamic effect of PPEF and the mechanical effect of equator-ward neutral winds during the main phase of a geomagnetic storm, the composition change effect tends to be more effective during the recovery phase of a geomagnetic storm [19,20]. Figure 9a,b display the map of O/N2 column ratio measured by TIMED/GUVI on 11 May and the background reference map, respectively. Here, the background reference results are calculated using average values over three geomagnetically quiet days before the storm event (i.e., 7–9 May). Figure 9c shows the delta O/N2 map through subtracting the quiet-time values from storm-time values. As can be seen, the delta O/N2 distribution reveals a 10–30% reduction in mid-latitude regions, while the O/N2 ratio in the equatorial regions exhibits a 20–40% enhancement. Consequently, the equator-ward expansion of O/N2 depletion and the equatorial enhancement of O/N2 led to a suppression of the previously expanded double EIA crests, causing them to collapse toward the equator and merge into a single equatorial band [2,15].
In addition to the composition changes effect, several studies have suggested that the merging of EIA crests can be triggered by localized downward E × B drift driven by westward electric fields due to wind disturbances [27,28,29,31]. Storm-time changes in the global neutral wind patterns and the influence of the Coriolis force typically lead to equator-ward and westward wind surges, which contribute to the building-up of DDEF with a westward polarity during the daytime through local dusk. The westward electric fields can diminish or even reverse the upward plasma drift in the equatorial region, thereby suppressing the ambipolar diffusion and contributing to the formation of single-peak EIA morphology [13,32]. For instance, Figure 7a shows that the daytime hmF2 during 12:00–18:00 UT on 11 May was generally lower than those observed at the same times during quiet conditions on 9 May, which suggests the likely influence of westward DDEF. However, Figure 8e shows that the magnitude of meridional winds at the mid-latitude station was quite small between 22:00 UT and 01:00 UT on 11–12 May, and Figure 8f shows that zonal winds were predominantly eastward during this period. These observations imply that the disturbance dynamo might have subsided by the end of 11 May. Given the lack of daytime neutral winds measurements and equatorial electric field data, assessing the relative contribution of DDEF and composition change effect remains a challenging issue. Future theoretical simulations are necessary to further elucidate their respective importance.

5. Conclusions

This paper studies the dynamic variations of EIA morphology in the American–Atlantic longitude sector during the main phase and recovery phases of the super geomagnetic storm that occurred on 10–11 May 2024. The storm-time ionospheric–thermospheric responses from the equatorial to the mid-latitude regions are comprehensively analyzed using multi-instrument observations, encompassing ground-based GNSS TEC, ionosonde observations, and FPI-measured neutral winds, as well as space-based measurements from GOLD, Swarm, DMSP, and TIMED satellites. The key findings are summarized as follows:
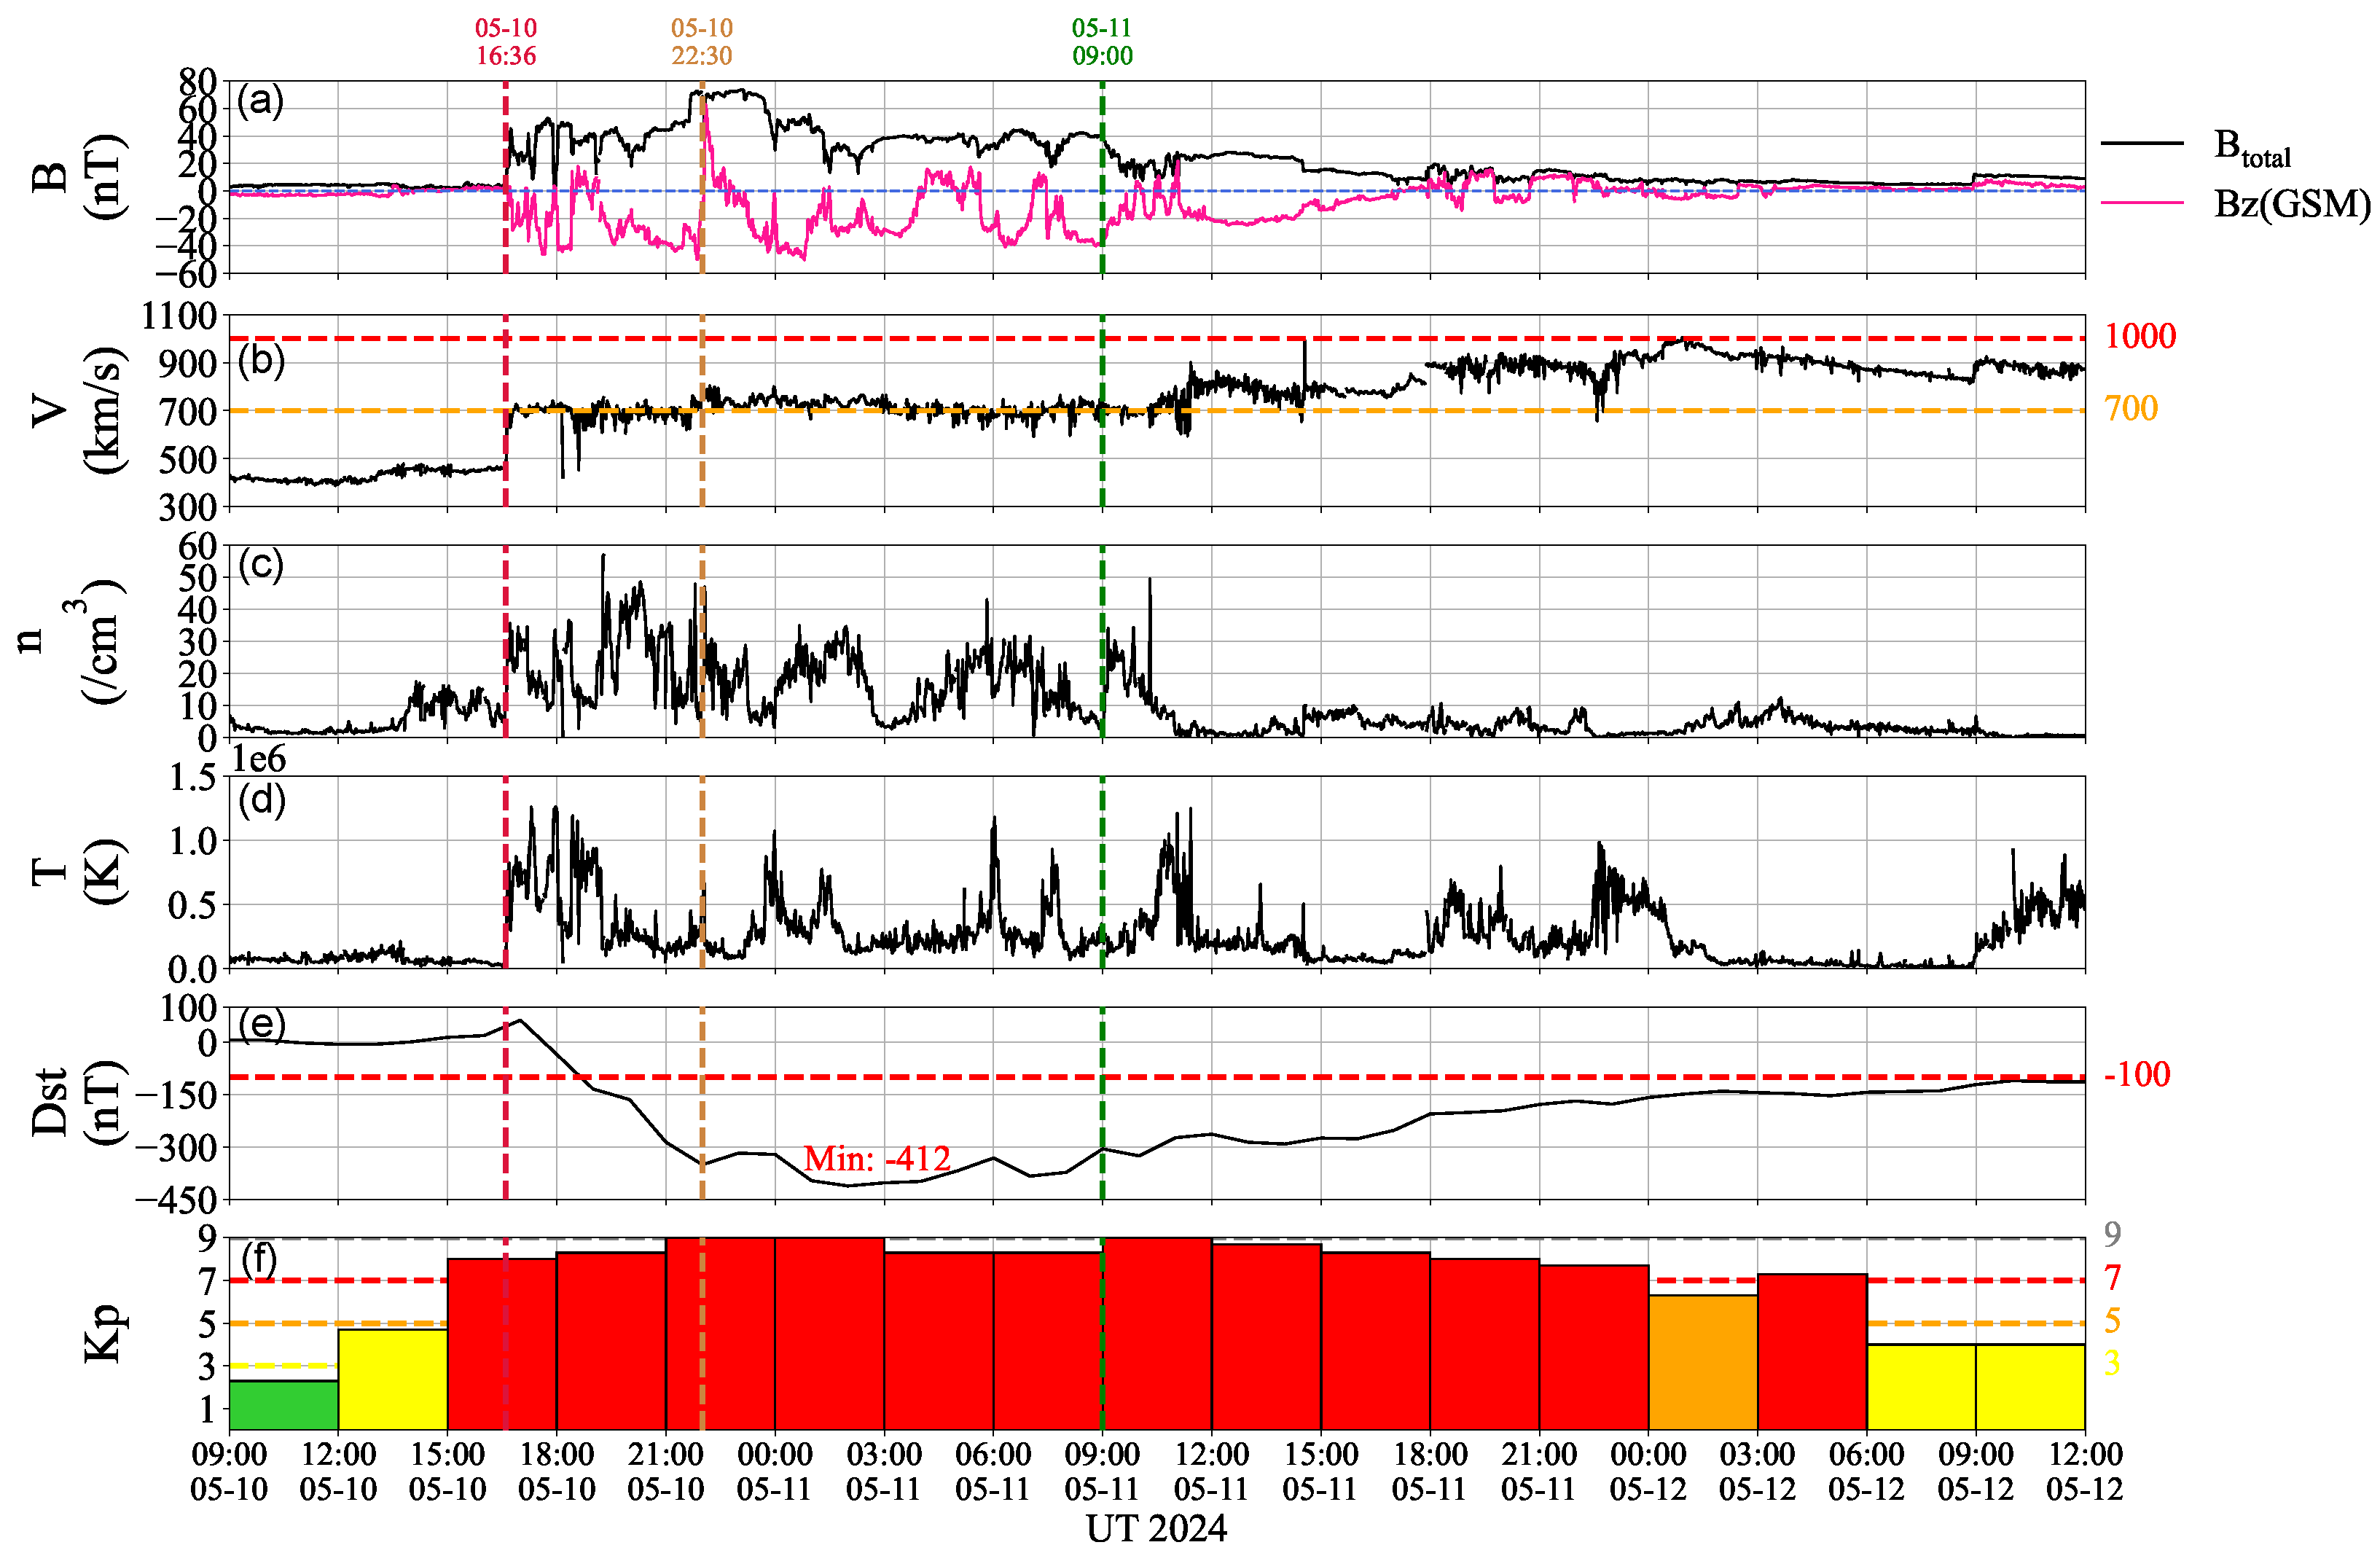
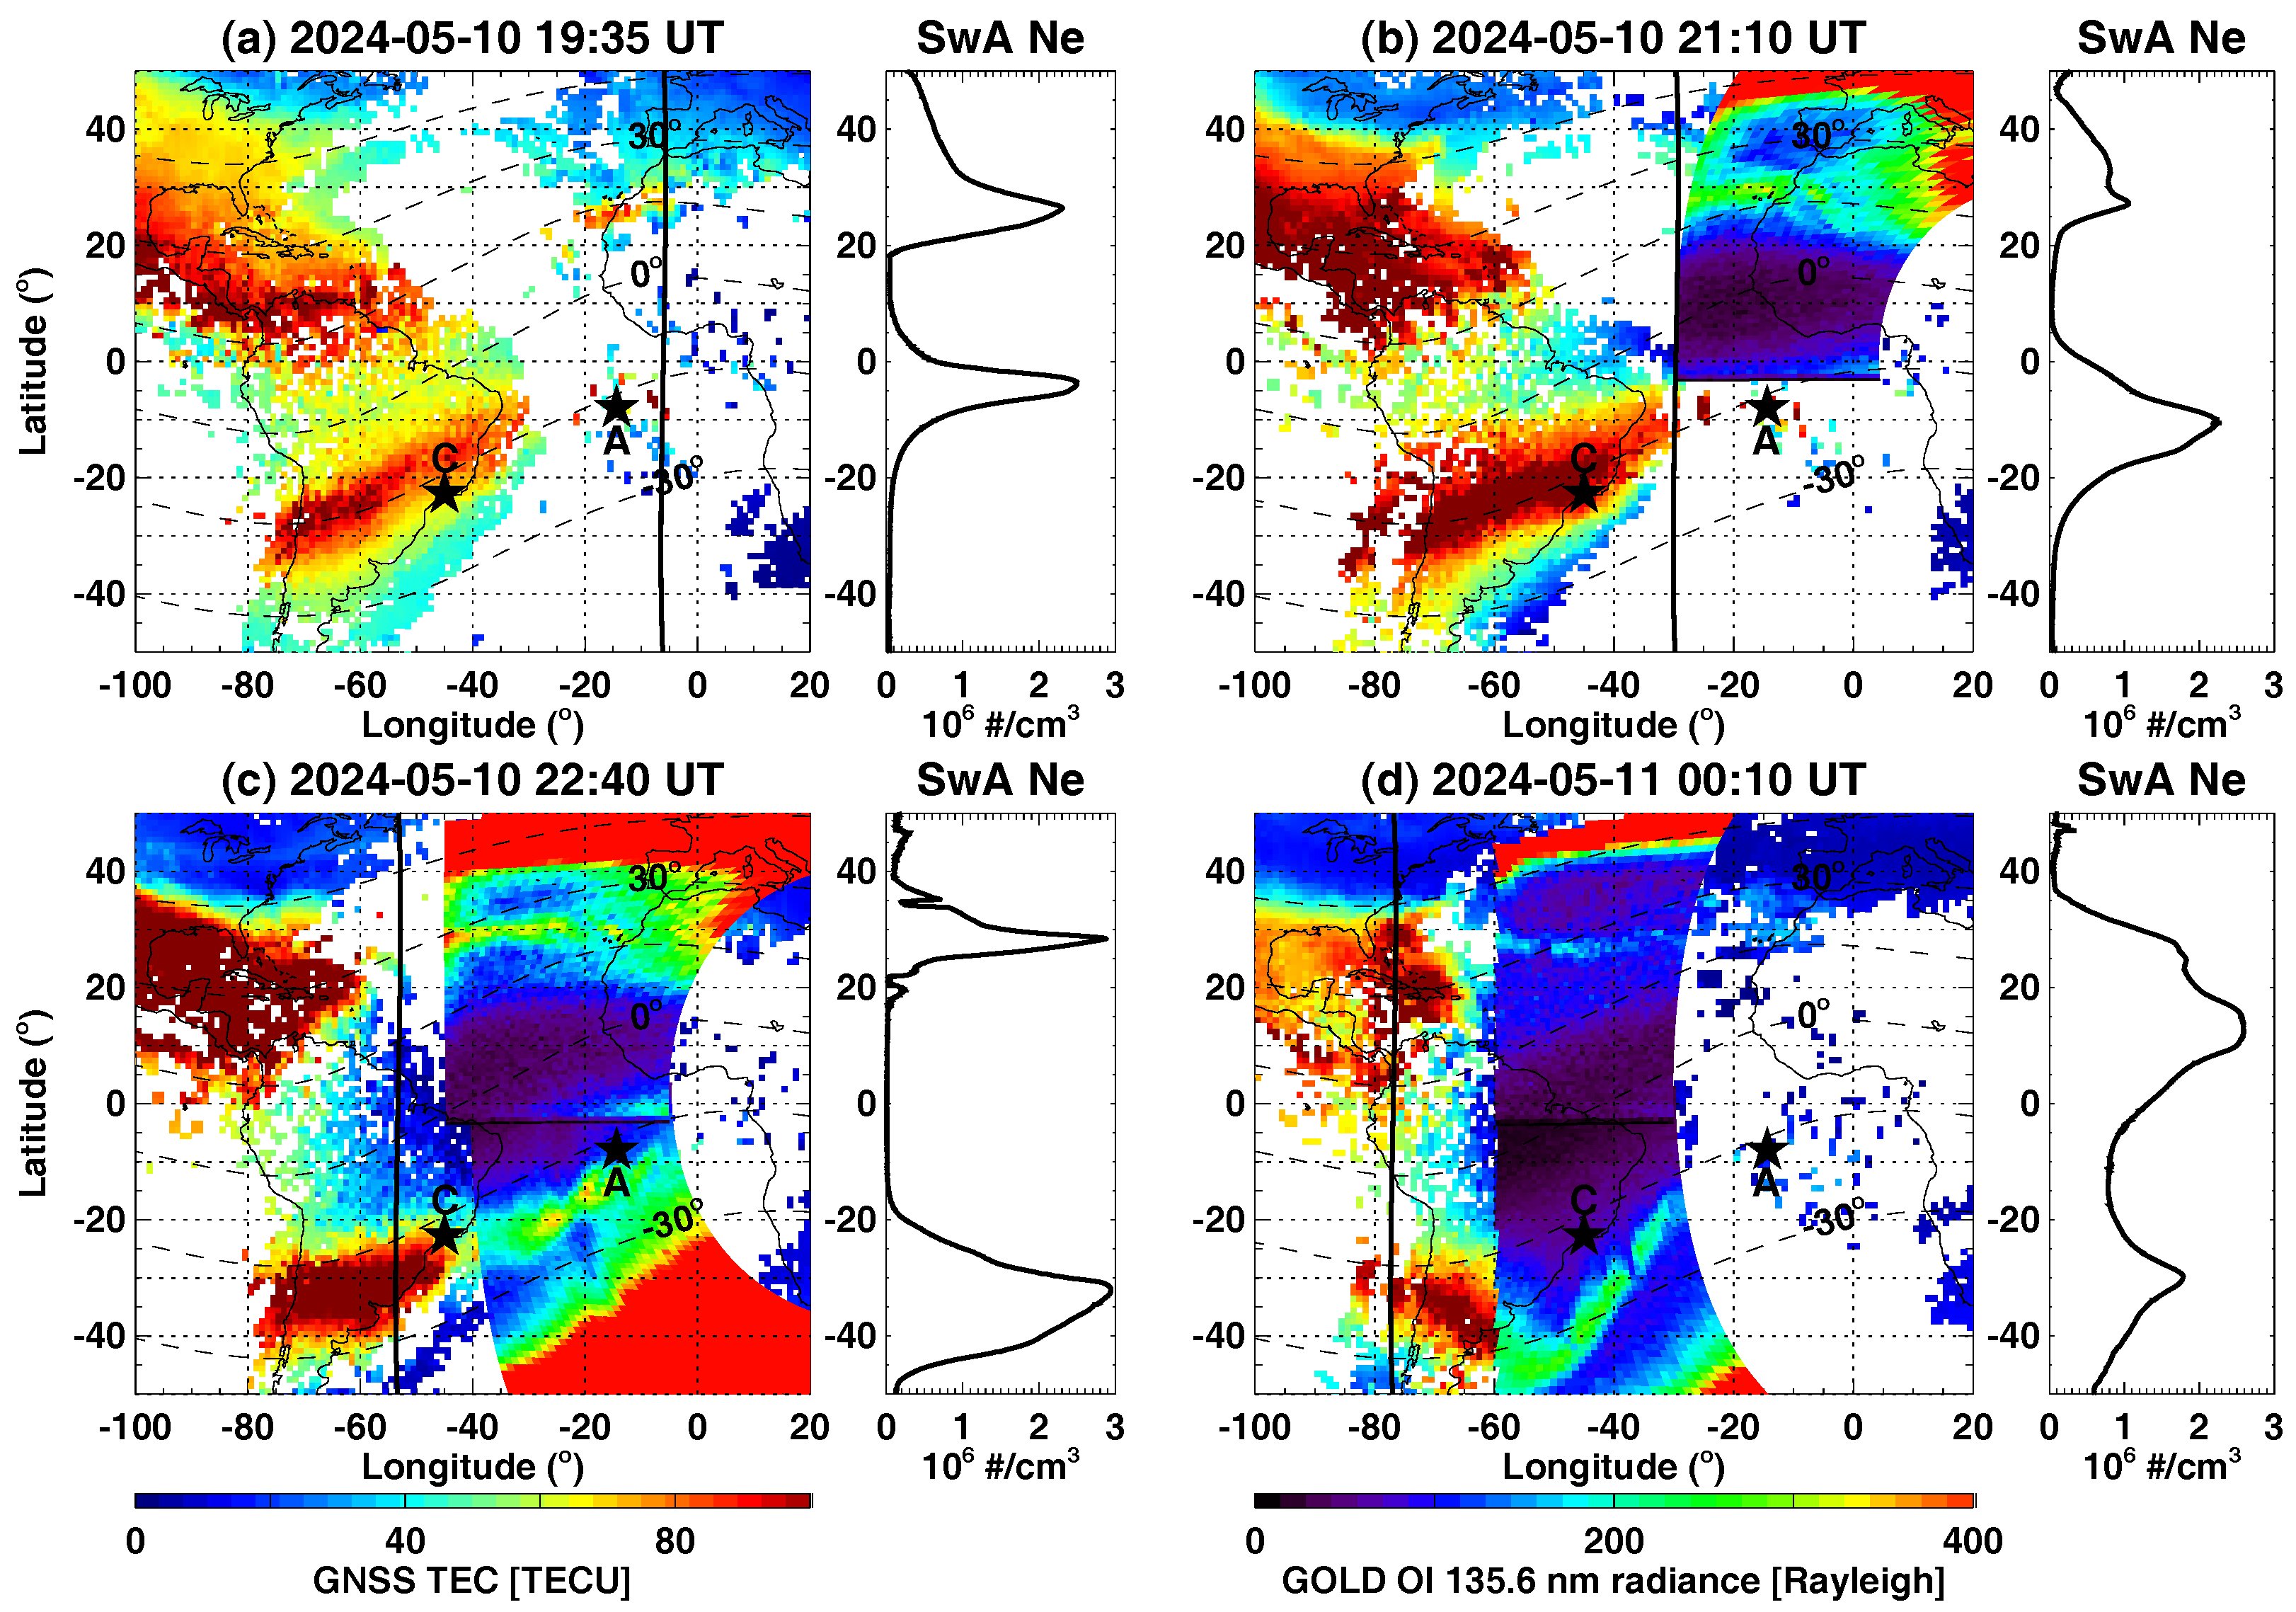
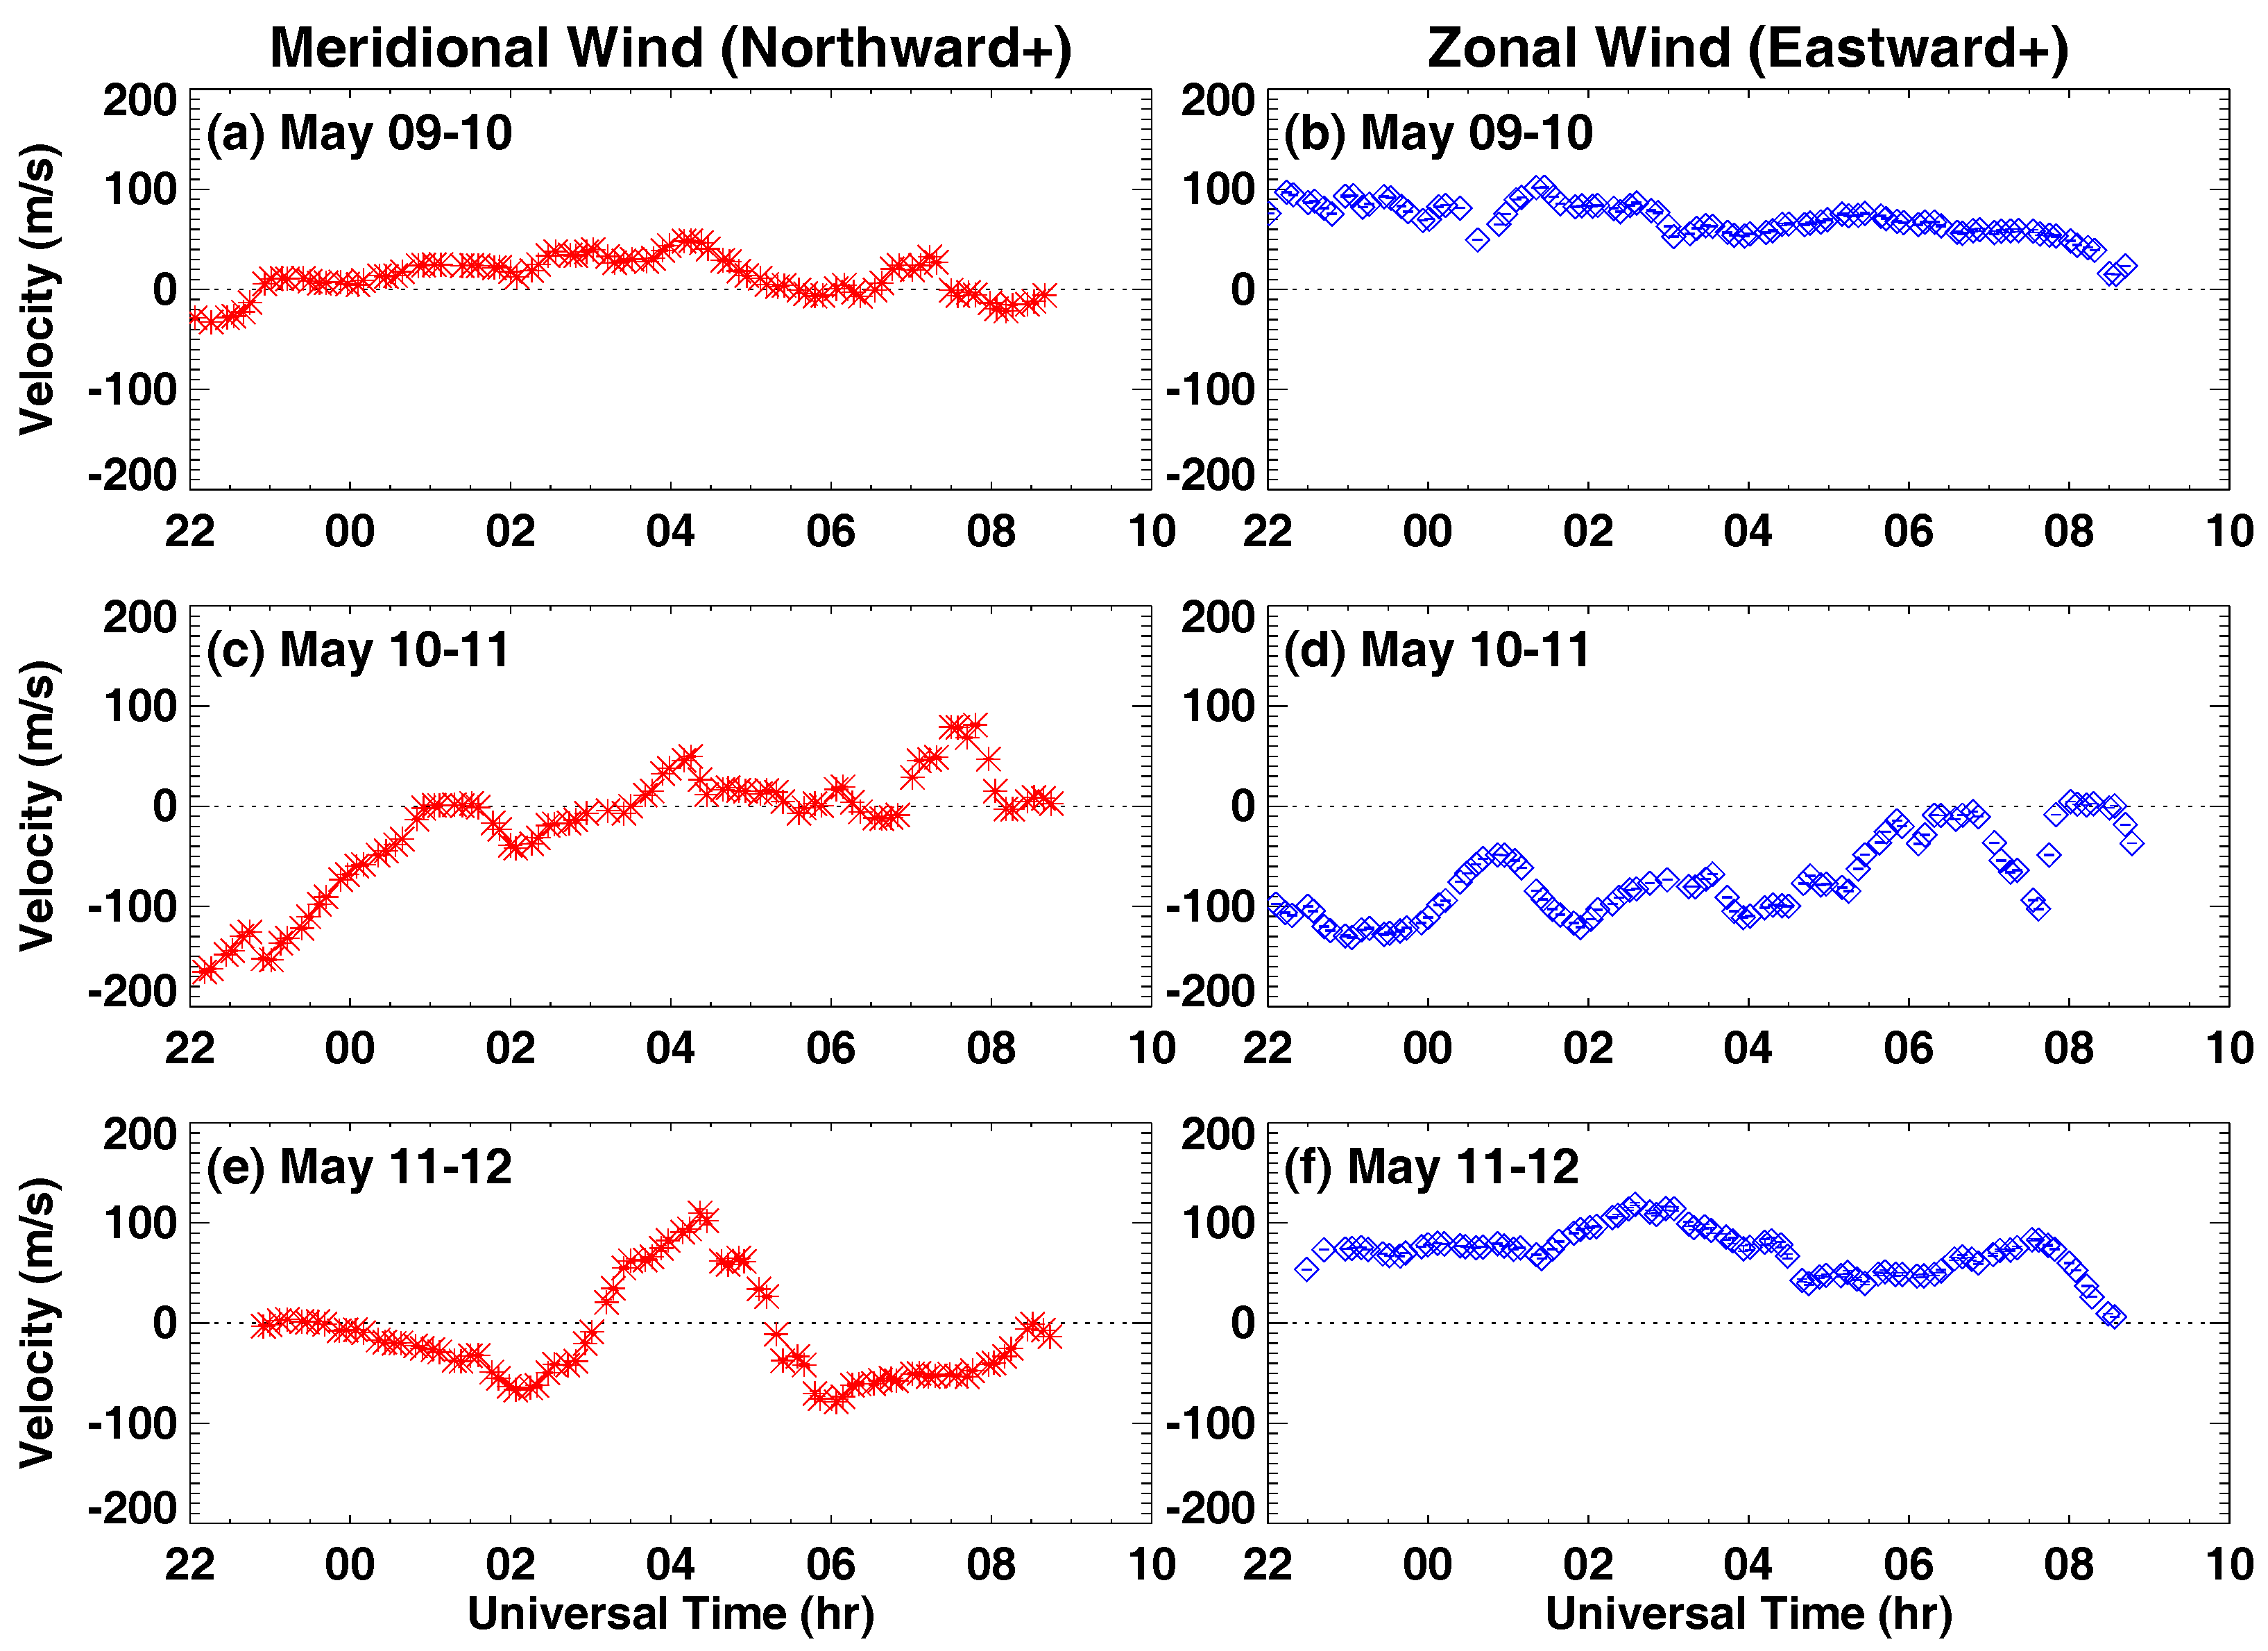
  • During the main phase of the superstorm, the low- and mid-latitude ionosphere experienced a strong positive storm, with GNSS TEC showing drastic enhancements of 50–100% in a few hours. In the meantime, the EIA crests exhibited a remarkable poleward expansion, reaching latitudes as high as ±35° MLAT. This phenomenon can be predominantly attributed to the super-fountain effect driven by strong PPEF associated with the strongly southward excursion of IMF Bz. Additionally, transient poleward wind surges likely enhanced ambipolar diffusion, further contributing to the poleward shift of the EIA crests.
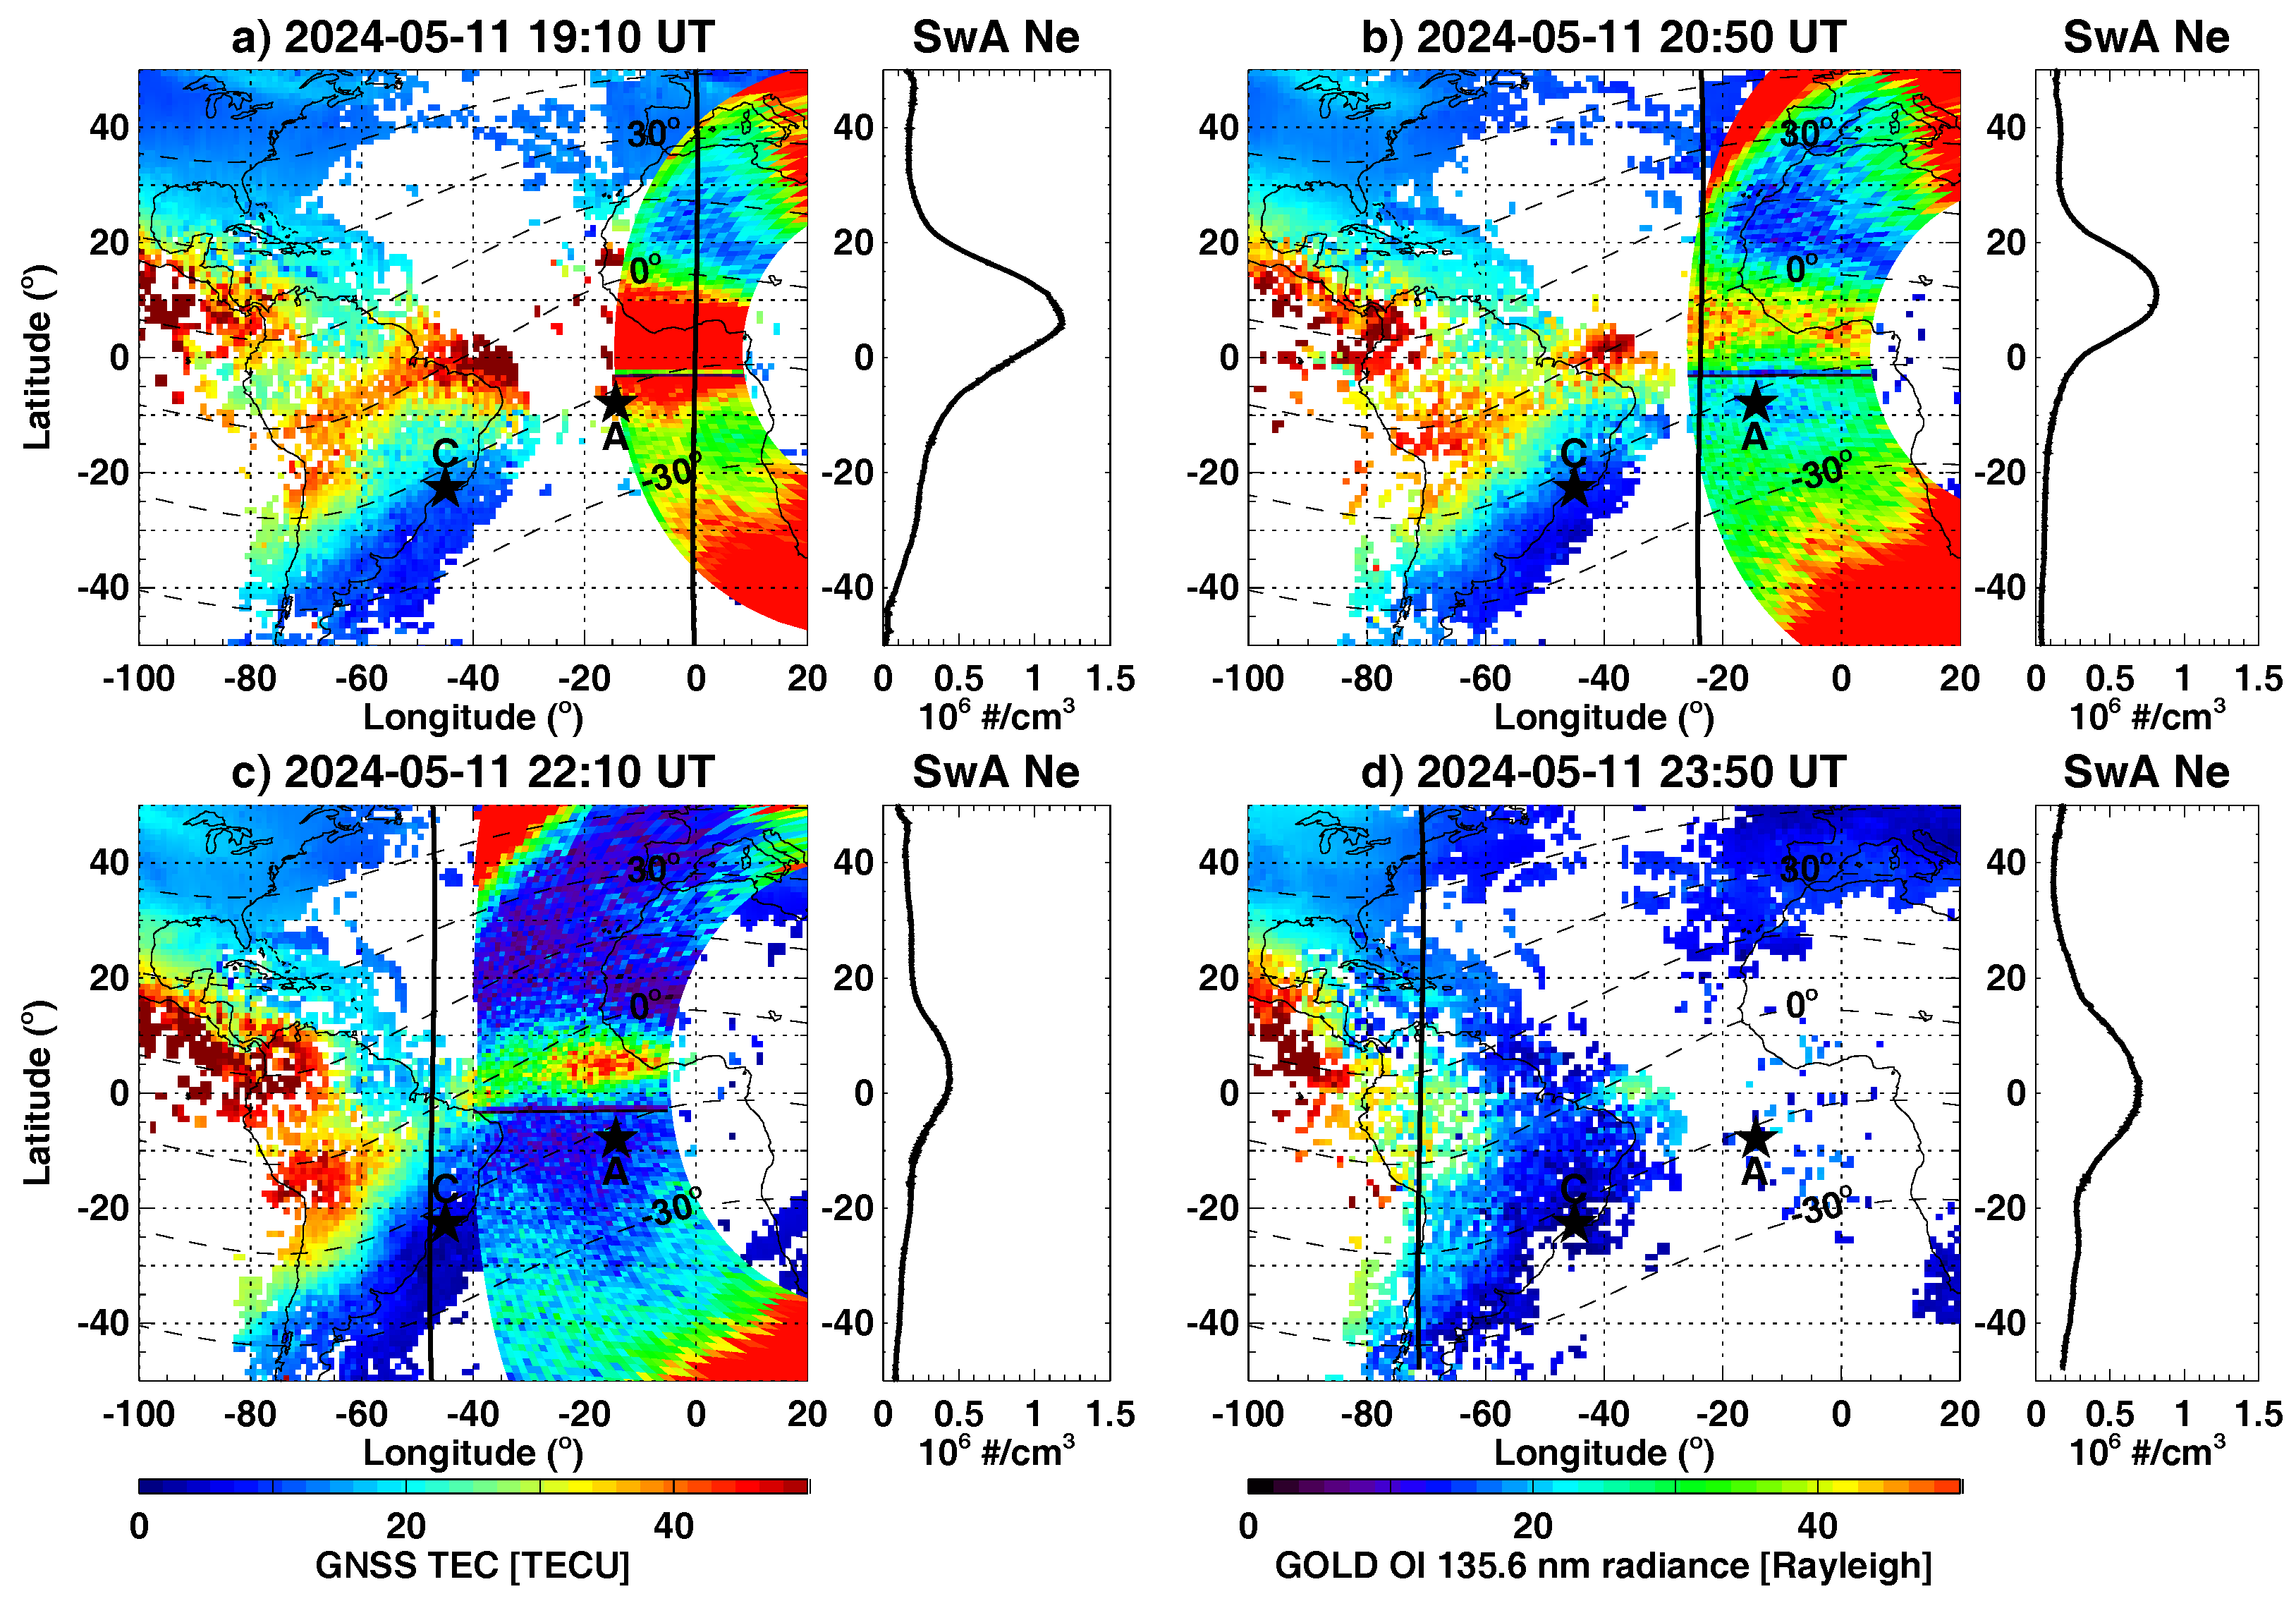
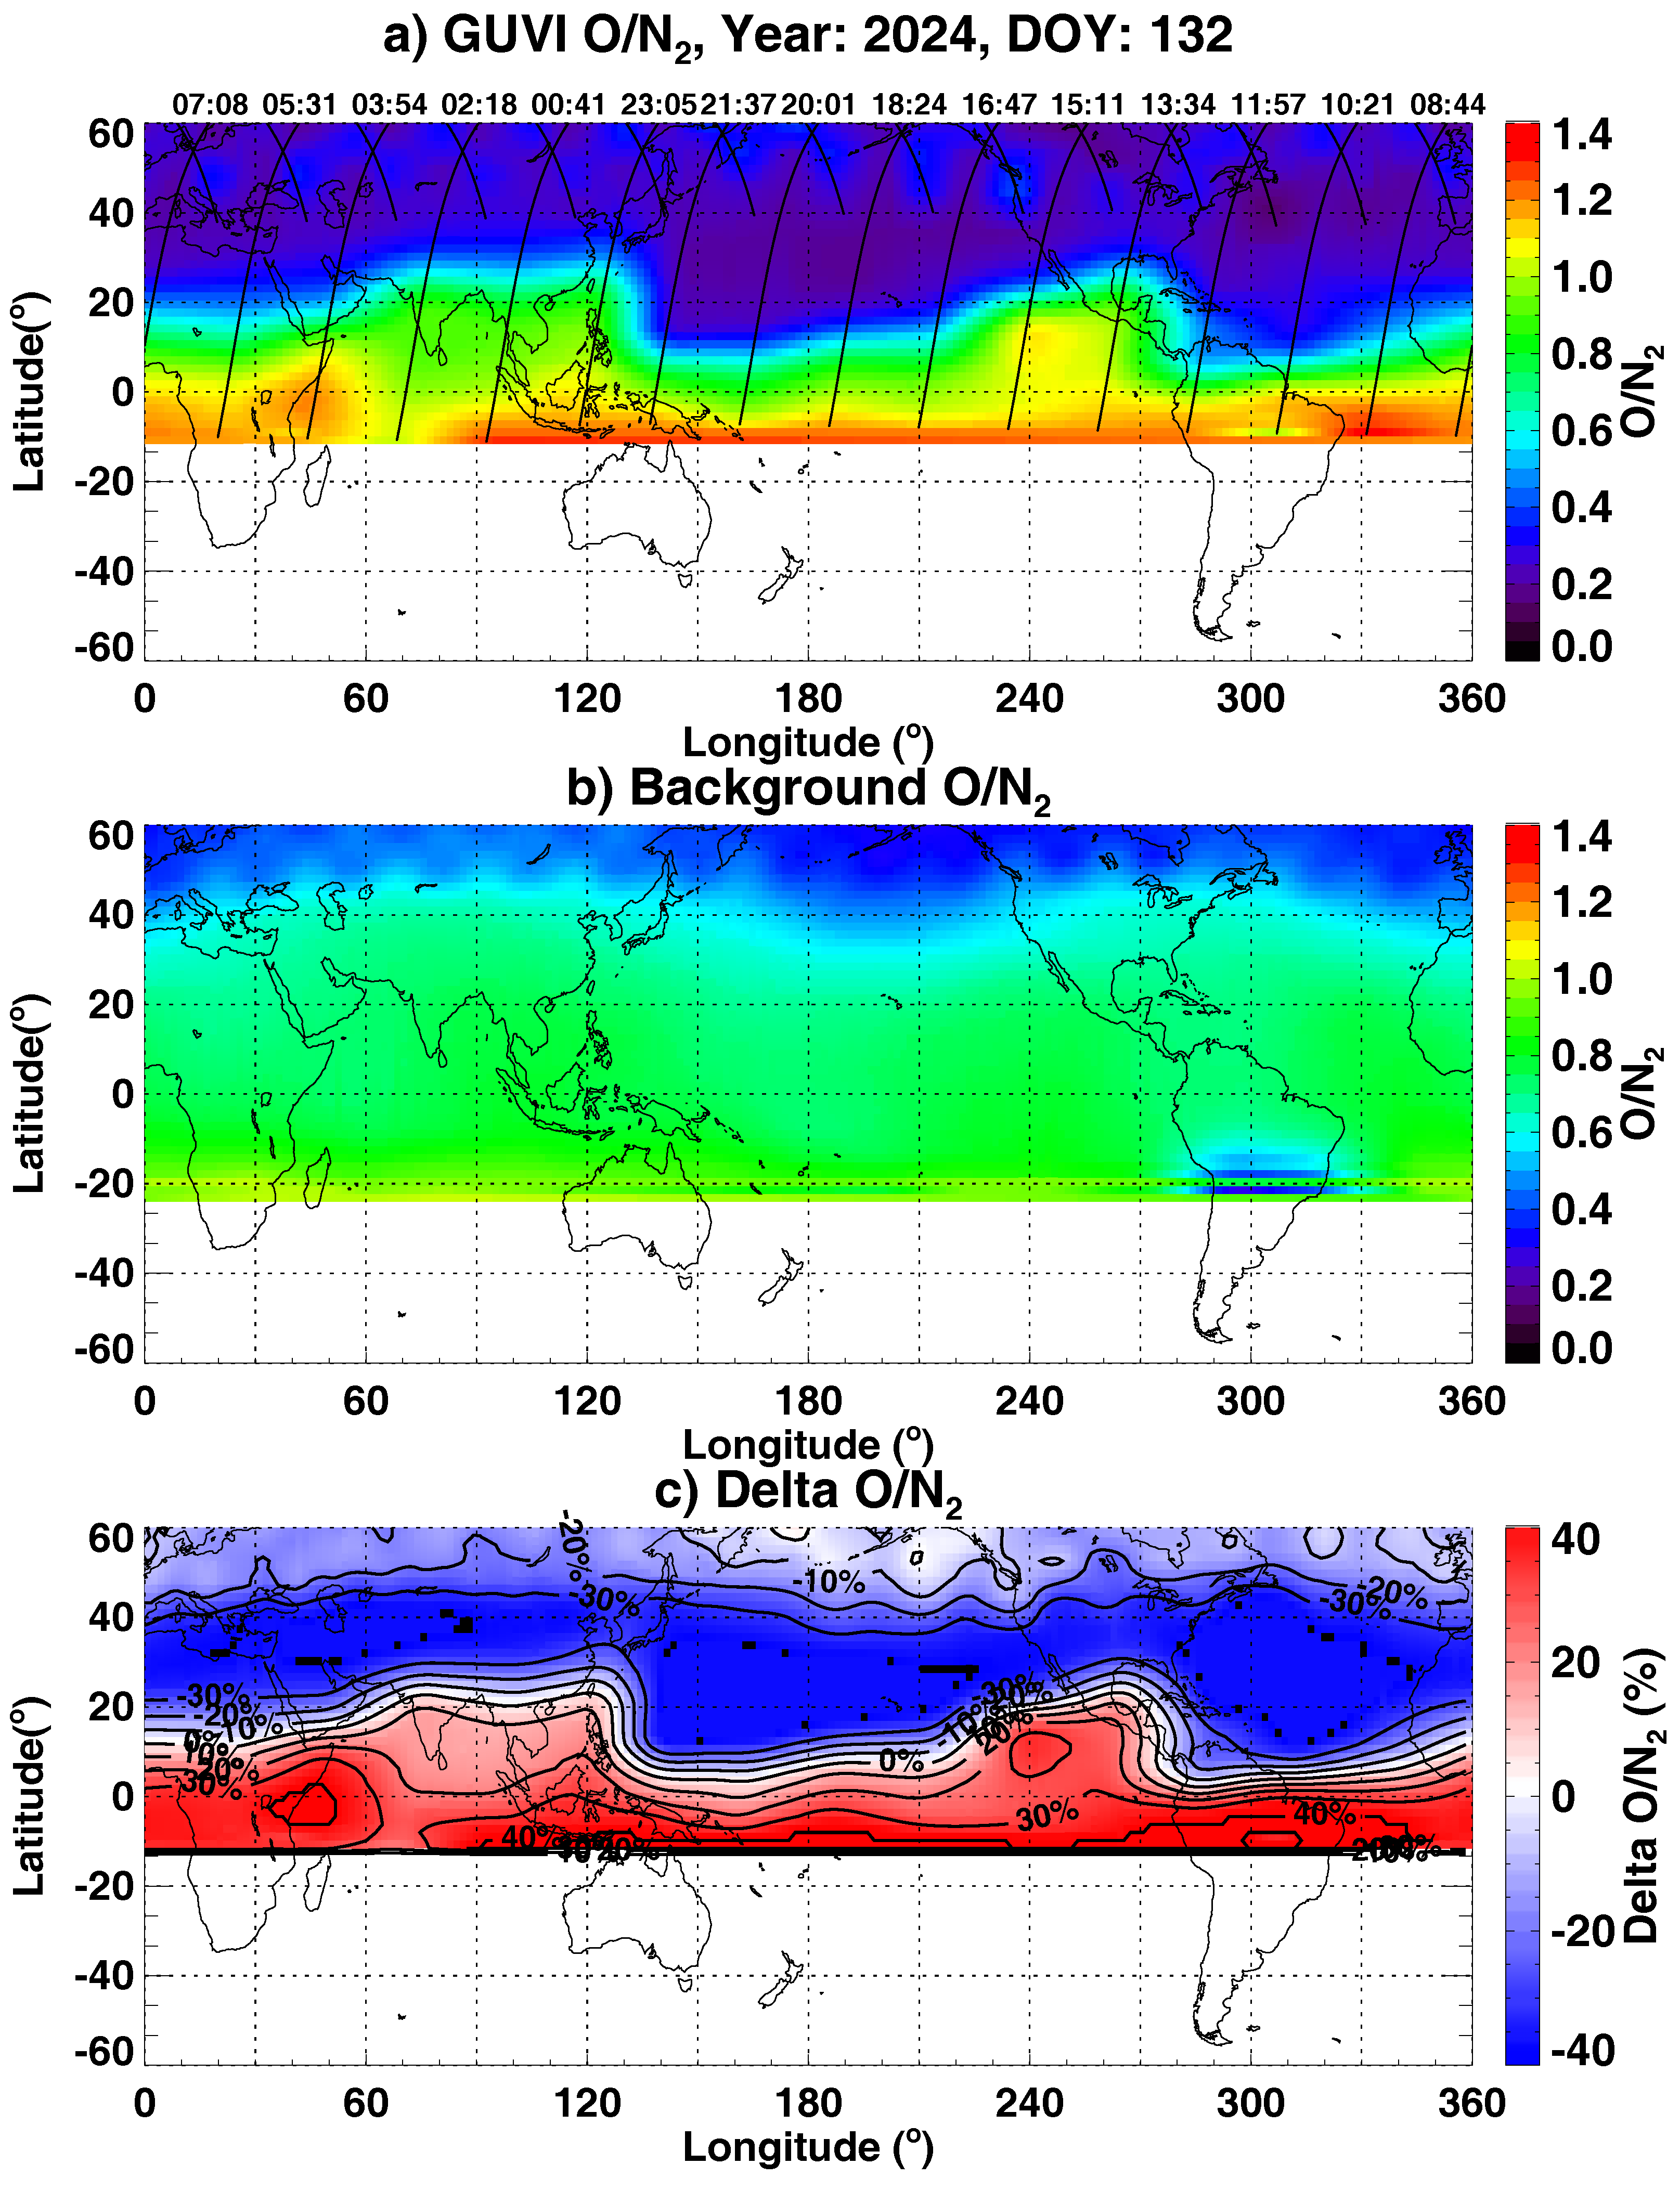
  • During the recovery phase of the superstorm, the global ionosphere was characterized by a substantial negative storm, marked by a 50–80% depletion in GNSS TEC. Simultaneously, the EIA crests in the American–Atlantic sector were severely suppressed and collapsed toward the equator, merging into a single equatorial band. This phenomenon is likely related to the composition change effect, with O/N2 being significantly enhanced in the equatorial region while being depleted at higher latitudes. In addition, westward DDEF likely played a role in contributing to the merging of the EIA crests.
In conclusion, our results reveal novel findings of dramatic and dynamic day-to-day variations in EIA morphology, with a significant poleward expansion during the main phase, which then merged into a single equatorial band during the recovery phase. These key findings illustrate the complex processes involved in magnetosphere–ionosphere–thermosphere coupling during a superstorm, underscoring the substantial impacts of space weather on the global ionosphere.

Author Contributions

Conceptualization, E.A.; methodology, E.A. and Y.C.; software, E.A.; validation, E.A. and Y.C.; formal analysis, E.A., Y.C. and B.L.; investigation, E.A.; resources, E.A.; writing—original draft preparation, E.A.; writing—review and editing, E.A., Y.C. and B.L.; visualization, E.A.; supervision, E.A.; project administration, E.A.; funding acquisition, E.A. and B.L. All authors have read and agreed to the published version of the manuscript.

Funding

This work is supported by the Strategic Priority Research Program of the Chinese Academy of Sciences (Grant No. XDB0560000), NSF awards AGS-1952737, AGS-2033787, and PHY-2028125, and the National Natural Science Foundation of China (41974184). Data production from the Fabry-Perot interferometers at Cachoeira Paulista, Brazil is supported by the Brazilian Ministry of Science, Technology and Innovation, Brazilian Space Agency, CNPq (Grant 311840/2022-1), and by NSF award number 2431743.

Data Availability Statement

GNSS TEC data are provided by MIT Haystack Observatory through the Madrigal distributed data system (http://cedar.openmadrigal.org/ (accessed on 1 September 2024)). The solar wind and geophysical parameters data are acquired from NASA/GSFC’s Space Physics Data Facility’s OMNIWeb service (https://cdaweb.gsfc.nasa.gov/ (accessed on 1 September 2024)) and Kyoto world data center for Geomagnetism (http://wdc.kugi.kyoto-u.ac.jp/ (accessed on 1 September 2024)). GOLD data can be accessed at (https://gold.cs.ucf.edu/data/search/ (accessed on 1 September 2024)). The ionosonde data are provided by the University of Massachusetts Lowell DIDB database of Global Ionospheric Radio Observatory (https://giro.uml.edu/didbase/scaled.php (accessed on 1 September 2024)). Swarm data are provided by the European Space Agency (https://swarm-diss.eo.esa.int/ (accessed on 1 September 2024)). DMSP data and FPI data are available at the Madrigal CEDAR database (http://cedar.openmadrigal.org/ (accessed on 1 September 2024)). TIMED/GUVI data are provided by Johns Hopkins University Applied Physics Laboratory at https://guvitimed.jhuapl.edu/data_products (accessed on 1 September 2024).

Conflicts of Interest

The authors declare no conflicts of interest.

Correction Statement

This article has been republished with a minor correction to the Funding statement. This change does not affect the scientific content of the article.

References

  1. Appleton, E.V. Two Anomalies in the Ionosphere. Nature 1946, 157, 691. [Google Scholar] [CrossRef]
  2. Balan, N.; Liu, L.; Le, H. A brief review of equatorial ionization anomaly and ionospheric irregularities. Earth Planet. Phys. 2018, 2, 257–275. [Google Scholar] [CrossRef]
  3. Duncan, R.A. The equatorial F-region of the ionosphere. J. Atmos. Terr. Phys. 1960, 18, 89–100. [Google Scholar] [CrossRef]
  4. Fejer, B.G. Low latitude storm time ionospheric electrodynamics. J. Atmos. Sol.-Terr. Phys. 2002, 64, 1401–1408. [Google Scholar] [CrossRef]
  5. Huang, C.S.; Sazykin, S.; Chau, J.L.; Maruyama, N.; Kelley, M.C. Penetration electric fields: Efficiency and characteristic time scale. J. Atmos. Sol.-Terr. Phys. 2007, 69, 1135–1146. [Google Scholar] [CrossRef]
  6. Abdu, M.A.; de Paula, E.R.; Batista, I.S.; Reinisch, B.W.; Matsuoka, M.T.; Camargo, P.O.; Veliz, O.; Denardini, C.M.; Sobral, J.H.A.; Kherani, E.A.; et al. Abnormal evening vertical plasma drift and effects on ESF and EIA over Brazil-South Atlantic sector during the 30 October 2003 superstorm. J. Geophys. Res. Space Phys. 2008, 113, A07313. [Google Scholar] [CrossRef]
  7. Karan, D.K.; Eastes, R.W.; Daniell, R.E.; Martinis, C.R.; McClintock, W.E. GOLD Mission’s Observation About the Geomagnetic Storm Effects on the Nighttime Equatorial Ionization Anomaly (EIA) and Equatorial Plasma Bubbles (EPB) During a Solar Minimum Equinox. Space Weather. 2023, 21, e2022SW003321. [Google Scholar] [CrossRef]
  8. Lin, C.H.; Richmond, A.D.; Liu, J.Y.; Yeh, H.C.; Paxton, L.J.; Lu, G.; Tsai, H.F.; Su, S.Y. Large-scale variations of the low-latitude ionosphere during the October-November 2003 superstorm: Observational results. J. Geophys. Res. Space Phys. 2005, 110, A09S28. [Google Scholar] [CrossRef]
  9. Mannucci, A.J.; Tsurutani, B.T.; Iijima, B.A.; Komjathy, A.; Saito, A.; Gonzalez, W.D.; Guarnieri, F.L.; Kozyra, J.U.; Skoug, R. Dayside global ionospheric response to the major interplanetary events of 29–30 October 2003 “Halloween Storms”. Geophys. Res. Lett. 2005, 32, L12S02. [Google Scholar] [CrossRef]
  10. Tsurutani, B.; Mannucci, A.; Iijima, B.; Abdu, M.A.; Sobral, J.H.A.; Gonzalez, W.; Guarnieri, F.; Tsuda, T.; Saito, A.; Yumoto, K.; et al. Global dayside ionospheric uplift and enhancement associated with interplanetary electric fields. J. Geophys. Res. 2004, 109, A08302. [Google Scholar] [CrossRef]
  11. Blanc, M.; Richmond, A.D. The ionospheric disturbance dynamo. J. Geophys. Res. 1980, 85, 1669–1686. [Google Scholar] [CrossRef]
  12. Aa, E.; Zhang, S.R.; Erickson, P.J.; Wang, W.; Qian, L.; Cai, X.; Coster, A.J.; Goncharenko, L.P. Significant Mid- and Low-Latitude Ionospheric Disturbances Characterized by Dynamic EIA, EPBs, and SED Variations During the 13–14 March 2022 Geomagnetic Storm. J. Geophys. Res. Space Phys. 2023, 128, e2023JA031375. [Google Scholar] [CrossRef]
  13. Fagundes, P.R.; Cardoso, F.A.; Fejer, B.G.; Venkatesh, K.; Ribeiro, B.A.G.; Pillat, V.G. Positive and negative GPS-TEC ionospheric storm effects during the extreme space weather event of March 2015 over the Brazilian sector. J. Geophys. Res. Space Phys. 2016, 121, 5613–5625. [Google Scholar] [CrossRef]
  14. Kuai, J.; Liu, L.; Liu, J.; Sripathi, S.; Zhao, B.; Chen, Y.; Le, H.; Hu, L. Effects of disturbed electric fields in the low-latitude and equatorial ionosphere during the 2015 St. Patrick’s Day storm. J. Geophys. Res. Space Phys. 2016, 121, 9111–9126. [Google Scholar] [CrossRef]
  15. Sreeja, V.; Ravindran, S.; Pant, T.K.; Devasia, C.V.; Paxton, L.J. Equatorial and low-latitude ionosphere-thermosphere system response to the space weather event of August 2005. J. Geophys. Res. Space Phys. 2009, 114, A12307. [Google Scholar] [CrossRef]
  16. Balan, N.; Shiokawa, K.; Otsuka, Y.; Kikuchi, T.; Vijaya Lekshmi, D.; Kawamura, S.; Yamamoto, M.; Bailey, G.J. A physical mechanism of positive ionospheric storms at low latitudes and midlatitudes. J. Geophys. Res. Space Phys. 2010, 115, A02304. [Google Scholar] [CrossRef]
  17. Luan, X. Equatorial Ionization Anomaly Variations During Geomagnetic Storms. In Ionosphere Dynamics and Applications; American Geophysical Union (AGU): Washington, DC, USA, 2021; Chapter 13; pp. 301–312. [Google Scholar] [CrossRef]
  18. Buonsanto, M.J. Ionospheric Storms—A Review. Space Sci. Rev. 1999, 88, 563–601. [Google Scholar] [CrossRef]
  19. Fuller-Rowell, T.J.; Codrescu, M.V.; Moffett, R.J.; Quegan, S. Response of the thermosphere and ionosphere to geomagnetic storms. J. Geophys. Res. 1994, 99, 3893–3914. [Google Scholar] [CrossRef]
  20. Prölss, G.W. Magnetic storm associated perturbations of the upper atmosphere— Recent results obtained by satellite-borne gas analyzers. Rev. Geophys. Space Phys. 1980, 18, 183–202. [Google Scholar] [CrossRef]
  21. Eccles, J.V.; St. Maurice, J.P.; Schunk, R.W. Mechanisms underlying the prereversal enhancement of the vertical plasma drift in the low-latitude ionosphere. J. Geophys. Res. Space Phys. 2015, 120, 4950–4970. [Google Scholar] [CrossRef]
  22. Farley, D.T.; Bonelli, E.; Fejer, B.G.; Larsen, M.F. The prereversal enhancement of the zonal electric field in the equatorial ionosphere. J. Geophys. Res. 1986, 91, 13723–13728. [Google Scholar] [CrossRef]
  23. Aa, E.; Zhang, S.R.; Zou, S.; Wang, W.; Wang, Z.; Cai, X.; Erickson, P.J.; Coster, A.J. Significant Midlatitude Bubble-Like Ionospheric Super-Depletion Structure (BLISS) and Dynamic Variation of Storm-Enhanced Density Plume During the 23 April 2023 Geomagnetic Storm. Space Weather 2024, 22, e2023SW003704. [Google Scholar] [CrossRef]
  24. Karan, D.K.; Martinis, C.R.; Eastes, R.W.; Daniell, R.E.; McClintock, W.E.; Huang, C.S. GOLD Observations of Equatorial Plasma Bubbles Reaching Mid-Latitudes During the 23 April 2023 Geomagnetic Storm. Space Weather 2024, 22, e2023SW003847. [Google Scholar] [CrossRef]
  25. Zhao, B.; Wan, W.; Liu, L. Responses of equatorial anomaly to the October–November 2003 superstorms. Ann. Geophys. 2005, 23, 693–706. [Google Scholar] [CrossRef]
  26. Carruthers, G.R.; Page, T. Apollo 16 Far-Ultraviolet Camera/Spectrograph: Earth Observations. Science 1972, 177, 788–791. [Google Scholar] [CrossRef]
  27. Aa, E.; Zhang, S.R.; Wang, W.; Erickson, P.J.; Qian, L.; Eastes, R.; Harding, B.J.; Immel, T.J.; Karan, D.K.; Daniell, R.E.; et al. Pronounced Suppression and X-Pattern Merging of Equatorial Ionization Anomalies After the 2022 Tonga Volcano Eruption. J. Geophys. Res. Space Phys. 2022, 127, e30527. [Google Scholar] [CrossRef]
  28. Laskar, F.I.; Karan, D.K.; Daniell, R.E.; Codrescu, M.V.; Eastes, R.W.; Pedatella, N.M.; Wang, W.; Maute, A.; Aryal, S.; Rajesh, P.K.; et al. The X-Pattern Merging of the Equatorial Ionization Anomaly Crests During Geomagnetic Quiet Time. J. Geophys. Res. Space Phys. 2024, 129, e2023JA032224. [Google Scholar] [CrossRef]
  29. Rang, X.; Xiong, C.; Zheng, Y.; Liu, J.; Jiao, Y.; Gao, S.; Huang, Y.; Wan, X.; Yin, F. Multi-instrumental observations of nighttime X-pattern of equatorial ionization anomaly during magnetically quiet-time: Case study. Earth Planet. Phys. 2024, 8. [Google Scholar] [CrossRef]
  30. Basu, S.; Basu, S.; Huba, J.; Krall, J.; McDonald, S.E.; Makela, J.J.; Miller, E.S.; Ray, S.; Groves, K. Day-to-day variability of the equatorial ionization anomaly and scintillations at dusk observed by GUVI and modeling by SAMI3. J. Geophys. Res. Space Phys. 2009, 114, A04302. [Google Scholar] [CrossRef]
  31. Wu, K.; Qian, L.; Wang, W.; Cai, X.; Mclnerney, J.M. Investigation of the GOLD Observed Merged Nighttime EIA with WACCM-X Simulations During the Storm of 3 and 4 November 2021. Geophys. Res. Lett. 2023, 50, e2023GL103603. [Google Scholar] [CrossRef]
  32. Balan, N.; Otsuka, Y.; Nishioka, M.; Liu, J.Y.; Bailey, G.J. Physical mechanisms of the ionospheric storms at equatorial and higher latitudes during the recovery phase of geomagnetic storms. J. Geophys. Res. Space Phys. 2013, 118, 2660–2669. [Google Scholar] [CrossRef]
  33. Pierrard, V.; Winant, A.; Botek, E.; Péters de Bonhome, M. The Mother’s Day Solar Storm of 11 May 2024 and Its Effect on Earth’s Radiation Belts. Universe 2024, 10, 391. [Google Scholar] [CrossRef]
  34. Aa, E.; Zhang, S.R.; Lei, J.; Huang, F.; Erickson, P.J.; Coster, A.J.; Luo, B. Significant Midlatitude Plasma Density Peaks and Dual-Hemisphere SED During the 10–11 May 2024 Super Geomagnetic Storm. J. Geophys. Res. Space Phys. 2024, 129, e2024JA033360. [Google Scholar] [CrossRef]
  35. Foster, J.C.; Erickson, P.J.; Nishimura, Y.; Zhang, S.R.; Bush, D.C.; Coster, A.J.; Meade, P.E.; Franco-Diaz, E. Imaging the May 2024 Extreme Aurora with Ionospheric Total Electron Content. Geophys. Res. Lett. 2024, 51, e2024GL111981. [Google Scholar] [CrossRef]
  36. Themens, D.R.; Elvidge, S.; McCaffrey, A.; Jayachandran, P.T.; Coster, A.; Varney, R.H.; Galkin, I.; Goodwin, L.V.; Watson, C.; Maguire, S.; et al. The High Latitude Ionospheric Response to the Major May 2024 Geomagnetic Storm: A Synoptic View. Geophys. Res. Lett. 2024, 51, e2024GL111677. [Google Scholar] [CrossRef]
  37. Evans, J.S.; Correira, J.; Lumpe, J.D.; Eastes, R.W.; Gan, Q.; Laskar, F.I.; Aryal, S.; Wang, W.; Burns, A.G.; Beland, S.; et al. GOLD Observations of the Thermospheric Response to the 10–12 May 2024 Gannon Superstorm. Geophys. Res. Lett. 2024, 51, e2024GL110506. [Google Scholar] [CrossRef]
  38. Spogli, L.; Alberti, T.; Bagiacchi, P.; Cafarella, L.; Cesaroni, C.; Cianchini, G.; Coco, I.; Mauro, D.D.; Ghidoni, R.; Giannattasio, F.; et al. The effects of the May 2024 Mother’s Day superstorm over the Mediterranean sector: From data to public communication. Ann. Geophys. 2024, 67, PA218. [Google Scholar] [CrossRef]
  39. Rideout, W.; Coster, A. Automated GPS processing for global total electron content data. GPS Solut. 2006, 10, 219–228. [Google Scholar] [CrossRef]
  40. Vierinen, J.; Coster, A.J.; Rideout, W.C.; Erickson, P.J.; Norberg, J. Statistical framework for estimating GNSS bias. Atmos. Meas. Tech. 2016, 9, 1303–1312. [Google Scholar] [CrossRef]
  41. Eastes, R.W.; McClintock, W.E.; Burns, A.G.; Anderson, D.N.; Andersson, L.; Codrescu, M.; Correira, J.T.; Daniell, R.E.; England, S.L.; Evans, J.S.; et al. The Global-Scale Observations of the Limb and Disk (GOLD) Mission. Space Sci. Rev. 2017, 212, 383–408. [Google Scholar] [CrossRef]
  42. Eastes, R.W.; Solomon, S.C.; Daniell, R.E.; Anderson, D.N.; Burns, A.G.; England, S.L.; Martinis, C.R.; McClintock, W.E. Global-Scale Observations of the Equatorial Ionization Anomaly. Geophys. Res. Lett. 2019, 46, 9318–9326. [Google Scholar] [CrossRef]
  43. Cai, X.; Wang, W.; Eastes, R.W.; Qian, L.; Pedatella, N.M.; Aa, E.; Zhang, S.; Coster, A.; Daniell, R.E.; McClintock, W.E. Equatorial Ionization Anomaly Discontinuity Observed by GOLD, COSMIC-2, and Ground-Based GPS Receivers’ Network. Geophys. Res. Lett. 2023, 50, e2023GL102994. [Google Scholar] [CrossRef]
  44. Wu, K.; Xu, J.; Xiong, C.; Yuan, W. Edge Plasma Enhancements of Equatorial Plasma Depletions Observed by All-Sky Imager and the C/NOFS Satellite. J. Geophys. Res. Space Phys. 2018, 123, 8835–8849. [Google Scholar] [CrossRef]
  45. Manoj, C.; Maus, S. A real-time forecast service for the ionospheric equatorial zonal electric field. Space Weather 2012, 10, S09002. [Google Scholar] [CrossRef]
  46. Reinisch, B.W.; Huang, X. Deducing topside profiles and total electron content from bottomside ionograms. Adv. Space Res. 2001, 27, 23–30. [Google Scholar] [CrossRef]
  47. Heilig, B.; Stolle, C.; Kervalishvili, G.; Rauberg, J.; Miyoshi, Y.; Tsuchiya, F.; Kumamoto, A.; Kasahara, Y.; Shoji, M.; Nakamura, S.; et al. Relation of the Plasmapause to the Midlatitude Ionospheric Trough, the Sub-Auroral Temperature Enhancement and the Distribution of Small-Scale Field Aligned Currents as Observed in the Magnetosphere by THEMIS, RBSP, and Arase, and in the Topside Ionosphere by Swarm. J. Geophys. Res. Space Phys. 2022, 127, e2021JA029646. [Google Scholar] [CrossRef]
Figure 1. Temporal variation of (a) the total and southward component of the interplanetary magnetic field (IMF), (b) the solar wind velocity, (c) the solar wind density, (d) the solar wind temperature, (e) the disturbance storm time (Dst) index, and (f) Kp index during 10–12 May 2024. The vertical dashed lines refer to multiple distinct interplanetary shocks.
Remotesensing 16 04290 g001
Figure 2. (ad) Combined maps of GNSS TEC and GOLD nighttime OI 135.6 nm emission radiance (when available) over the American–Atlantic longitude sector at four times between 19:35 UT on 10 May and 00:10 UT on 11 May, overlapping with Swarm A satellite orbits. The geomagnetic latitudes with 15° interval are marked by dashed lines. The stars mark the digisonde locations of Ascension island (A) and Cachoeira Paulista (C). The right sub-panels show the corresponding latitudinal profiles of ionospheric electron density along the Swarm A path.
Remotesensing 16 04290 g002
Figure 3. (ad) Combined maps of GNSS TEC and GOLD nighttime OI 135.6 nm emission radiance (when available) over the American–Atlantic longitude sector at four times between 18:20 UT and 23:25 UT on 10 May, overlapping with DMSP F17 (black) and F18 (purple) satellite orbits. The geomagnetic latitudes with 15° interval are marked by dashed lines. The right sub-panels show the corresponding latitudinal profiles of ionospheric ion density along DMSP F17 and F18 orbits.
Remotesensing 16 04290 g003
Figure 4. TEC keogram as a function of universal time and latitude along 65°W longitude on (a) 9 May, (b) 10 May, and (c) 11 May 2024, respectively. The terminator and geomagnetic latitudes with 15° intervals are marked.
Remotesensing 16 04290 g004
Figure 5. The same as Figure 2, but during the storm recovery phase between 19:10 UT and 23:50 UT on 11 May 2024.
Remotesensing 16 04290 g005
Figure 6. Temporal variations in (a) interplanetary electric field (IEF) and (b) equatorial electric field (EEF) over 60°W for quiet-time (black) and quiet-time plus penetration (red) on 10–11 May 2024.
Remotesensing 16 04290 g006
Figure 7. Digisonde measurements of electron density profile and F2 layer peak height (hmF2) at (a) Ascension island and (b) Cachoeira Paulista on 9–11 May 2024.
Remotesensing 16 04290 g007
Figure 8. Brazil FPI red-line measurements of thermospheric neutral winds in the (ac) meridional and (df) zonal directions on 9–12 May 2024.
Remotesensing 16 04290 g008
Figure 9. (a) Map of O/N2 column ratio measured by TIMED/GUVI on 11 May 2024. Black lines show the satellite orbits, with the corresponding times labeled. (b) Quiet-time O/N2 map as the background reference. (c) Delta O/N2 map.
Remotesensing 16 04290 g009
Disclaimer/Publisher’s Note: The statements, opinions and data contained in all publications are solely those of the individual author(s) and contributor(s) and not of MDPI and/or the editor(s). MDPI and/or the editor(s) disclaim responsibility for any injury to people or property resulting from any ideas, methods, instructions or products referred to in the content.

