1. Introduction
The ionosphere, the highly conductive layer of the Earth’s upper atmosphere, exhibits complex behaviors influenced by various geophysical processes originating from the upper and the lower layers. On one hand, solar activities like solar flares, solar winds, and solar scintillations can release a large amount of energy particles that directly or indirectly affect the formation and features of the Earth’s ionosphere. On the other hand, the ionosphere can also be impacted by natural events and human activities, such as seismic activities, volcanoes, tsunamis, communication, and so on [
1,
2,
3,
4,
5]. However, as a faint factor in the ionosphere, investigations on seismo-ionospheric influences can provide critical insights into understanding the precursory signals preceding seismic activities, as well as the mechanism of lithosphere–atmosphere–ionosphere coupling (LAIC) ([
5,
6,
7],
and references therein). It can also give potential implications for earthquake predictions, a large challenge in the world so far.
Pursuing ionospheric precursors associated with seismic activities has always been the main topic of the development of remote sensing measurements on the Earth. Though ionospheric irregularities prior to the huge American earthquake in Alaska on 28 March 1964, were reported as early as 1965 [
8], intensive investigations on ionospheric variations preceding seismic events have gradually become more and more attractive as modern air-born satellite receivers rise, for instance, Predvestnik-E in Russia in 2001, Quake Sat in America in 2003, DEMETER in France in 2004, SWARM in Europe in 2013, and so on. From then on, investigations of seismo-ionospheric influences have been focused on the quantitative temporal–spatial evolution of features instead of simple qualitative identifications of anomalies, as well as on the detailed LAI coupling process. The crucial properties of the seismo-ionospheric influence mainly include the occurrence time, location, and corresponding varying magnitude of the precursory signals.
Pulinets et al. [
9] have presented that the occurrence probability of an ionospheric anomaly within 5 days is 73% for magnitude five earthquakes (EQs) and 100% for magnitude six ones, and the spatial scale of the ionospheric effect on strong EQs is near 20° in longitude, as well as in latitude. Parrot [
10,
11] has reported that variations in ionospheric parameters registered via the DEMETER satellite before the real EQs increase apparently compared with those attained from randomly generated EQs. Utilizing different stages of DEMETER measurements of electrical fields, Němec et al. [
12,
13] and Píša et al. [
14,
15] have reported that a statistical ionospheric influence obviously appeared 4 h before strong EQs. Heavy research has been focused on the seismo-ionospheric influence since the Wenchuan
MS 8.0 earthquake took place on 12 May 2008, in China and anomalous information has been increasingly explored at least for ionospheric parameters monitored by the ground-based ionosonde, DEMETER satellite, ground-based GPS receivers, six microsatellites of FORMOSAT3/COSMIC (F3/C), and the CHAMP satellite. Li et al. [
16] have made a summary of these measurements and reported that ionospheric variations with amplitudes of 20–123% appeared primarily one month, mainly two weeks, and collectively within one week prior to the main event. The GPS TEC anomalies happened within a range of 20° in the southeast around the epicenter area, as well as in its magnetically conjugated area [
17] in space, and their space sizes could extend up to 2850 km in longitude and 1650 km in latitude [
18]. Akhoondzadeh et al. [
19] have analyzed irregularities in the DEMETER ion density and electron density and GPS TEC before four strong earthquakes (EQs) of the 2009 Samoa islands
MW 8.1 EQ, the 2008 Sichuan
MW 7.9 EQ, the 2009 L’Aquila
MW 6.3 EQ, and the 2006 Hormozgan
MW 6.0 EQ during geomagnetically quiet conditions and reported that the positive and negative anomalies appeared 1 to 5 days prior to these events. Furthermore, more details of the variations have also been revealed: 67% for DEMETER parameters and GPS TEC before the Samoa
MW 8.1 EQ; −52% and −37% for ion density and electron density, and −24% for TEC before the Sichuan
MW 7.9; 47% and 15% for electron density and ion density, and 28% for TEC before the L’Aquila
MW 6.3 EQ; and 36% for electron density and 21.5% for TEC before the Hormozgan
MW 6.0 EQ. These varied amplitudes tend to illustrate the fact that changed ionospheric amplitudes increase as the magnitudes of the considered EQs increase.
A large number of investigations of the seismo-ionospheric influence seem to reach a common sense that ionospheric information easily happens two weeks prior to the seismic events and it can be considered as a short-term precursor, while the specified location where these precursory signals tend to appear has not been confirmed yet possibly due to the low spatial resolution and dependence of the local time of satellite observations.
An automatic detection method to detect DEMETER perturbations in the main seismic belt areas was initially developed by Li and Parrot [
20] and then was improved to search for DEMETER and CSES perturbations globally with a prolonged space size [
21,
22,
23,
24,
25,
26,
27]. It was revealed that ionospheric perturbations with a large magnitude, like |
A|> 100%, and a large space size, like
t > 200 s, can well establish large-scale ionosphere structures, such as the equatorial ionization anomaly (EIA), the Weddle sea anomaly (WSA), the South Atlantic Magnetic Anomaly (SAMA), and so on [
25,
26,
27]. To correlate moderate ionospheric perturbations to strong low-mid latitude earthquakes with a specified time and space window, like a 15 day delay and 1500 km from epicenters, the statistical results show that, in time, the ionospheric effect mainly appears within 5 days prior to EQs for both electron density and ion density and shifts 500–700 km from the mid–low-latitude epicenters instead of right above them, which highly complies theoretically with the physical seismo-ionospheric model based on a zonal electric field propagating along magnetic lines [
27].
However, we have to mention the fact that satellites, like DEMETER and CSES, have their own revisiting periods and their observations heavily depend on the local time. Meanwhile, their orbit heights (660 km for DEMETER and 500 km for CSES) are far from the altitude of 200–400 km where electrons concentrate and the apparent seismic ionospheric influence easily occurs [
28]. These properties possibly prevent a comprehensively established seismo-ionospheric feature. Pulinets [
29] have reported three main ionospheric features marked by low-latitude earthquakes: magnetic conjugacy for major cases, longitudinal asymmetry of ionospheric abnormity related to the vertical projection of epicenters, and an equatorial orientation anomaly reaction (i.e., 30°–40° latitude). And these large-scale configurations imply only one mechanism of gaseous emanations, such as radon, from the Earth’s crust.
Though the right amplitude and space size of a seismo-ionospheric variation have not been established, perturbations with a magnitude less than 100% and a space size less than 120 s can well depict the temporal–spatial characteristics of the seismo-ionospheric effect [
27]. These promising results could contribute to the development of more reliable earthquake prediction methods and be integrated into existing earthquake prediction frameworks to enhance its accuracy.
The CSES satellite was successfully launched on 2 February 2018. Some data have been tentatively considered as candidates during earthquake prediction practice to search for possible precursory signals preceding seismic activities in China since the end of April 2020. The contouring method was primarily utilized to process weekly plasma data measured via the CSES satellite. Obvious ionospheric irregularities were successfully put forward 14 days prior to the 22 May 2021, Maduo
MS 7.4 EQ, and 11 days prior to the 8 January 2022, Menyuan
MS 6.9 EQ [
24]. However, the contouring method has gradually shown its shortcomings during the CSES tracing work: high-amplitude anomalies could cover low ones, that is, the contouring map cannot reveal all positive and negative anomalous points in the total map. Under these conditions, an automatic detection method has been alternatively put into service after the last Wushi
MS 7.1 earthquake occurred on 23 January 2024, and obvious plasma variations were successfully detected during its aftershocks. So, in this paper, the CSES satellite is introduced in
Section 2. In
Section 3, the automatic detection method and its use in data processing are presented. The total tracing process of possible CSES plasma precursors before several strong aftershocks of the Wushi
MS 7.1 earthquake by the automatic detection method is described in detail in
Section 4. The Discussion and Conclusions are provided in
Section 5 and
Section 6, respectively.
3. Automatic Detection Method
An automatic detection method has been primarily developed into software to search and identify ionospheric variations when dealing with large amounts of plasma data measured by the DEMETER satellite since 2012 [
20]. Investigations of the relationship between automatically searched ionospheric perturbations and strong earthquakes globally have been continuously conducted [
21,
22,
23,
24,
25,
26,
27,
33,
34]. The software has been gradually improved from functional modules to an interface during this period to adjust to different data storage formats from DEMETER to the CSES. The interface primarily established in 2012 [
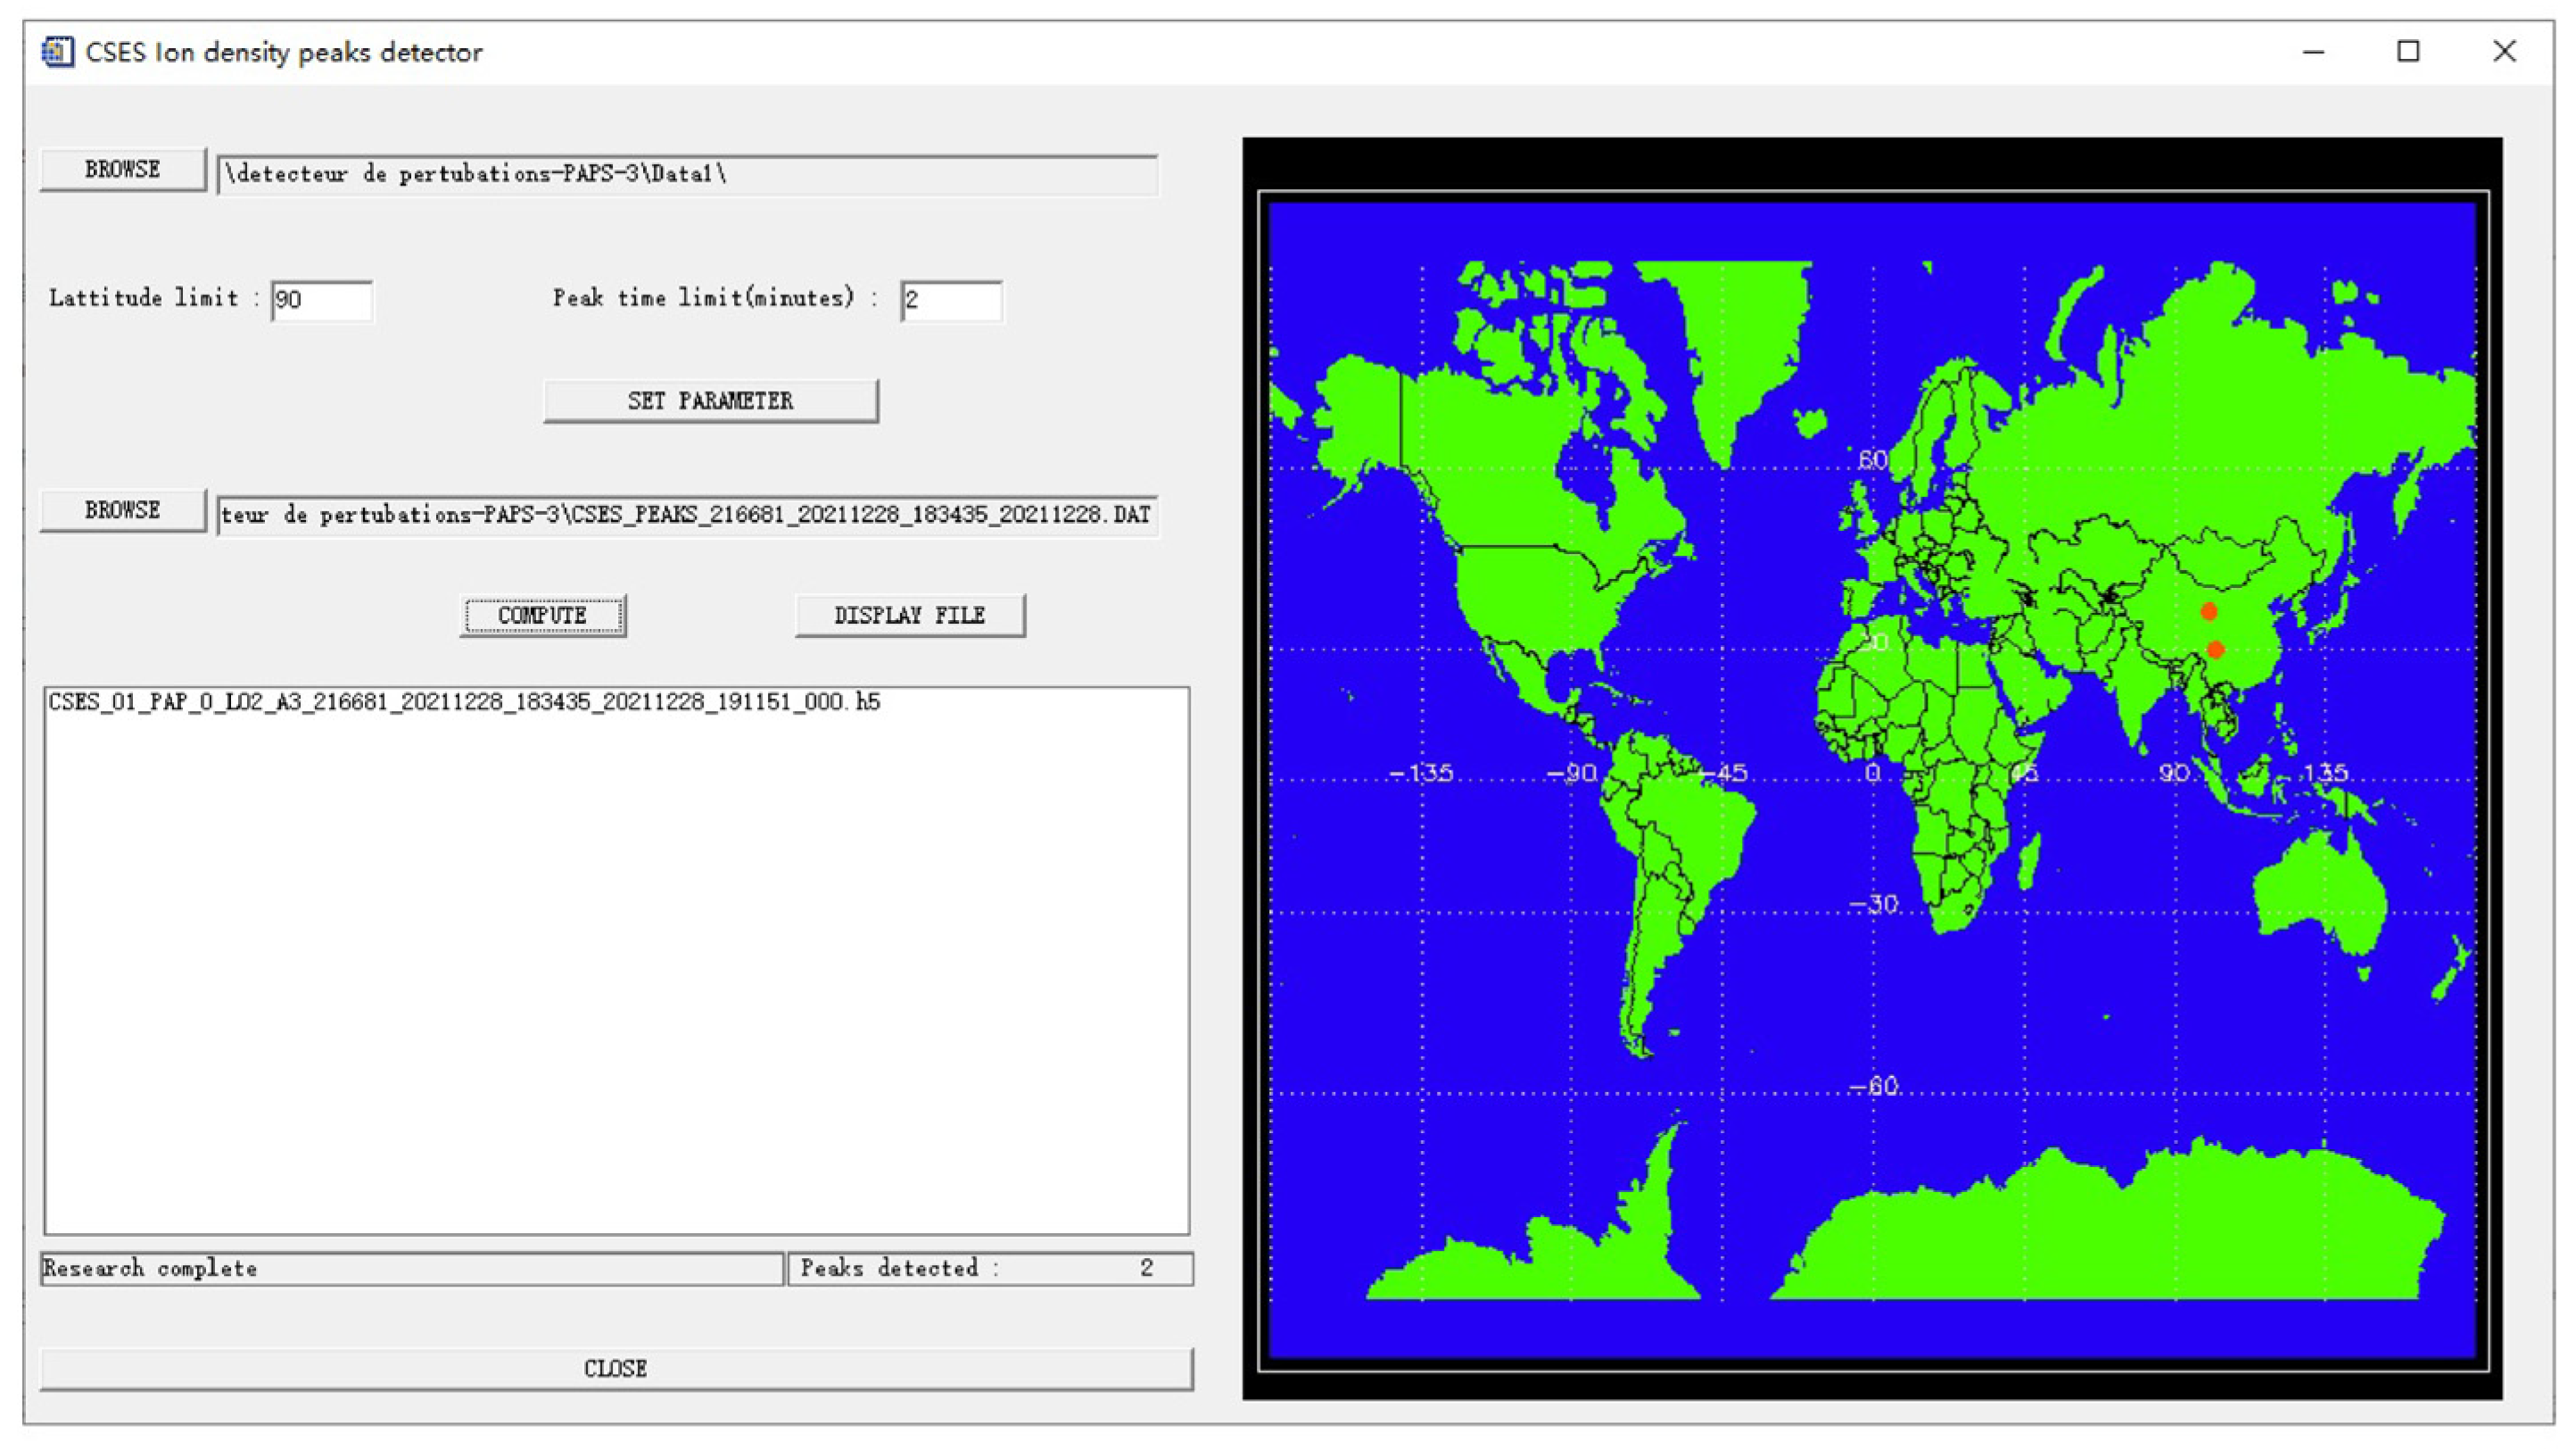
20] has been currently updated for the ion data of the CSES, as shown
Figure 1 (CSES Measured Ionospheric Perturbation Automatic Detection Software V1.0, authorized by National Copyright Administration of the People’s Republic of China on 4 November 2024 under RN. 2024SR1683021 in
https://www.ccopyright.com.cn, accessed on 5 November 2024). Here, two variable parameters have to be specified before running the software: one is the latitude limit that usually is set to 90°. The other is the peak time limit, which stands for the maximum value in minute of space scale of expected plasma perturbations and is generally specified as 2 min for the seismogenic ionospheric influence [
27]. At the same time, the minimum value of the space scale of a perturbation keeps the same value as before and is set to 20 s to ensure that the perturbation has a certain duration to avoid pulse-like variations.
An example has been given here in an effort to present the process of searching ionospheric perturbations using this software. The Level 2 ion density data along night orbit 21668 measured by CSES on 28 December 2021, as an input file has been processed by the software and the output results are only for the O
+ density. The final running interface can be seen in
Figure 1. It is clear from
Figure 1 that two O
+ perturbations (red dots) have been accepted along this orbit.
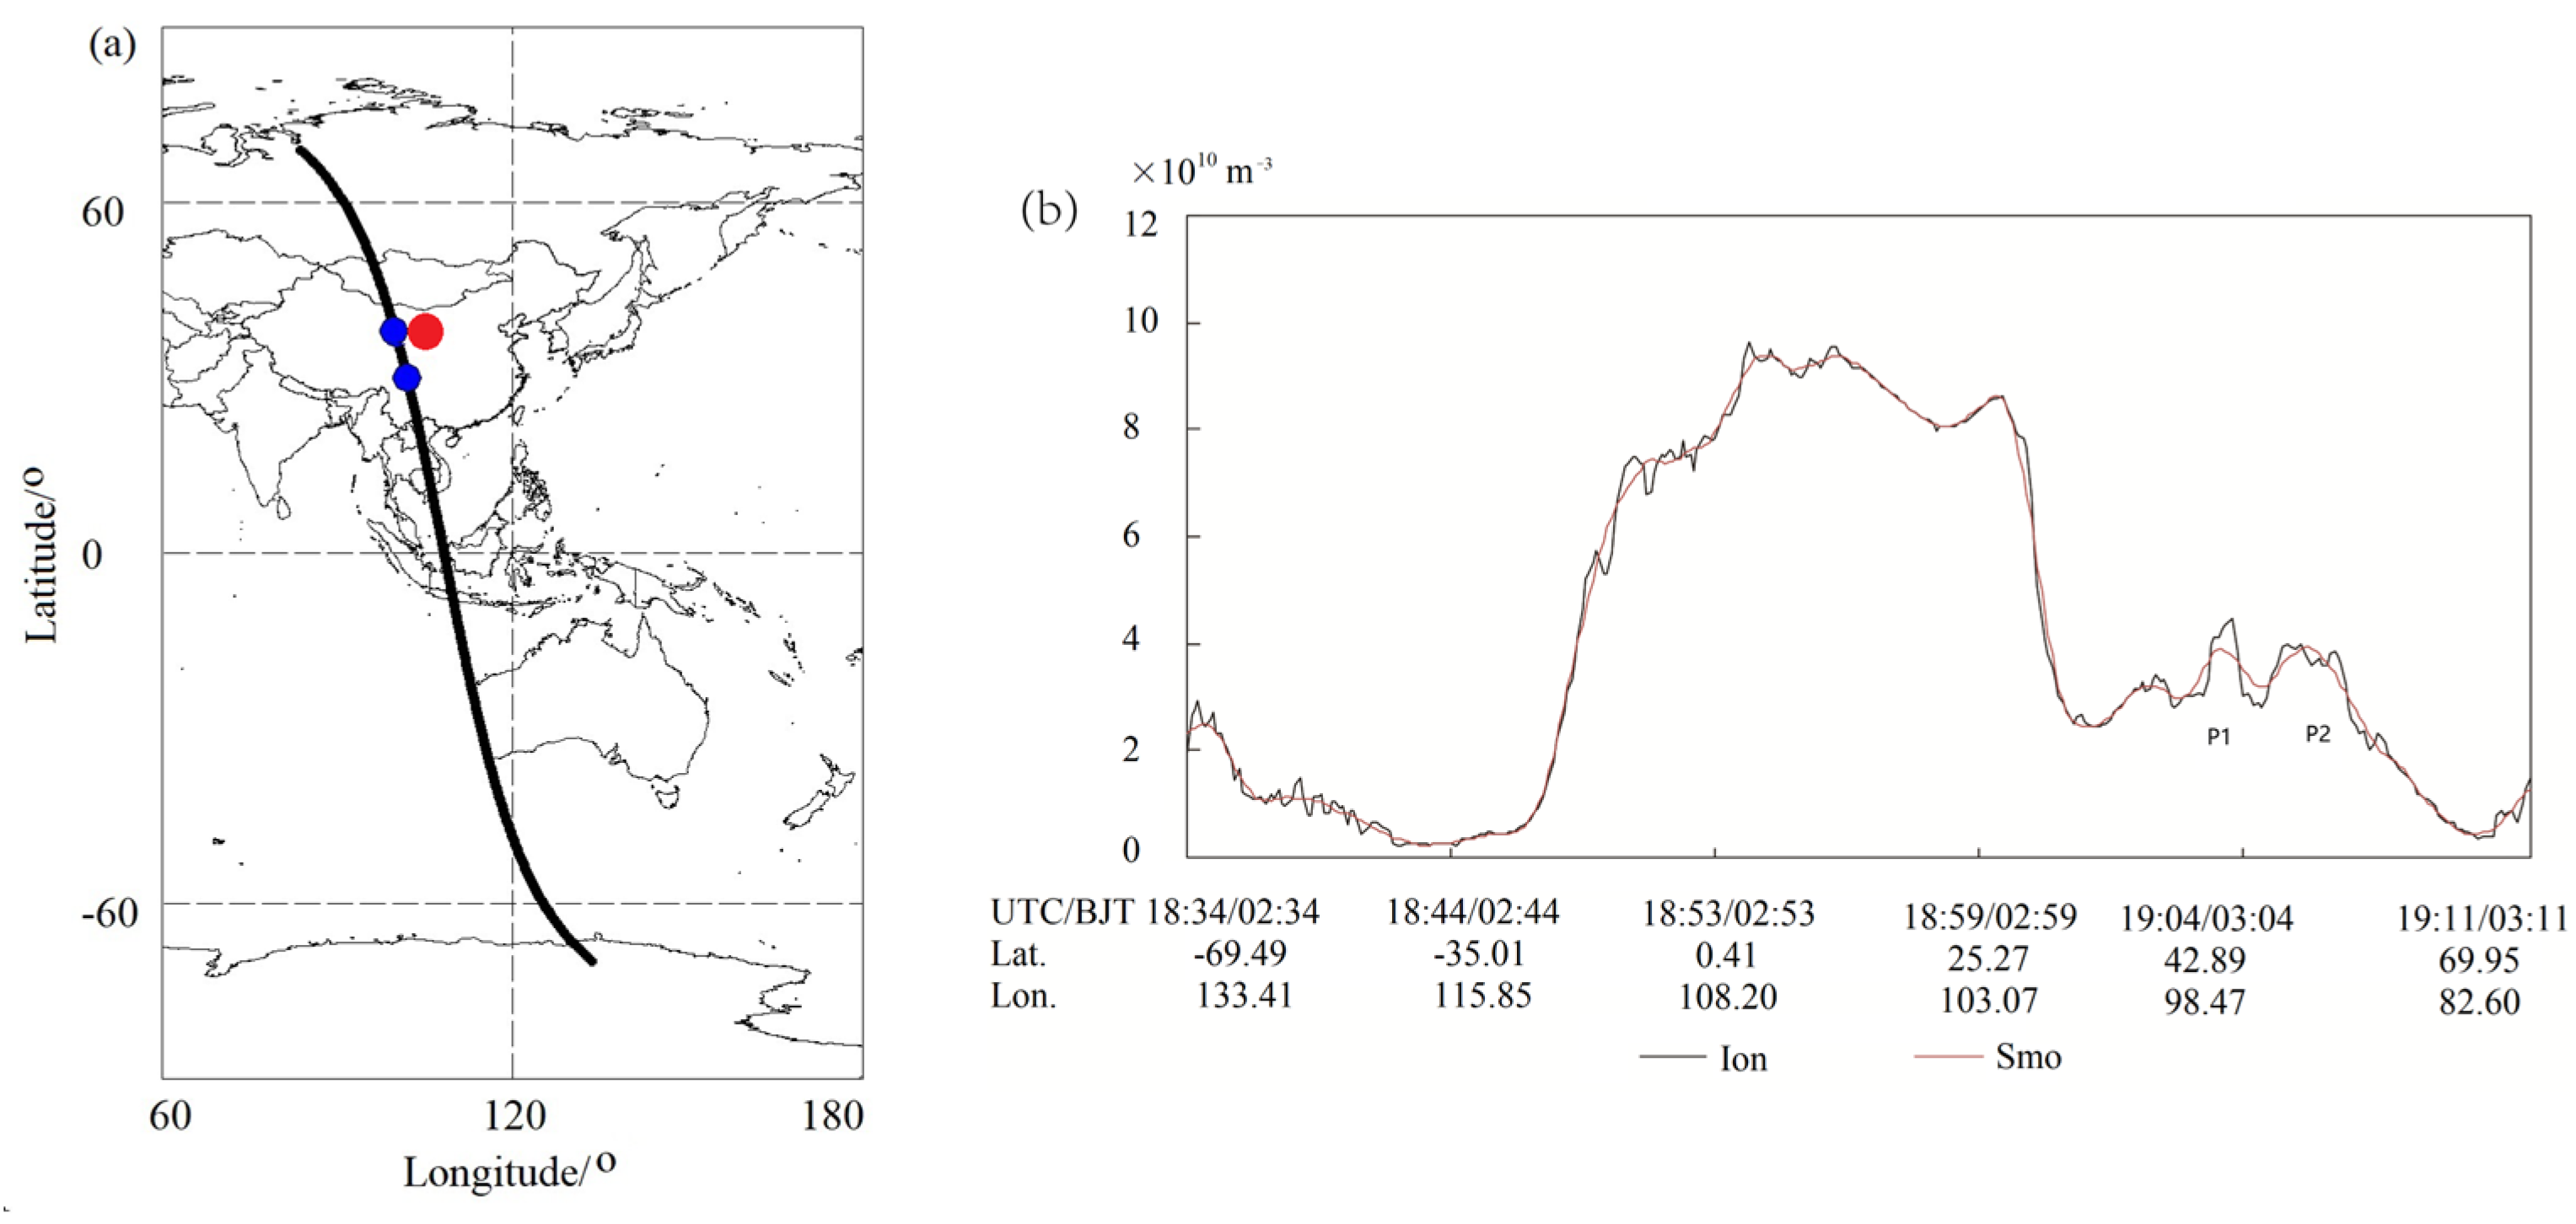
Figure 2a presents the running night orbit 21668 (black dot line) in the map. The two blue dots stand for the same locations of searched perturbations in red shown in
Figure 1, and the red dot is the Menyuan
MS 6.9 earthquake that occurred on 8 January 2022 in northwest China. The recorded O
+ density along this orbit during night time is shown in
Figure 2b as a black line (Ion), and its smoothed data using the SAVGOL function are shown in red (Smo). Two O
+ perturbations complying with the set parameters in
Figure 1 have been successfully searched from the smoothed line (red line in
Figure 2b) and are labelled by P1 and P2 in
Figure 2b. Their corresponding parameters are output in
Table 1. From
Figure 2a and
Table 1, P1 appeared near the epicenter of the 8 January 2022, Menyuan
MS 6.9 earthquake with an enhanced magnitude of 30.1%, and it had been recognized as ionospheric precursor of this event, 11 days before and only 120 km away [
24]. Another perturbation, P2, with a magnitude of 4.1% tended to be a background irregularity [
27].
4. Automatically Searched Plasma Perturbations Before Several Aftershocks of the Wushi MS 7.1 Earthquake
An earthquake with magnitude
MS = 7.1 abruptly hit the Wushi area, Xinjiang province in northwest China at 02:09:05 CST (China Standard Time) on 23 January 2024, with an epicenter located at 41.20°N and 78.72°E and a depth of 22 km. This earthquake locates only 6 km away from a sub-fault of the Maidan fault in the Tianshan seismic belt and the stress originats from the collision between the Indian plate and the Eurasian plate, generating a series of reverse fault seismic activities involving this event. A series of aftershocks successively occurred one by one.
Table 2 shows the information of aftershocks with a magnitude equal to or more than five till 25 February 2024. After that, no shocks with a magnitude more than five happened. From
Table 2, most of the strong aftershocks took place within 3 days after the main shock. Only two aftershocks of
MS 5.3 and an
MS 5.8 took place at the end of February, one month after the last strong aftershock.
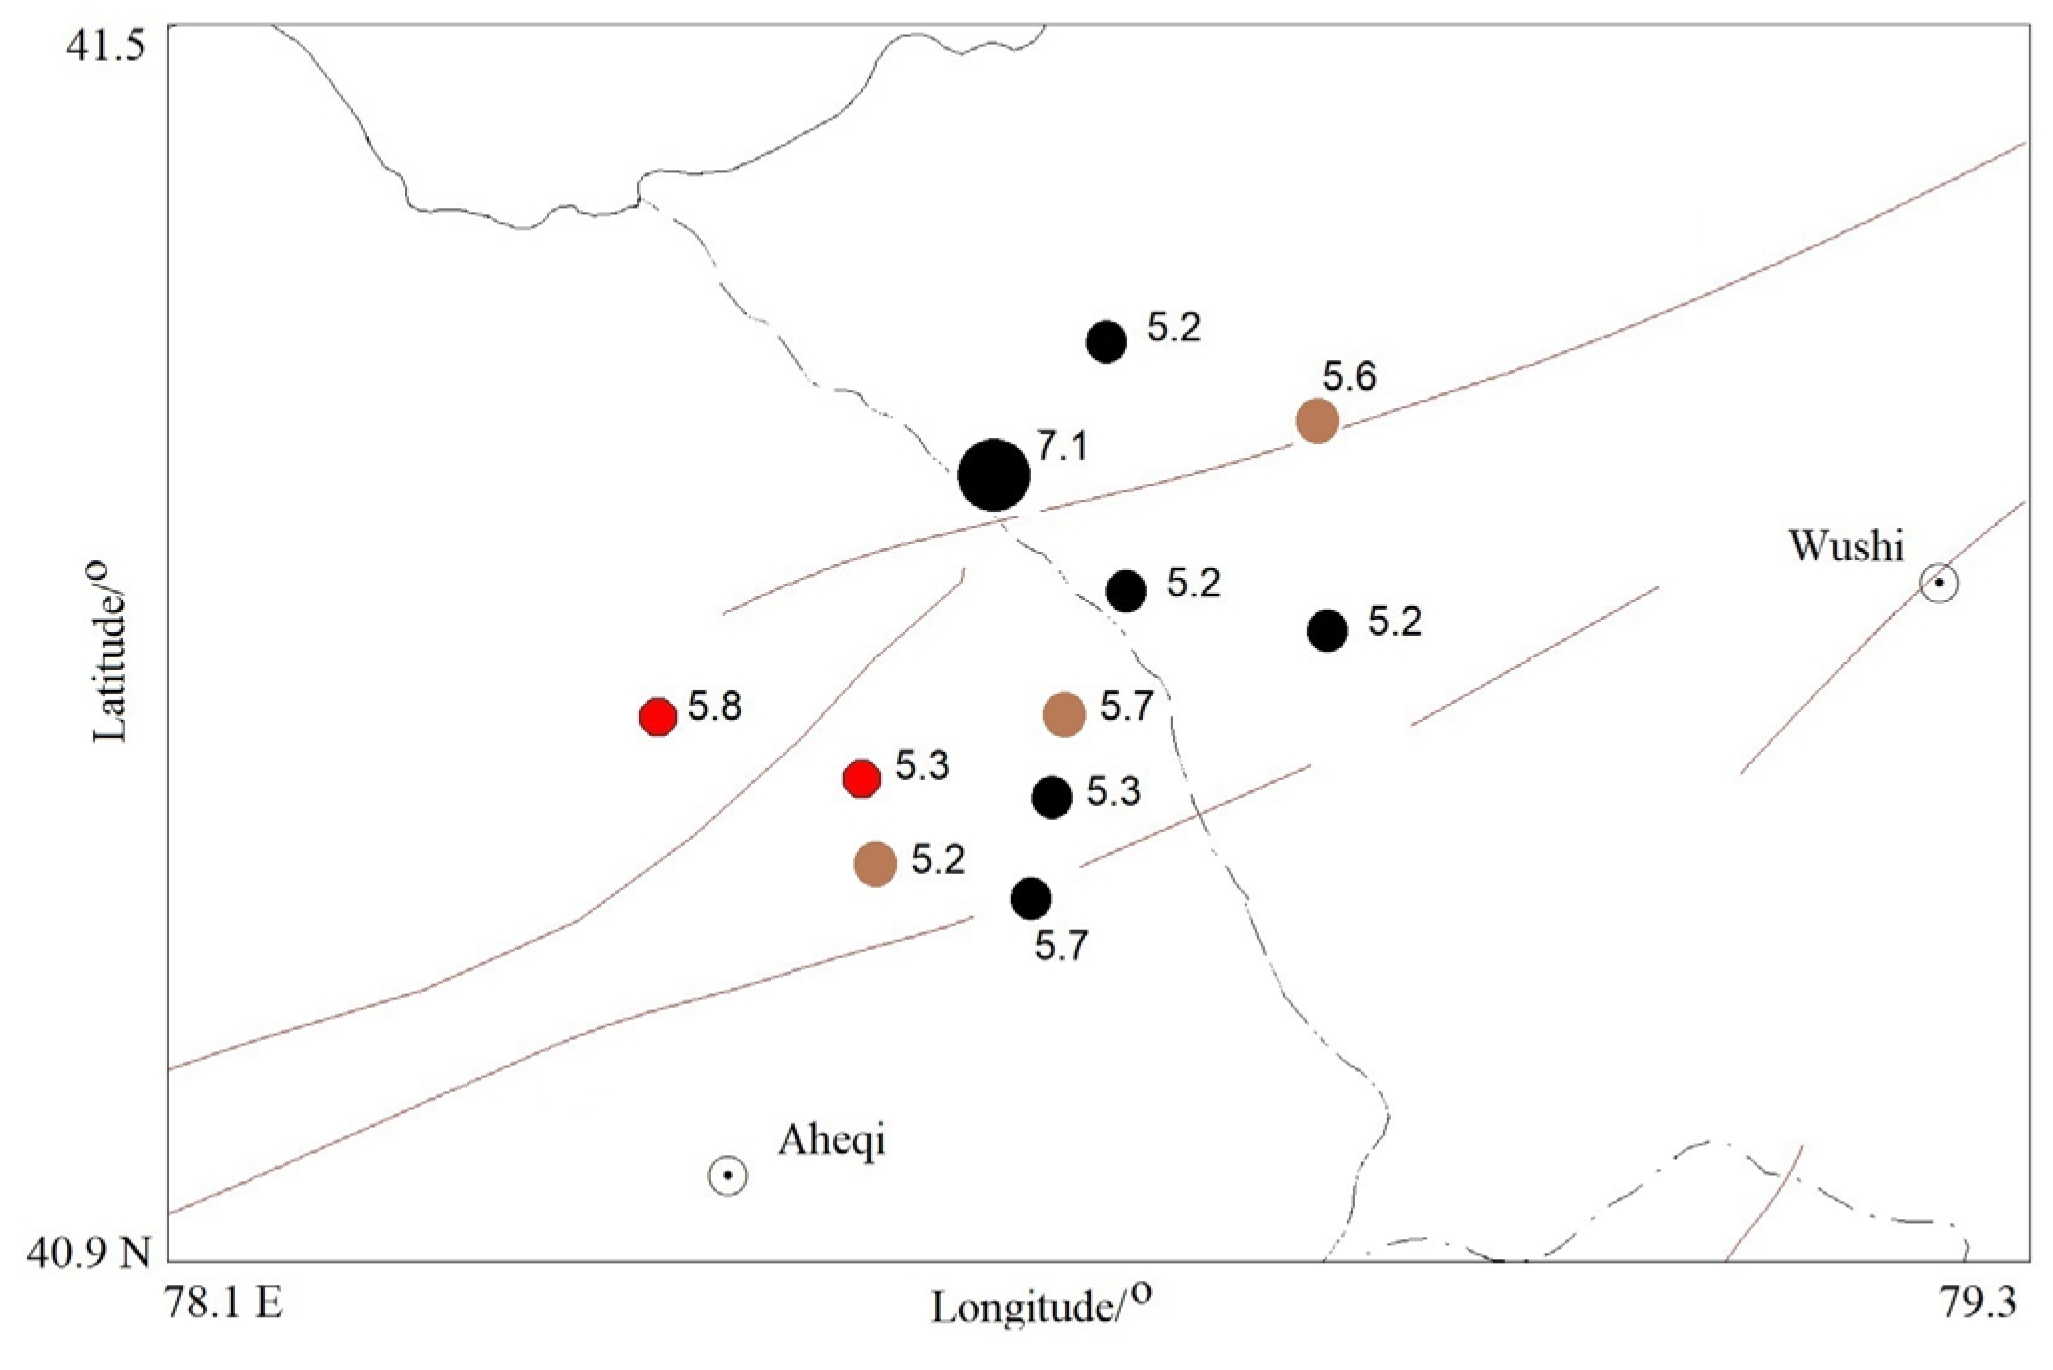
The distribution of this Wushi earthquake sequence is displayed in
Figure 3. The main shock happened in Wushi County and in the north of one reverse sub-fault of the Maidan fault. All aftershocks with a magnitude more than five took place within 20 km from the main shock, while most of them, including the biggest
MS 5.8 aftershock on 25 February, were in the Aheqi area (see
Figure 3). So, in the following part, only the biggest
MS 5.8 aftershock is labelled in
Figure 4 to display its relative location to future detected ionospheric perturbations.
The automatic detection method was put into earthquake prediction service immediately after this Wushi
MS 7.1 event to mainly trace nighttime electron density weekly, as well as the ion (O
+) density as a comparison, to monitor possible precursory signals during impending aftershocks. The electron density is considered as the dominant parameter during this period due to the contaminated sensors on the PAP payload one month after the CSES launch [
35], while positive results from this payload have been reported [
23,
24,
35]. Therefore, it is believed that the corresponding ion perturbations and electron ones are more reliable if one earthquake is detected at the same time by these two parameters [
34].
One point is that perturbations with an amplitude less than 10% are generally ignored due to their variations being merged into the background irregularities of the ionosphere [
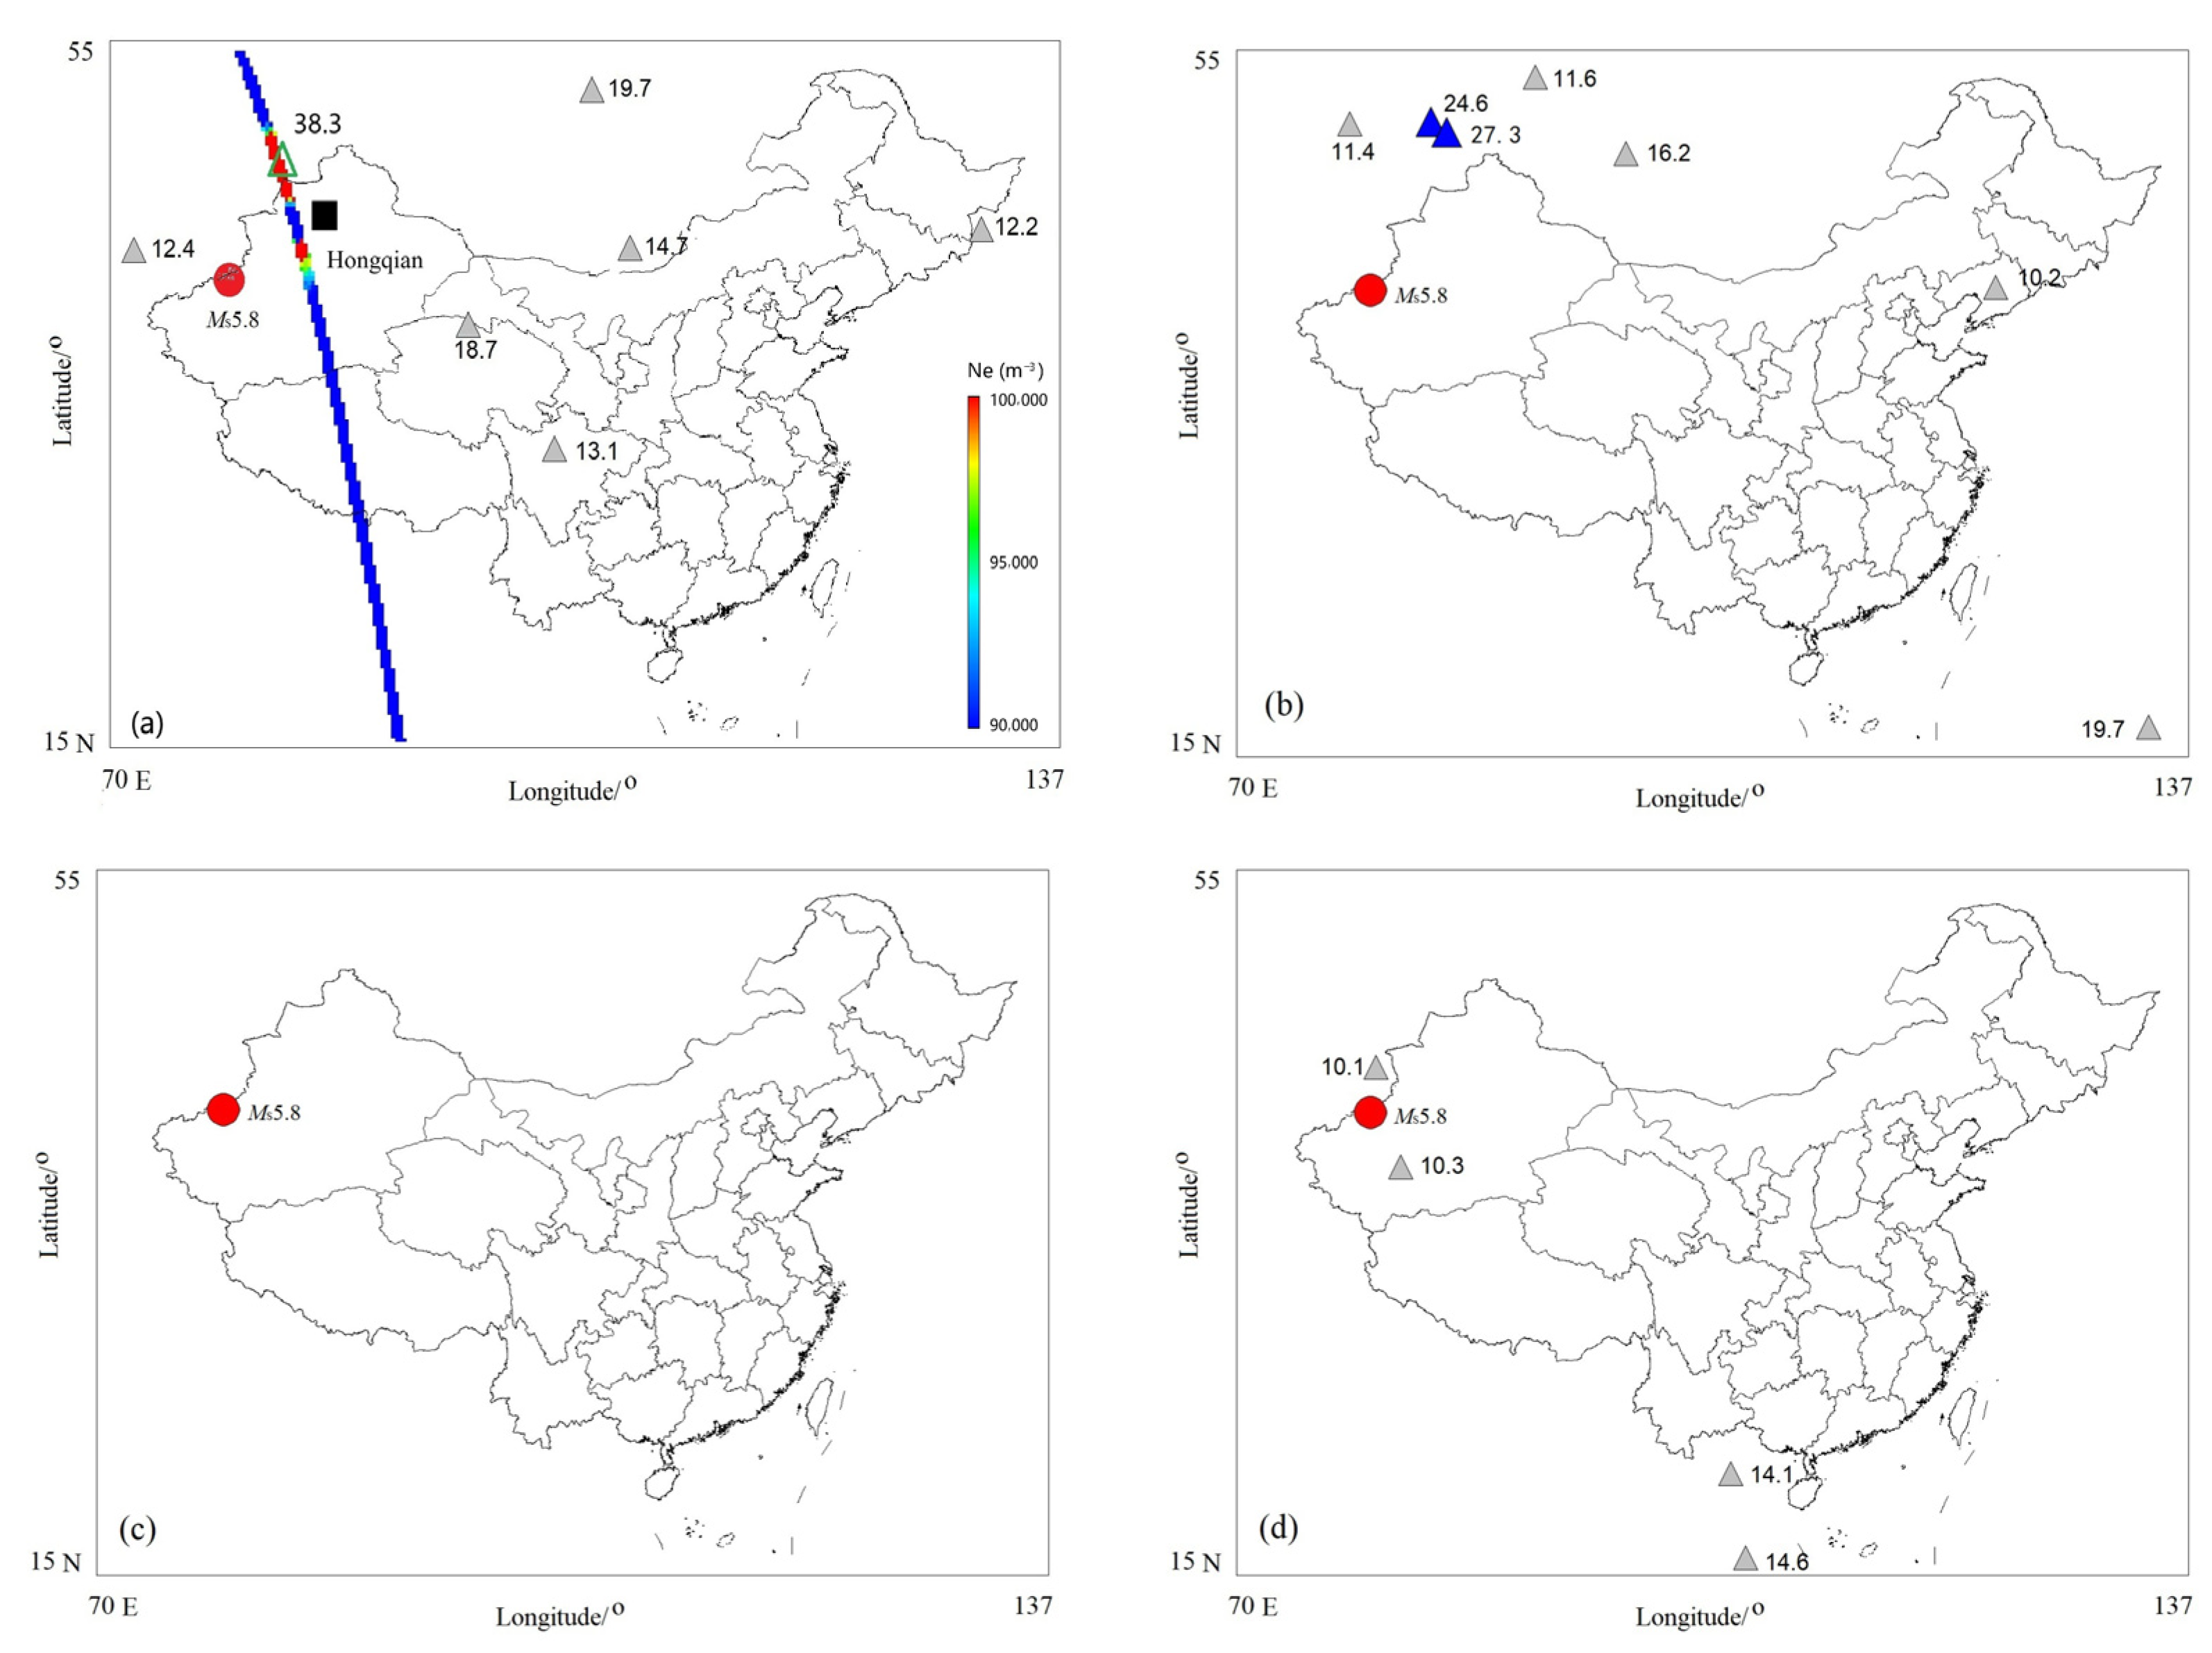
27] when this method is utilized in earthquake prediction practice. While perturbations where this parameter is beyond 20% are usually considered more reliable during this period, it is possible that seismic activities can induce variable amplitude disturbances. Another point is that only perturbations lying in a latitude range of 15–55°N and longitude range of 70–135°E in an area covering all of China are displayed in different colors of grey for referable ones with a amplitude of 10–20% and blue for reliable ones > 20% in the weekly map.
Figure 4 demonstrates the ionospheric perturbations searched automatically via the software week by week from 24 January 2024 after the Wushi main shock to 24 February 2024, one day before the biggest aftershock of
MS 5.8 on 25 February 2024. A plasma perturbation on the electron density was first detected successfully during 24–30 January 2024, and it is shown in
Figure 4a as an empty green triangle. Its related information has been listed in
Table 3 as Pe1. From
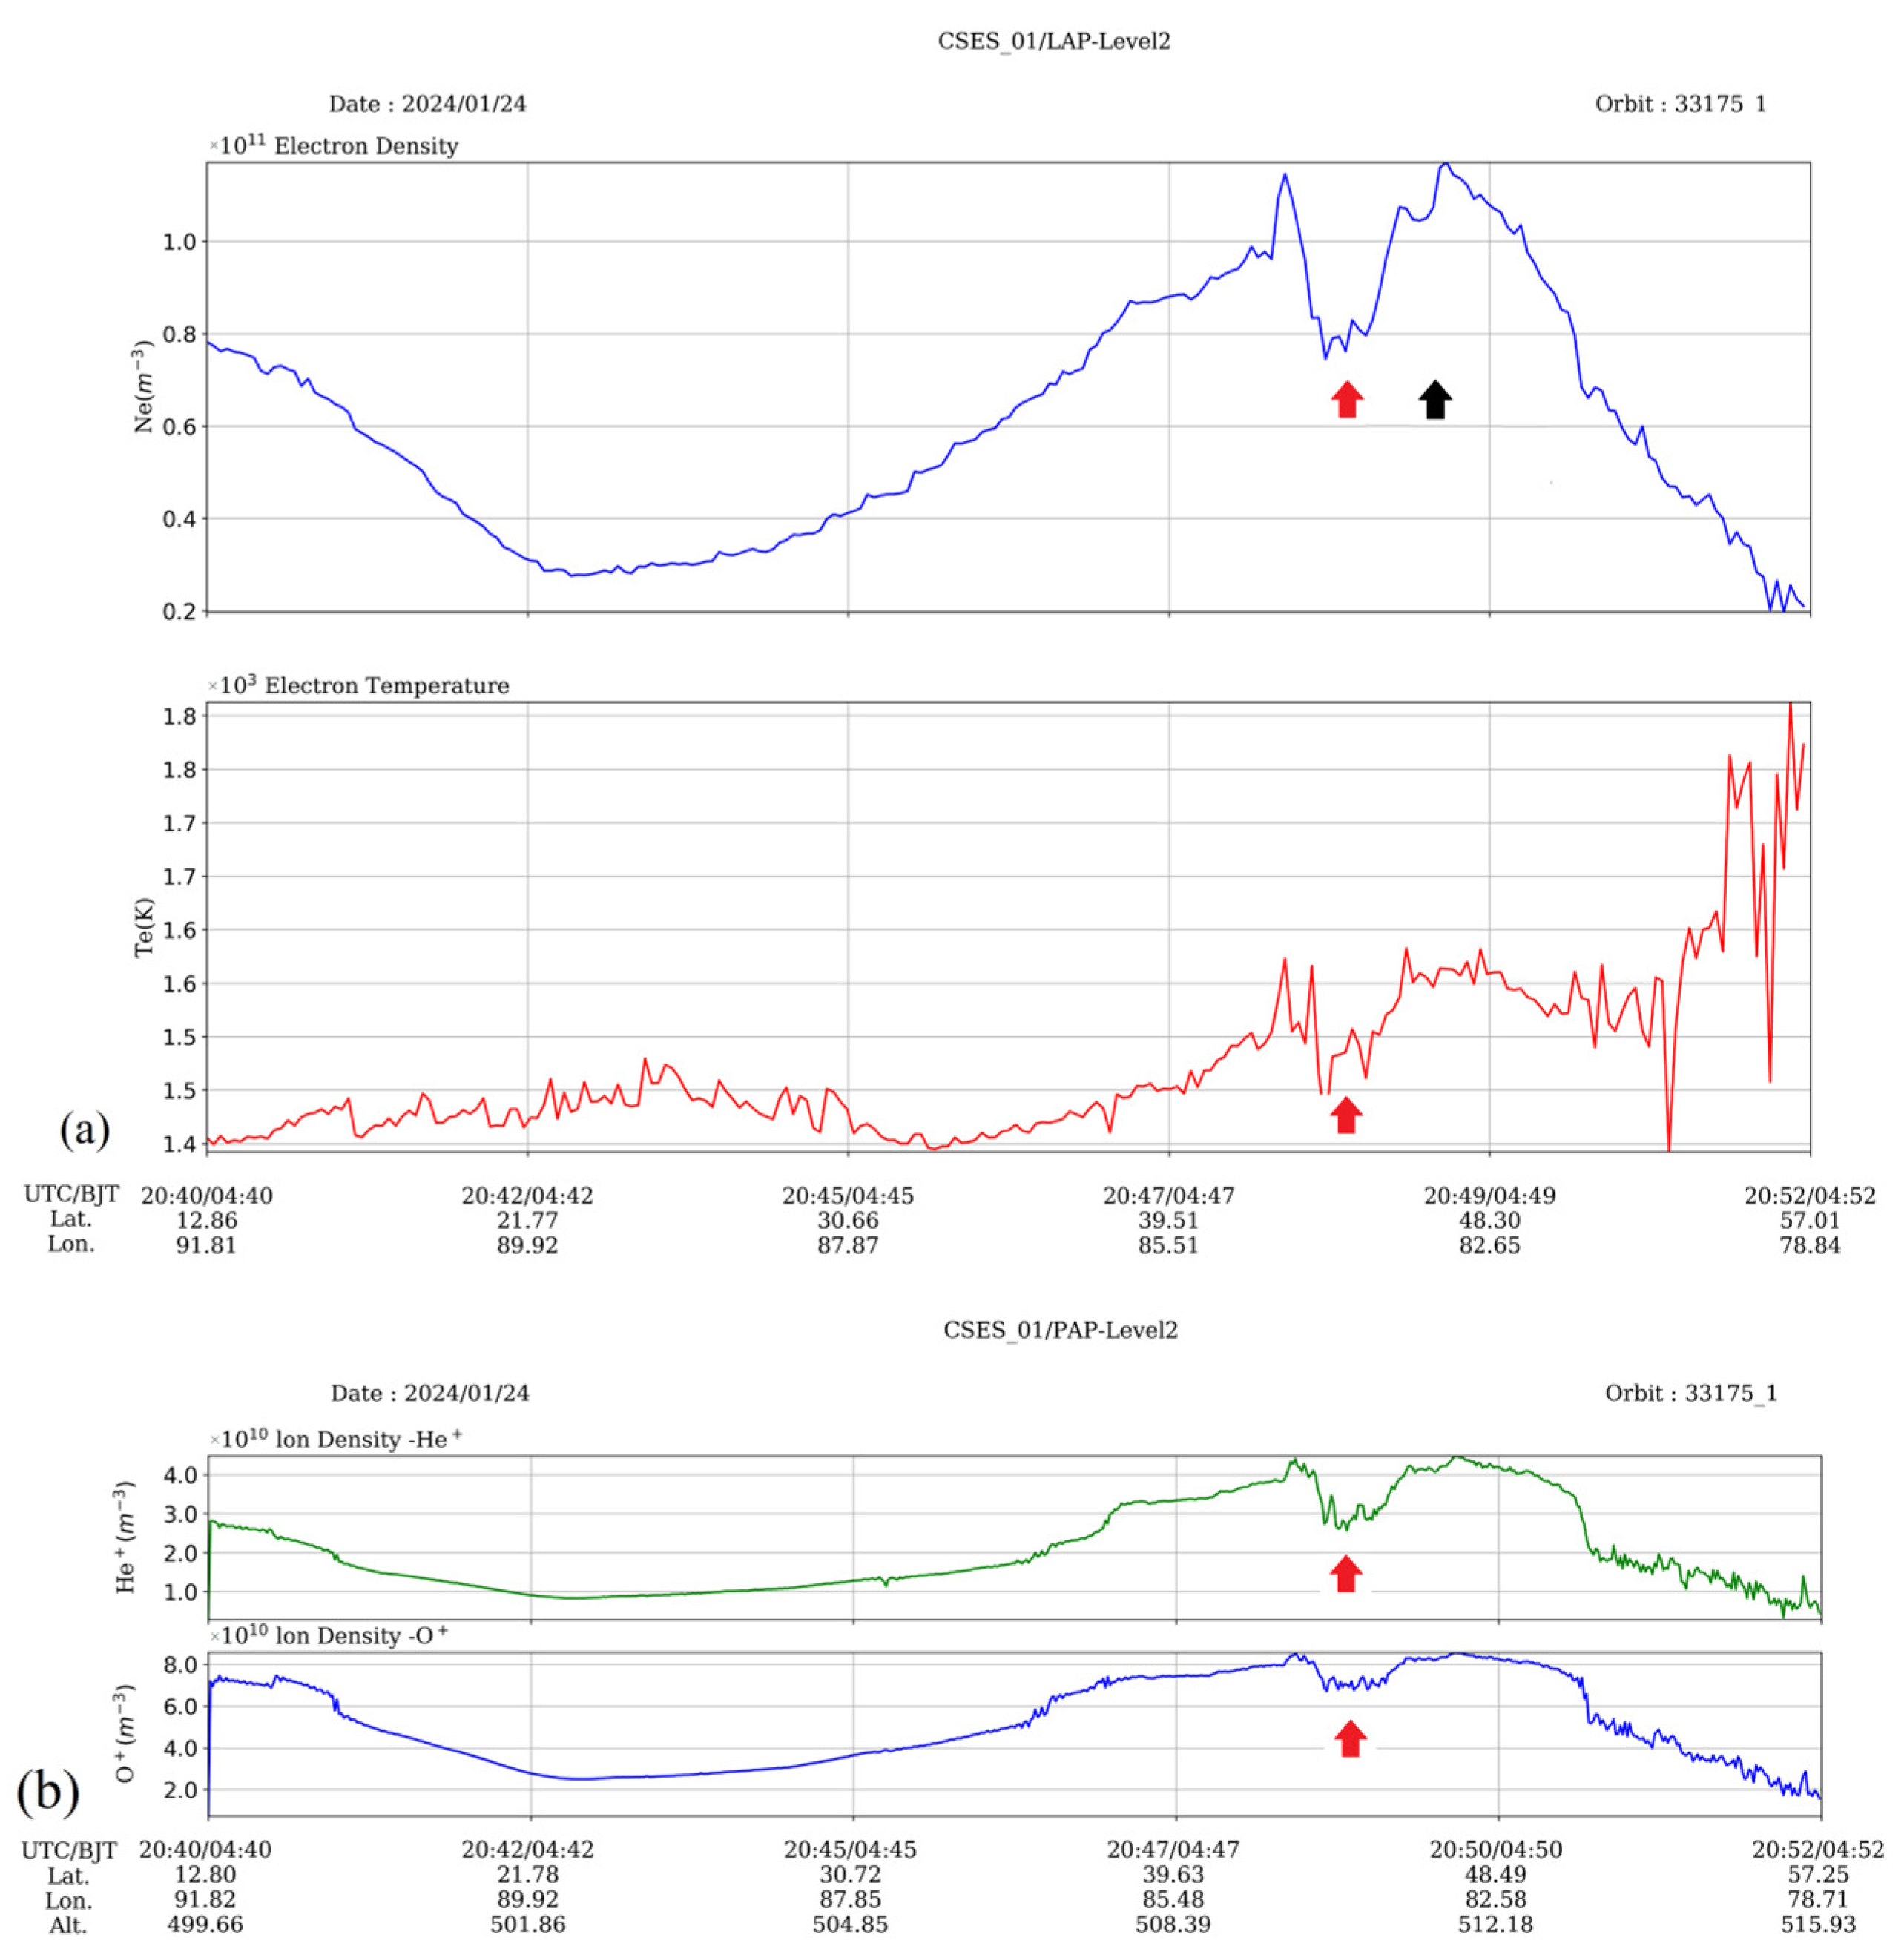
Table 3, it is obvious that this ionospheric irregularity took place on 24 January 2024, in night orbit 33175 with an increased amplitude of 38.3%, which can be considered as a precursory variation because its magnitude was more than 20%. But no ion perturbations were searched at the same orbit, or none at the other orbits covering the considered area in this investigation. At the same time, variations in different plasma parameters like the electron density, electron temperature, as well as ion densities were also examined. Pictures of these parameters from the CSES satellite data processing system are displayed from top to bottom in
Figure 5. In
Figure 5, the detected electron perturbation listed in
Table 3 as Pe1 is labelled with a black arrow in the top panel. From
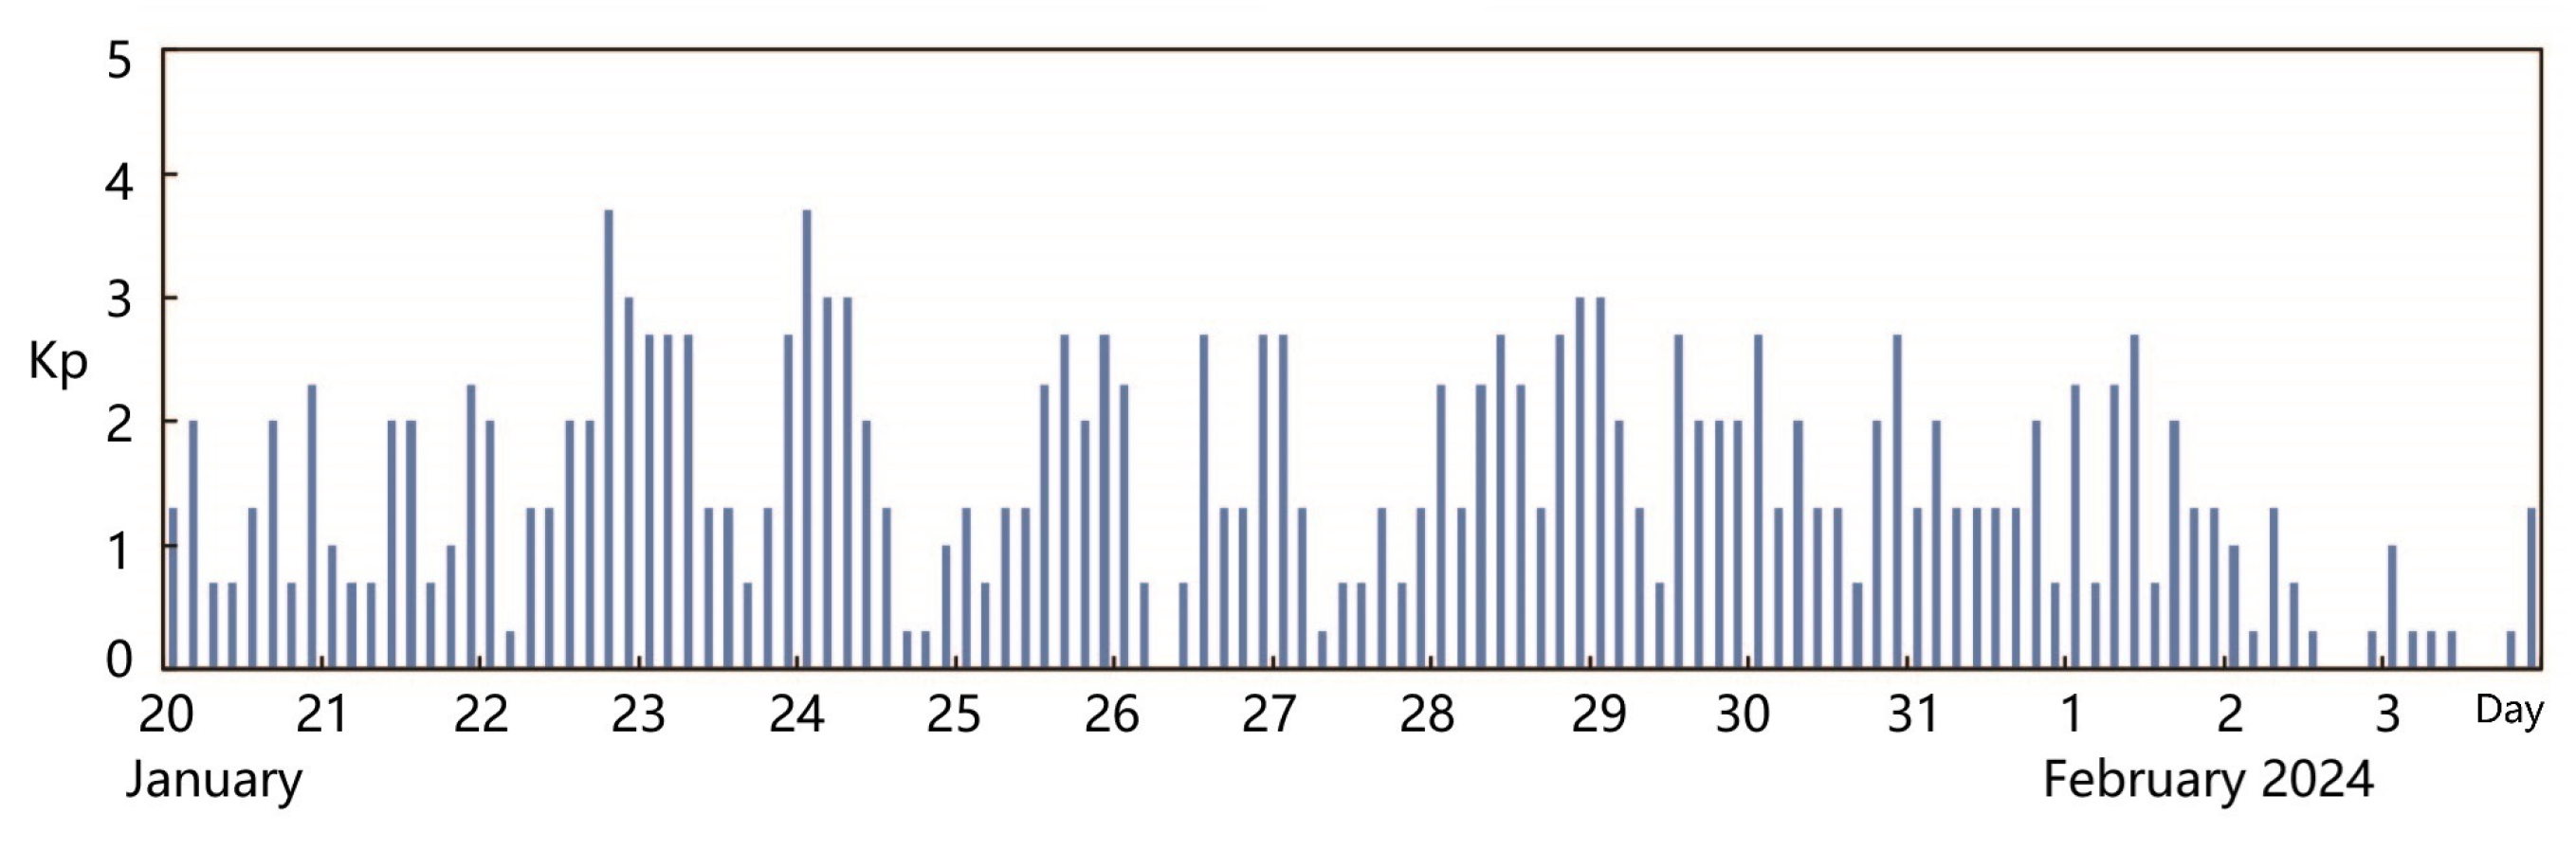
Figure 5, all parameters are totally characterized by a synchronous variation, first a decrease and then an increase, but not all perturbations were detected via the software with a specified space size of 2 min. The Kp index with eight three-hourly averaged values each day was examined from 20 January to 3 February 2024 (
Figure 6) to avoid the ionospheric influence from solar activity. It is clear from
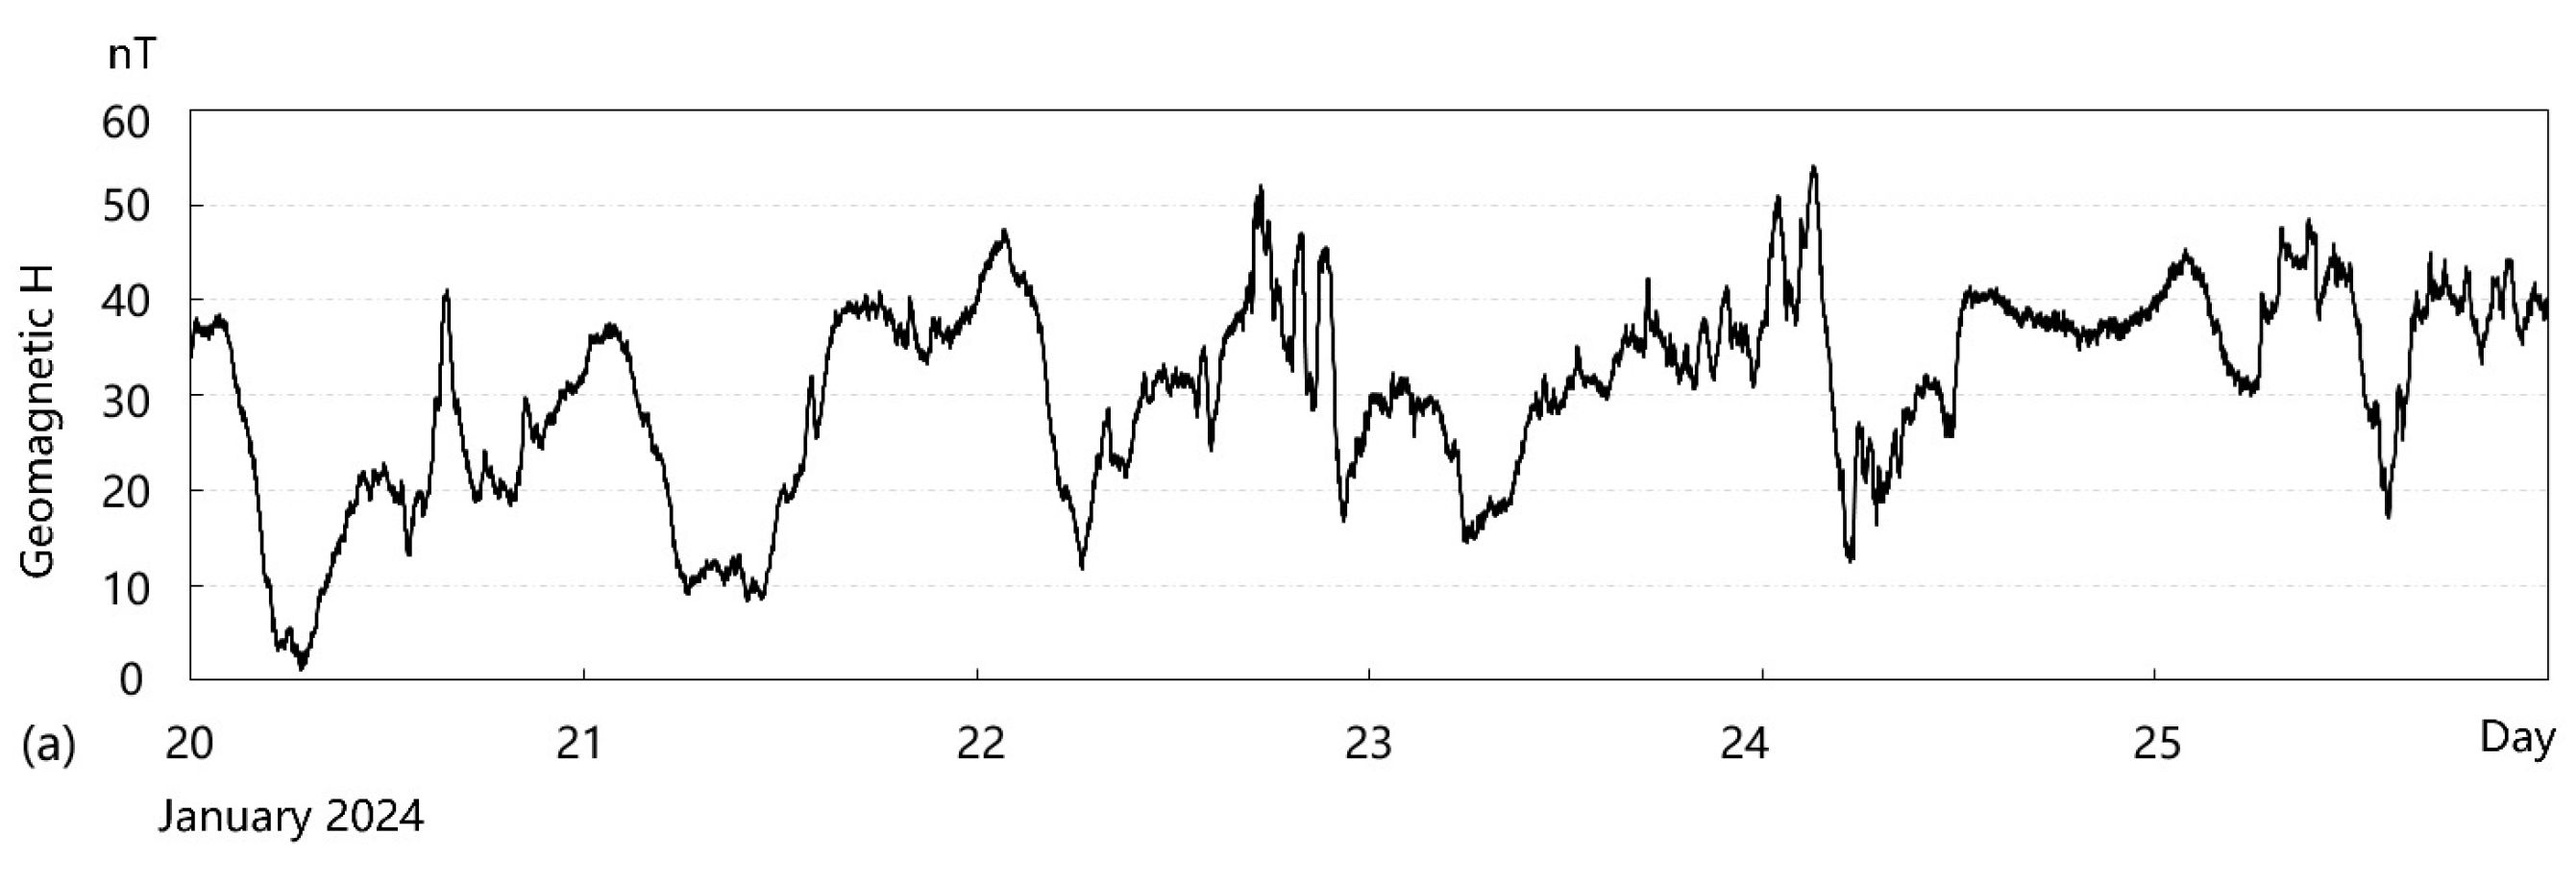
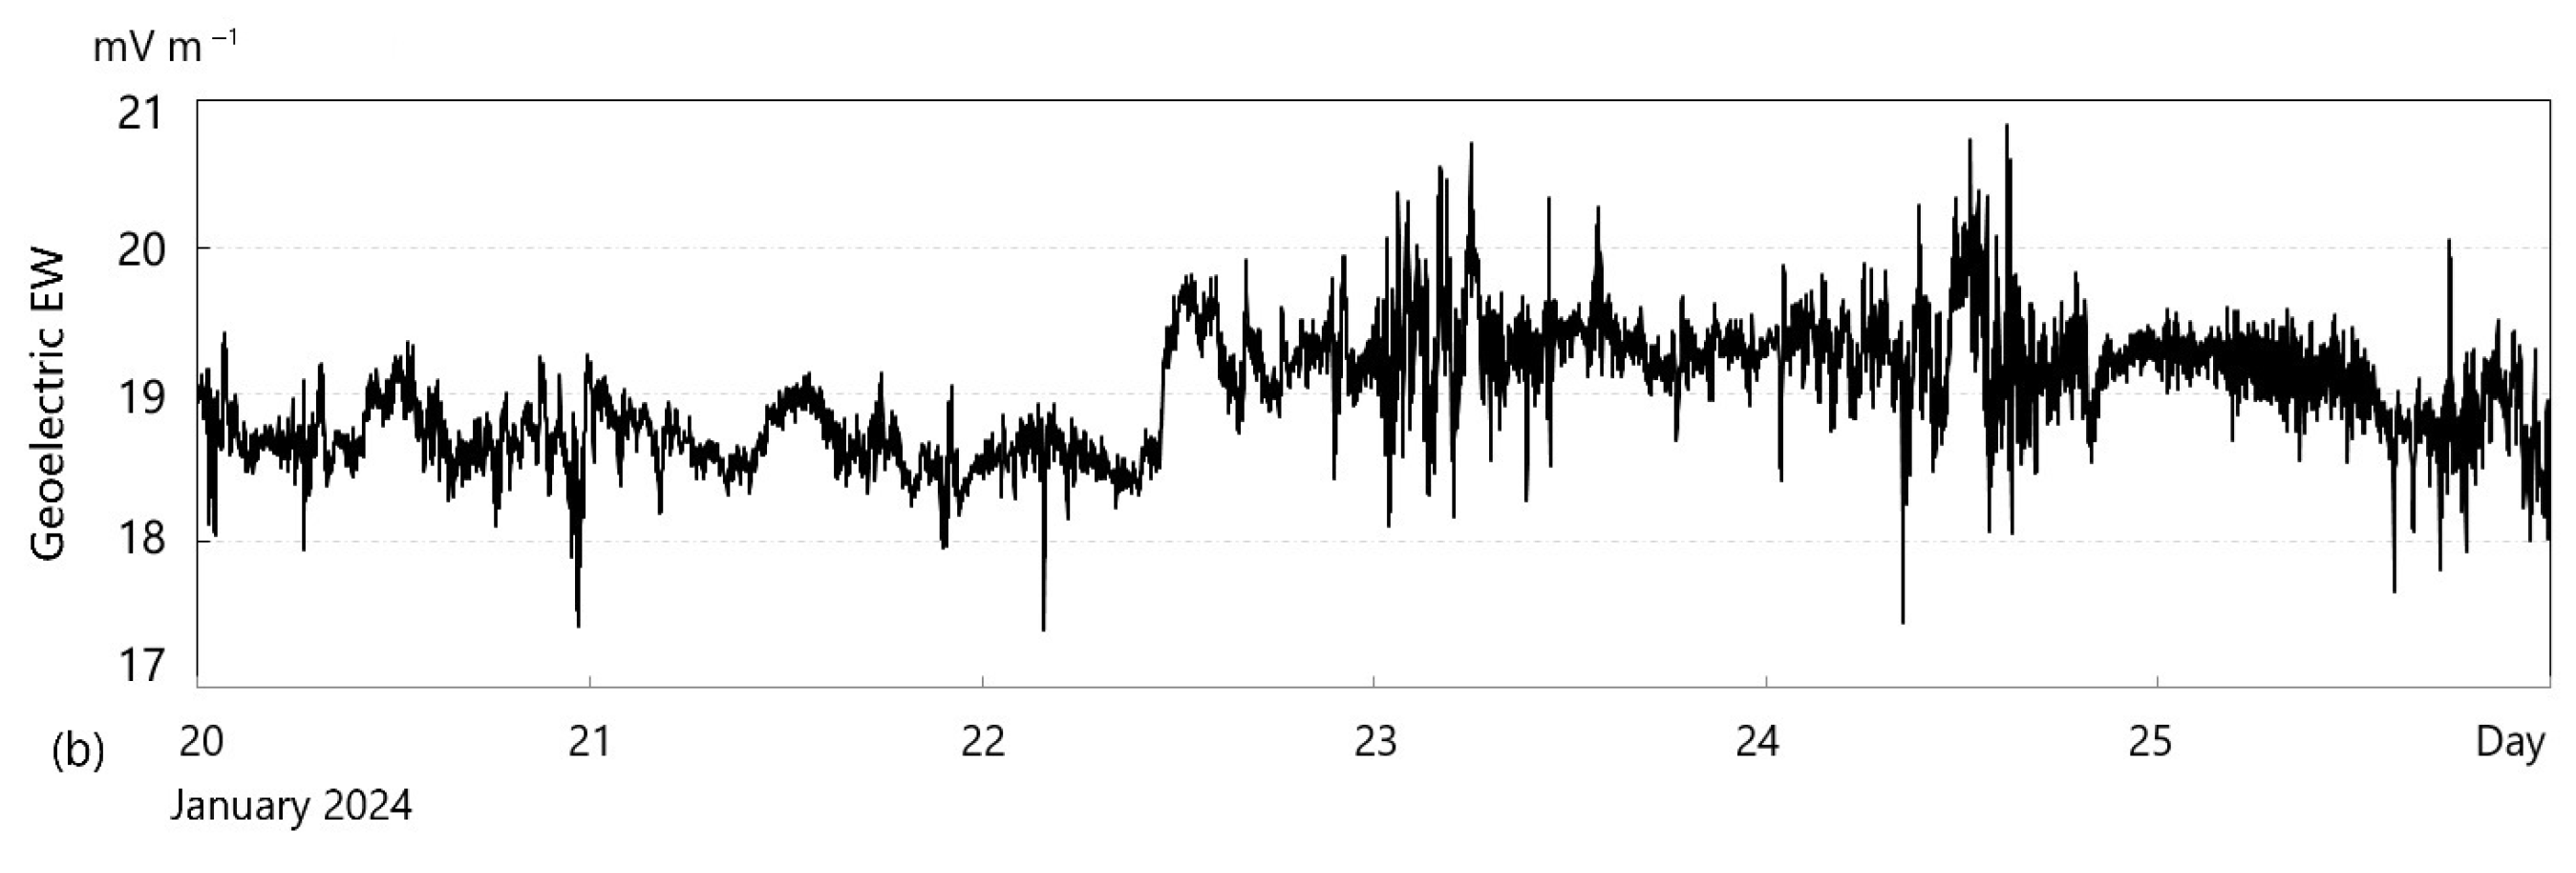
Figure 6 that the Kp value on 23 and 24 January reached 3.7, indicating that ionospheric variations in the same period possibly originated from geomagnetic disturbances. For this reason, we also checked geomagnetic horizontal component H and geoelectric EW (east–west) component during 20–25 January 2024 at the ground-based Hongqian observing station (45.4°N, 84.8°E), only 80 km from the night orbit 33175 (See
Figure 4a), and the fluctuations of these two parameters are shown in
Figure 7. From
Figure 7, obvious perturbed signals appeared for both the geomagnetic H component and geoelectric EW component in the same period when the electron density, as well as other ionospheric parameters, suffered an abrupt decease, which is called electron depletion or a plasma bubble [
36]. This obvious depletion lasted only 1 min, less than 500 km in space. Orbits within 500 km from this plasma bubble orbit have also been examined during 21–25 January 2024 (a total revisiting period), but no similar phenomena happened.
After that, three aftershocks with magnitudes of
MS 5.2,
MS 5.6, and
MS 5.7 took place, respectively, on 25, 26, and 30 January (see
Table 2 and
Figure 3), approximately 700 km away from the location where the electron perturbation was searched on 24 January.
Li et al. [
24] have reported that obvious CSES ionospheric variations appeared 11 days and 6 days (considering a revisiting period of 5 days for the CSES satellite) prior to the 8 January 2022 Menyuan
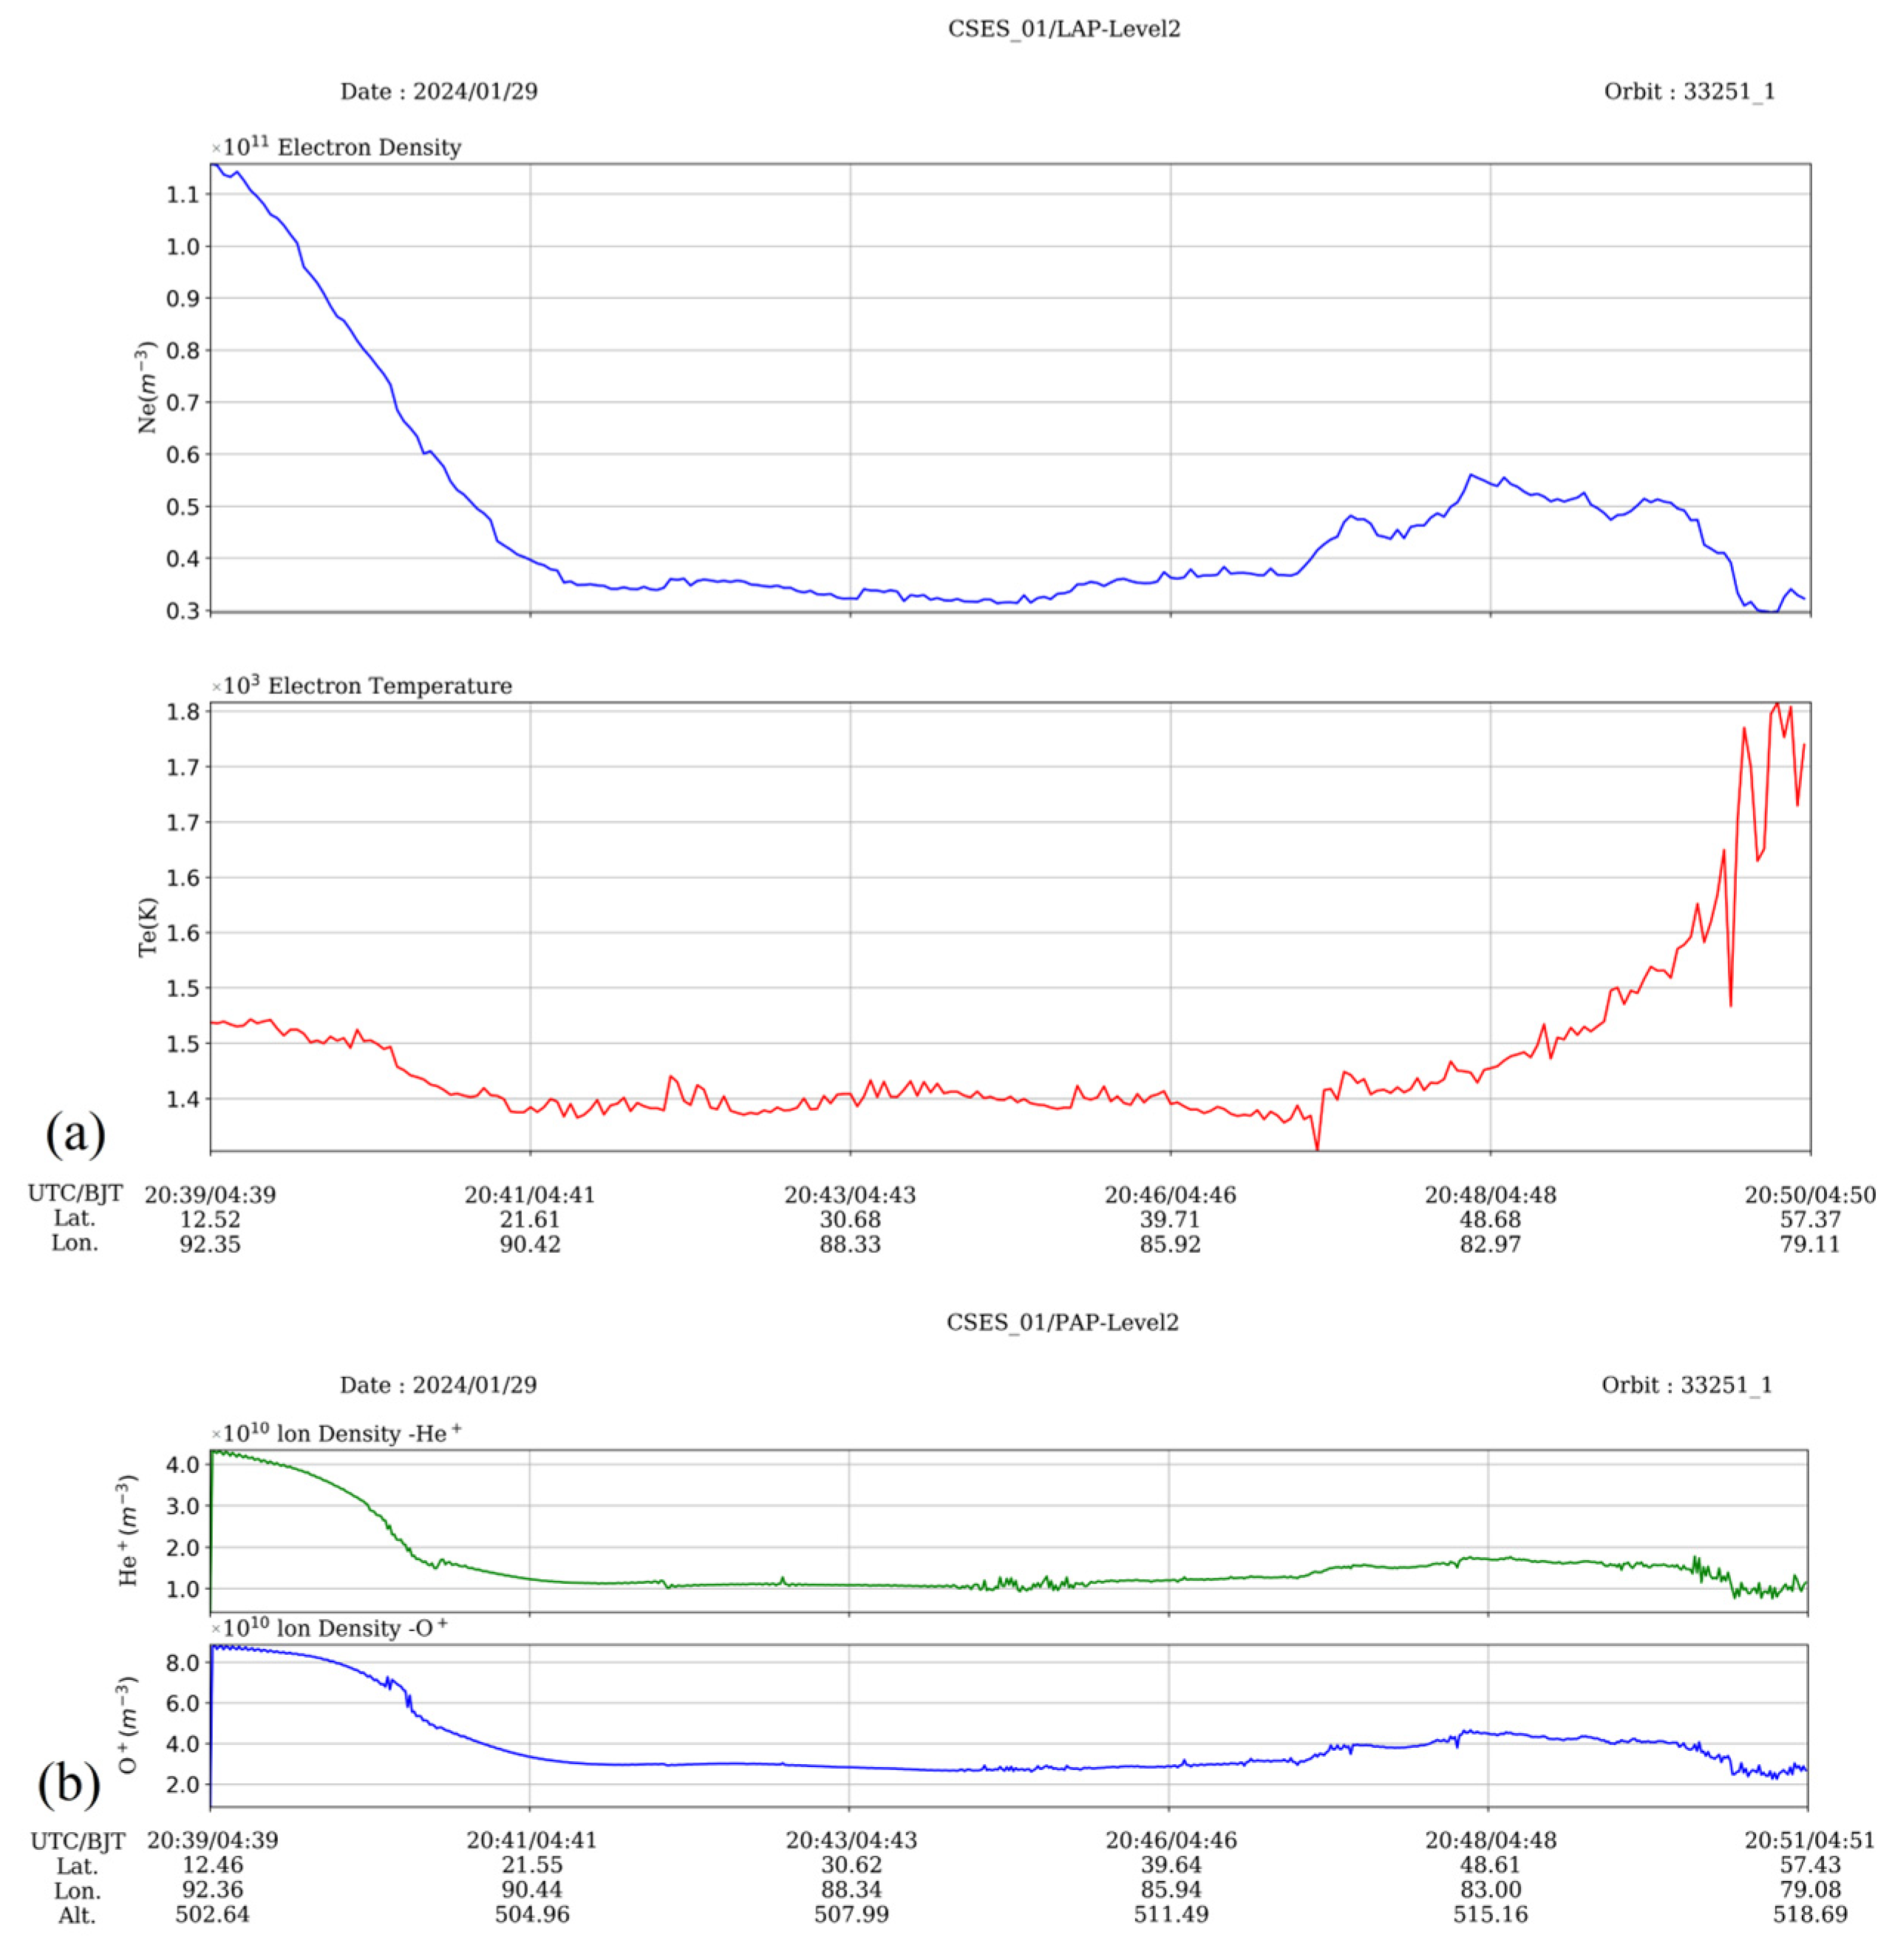
MS 6.9 earthquake. At this time, neither electron perturbations nor ion perturbations were searched on the next revisiting night orbit 33251 on 29 January. Variations in several plasma parameters recorded in this orbit had also been checked and they are exhibited in
Figure 8 with the same arrangement as in
Figure 5. It is clear that no obvious irregularities had been found around the plasma bubble that appeared on the last revisiting orbit 33175.
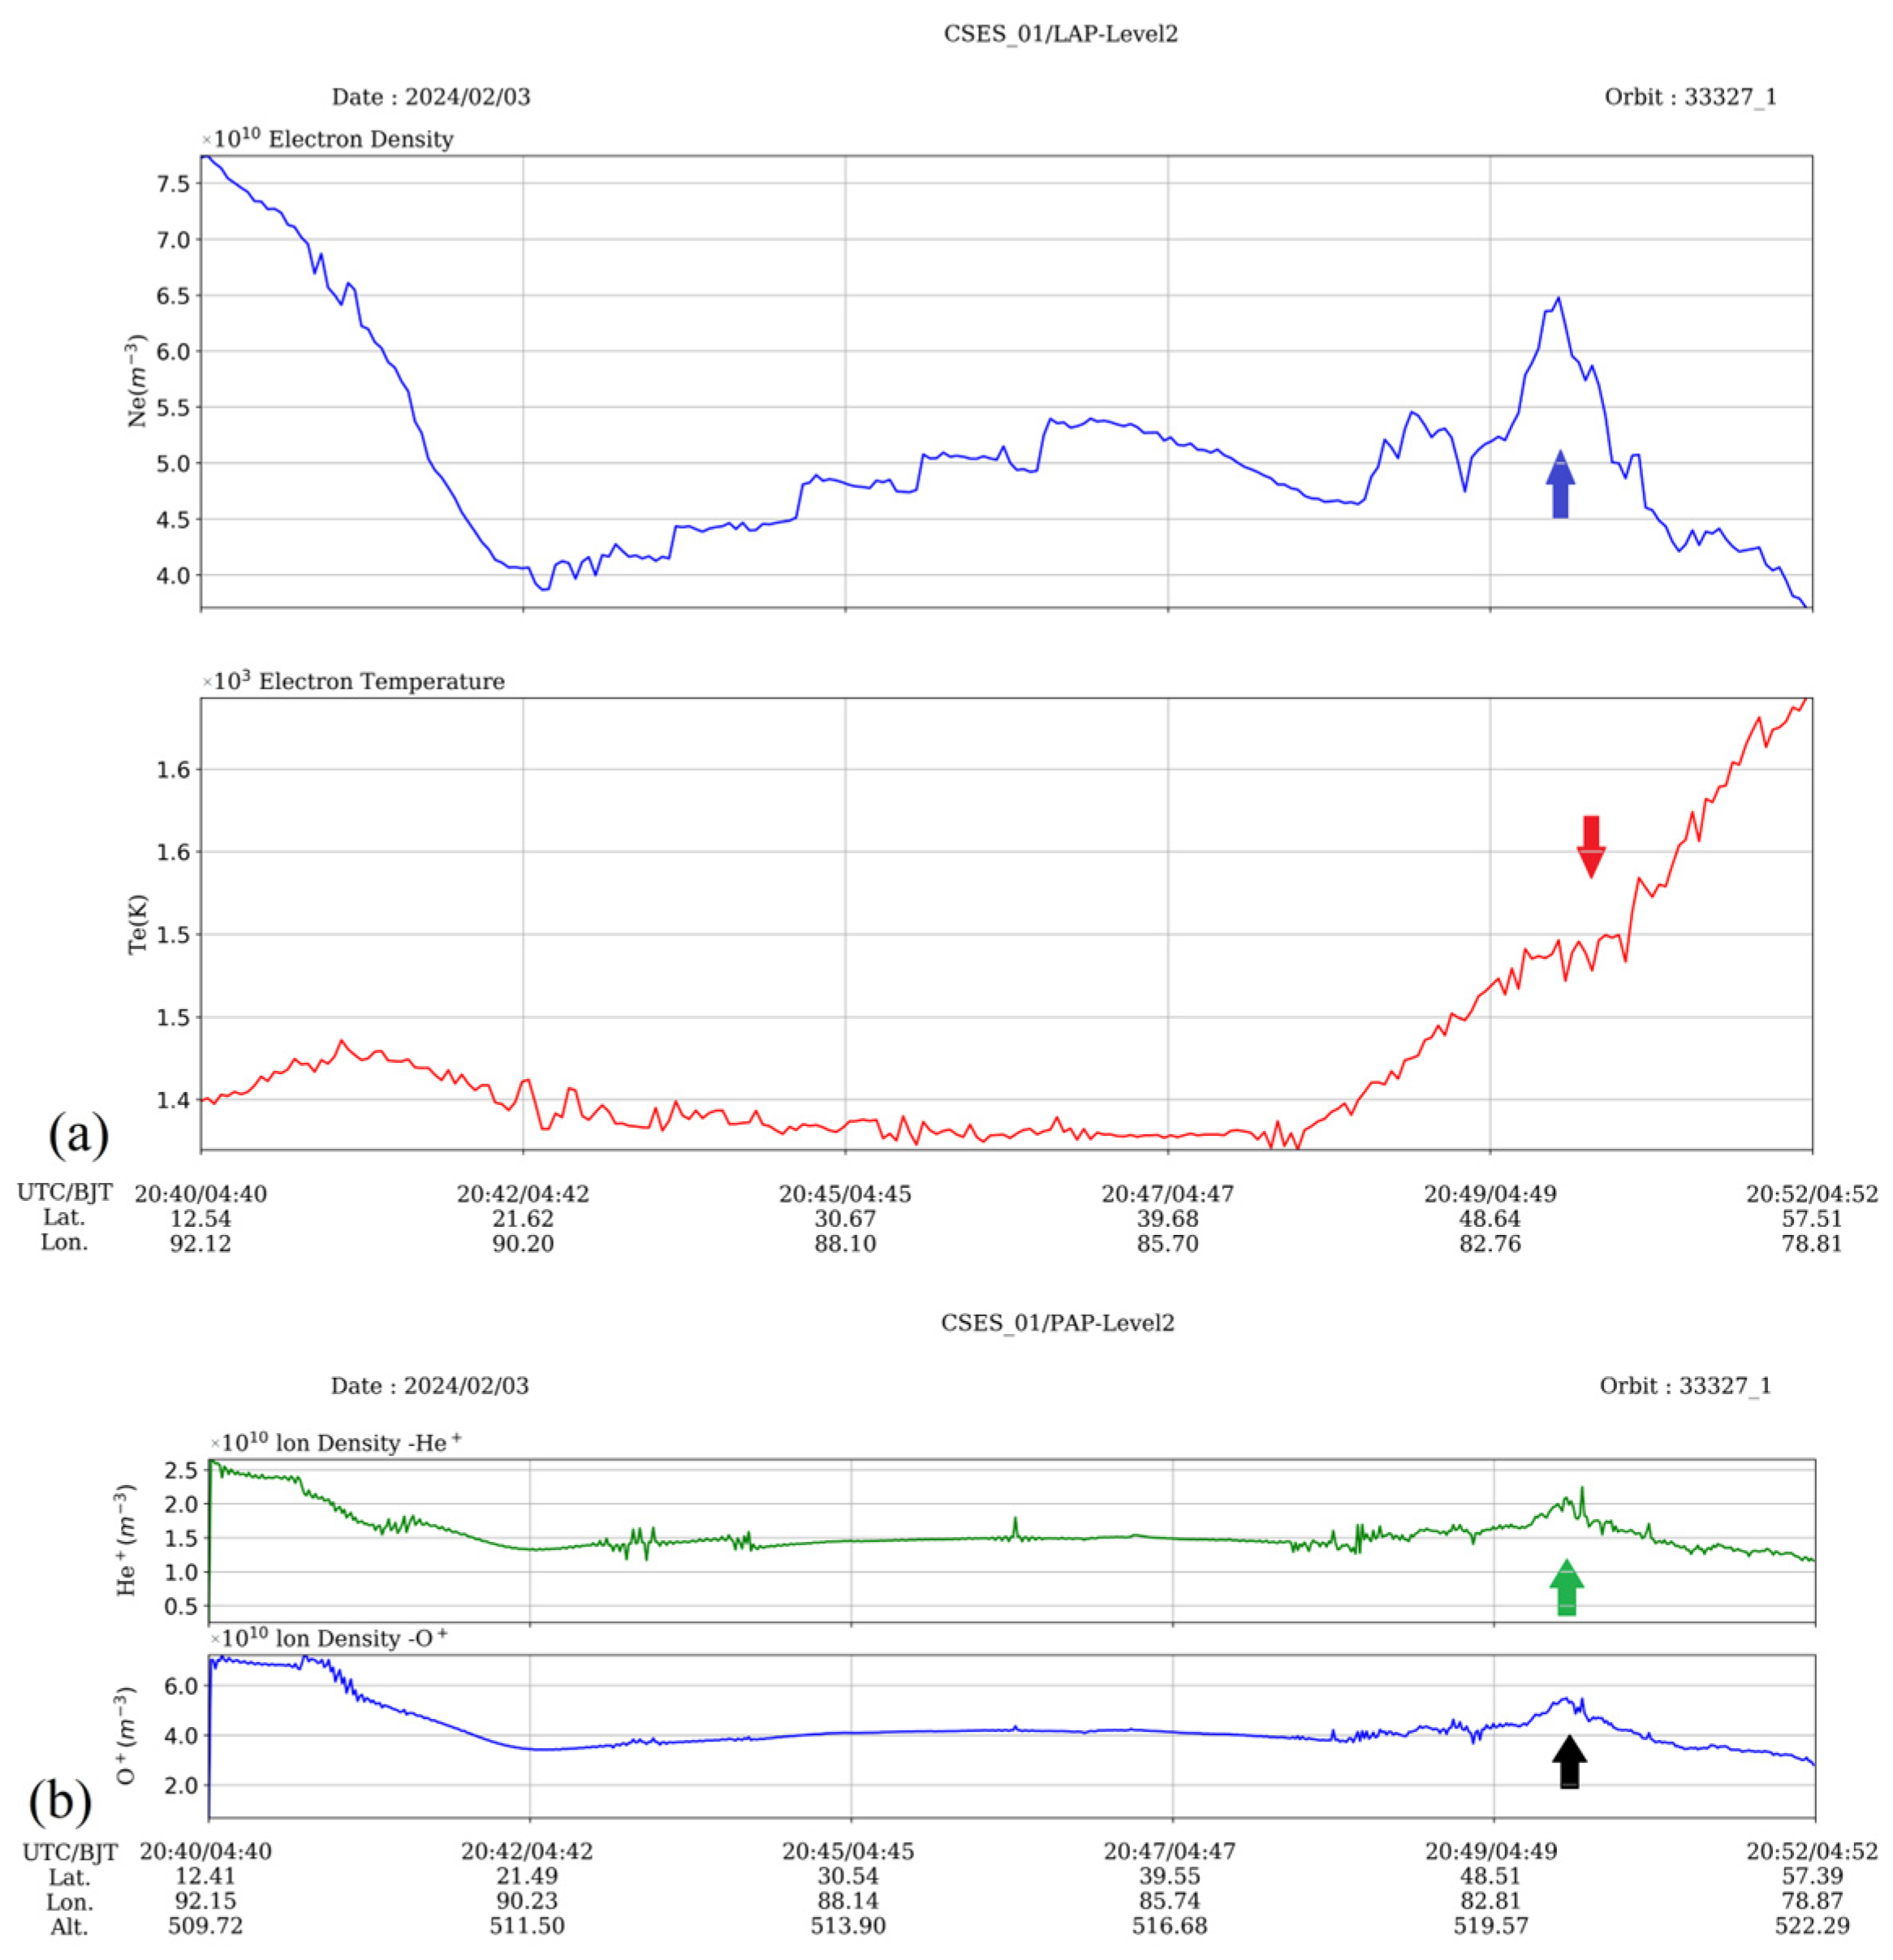
An electron perturbation and an O
+ perturbation with magnitudes over 20% were successfully detected in the next week (31 January–6 February 2024), and they have been listed as Pe2 and Pi2 in
Table 3. Their relative locations on the map are displayed with blue triangles in
Figure 4b. From
Table 3, these two plasma disturbances happened on 3 February on the night orbit 33327, one revisiting orbit of 33175 where obvious electron depletion occurred earlier. These two ionospheric variations occurred almost synchronously, with near locations and similar amplitudes of 24.6% for the electron density and 27.3% for the ion density and space sizes of 489 km and 510 km (see
Table 3), respectively. Variations in different plasma components automatically output from the CSES data processing system were extracted and are displayed in
Figure 9. The two detected ionospheric perturbations are labelled with a blue arrow for the electron density (see the top panel in
Figure 9a) and a black arrow for the O
+ density (see the bottom panel in
Figure 9b). From
Figure 9, it is obvious that almost synchronous fluctuations occurred not only in the electron and O
+ density data but also in the electron temperature and He
+ density measurements. On one hand, the electron density and the electron temperature demonstrate a contrary varying trend where one increases and the other decreases (see
Figure 9a), which is highly coincident with what has been reported before [
19]. Enhancements of O
+ and He
+ show almost the same pattern when comparing the top panel with the bottom one in
Figure 9b, on the other hand. Meanwhile, the Kp index on the same day as plasma perturbations occurred was quiet when we checked this parameter in
Figure 6. Thus, these apparent irregularities had been considered as seismic precursors at that time and would be traced continuously in the following days.
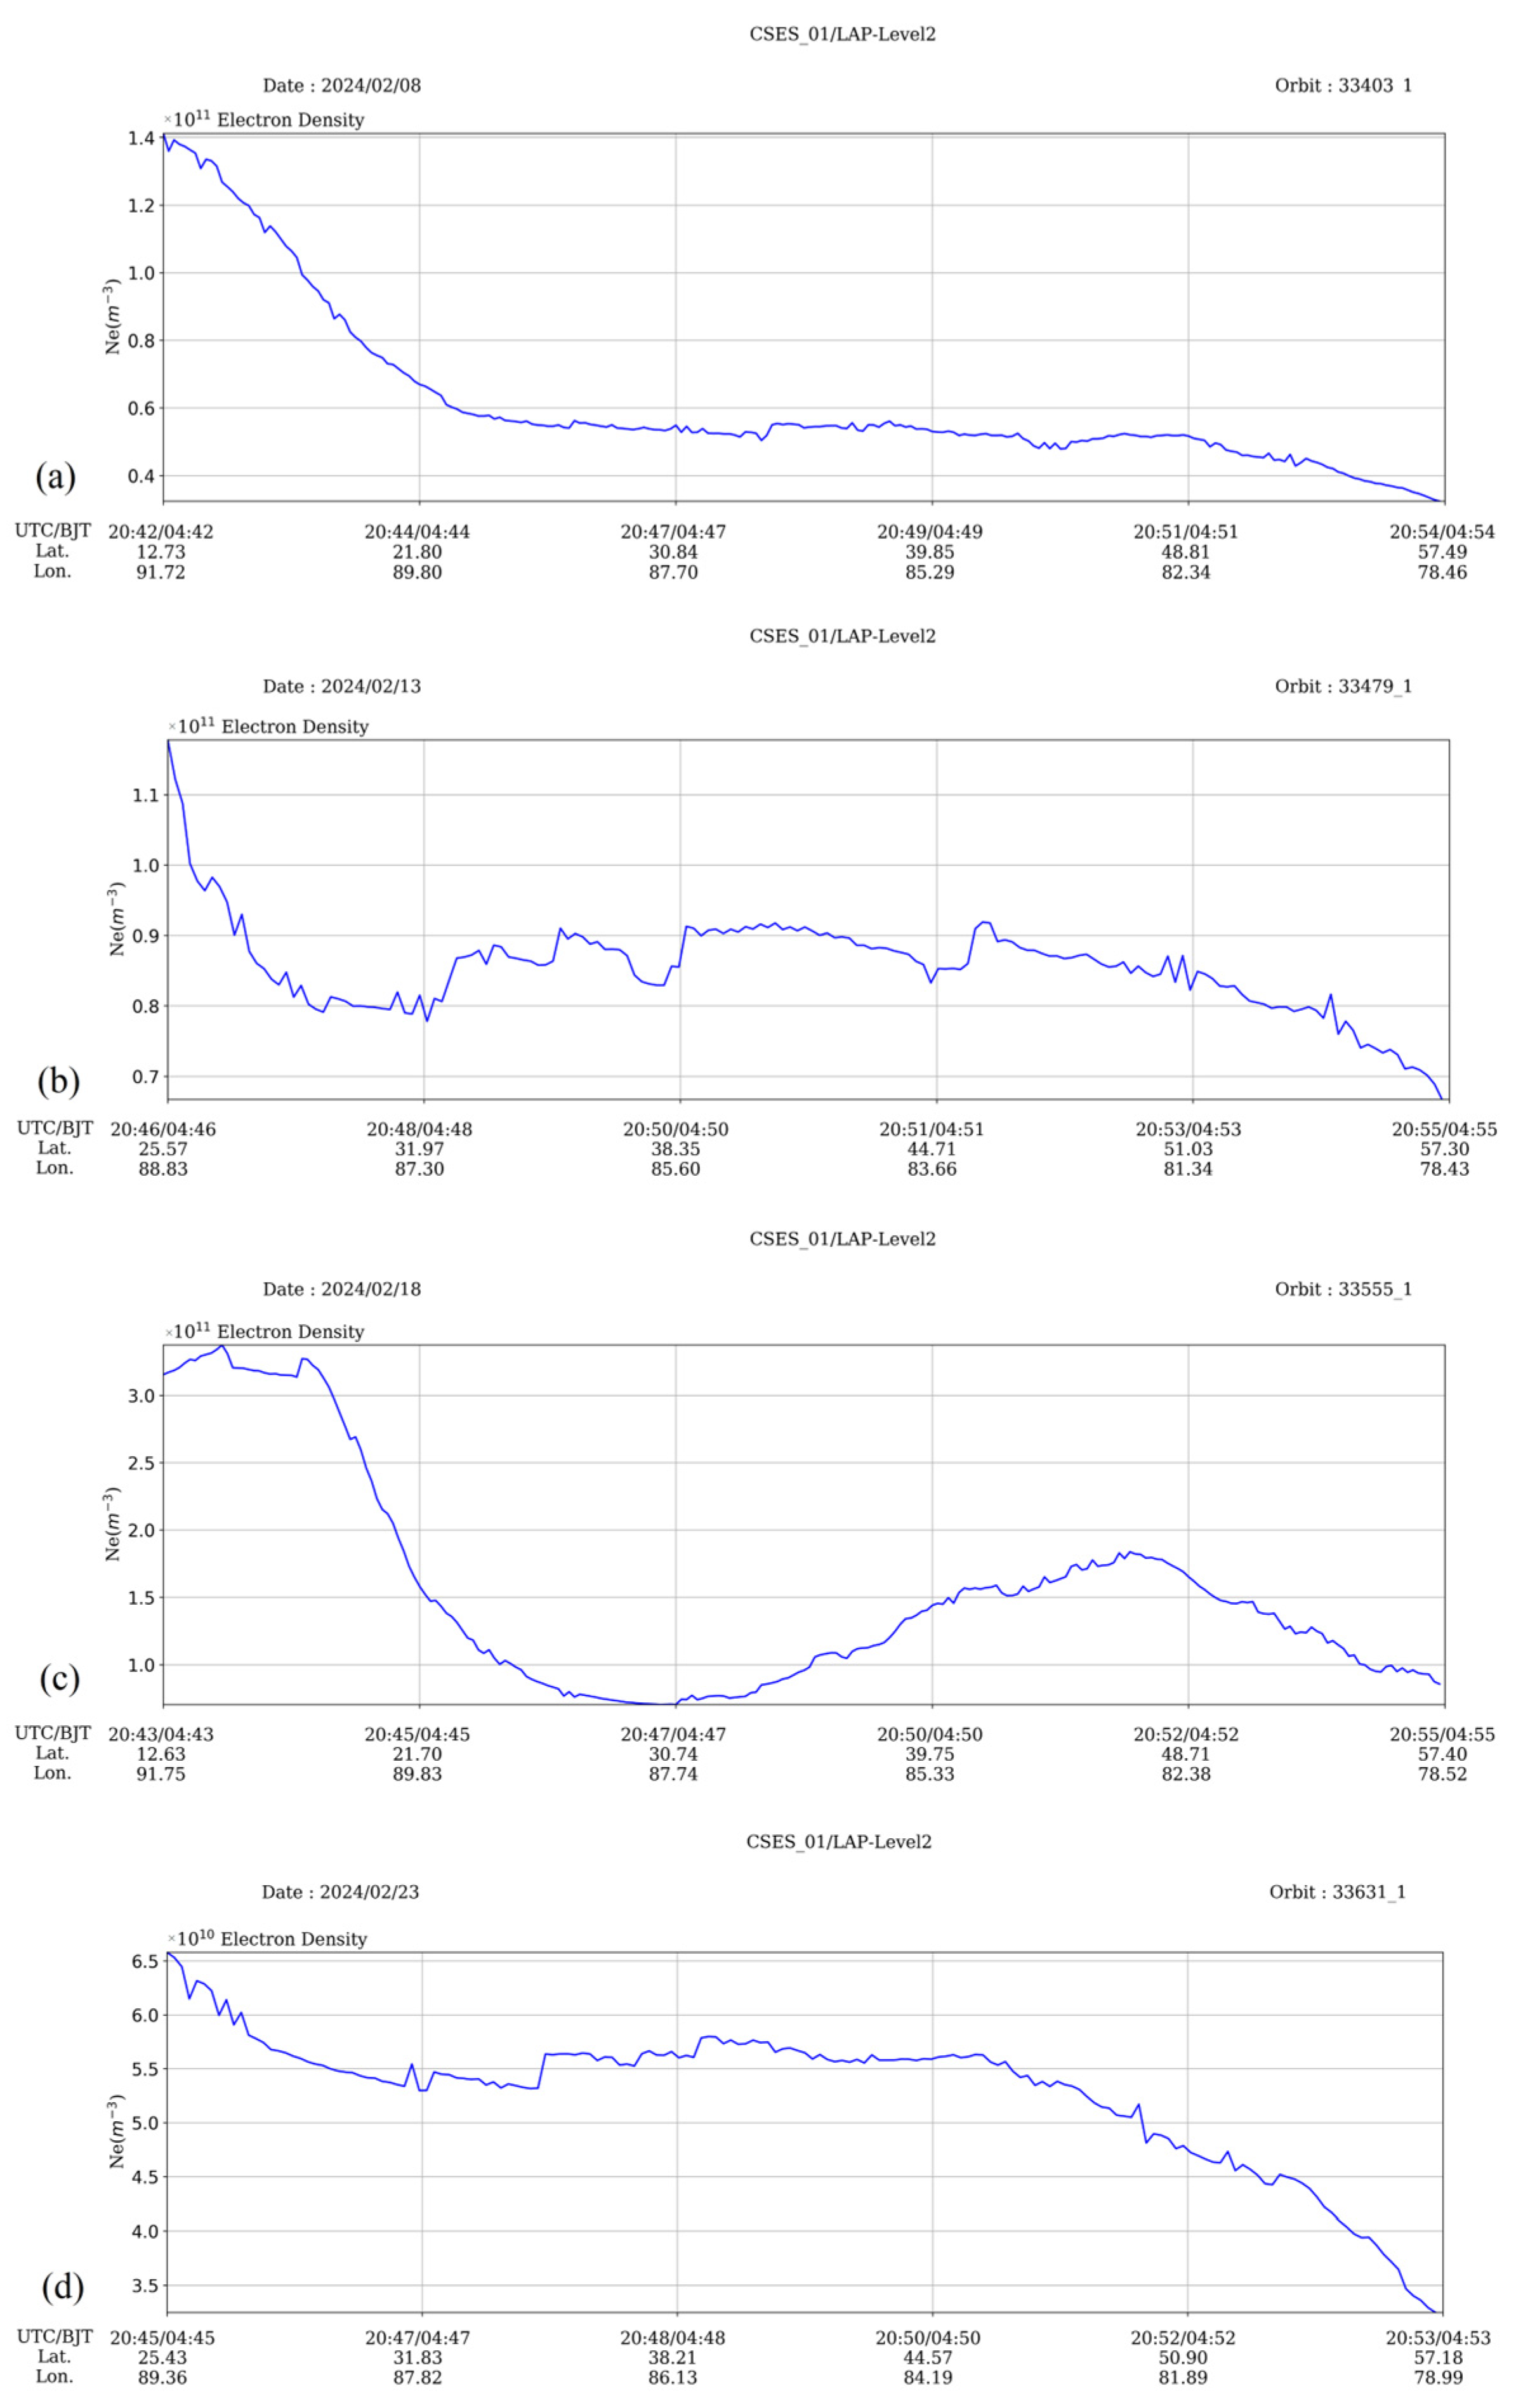
However, neither electron perturbations nor ion perturbations with a magnitude beyond 20% had been detected in the next two weeks since 7 February 2024 (see
Figure 4c,d). Corresponding fluctuations for various plasma parameters of the following revisiting orbits on 8, 13, 18, and 23 February had been checked and are demonstrated in
Figure 10 for the electron density and in
Figure 11 for the O
+ density. From
Figure 10 and
Figure 11, since 8 February, no obvious variations in these two parameters had taken place around the location where strengthened ionospheric irregularities were detected on orbit 33327 on 3 February 2024.
Two strong aftershocks with magnitudes of
MS 5.3 and
MS 5.8 took place on 24 and 25 February 2024, in the aftershock area of the Wushi event, with depths of 10 km and 11 km, respectively (
Table 2 and red dots in
Figure 3). So far, this
MS 5.8 earthquake was the biggest aftershock since the Wushi
MS 7.1 event took place on 23 January 2024. After that, no strong events with a magnitude over five occurred. Therefore, the synchronous enhancements in various ionospheric parameters registered on 3 February were probably associated with this biggest aftershock, 1000 km away and with a 20 day delay.
5. Discussion
The CSES satellite has been ongoing for more than 6 years since it was launched in 2018 in China. More and more studies have reported on its achievements in data assessment and availability [
37,
38,
39,
40], global geomagnetic field modeling [
40], investigations of ionospheric events like magnetic storms [
40,
41,
42], and ionospheric structures [
25,
26]. However, one significant goal of the development of this satellite to monitor seismic activities around the world is always the main topic. Investigations of seismogenic influences on the ionosphere have absorbed more and more attentions either in earthquake case studies or statistical analyses of a large amount of events [
23,
24,
27,
35,
43,
44,
45] to enhance our understanding of the topside ionospheric physics from lithospheric events.
At the same time, the CSES satellite plasma data have tentatively been put into earthquake prediction practice since 2020 [
24]. The contouring line method was first utilized within the China area to process the original electron and ion densities and highlight possible precursory information associated with impending strong seismic activities. Two outstanding examples have been reported by Li et al. [
24] in this period, and enhanced ionospheric fluctuations were successfully observed 14 days prior to the Maduo
MS 7.4 earthquake and 11 and 6 days to the Menyuan
MS 6.9 event in Northwest China. However, the contouring method is unable to reveal completely all ionospheric anomalies with different amplitudes. To deal with this problem, the automatic detection method developed by Li et al. [
20,
21,
22] to statistically investigate the seismo-ionospheric influence has been alternatively introduced to search for probable ionospheric precursors weekly during earthquake prediction practice in China after the Wushi
MS 7.1 earthquake on 23 January 2024.
Ionospheric perturbations had been successfully detected two times in the following month near the Wushi aftershock area. A night electron disturbance was detected first at 2:00 local time on 24 January 2024 (a relative specified local time was 14:00 during the day and 2:00 at night for the CSES satellite), the next day after the Wushi main shock, with an amplitude of 38.3%. But no ion perturbations were searched at the same up-going orbit 33175. Meanwhile, obvious corresponding variations were also registered for other plasma parameters, like the electron temperature and O
+ and He
+ densities, when we examined their processed pictures (see
Figure 4a and
Figure 5). However, the Kp index showed that these irregularities occurred in a moderately geomagnetically disturbed period (
Figure 6), which can induce positive and negative fluctuations in the ionosphere [
42,
46]. To confirm the influence of the solar activity on the ionosphere, the geomagnetic H component and geoelectric EW component measured at the nearest ground-based Hongqian station to the detected orbit had been checked and apparent perturbations (
Figure 7) were found during 23 and 24 January, which seems to indicate that the ionospheric variations this time probably originated from solar activities and had no near relationship with the following Wushi aftershocks. However, it is well known that the influence of geomagnetic storm on the ionosphere is global [
9,
25,
26,
42,
46]. Now, one question arises: why did these plasma bubbles occur only on this night at the 33175 orbit but not at other near orbits?
It is well known that equatorial plasma bubbles (EPBs) are one of the typical ionospheric irregularities ranging from a few meters to hundreds of kilometers during nighttime at low latitudes and equatorial regions [
47,
48,
49]. The EPBs are usually attributed to geomagnetic storms. During geomagnetic storms, the ionosphere and thermosphere systems are modulated significantly by energy injections from solar winds and the magnetosphere, and EPBs show very complex generation and evolution behaviors. However, there are still unsolved questions associated with plasma density depletions due to the complicated dynamic and electrodynamic processes in the ionosphere [
50,
51,
52].
However, Kuo et al. [
53] have reported that nighttime TEC variations, as well as a nighttime plasma bubble (equatorial spread F) induced by the current from the Earth’s surface can extend over the whole magnetic flux tube containing the earthquake epicenter, indicating that these phenomena within the preparation region can be considered as earthquake precursors. So, whether the plasma bubbles that appeared on 24 January 2024, are combined effects of solar activity and earthquake preparation or not needs further investigation.
Then, perturbations of the electron density and ion density had been detected automatically via the software on the revisiting orbit of 33327 on 3 February 2024, and they were characterized by the almost synchronous described parameters shown in
Table 2, which were also supported by the similar variation properties of different ionospheric components displayed in
Figure 9, as well as the contrary variations in the electron density and electron temperature. All these features seem more available as seismo-ionospheric precursors. Concerning this point, Li et al. [
24,
27] have reported ideal examples of similar variation forms of various ionospheric parameters on the same orbit before the Maduo
MS 7.4 earthquake, as well as the Menyuan
MS 6.9 earthquake, while the forms are probably different in the same revisiting orbits that occurred on different dates due to ionospheric dynamics with time. Another point is that it is possible that variations of the same revisiting orbits on different dates are not continuous, even when the date is more near to the event than others, which can also be testified by Li et al. [
27] concerning the Maduo event. Thus, it is not surprising that we found no sign of ionospheric irregularities in the following two weeks (see
Figure 10 and
Figure 11). At the same time, no strong seismic event occurred around these anomalies appearing on 3 February during this period.
Two strong aftershocks with magnitudes of
MS 5.3 and
MS 5.8 occurred sequentially on 24 and 25 February 2024, 20 days after the appearance of the last outstanding ionospheric variations and 1000 km away in the southwest. The statistical results for the relationship between the CSES perturbations and strong mid–low-latitude earthquakes conducted by Li et al. [
27] have shown that the seismo-ionospheric influence appears mainly in the 5 days before and shifts 500–700 km from epicenters instead of right above them, but we also note a concentration of this influence at 1000 km and even at 1500 km. These results are highly coincident with the physical model of the seismogenic current propagating along magnetic lines indicating that the seismo-ionospheric influence is usually above the epicenter when an earthquake occurs in auroral or high-latitude areas due to the vertical magnetic lines and a shift from the epicenter in mid–low-latitude area due to an unignored horizontal component of the magnetic lines. It is also reported that the seismo-ionospheric influence is under the control of other factors, such as solar activities, not to mention the inner properties of the earthquake, like the magnitude, focal mechanism, focal depth, etc. [
22,
34]. Li et al. [
16] have performed a statistical work on the temporal evolution of the ionospheric influence of the China Wenchuan
MS 8.0 earthquake and found the ionospheric anomalies appeared earlier one month, mainly two weeks, and collectively one week before. Yang et al. [
45] have presented that the power spectrum density anomaly on the ELF electric field measured by the CSES satellite happened one month prior to the 2021 Maduo
MS 7.3 earthquake. Zhang et al. [
43] have reported that the ionospheric and atmospheric disturbances occurred and accelerate 50 days and 15 days before the 2022 China Luding
MS 6.8 earthquake.
Theoretically, ionospheric reaction can be expected for an earthquake with a magnitude larger than 4.6 [
9]. It is possible that this
MS 5.8 earthquake generated these ionospheric variations beyond 20% even at a distance of 1000 km. Except for that, this strongest aftershock occurred in the Aheqi area instead of in the Wushi area (
Figure 3). There is a fact that cannot be ignored: the main damage lies in Aheqi county, even though the epicenter of the Wushi
MS 7.1 earthquake lies in Wushi county. On one hand, Aheqi county is well within 5 km away from the seismic fault, while the distance is about 25 km for Wushi county in the light of the reversion results of the INSAR measurement. On the other hand, the rupture in the southwest of the main shock is closer to the Earth’s surface according to the reversion results of the source rupture (
https://yjgl.luohe.gov.cn/index.php?c=show&id=3957, accessed on 1 August 2024). These processes can also accelerate ionospheric variations prior to this biggest aftershock.
However, confirming the right location and the magnitude of the impending event in the light of detected ionospheric perturbations is still a significant challenge during earthquake prediction practice, not to mention that the automatic detection method cannot reveal all ionospheric perturbations associated with seismic activities under these two limitations of A > 20% amplitude and t = 20–120 s space size. So, on one hand, the temporal–spatial evolution of features of the seismo-ionospheric influence need to be further reconfirmed by employing longer satellite measurements like SWARM and more seismic events in different locations. On the other hand, integrating ground-based observed data analysis with satellite Earth observations is still an effective way to enhance our understanding of the physical mechanism of the seismo-ionospheric influence and lithosphere–atmosphere–ionosphere process. The automatic detection method needs to be improved and more reasonable parameters need to be defined to perform a long-run earthquake prediction practice as well.
6. Conclusions
In this methodologically driven paper, a successful tracing process of automatic detected CSES precursors before several aftershocks of the Wushi MS 7.1 earthquake has been depicted in detail.
The automatic detection method was employed immediately after the Wushi
MS 7.1 earthquake on 23 January 2024, in northwest China to trace possible CSES electron and ion variations prior to aftershocks weekly. A strengthened electron fluctuation with magnitude of 38.3% was detected primarily at night orbit 33175 (
Table 3) next day after the Wushi main event in the first week of 24–30 January 2024. The variations in electron and ion parameters showed a similar property: an abrupt decrease, a typical feature of a plasma bubble. Meanwhile the Kp index was also checked to testify that a moderate geomagnetic storm took place, and apparent variations also occurred in the ground-based geomagnetic H component, as well as geoelectric EW component, which increases the probability that the variations originated from solar activities instead of the following three aftershocks with magnitudes over 5.0 during 25–30 January (see
Table 2 and
Figure 3).
In the next week (from 31 January to 6 February 2024), an electron perturbation with a magnitude 24.6%, as well as an ion perturbation of 27.3%, were successfully searched and located on the map in
Figure 4b, and their parameters are shown in
Table 3. These two perturbations were characterized by, on the one hand, a location of the night revisiting orbit 33327 on the revisiting date 3 February that was the same as what happened on 24 January and similar parameters describing their properties, which are also distinguished visually from fluctuations in electron density, electron temperature, and O
+ and He
+ densities along the orbit 33327 in
Figure 9, on the other hand. Furthermore, the contrary trends for the variations in the electron density and the electron temperature highlight the availability of these variations as seismic precursors. However, no similar variations had been found at the same revisiting orbits or other orbits near the aftershock areas during the next two weeks till the occurrence of the strongest aftershock of
MS 5.8 on 25 February 2024, 20 days after and 1000 km away.


