Article

Assessment and Dynamic Prediction of Green Space Ecological Service Value in Guangzhou City, China

College of Natural Resources and Environment, South China Agricultural University, Guangzhou 510642, China
*
Author to whom correspondence should be addressed.
Remote Sens. 2024, 16(22), 4180; https://doi.org/10.3390/rs16224180
Submission received: 12 September 2024 / Revised: 31 October 2024 / Accepted: 6 November 2024 / Published: 8 November 2024

Abstract

:
As an important part of the urban ecosystem, urban green space provides a variety of ecosystem services, including climate regulation, soil conservation, carbon sink and oxygen release, and biodiversity protection. However, existing remote sensing evaluation methods for ecological service value lack the evaluation indicators of ecosystem service value for Guangzhou, China, and the evaluation method depends on the land cover type. Based on remote sensing technology and random forest algorithm, this study addresses these gaps by integrating remote sensing technology with a random forest algorithm to enhance the accuracy and rationality of ESV assessments. Focusing on Guangzhou, China, we improved the ecological service value evaluation system and conducted dynamic predictions based on land-use change scenarios. Our results indicate that the total ESV of Guangzhou’s green space was USD 7.323 billion in 2020, with a projected decline to USD 6.496 billion by 2030, representing a 12.37% reduction due to urbanization-driven land-use changes. This research highlights the noticeable role of green spaces in urban sustainability and provides robust, data-driven insights for policymakers to design more effective green space protection and management strategies. The improved assessment framework offers a novel approach for accurately quantifying urban ecosystem services and predicting future trends.

1. Introduction

The ecological service function of urban green space refers to the direct or indirect provision of material products and related services for human beings in the urban green space ecosystem, meeting various needs such as human survival and life, and improving people’s livelihood and well-being [1,2,3]. The study of the dynamic evolution of the eco-logical service value of urban green space can reveal its changing characteristics and laws over different time periods and spatial ranges, which is helpful in discovering the key factors affecting the ecological service value of urban green space and predicting future development trends [4]. Traditional methods using non-remote sensing means (traditional means) have been employed for research and analysis [5]. For example, Zhang et al. [6] used the full-permutation polygon diagram method to standardize the value of different types of ecosystem services, showing the inter-annual trend of ecosystem service functions of green space in Nanjing from weak to strong. Jie et al. [7] established a meta-analysis value transfer database through literature screening, evaluating the ecosystem service value of resource-based cities from the perspective of urban households’ willingness to pay, and found that supply, climate regulation, and biodiversity positively impact the value of ecosystem services. However, these services are often difficult to quantify directly, and related research inevitably requires considerable manpower and material resources. Remote sensing technology, due to its fast, multi-spectral, wide-range, and cost-effective imaging capability, can provide detailed information on the spatial distribution, coverage area, vegetation growth and other aspects of urban green spaces, thus helping assess the value of these services quickly and accurately [8]. With the continuous development and improvement of remote sensing technology, its application in urban ecosystem service assessment will become increasingly extensive. Based on remote sensing technology, the spatiotemporal dynamic evolution and driving analysis of the ecological service value of urban green space can provide a better understanding of its change process, reveal the driving factors and mechanisms affecting the spatiotemporal evolution, support decision-making for urban land use planning and management, and contribute to the coordinated development of socio-economic and ecological environments [9,10,11]. Currently, there are two approaches to assessing the value of ecosystem services in urban green spaces based on remote sensing techniques: semi-quantitative assessment methods and quantitative assessment methods.
First, the semi-quantitative assessment method of remote sensing of ecosystem service value combines remote sensing technology with traditional data acquisition methods, meaning that some of the assessment indicators in the traditional method are obtained through remote sensing technology [12]. For example, Peng Xiulian et al. [13] evaluated the total value of ecological services in Zhushuqiao Reservoir, an important drinking water source in Changsha City, using the equivalent factor of unit area value and the value of intermediate materials. They calculated the total value of ecological services in Zhushuqiao Reservoir to be CNY 4.449 billion and CNY 7.669 billion, respectively. Wang Shaohui et al. [14] evaluated and analyzed the urban green space ecosystem in Zunyi central urban area of Guizhou Province using statistical results of network multi-source data. Their results showed that the ecological service function of the urban ecosystem in Zunyi central urban area has huge ecological and economic benefits, and the service function of the ecosystem plays a crucial role in improving the ecological environment of the city, improving the happiness index of urban residents, and promoting sustainable urban development. Zhang et al. [15]. measured the ESV of the Sunan Canal Basin in Jiangsu Province based on remote sensing indicators and socio-economic factors, analyzing the spatial and temporal evolution of ecosystem service value using the contribution method and spatial statistics method. The results showed an initial increase followed by a decline in total ESV, with the declining areas mainly located in the southeastern part of the province and in rapidly expanding urban areas along the canals. This method mainly uses remote sensing technology to obtain land cover types but does not improve the specific functional value assessment method, which limits the accuracy and rationality of the assessment results to some extent.
Second, the quantitative assessment method of remote sensing of ecosystem service value uses remote sensing technology to evaluate the value of ecosystem services. For example, Zaman-ul-Haq et al. [16] used the benefit transfer method (BTM) to assess the change in the monetary value of urban ecosystem services from remote sensing data, showing that urbanization in Pakistan is depleting productive ecological land in urban areas. Based on the WorldView-3 remote sensing image data, Jiang Liuzhi et al. [17] analyzed the spatial distribution characteristics of urban green space in Futian District, Shenzhen, and evaluated its ecological service value. The results showed that the ecological service value of urban green space in Futian District was 116.8341 million yuan, and the ecological service value of urban green space per unit area was 83,500 yuan. In the study of the spatiotemporal dynamic evolution of urban ecosystem service value, Nayak D. et al. [18] used remote sensing data and GIS technology to dynamically analyze the value of ecosystem services corresponding to the global value coefficient (VC) to estimate the changes in total ecosystem service value (ESVt) and individual ecosystem service functions. The study showed that the value of ecosystem services (ESV) in the Mangaluru urban agglomeration in India fell from USD 116.89 million to USD 851.4 million due to a decrease of 9.54% and 63.44%, respectively, between 1980 and 2022, respectively. Wang Ruosi et al. [19] used the dynamic equivalent method of ecosystem service value and the geographic detector model to show that the dominant factors affecting the spatial and temporal distribution of ecosystem service value were land use, NPP, precipitation and slope, in addition to temperature, elevation and soil type. Wang et al. [20]. used the equivalent factor method to estimate the ESV of the archipelago area based on long time series of remotely sensed data, and the results showed that the total value of ecosystem services in the study area increased from 1876.04 million yuan in 1984 to 2128.52 million yuan in 2017 (+13.46%), with an average annual increase of 7.65 million yuan, or 0.40% per year. However, it remains challenging to establish a reasonable quantitative method of remote sensing index and monetary value in the study of evaluating ecological service function by full remote sensing, thus limiting the current accuracy of ESV evaluations.
The purpose of this study was to establish an improved ecological service value assessment system, enhance the accuracy and rationality of the assessment using a random forest algorithm, and more accurately evaluate the value of ecological service functions in the selected study area, conducting dynamic value assessments based on land cover type prediction.

2. Materials and Methods
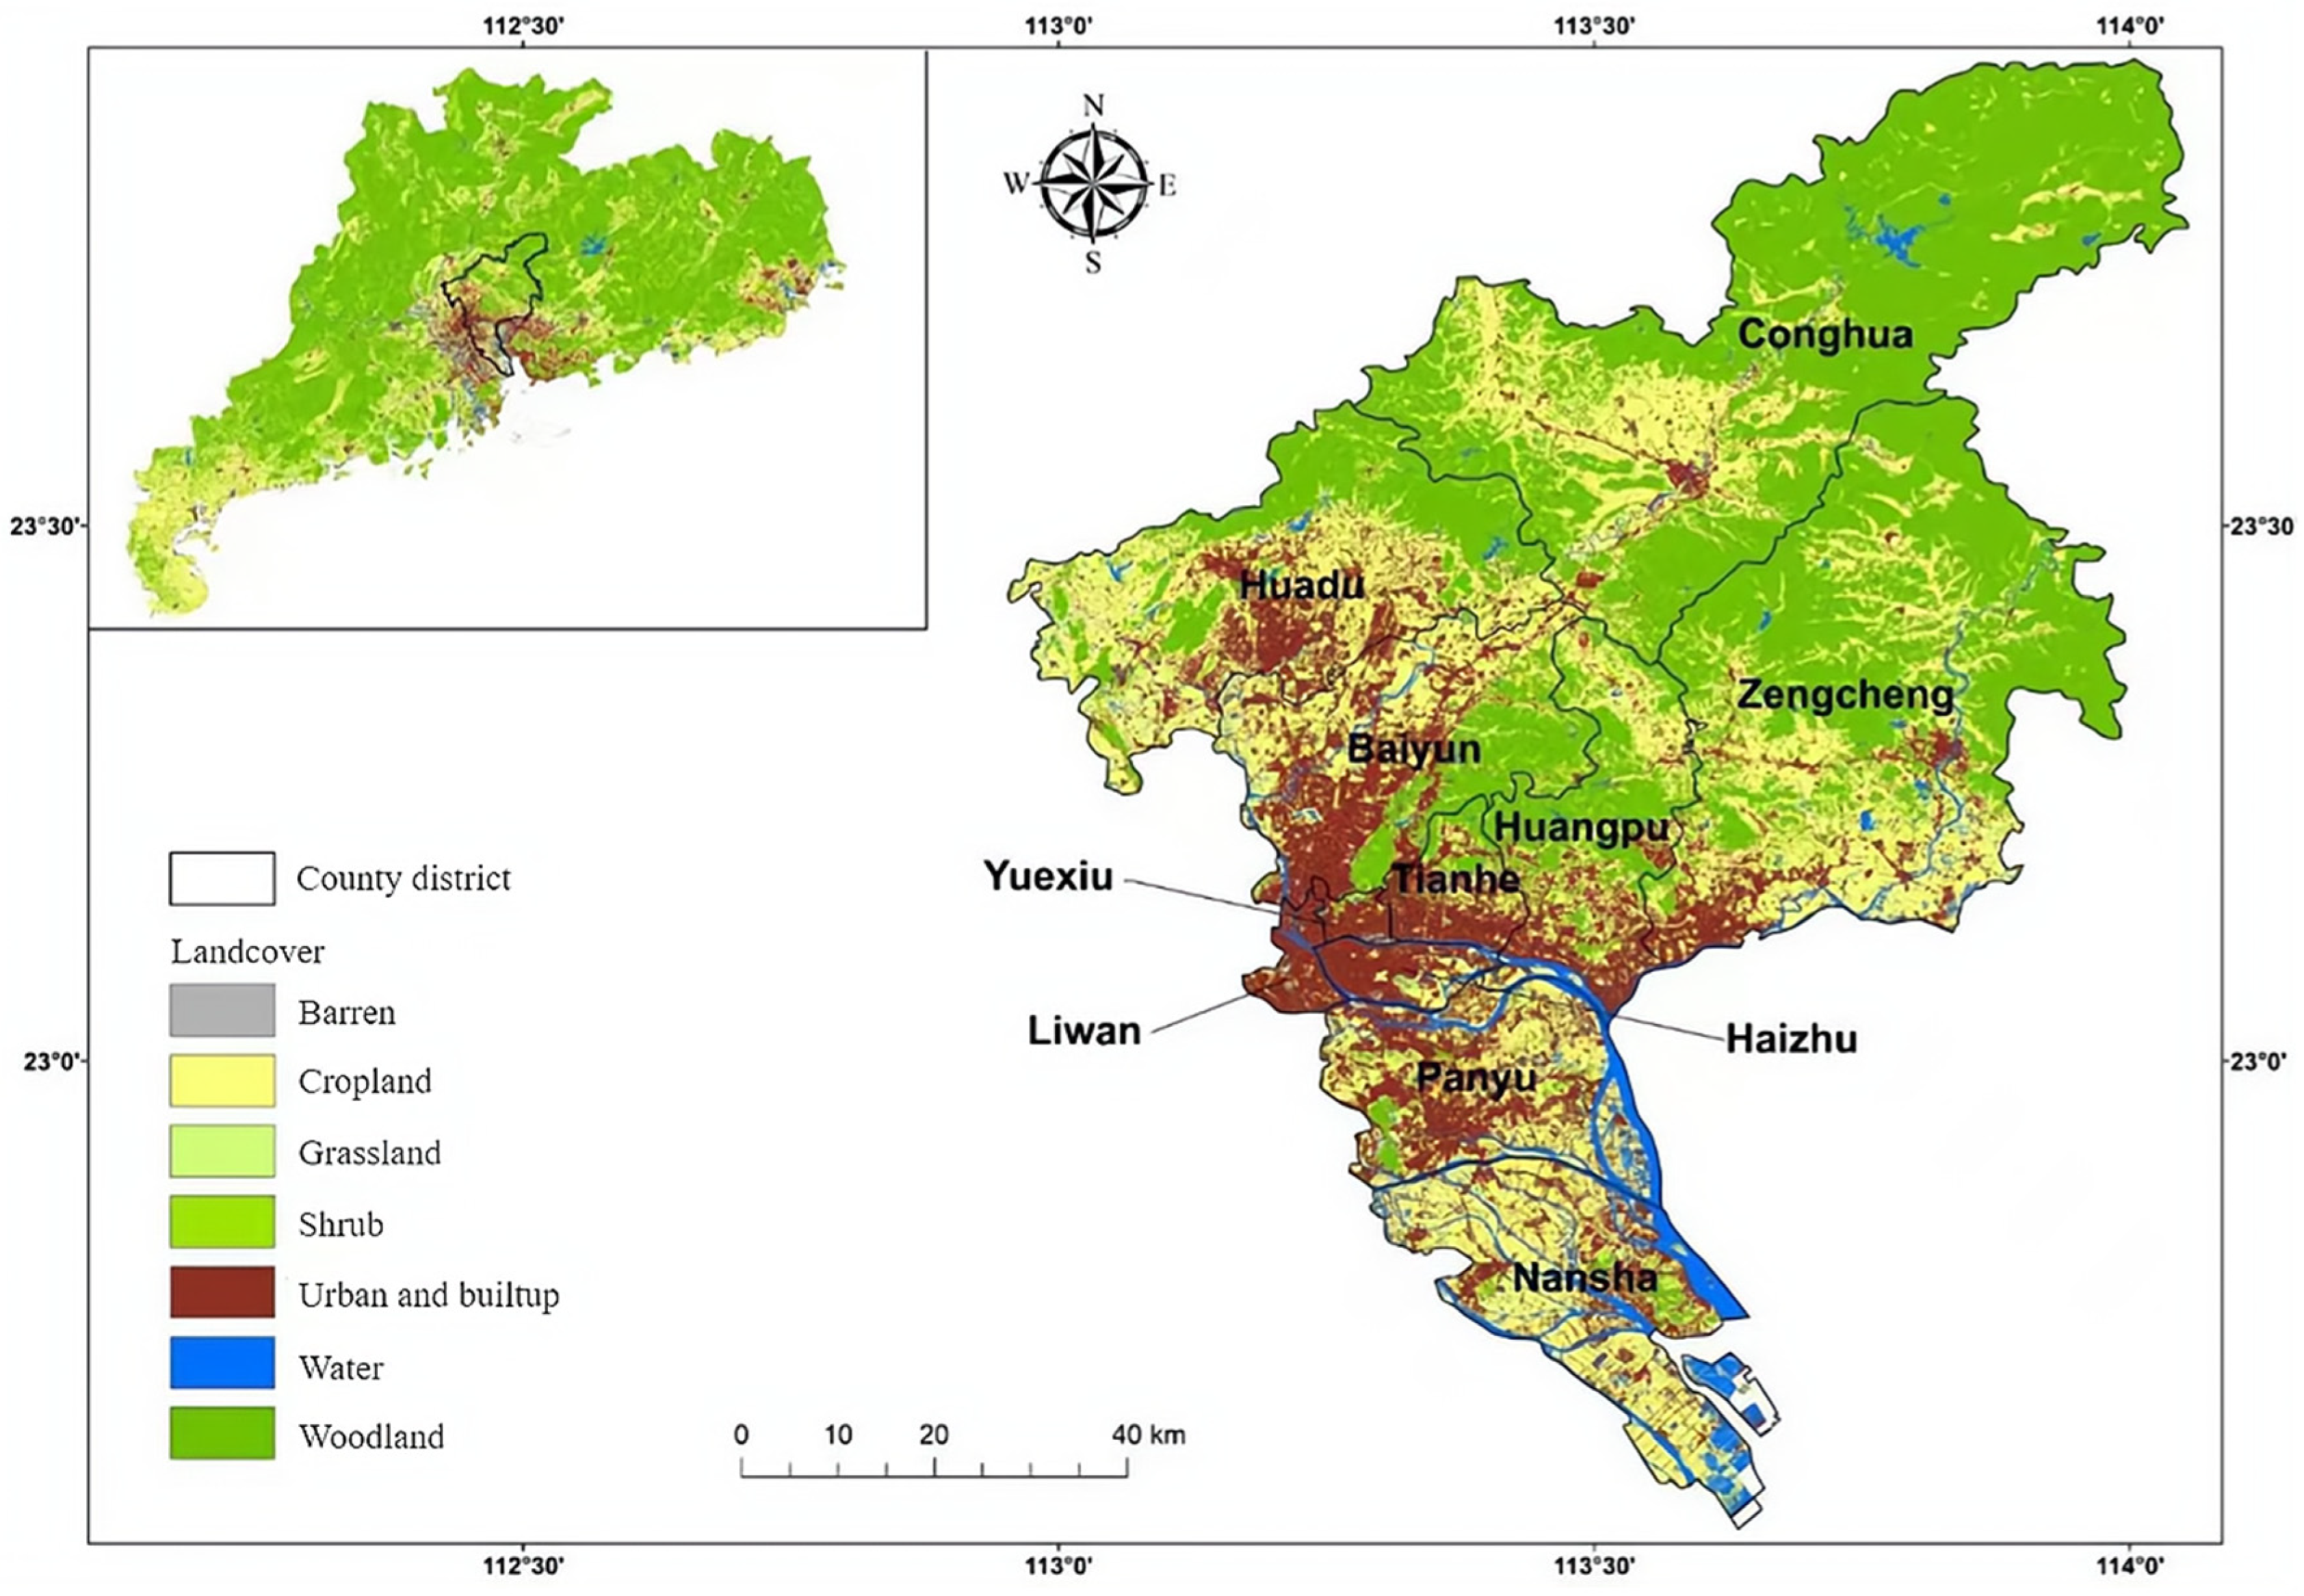
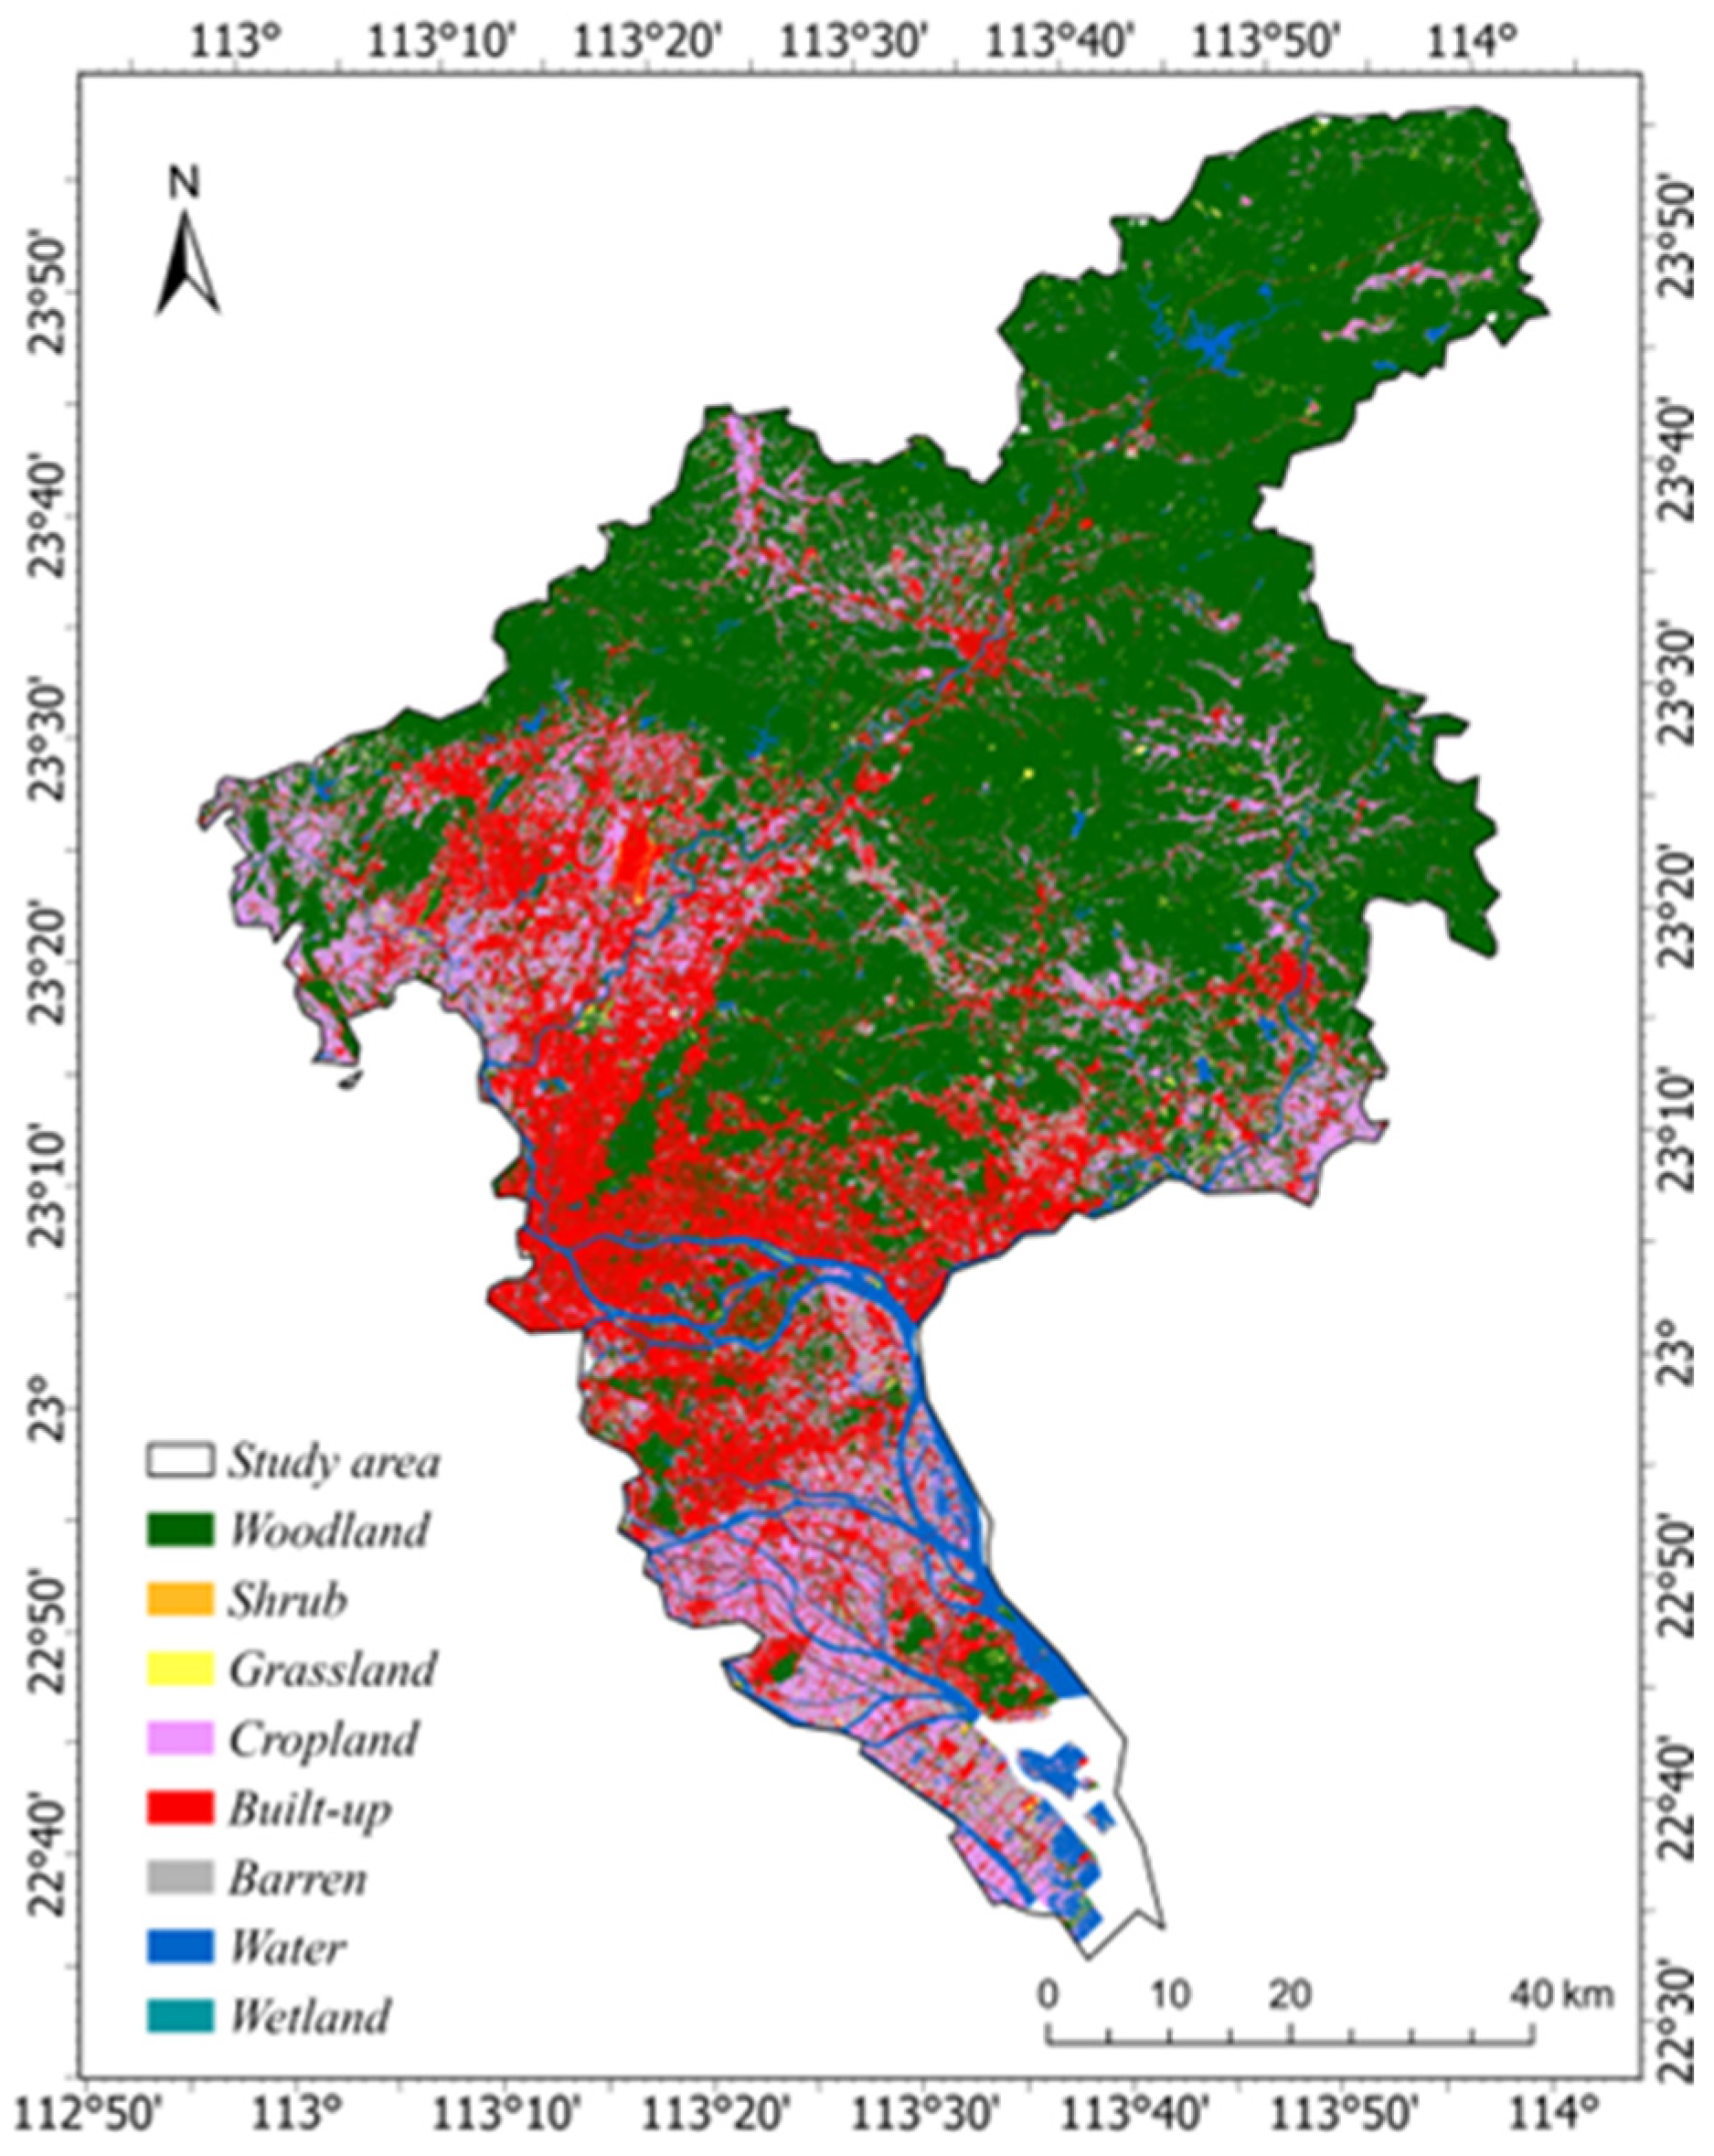
2.1. Study Site

This study was conducted in Guangzhou, Guangdong Province, China 22°26″~23°56″N, 112°57″~114°3″E) (Figure 1). Guangzhou is located in southern China, with an administrative area of 7434.4 square kilometers, belonging to the subtropical monsoon climate zone [21,22]. Summers are hot and rainy, winters are relatively warm, and the transition between spring and autumn is mild. The average annual temperature ranges from 21.7 to 23.1 °C, with highs of 39.1 °C. The annual precipitation is 193 mm, and the average annual precipitation days are 149 days. Guangzhou’s unique geographical location and natural climatic conditions make it one of the regions with the richest plant resources in the world, with rich biodiversity and good ecological environment.

2.2. Data Sources and Preprocessing
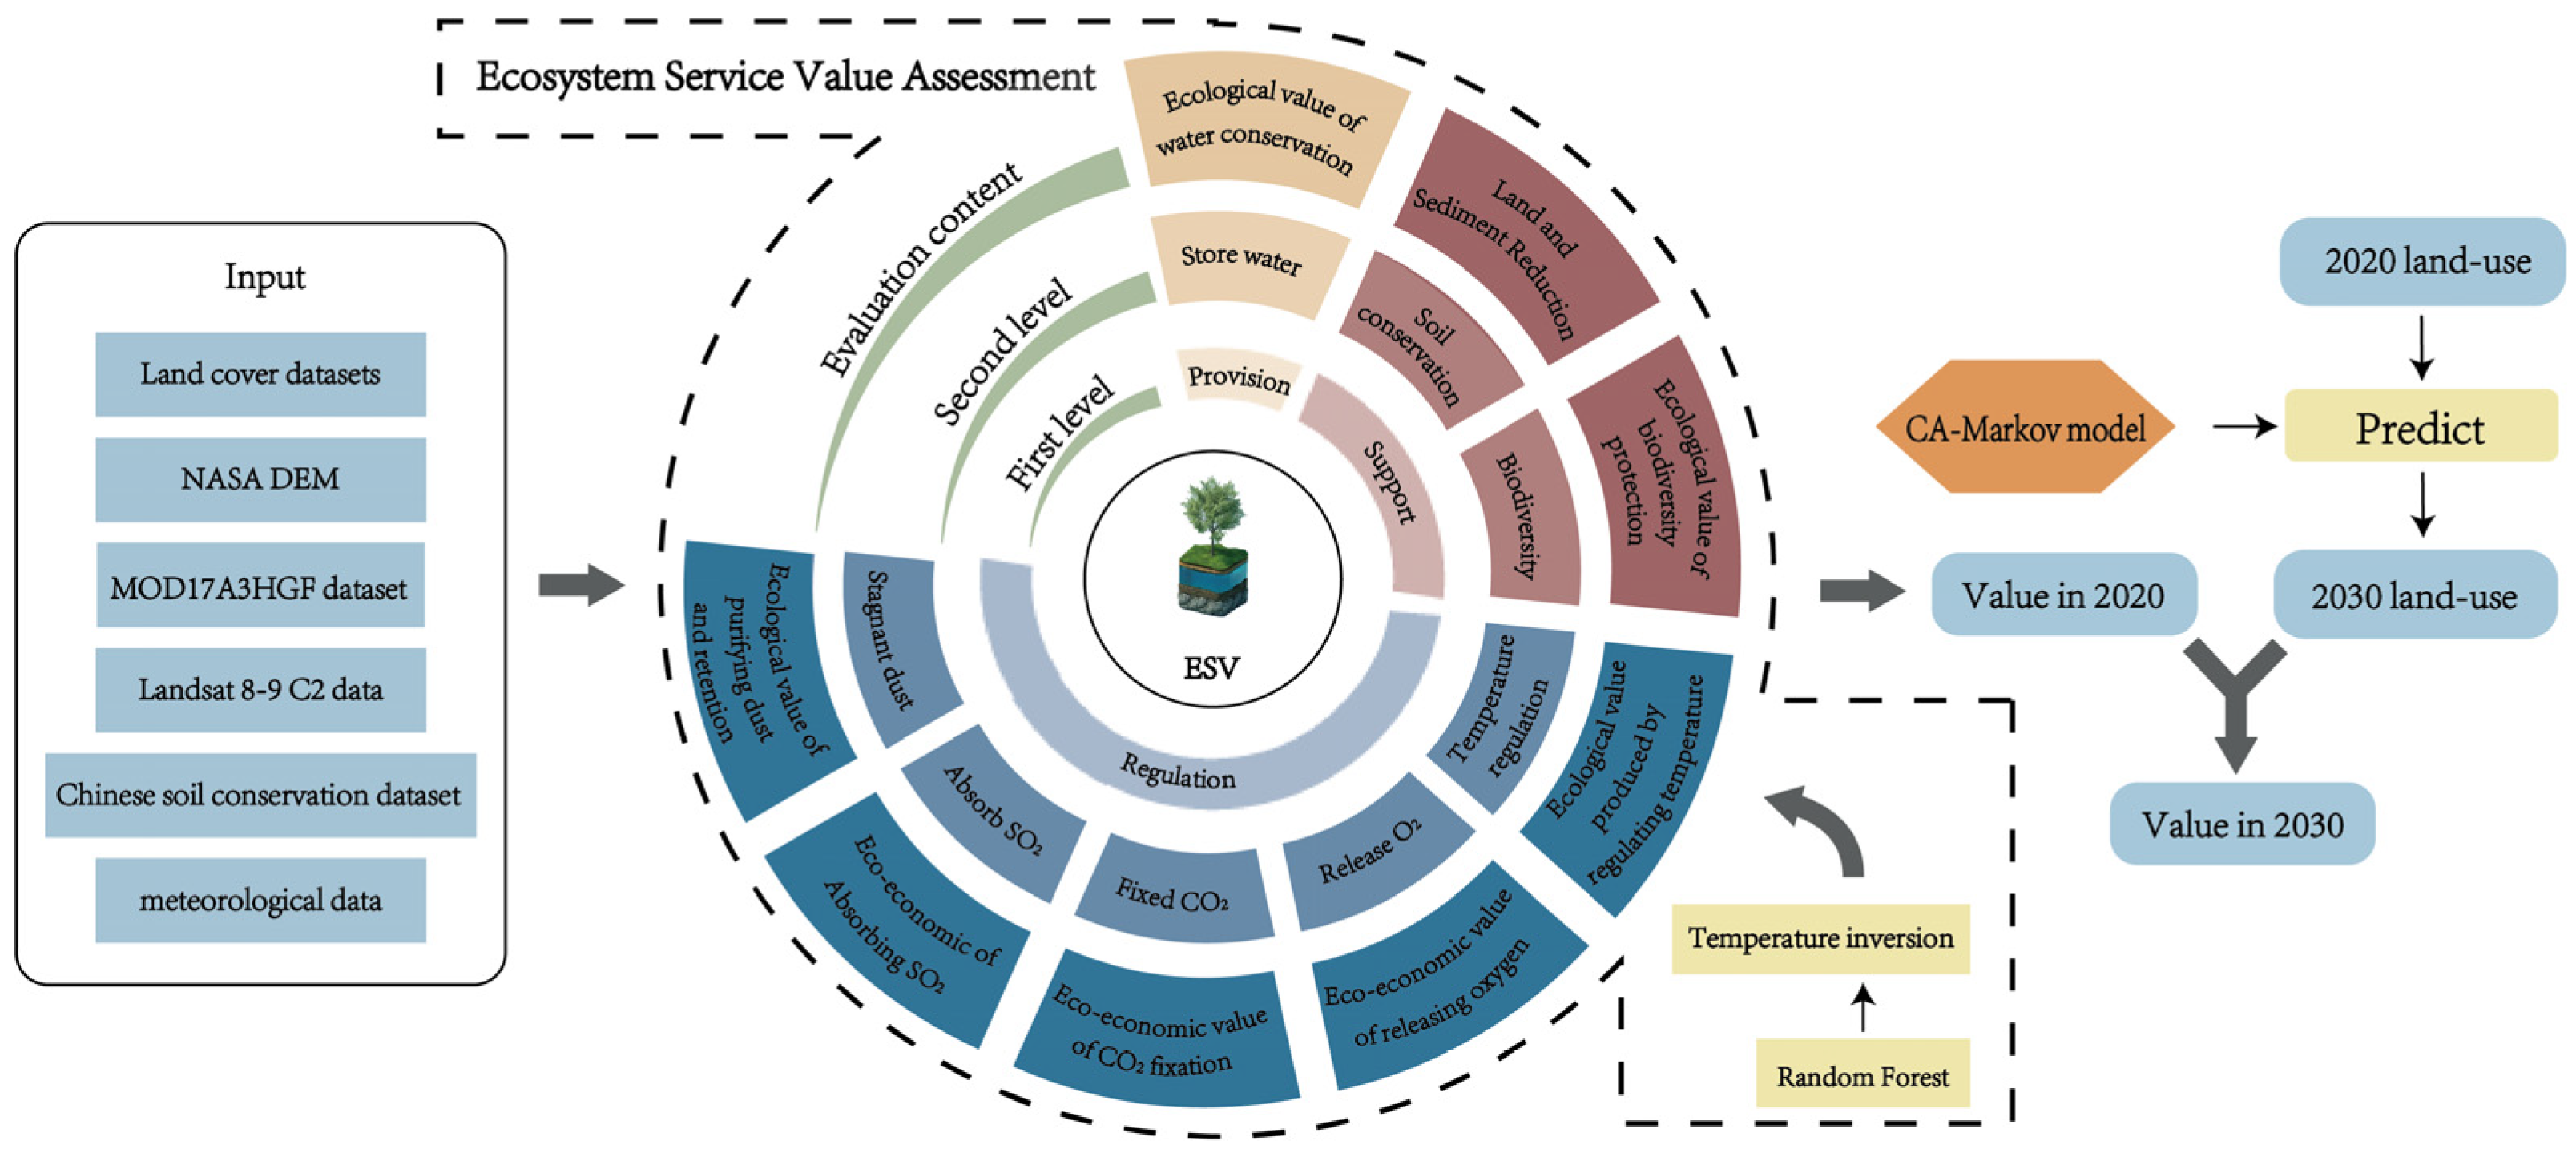
In this study, the following data were collected, including administrative district data, Net Primary Production (NPP) data, elevation data, LULC data, precipitation data, and C2 L2 product data of the Landsat series of satellites (Table 1). (1) The land cover data were obtained from a website, with a 30 m spatial resolution (https://zenodo.org/record/8176941, accessed on 3 June 2024) [23]. (2) The vector data of district-level administrative divisions in Guangzhou is extracted from the data of third-level administrative divisions in the 2024 edition of the National Geographic Information Public Service Platform (https://cloudcenter.tianditu.gov.cn/administrativeDivision, accessed on 7 June 2024) according to the mask. (3) The topography data were obtained from the National Aeronautics and Space Administration (NASA) digital elevation model (DEM) product, with a 30 m Spatial resolution (https://earthdata.nasa.gov/, accessed on 22 May 2024). (4) The net primary productivity (NPP) data were acquired from MOD17A3HGF product of modis remote sensing image (https://lpdaac.usgs.gov/, accessed on 4 June 2024). (5) The data required for temperature inversion (including surface albedo panchromatic band, atmospheric transmittance, thermal Band in radiance, upwelled radiance and downwelled radiance) were obtained from the Landsat 8-9 C2 L2SP product (https://earthexplorer.usgs.gov/, accessed on 4 June 2024). The Landsat 8-9 C2 L2SP product is a 16-day synthesis product with a spatial resolution of 30 m, including three types of data: surface reflectivity (SR), surface temperature (ST) and quality assurance (QA). (6) The data of soil and water conservation capacity (including rainfall erosivity factor, vegetation coverage factor, slope length factor, soil erodibility factor and soil conservation measures factor) were obtained from ScienceDB platform (https://cstr.cn/31253.11.sciencedb.07135, accessed on 4 June 2024) [24]. (7) The meteorological data (including temperature and precipitation) were acquired from the National Meteorological Science Data Center (http://data.cma.cn, accessed on 11 June 2024). To match the spatial resolution and projection of the DEM data, the NPP images with a spatial resolution of 500 m × 500 m were resampled using a nearest neighbor method (NNM) to create NPP data with a spatial resolution of 30 m × 30 m from which the longitude, latitude, altitude, slope, and aspect indicators were extracted. In addition, the NNM was used to downscale the 300 m soil data products to a 30 m spatial resolution using ArcGIS 10.8 software (Esri, Redlands, CA, USA). The sample points needed for the random forest model in this study come from the single-day station temperatures (matching the transit time of Landsat satellite) of six meteorological observation stations in Guangzhou from 2020 to 2023 obtained in (7) the meteorological data and the data of MNDWI, NDVI, LST, albedo and elevation obtained from remote sensing images (the specific acquisition method is explained in Section 2.3). A total of 9 sample data were collected from each sample point, including 54 training sample data, and the sample size was more than 50, which met the requirements of statistical modeling.
The Landsat data preprocessing included the following steps. (1) Scale the data from a 16-bit integer value to actual reflectivity data according to the scale factor and offset. (2) The ENVI 5.3 software (Exelis VIS, Longmont, CO, USA) was used to obtain 2 VIs (NDVI, MNDWI) from the Landsat 8-9 C2 L2SP product. The flow chart of this study is shown in Figure 2.

2.3. Methods

2.3.1. Ecosystem Service Value Calculation

Guangzhou is located in the subtropical monsoon climate zone, with abundant annual precipitation and diverse vegetation types. Therefore, in terms of water conservation, carbon sink and temperature regulation, we have improved the factor table proposed by Xie et al. [25] according to the actual conditions in the region, and refined the temperature regulation and carbon sink functions of different vegetation types such as forests, shrubs and grasslands, and referred to the residential electricity price in Guangzhou and the CEA transaction price in China carbon market (for more detailed improvement, see the method description of estimating the value of each ecological service function below), so as to calculate ESV more scientifically and accurately. Based on the above situations and assessment method of Urban ESV by Maimaiti et al. [26], We improve the evaluation system of urban ecological service value according to the characteristics of the study area to calculate ESVs. The total value of ecosystem services (ESV) in the study area was calculated using Equation (1).
E S V = i = 1 n E S V i
where E S V i refers to the ith estimated value of ecosystem service function, divided into 3 categories of services (Provision service, Regulation service and Regulation service). The three categories include 8 factors, as described in Table 2.

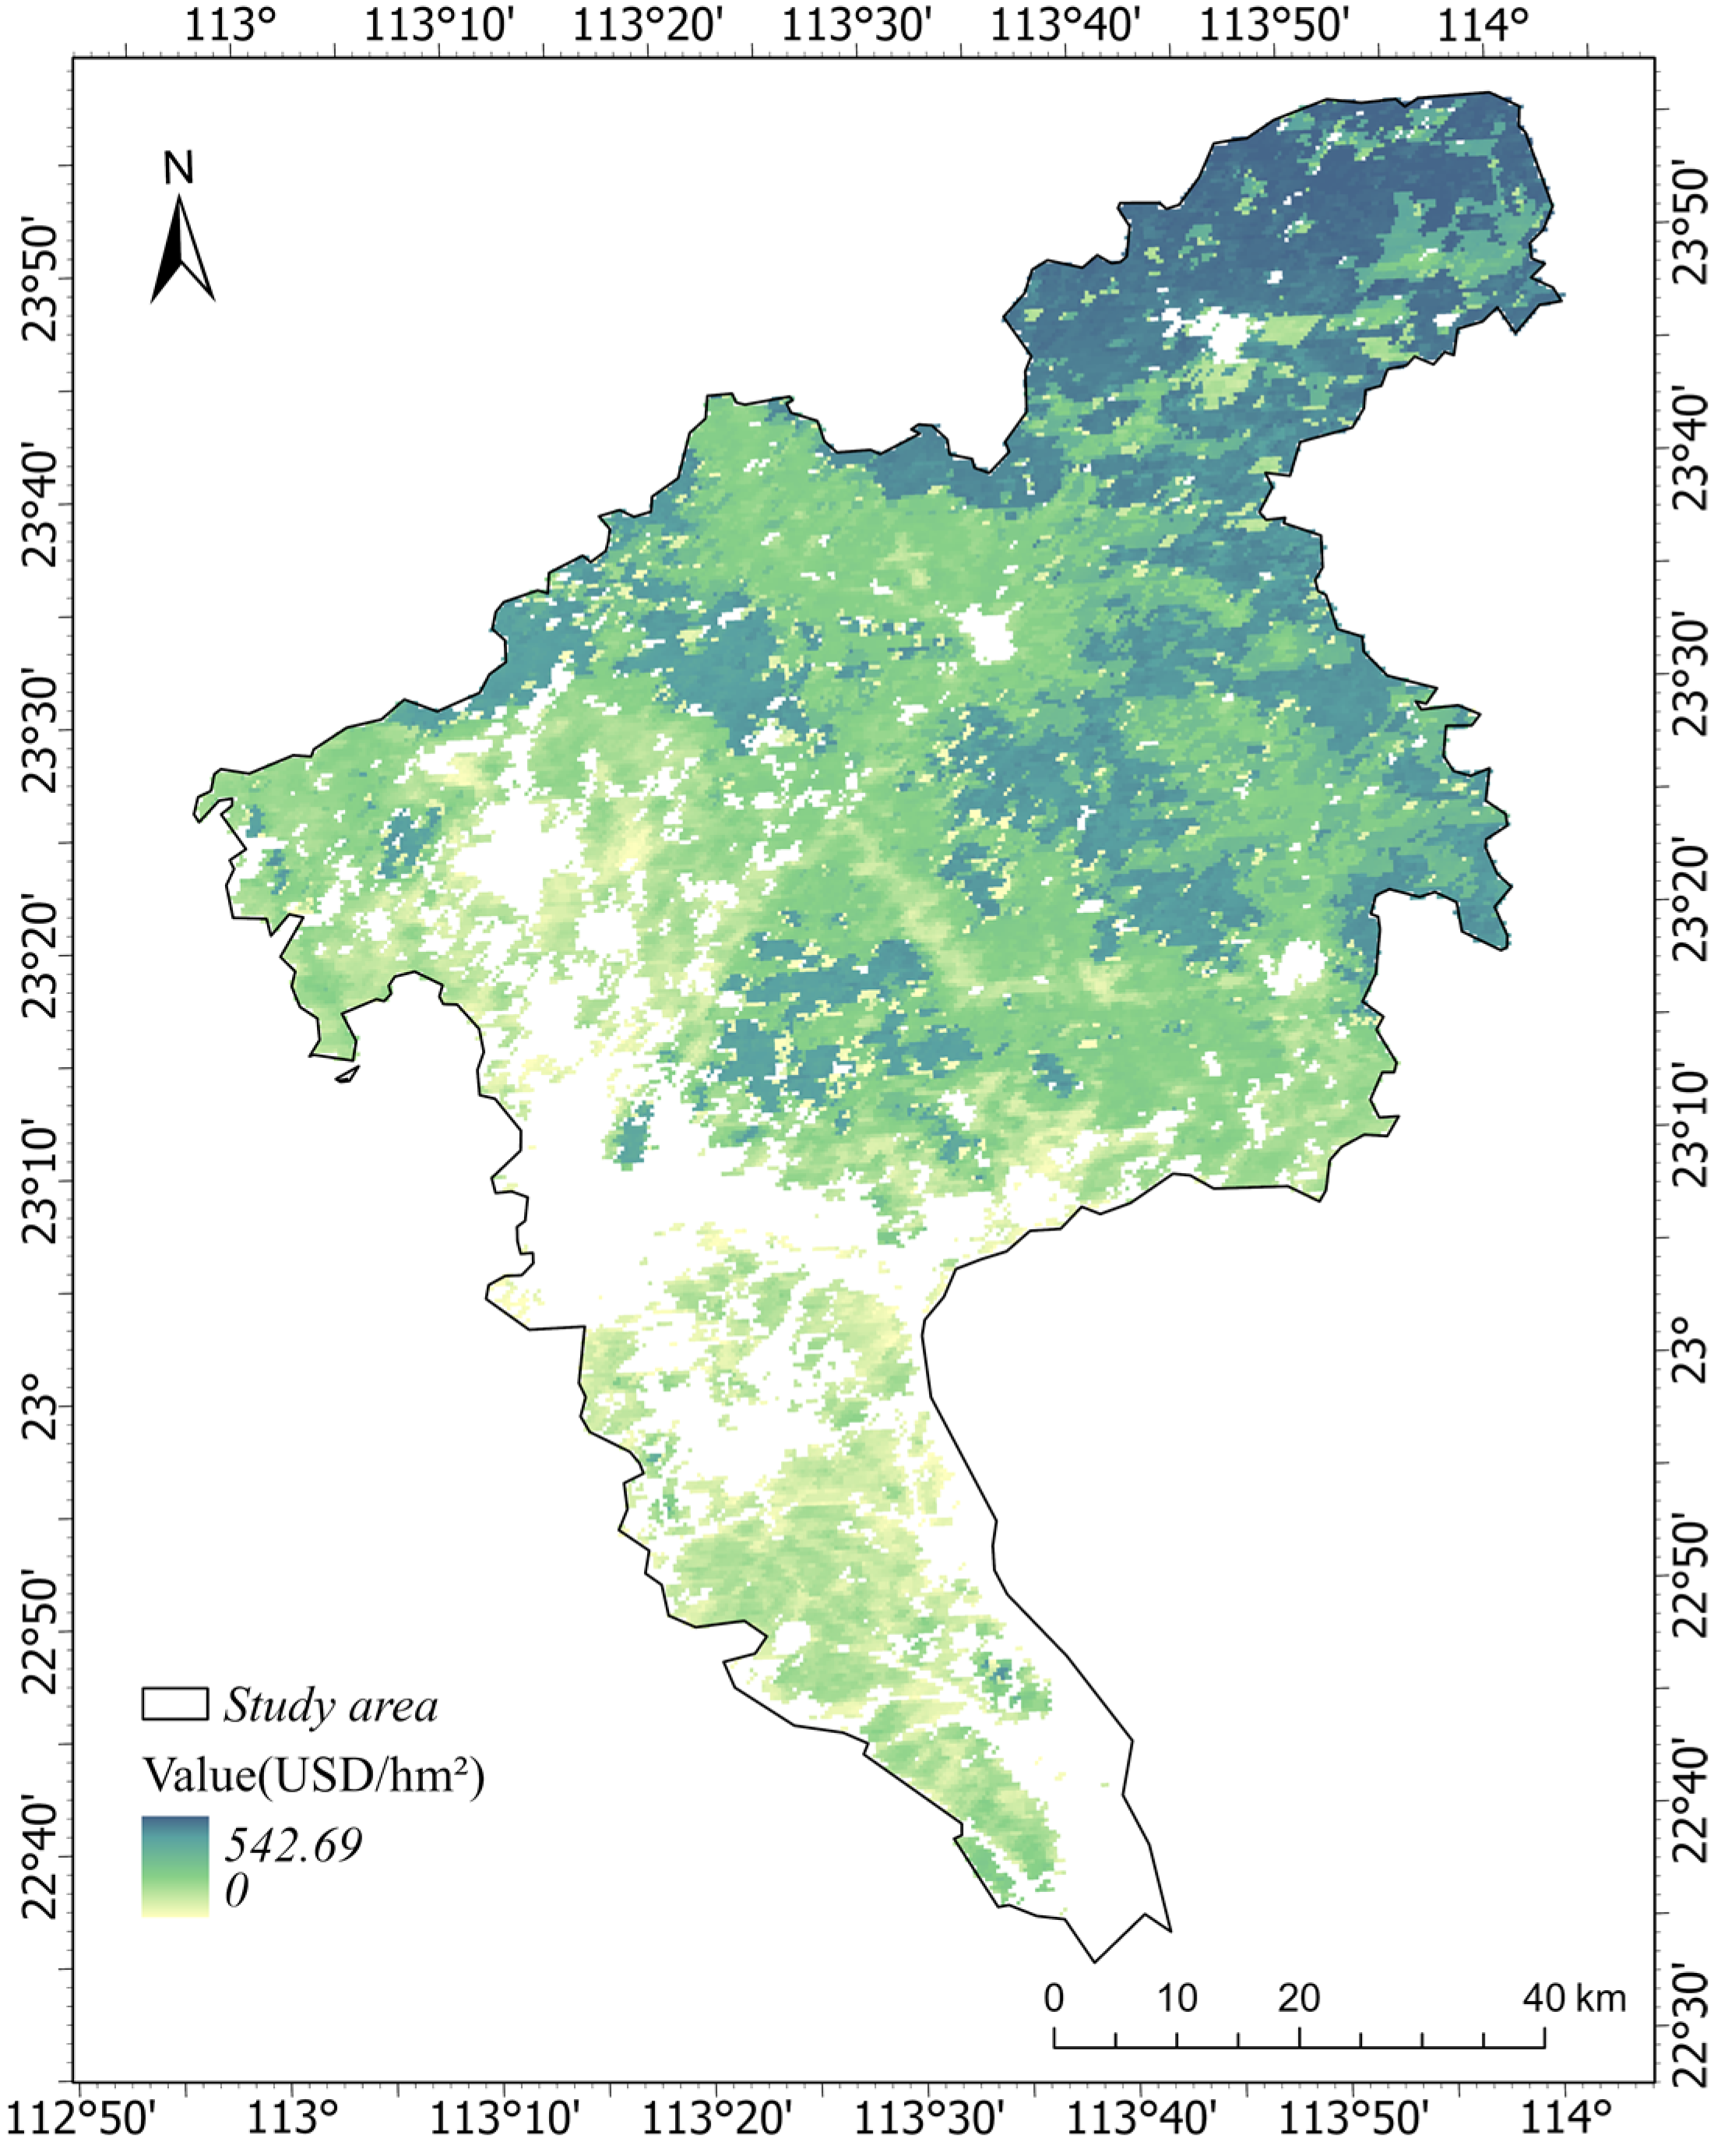
Estimation of the Value of Conserved Water

In this paper, the shadow engineering method is used to estimate the water conservation value of the green space system in Guangzhou, and the value of conserved water was calculated by Equation (2).
E S V w = A · P · λ · F
where ESVW is the value of water conservation in urban green space; A represents the area of green space (hm2), through the area statistics of land cover datasets, the areas of forest, shrub and grassland are 414,875.4228, 618.597 and 10,138.0086 hectares, respectively; P is the amount of precipitation (mm); λ is the coefficient of culvert water, and some research results show that the annual evapotranspiration of forest land in China accounts for 30–80% of the annual water drop, and the average annual evapotranspiration is about 56% of the annual precipitation [27]. This paper takes λ as a reference and takes it as 44%. F is the unit capacity cost of the reservoir, take USD 0.8859/m−3.

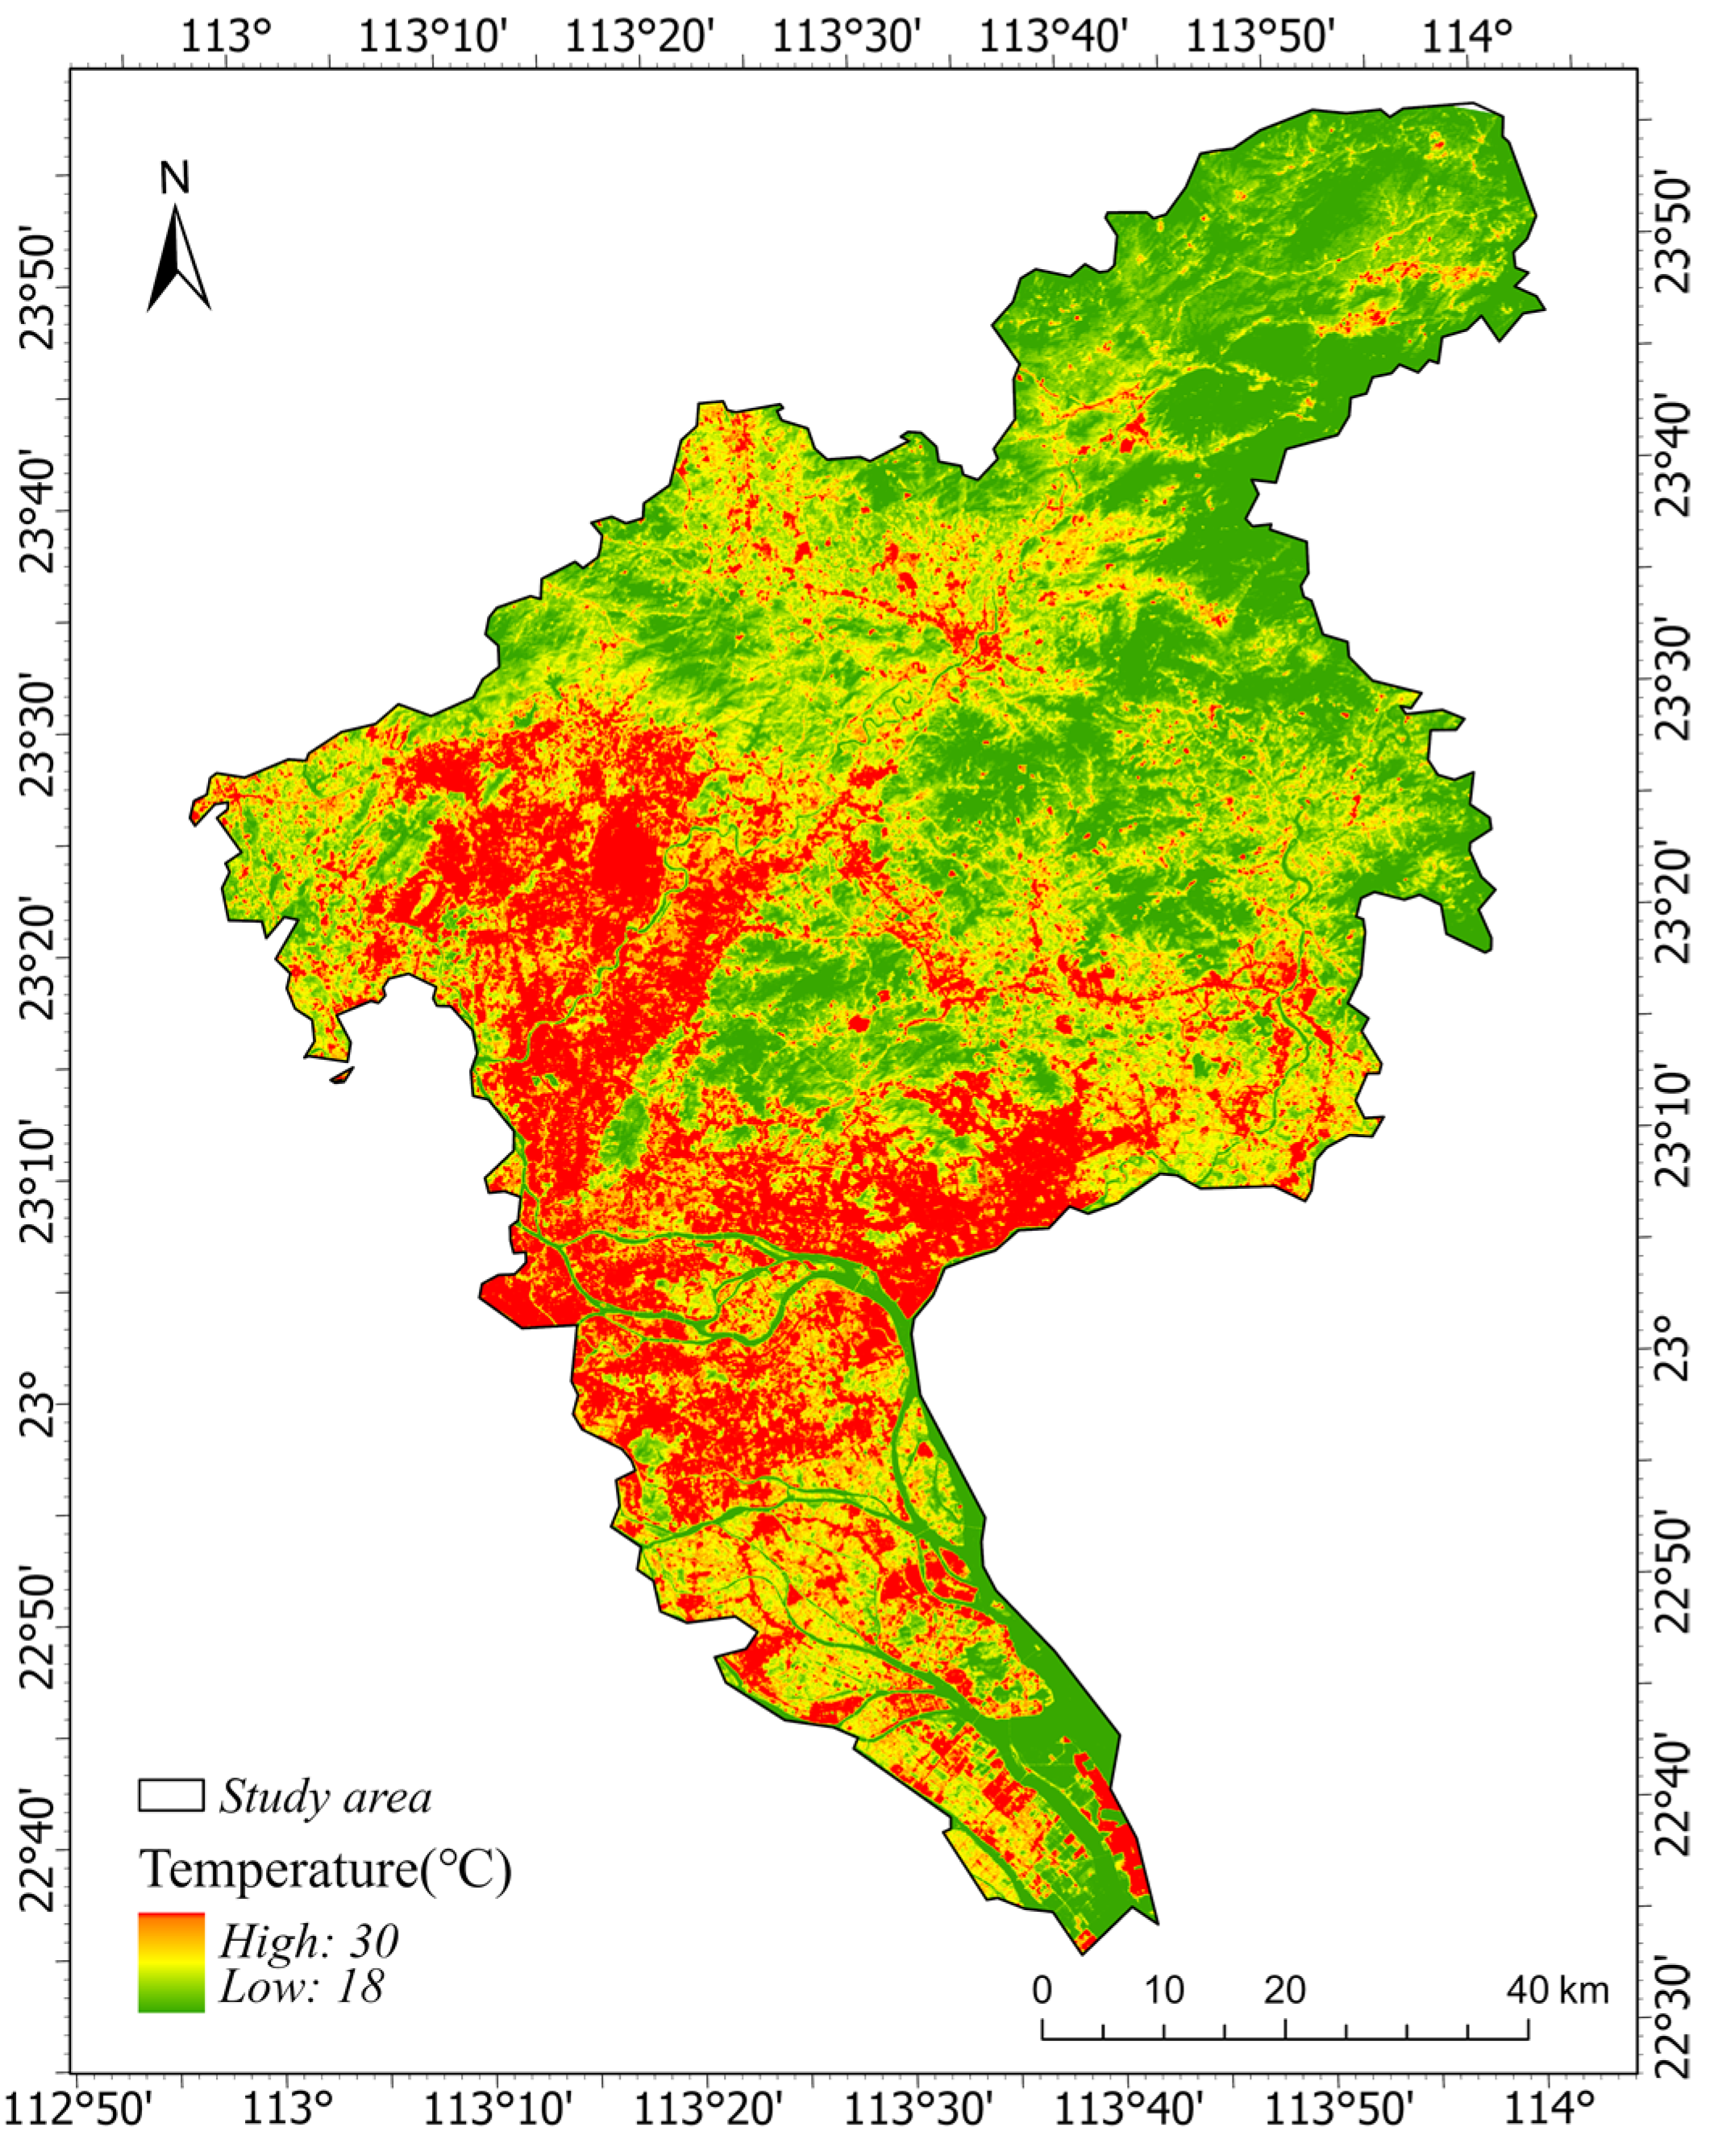
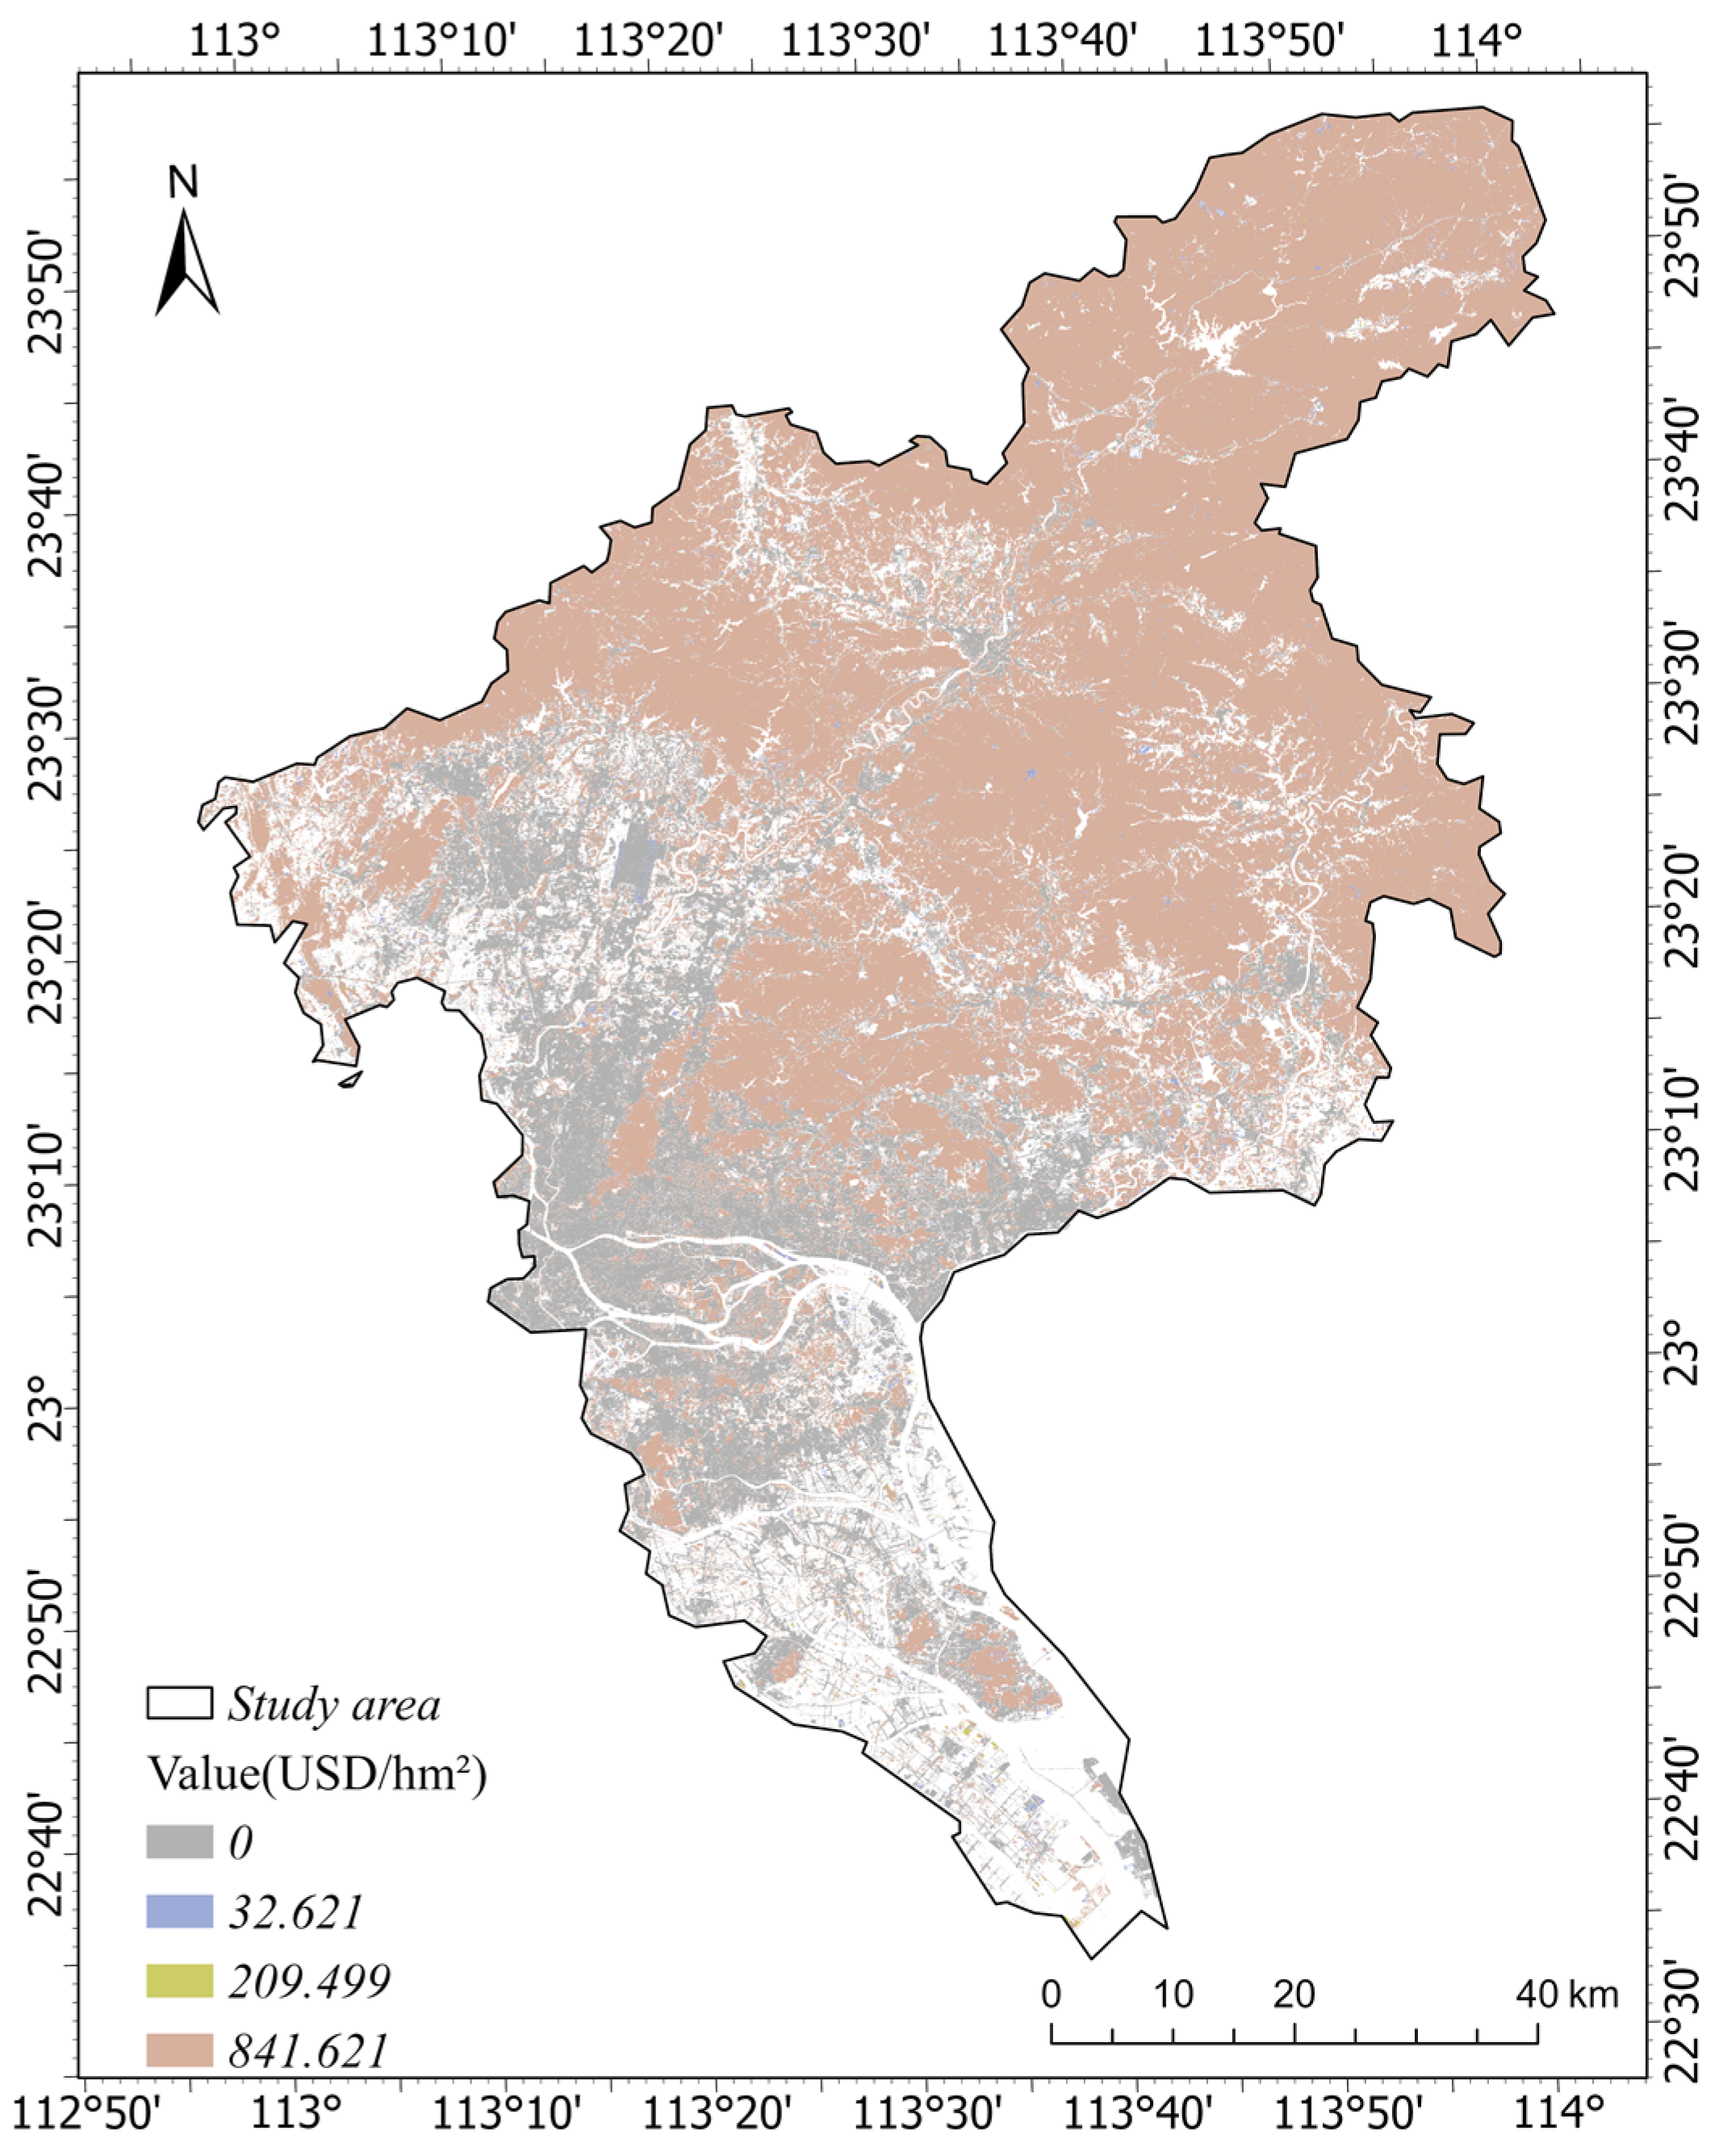
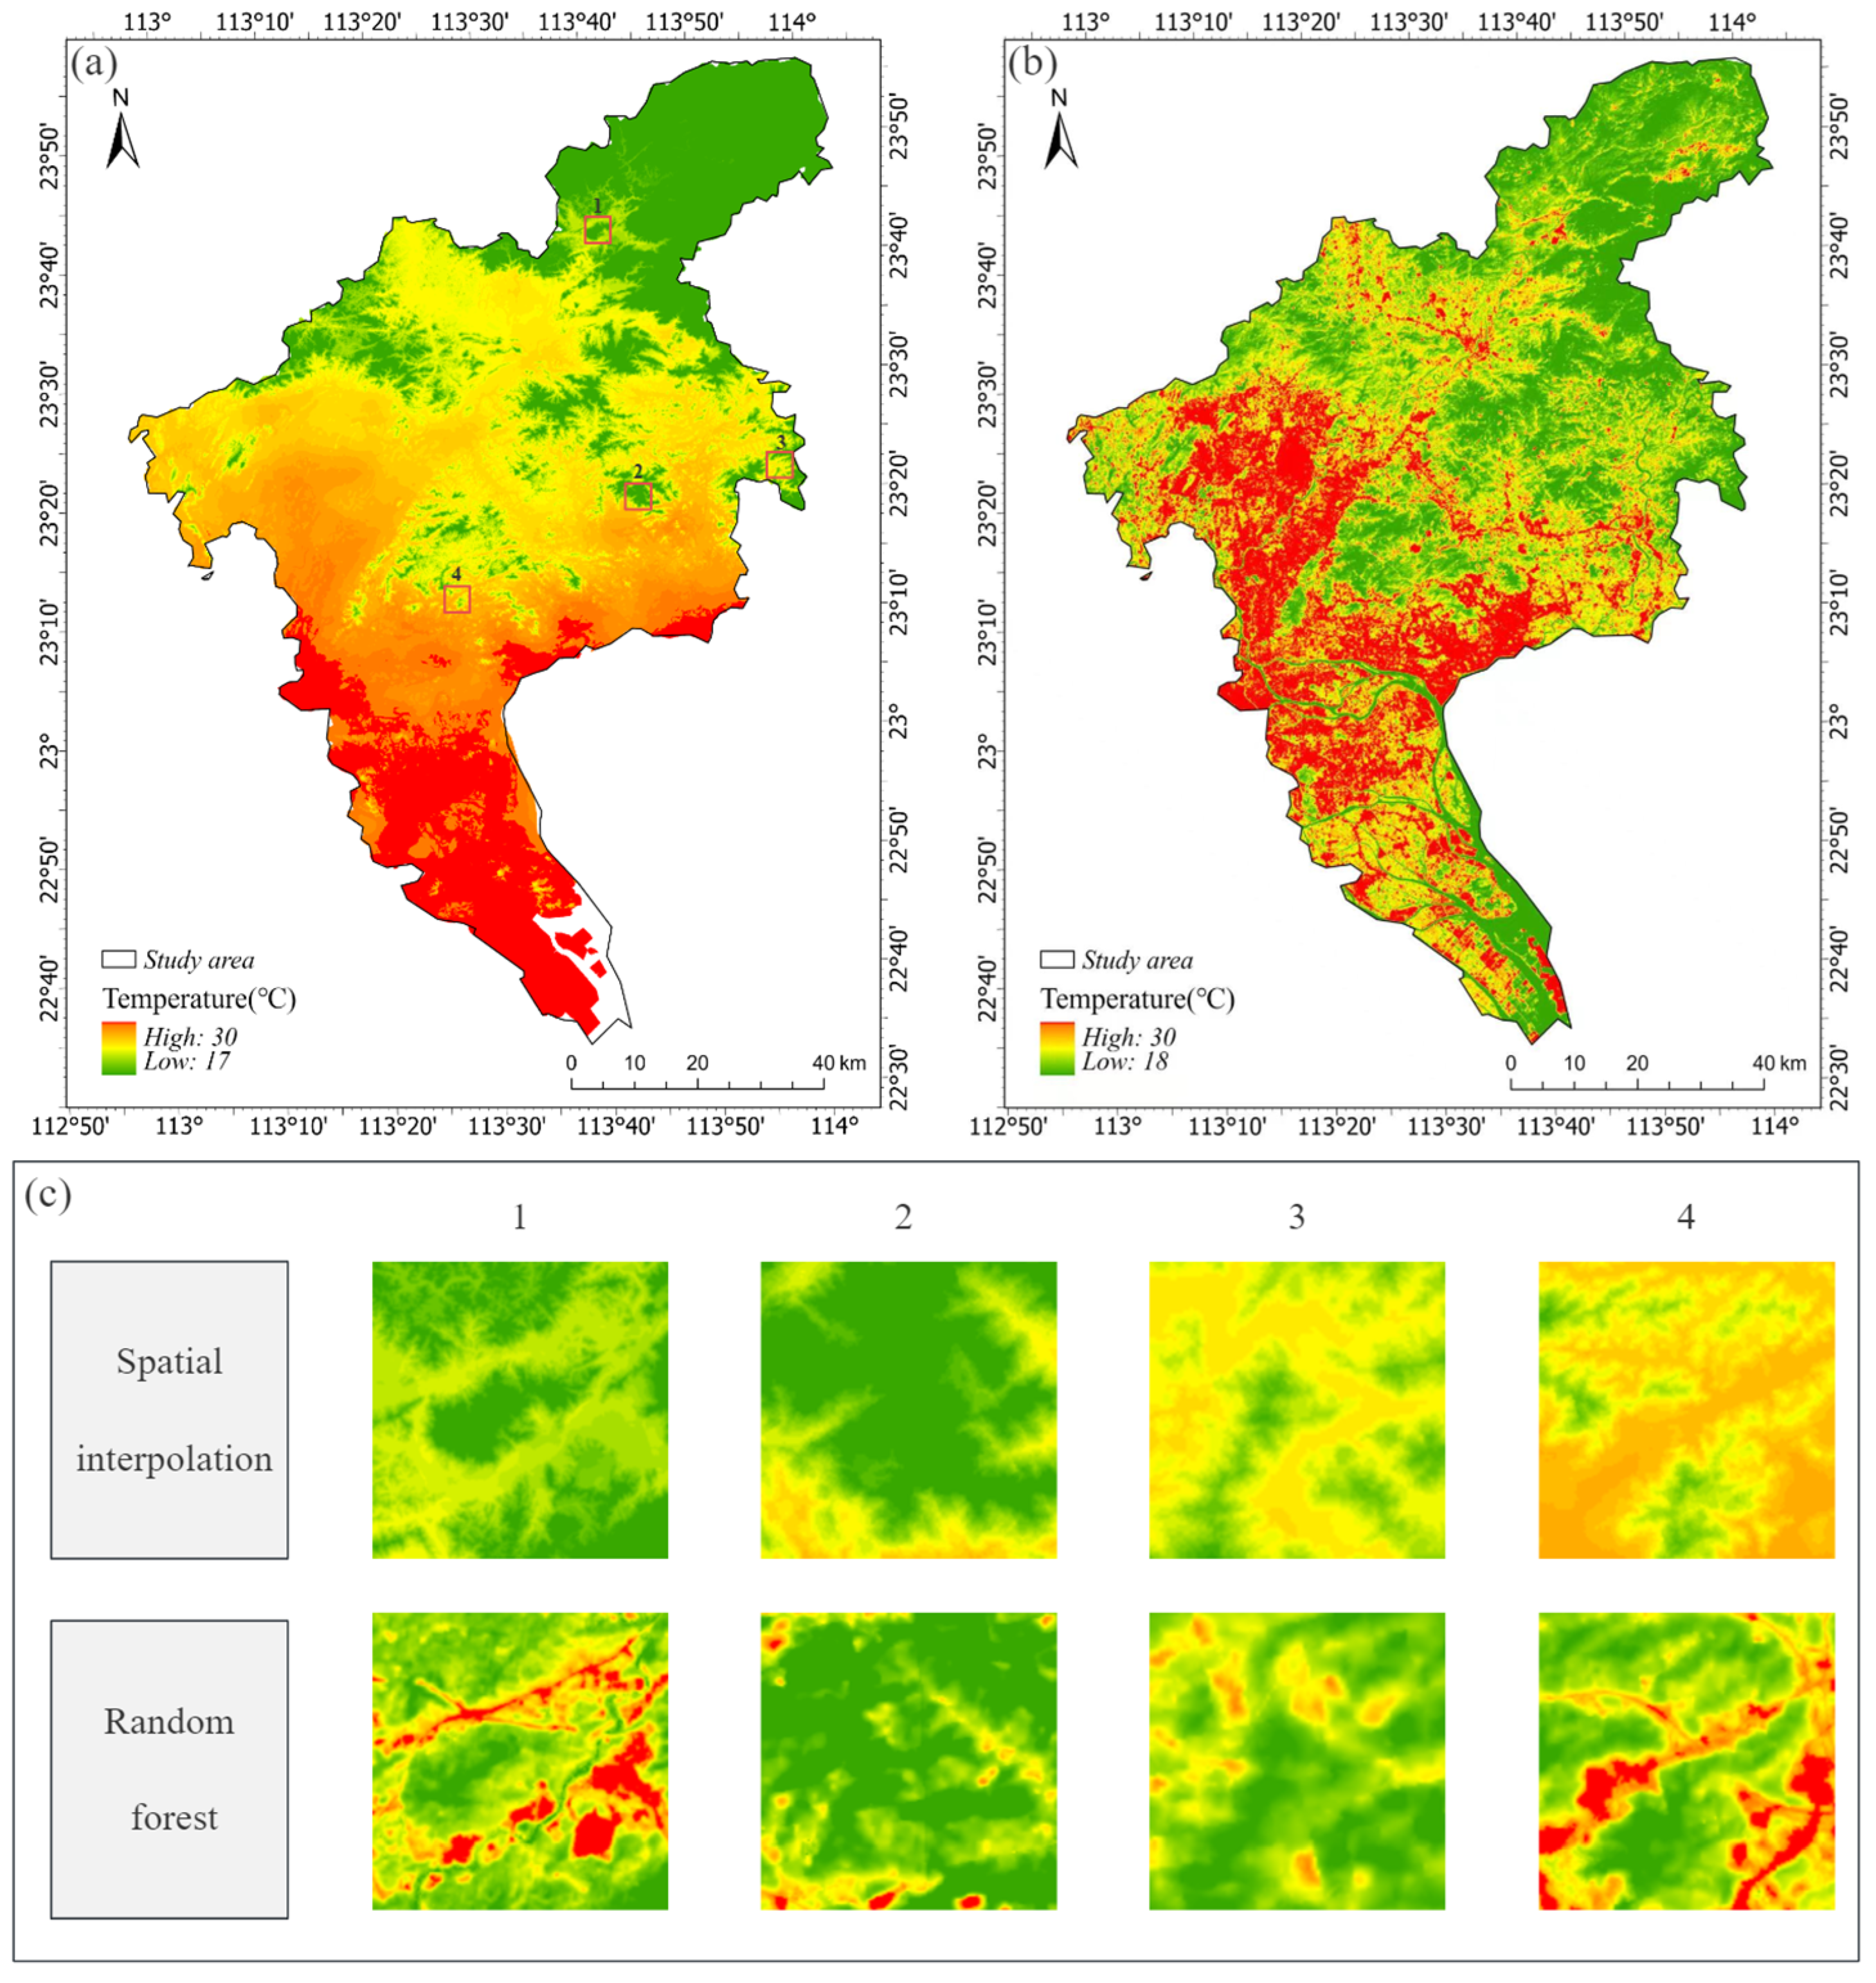
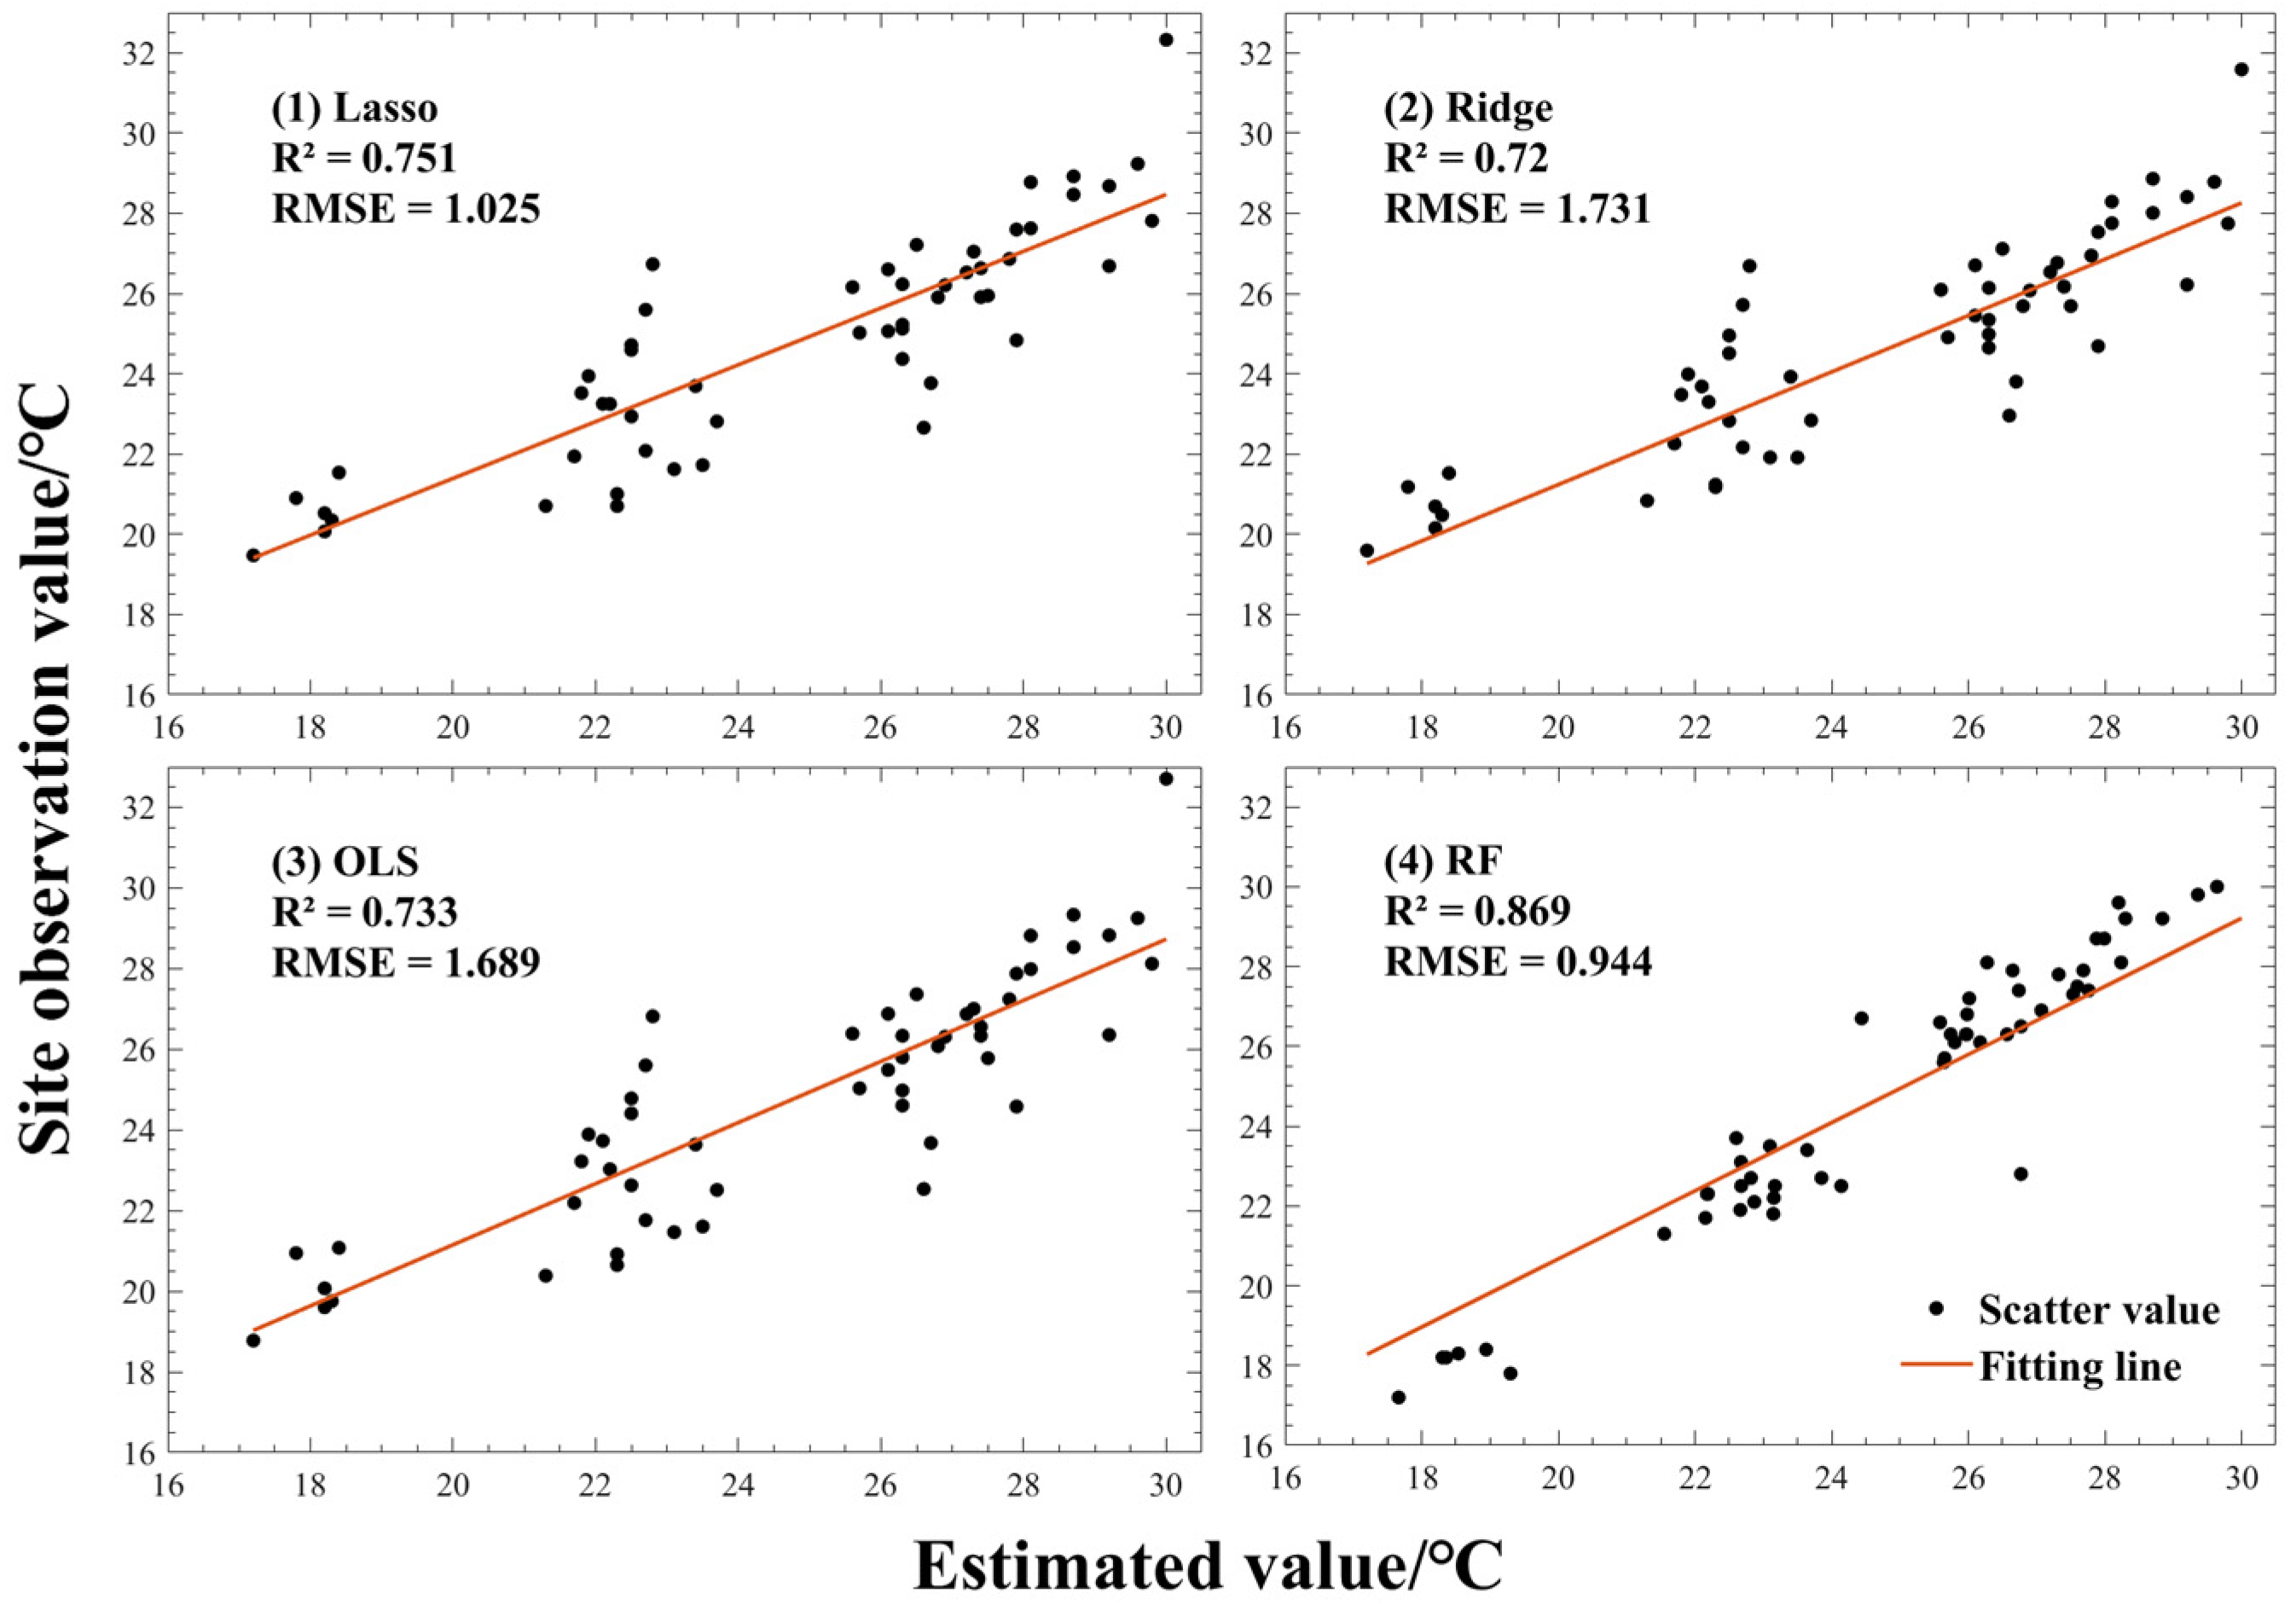
Estimation of the Value of Temperature Regulation

The air conditioner is regarded as a substitute for the cooling function of urban green space, and the power consumption of air conditioner to reduce the same temperature is calculated as the cooling value of urban green space system [2]. The specific calculation is shown in Equation (3).
E S V M = A T d i P G G
where ESVM represents the value of urban green space cooling; Tdi represents the average near-surface air temperature difference between urban green space and impervious surface, which is calculated by Equation (4); PG represents the electricity price, and the recommended price of USD 0.104/kWh−1 is calculated by the value of the gross ecosystem product value in this paper [28]; G represents the electrical energy consumed by an energy efficiency ratio of 4 air conditioners to absorb the heat released by 1 °C cooling of standard pressure air with an air thickness of 1.5 m [29], which is calculated to be 4616.72 (hm2 · kWh−1).
T d i = T s b u i l d i n g T s i
where T s b u i l d i n g indicates the average near-surface temperature of impervious surface; T s i indicates the average near-surface temperature of green space, both of which are derived from the temperature inversion results of random forest model and obtained by using the partition statistical tools of ArcGIS software. In this study, estimating the Near-surface-temperature was conducted using a random forest algorithm (RF) as a nonlinear multi-parameter optimization problem [30,31]. Random forest is a machine learning model that is widely used for tasks such as classification and regression [32,33]. As shown in Figure 3, it is an ensemble learning algorithm based on the Begging strategy, which forms a plurality of sub-datasets by extracting samples from the original dataset, constructing a decision tree for each sub-dataset, randomly selecting a part of the features at each node for splitting, so as to generate a specified number of decision trees, and finally summarizing the weighted average calculation of the prediction results of all decision trees to form the final prediction.
The elevation source required for stochastic forest model input is in Section 2.2; Albedo’s average surface reflectance from the Panchromatic band of the Landsat 8-9 C2 L2SP product; NDVI reference Equation (15); MNDWI is calculated according to the following Equation (5) [34]:
M N D W I = ρ G R E E N ρ S W I R / ρ G R E E N + ρ S W I R
where ρGREEN stands for the green band, and ρSWIR stands for the shortwave infrared band.
The surface temperature (LST) is calculated according to the inverse function [35] of Planck’s formula: K1 and K2 are constants of TIRS Band10, and the units are W/(m2·µm·sr) and K. B(Ts) is the blackbody radiation brightness value.
T s = K 2 / l n K 1 / B T s + 1 273.15
According to the radiation transmission Equation (7), B T s is obtained [36].
B T s = L λ L u τ · 1 ε L d / ε · τ
where B(Ts) is the thermal radiation brightness of the blackbody at Ts derived from Planck’s law, where Ts is the real surface temperature; Lλ is the thermal infrared radiation brightness value received by the satellite sensor, where λ is the thermal radiation brightness of the black body in Ts derived from Planck’s law; Lu is the upward radiation brightness of the atmosphere; τ is the atmospheric transmittance in thermal infrared band; ε is the surface emissivity; Ld is the downward radiation brightness of the atmosphere. According to Kirchhoff’s law, the emissivity is equal to the absorption rate, so (1 − ε) can represent the reflectivity.
The land surface emissivity in this study area is calculated by the following equation, where ε w a t e r , ε b u i l d i n g and ε s u r f a c e represent the specific emissivity of pixels in water, town and natural surface, respectively [37].
ε = ε w a t e r + ε b u i l d i n g + ε s u r f a c e
ε w a t e r = 0.995 · F c w a t e r
ε b u i l d i n g = 0.9589 + 0.086 · F c o t h e r 0.0671 · F c o t h e r 2
ε s u r f a c e = 0.9625 + 0.0614 · F c v e g 0.0461 · F c v e g 2
where F c w a t e r ,   F c v e g   a n d   F c o t h e r , respectively, represent the vegetation coverage of water body, full coverage vegetation and other ground objects. In this paper, the model [38] based on the pixel dichotomy model is used to solve the vegetation coverage.
F c w a t e r = 0
F c o t h e r = N D V I N D V I s o i l / N D V I v e g N D V I s o i l
F c v e g = 1
where NDVIsoil is the NDVI value of the completely bare soil or the area without vegetation coverage, and NDVIVeg represents the NDVI value of the pixel completely covered by vegetation, that is, the NDVI value of the pixel with pure vegetation. The empirical values are NDVIVeg = 0.70 and NDVIsoil = 0.00 [39].
N D V I = ρ N I R ρ R E D / ρ N I R + ρ R E D
where ρNIR stands for the near-infrared band, and ρRED stands for the infrared band.

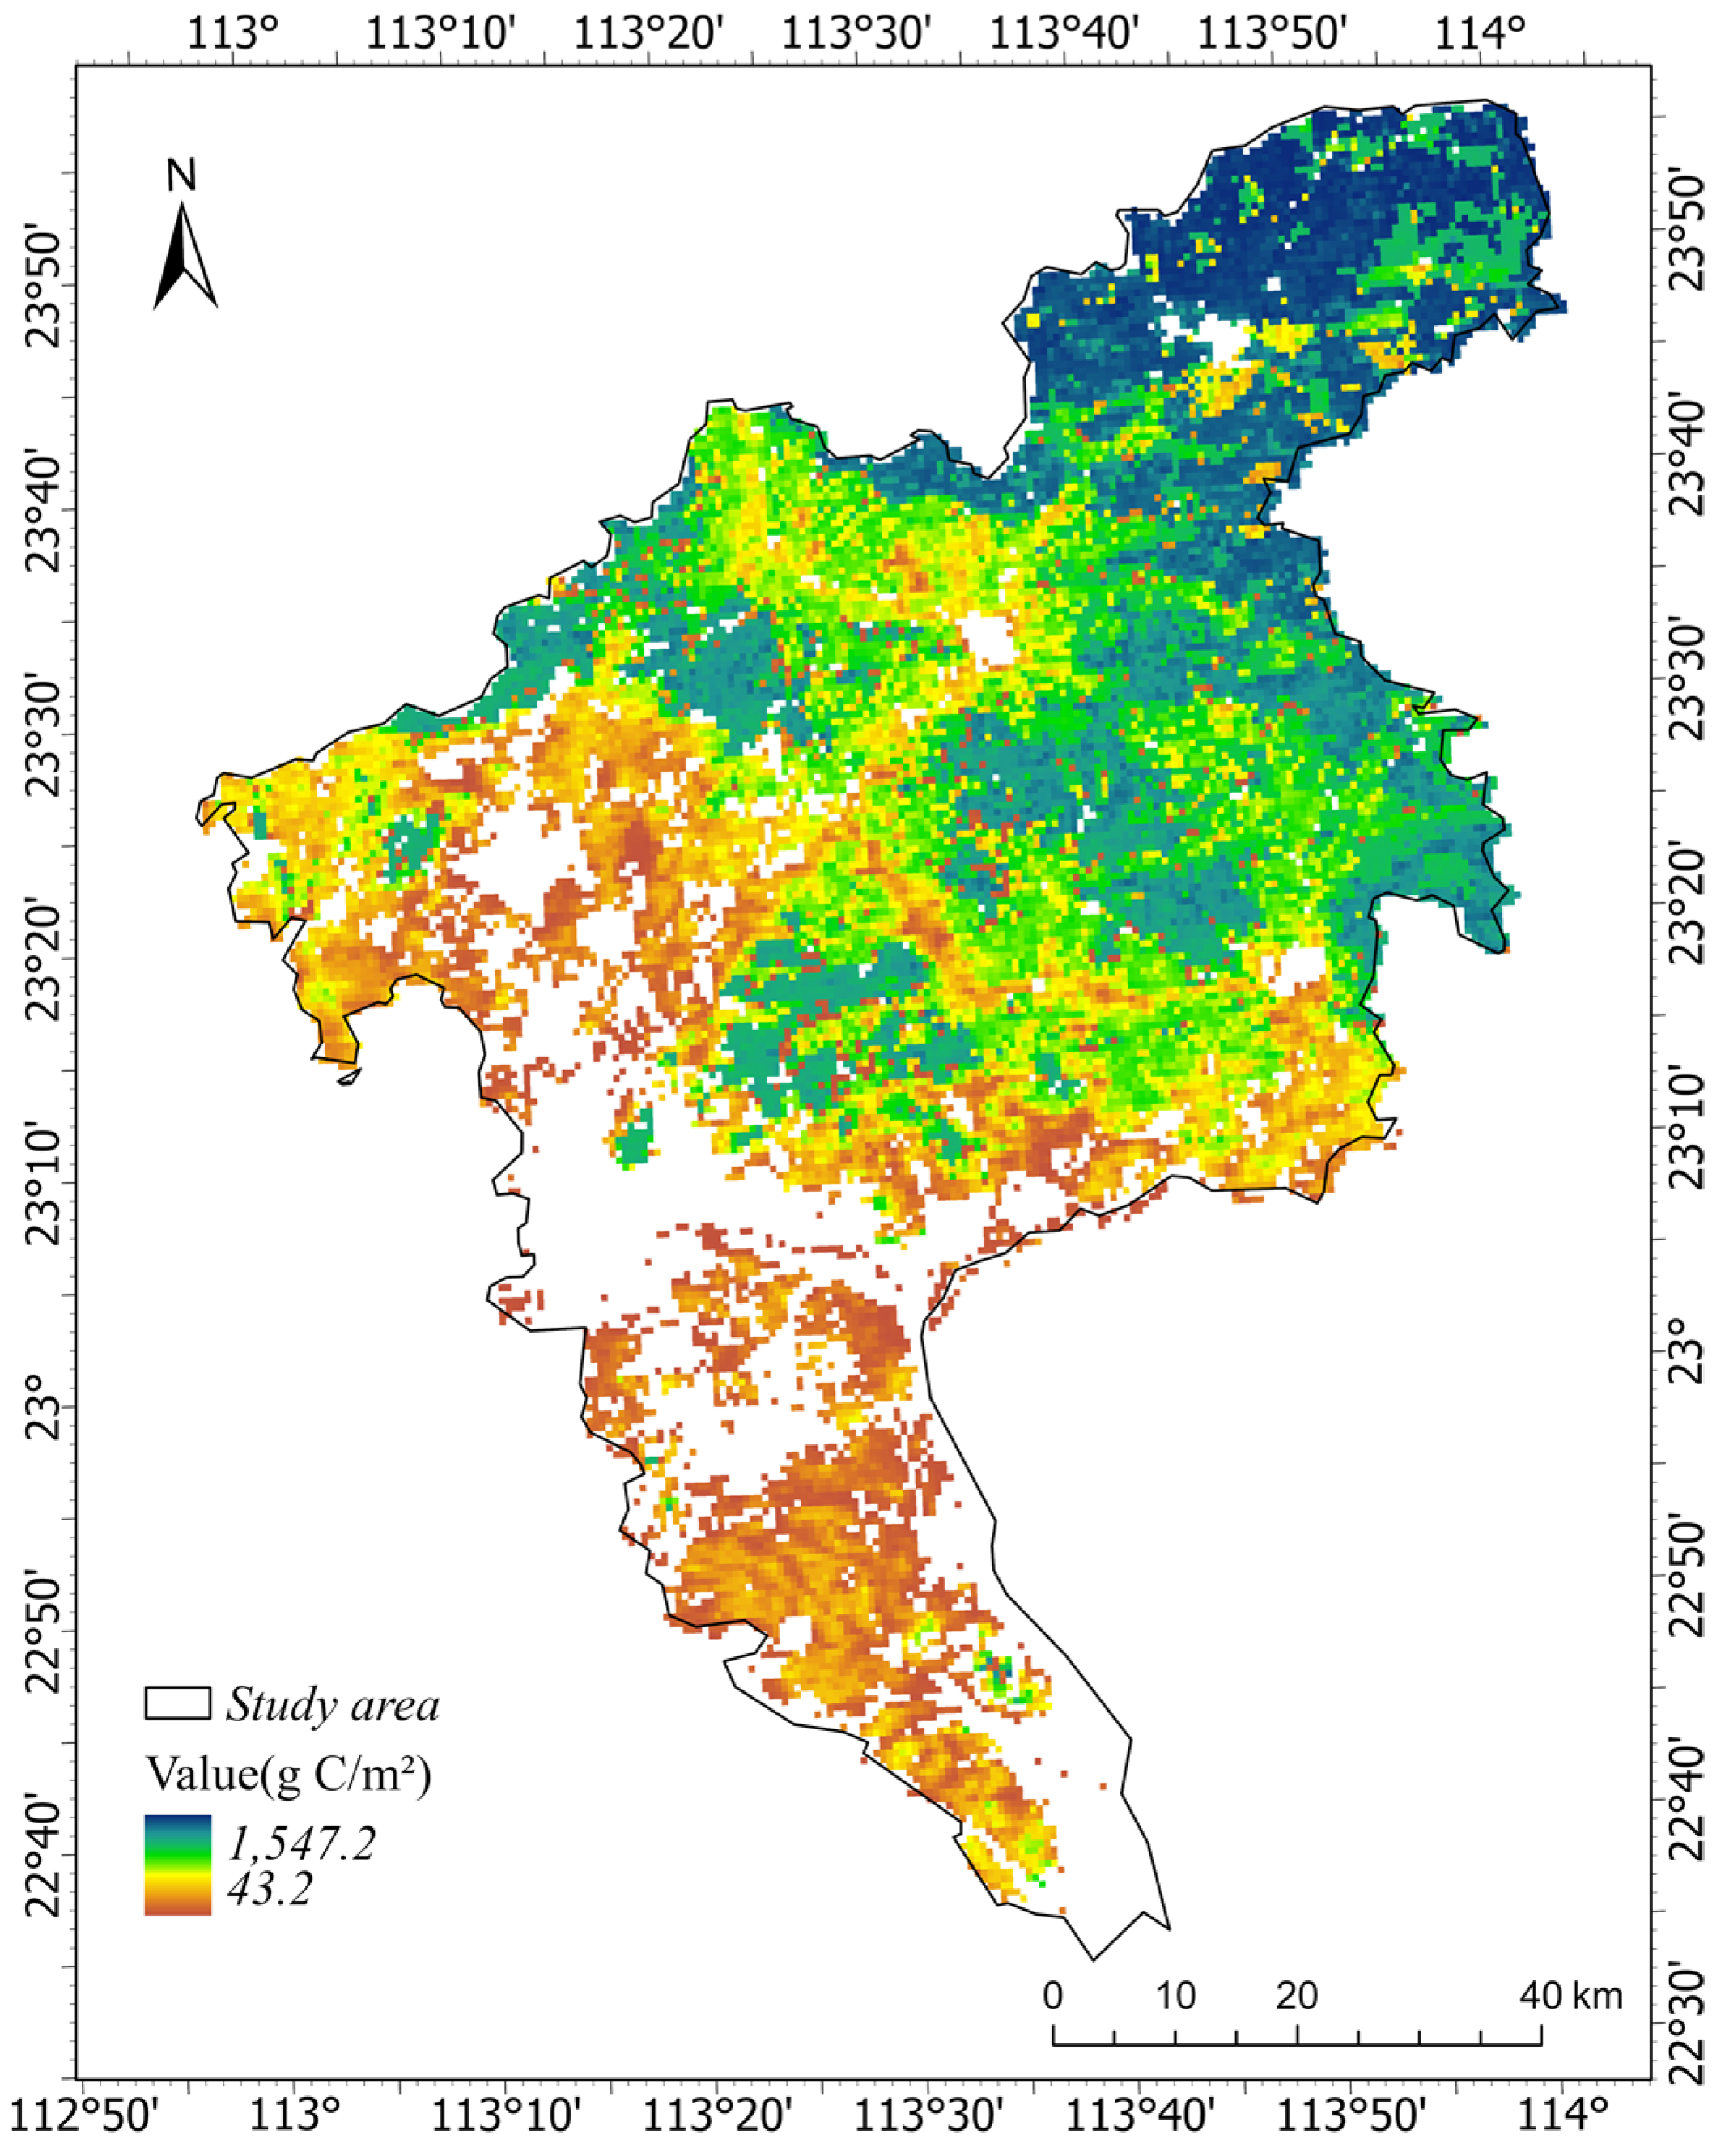
Estimation of Carbon Sequestration and Oxygen Release Value

On the basis of the measurement of vegetation net primary productivity (NPP) [40], remote sensing technology and ecological economics methods were used to estimate the reference Equations (16) and (17) of carbon sequestration and oxygen release value of urban green space in the study area.
E S V o = R o × C o
E S V c = F c × C E A
where Ro is the amount of oxygen released and Fc is the amount of carbon sequestration, which can be calculated by combining the respiration equation: for every 1 g of dry matter formed, 1.62 g of CO2 can be fixed, and 1.2 g of O2 can be released, and the dry matter mass can be calculated from NPP according to the content of carbon in the dry matter of plants about 45% [41], so the balance of carbon and oxygen is (NPP/45%) × 1.62 and (NPP/45%) × 1.20, respectively. Co is the cost of industrial oxygen production, with a value of USD 101.488/t [42], CEA(USD 9.30/t) is the average transaction price of CEA in China carbon market in 2023.

Estimation of SO2 Absorption Value

The value of SO2 uptake by greenfield systems is estimated using the recovery cost method, which is calculated as follows:
E S V s = A · Q s · P s
where Ys represents the value of SO2 absorbed by urban green space; Qs is the amount of SO2 absorbed per unit of green area (t·hm−2), this paper refers to the research of Gong Wei et al. [43], the SO2 absorption capacity of trees, shrubs and grasslands is 85.0, 18.9 and 8.9 kg/(hm2·a), respectively, Ps is the SO2 treatment cost, and the tax amount per pollution equivalent of air pollutants is according to the “Environmental Protection Tax Item and Tax Table”. The minimum standard is USD 0.174, and the pollution equivalent value of SO2 is 0.95 (unit: kg).

Estimation of the Value of Trapped Dust

In this paper, the cost substitution method is used to estimate the dust retention value of green space system, and the specific estimation refers to Equation (19).
E S V d = A · Q i · P d
where ESVD represents the value of dust retention in urban green space; Qi indicates that the dust retention capacity of trees, shrubs and grasslands is 12.9, 3.2 and 0.5 ton/(hm2·a), respectively; Pd(=USD 65.54/ton) is the cost of dust removal, which is estimated in this paper according to the recommended pricing of the value of purified industrial dust [40].

Soil Conservation Value Estimation

Urban green space plays an important role in soil conservation, and this value is estimated as follows:
E S V A c = E s + E n
E s = A × A c × B ÷ H + 10,000 × ρ
E n = A × A C ÷ ρ × 24 % × C
where E is the soil retention value; Es is the value of reducing land loss; En is the value of reducing siltation disaster. Ac is the amount of soil retained; B is the average annual income of forestry (USD 247.195/hm2 · a); H is the soil thickness (0.6 m); ρ is the bulk density of soil (1.5 g/cm3) [43]; C is the cost of earthwork removal of USD 1.827/m3 [40].
A c = R · K · L S 1 C · P
where R is the annual rainfall erosivity index, K is the soil erodibility factor, LS is the slope factor and slope length factor, C is the vegetation cover factor, and P is the soil conservation measure factor, which refers to the ratio of soil loss of specific soil and water conservation measures to the soil loss of the corresponding slope tillage plots without conservation measures. The p-value of a good measure is small, and the p-value of the opposite is large.

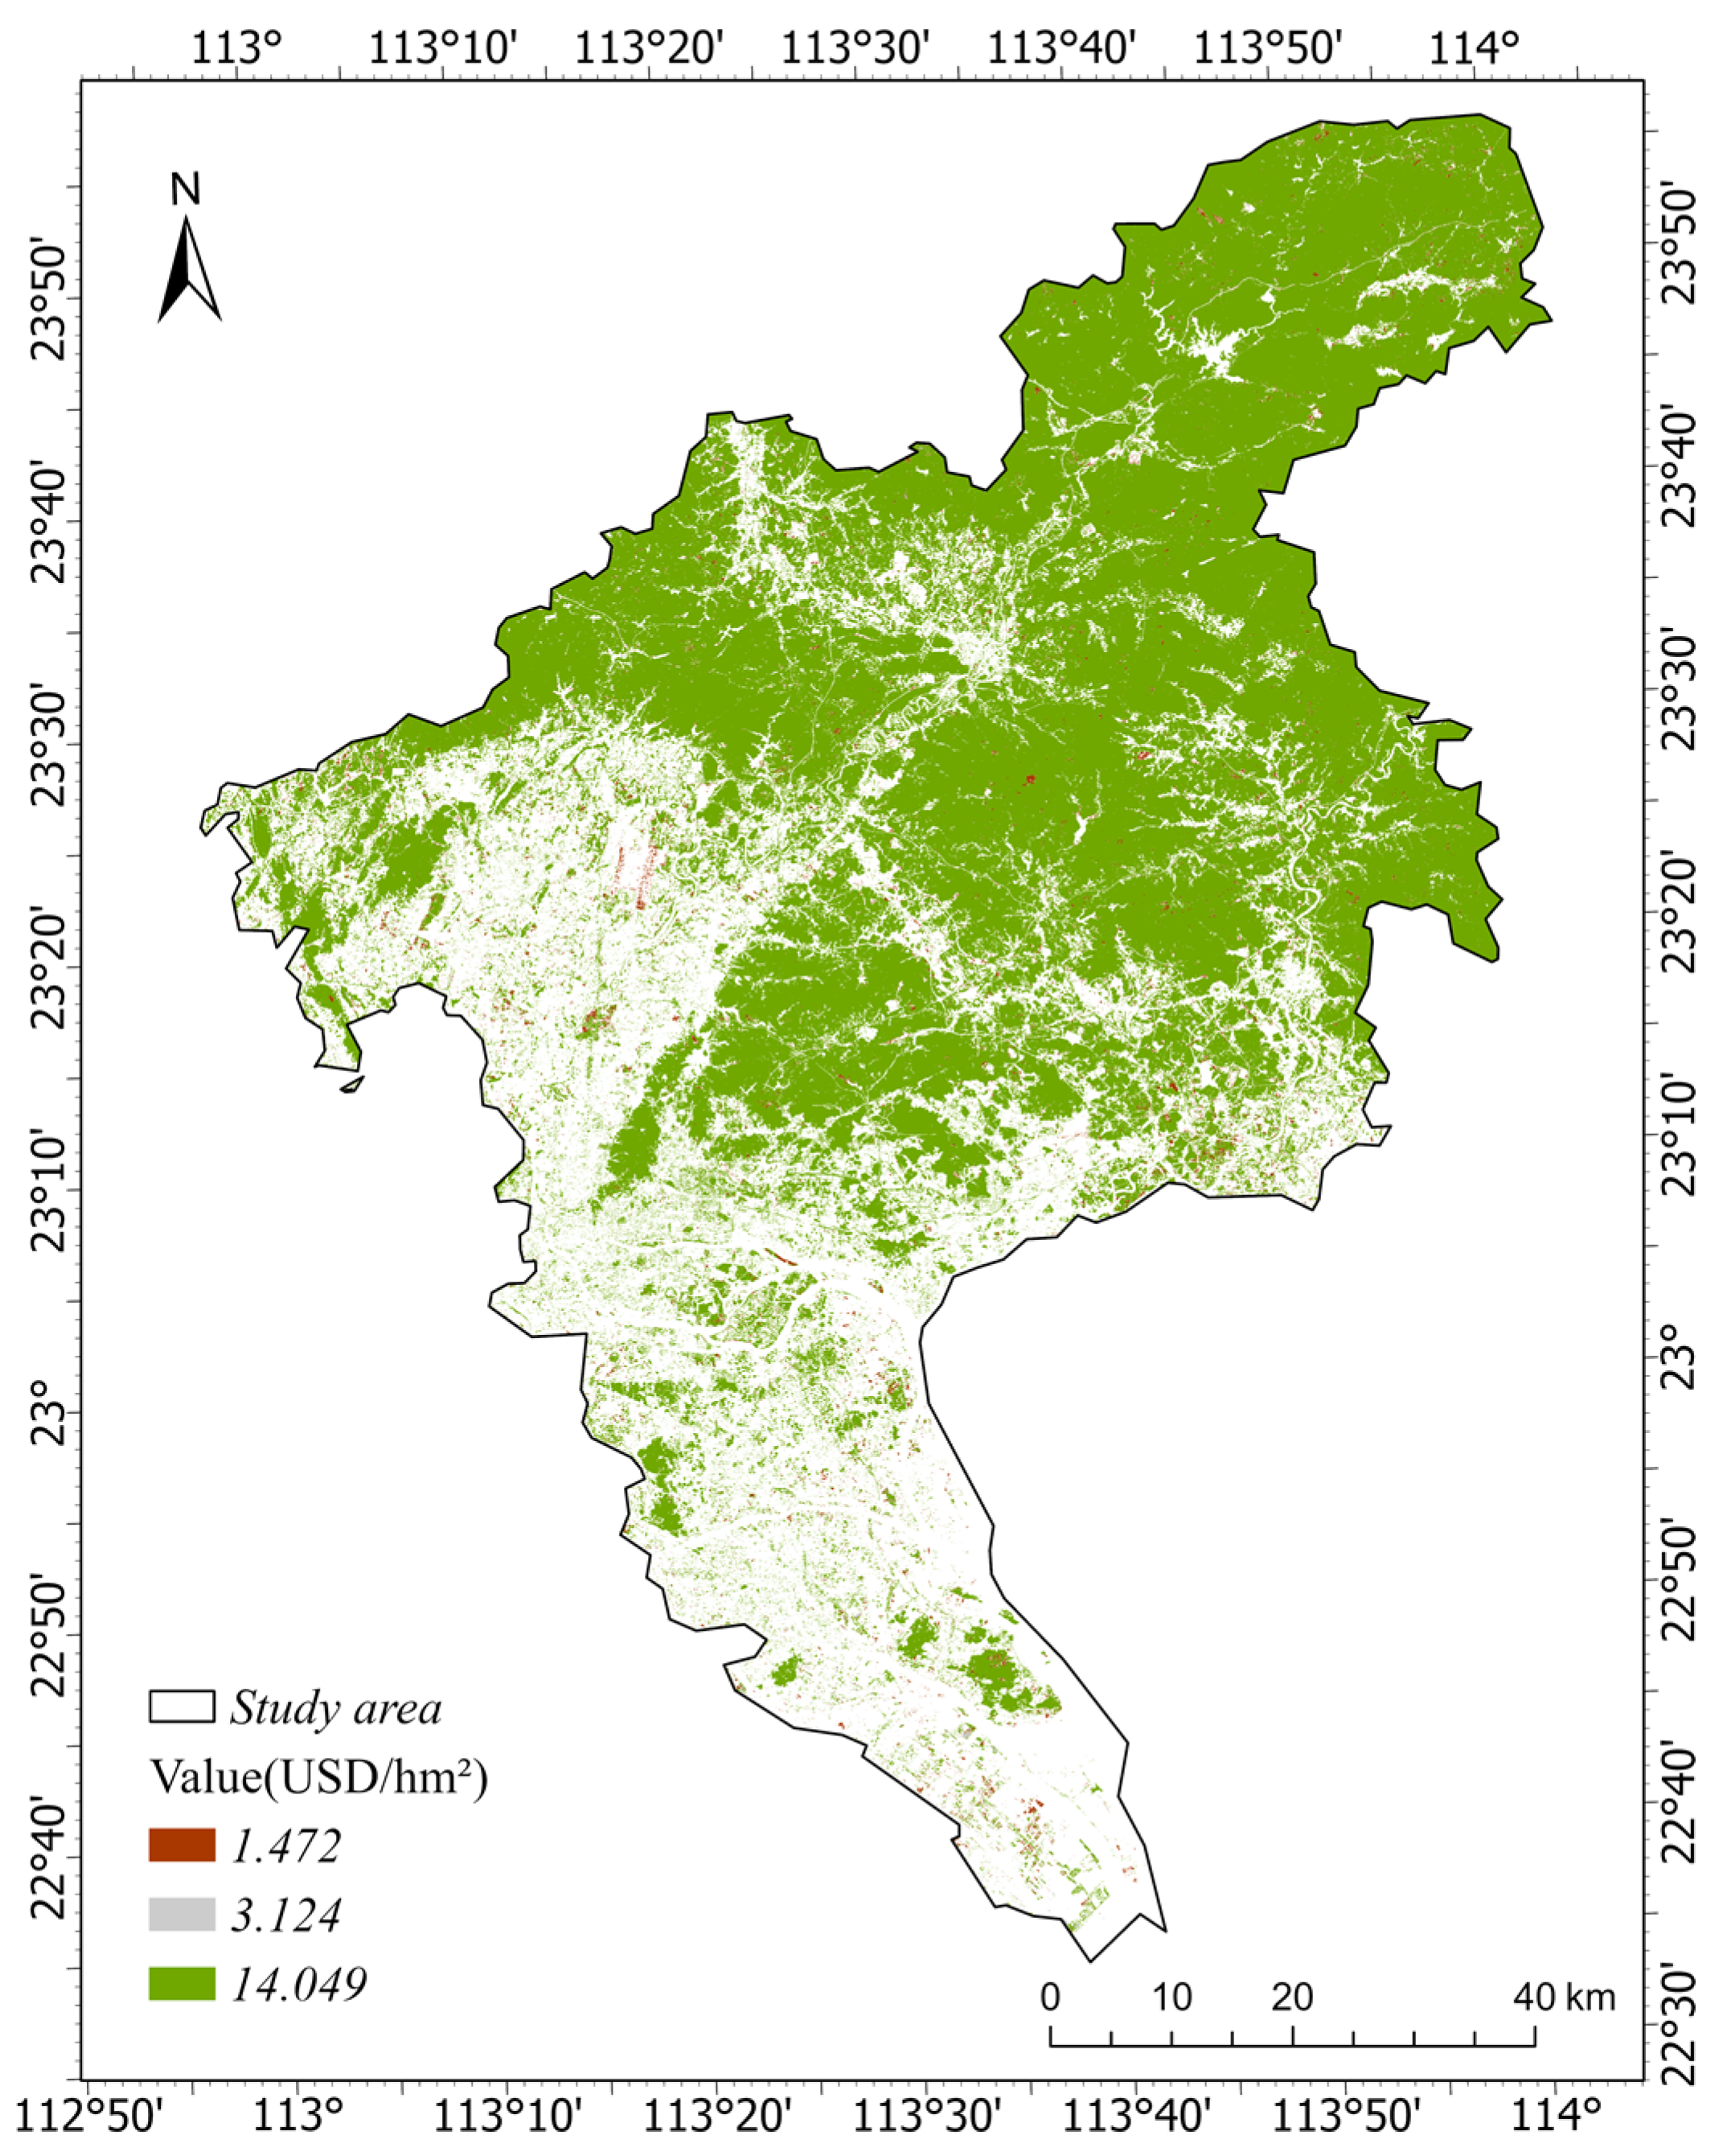
Estimation of Biodiversity Conservation Value

The opportunity cost method is used to estimate the biodiversity conservation value of urban green space, and the calculation formula is as follows:
E S V b = A · F f
where ESVb represents the conservation value of urban green space biodiversity; Ff is the opportunity cost of species loss per unit area, and the annual opportunity cost of species loss per unit area of forest land, shrub and grassland is 2899.643, 1499.822 and 724.911 (USD/hm2·a) according to the Code for Assessment of Forest Ecosystem Service Function [44].

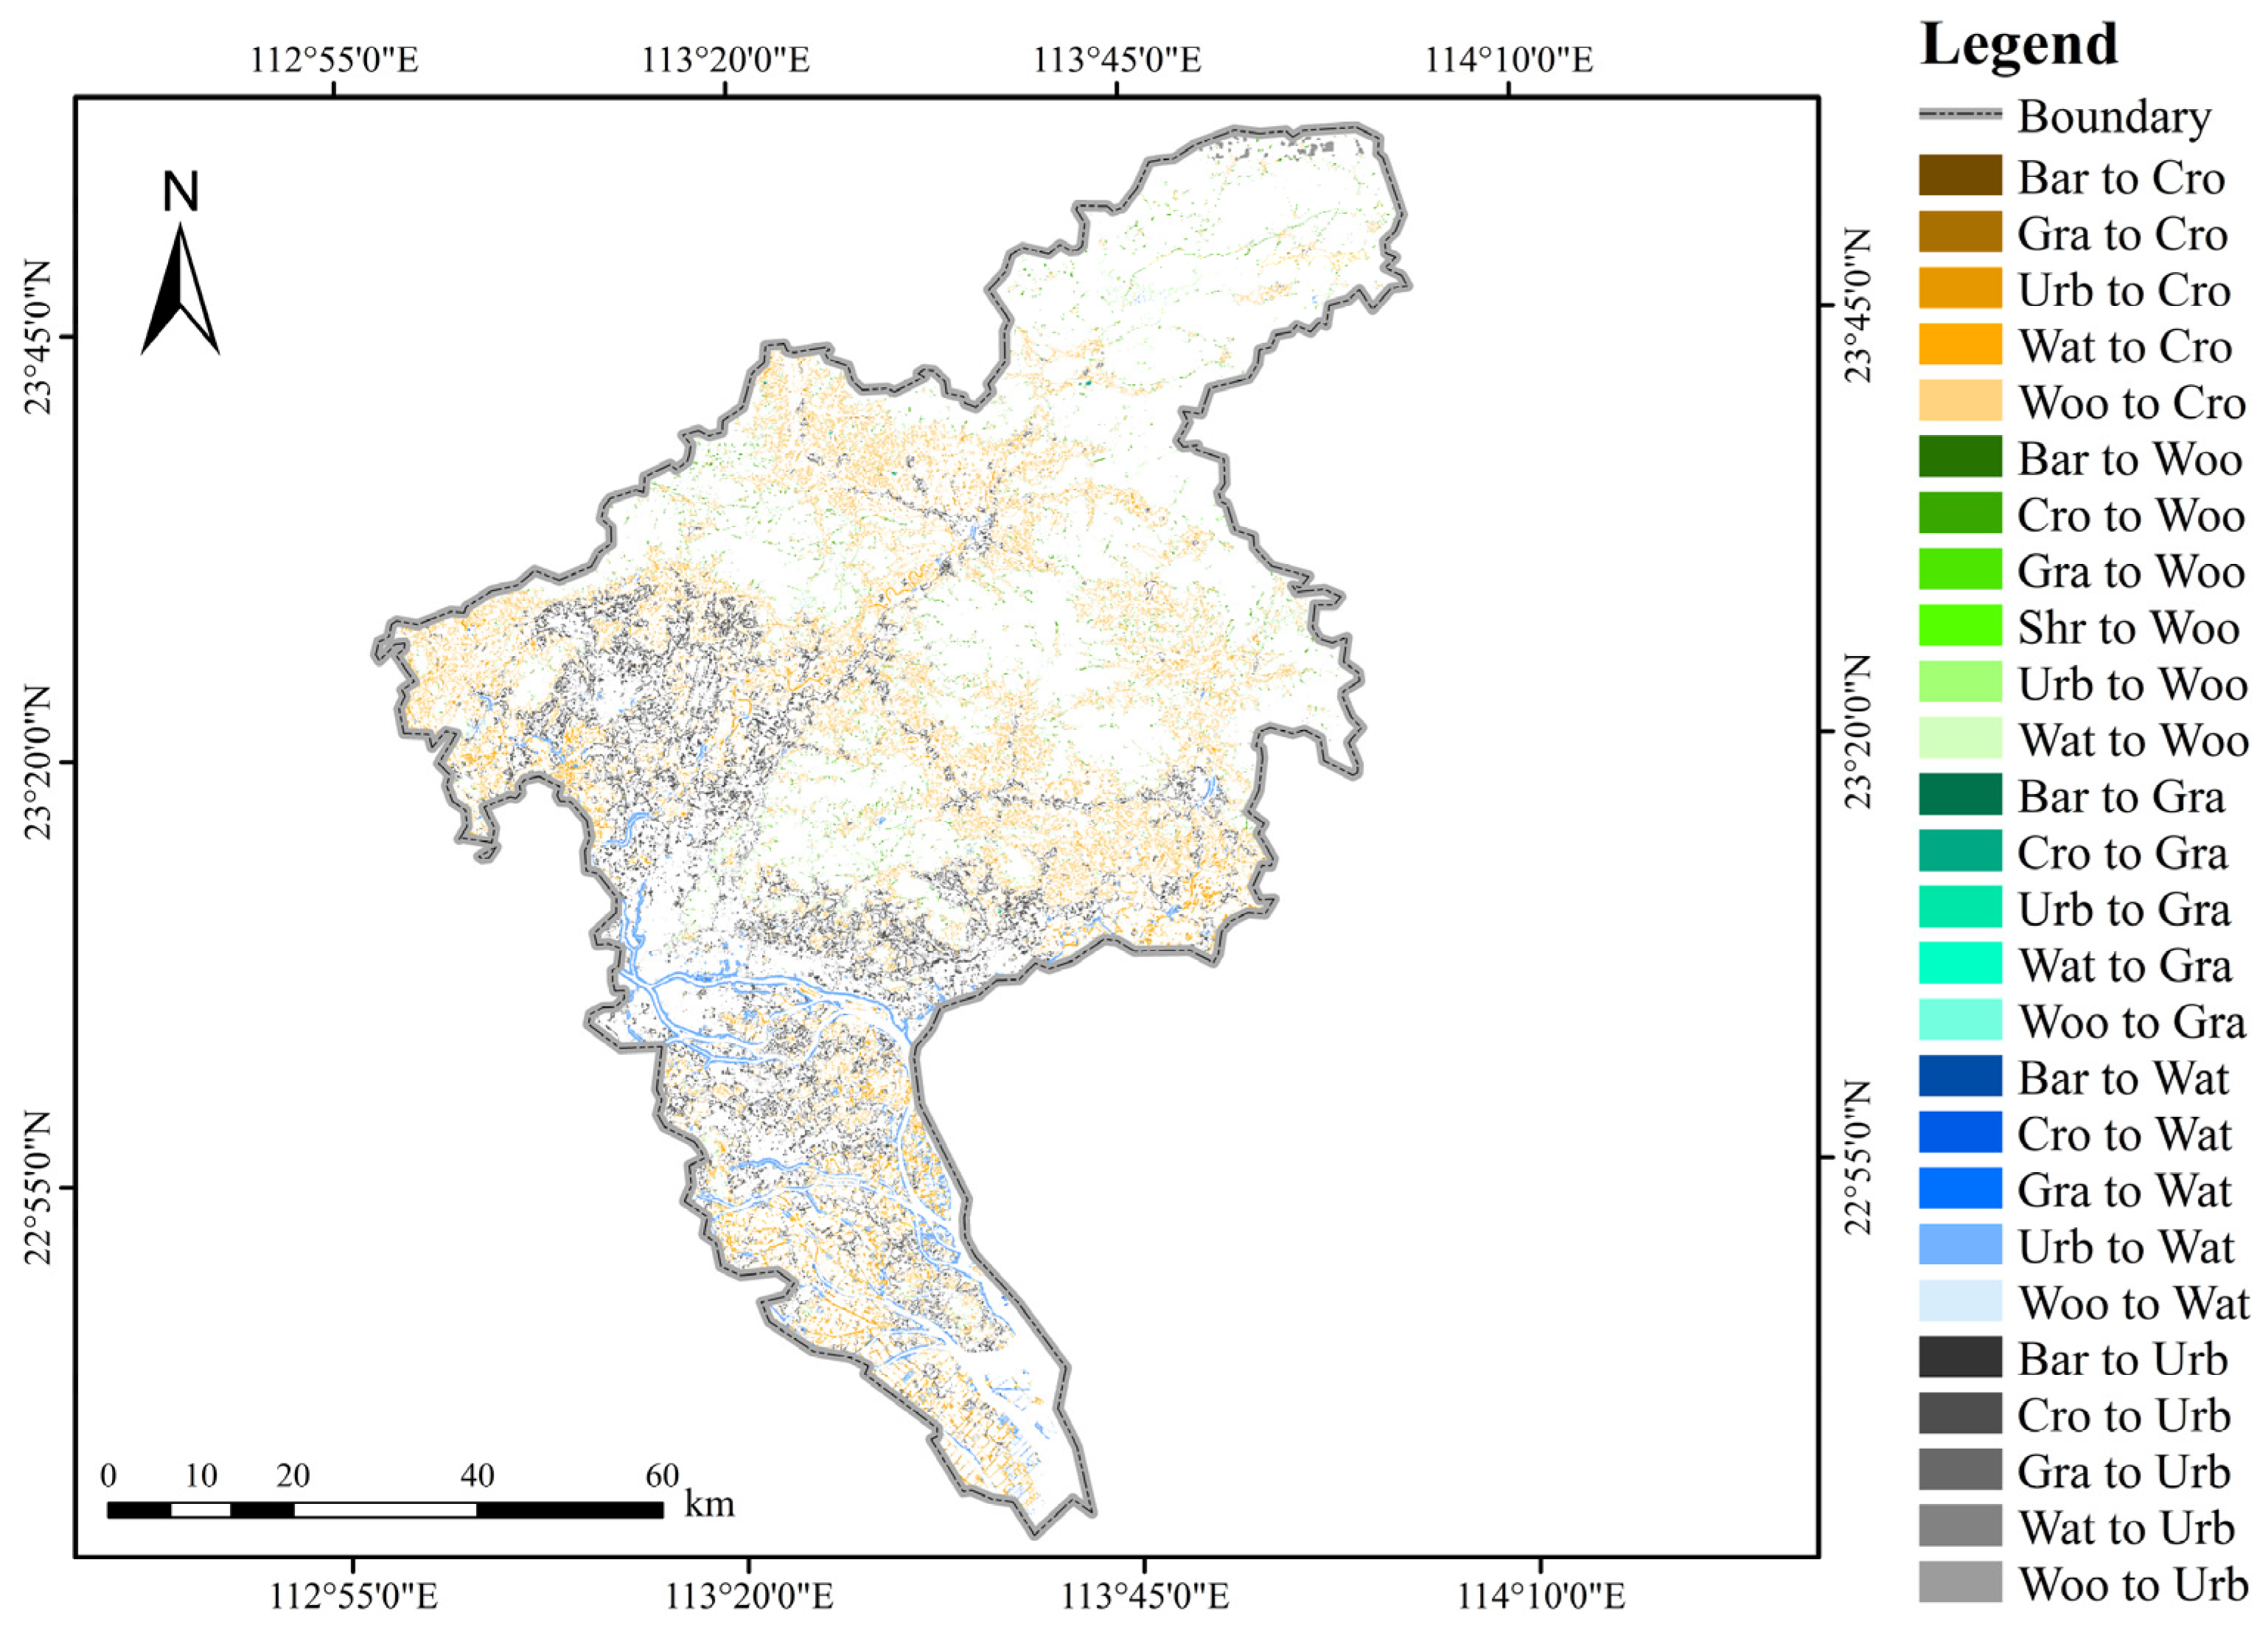
2.3.2. LULC Change Prediction Using the CA-Markov Model

Based on the land use transition matrix, the CA-Markov model not only has strong dynamic simulation ability, but also can predict long-term series, and has the advantages of no after-effect and stability, and has been widely used in the study of land use change [45]. In this paper, the CA-Markov model is used to simulate land use change in the study area. The Markov model is calculated as follows:
S t + 1 = P i j × S t
where S(t) and S(t+1) represent the land use types at time t and t + 1, respectively. Pij is the transition matrix probability between types. The specific formula for calculating Pij is as follows:
P i j = A i j Σ i = 1 n Σ j = 1 n A i j
where i and j represent the land use types of Ti and Tj, respectively, and n is the total number of land use types. Pij indicates that the land use area changes from Class i (time Ti) to class j (time Tj) the percentage of land use area. In the transfer matrix, the diagonal item Aij(i = j) represents the untransformed region of Class i, while other items Aij represent the region (km2) transformed from Class i to Class j. The following equation describes how to calculate the CA model:
S t + 1 = F S t , N
where St, St+1 represent the cellular states at time t and t + 1, respectively. N is the neighborhood of the cell; F is the conversion rule.

3. Results

3.1. The Value of Various Functional Ecological Services of Urban Green Space

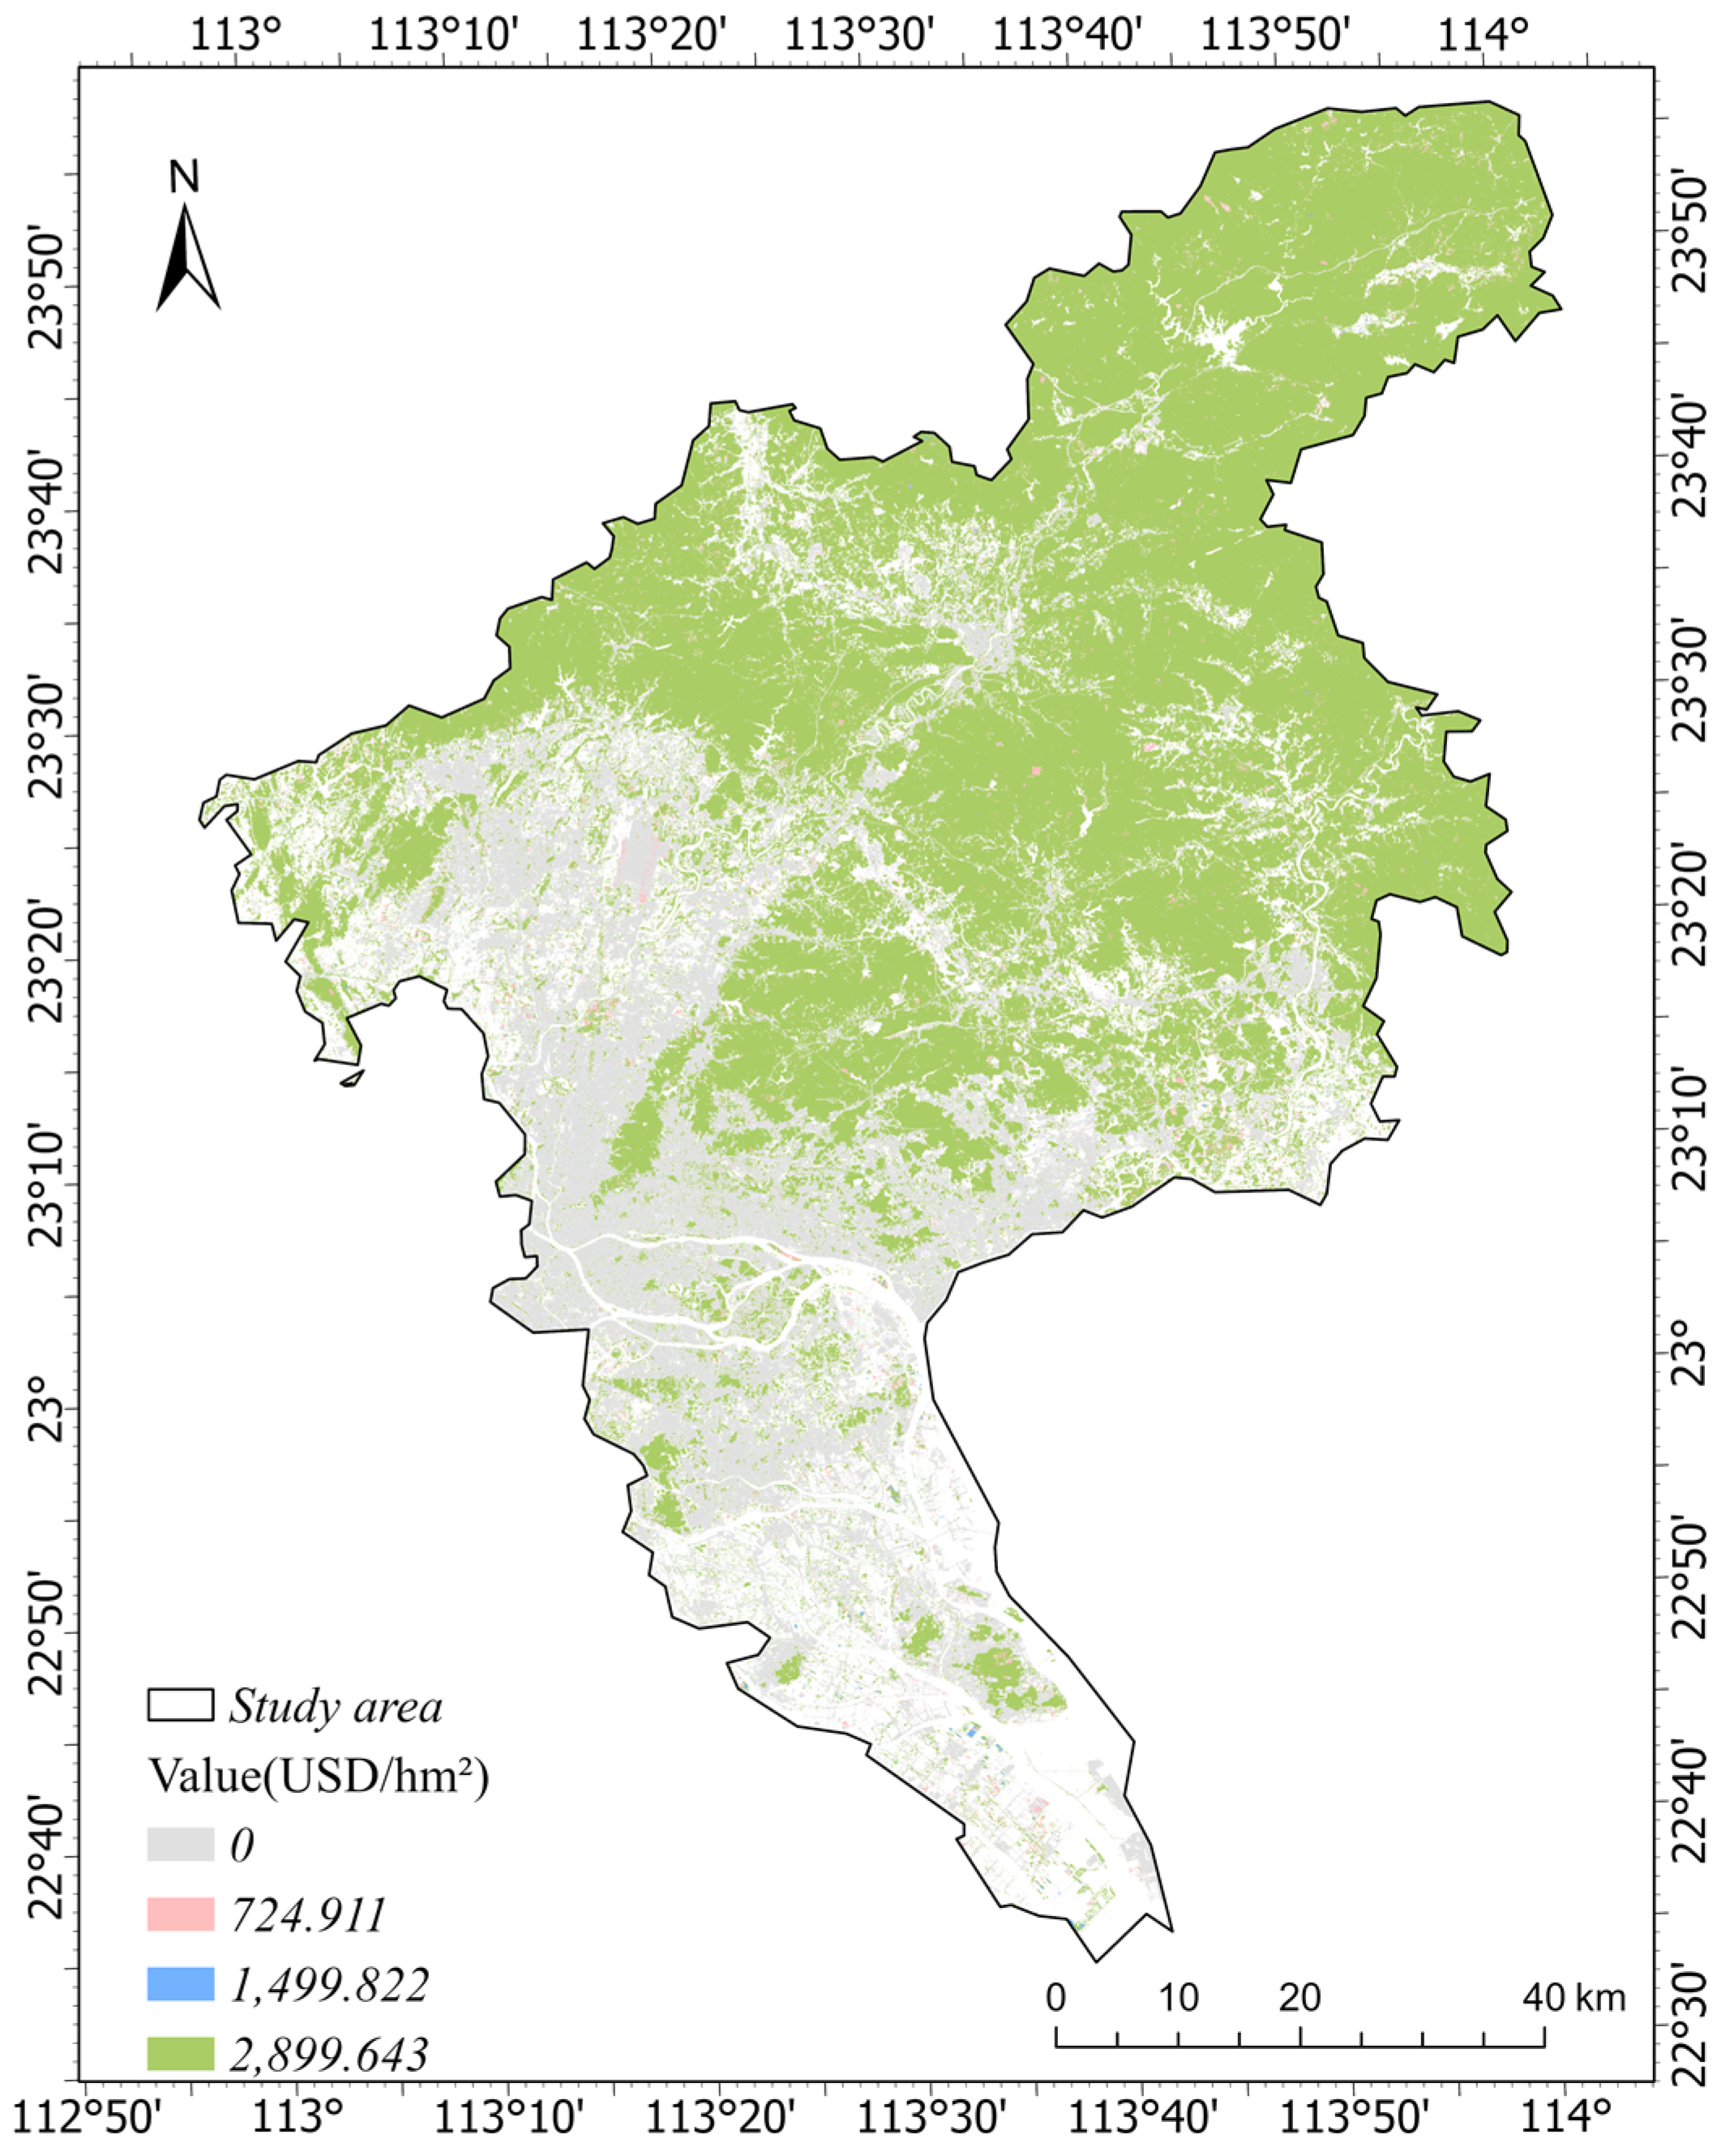
3.1.1. Provision Service Value

In Equation (2), the area of green space (A) derived from the land use map (as shown in Figure 4), indicates that the water conservation values of forests, shrubs, and grasslands in Guangzhou in 2020 were USD 30.473, USD 4.494 and USD 73.448 million, respectively, according to Equation (2). The raster data of annual precipitation was input into ArcGIS, and the raster calculator was used to multiply the culvert coefficient and the cost of the reservoir per unit capacity to obtain the unit water conservation value, as shown in Figure 5. The results indicate that the unit water conservation value is higher in the northeast and south of Guangzhou, mainly because urban green spaces not only intercept and store precipitation, but also significantly reduce surface runoff, thereby reducing pressure on the urban drainage system.

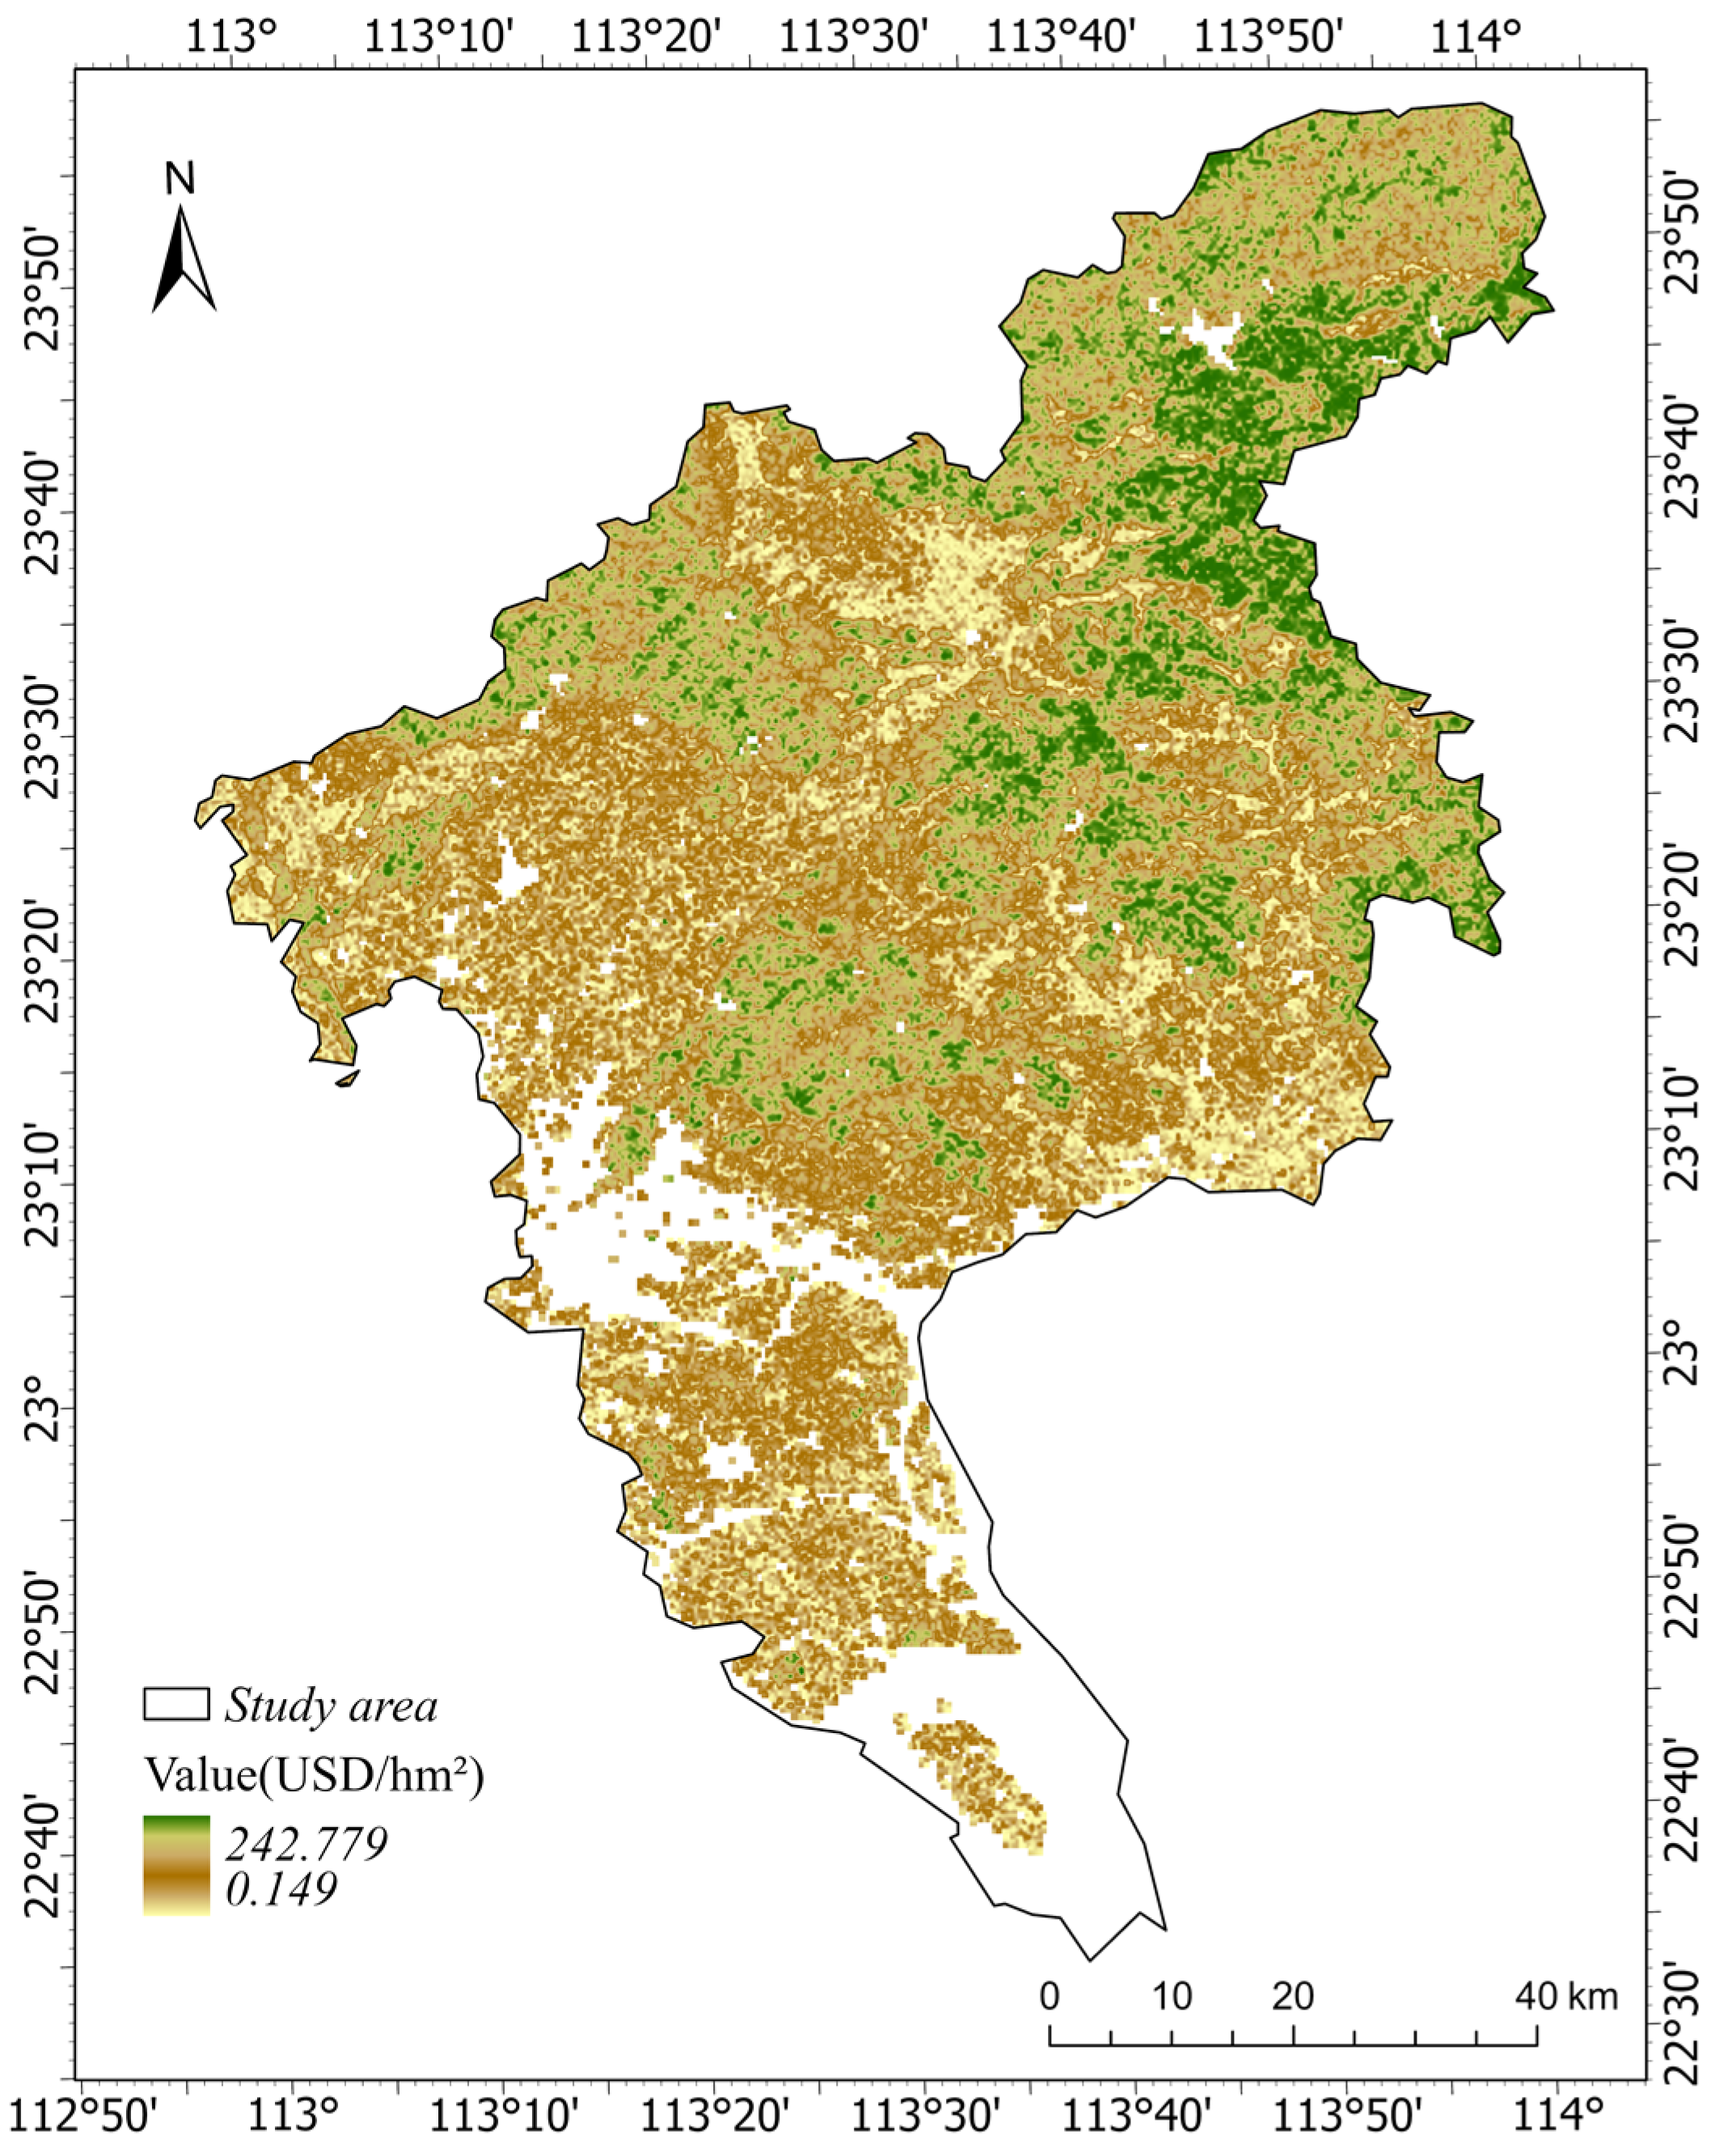
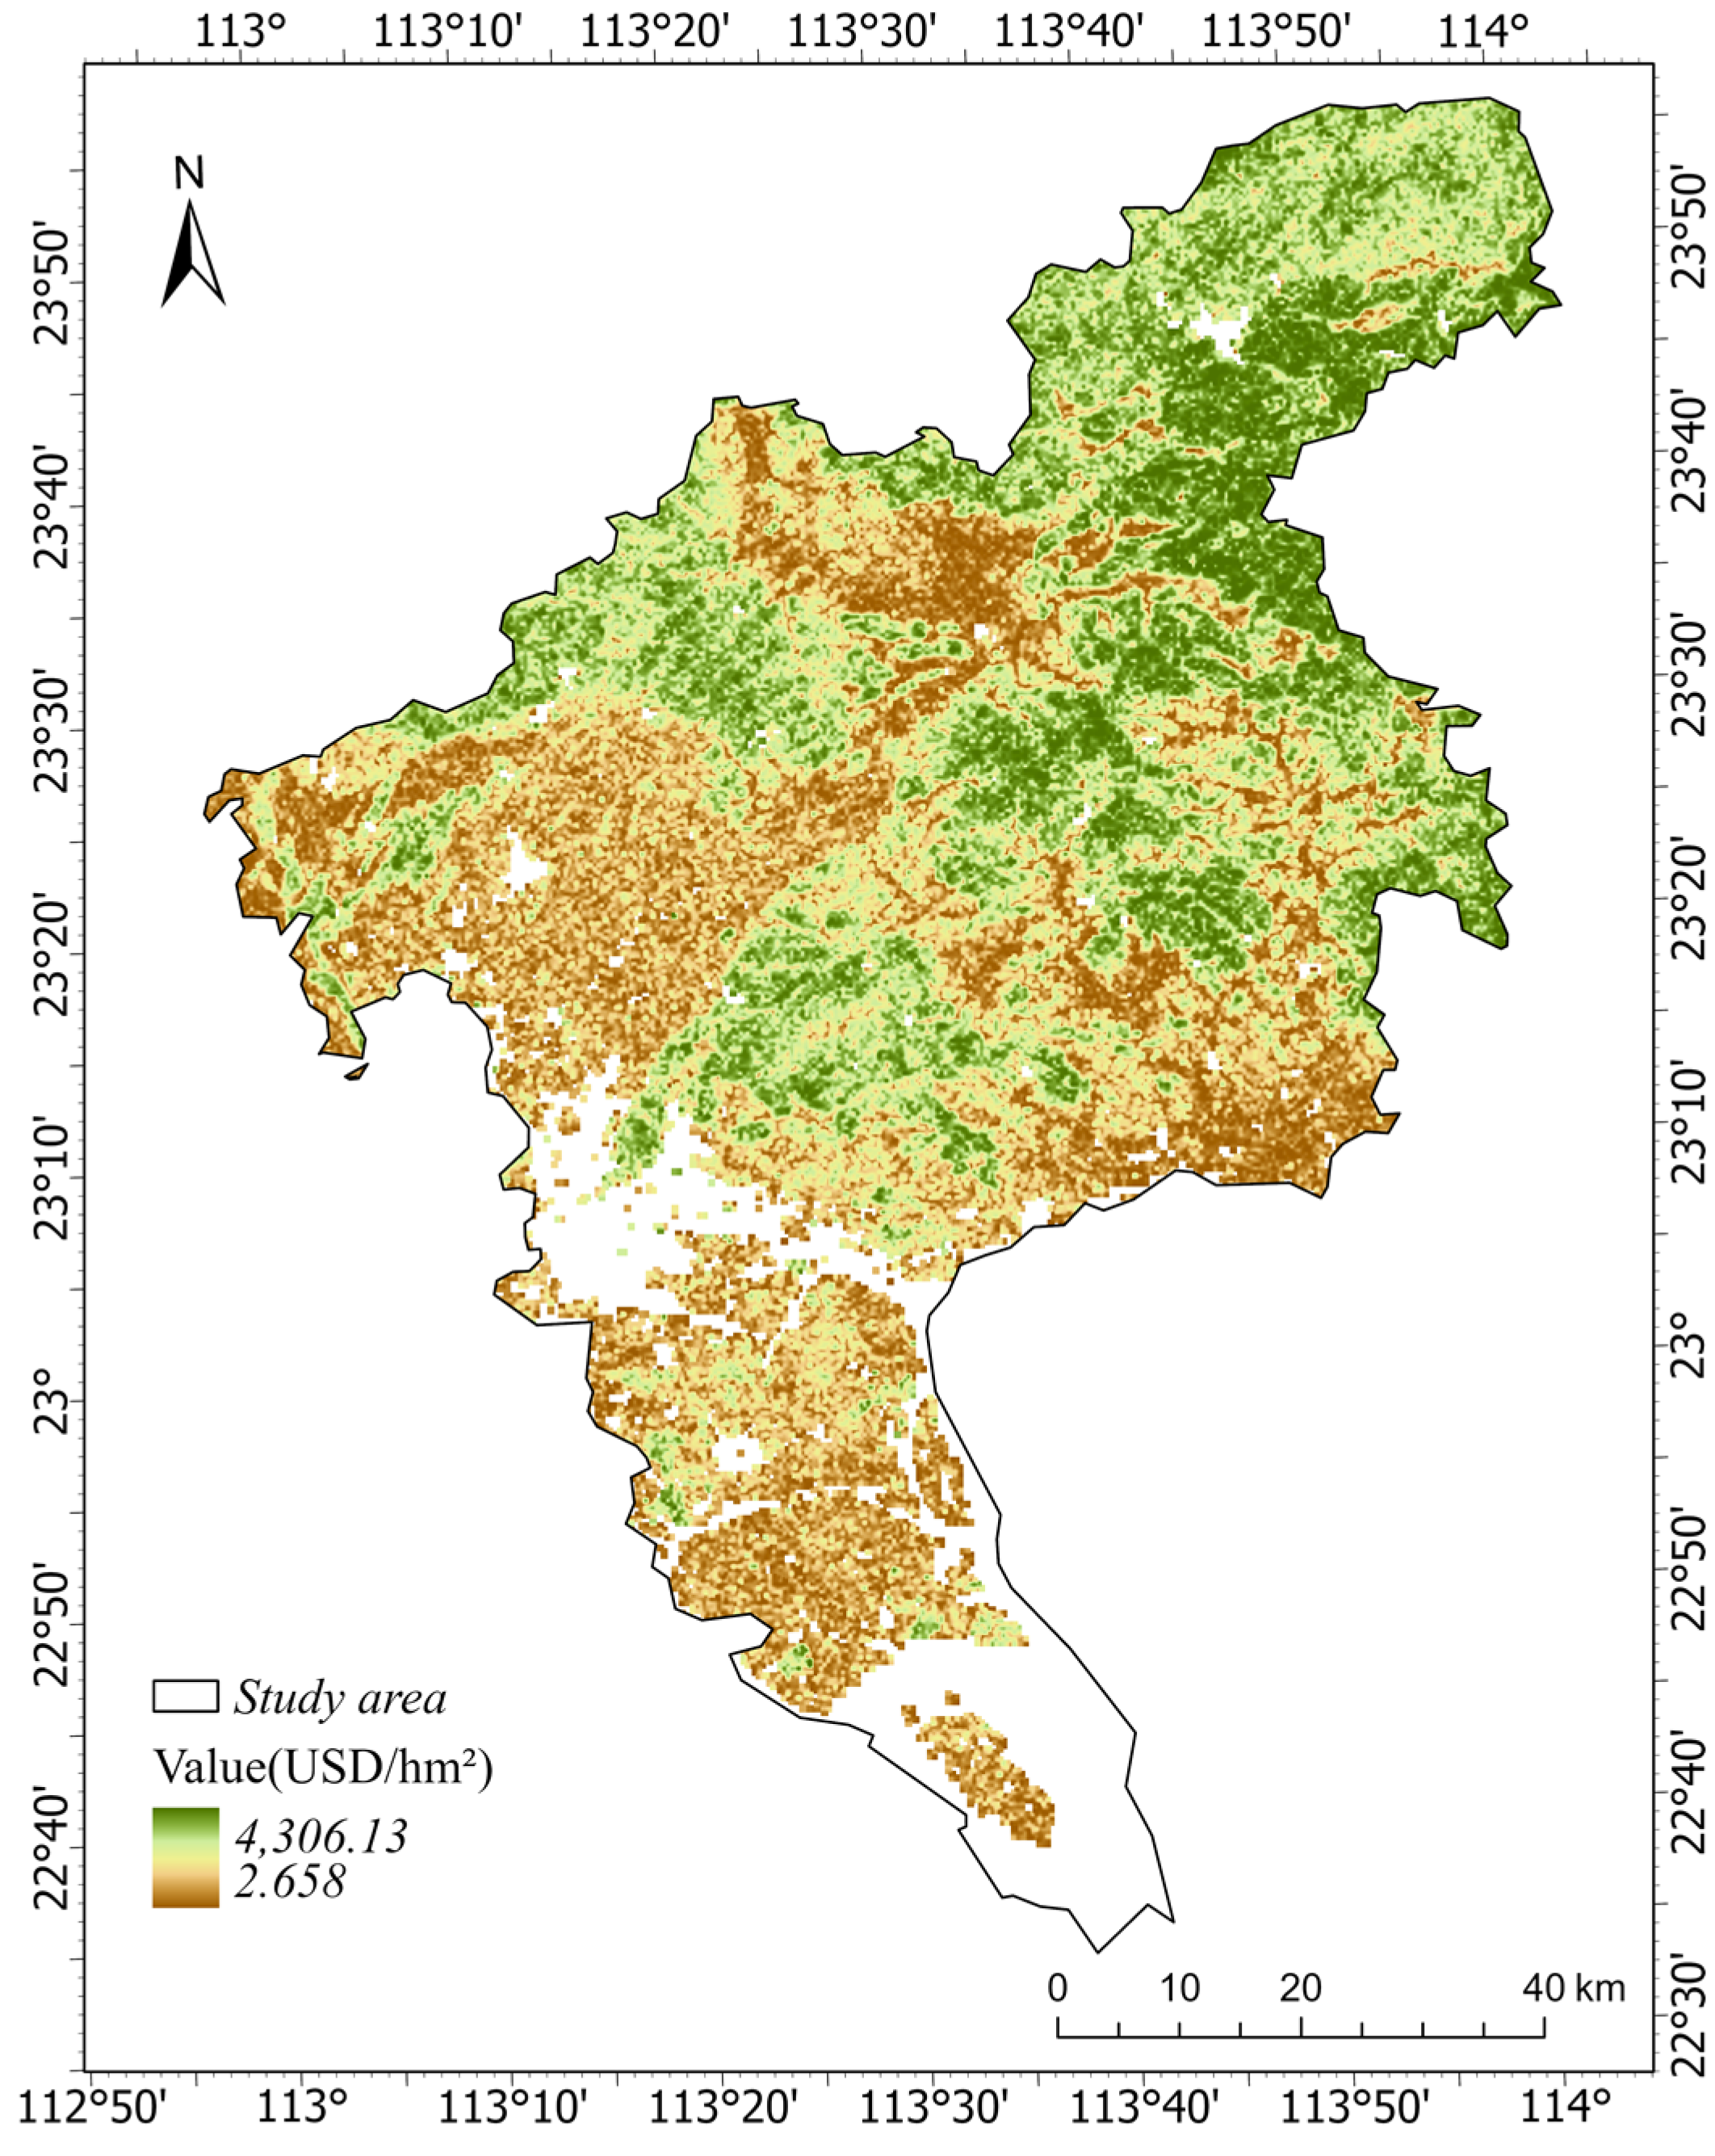
3.1.2. Regulation Service Value

Urban green spaces regulate temperature in multiple ways. On one hand, tree canopies block sunlight, reducing radiant heat reaching the ground. On the other hand, these green spaces emit moisture through transpiration, absorbing heat from the surrounding environment and thereby reducing air temperature. The NSAT inversion model was developed based on 54 training samples using the random forest (RF) algorithm. In this study, the parameters of the model were determined according to existing research [46] and a large number of experiments. The number of decision trees was set to 100, the maximum depth of each tree was 10, and the maximum number of leaf nodes was 50. Figure 6a shows the modeling accuracy of the model, where R2 = 0.896 and RMSE = 0.94, indicating that the stochastic forest assessment model has high prediction accuracy for evaluating NSAT. In addition, 24 test samples were used to verify the estimation accuracy of the RF model, as shown in Figure 6b. The results showed R2 = 0.891 and RMSE = 1.189. Most points are close to the 1:1 line, indicating the reliability of the model. The temperature inversion results of Guangzhou City are presented in Figure 7. It can be observed that, due to the denser canopy structure, forests can reflect and absorb solar radiation more effectively, reducing the amount of heat reaching the ground. At the same time, the transpiration of the forest is stronger, consuming more energy and increasing the humidity of the environment, further reducing the temperature. As a result, compared with the small patches of grass and shrubs around the urban built-up area, the large forests in the northern part of Guangzhou show a more significant cooling effect. According to the statistical analysis of Equation (4), the cooling effects of forests, shrubs, and grasslands in Guangzhou were 6.203 °C, 3.687 °C and 4.091 °C, respectively. The ecological service values of urban green space temperature regulation were USD 12.35, USD 0.011 and USD 0.20 hundred million, respectively.
Figure 8 shows the spatial distribution (NPP) of vegetation net primary productivity in Guangzhou based on MOD17A3HGF products. The mass of O2 released from urban green space in the study area was estimated by remote sensing technology and ecological economics method, and then the oxygen release value of urban green space in the study area was obtained from Equation (16), as shown in Figure 9. The texture is well structured, and the forest contains a variety of vegetation types, such as trees, shrubs, herbaceous plants, etc. These vegetation types form complex layers within the vertical structure, allowing the forest to make better use of resources such as light, water, and nutrients, thereby increasing the overall NPP. According to the statistical analysis, the value of oxygen released from forests, shrubs, and grasslands was USD 10.601, USD 0.01, and USD 0.195 hundred million, respectively.
Urban green spaces absorb carbon dioxide from the atmosphere through photosynthesis of vegetation, convert and fix it in plant tissues, thereby effectively reducing the concentration of greenhouse gases. In this paper, the carbon sequestration value per unit area of urban green space was calculated using the net primary productivity (NPP) data of vegetation provided by MOD17A3HGFV061 products and the average CEA transaction price of USD 9.30/t in China’s carbon market (Figure 10). According to Equation (17), the carbon dioxide absorption values for forests, shrubs, and grasslands were USD 139.342, USD 0.13 and USD 2.566 million, respectively.
Urban green spaces play an important role in air purification, mainly through the absorption, degradation, accumulation, and release of air pollutants. However, due to the wide variety of air pollutants, the purification mechanisms for different pollutants in urban green spaces also vary. Current research has not yet fully established the specific relationships between the purification functions of urban green spaces and various pollutants. Therefore, this study chose two factors—sulfur dioxide absorption (SO2) and dust retention—to estimate the value of urban green spaces in improving the atmospheric environment.
Moreover, there are significant differences in the dust retention capacity of different types of urban green spaces, mainly influenced by vegetation coverage, vegetation structure and topography. Due to its high vegetation coverage, complex vegetation structure, and multi-level dust barrier, forest shows the strongest dust interception and adsorption capabilities. The dust retention ability of shrubs is second, while that of grasslands is relatively weak. The formation mechanism behind this difference is that forest vegetation effectively reduces wind speed and uses leaf surfaces and branch structures to intercept and absorb dust particles. In contrast, shrubs and grasslands exhibit relatively weaker dust retention due to the limitations of vegetation density and height.
The SO2 absorption value and dust retention value of urban green spaces were evaluated using Equations (18) and (19), as shown in Figure 11 and Figure 12, respectively. The results were statistically analyzed, showing that the SO2 absorption of forests, shrubs and grasslands in the study area in 2020 was 3526.441, 1.169 and 9.023 t, respectively. The service values were USD 5.828, USD 0.002 and USD 0.015 million, respectively. The dust retention volumes were 535.19, 1.98 and 5.07 thousand tons, respectively, with service values of USD 349.17, USD 0.13 and USD 0.33 million.

3.1.3. Support Service Value

Green vegetation reduces erosion and soil loss by stabilizing the soil. In this paper, the value of green space in reducing land loss and sediment accumulation was evaluated using Equations (21) and (22), and subsequently, the soil conservation value of green space was estimated using Equation (20). Combined with the actual situation of the study area, the soil conservation Ac was estimated by Equation (23), that is, the difference between the potential soil erosion amount and the actual soil erosion amount, and the annual rainfall erosivity index R value adopts the simple model of Liu [47]. The soil erosion factor K value, the slope length factor LS, the vegetation coverage factor C and the soil and water conservation measure factor P mask were extracted from the data set of China soil and water conservation capacity (1992–2019) provided by ScienceDB platform, Guangzhou, as shown in Figure 13.
As shown in Figure 14 and Figure 15, the values for reducing land loss and sediment deposition of urban green spaces in the study area are presented. In the northeast area of Guangzhou, the ecosystem service value per unit area is higher, mainly due to the widely distributed forest vegetation. Compared with grassland and shrubs, forests have higher vegetation coverage, which effectively reduces the direct erosion of rain on the surface. In addition, the roots of forest plants are usually more developed than grasslands and shrubs, with greater depth and density, thus enhancing the stability of soil. The complexity of forest ecosystems also provides stronger comprehensive benefits. Forests contain multiple vegetation layers, such as tree, shrub, and herb layers, and support a variety of biological components, such as animals and microorganisms. This multi-level, multi-component ecosystem demonstrates remarkable advantages in reducing soil erosion and preventing sediment deposition. Based on statistical analysis, the value of soil conservation services provided by urban green space forest, shrub and grassland in 2020 was calculated as USD 0.307 billion, USD 0.101 million and USD 3.610 million, respectively.
As a natural space in the city, urban green spaces play a unique and irreplaceable role in the conservation of biodiversity [48]. These green spaces not only provide critical habitats for various wildlife and enhance species diversity, but also offer important access to nature and ecosystems for city dwellers. In addition, through contact with nature, residents’ awareness of biodiversity conservation has been raised, and the harmonious coexistence of man and nature has been further promoted. Therefore, it is particularly important to evaluate the value of urban green space in biodiversity conservation. The value of biodiversity per unit area is derived from the opportunity cost per unit area of annual species loss in the Code for Assessment of Forest Ecosystem Service Function, in which the annual opportunity cost of species loss per unit area of forests, shrubs and grasslands is USD 2899.643, USD 1449.822 and USD 724.911/(hm2·a), respectively. As shown in Figure 16, the biodiversity values for forests, shrubs and grasslands in Guangzhou in 2020 were USD 12.029, USD 0.009 and USD 7.351 hundred million, respectively.

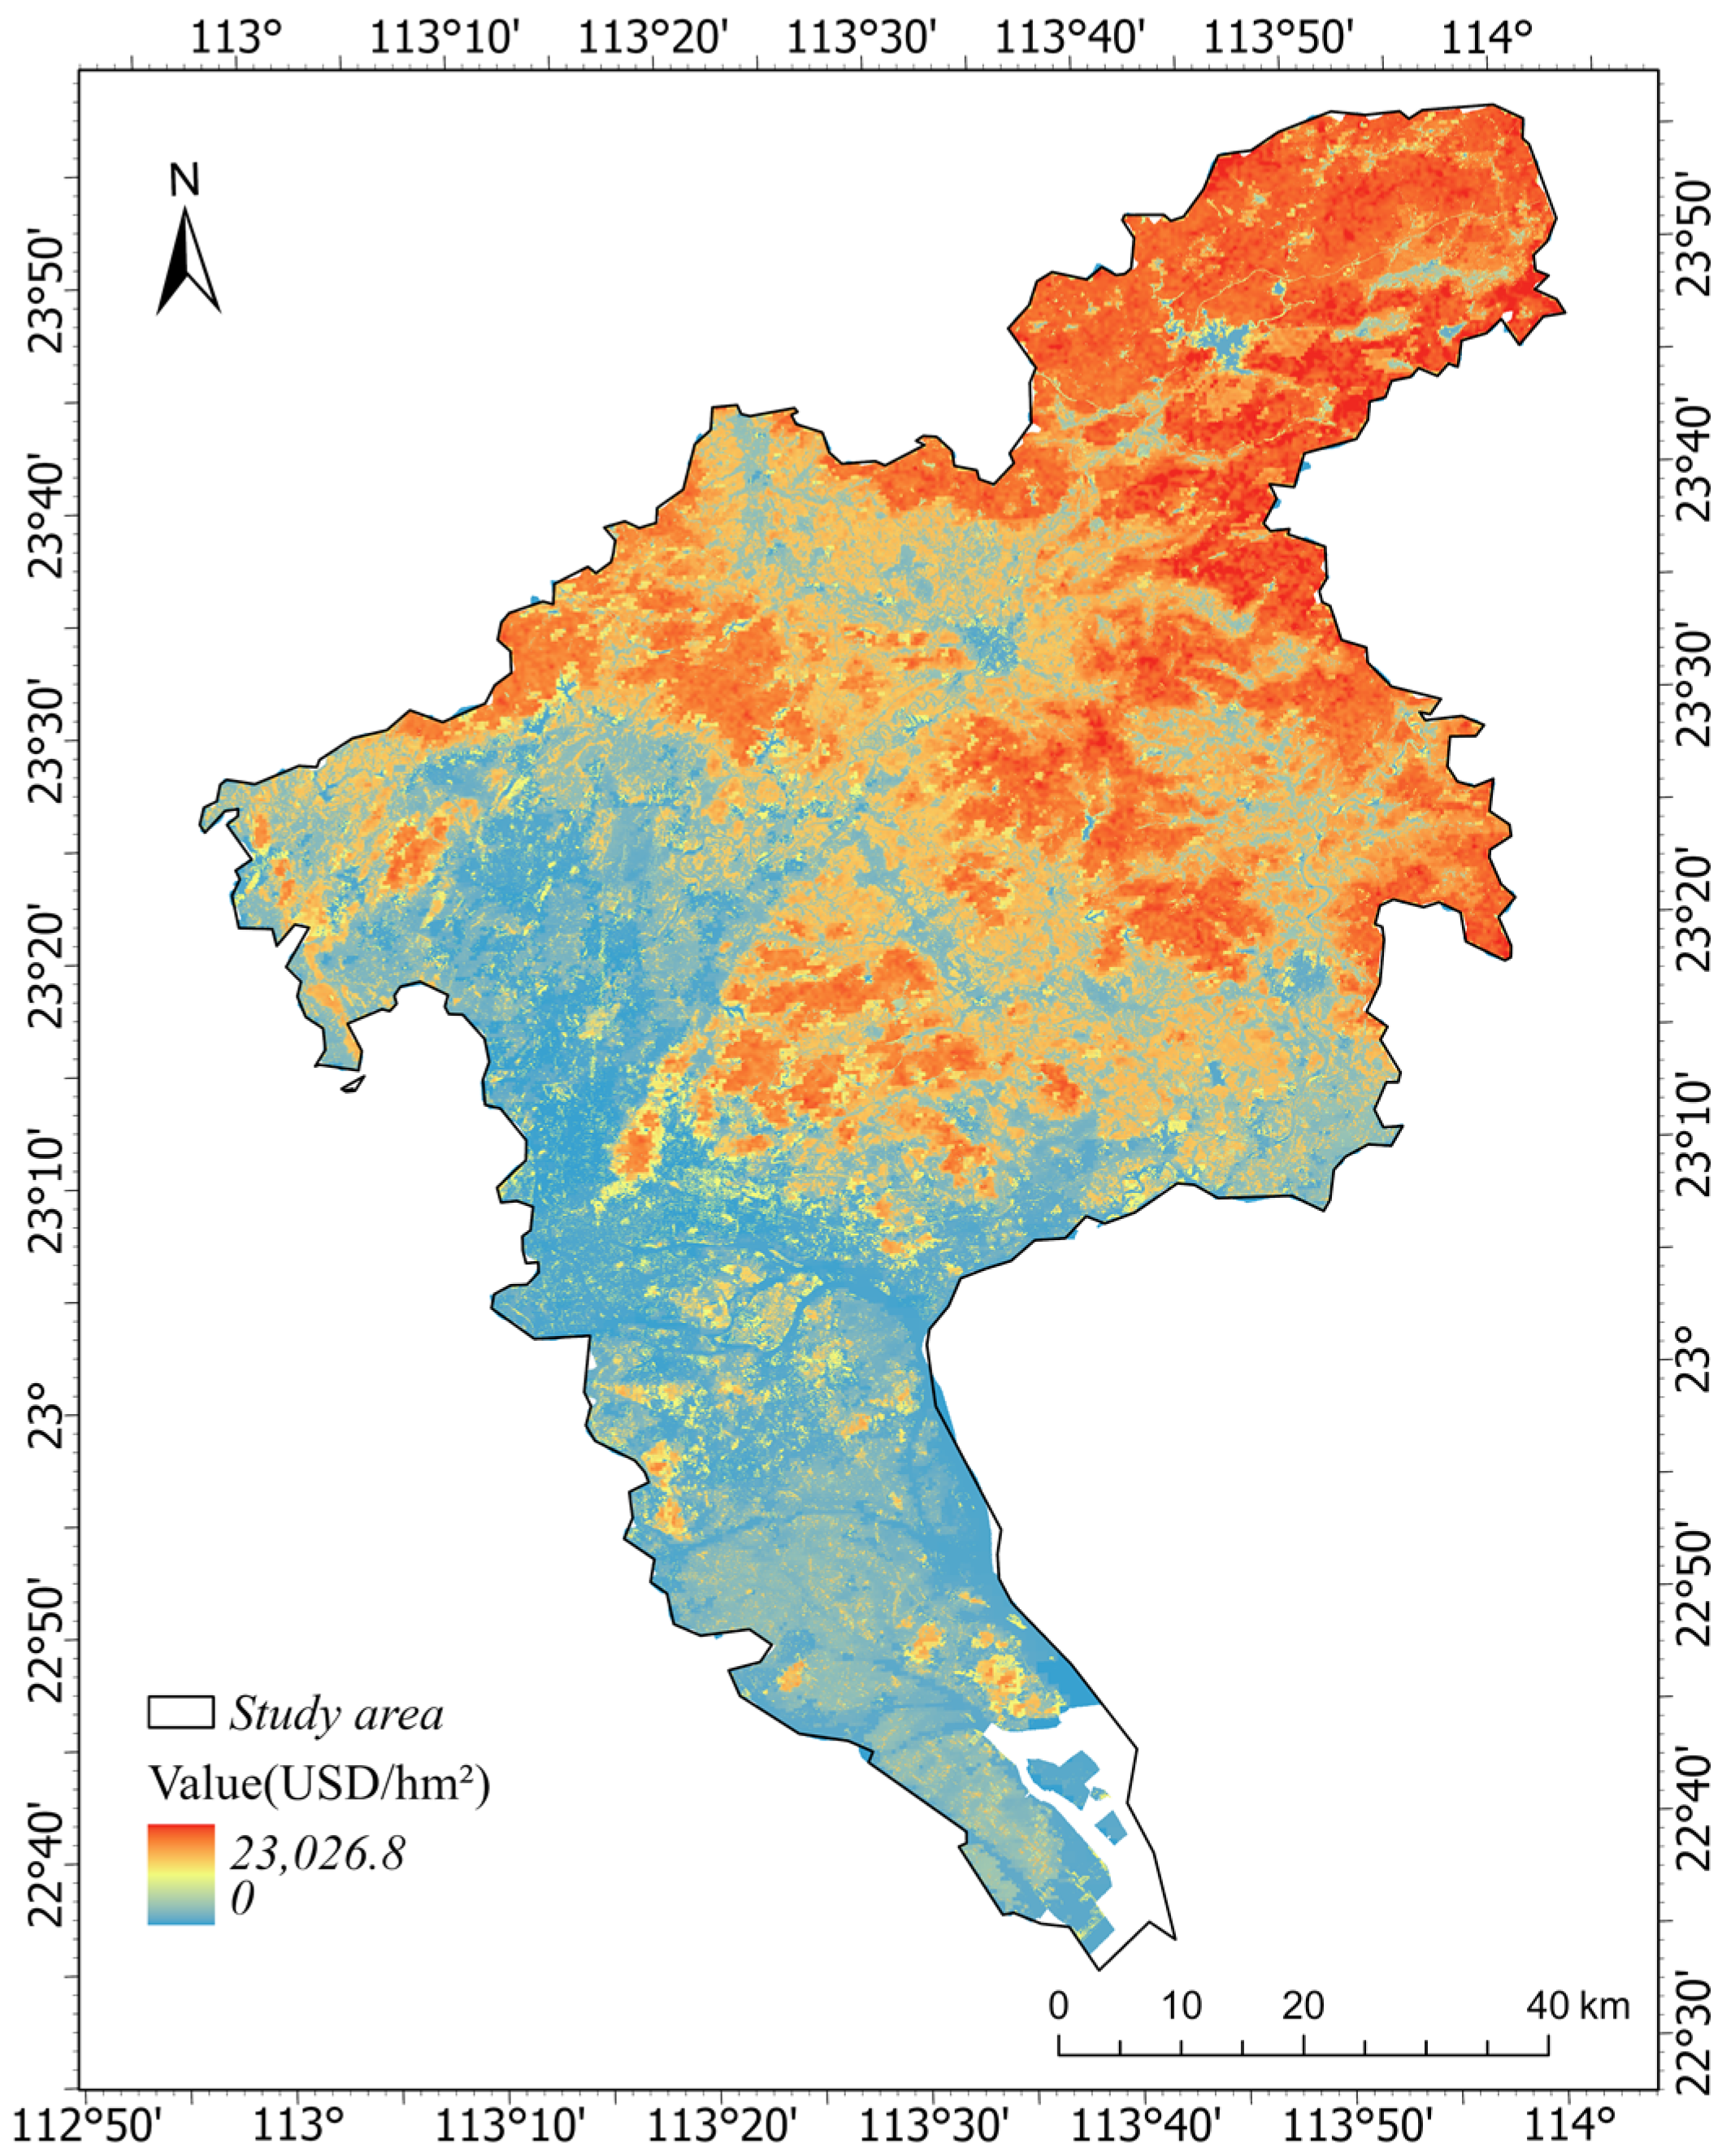
3.2. The Total Ecological Service Value of Urban Green Space

As shown in Figure 17, the total ecological service value of urban green space in Guangzhou presents a spatial distribution pattern of “high in the north and low in the south”, mainly due to the fact that the northern area of Guangzhou is mostly hilly and mountainous, with high forest coverage, and the northern area may be less affected by human activities and the degree of urbanization is lower than that of the city center and the southern area. As a result, more natural ecosystems are preserved, so that the ecological functions of green spaces can be more fully exerted. In 2020, the total value of urban green space in the study area in terms of ecological services such as soil conservation, carbon sequestration and oxygen release, and SO2 absorption was about USD 7.482 billion, accounting for 0.02% of the annual GDP, and the average unit area value was USD 17,708.12. This shows that although the proportion of urban green space in the total economy is limited, the value of ecological services provided per unit area is significant, highlighting the key role of green space in maintaining urban ecological balance and improving environmental quality.

3.3. Ecosystem Service Value Prediction Based on CA_Markov

Based on the Mahal method, this study designs a Business as Usual (BAU) future urban growth scenario, assuming that the future city grows without any development restrictions and follows the same model as past urban growth. This scenario is used to predict land use changes in Guangzhou. As shown in Figure 18, over the next 10 years, the area of water and cultivated land will increase, while urban and rural construction land will initially increase before stabilizing. The grassland area will remain stable, whereas forest and shrubland areas will decrease by 11.6% and 8.2%, respectively, compared to 2020. According to the results of predicting land use change in Guangzhou, the land use pattern is in a state of change in a certain period of time in the future. With the rapid increase in the global population, the rise in living standards, and improvements in production and lifestyle, the ecological environment at a macro level worsening. More regions are experiencing declining water quality, reduced land usability, and increasingly scarce water resources. These issues are bound to attract attention and heighten the awareness of sustainable development, constituting a new land manipulation situation of urban and rural economic integration. Table 3 shows the response results of urban green space ecological service value prediction based on Markov model land use type change.

4. Discussion

In this paper, we make a detailed assessment of the ecosystem service value of urban green space in Guangzhou through an improved ecosystem service value assessment system, combined with remote sensing technology and random forest algorithm, and conduct a dynamic assessment based on land use change prediction.

4.1. Comparison with Similar Studies

Previous ESV assessment methods have provided valuable information but also have limitations. First, the remote sensing assessment method was used to evaluate ESV, mainly based on various indices (such as NDVI, NDBSI, etc.) extracted from the spectral bands of image data [49]. Although this method is simple and convenient due to the accessibility of individual spectral indices, it cannot accurately assess ESV because it is difficult to establish a reasonable quantitative method for remote sensing indices and monetary values. Some studies have combined traditional methods with remote sensing technology to evaluate ESV using multiple factors, but they fail to distinguish between different types of green spaces when estimating the temperature regulation value of green space systems. This lack of differentiation impacts the accuracy of the assessments. Therefore, we inverted the urban average temperature to distinguish the cooling effects of three green space types: forest, shrub, and grassland, improving the accuracy and rationality of the assessment. Second, in this study, we did not use the traditional interpolation method of meteorological observation points or the multiple linear regression method to calculate air temperature [50]. Instead, we established the relationship between near-surface air temperature and five independent variables—NDVI, LST, MNDWI, albedo, and elevation—using the random forest algorithm to realize temperature inversion. This method was compared with the traditional interpolation method, as shown in Figure 19. The results demonstrate the availability and superiority of the random forest model in quantitative remote sensing and temperature inversion. As shown in Figure 20, compared with the linear regression model, the random forest model (R2 = 0.869) achieved a better inversion fitting effect, indicating that the random forest model is suitable for the inversion of near-surface air temperature. Improving the traditional evaluation method for the temperature regulation value using this approach contributes to a more scientifically sound evaluation of total ecological service value. In addition, this study conducted a dynamic value assessment through land use change prediction, providing a dynamic value prediction of the future trend of urban green space ecosystem service value. It was concluded that the ESV of urban green spaces in Guangzhou in 2030 would be USD 6.637 billion, representing a 12.37% reduction compared to 2020. Therefore, in the process of strengthening green space construction in Guangzhou, the government should establish a red line for green space protection to limit the encroachment of urban construction on natural ecosystems and ensure that the green space area will not be reduced due to urban expansion.

4.2. Prospects for Future Studies

Building on the work of Xie et al. [25], this paper further improves the value coefficient and evaluation methods of ecological services in Guangzhou. The ideas and methods presented here provide a reference for ESV scientific research and offer meaningful suggestions for sustainable economic development and natural resources management. However, this paper has certain limitations. The ecosystem service index mainly considers the availability and importance of data and cannot comprehensively measure the value generated by all ecosystem service functions. In future studies, other factors of ecosystem service function, such as nitrogen fixation and habitat provision, will be considered to improve the accuracy of assessment, strengthen monitoring and assessment of sensitive areas of ecosystem service value change, and provide more targeted suggestions for policy making. Furthermore, the random forest algorithm requires a large sample size to establish a stable model, and the near-surface temperature model has poor stability in retrieving small sample areas. Therefore, incorporating more sample data and exploring alternative algorithms for retrieving near-surface air temperatures will be crucial to improving accuracy. In addition, this study mainly considers the influence of land use change on ESV under a BAU scenario to predict future change in ecosystem service value. In the future, we can consider adding factors such as predicting the future interannual temperature change, and conduct multi-scenario analysis, so as to optimize the prediction model to ensure that the prediction of future ecosystem service value change is more reasonable and realistic.

5. Conclusions

In this study, the ecological service value of urban green space in Guangzhou was evaluated by using remote sensing technology and random forest algorithm through an improved ecosystem service value assessment system. The dynamic value of urban green space services was also evaluated based on land use change predictions. The main findings are as follows: (1) In 2020, urban green space in the study area was evaluated in terms of soil conservation, carbon sequestration and oxygen release, and SO2 absorption. The total value generated by ecological services was about USD 7.482 billion, accounting for 0.02% of the annual GDP. The average unit area value was USD 17,708.12. (2) Under the BAU future urban growth scenario, urban green space is expected to face partial encroachment by 2030, resulting in an estimated ecological service value of USD 6.637 billion, representing a 12.37% decline compared to 2020. (3) Forests exhibit high ecological service value and strong capabilities in temperature regulation, carbon sequestration, and oxygen release. Therefore, priority should be given to expanding forested areas during the process of strengthening green space construction in Guangzhou. In addition, attention should be paid to the spatial heterogeneity of different types of urban green spaces. Optimizing the structure of urban green spaces, increasing plant diversity, and maintaining ecological balance through strategic configuration will help maximize the ecological services and functions of the urban green space system.
In conclusion, this study provides a new method and perspective for assessing the value of urban green space ecosystem services. The proposed approach can help government agencies better understand the importance of urban green spaces in maintaining the city’s ecological balance and provide a scientific basis for developing effective green space protection and construction policies. This contributes not only to improving the quality of life for city residents but also to promoting sustainable urban development.

Author Contributions

Z.L. (Zhenhua Liu), Methodology, Formal analysis, Visualization, Writing—original draft, Writing—review and editing, Investigation; Z.Z., Conceptualization, Supervision, Data curation; Z.L. (Zhefan Li), Conceptualization, Methodology, Writing—review and editing, Investigation; J.S., Supervision, Methodology; J.O., Formal analysis, Writing—review and editing. All authors have read and agreed to the published version of the manuscript.

Funding

This research received no external funding.

Data Availability Statement

Data are contained within the article.

Conflicts of Interest

The authors declare no conflict of interest.

References

  1. Westman, W.E. How Much Are Nature’s Services Worth? Science 1977, 197, 960–964. [Google Scholar] [CrossRef] [PubMed]
  2. Costanza, R.; d’Arge, R.; de Groot, R.; Farber, S.; Grasso, M.; Hannon, B.; Limburg, K.; Naeem, S.; O’Neill, R.V.; Paruelo, J.; et al. The Value of the World’s Ecosystem Services and Natural Capital. Nature 1997, 387, 253–260. [Google Scholar] [CrossRef]
  3. Ouyang, Z.; Zheng, H.; Xiao, Y.; Polasky, S.; Liu, J.; Xu, W.; Rao, E. Improvements in Ecosystem Services from Investments in Natural Capital. Science 2016, 352, 1455–1459. [Google Scholar] [CrossRef] [PubMed]
  4. Anaya-Romero, M.; Muñoz-Rojas, M.; Ibáñez, B.; Marañón, T. Evaluation of Forest Ecosystem Services in Mediterranean Areas. A Regional Case Study in South Spain. Ecosyst. Serv. 2016, 20, 82–90. [Google Scholar] [CrossRef]
  5. Zhang, X.; Ren, W.; Peng, H. Urban Land Use Change Simulation and Spatial Responses of Ecosystem Service Value Under Multiple Scenarios: A Case Study of Wuhan, China. Ecol. Indic. 2022, 144, 109526. [Google Scholar] [CrossRef]
  6. Zhang, C.; Wu, Q.; Peng, J.; Wang, F.; Liu, B.; Zhou, W. Estimation of Ecosystem Service Value and Function Assessment of Urban Green Space: A Case Study of Nanjing. Ecol. Sci. 2019, 38, 142–149. (In Chinese) [Google Scholar]
  7. Jie, M.; Sun, J.; Liu, T. Assessment of Ecosystem Service Value of Resource-Based Cities in China: Based on the Perspective of Meta Model. Arid Land Geogr. 2022, 45, 1949–1957. (In Chinese) [Google Scholar]
  8. Chen, C.; Wang, L.; Chen, J.; Liu, Z.; Liu, Y.; Chu, Y. A Seamless Economical Feature Extraction Method Using Landsat Time Series Data. Int. J. Appl. Earth Obs. Geoinf. 2021, 104, 102379. [Google Scholar]
  9. Wang, Y.; Huang, H.; Yang, G.; Chen, W. Ecosystem Service Function Supply–Demand Evaluation of Urban Functional Green Space Based on Multi-Source Data Fusion. Remote Sens. 2023, 15, 118. [Google Scholar] [CrossRef]
  10. Sun, Z.; Xue, W.; Kang, D.; Peng, Z. Assessment of Ecosystem Service Values of Urban Wetland: Taking East Lake Scenic Area in Wuhan as an Example. Land 2024, 13, 1013. [Google Scholar] [CrossRef]
  11. Alavi, N.; Zare, F.; Dehghani, R. Assessing Ecosystem Services of Urban Green Spaces: A Remote Sensing Approach. Sustainability 2020, 12, 3855. [Google Scholar]
  12. Yang, Q.; Liu, G.; Giannetti, B.F.; Agostinho, F.; Almeida, C.M.V.B.; Casazza, M. Emergy-Based Ecosystem Services Valuation and Classification Management Applied to China’s Grasslands. Ecosyst. Serv. 2020, 42, 101073. [Google Scholar] [CrossRef]
  13. Peng, X.; Huang, H.; She, K.; Xie, L.; Li, D. Assessment of Ecological Service Value of Important Reservoir Water Sources: A Case Study of Zhushuqiao Reservoir. Pearl River 2020, 41, 111–116. (In Chinese) [Google Scholar]
  14. Wang, S.; Yang, G.; Xu, C.; Li, M. Assessment of Ecosystem Service Value of Green Space in Mountainous Cities: A Case Study of Zunyi City Center. Environ. Protect. Sci. 2023, 49, 112–119. (In Chinese) [Google Scholar]
  15. Zhang, X.; Shen, J.; Sun, F.; Wang, S. Spatial-Temporal Evolution and Influencing Factors Analysis of Ecosystem Services Value: A Case Study in Sunan Canal Basin of Jiangsu Province, Eastern China. Remote Sens. 2023, 15, 112. [Google Scholar] [CrossRef]
  16. Zaman-ul-Haq, M.; Kanwal, A.; Gardezi, A.A.; Fatima, H.; Saqib, Z.; Bokhari, S.A.; Nasr, E.A.; Ahmad, S.; Shafiq, M. Assessing Spatial-Temporal Changes in Monetary Values of Urban Ecosystem Services through Remotely Sensed Data. Sustainability 2022, 14, 15136. [Google Scholar] [CrossRef]
  17. Jiang, L.Z.; Yang, D.; Mei, C.; Ban, Y.; Yang, X. Assessment of Ecosystem Service Function and Value of Urban Green Space: A Case Study of Futian District, Shenzhen. J. Cent. China Norm. Univ. (Nat. Sci. Ed.) 2018, 52, 424–431. (In Chinese) [Google Scholar]
  18. Nayak, D.; Shukla, A.K.; Devi, N.R. Decadal Changes in Land Use and Land Cover: Impacts and Their Influence on Urban Ecosystem Services. AQUA Water Infrastruct. Ecosyst. Soc. 2024, 73, 52–72. [Google Scholar] [CrossRef]
  19. Wang, R.S.; Pan, H.Y.; Liu, Y.H.; Tang, Y.P.; Zhang, Z.F.; Ma, H.J. Spatiotemporal Evolution and Driving Force of Ecosystem Service Value in Leshan City Based on Dynamic Equivalent. Acta Ecol. Sin. 2022, 42, 76–90. (In Chinese) [Google Scholar]
  20. Wang, L.; Chen, C.; Xie, F.; Hu, Z.; Zhang, Z.; Chen, H.; He, X.; Chu, Y. Estimation of the Value of Regional Ecosystem Services of an Archipelago Using Satellite Remote Sensing Technology: A Case Study of Zhoushan Archipelago, China. Int. J. Appl. Earth Obs. Geoinf. 2021, 105, 102616. [Google Scholar] [CrossRef]
  21. Wang, H.; Lin, C.; Ou, S.; Feng, Q.; Guo, K.; Xie, J.; Wei, X. Evolutionary Characteristics and Driving Forces of Green Space in Guangzhou from a Zoning Perspective. Forests 2024, 15, 135. [Google Scholar] [CrossRef]
  22. Rao, Y.; Zhang, S.; Yang, K.; Ma, Y.; Wang, W.; Niu, L. Scale Differences and Gradient Effects of Local Climate Zone Spatial Pattern on Urban Heat Island Impact—A Case in Guangzhou’s Core Area. Sustainability 2024, 16, 6656. [Google Scholar] [CrossRef]
  23. Yang, J.; Huang, X. The 30 m Annual Land Cover Datasets and Its Dynamics in China from 1985 to 2022. Earth Syst. Sci. Data 2023, 13, 3907–3925. [Google Scholar] [CrossRef]
  24. Li, J.; He, H.; Zeng, Q.; Chen, L.; Sun, R. Dataset of Soil Conservation Capacity Preventing Water Erosion in China (1992–2019). Sci. Data Bank 2023, 16, 319. [Google Scholar] [CrossRef] [PubMed]
  25. Xie, G.; Zhang, C.; Zhen, L.; Zhang, L. Dynamic Changes in the Value of China’s Ecosystem Services. Ecosyst. Serv. 2017, 26, 146–154. [Google Scholar] [CrossRef]
  26. Maimaiti, B.; Chen, S.; Kasimu, A.; Mamat, A.; Aierken, N.; Chen, Q. Coupling and Coordination Relationships between Urban Expansion and Ecosystem Service Value in Kashgar City. Remote Sens. 2022, 14, 2557. [Google Scholar] [CrossRef]
  27. Mao, W.Y.; Zi, X.H.; Li, Z. Resource and Environment Common Data Sheets; China Science and Technology Press: Beijing, China, 1992. (In Chinese) [Google Scholar]
  28. Lin, B.Q.; Lan, T.X. Progress of Increasing-Block Electricity Pricing Policy Implementation in China’s First-Tier Cities and the Impact of Resident Policy Perception. Energy Policy 2023, 117, 113544. (In Chinese) [Google Scholar] [CrossRef]
  29. Liu, Q.; Zhao, F.; Gao, W. NCEP/NCAR Hourly Analysis and Comparative Analysis of Measured Land Surface Temperature and Surface Air Temperature in China. Meteorol. Mon. 2008, 35, 83–91. (In Chinese) [Google Scholar]
  30. Breiman, L. Random Forests. Mach. Learn. 2001, 45, 5–32. [Google Scholar] [CrossRef]
  31. Fang, K.N.; Wu, J.B.; Zhu, J.P.; Xie, B.C. A Review of Technologies on Random Forests. Stat. Inf. Forum 2011, 26, 32–38. [Google Scholar]
  32. Zhang, L.; Wang, L.L.; Zhang, X.D.; Liu, S.R.; Sun, P.S.; Wang, T. The Basic Principle of Random Forest and Its Applications in Ecology: A Case Study of Pinus yunnanensis. Acta Ecol. Sin. 2014, 34, 650–659. [Google Scholar]
  33. Oukawa, G.Y.; Krecl, P.; Targino, A.C. Fine-Scale Modeling of the Urban Heat Island: A Comparison of Multiple Linear Regression and Random Forest Approaches. Sci. Total Environ. 2022, 815, 152836. [Google Scholar] [CrossRef] [PubMed]
  34. Wang, Z.; Zhao, J.; Liu, D. Research on Remote Sensing Water Extraction Method Based on SWIR Band. Remote Sens. Technol. Appl. 2013, 28, 682–686. (In Chinese) [Google Scholar]
  35. Dairma, D.; Bao, Y. Comparative Analysis of Surface Albedo Retrieval Methods Based on TM Data. J. Inner Mongolia Normal Univ. Nat. Sci. Ed. 2010, 39, 186–190. (In Chinese) [Google Scholar]
  36. Li, Z.L.; Wu, H.; Wang, N.; Qiu, S.; Sobrino, J.A.; Wan, Z.; Tang, B.H.; Yan, G. Land Surface Emissivity Retrieval from Satellite Data. Int. J. Remote Sens. 2013, 34, 3084–3127. [Google Scholar] [CrossRef]
  37. Valor, E.; Caselles, V. Mapping Land Surface Emissivity from NDVI: Application to European, African and South American Areas. Remote Sens. Environ. 1996, 57, 167–184. [Google Scholar] [CrossRef]
  38. Wang, A.; Zhao, Z. Progress in the Study of Estimation Methods for Vegetation Cover Based on Remote Sensing. Green Sci. Technol. 2015, 3, 10–14. (In Chinese) [Google Scholar]
  39. Snyder, W.C.; Wan, Z.; Zhang, Y.; Feng, Y.-Z. Classification-Based Emissivity for Land Surface Temperature Measurement from Space. Int. J. Remote Sens. 1998, 19, 2753–2774. [Google Scholar] [CrossRef]
  40. Xu, Q.; Li, J.; Zhang, S.; Yuan, Q.; Ren, P. Spatio-Temporal Changes and Driving Mechanisms of Vegetation Net Primary Productivity in Xinjiang, China from 2001 to 2022. Land 2024, 13, 1305. [Google Scholar] [CrossRef]
  41. Hu, S.; Zhang, L. Evaluation and Management of Ecosystem Service Value in Tibet Gongbu Nature Reserve. Prog. Geogr. 2010, 29, 217–224. (In Chinese) [Google Scholar]
  42. Zhang, X.; Xu, Z.; Zhang, Z.; Gu, D.; Wang, L. The Value of Environmental Purification Services for Urban Green Space Ecosystems in Qingdao. Acta Ecol. Sin. 2011, 31, 2576–2584. (In Chinese) [Google Scholar]
  43. Gong, W.; Ou, S.; Yang, T.; Yi, C.X. Quantitative Assessment of Ecological Value of Urban Green Space Based on GIS/RS. J. Anhui Agric. Sci. 2018, 46, 38–43. (In Chinese) [Google Scholar]
  44. Wang, B.; Ren, X.; Hu, W. Assessment of Forest Ecosystem Services Value in China. Sci. Silvae Sin. 2011, 47, 145–153. (In Chinese) [Google Scholar]
  45. Li, Y.; Lin, A.; Wu, H.; Wu, X.; Cen, L.Y.; Liu, H. Refined Simulation of Urban Land Use Change Considering Spatial Scale Effects Environ. Protect. Sci. Acta Geogr. Sin. 2022, 77, 2738–2756. (In Chinese) [Google Scholar]
  46. Bai, L.; Xu, Y.; He, M.; Li, N. Research on Remote Sensing Inversion of Near-Surface Air Temperature Based on Random Forest Algorithm. J. Geo-Inf. Sci. 2017, 19, 390–397. (In Chinese) [Google Scholar]
  47. Liu, B. Estimation and Distribution of R in Weibei Area. J. Northwest For. Univ. 1993, 8, 21–29. (In Chinese) [Google Scholar]
  48. Xu, H.; Yang, S.; Chen, Y.; Chen, G. Assessment of the Value of Urban Green Space Ecological Service Function: A Case Study of Beijing Forestry University. Ningxia J. Agric. For. Sci. Technol. 2014, 55, 48–51. (In Chinese) [Google Scholar]
  49. Wei, Z.; Guan, Y.; Cai, D.; Zhang, C.; Yao, W.; Liao, Z.; Deng, R.; Qian, J.; Xia, Y.; Guo, S. An Assessment Method of Ecosystem Service Value Based on Improved Remote Sensing Ecological Index. Geo-Inf. Sci. 2024, 26, 1763–1778. (In Chinese) [Google Scholar]
  50. Yang, S.; Zhang, M.; Peng, B.; Yuan, S.; Li, H.; Liao, Y. A Preliminary Study on Remote Sensing Estimation of Daily Minimum Temperature in Guizhou Province Based on Polar-Orbiting Satellites Environ. Protect. Sci. Mid-Low Lat. Mt. Meteorol. 2023, 47, 69–76. (In Chinese) [Google Scholar]
Figure 1. Geographical location and land use survey of Guangzhou.
Remotesensing 16 04180 g001
Figure 2. Flow chart depicting the research methodology.
Remotesensing 16 04180 g002
Figure 3. Demonstration of the stochastic forest model used in near-surface temperature inversion (Note: NSAT is the station temperature data obtained by the weather station as the input variable to be explained, LST is the land surface temperature, NDVI is the normalized vegetation index, MNDWI is the improved normalized water index, and Albedo is the surface reflectivity, which are all input characteristic variables. The accuracy of the final prediction is compared with that of the traditional linear method).
Remotesensing 16 04180 g003
Figure 4. Land use map of Guangzhou.
Remotesensing 16 04180 g004
Figure 5. Spatial distribution of water conservation value in Guangzhou.
Remotesensing 16 04180 g005
Figure 6. Scatterplots of measured versus estimated values of NSAT based on (a) 54 training samples and (b) 24 testing samples.
Remotesensing 16 04180 g006
Figure 7. Inversion results of near-surface air temperature in Guangzhou.
Remotesensing 16 04180 g007
Figure 8. Annual NPP total map.
Remotesensing 16 04180 g008
Figure 9. Spatial distribution of oxygen release value.
Remotesensing 16 04180 g009
Figure 10. Carbon sequestration value per unit area of Guangzhou.
Remotesensing 16 04180 g010
Figure 11. The value of SO2 absorbed per unit area of Guangzhou City.
Remotesensing 16 04180 g011
Figure 12. The value of dust retention per unit area in Guangzhou.
Remotesensing 16 04180 g012
Figure 13. Soil and water conservation capacity factors and soil conservation capacity in Guangzhou (Note: (ae) represent the spatial distribution maps of the annual rainfall erosivity index R value, the soil erosion factor K value, the slope length factor LS, the vegetation coverage factor C, the soil and water conservation measure factor P, respectively. (f) represents the final spatial distribution map of soil conservation capacity).
Remotesensing 16 04180 g013
Figure 14. The value of reducing land loss per unit area in Guangzhou.
Remotesensing 16 04180 g014
Figure 15. The value of reducing siltation disaster per unit area in Guangzhou.
Remotesensing 16 04180 g015
Figure 16. Conservation value of biodiversity per unit area in Guangzhou.
Remotesensing 16 04180 g016
Figure 17. The total value of ecological services per unit area in Guangzhou.
Remotesensing 16 04180 g017
Figure 18. Prediction results of land use change in Guangzhou in 2030.
Remotesensing 16 04180 g018
Figure 19. (a) Temperature (unit: °C) distribution map of Guangzhou based on traditional spatial interpolation method; (b) Temperature distribution map (unit: °C) of Guangzhou based on random forest model; (c) 1~4 correspond to the spatial interpolation and the detailed map of the air temperature (unit: °C) obtained by RF, respectively.
Remotesensing 16 04180 g019
Figure 20. Temperature fitting curve. (Note: Figures (1–4) are the fitting curves of Lasso regression, Ridge regression, Ordinary least squares method and Random Forest method, respectively).
Remotesensing 16 04180 g020
Table 1. A detailed description of the study data.
NameSpatial
Resolution
Time
Resolution
Time
Frame
Data
Sources
The 30 m annual land cover datasets and its dynamics in China from 1985 to 202230 mAnnual2010, 2015, 2020, 2022Jie Yang and Xin Huang (2023) [23] The 30 m annual land cover datasets and its dynamics in China from 1985 to 2022 [Data set]. In Earth System Science Data (1.0.2, Vol. 13, Number 1, pp. 3907–3925). Zenodo. https://doi.org/10.5281/zenodo.8176941 (accessed on 8 November 2023)
Vector data of three administrative divisions of provinces, cities and counties in ChinaVectorAnnual2024https://cloudcenter.tianditu.gov.cn/administrativeDivision (accessed on 8 November 2023)
NASA DEM 30 m30 mAnnual2020https://earthdata.nasa.gov/esds/competitive-programs/measures/nasadem (accessed on 8 November 2023)
MOD17A3HGF V061 dataset500 mAnnual2001 to 2022https://lpdaac.usgs.gov/ (accessed on 8 November 2023)
Landsat 8-9 C2 L2SP product data30 mDiurnal2021 to 2024https://earthexplorer.usgs.gov/ (accessed on 8 November 2023)
Dataset of Soil Conservation Capacity Preventing Water Erosion in China (1992–2019)500 mAnnual1992 to 2019Jialei Li, Hongbin He, Qinghua Zeng, et al. [24] Dataset of Soil Conservation Capacity Preventing Water Erosion in China (1992–2019) [DS/OL]. V1. Science Data Bank, 2023.
https://cstr.cn/31253.11.sciencedb.07135 (accessed on 8 November 2023).
The meteorological data in GuangzhouPanel dataAnnual2020 to 2023http://data.cma.cn (accessed on 8 November 2023)
Table 2. Quantitative assessment factors of urban green space ecosystem service value.
Types of Ecosystem Service 1st Service2nd LevelAssessment Content
Provision serviceStore waterEcological value of water conservation
Regulation serviceTemperature regulationEcological value produced by regulating temperature
Release O2Eco-economic value of releasing oxygen
Fixed CO2Eco-economic value of CO2 fixation
Absorb SO2Eco-economic value of absorbing SO2
Stagnant dustEcological value of purifying dust and retention
Support serviceSoil conservationReduce the value of land loss
Reduce the value of sediment deposition disaster
BiodiversityEcological value of biodiversity protection
Table 3. Comparison of ecosystem service value between 2020 and 2030.
Types of Ecosystem Service 1st Service2nd LevelValue in 2020 (Unit: USD 100 Million)Value in 2030 (Unit: USD 100 Million)
Provision serviceStore water31.25227.759
Regulation serviceTemperature regulation12.56111.135
Release O210.8069.582
Fixed CO21.4201.259
Absorb SO20.0580.052
Stagnant dust3.4963.106
Support serviceSoil conservation3.1052.751
Biodiversity12.11210.721
Disclaimer/Publisher’s Note: The statements, opinions and data contained in all publications are solely those of the individual author(s) and contributor(s) and not of MDPI and/or the editor(s). MDPI and/or the editor(s) disclaim responsibility for any injury to people or property resulting from any ideas, methods, instructions or products referred to in the content.

